Embed Size (px)
Citation preview
University of ConnecticutOpenCommons@UConn
Doctoral Dissertations University of Connecticut Graduate School
5-6-2014
Gene Expression Profile Reveals the NovelRepression of Heat Shock Protein Expression byTNIP1 in KeratinocytesVincent P. [email protected]
Follow this and additional works at: https://opencommons.uconn.edu/dissertations
Recommended CitationRamirez, Vincent P., "Gene Expression Profile Reveals the Novel Repression of Heat Shock Protein Expression by TNIP1 inKeratinocytes" (2014). Doctoral Dissertations. 380.https://opencommons.uconn.edu/dissertations/380

Gene Expression Profile Reveals the Novel Repression of Heat Shock Protein
Expression by TNIP1 in Keratinocytes
Vincent P. Ramirez, PhD
University of Connecticut, 2014
The TNFα-induced protein 3-interacting protein 1 (TNIP1) protein
represses various receptor-mediated signaling pathways, ranging from
transmembrane to nuclear receptors. Increased TNIP1 expression results in
blocking the TNFα-induced NF-κB activation or repressing peroxisome
proliferator activated receptor and retinoic acid receptor activity. These
transcription factors play key roles in regulating inflammation and inflammatory
diseases. A growing number of references have linked TNIP1 SNPs and
increased expression in psoriasis, a chronic inflammatory disease characterized
by keratinocyte hyperproliferation and incomplete differentiation. However,
TNIP1’s exact role is not yet known. To determine the genes and biological
functions regulated by TNIP1 in keratinocytes, we overexpressed TNIP1 in
cultured keratinocytes and performed a gene expression microarray analysis.
Reduced expression of most genes was observed, including several heat shock
proteins (HSP). These results suggest TNIP1 could regulate the cell stress
response. However, its exact role in this process and the mechanism of the
TNIP1-mediated transcriptional repression is not yet characterized.
We examined the TNIP1 repression of HSPA6 (also named HSP70B’) to
model the repression on all HSPs. Since the transcriptional regulation of HSPA6
has not yet been fully characterized, we examined the factors contributing to its
promoter activation. We found that a novel AP1 site and heat shock element
upstream of previously recognized sites contribute to its basal and stress
inducibility, respectively. To determine the mechanism of TNIP1’s repression on
HSPA6, we hypothesized that TNIP1 acts on PPAR, RAR or NF-κB to reduce the
expression of HSPs. We observed TNIP1 does not act through these
transcription factors, but possibly through a novel, yet uncharacterized pathway.
Additionally, we assessed the effect of TNIP1 on keratinocyte proliferation and
differentiation. We found that a chronic, but not acute, overexpression of TNIP1
blocks keratinocyte cell growth to possibly through decreasing the HSP
chaperone function.

Gene Expression Profile Reveals the Novel Repression of
Heat Shock Protein Expression by TNIP1 in Keratinocytes
Vincent P. Ramirez
B.S. University of California, Davis, 2004
A Dissertation
Submitted in Partial Fulfillment of the
Requirements for the Degree of
Doctor of Philosophy
at the
University of Connecticut
2014
ii
APPROVAL PAGE
Doctor of Philosophy Dissertation
Gene Expression Profile Reveals the Novel Repression of
Heat Shock Protein Expression by TNIP1 in Keratinocytes
Presented by
Vincent P. Ramirez, B.S.
Major Advisor __________________________________________________
Dr. Brian J. Aneskievich
Associate Advisor
__________________________________________________
Dr. Theodore Rasmussen
Associate Advisor
__________________________________________________
Dr. Charles Giardina
University of Connecticut
2014

iii
Dedication
To the Ramirez, Pascual, Panganiban and Titong families: thank you for
all your support throughout this journey.

iv
Acknowledgements
I would like to give my sincerest thanks to my major advisor Dr. Brian J.
Aneskievich for giving me the opportunity to join his laboratory as a graduate
student. With his guidance and training, I grew into the scientist I am today. I
would also like to thank my associate advisors Dr. Charles Giardina and Dr.
Theodore Rasmussen for their time and efforts in advising me throughout my
research project. I would especially like to thank Dr. Giardina for his expertise
and input on the intricacies and technicalities of the heat shock protein world.
I am thankful for the help and advice given by the past and present
members of the Aneskievich lab. First, I would like to thank Carmen Zhang for
training me in various aspects of the lab and for starting the microarray project by
doing the initial TNIP1-overexpression. I also want to thank the past Aneskievich
lab graduate students, Priscilla Encarnacao, Igor Gurevich and Nidhish Francis,
for their suggestions and comments to help me with the TNIP1-HSP project.
Also, thanks to my undergraduate and Pharm.D mentees Mike Stamatis for
generating many of the luciferase constructs used for these experiments,
Anastasia Shmukler for performing some of the qPCR and MTS assays, Tom
Walcyzk for keeping the lab in perfect condition, and Hank Ng for his assistance
with the TSS project. I also could not have completed the project without the
work and results generated by Nora McHugh.
I am very grateful to my former supervisors Dr. Sarah Jaw-Tsai for
teaching me about pharmacology and pharmacokinetics and encouraging me to

v
pursue my graduate studies and Michele Bauer for giving me a start in laboratory
research.
I would like to acknowledge the financial support I received from the
UConn School of Pharmacy, Center for Regenerative Biology, and Molecular and
Cellular Biology, and Society of Toxicology, as well as the NIH and UConn
Research foundation grants awarded to Dr. Aneskievich.
I would like to thank my family and friends for their support and
encouragement throughout my time in graduate school. Lastly, I would like to
give a heartfelt thank you to my beautiful and wonderful wife, Alley. Without you
by my side to help and support me before and during graduate school, I would
not have succeeded. Thank you for all you have done with and for me.

vi
Table of contents
Page
Title Page i
Approval Page ii
Dedication iii
Acknowledgements iv
Table of Contents vi
List of Figures viii
List of Tables x
List of Abbreviations xi
Chapter 1 Introduction 1
Skin anatomy and keratinocyte biology 1
TNFα-Induced Protein 3-Interacting Protein 1
(TNIP1) 8
Heat Shock Proteins 20
Summary 23
Chapter 2 TNIP1 modulates heat shock protein expression
and the stress response 25
Abstract 25
Introduction 27
Materials and Methods 30
Results 35
Discussion 46

vii
Chapter 3 Transcriptional regulation of HSPA6 in basal
and stressed conditions 50
Abstract 50
Introduction 52
Materials and Methods 55
Results 62
Discussion 86
Chapter 4 TNIP1-HSP mechanism of repression and
overall keratinocyte consequences 92
Abstract 92
Introduction 93
Materials and Methods 96
Results 100
Discussion 111
Chapter 5 Summary, conclusions and future directions 114
Summary and conclusions 114
Future directions 119
Appendix 1 TNIP1 protein expression up to 96 hours 122
Appendix 2 Microarray results from TNIP1 overexpression 123
Appendix 3 Protocol for making HSPA6 promoter constructs 130
Appendix 4 TNIP1 transcriptional start site 136
Appendix 5 Experiment numbers for each figure 138
References 139

viii
List of Figures
Page
1.1 Illustration of the skin 6
1.2 Illustration of the epidermis and its keratinocyte layers 7
1.3 TNIP1-mediated signaling pathways 17
2.1 Validation of TNIP1 overexpression 36
2.2 TNIP1 overexpression microarray results 38
2.3 Ingenuity Pathway Analysis clustering of genes with significant
expression change 39
2.4 DAVID clustering of genes with significant expression change 42
2.5 Effect of TNIP1 overexpression on HSPs in HaCaT KCs 43
2.6 Effect of TNIP1 overexpression on KC differentiation markers in
NHEKs 44
2.7 Effect of TNIP1 overexpression on HSPs in NHEKs 45
3.1 Basal and heat-inducible expression of HSPA6 in HaCaT KCs 63
3.2 Basal and heat-inducible expression of HSPA1A in HaCaT KCs 64
3.3 Expression of HSPA6 in various cell types 65
3.4 Native restriction enzyme sites within the HSPA6 3kb promoter 67
3.5 In silico analysis of the HSPA6 3kb promoter 68
3.6 Determining the transcriptionally regulated regions within the
HSPA6 promoter 71
3.7 Localizing the repressible region within the HSPA6 promoter 72
3.8 Localizing the basal and inducible regions within the HSPA6
promoter 73
3.9 Searching for transcription factor binding sites between -346 to -216
bp region of the HSPA6 promoter 75
3.10 Characterization of the -244 bp AP1 site 76
3.11 EMSA binding analysis of AP1 proteins c-Jun and c-Fos to the -244
AP1 site 77

ix
3.12 Searching for heat responsive elements between -346 to -216 bp
region of HSPA6 80
3.13 Characterization of the -284 bp HSE 81
3.14 EMSA binding analysis of HaCaT HSF proteins to the -284 bp HSE 82
3.15 EMSA binding analysis of HaCaT HSF proteins to a consensus HSE 83
3.16 EMSA binding analysis of HeLa HSF proteins to the -284 bp HSE 84
3.17 EMSA binding analysis of HeLa HSF proteins to a consensus HSE 85
4.1 In silico analysis of the HSPA6 3kb promoter searching for TNIP1-
repressed transcription factors 101
4.2 Analysis of the HSPA6 promoter truncation constructs 102
4.3 Analysis of the HSPA6 promoter deletion constructs 106
4.4 Effect of TNIP1 overexpression on HSPs in heat stressed HaCaT
KCs 108
4.5 Effect of “short term” increased TNIP1 levels on HaCaT KCs viability
and growth 109
4.6 Effect of “long term” increased TNIP1 levels on HaCaT KCs viability
and growth 110

x
List of Tables
Page
1.1 TNIP1 and associated diseases 18
1.2 Experimentally altered TNIP1 and the resulting phenotypes 19
2.1 List of qPCR primers for the microarray 34
3.1 Site-directed mutagenesis primer sequences. 60
3.2 Oligomers used for EMSA probes 61
4.1 List of top predicted transcription factor binding sites within the -216
to -70 bp region of the HSPA6 promoter 109

xi
List of Abbreviations
ABIN1 A20 binding and inhibitor of NF-κB AP1 Activator protein 1 C/EBP Ccaat-enhancer binding proteins DAVID Database for Annotation, Visualization and Integrated
Discovery DNAJA1 HSP40 (homolog), subfamily A, member 1 DNAJB1 HSP40 (homolog), subfamily B, member 1 EMSA Electrophoretic mobility shift assay GWAS Genome wide association studies HDAC Histone deacetylase HSE Heat shock element HSF Heat shock transcription factor HSP Heat shock protein HSPA1A HSP70, subfamily A, member 1A HSPA6 HSP70, subfamily A, member 6 (HSP70B’) IKK Inhibitor of NF-κB kinase IPA Ingenuity Pathway Analysis KC Keratinocyte luc Luciferase mt Mutant MZF1 Myeloid zing finger 1 NEMO NF-κB essential modulator NF-κB Nuclear actor κB NHEK Normal human epidermal keratinocyte NR Nuclear receptor PPAR Peroxisome proliferator activated receptor RA Rheumatoid arthritis RAR Retinoic acid receptor RIP140 Receptor interacting protein 140 RXR Retinoid X receptor SLE Systemic lupus erythematosus SNP Single nucleotide polymorphism SRC1 Steroid receptor coactivator 1 SSc Systemic sclerosis TNFAIP3 TNFα-induced protein 3 TNFR TNFα receptor TNFα Tumor necrosis factor, alpha TNIP1 TNFα induced protein 3-interacting protein 1 UBAN Ubiquitin binding in ABIN and NEMO VAN Virion-associated nuclear shuttling protein WHN Winged helix transcription factor ZFX Zinc finger protein, X-linked

1
Chapter 1
INTRODUCTION
Skin structure and regulation
Skin anatomy and keratinocyte biology
The skin is the largest organ in our body serving as a first line defense
from various environmental stressors, including exposure to UV, heat and
chemicals. It is made up of two layers: the outer epidermal layer and the
underlying dermal layer (Fig 1.1) (1, 2), each consisting of many specialized cells
and structures that contribute to the overall health and protective function of the
skin. The outermost layer, the epidermis, is composed of several different cell
types, in which approximately 90% are keratinocytes (KC) (3). The remaining
cells are melanocytes and Langerhans cells, which contribute to skin
pigmentation and protect the skin during infections, respectively. The epidermis
can be further subdivided into four major layers – the stratum basale (bottom
layer), stratum spinosum, stratum granulosum and stratum corneum (top layer)
(Fig 1.2) (4). The process of cornification, when KC proliferate and differentiate
from the basal to the cornified cells, is crucial for to generate a tough, resilient
barrier to separate the body from the harsh environment (2).
Epidermal and KC homeostasis are regulated by many different
endogenous and exogenous factors, including proteins, drugs and UV (5-7). The
epidermis is at a constant state of flux where new KCs are produced in the
stratum basale, while old, differentiated KCs are sloughed off from the stratum
corneum. Proliferative KCs are found in the basal layer, where they are

2
responsible for repopulating the epidermis. When a KC leaves this layer, a
unique form of programmed cell death, cornification, occurs, where there is a
turnover of highly specific proteins within each layer of the epidermis, eventually
resulting in the KC’s death and removal at the top layer (4). Several receptor-
mediated pathways regulate the cornification process, including nuclear
receptors (NR), tumor necrosis factor alpha (TNFα) receptor (TNFR), epidermal
growth factor receptor (EGFR), and toll like receptors (TLR).
Keratinocyte regulation by nuclear receptors
NRs are a superfamily of ligand-activated transcription factors that
modulate gene transcription. There are over 45 different NRs, each playing key
roles in regulating many biological functions and processes (8). Many different
NRs, including but not limited to peroxisome proliferator activated receptors
(PPAR) and retinoic acid receptors (RAR), contribute to KC differentiation
process. Equally important to the transcriptional activity of ligand-bound NRs are
the coregulator proteins they interact with. Coregulators, which are classified as
either coactivators or corepressors, directly bind NRs through specific amino acid
motifs. As their name might suggest, coactivators increase NR transcriptional
activity, facilitated by NR ligand binding. Corepressors, on the other hand,
mediate the repression of NRs, typically, in absence of a ligand. The regulation of
NRs, and the possible effect on their target genes, could have a great effect on
KC homeostasis (9).

3
The PPAR subfamily of NRs has been shown to enhance KC proliferation
and differentiation. Ligands for PPARs range from endogenous lipids and their
derivatives to exogenous therapeutic chemicals targeting a specific subtype(s) of
PPAR. KCs express all three subtypes (α, β/δ and γ) of PPARs in both basal and
suprabasal KCs (10). Pharmacological stimulation of PPAR β/δ or γ by isoform
specific ligands resulted in stimulating KC differentiation, suggesting a pro-
differentiation role in skin physiology (11, 12). On the other hand, PPARα
activation results in a thinner epidermis, where KC proliferation is blocked but
differentiation is induced (13). Since each PPAR isoform plays a role in normal
KC differentiaton and proliferation, its potential role in KC-related diseases were
also characterized. Psoriasis is classically recognized as epidermal keratinocyte
hyperproliferation with incomplete differentiation, incomplete barrier formation,
and immune cell infiltration (14). In psoriasis, PPAR ligand treatment reduced the
inflammation and restored normal KC physiology (15-17).
In contrast to PPARs, the two isoforms of RAR (α and γ) were
characterized in the skin to represses KC proliferation and differentiation.
Treatment with retinoids, the ligands for RARs, has shown to prevent proper KC
differentiation, where the top, cornified layer does not fully form (18). Because of
this repressive effect, retinoids have been used to treat hyperproliferative
inflammatory diseases, including psoriasis (19). Since the activation of either
RAR or PPAR can lead to drastic changes in skin proliferation and differentiation
in both normal and diseased skin, understanding the mechanisms involved in

4
these regulating NRs activation and repression is crucial to potentially target
these receptors to maintain or modulate KC homeostasis.
TNFα receptor and keratinocyte cornification
The fate of KC proliferation and differentiation in both normal and inflamed
conditions can also be regulated by altering the TNFR-initiated signaling
pathway. TNFR is a key transmembrane protein to activate the transcription
factor NF-κB, which contributes to promoting KC terminal differentiation.
Classically, the activation of NF-κB is initiated by TNFR and is largely dependent
on a series of phosphorylation and ubiquitination steps on various cytoplasmic
proteins. Typically, ubiquitination is part of the proteasome-mediated protein
degradation pathway; however, there are proteins, including NF-κB essential
modulator (NEMO; also named inhibitor of NF-κB kinase gamma; IKKγ), whose
ubiquitination results not only in protein breakdown but also in protein-protein
interaction and enzyme activation (20). Although not an enzyme itself,
ubiquitinated NEMO interacts with IKKα and IKKβ in the IKK complex and
facilitates activation of these kinases. The ubiquitination of NEMO is essential in
this pathway because without it, the subsequent degradation of IκB and nuclear
translocation of NF-κB will be blocked. When NF-κB activation was prevented in
mice, a thickening in the suprabasal KCs was observed; alternatively, when NF-
κB was overexpressed, a hypoplastic epidermal layer was seen (21). In addition
to activation of NF-κB, TNFR stimulation results in increased expression of pro-
inflammatory cytokines, including IL-6 and IL-8, which are also involved in
regulating KC proliferation (22). These results indicate that the activation of

5
TNFR and NF-κB contribute to the generation of a normal, stratified epidermal
layer. Overall, understanding the regulatory proteins involved in the TNFR and
NR pathways is essential to determine the possible fate of epidermal KCs. Our
lab discovered and characterized a novel NR corepressor, TNFα-induced protein
3 (TNFΑIP3)-interacting protein 1 (TNIP1), and aimed to examine its potential
function(s) in KC biology.

6
Figure 1.1
Figure 1.1. Illustration of the skin. The general structure of the skin is shown,
including the thick dermal layer and the thin epidermis. Part of the subcutaneous
layer is also show. The related structures are also illustrated. Original image from
(1).

7
Figure 1.2
Figure 1.2. Illustration of the epidermis and its keratinocyte layers.
Keratinocyte proliferation begins at the basal layer (stratum basale) where new
cells can begin to move out of is layer to differentiate. The process of
cornification is shown as the cells transition to become the cornified layer
(stratum corneum). Original image from (4).

8
TNFα-induced protein 3-interacting protein 1 (TNIP1)
TNIP1 is a corepressor of PPARs and RARs
Prior work in our laboratory discovered TNIP1 (also known as ABIN-1,
Naf1 and VAN) as a novel coregulator of ligand-bound PPARs and RARs (Fig
1.3) (23, 24). The requirement for ligand presence for TNIP1-NR interaction
suggested TNIP1 as a NR coactivator. Intriguingly, the effect of TNIP1 interaction
with NRs resulted in repression of these receptors’ activities. TNIP1’s direct
binding to PPARs and RARs is facilitated by specific amino acid motifs within the
TNIP1 sequence. TNIP1 exhibits a strong subtype preference amongst PPARs (γ
> β/δ >>> α) and RARs (α >> γ) (23, 24), however it does not interact with the
PPAR and RAR heterodimer partner retinoid X receptor (RXR). Additionally,
TNIP1 had no effect on the activities of other NRs, such as estrogen receptors α
and β, androgen receptor, and progesterone receptor (Encarnacao and
Aneskievich, unpublished). The decrease in PPAR and RAR activity was not due
to a reduction in NR expression levels, (23-25) supporting the interpretation that
the repressive effect was due to TNIP1 alterating NR transcriptional activity.
As a NR coregulator, TNIP1 is in a still relatively small class of
corepressors of agonist-bound NRs exemplified by this group’s archetype,
receptor interacting protein 140 (RIP140) (26). Unlike RIP140 (27), we found no
association between TNIP1 and chromatin remodeling histone deacetylase
(HDAC) enzymes. Rather, TNIP1 attenuates receptor activity acting through a
different mechanism to halt excessive receptor activation either by toxic ligand
levels or exposure to the ligand at inappropriate times. Additionally, even under

9
normal ligand conditions, coregulators may contribute to a combinatorial
approach to NR regulation, providing for a finer level of control over receptor
activity instead of the all-on or all-off effect of typical coactivators or
corepressors. Furthermore, TNIP1 repression is partially relieved by over-
expression of the NR coactivator steroid receptor coactivator 1 (SRC1)
suggesting that interference with coactivator recruitment by liganded NRs is a
mechanism of TNIP1 repression (23).
The repressive effect observed on NRs indicates TNIP1 could play key
roles in regulating KC proliferation and differentiation. Since ligand activation of
PPAR and RAR results in changes KC cornification, altered TNIP1 expression
could lead to significant changes in KC differentiation.
TNIP1 blocks TNFα Receptor induced NF-κB activation
Increased TNIP1 expression levels have also led to decreased activation
of NF-κB via the TNFR (Fig 1.3). TNIP1 over-expression inhibits NF-κB signaling
downstream of TRAF2 at the level of IKK, specifically NEMO. There is a direct
physical interaction (28) between TNIP1 and NEMO (in addition to TNIP1 and
A20). When TNIP1 levels are experimentally increased, A20-mediated removal
of ubiquitin from NEMO is likely facilitated, decreasing the activity of the IKK
complex, blocking NF-κB gene regulation (28, 29).
In addition to the interaction with NEMO, TNIP1 can also prevent NF-κB
activation through decreasing the pool of one of the NF-κB subunits -- p50 (Fig
1.3). NF-κB is a homo- or hetero-dimeric transcription factor consisting of

10
proteins in the Rel family. The p50 and p65 complex is the most common NF-κB
dimer, with the p50 subunit derived from proteolytic processing of the precursor,
and IκB protein, p105. Endogenous (30) and overexpressed (31) TNIP1 was
found to bind and inhibit the processing of p105 resulting in a reduction of active
p50. While the two proteins can physically interact, this is not an absolute
requirement for the effect on p105. Interestingly, for any effect TNIP1 may have
on intracellular signaling, increases in p105 expression significantly increased
TNIP1 half-life (31). This protein-protein interaction could prevent NF-κB
activation in two ways: (1)decreasing available p50 to form an active NF-κB
dimer and (2)increasing TNIP1 expression to prevent IKK activation.
Further upstream of NEMO or Complex II, TNIP1 was found to interact
with the TNFR. Haas and colleagues identified the various intracellular proteins
recruited post TNFR ligand binding, including the IKK trimeric complex and
TNIP1 (32). Although the specific details of how TNIP1 associates with the
complex were not elucidated, mechanisms of NEMO’s association in this
complex were discussed. NEMO’s ubiquitin binding domain, UBAN, facilitates the
recruitment of the complex to other ubuquitinated TNFR bound proteins, such as
RIP1 and TNFR-associated factor 2 (TRAF2). Given that TNIP1 also has the
same UBAN domain, it is likely that its presence in the TNFR complex is
mediated through TNIP1’s ability to bind ubiquitin chains.
Implication for TNIP1 at the genetic level
Current connections between TNIP1 and human pathologies are found in

11
several diseases and tissues including psoriasis, a chronic inflammatory skin
disease. These associations derive from high throughput approaches such as
genome-wide association studies (GWAS) and expression microarrays (33-39)
(Table 1.1). Whether through sequence variations or expression levels, these
approaches have linked TNIP1 with psoriasis, systemic lupus erythematosus
(SLE), systemic sclerosis (SSc), rheumatoid arthritis (RA) and
leukemia/lymphoma. Additionally, the inflammation-associated defects observed
using both in vitro and in vivo experimental systems are consistent with current
reports of TNIP1 alterations associated with human auto-immune and chronic
inflammatory diseases (Table 1.2). TNIP1’s wide tissue distribution (24, 25, 40)
and involvement in a number of receptor-mediated signaling pathways (41)
would likely extend impact of its altered function to non-immune cells. For
instance, we found TNIP1 antibody staining in both stratified cutaneous and
mucosal epithelial cells and germinal centers of human tonsil (25). More clearly
defined roles for TNIP1 in normo- and patho-physiology will benefit from organ-
and cell-specific knockout systems.
The TNIP1 gene has been implicated in psoriasis, SLE and SSc through
at least three independent GWAS reports. In each case however, the strongest
disease-associated single nucleotide polymorphisms (SNP) were in non-coding
regions. In the psoriasis study (34), despite strong association with the disease
(P-value 1 x 10-20) and ~1.5 fold increase in TNIP1 expression between lesioned
and uninvolved skin (i.e., tissues from the same individual), the SNP was several
kilobases upstream from the TNIP1 locus, indicating the TNIP1 promoter

12
sequence may be altered, possibly affecting TNIP1 expression.
Similar to psoriasis, SNPs in non-coding TNIP1 regions were also disease
associated with SSc. Three different TNIP1 SNPs were identified in European
populations in the second GWAS report for SSc (39). Intriguingly, when TNIP1
mRNA and protein levels were assessed from cultured dermal fibroblasts of SSc
patients, a ~1.7-fold decrease was observed. A separate GWAS study also
identified SNPs in SLE. Two TNIP1 intronic SNP variants were found in SLE
patients from Chinese Han, Caucasian, and Japanese populations, with the latter
two groups having the same SNP (35, 36, 38). Unlike the altered expression of
TNIP1 in psoriasis and SSc, there was no TNIP1 mRNA change associated with
this SLE SNP (38). However, Kawasaki and colleagues suggested the SNP
location in intron 1 could impact TNIP1 splicing possibly affecting the use of
alternative exons 1A and B with exon 2 and thereby contributing to the numerous
splice variants of TNIP1 (42-44) with as yet unrecognized consequences. Far
from being innocuous spacers between coding regions of genes, introns are now
recognized as possible sites of transcription-regulating factors at the DNA level
and/or potential effectors of splicing at the RNA level (45, 46). Likewise, proximal
or intergenic regions, especially those covering the disease-associated gene’s
promoter/enhancer region, may affect expression levels or tissue-specific
expression (47). Most recently, copy number variations were reported for
TNFΑIP3 and TNIP1 suggesting other forms of genome-wide analyses could
prove productive in relating these genes to the disease states (48).
Through physical association with TNFR pathway, the molecular
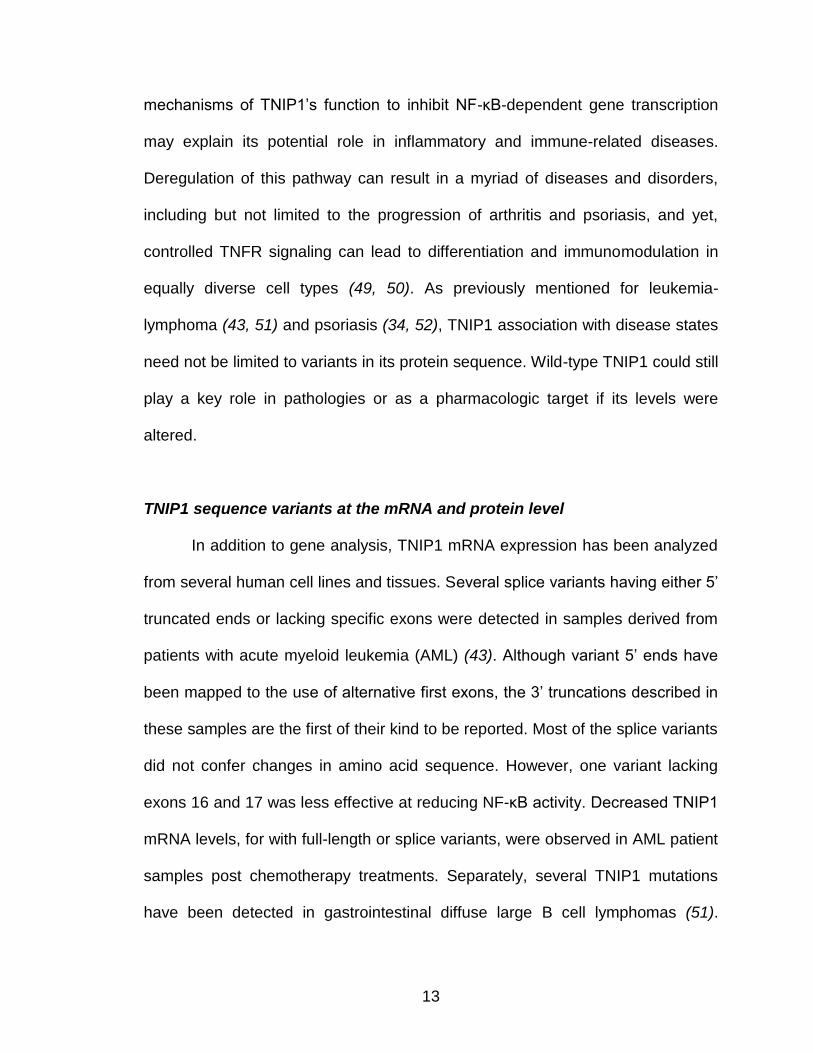
13
mechanisms of TNIP1’s function to inhibit NF-κB-dependent gene transcription
may explain its potential role in inflammatory and immune-related diseases.
Deregulation of this pathway can result in a myriad of diseases and disorders,
including but not limited to the progression of arthritis and psoriasis, and yet,
controlled TNFR signaling can lead to differentiation and immunomodulation in
equally diverse cell types (49, 50). As previously mentioned for leukemia-
lymphoma (43, 51) and psoriasis (34, 52), TNIP1 association with disease states
need not be limited to variants in its protein sequence. Wild-type TNIP1 could still
play a key role in pathologies or as a pharmacologic target if its levels were
altered.
TNIP1 sequence variants at the mRNA and protein level
In addition to gene analysis, TNIP1 mRNA expression has been analyzed
from several human cell lines and tissues. Several splice variants having either 5’
truncated ends or lacking specific exons were detected in samples derived from
patients with acute myeloid leukemia (AML) (43). Although variant 5’ ends have
been mapped to the use of alternative first exons, the 3’ truncations described in
these samples are the first of their kind to be reported. Most of the splice variants
did not confer changes in amino acid sequence. However, one variant lacking
exons 16 and 17 was less effective at reducing NF-κB activity. Decreased TNIP1
mRNA levels, for with full-length or splice variants, were observed in AML patient
samples post chemotherapy treatments. Separately, several TNIP1 mutations
have been detected in gastrointestinal diffuse large B cell lymphomas (51).

14
These sequence alterations are either point or frame-shift mutations, the latter
resulting in a protein truncation. One mutant in particular, causing a glutamic acid
to lysine change (E476K), lost its NF-κB inhibitory properties; other missense
mutations did not alter this TNIP1 property. Thus, sequence variations, either at
the mRNA level possibly affecting message stability, exon content, or amino acid
sequence could impact ultimate TNIP1 protein function. Additionally, we should
consider that there could be functional consequence to even wild-type TNIP1
protein if its levels or post-translation processing, e.g. phosphorylation were
altered.
Increased expression of TNIP1
In contrast to other TNIP1 associated diseases, the connection between
TNIP1 and RA appears strictly at the expression level, not at a susceptibility
locus or nucleotide mutation. Three SNP type GWAS reports (38, 53, 54)
concluded loci-disease association(s) did not meet the cut-offs used for the
analyses. However, when compared to knee synovial membrane biopsies from
osteoarthritis patients, similar samples from patients with RA showed a 2.5-3.5
fold TNIP1 mRNA increase. Osteoarthritis and RA are referred to as non-
inflammatory versus inflammatory forms of the disease, respectively. Consistent
with this inflammatory association, TNIP1 was one of the genes with increased
expression following TNFα treatment of cultured synovial fibroblasts (33).
Nevertheless, TNFα-increased TNIP1 expression may be tissue specific by
following one of multiple post-TNFα-receptor signaling pathways. For instance,

15
retrovirus-mediated increases in NF-κB signaling, one of several post-TNFα-
receptor consequences, did not increase TNIP1 expression in dermal fibroblasts
but did in epidermal keratinocytes (55). TNIP1 upregulation in response to
signaling from inflammatory mediators coupled with dampening of NF-κB activity,
at least in experimental systems, suggests its dysregulation may be contributory
and/or consequential to cytokine signaling.
Non-coding changes in TNIP1 and possible connections to disease
The quandary of how TNIP1 non-coding region SNPs affect psoriasis,
SLE and SSc is much the same as for any other extra-exonic sequence changes
associated with disease. Sequence alterations in promoter regions, even those
distant to transcription start sites may affect transcription factor binding and, in
turn, mRNA production. Likewise, SNPs in non-coding regions may alter
transcript conformation resulting in changes in its stability, translational efficiency,
or interaction with RNA regulatory factors (56). Thus even the wild-type TNIP1
protein sequence at altered levels could impact the associated disease states
given the ability of TNIP1 to modulate post-receptor signaling as detailed below.
In the case of RA, experiments using fibroblast-like synoviocytes show wild-type
TNIP1 increases pro-inflammatory cytokines, potentially advancing the disease
(57). In this vein, as psoriasis, SLE, and RA are at least in part regulated (58) by
receptor pathways (TNFR) modulated by TNIP1, TNIP1 itself could be a focal
point for clinical intervention. This possibility is again echoed by TNIP1
corepression of nuclear receptors currently used as therapeutic targets (RAR)

16
(59) or suggested for such use (PPAR) (60, 61) for treatment of psoriasis or other
inflammatory diseases (62). However, a discrepancy arises in TNIP1’s inhibitory
effect on TNFR signaling and increasing pro-inflammatory cytokines in RA. We
hypothesize that TNIP1 could regulate these molecules through a separate
pathway distinct from TNFR (57). Therefore, while several targets have been
elucidated, it is plausible that other TNIP1-mediated pathways have not yet been
discovered.

17
Figure 1.3
Figure 1.2. TNIP1-mediated signaling pathways. (Left) In the TNFR-induced
NF-κB activation pathway, intracellular proteins are recruited to the TNFR to form
complex I, which facilitates the phosphorylation and subsequent activation and
polyubiquitination of NEMO. IB is then targeted for degradation, allowing the
p65/p50 NF-ΚB heterodimer to translocate into the nucleus. TNIP1 inhibits NF-
ΚB activation by preventing NEMO’s polyubiquitination. Additionally, TNIP1
blocks the processing of p105 to the NF-ΚB subunit p50, therefore decreasing
the available pool of NF-ΚB. (Right) TNIP1 represses nuclear receptors
transcriptional activity. Upon ligand-NR binding, TNIP1 exerts its inhibitory effects
on either PPAR or RAR. Red (ᴓ) denotes TNIP1’s inhibitory functions.

18
Table 1.1. TNIP1 and associated diseases
Disease TNIP1 Association
Experimental Approach
Reference
Psoriasis Intronic SNP; Increased expression
GWAS; Gene expression microarray
Nair et al. (34); Psoriasis Consortium (52); Ellinghaus et al. (63)
Psoriatic Arthritis Intronic SNP GWAS Bowes et al.(64)
Systemic Lupus Erythematosus
Intronic SNP GWAS Kawasaki et al. (38)
Systemic Sclerosis
Intronic SNP GWAS Allanore et al. (39)
Leukemia-Lymphoma
Splice Variants RT-PCR and sequencing
Shiote et al. (43)
Leukemia-Lymphoma
Point or frameshift mutations
PCR and sequencing
Dong et al. (51)
Rheumatoid Arthritis
Increased expression
Gene Expression microarray
Gallagher et al. (33)

19
Table 1.2. Experimentally altered TNIP1 and the resulting phenotypes
Experimental Model Phenotype Reference
Overexpression of WT TNIP1 in vivo via adenoviral tail vein delivery
Protection from TNFα/Galactosamine induced acute liver failure
El Bakkouri et al. (65)
Overexpression of WT TNIP1 in vivo via adenoviral intratracheal delivery
Protection from allergen induced airway inflammation
Wullaert et al. (66)
Mouse knockout by BAC recombineering and Cre mediated excision to delete sequences including exons 12-15
1 in 40 mice were live-born; Embryonic lethal at day 18.5; Anemic; Hypocellular livers; Increased apoptosis in embryonic livers
Oshima et al. (67)
Gene trap mutation mouse model
1 in 40 mice were live-born; Embryonic lethal at day 18.5; Live-born mice die within 40 days post-birth; Enlarged lymph nodes and spleen
Zhou et al. (68)
Mouse knock-in model mutating TNIP1’s UBAN domain
Development of lupus-like autoimmune disease within 5 months; Enlarged lymph nodes and spleen;
Nanda et al. (69)
Overexpression of WT TNIP1 in vitro in Saos-2 osteosarcoma cells
Protection from trichostatin A induced apoptosis
Zhang et al. (70)
20
Heat shock proteins
Heat shock proteins and the skin
Epidermal KCs serve as the primary barrier between the numerous
environmental chemicals and toxins and the body (71). These cells are likely to
respond through a number of mechanisms and proteins to protect them from
toxicity or death. Heat shock proteins (HSP) are a superfamily of molecules
involved in protecting cells from numerous stress events. Initially discovered in
Drosophila after incubating in increased temperatures (72), increase HSP
expression was observed in response to toxic chemical and UV light assaults
across all cell types and organisms (71). HSPs were reported to refold of
denatured proteins and block protein aggregation, therefore preventing cell
death. However, further characterization of many HSPs revealed constitutive
expression of several family members. These constitutively expressed HSPs
account for their availability in “house-keeping” chaperone function (73).
Different HSP subfamilies, which are classified according to their
molecular weight (73), are found in the skin. The HSPA family (also named
HSP70) has been well studied in KC biology. Members of this family are
observed in both unstressed and stressed KCs (74, 75). Several family members
have mostly similar with some distinct functions in the cell with regards to the
proteins they can interact with and fold. HSPA1A (HSP70) is the best known
HSPA family member. This protein is expressed in KCs, but can still be highly
stress induced. The HSPA1A chaperone function is vital in unstressed
conditions, while its expression in stress-induced cells is crucial to prevent cell

21
death. Targeting HSPA1A to reduce its expression using an antisense oligomer
induced cell death and inhibited cell growth (76). A closely related family
member, HSPA6 (HSP70B’) expression is also observed in both conditions.
While these two proteins are key to cell protection in stressed conditions, each
can bind specific proteins with higher affinity than others. For example, HSPA6 is
more effective at binding and refolding p53, whereas it does not interact with
HSPA1A-specific protein substrates from the peroxisome (77, 78). However, both
proteins are important to normal cell homeostasis because specific knockdown of
either HSP resulted in reduced cell survival following thermal or chemical stress.
Furthermore, decreasing the expression of both HSPs led to a greater reduction
in cell survival, suggesting both are important in cell protection (79). Additionally,
increased expression of HSPA1A led to enhanced cell growth and proliferation,
suggesting it may regulate this process. In KC specific tissues, increased
expression of several HSPs, including HSPA1A, was observed in psoriatic
lesions (80). While the exact function of HSPs in psoriasis is yet unknown, it is
speculated that the increased expression could be a result of inflammation within
the keratinocytes. Regardless, this observation could indicate a functional role for
HSPs in the pathogenesis of inflammation.
Expression and transcriptional regulation of heat shock protein A6
The expression of HSPA6 is less characterized and understood compared
to other HSPs. HSPA6 mRNA and protein expression is highly induced following
either thermal, chemical or UV stress in all cells examined (81, 82). In non-

22
stressed conditions, HSPA6 production is variable, from none detected to low
expression levels (79, 81, 82). This could possibly be dependent on cell type and
growth condition differences (83). Currently, the transcriptional regulation of
HSPA6 has mostly been characterized using a minimal ~287 bp promoter (84-
86). To date, a functional activator protein 1 (AP1) site and heat shock response
element (HSE) have been characterized. Additionally, a predicted TATA box was
found, but not yet analyzed. Initial work from our laboratory observed high
expression levels of HSPA6 in basal, unstressed conditions. This level was
further increased in response to thermal stress (Ramirez et al 2014, submitted).
These findings may indicate HSPA6, like HSPA1A, plays key roles in normal,
stressed and diseased KCs to possibly modulate the pathogenesis of skin related
diseases.

23
Summary
Proper regulation of epidermal KC homeostasis is essential to generate a
functional barrier to separate the possible environmental stressors from our body.
Outlined in this chapter are only some of the proteins involved in regulating the
proliferation and differentiation of KCs in both normal and diseased states. We,
and others, characterized TNIP1 as one of those possible factors. TNIP1 can
directly or indirectly repress the activity or activation of transcription factors
involved in KC proliferation and differentiation. Sequence alterations and
expression level changes were observed in several inflammatory diseases,
including those affecting KC growth. However, TNIP1’s exact role in these
diseases are not yet understood. In the research presented on this dissertation,
we sought to characterize the transcriptional and cellular outcomes of increased
TNIP1 expression in human KCs to possibly contribute in understanding TNIP1’s
role in normal or diseased skin.
Using a gene microarray analysis to examine the transcriptional
expression changes in TNIP1-overexpressing cultured KCs, this research
validated TNIP1’s role in the previously mentioned associated inflammatory
diseases. Expression of TNFR- and NR-regulated genes was also reduced
following increased TNIP1 exposure, confirming TNIP1’s repressive effect on
these pathways. Interestingly, we observed the novel repression of genes
associated in regulating the cell stress response, HSPs. Choosing one HSP
(HSPA6), we examined the potential mechanism of how TNIP1 could repress a
family HSPs. We determined that the transcriptional repression of HSPA6 is not

24
through previously characterized TNIP1 factors, suggesting TNIP1 could regulate
a yet uncharacterized pathway. In addition to the possible transcriptional
changes involved with TNIP1, we assessed the overall cellular consequence of
increased TNIP1 levels. This work suggests that a chronic, but not acute,
overexpression of TNIP1 results in reduced growth of cultured KCs. These
results indicate that TNIP1 could regulate KC growth and differentiation, possibly
through repression of HSP expression.

25
Chapter 2
TNIP1 Modulates Heat Shock Protein Expression and the Stress Response
Abstract
A vast number of cellular responses to environmental and physiological
signals are regulated by various receptor-initiated pathways, which in turn are
modulated by a diverse set of regulatory proteins. TNFα-induced protein 3-
interacting protein 1 (TNIP1) is one such protein; it inhibits both transduction by
transmembrane receptors, such as the TNFα-receptor, and by nuclear receptors
PPAR and RAR activity. Despite their cytoplasmic versus nuclear signaling,
these receptors play key roles in regulating inflammation and inflammatory
diseases. Interestingly, a growing number of references through GWAS and
expression studies have implicated TNIP1 in chronic inflammatory diseases such
as psoriasis and rheumatoid arthritis. However, TNIP1’s exact role has yet been
determined.
To characterize the specific genes and pathways affected by TNIP1, we
overexpressed TNIP1 in HaCaT keratinocytes. Using a gene microarray analysis,
we observed reduced expression of most genes altered. These results not only
validated previously determined TNIP1-repressed pathways and biological
processes, but also revealed novel TNIP1-affected pathways, such as the cell
stress response. Specific proteins involved in this process, heat shock proteins
(HSP), showed reduced mRNA and protein expression following increased
TNIP1 levels. When TNIP1 levels were increased in normal human epidermal
keratinocytes, the repression of HSPs were only observed in differentiating

26
keratinocytes. Additionally the induction of one keratinocyte differentiation
marker, involucrin, was blocked by TNIP1. This may indicate that keratinocyte
differentiation may be slowed by increased levels of TNIP1. Keratinocytes rely on
HSPs for both chaperone and stress recovery functions, during differentiation
and inflammation. Their reduced expression by TNIP1 could compromise cell
function, possibly affecting KC homeostasis.
27
Introduction
TNF-induced protein 3-interacting protein 1 (TNIP1) is an intracellular
regulatory protein that blocks or represses various signaling pathways involved in
normal cell physiology and the pathogenesis of several inflammatory diseases,
such as psoriasis, systemic lupus erythematosus and rheumatoid arthritis (34,
38, 87). These pathologies share a hyper inflammatory nature, in part, resulting
from dysregulation of a diverse group of receptor-mediated signaling pathways,
possibly involving altered TNIP1 levels or functions. For instance, increased
levels of TNIP1 were observed in skin samples from patients with psoriasis, a
chronic inflammatory disease characterized by keratinocyte (KC) hyper-
proliferation and incomplete differentiation. Research from our laboratory
determined TNIP1 as a ligand-dependent nuclear receptor corepressor,
specifically of peroxisome proliferator activated receptor (PPAR) and retinoic acid
receptor (RAR) (23, 24). Work from other laboratories characterized TNIP1
blocking transmembrane receptor-initiated cascades, such as TNF receptor
(TNFR) (28, 31, 88), epidermal growth factor receptor (EGFR) (89), and toll-like
receptor (TLR) (69, 90), resulting in the reduced activation of NF-κB, Elk-2 and
C/EBPβ, respectively. Overall, TNIP1 can be classified as a direct or indirect
repressor of transcription factor activation or activity (for a recent review on
TNIP1, refer to (41)). Although TNIP1’s association in these cascades and
diseases has been observed, the consequences and specific genes affected by
increased TNIP1 have not yet been established. To assess the role TNIP1 plays
in KC biology, we performed a gene microarray using samples from TNIP1-
28
overexpressing cultured KCs. The gene clustering analysis not only confirmed
TNIP1’s association in known inflammatory diseases and processes, but it also
found a novel pathway involved in TNIP1 signaling — the cell stress response
centering on heat shock proteins (HSP).
HSPs are molecular chaperones initially discovered (72) for their
protective roles during cellular stress by preventing protein unfolding and
aggregation (71, 73). Under basal, unstressed conditions, these proteins aid in
new protein folding and shuttling. Similar to other cell types, epidermal
keratinocytes have basal and stress inducible levels of HSPs (74, 80, 91).
Because the keratinocytes are a first line barrier between various environmental
stressors and the body, HSPs are key to protecting keratinocytes from the
damage caused by cellular stressors, including UV exposure, chemical treatment
or increased thermal changes (71).
The HSPA (also named HSP70) family is well known and widely studied in
skin biology. In unstressed skin, HSPA1A, the best-characterized member of this
family, is primarily found in the major cell type in the epidermis, KCs, but not
other cell types, such as melanocytes and fibroblasts (92). Pharmacologic
repression of HSPA1A expression in keratinocytes resulted in reduced resistance
to UV treatment (93). Further, increased expression of HSPA1A is observed in
psoriatic lesions (80) and wound healing (94), suggesting a potential role for
these chaperones in these pathologies. The expression of a close relative of
HSPA1A, HSPA6 (also named HSP70B’), has recently been established in KCs
(74). This protein has some similar protective functions compared to HSPA1A
29
(79) although each has distinct protein substrates as examined through protein
binding with endogenous or experimentally expressed proteins. HSPA6 has
preferential binding to unfolded p53, but has no effect on HSPA1A protein
subtrates, luciferase enzyme and peroxisomal proteins (77, 78). It is speculated
that HSPA6 may act as a backup response to stressors, whereas HSPA1A is the
primary response. Regardless, siRNA-mediated knockdown of either HSP
resulted in decreased cell survival post thermal and chemical stress, indicating
both HSPs are crucial for cell protection (79).
In this chapter, we examined the cell signaling effects and gene
transcriptional changes due to overexpression of recombinant TNIP1. Although
TNIP1 was previously shown to block pathways initiated by nuclear and
transmembrane receptors (23, 24, 28, 31, 88), this repression was assessed
using reporter gene constructs, not through quantifying the expression of
endogenous target genes. To determine the specific genes, we performed a
gene microarray analysis of TNIP1-overexpressed HaCaT KCs to confirm the
biological functions and pathways associated with TNIP1, as well as to search for
novel pathways altered by TNIP1. In addition to affecting pathways involved in
inflammation and cell death, increased TNIP1 affected a not yet characterized
TNIP1-associated pathway, regulation of the stress response. We observed
reduced levels of several heat shock proteins (HSP), including HSPA1A and
HSPA6. These results could suggest a novel TNIP1 function in modulating the
cell stress response.

30
Materials and Methods
Cell Culture
HaCaT KCs (95) were cultured in 37C with 5% CO2 humidified incubator
in a 3:1 DMEM/F12 media containing 10% FBS (Thermo Scientific HyClone,
Logan, UT), 100U/ml penicillin, and 100 mg/ml streptomycin. The cells were
plated on 6- or 24-well plates at a density of 6.8 x 10⁵ or 1.5 x 10⁵ cells per well,
respectively. Twenty-four hours after, cells were infected with an adenovirus
construct expressing TNIP1 (Ad-TNIP1) or LacZ as a control (Ad-LacZ) at an
multiplicity of infection (MOI) of 500 using Polybrene infection reagent (Millipore,
Billerica, MA) (96). Sixteen hours post-infection, the viral mixture was aspirated
and media replaced. Twenty-four hours post-infection, cells were collected for
total RNA using the RNeasy kit (Qiagen, Valencia, CA) or protein using RIPA
lysis buffer (10 mM Tris, 150 mM NaCl, 1% deoxycholic acid, 1% Triton, 0.1%
SDS).
Normal human epidermal keratinocytes (NHEK) were cultured in 37C
with 5% CO2 humidified incubator in a KBM-Gold supplemented with KBM-Gold
Bullet Kit (Lonza Biologics Inc, Hopkinton, MA) at passage number 2-4. Cells
were plated on 6-well plates at 9.5 x 10⁴ cells per well. Forty-eight hours after,
cells to be collected from low calcium (0.1 mM) media were infected with Ad-
TNIP1 or Ad-LacZ (control) at an MOI of 50 (assuming one cell doubling time has
occurred)using Polybrene infection reagent. Twenty-four hours after infection, the
cells cultured in low calcium medium were collected for total RNA using the
RNeasy kit (Qiagen) or protein using RIPA lysis buffer, while the media for the

31
the cells grown in high calcium was replaced with fresh media supplemented to a
final concentration of 1.2 mM calcium. Forty-eight hours after, high calcium
cultured cells were infected with Ad-TNIP1 or Ad-LacZ (control) at an MOI of 50
(assuming a total of 4 cell doubling times have occurred) using Polybrene
infection reagent. Twenty-four hours after infection, the cells cultured in high
calcium medium were collected for total RNA using the RNeasy kit (Qiagen) or
protein using RIPA lysis buffer.
Microarray
Total RNA isolated from LacZ- or TNIP1-expressing adenovirus infected
cells was provided to the University of Connecticut Health Center Molecular Core
Facility for microarray analysis. The microarray was performed using the Illumina
Human WG-6 3.0 Expression Bead Chip and analyzed using the GenomeStudio
software (Illumina, San Diego, CA). Significantly altered genes were determined
using a fold change of ≥ 2 and a p-value ≤ 0.05 (DiffScore = 13). Functional
grouping and analysis was performed using Ingenuity Pathway Analysis online
software (Ingenuity Systems, www.ingenuity.com) and the Database for
Annotation, Visualization and Integrated Discovery (DAVID) web-accessible
program (97, 98).
Real-Time quantitative PCR analysis
Reverse transcription was performed using aliquots from the total RNA used for
the microarray using the iScript reverse transcriptase (BioRad, Hercules, CA).

32
Gene expression changes were analyzed using POWER SYBR green master
mix (Life Technologies, Grand Island, NY). Real-time PCR was performed using
Applied Biosystems 7500 Fast Real-Time PCR system. Data analysis was
carried out on ABI 7500 software using the ΔΔCT method. The primer sequences
used and reaction conditions are listed on Table 2.1. All data was normalized to
the ribosomal proten L13a (RPL13a) (99).
Immunoblot analysis
Whole-cell lysates were prepared in RIPA buffer and the protein concentration
was determined using the 660 nm Protein Assay (Thermo Pierce). Ten
micrograms of protein were separated by SDS/PAGE, transferred to
nitrocellulose membranes, rinsed with nanopure water and treated with Qentix
(Thermo Scientific Pierce). Blots were incubated in blocking buffer consisting of
5% (w/v) non-fat dried milk, phosphate-buffered saline, and 0.1% Tween 20, then
probed with HSP70B’ antibody (ADI-SPA-754) at 1:1000 dilution (Enzo Life
Sciences, Farmingdale, NY) or anti-HSPA1A antibody (ADI-SPA-810) at 1:1000
dilution (Enzo Life Sciences) (82, 83) followed by HRP (horseradish peroxidase)-
conjugated secondary goat anti-mouse antibody at 1:10,000 dilution
(PerkinElmer, Branford, CT). Blots were subsequently probed with -actin
antibody (ab8227) at 1:5,000 dilution (Abcam, Cambridge, MA) followed by HRP-
conjugated secondary goat anti-rabbit antibody at 1:20,000 dilution
(PerkinElmer). Between probing steps, blots were washed with 0.2% Tween20 in
phosphate-buffered saline. Detection of binding was determined with enhanced

33
chemiluminescence reagents (Thermo Scientific Pierce). Band signals were
digitally captured and analyzed using the Kodak image station CCF and
Carestream molecular imaging software.
Statistical Analysis
Data was analyzed using Prism Software version 5 (GraphPad) (La Jolla, CA).
Student’s T-test was use to compare between pairs. Statistical significance was
defined as p 0.05.

34
Table 2.1 List of qPCR primers
Primer name Primer sequence 5’ to 3’
HSPA6, forward CTC CAG CAT CCG ACA AGA AGC
HSPA6, reverse ACG GTG TTG TGG GGG TTC AGG
IL6, forward GGT ACA TCC TCG ACG GCA TCT
IL6, reverse GTG CCT CTT TGC TGC TTT CAC
DNAJB1, forward GAG GAA GGC CTA AAG GGG AGT
DNAJB1, reverse AGC CAG AGA ATG GGT CAT CAA
HSPA1A, forward AGG TGC AGG TGA GCT ACA AG
HSPA1A, reverse ATG ATC CGC AGC ACG TTG AG
RARRES3, forward CAA GAG CCC AAA CCT GGA G
RARRES3, reverse TAT ACA GGG CCC AGT GCT CAT
NFKBIA, forward AAC CTG CAG CAG ACT CCA CT
NFKBIA, reverse ACA CCA GGT CAG GAT TTT GC
DNAJA1, forward TCA AAC CCA ATG CTA CTC AGG A
DNAJA1, reverse TCC ACC CTC TTT AAT TGC CTG T
RNASE7, forward GGA GTC ACA GCA CGA AGA CCA
RNASE7, reverse CAT GGC TGA GTT GCA TGC TTG A
MAKP13, forward TGC TCG GCC ATC GAC AA
MAKP13, reverse TGG CGA AGA TCT CGG ACT GA

35
Results
TNIP1 overexpression analysis using a gene microarray
To determine the effect of increased TNIP1 levels in keratinocytes (KC),
recombinant TNIP1 was overexpressed in HaCaT KC, a human immortalized,
but non-tumorigenic KC cell line which retains the KC differentiation properties
(95). Using an adenoviral vector expressing either TNIP1 (Ad-TNIP1) or control
gene LacZ (Ad-LacZ) at a MOI=500, a ~11-fold increase of TNIP1 protein was
observed twenty-four hours after adenoviral infection (Fig 2.1). Increased
expression of TNIP1 was further examined at 48, 72 and 96 hours post-infection.
Expression of TNIP1 did not change throughout these later timepoints (data not
shown). The mRNA changes at 24 hours post-infection was chosen for the
microarray to reduce the chances of gene expression changes due to further
downstream protein expression changes.
Increased TNIP1 results in repression of a majority of genes
To assess the possible direct repressive effect on TNIP1 on target genes’
transcription, we extracted total RNA lysates from the Ad-LacZ and Ad-TNIP1
infected cells twenty-four hours post-infection for a gene microarray analysis.
Using the Illumina whole genome expression array, we observed 139
significantly regulated genes using cutoffs of 2-fold and a p-value 0.05. We
plotted these results and observed that 136 genes’ expression was reduced,
while only 3 genes were increased (Fig 2.2, top panel). The volcano plot shows
log2-fold change in mRNA expression between the control and TNIP1-

36
Figure 2.1
Figure 2.1. Validation of TNIP1 overexpression. Expression and quantitation
of TNIP1 protein in control (Ad-LacZ) or TNIP1-overexpressed (Ad-TNIP1)
HaCaT KCs. Statistical significance was determined using Student’s t-test, ** p <
0.01. Bars are mean + SEM from experimental triplicates.

37
overexpressed samples on the x-axis and the negative log of the DiffScore
(transformed p-value) on the y-axis. Each point on the plot represents a single
gene.
To validate the use of the microarray, we performed a qPCR analysis of
selected genes. Genes which were maximally reduced (HSPA6 and IL-6) and
increased (RNase7 and MAPK13) were among those chosen. Additionally, we
chose previously determined nuclear receptor and NF-kB regulated genes
(RARRES3 and NFKBIA, respectively) (Fig 2.2, bottom panel). A similar trend in
gene reduction and induction was observed comparing the microarray and
qPCR.
Determining the biological functions and pathways affected by increased TNIP1
To determine the biological processes most relevant to our TNIP1
overexpression microarray, we used two pathway analyses and clustering web-
accessible programs, Ingenuity Pathway Analysis (IPA) and the Database for
Annotation, Visualization and Integrated Discovery (DAVID). The IPA analysis
can group the significantly altered gene list by biological function and
toxicological pathways affected. The top associated biological functions affected
by increased TNIP1 levels include cancer, cell death, inflammatory diseases and
gene expression (Fig 2.3, top panel). The IPA pathway clustering analysis
showed that pathways involving PPAR and RAR activation were affected in the
microarray (Fig 2.3, bottom panel). Further, pathways previously unknown to be
regulated by TNIP1 were affected, especially stress associated pathways.

38
Figure 2.2
Figure 2.2. TNIP1 overexpression microarray results. Top panel. Volcano plot
analysis of microarray results. Each point represents one gene. Bottom panel.
Validation of microarray using qPCR. Note break in axis and change in scale.

39
Figure 2.3
Figure 2.3. Ingenuity Pathway Analysis clustering of genes with significant
expression change. Top panel. IPA biological function analysis of the top
affected clusters. Bottom panel. IPA pathway cluster of the top affected pathways
above the threshold.

40
To further confirm the pathways and functions observed using IPA, we
also used the separate functional annotation software, DAVID. The top gene
functional classifications observed were similar to the IPA clustering (Fig 2.4).
From the DAVID analysis, the unexpected pathway affected by TNIP1 was the
stress response pathway. To determine the potential TNIP1 effect on this novel
TNIP1-associated pathway, we looked at the specific genes within this pathway
altered by TNIP1.
Heat shock response genes’ expression is repressed by TNIP1
The microarray results showed reduced expression of five HSP family
members (HSPA6, DNAJB1, HSPA1B, HSPA1A and DNAJA1) by 20-, 5-, 3.2-,
3- and 2-fold, respectively. HSPA6 was the gene most repressed by TNIP1 in our
analysis. Results from the microarray were validated via qPCR (Fig 2.5, top
panel). Since the role of the HSPA family is better characterized in keratinocyte
biology, we further assessed whether TNIP1’s inhibitory effect on these genes
extend to altered protein expression. We observed reduced protein expression of
both HSPA1A and HSPA6 in response to enhanced TNIP1 protein expression
(Fig 2.5, bottom panel).
In addition to using the HaCaT keratinocytes, we also examined the
transcript expression levels of HSPA1A and HSPA6 in cultured normal human
skin keratinocytes (NHEK). A well characterized and used method to induce
NHEK differentiation from an undifferentiated population is to switch the media
calcium concentration from low to high amounts. To test if the calcium switch

41
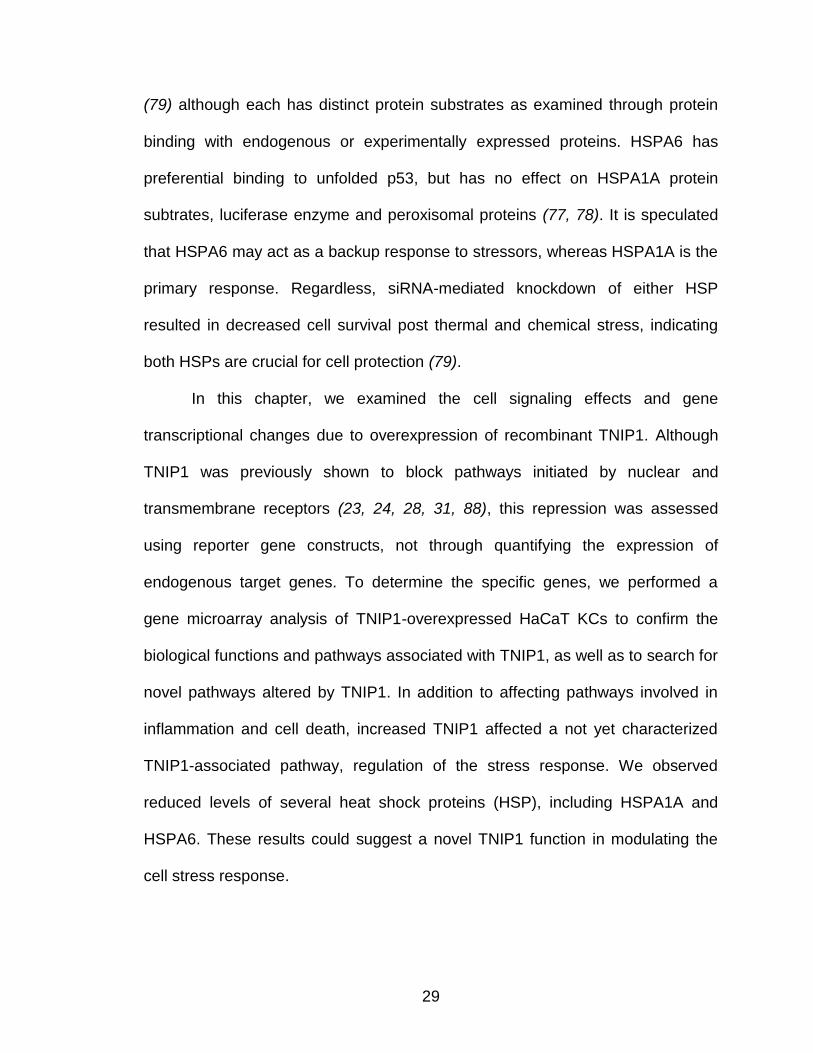
induced KC differentiation, we examined the mRNA levels of two KC
differentiation markers observed in the spinous and granular layers, keratin 1 and
involucrin, respectively (Fig 2.6). Control infected cells show 38- and 13-fold
increased expression of keratin 1 and involucrin, respectively, suggesting KC
differentiation is occurring. Interestingly, HSPA1A and HSPA6 expression was
increased in differentiating KC compared to the undifferentiated KC (Fig 2.7). The
TNIP1-mediated repression of these genes was only observed in differentiating
keratinocytes. TNIP1 had no effect on HSPA1A and HSPA6 in low calcium
cultured cells.

42
Figure 2.4
Figure 2.4. DAVID clustering of genes with significant expression change.
DAVID biological function analysis of the top affected clusters.

43
Figure 2.5
Figure 2.5. Effect of TNIP1 overexpression on HSPs in HaCaT KCs. Top
panel. Microarray and qPCR analysis of HSPA6, DNAJB1, HSPA1A and
DNAJA1 in HaCaT KCs. Bottom panel. Western blot analysis of HSPA1A and
HSPA6 in HaCaT KCs. -actin is used as a loading control.
44
Figure 2.6
Figure 2.6. Effect of TNIP1 overexpression on KC differentiation markers in
NHEKs. Quantitative PCR analysis of keratin 1 (left graph) and involucrin (right
graph) in undifferentiated (low calcium) or differentiated (high calcium) NHEKs
infected with Ad-LacZ (control) or Ad-TNIP1. Statistical significance was
determined using Student’s t-test, * p < 0.05. Bars are mean + SEM from
experimental triplicates.

45
Figure 2.7
Figure 2.7. Effect of TNIP1 overexpression on HSPs in NHEKs. Quantitative
PCR analysis of HSPA1A (left graph) and HSPA6 (right graph) in undifferentiated
(low calcium) or differentiated (high calcium) NHEKs infected with Ad-LacZ
(control) or Ad-TNIP1. Statistical significance was determined using Student’s t-
test, * p < 0.05. Bars are mean + SEM from experimental triplicates.

46
Discussion
The expression and roles of TNIP1 in cells and tissues are still being
determined. Through several genome wide association studies and gene
expression analysis, TNIP1 has been linked to various inflammatory diseases
(34, 38, 39, 87). Additionally, TNIP1’s repressive effects have been observed
experimentally in several receptor-mediated pathways, including TNFR and
nuclear receptors, using promoter-responsive reporter constructs (24, 25, 28, 31,
69, 88) (refer to (41) for review). Consistent with TNIP1’s repression of these
pathways, our microarray results using cells overexpressing TNIP1 resulted in
reduced expression of 136 of 139 genes, validating TNIP1’s repressive effect.
Decreased expression of TNFα and nuclear receptor target genes, including
interleukin 6 (IL6), NFkB inhibitor alpha (NFKBIA) and retinoic acid receptor
responder 3 (RARRES3), were observed, confirming TNIP1’s role in repressing
these pathways.
Pathway clustering analysis showed functions related to cancer, cell death
and immunological diseases were affected using IPA, while DAVID (97, 98)
analysis showed functions related to antiviral defense, transcription and cell
death. The classification for cancer, immunological diseases and antiviral
defense could be related because each of these functions have similar altered
genes that are associated with inflammation. The specific functional grouping
could be annotated differently within these clustering programs. However, since
the gene lists altered are the similar, this could make the association between
TNIP1 and these pathways stronger. A previously unknown TNIP1-associated

47
function affected from the TNIP1 overexpression in HaCaT KCs was the stress
response pathway, indicating TNIP1 could play a role in modulating the cell
stress response in skin KCs.
Expression levels of several stress-responsive genes from two HSP
families, HSPA and DNAJ (also named HSP70 and HSP40, respectively), were
decreased after TNIP1 overexpression in HaCaT KCs. HSPA1A/B, HSPA6,
DNAJA1, and DNAJB1 levels were reduced as much as 20-fold in the
microarray. In addition to their key roles in protecting the cell from various
stressors, they play equally important functions in unstressed cells as molecular
chaperones. Protein expression analysis for HSPA1A and HSPA6 further
showed reduced protein expression, suggesting HaCaT KCs may have a
reduced capacity to tolerate exposure to cell stressors with increased TNIP1
levels. In unstressed cells, TNIP1 could affect new protein synthesis and
shuttling through reduced expression of HSPs, possibly affecting KC proliferation
and differentiation.
TNIP1 appears to play important roles in regulating multiple receptor
mediated signal pathways— from the membrane bound TNFR (28, 67, 100)
signaling cascades to modulating the transcriptional activity of nuclear PPAR (24)
and RAR (23). Additionally, increased expression of TNIP1 has been implicated
in several disease states, including psoriasis (34, 52). Though TNIP1’s specific
role has not been identified in these diseases, our results observed TNIP1
overexpression reduced expression of several HSPs, a group of proteins whose
expression also increases during psoriasis. These results show a discord in

48
these findings because increased levels of both TNIP1 and HSPs were
observed. A potential explanation could be that, while increased TNIP1 levels
result in reduced HSP expression, the inflammation-induced levels of HSPs
could be greater than that found if TNIP1 expression was not increased. If TNIP1
levels were reduced in psoriasis, more HSPs could be observed in psoriatic
lesions, which would protect the cell from further inflammation-induced damage.
Using NHEK cells, we were able to determine whether TNIP1 has an
effect on HSPs in undifferentiating (low Ca2+ in the media) or a mixed population
of undifferentiated and differentiated (high Ca2+ in the media) KCs (101). To
generate a greater change in the cell population, the high calcium cultured
NHEKs were grown an extra 3 days after collecting the low calcium cultured
cells. The extra time allowed to grow in addition to the increased calcium
concentration further induces KC differentiation. Using undifferentiating vs.
differentiating cultured NHEK cells, we observed the TNIP1-mediated reduction
of HSPA1A and HSPA6 only in the mixed population with differentiating
keratinocytes. These results are consistent with the HaCaT KC data because the
cell culture conditions for the HaCaTs are also grown using high calcium media
(1.45 mM Ca2+). Thus, the HaCaT cells contain a mixed population of KCs.
Interestingly, when we examined two markers of KC differentiation, involucrin
and keratin 1, we observed a TNIP1-repressive effect on involucrin, but not
keratin 1. These results suggest TNIP1 reduces the expression of specific genes
and is not a general repressor of all genes.

49
In this chapter, we used a gene microarray to examine the specific genes
and functions altered by increased TNIP1 levels in KCs. Results show that
TNIP1-associated pathways and diseases were altered in response to enhanced
TNIP1 protein levels. A novel pathway, the cell stress response, was also
altered, in which HSP mRNA levels were reduced, possibly indicating TNIP1
could transcriptionally regulate these genes. The TNIP1-mediated repression of
HSPA1A and HSPA6 extended to a decrease in protein expression further
suggesting that TNIP1 may alter the cell stress response by inhibiting the
production of these proteins.

50
Chapter 3
Transcriptional Regulation of HSPA6 in Basal and Stressed Conditions
Abstract
Epidermal KCs serve as the primary barrier between the body and environmental
stressors. They are subjected to numerous stress events and are likely to
respond with a repertoire of heat shock proteins (HSP). HSPA6 (HSP70B’) is
described in other cell types with characteristically low to undetectable basal
expression, but is highly stress-induced. Despite this response in other cells, little
is known about its control in keratinocytes (KC). We examined endogenous
human KC HSPA6 expression and defined some responsible transcription factor
sites in a cloned HSPA6 3kb promoter. Using promoter 5’ truncations and
deletions, negative and positive regulatory regions were found throughout the
3kb promoter. A region between -346 to -217 bp was found to be crucial to
HSPA6 basal expression and stress inducibility. Site-specific mutations and
DNA-binding studies show a previously uncharacterized AP1 site contributes to
the basal expression and maximal stress induction of HSPA6. Additionally, a new
heat shock element (HSE) within this region was defined. While this element
mediates increased transcriptional response in thermally stressed KCs, it
preferentially binds a stress inducible KC factor, other than HSF1 or HSF2.
Intriguingly, this new HSPA6 HSE competes HSF1 binding a consensus HSE
and binds both HSF1 and HSF2 from other epithelial cells. Taken together, our
results demonstrate that the HSPA6 promoter contains essential negative and
positive promoter regions and newly identified transcription factor targets, which

51
are key to the basal and stress inducible expression of HSPA6. Furthermore,
these results suggest an HSF-like factor may preferentially bind this newly
identified HSPA6 HSE in HaCaT KCs.
52
Introduction
Properly controlled heat shock protein (HSP) gene expression is integral
to maintaining and restoring cell homeostasis under basal and stressed
conditions, respectively. Although initially known by their transcription induction
from thermal stress, HSP expression is also increased in response to toxic
chemical and UV light assaults (71). Additionally, the characterization of dozens
of HSP genes across multiple families established that several members are
constitutively expressed, accounting for their availability in “house-keeping”
chaperone function (73). As might be expected, within and across HSP families
there are some coding sequence similarities, common substrate targets, and
shared transcriptional control by HSF (heat shock factor) (102, 103). However,
these shared qualities belie the non-redundant role of several HSP identified in
recent reports (77-79, 104). HSPA1A (HSP70) is an important protein chaperone
in unstressed conditions and is crucial to prevent stress-induced cell death. While
closely related to HSPA1A, HSPA6 (HSP70B’) has similar yet distinct functions
and its expression patterns (79, 105) vary between cell types and cell densities
(83).
Like HSPA1A, HSPA6 expression is essential to increasing survival of
cells exposed to increased temperatures or chemicals. Single or double siRNA-
mediated knockdown of HSPA1A and/or HSPA6 suggest that while both HSPs
are important to increasing cell survival, HSPA6 may be a secondary regulator of
stress compared to HSPA1A (79). Decreased expression of HSPA6 did reduce
the cell viability after a 42C heat stress or proteasome inhibitor MG-132

53
treatment, suggesting its importance in cell survival. HSPA6 likely forms
complexes with HSPA1A and DNAJB1 (HSP40) (82, 106) to confer its protective
function. Despite some HSPA6/HSPA1A overlap in facilitating cell survival,
further work showed they have distinct protein substrates. Compared to
HSPA1A, HSPA6 has higher affinity for unfolded p53 but has no effect in
refolding the luciferase enzyme and peroxisomal proteins (77, 78). Better
definition of HSPA6 gene expression levels and the protein factors/promoter
elements contributing to it would improve our understanding as to its availability
or inducibility to meet these specific protective chaperone/refolding functions.
HSPA6 production under non-stressed conditions is variable, from not
detected, to low expression levels, possibly dependent on cell type (81, 82) and
growth condition differences (83). Its capacity for significant induction under
stressed conditions has been well-documented but what controls this or basal
expression has mostly been elucidated using a ~287 bp minimal promoter (84-
86). To enhance our understanding of HSPA6 production in other cell types and
control over its basal and inducible transcription, we examined HSPA6
expression in epidermal KCs and what might contribute to control of inducible
and any basal expression. Various HSPs in KCs serve as a cadre of molecular
chaperones and stress response proteins both for protein folding during cell
differentiation and epidermal response to topical assaults. Insufficient HSP
expression in KCs has detrimental consequences including i) inadequate
integration of cytoskeletal and non-cytoskeletal proteins to generate the skin’s
barrier and ii) failure to cope with or recover from stresses as evidenced by poor

54
or absent wound healing (107, 108). In brief, we found human KCs have
significant capacity for HSPA6 induction at both mRNA and protein levels
compared to the related HSPA1A. Additionally with computational analysis,
cloning, and functional assessment of ~3kb of the HSPA6 promoter we found
previously unidentified regions exerting negative or positive effects over basal
expression as well as a novel (heat shock element) HSE upstream of those
previously known (85). Constitutive and strikingly inducible HSPA6 expression in
combination with complex transcriptional regulation suggest it may be positioned
to contribute significant chaperoning as well as stress-protective functions to
epidermal KCs.

55
Materials and Methods
Cell culture
HaCaT, SCC13, MCF7, HeLa, HepG2 and dermal fibroblasts were cultured in a
3:1 DMEM/F12 media containing 10% FBS (Thermo Scientific HyClone, Logan,
UT), 100U/ml penicillin, and 100 mg/ml streptomycin. HT29 cells were cultured in
McCoy’s 5a modified media containing 10% FBS, supplemented with 1% non-
essential amino acids (NEAA), 100U/ml penicillin, and 100 mg/ml streptomycin.
Caco2 cells were cultured in MEM media containing 20% FBS and supplemented
with 1% NEAA, 1% pyruvate, 100U/ml penicillin, and 100 mg/ml streptomycin. All
cells were grown in a 37C with 5% CO2 humidified incubator. For mRNA and
protein analyses, cells were plated at 1.5 x 10⁵ and 6.8 x 10⁵ cells per well in 24-
or 6-well plates, respectively. Twenty-four hours later, cells were stressed for 1
hour in a 42C water bath (control cells were immersed in a 37C water bath) and
returned to a 37C incubator for the indicated recovery time. Cells were collected
for total RNA using the RNeasy kit (Qiagen, Valencia, CA) or protein using RIPA
lysis buffer (10 mM Tris, 150 mM NaCl, 1% deoxycholic acid, 1% Triton, 0.1%
SDS) supplemented with Halt Protease Inhibitor (Thermo Scientific, Waltham,
MA). For transfection analysis, cells were plated to 70% confluency in 24-well
plates. Twenty-four hours later, cells were transfected as described below.
Real-Time quantitative PCR analysis
Reverse transcription was performed using aliquots from the total RNA used for
the microarray using the iScript reverse transcriptase (BioRad, Hercules, CA).

56
Gene expression changes were analyzed using POWER SYBR green master
mix (Life Technologies, Grand Island, NY). Real-time PCR was performed using
Applied Biosystems 7500 Fast Real-Time PCR system. Data analysis was
carried out on ABI 7500 software using the ΔΔCT method. The primer sequences
used and reaction conditions are listed on Table 2.1. All data were normalized to
the ribosomal proten L13a (RPL13a) (99).
Immunoblot analysis
Whole-cell lysates were prepared in RIPA buffer and the protein concentration
was determined using the 660 nm Protein Assay (Thermo Pierce). Ten
micrograms of protein were separated by SDS/PAGE, transferred to
nitrocellulose membranes, rinsed with nanopure water and treated with Qentix
(Thermo Scientific Pierce). Blots were incubated in blocking buffer consisting of
5% (w/v) non-fat dried milk, phosphate-buffered saline, and 0.1% Tween 20, then
probed with HSP70B’ antibody (ADI-SPA-754) at 1:1000 dilution (Enzo Life
Sciences, Farmingdale, NY) or anti-HSPA1A antibody (ADI-SPA-810) at 1:1000
dilution (Enzo Life Sciences) (82, 83) followed by HRP (horseradish peroxidase)-
conjugated secondary goat anti-mouse antibody at 1:10,000 dilution
(PerkinElmer, Branford, CT). Blots were subsequently probed with -actin
antibody (ab8227) at 1:5,000 dilution (Abcam, Cambridge, MA) followed by HRP-
conjugated secondary goat anti-rabbit antibody at 1:20,000 dilution
(PerkinElmer). Between probing steps, blots were washed with 0.2% Tween20 in
phosphate-buffered saline. Detection of binding was determined with enhanced

57
chemiluminescence reagents (Thermo Scientific Pierce). Band signals were
digitally captured and analyzed using the Kodak image station CCF and
Carestream molecular imaging software.
Generation of luciferase constructs
The HSPA6 promoter containing the -2963 to +48 bp sequence (herein referred
to as -3 kb-luc) was PCR amplified from human genomic DNA (cat# 636401) (BD
Biosciences, San Jose, CA) using forward: 5’-GAT GGG TAC CTC ATC TTG
AAT TCC CAC AAC ACA TGG-3’ and reverse: 5’-GGC TGA AGC TTA GTG
AGG CTC TCC CTG CGG TTT CTC T-3’ with added KpnI and HindIII sites
(underlined), respectively for insertion into the promoterless vector pGL4.10
(Promega, Madison, WI) using the restriction sites indicated. 5’-promoter
truncations (-1230, -647 and -70 -luc) were performed by using the upstream
KpnI site and native restriction enzyme sites BglII, EcoRI and NruI, respectively.
Digested sites were blunted and ligated. Internal promoter deletions were
performed using the Quikchange Lightning site-directed mutagenesis kit (Agilent,
Santa Clara, CA). Constructs ΔA, ΔB, ΔC, and ΔD were generated using the -
1230 luc; constructs ΔE, ΔF, ΔG, and ΔH were generated using the -647 luc.
Fragment G site specific mutants were generated using the Quikchange
Lightning site-directed mutagenesis kit. The WHN, HSE, MZF1, C/EBP, AP1 and
Zfx sites were mutated as indicated (Table 1). Sites were determined using NHR
Scan (109), Nubiscan (110) and MatInspector (111) web-based software. To
generate the wild type (WT)-G-tk-luc, AP1 mutant (mt)-G-tk-luc, and HSEmt-G-
58
tk-luc construct, the HSPA6 G region was amplified via PCR using primers
flanked by KpnI sites. The pGL4.10 construct containing the thymidine kinase (tk-
luc) minimal promoter was used to insert the HSPA6 WT, AP1mt or HSEmt
fragment G. All HSPA6 3kb isolate, all site-directed mutants, and deletion
constructs were confirmed by sequencing (UConn Biotech Center).
Plasmid transfections
HaCaT cells were plated to 70% confluency 24 hours prior to transfections using
24-well plates. Eight hours prior to transfection, media was replaced with 0.5 mL
serum-containing 3:1 DMEM/F12 media. The appropriate HSPA6 promoter
pGL4.10 plasmid (200 ng) and pCMV- Galactosidase (100 ng) was transfected
using Fugene6 (Promega) using 100 μL serum-free media. Twenty-four hours
later, cells were stressed for 1 hour in a 42C water bath (control cells in a 37C
bath) and returned to a 37C incubator for 4 hours. Cells were then collected and
assayed for the luciferase activity (Promega), protein concentration (Pierce), and
-galactosidase activity (96).
Electrophoretic mobility shift assay (EMSA)
Nuclear extracts were prepared from HaCaT or HeLa cells as previously
described (44). Protein concentrations were determined by BCA protein assay
(Pierce, Rockford, IL). Oligomers (Integrated DNA Technology, IDT, Coralville,
IA) were annealed and end-labeled with 32P-ATP (Perkin Elmer). EMSA
oligonucleotide probe sequences are shown on Table 2. Fifteen or ten

59
micrograms of nuclear extracts were incubated with radiolabeled HSE or AP1
oligomers, respectively. For AP1 EMSAs, nuclear extracts were preincubated
with the appropriate antibodies or unlabeled competition oligomers 1 hour or 15
minutes, respectively, at room temperature prior to the addition of the
radiolabeled oligonucleotide probes. The mixture was incubated at room
temperature for 30 minutes and then loaded into a 6% polyacrylamide gel. Gels
were electrophoresed at 3.5mA/gel in 0.5X TBE buffer for 10 hours at 4°C. For
HSE EMSAs, nuclear extracts were preincubated with unlabeled competition
oligomers 15 minutes at room temperature prior to the addition of the
radiolabeled oligonucleotide probes. Antibodies were added and the mixture was
incubated at room temperature for 20 minutes, then on ice for 10 minutes.
Samples were loaded on a 4% polyacrylamide gel and electrophoresed at
3.5mA/gel in 0.5X TBE buffer for 8 hours at 4°C. Anti- c-Jun (SC-45X), c-Fos
(SC-52X), HSF1 (SC-9144x) and HSF2 (SC-13056X) antibodies were obtained
from Santa Cruz Biotechnology (Santa Cruz, CA). Gels were dried and exposed
to Amersham Hyperfilm MP (GE, Buckinghamshire, UK) for at least 16 h at -80°C
with intensifying screens. Films were developed using a Kodak X-Omat 2000.
Statistical analysis
All data were analyzed using Prism Software version 5 (GraphPad) (La Jolla,
CA). Student’s t-test was used to compare between paired results. ANOVA with
Newman Keuls post hoc was used to compare between grouped results, when
necessary. Statistical significance was defined as p 0.05.

60
Table 3.1. Site-directed mutagenesis primer sequences. Underlined sequences
denote mutations within the binding site.
Site name Sequence within HSPA6 Mutated sequence
WHN ACGC ATAC
HSE GGGAGGAGCTAGAACCTTCC GGGAGGAGCTAATTCCTTCC
MZF1 GCGGGGAAGGT GCGTAGAGGGT
C/EBP CTCAGGCTGCTGAAA CTCATGCACTTGTCA
AP1 TGAGTCA TTAGTTA
ZFX CTGGCCTGGCG CTAAGATGGCG

61
Table 3.2. Oligomers used for EMSA probes. Underlined sequences denote
mutations within the binding site. The predicted HSE mutation encompasses one
HSE repeat, whereas the double mutant encompasses two HSE inverted
repeats.
Oligomer name Primer sequence
Predicted AP1 top CTAGCAGCAGCCTGAGTCAGAGGCGGG
Predicted AP1 bottom CTAGCCCGCCTCTGACTCAGGCTGCTG
AP1 consensus top CTAGCGCTTGATGACTCAGCCGGAA
AP1 consensus bottom CTAGTTCCGGCTGAGTCATCAAGCG
Predicted AP1 mutant top CTAGCAGCAGCCTTAGTTAGAGGCGGG
Predicted AP1 mutant bottom CTAGCCCGCCTCTAACTAAGGCTGCTG
Predicted HSE top CTAGGGGAGGAGCTAGAACCTTCCCCGCA
Predicted HSE bottom CTAGTGCGGGGAAGGTTCTAGCTCCTCCC
HSE consensus top CTAGCGAAACCCCTGGAATATTCCCGACC
HSE consensus bottom CTAGGGTCGGGAATATTCCAGGGGTTTCG
Predicted HSE mutant top CTAGGGGAGGAGCTAATTCCTTCCCCGCA
Predicted HSE mutant bottom CTAGTGCGGGGAAGGAATTAGCTCCTCCC
Predicted HSE double mutant top CTAGGGGAGGAGCCCATTATAGTAGCGCA
Predicted HSE double mutant bottom CTAGTGCGCTACTATAATGGGCTCCTCCC

62
Results
Constitutive and inducible expression of HSPA6 in KCs
Basal and induced levels of HSPA6 were determined in HaCaT KCs under
standard culture and thermal stress conditions. Basal expression of HSPA6 was
detected in unstressed cells with several fold increase in protein levels observed
at 8- and 24-hours post heat shock (Fig 3.1, top panel). HSPA6 mRNA was
highly upregulated immediately following heat stress, then gradually decreased
over 8-12 hours after the stress period to levels similar to basal expression (Fig
3.1, bottom panel). To validate the heat shock, HSPA1A protein and mRNA
expression was also examined. The induction pattern of HSPA1A protein and
mRNA was similar to HSPA6, but to a lesser fold induction than HSPA6 (Fig 3.2).
Variable levels of HSPA6 and HSPA1A were also detected in other epithelial
(HT29, MCF-7, Caco2, HepG2) and epidermis-derived (SCC13), cells with
relatively little detected in dermal fibroblast cells (Fig 3.3) under standard (non-
stressed) culture conditions. HSPA6 cell-type range of expression and induction
suggested a combination of ubiquitous and stress-specific factors may control its
gene expression.
Determining specific transcription factor binding sites within the HSPA6 promoter
To guide physical isolation of the human HSPA6 promoter, we started with
an in silico examination of sequences upstream of the referenced transcription
start site (112) and 5’UTR of the NCBI mRNA reference sequence (113)
NM_002155.3. NHR Scan (109), NubiScan (110) and MatInspector (111)

63
Figure 3.1
Figure 3.1. Basal and heat-inducible expression of HSPA6 in HaCaT KCs.
Top panel. HSPA6 protein expression before (0 hr) and post-heat shock (8 and
24 hr). Samples shown from duplicate cultures. Bottom panel. HSPA6 mRNA
expression before (0 hr) and post-heat shock (1, 2, 3, 4, 8 and 12 hr). Unless
otherwise indicated, all cells are unstressed. -actin used as western blot loading
control.

64
Figure 3.2
Figure 3.2. Basal and heat-inducible expression of HSPA1A in HaCaT KCs.
Top panel. HSPA1A protein expression before (0 hr) and post-heat shock (8 and
24 hr). Samples shown from duplicate cultures. Bottom panel. HSPA1A mRNA
expression before (0 hr) and post-heat shock (1, 2, 3, 4, 8 and 12 hr).

65
Figure 3.3
Figure 3.3. Expression of HSPs in various cell types. HSPA6 (top panel) and
HSPA1A (bottom panel) protein expression in various cells. Unless otherwise
indicated, all cells are unstressed. -actin used as western blot loading control.

66
analysis suggested high scoring hits for diverse transcription factors up through
the first few thousand base pairs of DNA. Germane to our laboratory’s interest in
nuclear receptors, putative peroxisome proliferator activated receptor (PPAR)
and retinoic acid receptor (RAR) response elements were located between ~ -
3000 to -1200 bp upstream of the transcriptional start site. To determine HSPA6
expression responsiveness to these and other transcription factors, we isolated
and cloned its promoter region from -2962 to +48 bp (-3 kb) into a pGL4.10
luciferase reporter gene construct (Fig 3.4). Endogenous HSPA6 expression and
HSPA6 -3 kb-luc promoter activation marginally increased only in presence of
high concentration of PPARγ ligand or overexpressed PPARγ receptor and high
concentration of ligand, respectively (data not shown). Since PPARγ has low
expression in KCs, we hypothesized that other transcription factor(s) may be
responsible for the expression of HSPA6.
Searching the promoter for other predicted sites, further in silico promoter
analysis was performed. In addition to searching for factors that contribute to
HSPA6’s basal expression, we searched for heat shock elements (HSE) that
may contribute to the stress inducibility of HSPA6. Our analysis found previously
recognized sites such as two HSEs at -181 to -161 bp and -100 to -60 bp, an
AP1 site at -139 to -132 bp, and a predicted TATA box within the proximal
HSPA6 promoter, -283 to +110 bp (Wada 2007, Leung 1990). Importantly,
previously unrecognized potential transcription factor binding sites (such as AP1
and upstream HSEs) (Fig 3.5) were identified suggesting additional control
possibilities for basal and inducible HSPA6 promoter activity.

67
Figure 3.4
Figure 3.4. Native restriction enzyme sites within the HSPA6 3kb promoter.
Diagram of the HSPA6 promoter from -2952 to +48 bp. Restriction enzyme sites
shown and used for generating promoter truncation constructs. Yellow region
indicates start of the luciferase reporter gene.

68
Figure 3.5
Figure 3.5. In silico analysis of the HSPA6 3kb promoter. Top panel. HSPA6
promoter sequence between -1300 to -1100 bp. Red sequences denote putative
HSE. Bottom panel. HSPA6 promoter sequence between -700 to +48 bp. Red
sequences denote putative HSE. Blue sequences denote putative AP1 sites.
Nucleotides in boldface denote predicted TATA box. Underlined sections denote
previously identified HSEs. Italicized section denotes previously identified AP1
site.

69
HSPA6 promoter contains negative and positive basal regulatory regions
To narrow down the responsive regions involved in HSPA6 regulation, we
generated a series of 5’ truncation constructs using naturally occurring restriction
enzyme sites (Fig 3.4). Transfection results from the truncated HSPA6 promoter
constructs from unstressed cells showed the -647-luc had increased luciferase
activity compared to the “minimal” -70-luc. Interestingly, extending the 5’
promoter to -1230 bp and further led to a reduction of luciferase activity back to
the minimal promoter levels (Fig 3.6, left panel). These results suggest the
regulation of unstressed HSPA6 includes both negative (between -1230 to -648
bp) and positive (between -647 to -70 bp) elements. Heat-induced expression
(Fig 3.6, right panel) was observed with promoter regions inclusive of sequence
upstream of the previously described -181 and -100 bp HSEs. Notably however,
the fold induction of the -1230 bp and -3 kb were significantly greater than the
fold induction of the -647 bp reporter suggesting other proactive elements
involved in maximal stress response.
To further guide our search for HSPA6 promoter regions contributing to its
overall basal activity and stress response, we generated several constructs
deleting ~150 bp lengths within the -1230-luc or -647-luc constructs. Deletions
within the -1230-luc, ΔA-, ΔB-, ΔC- and ΔD-luc, (Fig 3.7, left panel) showed
removal of fragment D (-806 to -648) increased the promoter activity 76%,
suggesting possible negative regulatory element(s) within this region (Fig 3.7,
middle panel). The stress responsiveness of ΔA-, ΔB-, ΔC- and ΔD-luc were also

70
compromised as a decrease in fold induction was observed with these constructs
compared to full-length -1230-
luc (Fig 3.7, right panel). Internal promoter deletions within the -647-luc, ΔE-, ΔF-
, ΔG- and ΔH-luc (Fig 3.8, left panel), suggested fragments F, G and H each
contribute to the activation of the HSPA6 promoter. Removal of fragments F or H
reduced the promoter activity to ~35% compared to the full-length -647-luc.
Deletion of fragment G (-346 to -217 bp) (Fig 3.8, middle and right panels) led to
the complete loss of the HSPA6 promoter activity. While deletion of each
individual fragment reduced the heat inducibility of the promoter, the induction of
ΔG-luc was significantly reduced back to basal levels of -647-luc. Because
removal of fragment G lost all promoter activation we focused on determining the
possible site(s) within this region that are crucial for the activation of the HSPA6
promoter.
A novel AP1 site within -346 to -217 bp contributes to the activation of the
HSPA6 promoter
A transcription factor binding site search within fragment G (-346 to -217 bp)
determined 6 top-scoring predicted elements: WHN, HSE, MZF1, C/EBP, AP1
and ZFX (Fig 3.9). We generated site-specific mutants within the -647-luc
constructs to determine which binding site may contribute to the unstressed
(37C) expression of HSPA6. Of these candidate sites, mutation of WHN, HSE
and MZF1 had no significant effect on the basal HSPA6 promoter activation,

71
Figure 3.6
Fig 3.6. Determining the transcriptionally regulated regions within the
HSPA6 promoter. Left panel. Promoter activation at basal, 37C conditions. The
graph is normalized to the -70-luc. Right panel. Promoter induction due to a 1
hour, 42C heat stress. Graph shown as fold inducibility compared to 37C
condition. Letters denote statistical significance using ANOVA with Newman
Keuls post-hoc, p < 0.05. Bars are mean + SEM from n=3, triplicate experiments.

72
Figure 3.7
Figure 3.7. Localizing the repressible region within the HSPA6 promoter.
Left panel. Internal deletions A, B, C, and D between -1230 to -648 denoted as
the dotted line. Middle panel. Promoter activation at basal, 37C conditions.
Graph shown as percent of -1230-luc. Right panel. Promoter induction due to a 1
hour, 42C heat stress. Graph shown as fold inducibility compared to 37C
condition. Letters denote statistical significance using ANOVA with Newman
Keuls post-hoc, p < 0.05. Bars are mean + SEM from n=3, triplicate experiments.

73
Figure 3.8
Figure 3.8. Localizing the basal and inducible regions within the HSPA6
promoter. Left panel. Internal deletions E, F, G, and H between -647 to -70
denoted as the dotted line. Middle panel. Promoter activation at basal, 37C
conditions. Graph shown as percent of -647-luc. Right panel. Promoter induction
due to a 1 hour, 42C heat stress. Graph shown as fold inducibility compared to
37C condition. Letters denote statistical significance using ANOVA with
Newman Keuls post-hoc, p < 0.05. Bars are mean + SEM from n=3, triplicate
experiments.

74
whereas C/EBP and ZFX specific mutants resulted in an ~50% increase in the -
647-luc promoter activity. Only mutation of AP1 resulted in activity loss. This local
length of the HSPA6 promoter seems to share the trait of positive and negative
control we saw upstream with -1230 bp and -3 kb lengths. Thus the -346 to -217
bp region is likely crucial for proper positive and negative promoter regulation of
within the HSPA6 native promoter.
To independently assess regulation conferred by region G, we fused the -
346 to -217 bp region to the minimal tk- promoter (Fig 3.10). This G-tk-luc
construct did not significantly change the luciferase activity compared to the tk-
luc construct. When the AP1 site was mutated, a ~54% reduction was observed
compared to wild type fragment G tk-luc (G-WT tk-luc). These results suggest
fragment G activation potential is promoter context dependent, contributing to the
native HSPA6 promoter but not a heterologous (tk) promoter. These results are
consistent with the predicted -244 bp AP1 site contributing to the promoter
activation of HSPA6.
To test for physical association of AP1 to the predicted binding site,
electrophoretic mobility shift assays (EMSAs) were performed. Using the
predicted HSPA6 -244 bp AP1 site as the 32P-labeled oligomers, our EMSA
results show an AP1 specific band competed by an unlabeled HSPA6 AP1 site
and consensus AP1 site, but not by the mutated AP1 site. Addition of AP1
subunit (cJun, cFos, or combined) specific antibody disrupted the band species
in the cFos and the combined cJun/cFos lanes (Fig 3.11). Based on reporter

75
Figure 3.9
Figure 3.9. Searching for transcription factor binding sites between the -346
to -216 bp region of HSPA6. Site specific mutations within the -647-luc
construct. Filled shapes indicate wild-type elements. Specific site mutants are
shown as empty shapes. Graph shown as percent of -647-luc. Letters denote
statistical significance using ANOVA with Newman Keuls post-hoc, p < 0.05.
Bars are mean + SEM from n=3, replicate experiments.

76
Figure 3.10
Figure 3.10. Characterization of the -244 bp AP1 site. AP1 specific mutant
within the fragment G-tk-luc construct. Graph shown as percent of tk-luc. Letters
denote statistical significance using ANOVA with Newman Keuls post-hoc, p <
0.05. Bars are mean + SEM from n=3, replicate experiments.

77
Figure 3.11
Figure 3.11. EMSA binding analysis of AP1 proteins c-Jun and c-Fos to the
-244 bp AP1 site. Antibodies include non-specific IgG (I), anti-c-Jun (J), anti-c-
Fos (F) or both anti-c-Jun and anti-c-Fos (B). Non-radiolabeled competitor
oligomers include self HSPA6 AP1 site (S), consensus oligomer (C) or mutated
AP1 (M) at 5 or 50-fold excess.

78
construct and the protein-DNA interaction experiments, HSPA6 -244 to -237 is a
newly identified, functional AP1 site contributing to transcriptional activity of the
HSPA6 promoter in unstressed conditions.
A novel heat shock element within -346 to -217 bp contributes to the activation
and thermal induction of the HSPA6 promoter
In addition to promoter elements that might contribute to control of basal
activity, our transcription factor search predicted a previously unreported heat
shock element within region G. To test its contribution, or how other sites might
affect overall stress response, we tested 6 site-specific mutants (Fig 3.12) under
basal versus stressed conditions to determine fold induction. Mutations within the
WHN, HSE, HSE/MZF1, and AP1 sites significantly reduced the stress
inducibility of -647-luc, whereas C/EBP and ZFX specific mutations had no
significant effect on stress inducibility. Taken together, these separate binding
sites each contribute to the heat inducibility of the promoter and likely have an
additive effect in order to gain maximal stress inducibility.
To address the heat stress inducibility of the fragment G HSE, we fused
the -346 to -217 bp region to the tk-luc construct. This specific construct is
advantageous as it tests the fragment G candidate HSE independent of the
previously described HSEs more proximal to the transcriptional start site. The G-
WT-tk-luc was heat induced ~20-fold compared to the tk-luc. In contrast, the G-
HSEmt tk-luc abolished all stress induction (Fig 3.13). These results show that
the -284 bp HSE contributes to the increased expression of HSPA6 due to stress
induction.

79
Using the functionally defined HSPA6 -284 bp HSE as EMSA probe, a
band pattern observed from unstressed HaCaT KC nuclear extracts increases in
intensity with heat shock. The binding species could be competed with unlabeled
wild type, mutant, and double mutant HSPA6 HSE site, but not unlabeled
consensus HSE oligomers (Fig 3.14, top panel). Additionally, HSF1 or HSF2
specific antibodies did not affect the band pattern (Fig 3.14, bottom panel). Using
32P-labeled consensus HSE oligomers as EMSA probe, our unlabeled HSPA6
HSE was able to compete the HSF1 specific band, suggesting that the -284 bp
HSE can compete for HSF1 under these circumstances (Fig 3.15).
In an attempt to resolve these disparate results (HSE -284 transcriptionally
active in mediating thermal stress response but not performing as a classic HSF-
binding HSE in vitro) we compared the HSPA6 -284 bp HSE binding with that of
a consensus HSE (derived from the HSPA1A promoter) (114) with an alternate
nuclear protein source, HeLa cells. Using HeLa nuclear extracts, the HSPA6 -
284 bp HSE generated a binding complex recognized by HSF1 antibody from
unstressed and stressed cells, while a HSF2 complex was recognized from
stressed cells (Fig 3.16). As a control, we confirmed that the same extracts were
generating a HSF1-containing complex on the A1A consensus HSE (Fig 3.17).
Together, these transcription activation and EMSA results suggest a stress-
associated transcription factor, other than HSF1 or HSF2, binds the -284 bp HSE
in HaCaT KCs to activate the HSPA6 promoter. Intriguingly, when HeLa cells are
used, HSF1 and HSF2 can bind this site suggesting a cell specific transcription
factor binding of this HSE.
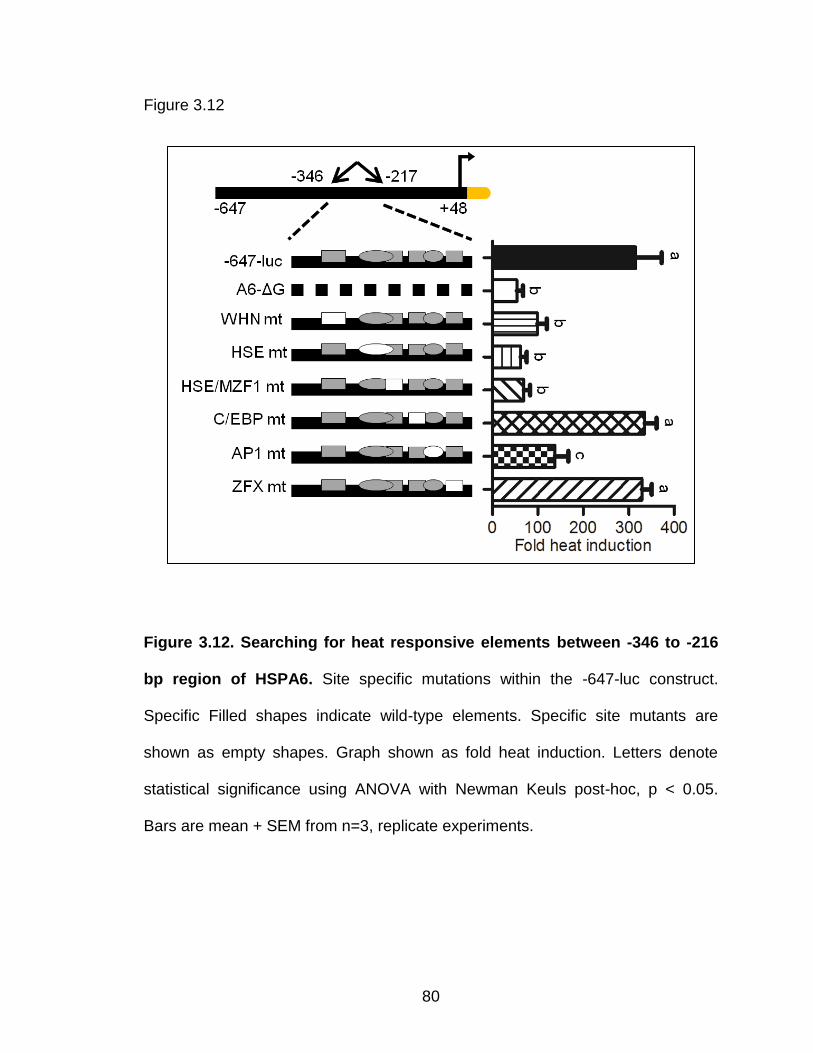
80
Figure 3.12
Figure 3.12. Searching for heat responsive elements between -346 to -216
bp region of HSPA6. Site specific mutations within the -647-luc construct.
Specific Filled shapes indicate wild-type elements. Specific site mutants are
shown as empty shapes. Graph shown as fold heat induction. Letters denote
statistical significance using ANOVA with Newman Keuls post-hoc, p < 0.05.
Bars are mean + SEM from n=3, replicate experiments.

81
Figure 3.13
Figure 3.13. Characterization of the -284 bp HSE. HSE specific mutant within
the fragment G-tk-luc construct. Graph shown as fold heat induction. Letters
denote statistical significance using ANOVA with Newman Keuls post-hoc, p <
0.05. Bars are mean + SEM from n=3, replicate experiments.

82
Figure 3.14
Figure 3.14. EMSA binding analysis of HaCaT HSF proteins to the -284 bp
HSE. EMSA of HSPA6 HSE with HaCaT KC nuclear extracts incubated with
unlabeled competitor oligomers. d. As in c with IgG, HSF1 or HSF2 specific
antibodies. Antibodies include non-specific IgG (I), anti-HSF1 (1), or anti-HSF2
(2) . Non-radiolabeled competitor oligomers include self HSPA6 HSE site (S),
consensus HSE (C), mutated HSE (M) or double mutated HSE (D) at 10 or 100-
fold excess.

83
Figure 3.15
Figure 3.15. EMSA binding analysis of HaCaT HSF proteins to a consensus
HSE. EMSA of consensus HSE with HaCaT KC nuclear extracts. Antibodies
include non-specific IgG (I), anti-HSF1 (1), or anti-HSF2 (2). Non-radiolabeled
competitor oligomers include self HSPA6 HSE site (S), consensus HSE (C) or
mutated HSE (M) at 10 or 100-fold excess. Arrowhead denotes supershift.

84
Figure 3.16
Figure 3.16. EMSA binding analysis of HeLa HSF proteins to the -284 bp
HSE. EMSA of HSPA6 HSE with HeLa nuclear extracts. Antibodies include non-
specific IgG (I), anti-HSF1 (1), or anti-HSF2 (2). Arrowheads denote supershift.

85
Figure 3.17
Figure 3.17. EMSA binding analysis of HeLa HSF proteins to a consensus
HSE. EMSA of consensus HSE oligomer with HeLa nuclear extracts. Antibodies
include non-specific IgG (I), anti-HSF1 (1), or anti-HSF2 (2). Arrowhead denotes
supershift.

86
Discussion
Although discovered over 20 years ago (112), HSPA6’s role as a
chaperone and stress-responding protein have only been recently studied (79,
82, 105, 115). Relative to other members of its HSP70 family, little is known
about HSPA6 transcriptional regulation in stressed and unstressed cells (85, 86).
Basal expression of HSPA6 was not detected in basal, unstressed cells using a
range cell types; however highly stress inducible expression was noted with a
wide range of expression (82, 83, 116).
Using a previously characterized, highly specific HSPA6 antibody (82), our
studies were consistent with a recent report (81) demonstrating detectable but
variable levels of constitutive HSPA6 protein and mRNA in all cell types
examined. Basal expression of HSPA6 could be dependent on different cell
growth conditions and may address the HSPA6 detection here but not in prior
analysis of HaCaT KCs (74). The majority of the cells grown in our lab (HaCaT,
SCC13, MCF7, HeLa, HepG2 and dermal fibroblasts) are grown in a 3:1 ratio of
DMEM:Ham’s F12 or are grown in DMEM supplemented with non-essential
amino acids (HT29 and Caco2). Modifying the ingredients of the cell culture
media has led to increased expression of HSPs (117, 118). Gomez-Sucerquia
and colleagues used cell culture media supplemented with non-essential amino
acids, which could contribute to the basal expression of HSPA6 (81). In addition
to the media composition, the cell density also affects the expression of HSPA6.
Noonan and colleagues observed that HT-29 cells plated at a low cell density
had increased expression of HSPA6 compared to cells cultured at a high cell

87
density (83). Upon thermal stress, HaCaT KCs responded with induction of both
HSPA1A and HSPA6, although the latter to many more fold at the mRNA level.
Given its detection in non-stress conditions ((81) and our report), its capacity for
significant fold induction (82, 119), and its likely contribution to post-stress cell
survival (83) we sought to better define control of its basal and stress-inducible
expression in KCs, a cell type with wide dependence on chaperone function and
likely to encounter diverse stress conditions. We found novel elements
contributing to its basal expression and importantly an upstream HSE likely
contributing to its maximal induction during a stress response.
An in silico promoter analysis indicated several candidate regulatory
elements throughout the first several thousand base pair of the promoter guiding
our cloning of a 3kb region (-2962 to +48 bp). Prior to our work, Wada and
colleagues examined the contribution of an AP1 site and 2 HSEs within the
proximal region (-287 to +110 bp) of the HSPA6 promoter to develop a reporter
construct sensitive to cadmium chloride exposure (84, 85). Taking advantage of
longer promoter regions we isolated, we found that a region further upstream (-
807 to -648 bp; here named fragment D) confers negative regulation and
contributes to heat stress inducibility on HSPA6. The presence of repressive
regions is consistent not only in the transfection results, but may also explain the
reduced endogenous expression in several cell types, such as dermal fibroblasts
and Caco2 cells. If these repressive factors are highly expressed in dermal
fibroblasts and Caco2 cells, the expression of HSPA6 would be greatly reduced.
Despite this region’s overall limiting effect on promoter activity, we established a

88
novel HSE in this region (-807 to -648 bp) that contributes to the HSPA6 maximal
stress inducibility. Furthermore, we observed that a region (-346 to -216 bp,
fragment G) in our extended promoter, directly upstream of previously identified
AP1 (-139 bp) and HSEs (-181 and -100 bp) sites, is crucial for the basal and
heat inducibility of HSPA6 likely by its provision of an additional AP1 site and
another HSE. To test the activating potential of this region, fragment G was fused
to a (tk) promoter where it could confer stress responsiveness to this
heterologous promoter but not raise its basal activity. Interesting, when the AP1
site was mutated in this fragment, basal activity was reduced suggesting that
fragment G was a combination of both positive (like AP1) and negative elements
(as yet to be identified) and that loss of AP1 favored the remaining negative
control from this region. Nevertheless, given that under basal, unstressed
conditions, this fragment G region can confer promoter activation in the context
of the HSPA6 promoter, we sought to determine possible factors contributing to
this region’s basal and stress inducibility.
Within fragment G (-346 to -216 bp), six top-scoring transcription factor
binding sites were predicted: WHN, HSE, HSE/MZF1, C/EBP, AP1 and ZFX. In
unstressed conditions, site specific mutants within fragment G showed that an
AP1 site at -240 bp contributes to the HSPA6 promoter activation. Surprisingly,
our mutation analysis discovered two presumptive repressive elements, C/EBP
and ZFX (120, 121), within this region. Similar to the full HSPA6 3kb promoter,
this shorter fragment also contains both positive and negative elements which
contribute to the overall basal transcription of HSPA6. Consistent with this AP1

89
site contributing to the basal activation of HSPA6, we found that cFos, a typical
subunit of the AP1 protein dimer, but not cJun binds the AP1 site within fragment
G. We expect that since the AP1 heterodimer can be made from several subunits
(cJun, junB, junC, Fra-1, Fra-2, cFos or fosB), the dominant AP1 dimer bound to
the -240 AP1 binding site could be cFos and another subunit other than cJun.
Results from the promoter mutation and EMSA analyses confirm that a new AP1
site within fragment G contributes to the basal and inducible expression of
HSPA6. Other non-HSF proteins have also been recently shown to contribute
control over basal and stress-induced HSP expression. Ataxin-3, possibly
through DNA binding but more likely through its interaction with transcription
factors, augments the full capacity of the HSP70 (HSPA1A) promoter to thermal
and chemical stress (122).
In addition to its basal regulation, we characterized the functional
elements within -346 to -216 that contribute to its stress inducibility. The
predicted HSE at -284 bp (gGGAg gAGCt aGAAc cTTCc) contains one imperfect
site (site 1) and two perfect sites (sites 3 and 4). The HSE specific mutation of
site 3 prevented the stress inducibility to a similar effect of the deletion of entire
fragment G, indicating these nucleotides contribute to the only HSE in this region.
Sites other than the HSE (WHN, HSE/MZF1 and AP1) also appear to contribute
to the maximal heat induction of HSPA6. The HSE/MZF1 site is labeled as such
due to the overlap between key nucleotides within these two sites. The mutations
within MZF1 also affect HSE site 4. We believe that the decrease in stress
inducibility due to the MZF1 mutation is due to the loss of a core HSE repeat.

90
Mutating the AP1 site, which plays a role in basal activation of HSPA6, also
reduced the induction compared to the full length, wild type -647-luc. Similar to
HSPA1A, multiple HSEs (123) and the elements conferring basal activation (124)
of HSPA6 may be necessary to obtain the maximal stress inducibility. The HSE
within fragment G may be working in concert with other factors to achieve the
maximal stress inducibility of HSPA6. Our results show that this HSE is
necessary for the stress inducibility within -346 to -216 bp region of the HSPA6
promoter.
The new HSPA6 HSE we demonstrated at -284 bp provided thermal
responsiveness both in the context of the HSPA6 promoter and when transferred
to the heterologous tk promoter. While this sequence was able to bind HaCaT
KC stress-associated nuclear protein(s) in vitro, it was surprising that these
binding factors were not recognized by either HSF1 or HSF2 antibodies.
Intriguingly, when this site was used as a competitor for the 32P-labeled
consensus HSE, again with HaCaT KC nuclear extracts, it competed HSF1 from
the consensus probe. To test the binding of our site to HSF, we performed the
EMSA analysis using nuclear extracts from a different cell type, HeLa cells. Data
from the HeLa EMSAs suggest our site binds HSF1 under unstressed and
stressed conditions, and HSF2 primarily in stressed nuclear extracts. It is
possible that a different HSF family member may bind this HSE, HSF4. This
transcription factor can compete for HSF1 binding (125), however expression of
HSF4 has not been tested in KCs. Thus our site may bind one of these HSFs, or
possibly a different stress-inducible factor. To date, HSF4’s function and

91
expression have mainly been characterized in eye development, playing a role in
the lens development (126). Altogether, the results from the promoter reports and
DNA-binding assays show our site as a functional HSE which can bind HSF1 and
HSF2, but preferentially binds another, yet characterized stress inducible factor
when presented with HaCaT KC nuclear proteins.
In the present study, we performed an analysis of HSPA6 promoter to
search for core basal and inducible transcriptional elements, finding both positive
and negative regulatory regions. Two factors, AP1 and HSF, contribute to the
expression of HSPA6. AP1 regulates HSPA6 transcription under both unstressed
and stressed conditions, whereas a HSF-like factor HSF contributes to the heat
inducibility of HSPA6. In addition to characterizing these regions, our HSE EMSA
results suggest an HSF-like factor from HaCaT KCs may preferentially bind the
HSPA6 promoter warranting further investigation of this possibly novel factor.

92
Chapter 4
TNIP1-HSP Mechanism of Repression and Overall Keratinocyte
Consequences
Abstract
The increased expression of TNFα-induced protein 3-interacting protein 1
(TNIP1), a repressor of transcription factor activation or activity, was shown to
affect the cell stress response through a reduction in HSP expression. HSPs are
not only important in protecting cells from the harmful effects of various stressors,
they play key roles as molecular chaperones during basal, unstressed conditions.
These results suggest TNIP1 could regulate the cell stress response. However,
its exact role in this process and the mechanism of the TNIP1-mediated
transcriptional repression is not yet characterized. We hypothesized that TNIP1
acts on PPAR, RAR or NF-kB, the TNIP1-repressed factors, to reduce the
expression of HSPs. Using HSPA6 to model the repression on all HSPs, we
observed TNIP1 does not act through these transcription factors. We further
localized a ~150 bp region within the HSPA6 promoter and determined several
predicted transcription factor binding sites, suggesting TNIP1 modulates HSP
repression through a novel, yet uncharacterized pathway. Additionally, we
assessed the effect of TNIP1 on keratinocyte proliferation and differentiation. We
found that a chronic, but not acute, overexpression of TNIP1 blocks keratinocyte
cell growth to possibly through decreasing the HSP chaperone function.

93
Introduction
The TNFα-induced protein 3 interacting protein 1 (TNIP1) is a regulator of
various receptor-mediated signaling pathways, including those initiated by TNF
receptor TNFR (28, 31, 88) and nuclear receptors (NR) peroxisome proliferator
activated receptors (PPAR) and retinoic acid receptors (RAR) (23, 24) (Fig 1.3
TNIP1 pathway figure). This repressive effect results in downstream or direct
inhibition of transcription factor activation or activity. Typically, a resulting
outcome of TNFR signaling is the activation of NFκB, a transcription factor
involved in modulating the immune and stress responses. Through interactions
with upstream signaling proteins, TNIP1 blocks the nuclear translocation of
NFκB, therefore preventing the transcription of its target genes. In a separate
mechanism, TNIP1 directly binds with NRs PPAR or RAR, but not their
heterodimer parter retinoid X receptor (RXR), in presence of receptor agonist.
Overall, TNIP1 can be thought of as a direct or indirect repressor of transcription
factor activation or activity, possibly having an effect on cellular processes or
diseases (for a recent review on TNIP1, refer to (41)).
A biological association with inflammatory diseases has also been
determined for TNIP1 observed at the genetic, transcript, protein or expression
levels. Through genome wide association scans, TNIP1 promoter and intronic
single nucleotide polymorphisms (SNPs) were found in inflammatory diseases
including but not limited to psoriasis, systemic lupus erythematosus and
rheumatoid arthritis (34, 38, 39, 87). Specific nucleotide or amino acid mutations
were found at the mRNA and protein level (43, 51). Furthermore, increased

94
TNIP1 levels were linked to psoriasis and rheumatoid arthritis (33, 34). The
altered expression of TNIP1 in these diseases could lead to aberrant signaling of
these pathways. While TNIP1 has been associated to these pathways and
diseases, the specific role and target genes affected by TNIP1 have yet been
characterized.
To search for specific genes and possibly novel pathways affected by
TNIP1, we overexpressed recombinant TNIP1 using an adenoviral construct in
HaCaT KCs and performed a gene microarray (Figs 2.1 & 2.2). The results not
only confirmed TNIP1’s role in these pathways and biological functions, but
discovered a novel TNIP1-regulated function: regulation of the cell stress
response (Figs 2.3 & 2.4). Increased expression of TNIP1 in HaCaT
keratinocytes (KC) repressed the expression levels of heat shock protein (HSP)
mRNA and protein expression, specifically HSPA6 and HSPA1A by 20- and 3.3-
fold, respectively (Figs 2.5 & 2.6). While best characterized for their role in
preventing protein unfolding and aggregation during times of cellular stress (71,
73, 78), expression of these proteins is crucial in unstressed conditions as well.
They have chaperone functions in aiding proper folding of newly synthesized
proteins and shuttling of many molecules.
Expression of both HSPA1A and HSPA6 is essential to increasing survival
of cells exposed to increased temperatures or chemicals. Pharmacologic
repression of HSPA1A expression in keratinocytes resulted in reduced resistance
to UV treatment (93). Furthermore, HSPA1A and HSPA6 specific siRNA-
mediated knockdown suggest that expression of either HSPs are important to

95
increasing cell survival. A reduction of both HSPs led to a greater loss of
thermotolerance, resulting in reduced cell viability (79). Decreased expression of
HSPA6 did reduce the cell viability after a 42C heat stress or proteasome
inhibitor MG-132 treatment, suggesting its importance in cell survival. HSPA6
likely forms complexes with HSPA1A and DNAJB1 (HSP40) (82, 106) to confer
its protective function. Despite some HSPA6 and HSPA1A overlap in facilitating
cell survival, further work showed they have distinct protein substrates.
Compared to HSPA1A, HSPA6 has higher affinity for unfolded p53 but had no
effect in refolding the luciferase enzyme and peroxisomal proteins (77, 78).
In this chapter, we examined the potential mechanism for the TNIP1-
mediated repression of HSPs. We chose HSPA6 because this gene was reduced
20-fold by increased TNIP1 compared to the 3.3-fold reduction of HSPA1A. We
isolated and cloned the HSPA6 3 kb promoter to the pGL4.1 luciferase reporter
gene construct. Surprisingly, our results indicate that TNIP1 does not repress
HSPA6 through known TNIP1-mediated transcription factors, PPAR, RAR and
NFκB. This suggests that a novel TNIP1-repressible pathway could inhibit HSP
expression. Additionally, this work suggests chronic TNIP1 overexpression, but
not acute, prevents the growth of cultured keratinocytes, suggesting TNIP1 may
play a role in the keratinocyte proliferation and differentiation process.

96
Materials and Methods
Cell Culture
HaCaT KCs (95) were cultured in 37C with 5% CO2 humidified incubator
in a 3:1 DMEM/F12 media containing 10% FBS (Thermo Scientific HyClone,
Logan, UT), 100U/ml penicillin, and 100 mg/ml streptomycin. The cells were
plated on 6- or 24-well plates at a density of 6.8 x 10⁵ or 1.5 x 10⁵ cells per well,
respectively. Twenty-four hours after, cells were infected with an adenovirus
construct expressing TNIP1 (Ad-TNIP1) or LacZ as a control (Ad-LacZ) at an
multiplicity of infection (MOI) of 500 using Polybrene infection reagent (Millipore,
Billerica, MA) (96). Sixteen hours post-infection, the viral mixture was aspirated
and media replaced. Twenty-four hours post-infection, cells were collected for
total RNA using the RNeasy kit (Qiagen, Valencia, CA) or protein using RIPA
lysis buffer (10 mM Tris, 150 mM NaCl, 1% deoxycholic acid, 1% Triton, 0.1%
SDS), or were used for further stress assays.
Cells underwent thermal stress in a 42C water bath for 1 hour;
unstressed cells were immersed in a 37C water bath for 1 hour (control). Cells
were allowed various recovery times in a 37C humidified incubator, as indicated.
Real-Time quantitative PCR analysis
Reverse transcription was performed using aliquots from the total RNA
used for the microarray using the iScript reverse transcriptase (BioRad, Hercules,
CA). Gene expression changes were analyzed using POWER SYBR green
master mix (Life Technologies, Grand Island, NY). Real-time PCR was

97
performed using Applied Biosystems 7500 Fast Real-Time PCR system. Data
analysis was carried out on ABI 7500 software using the ΔΔCT method. The
primer sequences used and reaction conditions are listed on Table 2.1. All data
was normalized to the ribosomal proten L13a (RPL13a) (99).
Generation of luciferase constructs
The HSPA6 promoter containing the -2963 to +48 bp sequence (herein
referred to as -3 kb-luc) was PCR amplified from human genomic DNA (cat#
636401) (BD Biosciences, San Jose, CA) using forward: 5’-GAT GGG TAC CTC
ATC TTG AAT TCC CAC AAC ACA TGG-3’ and reverse: 5’-GGC TGA AGC
TTA GTG AGG CTC TCC CTG CGG TTT CTC T-3’ with added KpnI and HindIII
sites (underlined), respectively for insertion into the promoterless vector pGL4.10
(Promega, Madison, WI) using the restriction sites indicated. 5’-promoter
truncations (-1230, -647 and -70 -luc) were performed by using the upstream
KpnI site and native restriction enzyme sites BglII, EcoRI and NruI, respectively.
Digested sites were blunted and ligated. Internal promoter deletions were
performed using the Quikchange Lightning site-directed mutagenesis kit
(Agilent). Constructs ΔE, ΔF, ΔG, and ΔH were generated using the -647 luc.
Fragment G site specific mutants were generated using the Quikchange
Lightning site-directed mutagenesis kit. Sites were determined using NHR Scan
(109), Nubiscan (110) and MatInspector (111) web-based software. All HSPA6
3kb isolate and truncation constructs were confirmed by sequencing (University
of Connecticut Biotech Center).

98
Plasmid transfections
HaCaT KCs were plated to 70% confluency 24 hours prior to transfections
using 24-well plates. Eight hours prior to transfection, media was replaced with
0.5 mL serum-containing 3:1 DMEM/F12 media. The appropriate HSPA6
promoter pGL4.10 plasmid (200 ng) and pCMV- Galactosidase (100 ng) was
transfected using Fugene6 (Promega) using 100 μL serum-free media. Twenty-
four hours later, cells were stressed for 1 hour in a 42C water bath (control cells
in a 37C bath) and returned to a 37C incubator for 4 hours. Cells were then
collected and assayed for the luciferase activity (Promega), protein concentration
(Pierce), and -galactosidase activity (96).
Cell Survival Assay
Cell viability was determined using the MTS assay (Promega). HaCaT
KCs were cultured in 24-well plates and adeno-infected as described previously.
Twenty-four hours after infection, cells were stressed in a 42C or 37C water
bath (control) for 1 hour.
HaCaT colony growth transient assay
HaCaT KCs were seeded in triplicate into 6-well plates (4,500 cells/well)
and transfected the following day with Effectene (Qiagen; Valencia, CA). Each
well received 300 ng pCMV-β-gal and either 216 ng of empty pcDNA3.1+
(Invitrogen; Carlsbad, CA) and 840 ng pBluescript KS+ or 3000 ng
pcDNA3.1+TNIP1 sense insert for at least a 20:1 molar difference of pcDNA3.1+
99
construct to β-gal marker plasmid to provide that any β-gal positive colony
subsequently counted had derived from a pcDNA-transfected cell. Differences in
pcDNA3.1+ expression vector amounts standardized copy number of expression
constructs. Cells were fed 18hrs post-transfection and 3 days later. Seven days
post-transfection cells were fixed in 2% paraformaldehyde and histochemically
stained for β-gal. Counting protocols for b-gal positive cells, total cell number,
and colony number were as described [Zhao JBC 276, p27907] for another NR-
interacting protein.
Constitutive expression of TNIP1 in HaCaT cells
HaCaT KCs were seeded and transfected with either empty pcDNA3.1+
(Invitrogen; Carlsbad, CA) and 840 ng pBluescript KS+ or 3000 ng
pcDNA3.1+TNIP1 sense or antisense insert containing a neomycin resistant
cassette at equal copy numbers. Forty-eight hours after transfection, all cultures
were put under G418 neomycin selection (600 ug/mL) and was replaced during
every cell feeding days. Cell growth was observed daily.
Statistical analysis
All data were analyzed using Prism Software version 5 (GraphPad) (La Jolla,
CA). Student’s t-test was used to compare between paired results. ANOVA with
Newman Keuls post hoc was used to compare between grouped results, when
necessary. Statistical significance was defined as p 0.05.

100
Results
HSPA6 promoter contains known TNIP1-responsive transcription factor binding
sites
Since TNIP1 expression results in the reduced activation or activity of
various transcription factors, we assessed whether the mechanism of TNIP1’s
repression could be through these factors. As a model for the TNIP1-repression
of these HSP familes, we further characterized one HSP, HSPA6. We isolated
and cloned the promoter of HSPA6 3 kb promoter region (-2952 to +48 bp
relative to the transcriptional start site) to a luciferase reporter gene construct. In
silico promoter analysis found predicted binding sites for TNIP1-regulated
transcription factors (Fig 4.1). Between the -647 to +48 bp promoter, no putative
sites were located. Lengthening the promoter to -1230 bp, two predicted NFκB
sites were found at -665, and -939 bp. Extending further to -2952 bp, two NFκB
site (-2830 and -2985bp), two retinoic acid response elements (RARE) (-1625
and -2419 bp) and five peroxisome proliferator response elements (PPRE)
(-1580, -1643, -1986, -2604 and -2768 bp).
TNIP1 does not repress HSPA6 through previously characterized pathways
To localize the TNIP1-responsive region, we generated several 5’-promoter
truncations using naturally occurring restriction enzyme sites. Transfection
results show that the “minimal” -70 bp promoter was unaffected by TNIP1.
Extending the promoter to -647 bp resulted in a ~60% reduction in promoter
activation. Further lengthening the promoter to -1230 and beyond had Figure 4.1

101
Figure 4.1. In silico analysis of the HSPA6 3 kb promoter searching for
TNIP1-repressed transcription factors. The promoter isolate was from -2952 to
+48 bp. KpnI and HindIII were generated using the primers to amplify the
promoter. BglII, EcoRI and NruI are naturally occurring restriction enzyme sites
and were use to generate promoter truncation constructs. The triangles, arrows
and diamonds denote predicted PPRE, RARE and NFκB binding sites,
respectively.

102
Figure 4.2
Figure 4.2. Analysis of the HSPA6 promoter truncation constructs. Diagram
of the HSPA6 5’ promoter truncation constructs. The triangles, arrows and
diamonds denote predicted PPRE, RARE and NFκB binding sites, respectively.
Yellow region indicates the start of the luciferase reporter gene. Graph shown as
percent response to increased TNIP1 compared to LacZ control. Letters denote
statistical significance between unstressed cells p<0.05. using ANOVA with
Newman Keul’s post-hoc. Bars are mean + SEM from n=3, experimental
triplicates.

103
no change in TNIP1 repression compared to the -647 bp promoter, suggesting
the -647 to -70 bp fragment of the HSPA6 promoter contains a TNIP1-repressible
element (Fig 4.2).
The TNIP1-repressive region within the HSPA6 promoter is between -216 to -70
bp
To narrow down the fragment repressed by TNIP1 within -647 to -70 bp, a
series of internal promoter deletions was generated deleting ~150 bp regions
within the -647-luc construct. Four internal deletion constructs were generated:
ΔA- (-647 to -478 bp), ΔB- (-478 to -346 bp), ΔC- (-346 to -216 bp) and ΔD-luc (-
216 to -70 bp). Only deletion of fragment D (-216 to -70 bp) resulted in significant
increases in promoter activation (~330%) (Fig 4.3), suggesting TNIP1 sensitive
regions are within this fragment. Deletion of fragments A, B and C had no
significant changes in HSPA6 promoter activation. In silico promoter analysis of
region D (Table 4.2, respectively) showed 6 predicted transcription factor binding
sites, respectively. More importantly, this region contain no known TNIP1-
repressible transcription factors, indicating that TNIP1 may repress HSPs
through a novel, possibly not yet characterized TNIP1-repressible factor.
HSPA6 and HSPA1A expression is repressed by TNIP1 in heat stressed
conditions
Since we found that TNIP1 represses HSPA6 in unstressed conditions, we
tested whether TNIP1 can repress the levels of HSPA6 under heat-stressed
conditions. We extended our analysis to determine whether HSPA1A is also

104
affected by TNIP1 in stressed conditions. In the control, Ad-LacZ infected cells,
the stress-induction pattern was similar for both HSPs, however, HSPA6 had a
greater fold induction. As expected, TNIP1 overexpression reduced basal (t=0)
expression of both HSPs. The repression under stressed conditions was different
for HSPA6 and HSPA1A. HSPA6 expression was decreased immediately after
cell stress and up to 8 hours post heat shock (Fig 4.4, top panel). Interestingly, at
each timepoint tested, the expression of HSPA6 was ~10-fold less in TNIP1
overexpressed cells compared to the control infected cells; however, the pattern
of stress induction and decrease to basal levels was similar, regardless of TNIP1
overexpression. HSPA1A did not show TNIP1-responsiveness after heat stress
(Fig 4.4, bottom panel). The differential regulation of these two HSPs could
suggest a different mechanism for TNIP1 repression. Although TNIP1 represses
HSPs in basal, unstressed conditions, its control over these HSPs varies under
stressed conditions.
TNIP1 does not affect cell survival following a short term overexpression
To assess the consequence of reduced HSPA6 in stressed conditions in
response to increased TNIP1, we assessed whether the cell survival of HaCaT
KCs are compromised after thermal stress. In a similar timeline, TNIP1 or control
LacZ was increased 24 hours prior to thermal stress, modeling a “short-term”
overexpression. Adeno-infected cells were heat stressed for 1 hour at 42C, then
given a 23 hour recovery period at 37C; unstressed cells were incubated for 1
hour at 42C then given the same recovery conditions. Using the MTS assay to

105
determine the cell viability, we observed that under these conditions increased
TNIP1 expression had no effect on both unstressed and heat-stressed KCs (Fig
4.5).
Long term increased TNIP1 expression hinders cell growth
To determine the effects of altered TNIP1 levels past 24 hours, we
examined the effect of TNIP1 7-days post overexpression. Using a method
different than the adenovirus, we transiently co-transfected single cell HaCaT
keratinocytes with a limiting amount of a β-gal construct as indicator of
transfection and either an empty vector or one containing the TNIP1 cDNA insert.
Keratinocytes transfected with TNIP1 yielded more small colonies and fewer
large colonies compared to those receiving the control vector (Fig 4.6). This
overall growth reduction is reflected in a significant decrease of the median cells
per colony for TNIP1 transfected cells (TNIP1, 15/colony; empty vector,
21/colony).
To address consequences stemming from chronic altered TNIP1 levels,
we attempted to generate a HaCaT keratinocyte line stably over-expressing
TNIP1. Control neor clones were successfully generated from transfection with
the empty and TNIP1 antisense vector 14-days later. However, HaCaT
keratinocytes transfected with the TNIP1 cDNA insert did not yield any
lines. These “long-term” assays demonstrate a negative TNIP1 effect on colony
expansion and suggest why the long-term growth required for cell line generation
may not have been possible from TNIP1 over-expressing cells.

106
Figure 4.3
Figure 4.3. Analysis of the HSPA6 promoter deletion constructs. Diagram of
the HSPA6 internal promoter deletions within -647-luc construct. Deletions are
shown as the dotted line. Graph shown as percent response to increased TNIP1
compared to LacZ control. Letters denote statistical significance between
unstressed cells p<0.05. using ANOVA with Newman Keul’s post-hoc. Bars are
mean + SEM from n=3, experimental triplicates.

107
Table 4.1. List of predicted transcription factor binding sites within the -216 to -70
bp region of the HSPA6 promoter.
TF Binding Site Location Score
p53 tumor suppressor -200 0.933
Heat shock factors -171 0.97
Estrogen response elements -160 0.924
RNA polymerase II transcription factor II B -154 1
ZF5 POZ domain zinc finger -152 0.92
E-box binding factors -144 0.935
AP1, Activating protein 1 -135 1
MAF and AP1 related factors -134 0.961
GC-Box factors SP1/GC -124 0.924
EGR/nerve growth factor induced protein C & related factors -123 0.93
Pleomorphic adenoma gene -108 0.935
GC-Box factors SP1/GC -101 0.931
Heat shock factors -89 0.905
Mouse Krueppel like factor -71 0.986

108
Figure 4.4
Figure 4.4. Effect of TNIP1 overexpression on HSPs in heat stressed HaCaT
KCs. Quantitative PCR of HSPA1A (top panel) and HSPA6 (bottom panel)
before (t = 0 hour) or after (t = 1, 2, 3, 4, 6 and 8 hours) a 1 hour heat stress at
42°C. Statistical significance was determined using Student’s t-test, LacZ vs.
TNIP1: **=p<0.01; *=p<0.05; †=p<0.1; ‡=p<0.15. Bars are mean + SEM from
experimental triplicates.

109
Figure 4.5
Figure 4.5. Effect of “short term” increased TNIP1 levels on HaCaT KCs
viability and growth. Cell viability analysis of HaCaTs overexpressing LacZ
(control) or TNIP1 using an adenoviral vector. Cell viability was assessed using
the MTS assay after a 1 hour heat shock at 42°C, then given a 23 hour recovery
period at 37°C.

110
Figure 4.6
Figure 4.6. Effect of “long term” increased TNIP1 levels on HaCaT KCs
viability and growth. (Left panel) Long term effect of increased sense TNIP1, or
control empty vector or antisense TNIP1. Cells per colony were determined 7
days after TNIP1 overexpression. The box-plot bottom and top edges border the
25th to 75th percentile, respectively, of colony sizes for each construct; the
horizontal line across box is at the 50th percentile, the colony median (not the
mean). Colony sizes for Naf transfection are significantly depressed (*, p<0.05,
Student’s t-test) compared to empty vector controls. (Right panel) Size
comparison of early HaCaT keratinocyte colonies developed following single-cell
transfection with a β-gal marker and empty expression vector (open bars) or
expression vector with Naf sense cDNA (solid bars).
111
Discussion
As observed from results presented in Chapter 2, TNIP1 overexpression
in HaCaT KCs resulted in reduced expression of several HSP family members,
including HSPA1A and HSPA6. While TNIP1’s repressive roles in the TNFR and
NR pathways have been elucidated, these pathways have not been known to
result in the transcriptional regulation of HSPs. Using HSPA6 as a model for
other TNIP1-regulated HSP repression, several putative NFκB binding sites,
PPREs and RAREs were located between the -2952 to -647 bp fragment of the
HSPA6 promoter. We determined the TNIP1-sensitive region within the promoter
between -647 to -478 bp and -216 to -70 bp, suggesting the TNFR and NR
pathways do not play a role in regulating these HSPs. This region lacked any
known TNIP1-repressed transcription factors even after extending our search to
include Elk2 (89) and C/EBP (68), the known TNIP1-inhibited downstream
targets of EGFR and TLR, respectively. These results suggest that the TNIP1-
mediated repression of HSPA6, and likely other HSPs, could be through a novel,
not yet determined TNIP1-repressible transcription factor.
To test the TNIP1-repression of HSPA6 under heat stressed conditions,
we observed TNIP1 could reduce HSPA6 heat inducibility in addition to its basal
expression. These results could suggest the mechanism of TNIP1’s repression,
while not yet fully characterized, could be independent of the thermal stress
induction. Interestingly, HSPA1A expression was only decreased in unstressed
conditions. The differential repression of HSPA6 and HSPA1A may suggest that
TNIP1 regulates these HSPs through different mechanisms under stressed and

112
unstressed conditions. However, a possible mechanism could be that the TNIP1-
repressible transcription factor binds a site next to a heat shock element. When
HSF is activated, it could displace the TNIP1-repressible transcription factor
binding the promoter, facilitating the HSF binding the HSE. A similar effect is
observed in the Gai2 promoter, where SP1 binding is disrupted by activation of
C/EBP binding an adjacent site (127). Determining any predicted binding site(s)
near a heat shock element within HSPA1A and matching it with the predicted
site(s) within the -216 to -70 bp promoter region of HSPA6 could be an avenue to
determine the specific mechanism of the TNIP1-mediated HSP repression.
Since HSPA6 is affected under both unstressed and stressed conditions,
we tested whether repression of this HSP can affect the cell survival of HaCaT
cells after a 1 hour, 42C heat shock. The short term cell viability was not
affected by increased TNIP1 in basal or stressed conditions, suggesting that
under these conditions, TNIP1 has no overall effect on KC’s stress response.
Under stressed conditions, however, TNIP1 only reduced HSPA6 expression, not
HSPA1A, directly after thermal stress and up to an 8 hour time period. Since
these proteins have similar functions in cell protection, it is possible that the
redundancy in function between these two HSPs is sufficient to protect HaCaT
KCs under heat stressed conditions 24 hours post TNIP1 overexpression. The
effect of increased TNIP1 may affect the HSPs chaperone function, since
multiple HSPs are decreased. We assessed whether a long term TNIP1
overexpression could affect the KCs growth under basal conditions. Transient
overexpression of TNIP1 resulted in a reduction in cell number per colony after 7-

113
days. Stably overexpressing TNIP1 resulted in no colony growth after 2 weeks.
The decrease in HSP expression levels could have led to the increase in KC cell
death. Prior work where the HSPA1A gene was deleted in a mouse model shows
a change in tissue physiology and function in unstressed cells (128), indicating its
importance not only in stress protection, but as a molecular chaperone. The
decrease of various HSPs by TNIP1 could affect the normal structure and
proliferation of keratinocytes, possibly resulting in the observed decrease in cell
growth. Taken together, these results suggest that the chronic overexposure to
TNIP1 negatively affects cell growth under basal, unstressed conditions. The
decreased levels of HSPs and the resulting reduced chaperone ability may
impair these cells to properly synthesize new proteins required for cell growth
and proliferation.
In this chapter, we found that the TNIP1-mediated repression of HSPA6 is
not through known TNIP1-repressed transcription factors, but likely a novel, not
yet characterized mechanism. Additionally, the effect of TNIP1 on HSPs varies in
heat stressed conditions, where only HSPA6, not HSPA1A, expression was
reduced. The overall cell consequences of increased TNIP1 were observed in a
chronic overexpression of TNIP1, resulting in decreased KC growth and
proliferation.

114
Chapter 5
Summary, conclusions and future directions
Summary and conclusions
Initial work on the TNFα-induced protein 3 (TNFAIP3)-interacting protein 1
(TNIP1) started in our laboratory while searching for novel NR coregulators in the
skin. Previous efforts characterized TNIP1’s role as an agonist-bound NR
corepressor, specifically of PPAR and RARs (24, 25), and determined TNIP1’s
transcriptional regulation and start sites (see Appendix 1 for TSS results) (44,
129). Researchers from other laboratories found TNIP1 to reduce the activation
and nuclear translocation of several transcription factors, including NF-kB (see
(41) for a current review). Overall, the resulting effect of TNIP1 can be
generalized as the direct or indirect repression of transcription factor activity or
activation.
These factors and their associated pathways, in part, regulate several
biological processes, including inflammatory diseases and KC growth. Indeed,
TNIP1 has been implicated in several diseases, including psoriasis, a disease
characterized by KC hyperproliferation and incomplete differentiation (34, 52).
Altered TNIP1 sequence and increased expression levels were observed in this
disease, suggesting it may play a role in regulating KC function. Although
TNIP1’s transcriptional regulation, repressive role in several pathways, and
association in various biological processes have been established, the specific
genes regulated by TNIP1 and the overall cellular outcomes of increased TNIP1
expression have not yet been determined.

115
The work in this thesis aimed to determine the genes and pathways
regulated by TNIP1 as well as characterize the consequences of transient
increased expression of TNIP1 in KCs. The studies described validated TNIP1’s
role in regulating the NR pathways, inflammatory diseases, and cell death.
Several novel TNIP1-regulated pathways and genes were also found, including
the cell stress response and repression of several HSPs. Proteins within this
family, which have been implicated in psoriasis and cell death, were reduced as
much as 20-fold in response to increased TNIP1. The reduced expression of
these HSPs in the HaCaT KCs, which are an immortalized, but non-tumorigenic
KC cell line, was validated by using normal human epidermal KCs. Interestingly,
in addition to reducing HSP expression in differentiated KCs, TNIP1
overexpression in the normal human epidermal KCs resulted in blocking the
induction of involucrin, a KC differentiation marker, indicating that TNIP1 could
modulate KC differentiation.
To examine TNIP1’s effect on cultured KCs, we assessed the overall the
growth of KCs following increased TNIP1 levels. TNIP1 had no effect on cell
growth in normal or heat stressed conditions 24 hours after transient
overexpression; long term (7 day) transient overexpression of TNIP1 led to
decreased cell colony size and number. Attempting to generate a chronic, stably
overexpressing TNIP1 KC line resulted in complete loss of cell growth,
suggesting that TNIP1 may play key roles in KC biology, possibly through
repression of HSP chaperone expression.

116
HSPA6 was used as a model to determine the possible mechanism of
how TNIP1 reduces HSP expression. HSPA6 was the gene reduced the most
after TNIP1 overexpression. We hypothesized that the TNIP1-mediated
repression was through the known, well characterized TNIP1-repressed
transcription factors PPAR, RAR or NF-kB. While several predicted binding sites
were found within the -3 kb promoter, the specific region responsive to TNIP1 (-
216 to -70 bp) lacked these predicted binding sites. In addition to these
transcription factors, two others have been described to be repressed by TNIP1
through upstream regulatory proteins, Elk-2 and C/EBP. Unfortunately, this
promoter region also lacks predicted binding sites for these factors. A possible
pathway involved in the HSP repression could be the EGFR-ERK2 pathway. The
repression of Elk-2 by TNIP1 is mediated by blocking EGFR-induced ERK2
nuclear translocation. In silico promoter analysis of the -216 to -70 bp region
suggests some of the top predicted sites could be ERK2 activated, such as
EGR1, KLF and E-box binding transcription factors. However, these sites and
their associated transcription factors are not known regulators HSPs expression.
An in depth analysis to examine if these factors regulate HSPA6 could be
assessed for future experiments.
A second possibility is that TNIP1 may reduce the expression of the
transcription factor(s) regulating the transcription of HSPA6. Searching the list of
predicted transcription factor sites within this fragment (Table 4.2), four genes
encoding transcription factors whose expression was reduced by TNIP1
overexpression were found. AP1 heterodimer protein subunits (fosB, c-fos and c-

117
jun) and early growth response 1 (EGR1) mRNA expression was decreased. It is
unlikely that AP1 is involved in the TNIP1 repression because a separate region
of the promoter, which is also contains an AP1 site, is not responsive to TNIP1. It
is possible that EGR1 protein expression is reduced after TNIP1 overexpression,
causing a reduction in HSPA6 transcription. This presupposes that EGR1
transcriptionally regulates the expression of HSPs, which has not yet been
characterized.
To determine if an ERK2-mediated transcription factor (EGR1, KLF or E-
box binding transcription factors) repressed by TNIP1 could be contributing to the
reduced HSP expression, an extensive examination would need to be done to (1)
establish if ERK2 activation results in increased endogenous HSP expression,
(2) determine whether ERK2 stimulation can activate the -216 to -70 bp promoter
region of HSPA6, (3) test if these factors bind the promoter, and (4) characterize
if TNIP1 can repress this factor. Since the aims of this research were to
determine the pathways affected by and cellular outcomes due to increased
TNIP1, the work presented in this thesis met this goal.
Along with Gomez-Sucerquia (81), a novel finding from this research was
the observation that HSPA6 protein was readily found in unstressed all cell types
examined (Ramirez et al submitted), whereas other laboratories noted little to no
basal expression in varying cell types including HaCaT KCs (74, 82, 83, 112,
115, 130, 131). The antibody (ADI-SPA-754) used was previously characterized
by (82) to be highly specific to HSPA6, suggesting that the band observed was
HSPA6. A possible explanation for this discrepancy could be the DMEM/F12

118
media used to grow the cells. The media used to culture all the cells contains a
3:1 ratio of DMEM to Ham’s F12 (HaCaT, SCC13, MCF7, HeLa, HepG2 and
dermal fibroblasts) or were supplemented with non-essential amino acids (HT29
and Caco2). Modifying the ingredients of the cell culture media has led to
increased expression of HSPs (117, 118). Additionally, (81) supplemented the
culture media with non-essential amino acids. HSPA6 protein expression was
observed in untreated cells. The basal expression of HSPA6 could be sensitive
not only to changes in cell density (83), but also cell culture media components.
The additional supplement to our HaCaT media could explain the difference in
basal HSPA6 expression level compared to (74).

119
Future directions
The studies described in this thesis open up a number of possibilities in
characterizing the role TNIP1 plays not only in regulating HSPs, but in normal
and diseased KC biology. With respect to the TNIP1-mediated repression of
HSPs, this work suggests TNIP1 could alter the chaperone function, but not the
immediate stress-protective role, of HSPs. Interestingly, the reduction in KC cell
growth was only observed in long-term TNIP1 overexpression. It would be
interesting to examine the expression levels of these HSPs after chronic TNIP1
exposure to assess whether the reduced levels of HSPs could contribute to the
reduced cell viability.
Further work to elucidate the mechanism of the HSP repression by TNIP1
is necessary. To date, the work described examined whether transcription factors
PPAR, RAR or NF-kB were involved in the repression of HSPs. Our work
indicates that these factors were not responsible for the reduced expression of
HSPs. This may suggest a new factor, and possibly pathway, is repressed by
TNIP1 to block the transcription of these genes. While a TNIP1-responsive
fragment within the HSPA6 promoter was localized, the specific element within it
was not determined. Site-directed mutagenesis of the top-scoring sites could be
done to elucidate the specific transcription factor involved in the repression of
HSPA6 and possibly other HSPs. In addition to the TNIP1-mediated repression
of HSPA6, putative transcription factor binding sites and a ~150 bp region within
the central region of the promoter was responsive to a yet uncharacterized
repressive factor(s) in normal, basal conditions. Further investigation is needed

120
to determine the factor(s) contributing to the reduced expression of HSPA6 in
unstressed conditions.
While the association between TNIP1 and KCs proliferation and
differentiation was characterized in this research, the specific role it could play in
inflammatory diseases, such as psoriasis, has not yet been determined. In the
TNIP1 microarray, expression of a number of inflammatory cytokines was
reduced; most notably IL-6 was decreased 10-fold. This result was only
determined at one timepoint, 24 hours post TNIP1 overexpression. To determine
TNIP1’s role in regulating these cytokines, a time-course study examining the
varied expression level of these, and other proteins, is necessary. Studying the
changes of these genes’ expression could determine a mechanism for how
TNIP1 affects these diseases.
A shortcoming to the research presented here was most the work
presented was performed in cultured normal or immortalized monolayer of KCs.
While these cell lines retain the differentiation properties, they are still not
stratified KCs such as found in skin. A possible avenue for research to mimic the
stratification of KCs into layers is to generate a KC organotypic model (132).
These organotypic cultures recapitulate the biochemical markers of differentiating
KCs resulting in cornification of the cultured cells. In these cultures, TNIP1
expression can be increased and the thickness of the organotypic layer
quantified. In this approach, a direct effect of KC proliferation and differentiation
can be examined in a manner where the level of TNIP1 overexpression could be
controlled. More importantly, the effect of increasing TNIP1 could be assessed in

121
a “dose-dependent” fashion. Conversely, to assess the impact of TNIP1 in whole
animal models, an adenoviral gene transfer can be performed in normal mice
(65, 66). Although this method was previously performed by the Beyaert
laboratory to exogenously express TNIP1, the effect on KC homeostasis was not
assessed.

122
Appendix 1
TNIP1 protein expression up to 96 hours post adeno-infection
This experiment was performed by Carmen Zhang (experiment # 158)
before the microarray was performed. TNIP1 -overexpressed HaCaT cells were
collected at 24-, 48-, 72-, or 96-hours post infection. TNIP1 expression was
increased up to the 96-hour timepoint.

123
APPENDIX 2
Microarray data from TNIP1 overexpression in HaCaT KCs
SYMBOL ratio t/w ILMN_GENE DEFINITION
HSPA6 0.05 HSPA6 Homo sapiens heat shock 70kDa protein 6 (HSP70B') (HSPA6), mRNA.
IL6 0.1 IL6 Homo sapiens interleukin 6 (interferon, beta 2) (IL6), mRNA.
FOSB 0.12 FOSB Homo sapiens FBJ murine osteosarcoma viral oncogene homolog B (FOSB), mRNA.
ZC3HAV1 0.16 ZC3HAV1 Homo sapiens zinc finger CCCH-type, antiviral 1 (ZC3HAV1), transcript variant 2, mRNA.
EGR1 0.18 EGR1 Homo sapiens early growth response 1 (EGR1), mRNA.
DNAJB1 0.2 DNAJB1 Homo sapiens DnaJ (Hsp40) homolog, subfamily B, member 1 (DNAJB1), mRNA.
LOC652878 0.2 LOC652878
PREDICTED: Homo sapiens similar to heat shock 70kDa protein 6 (HSP70B) (LOC652878), mRNA.
ARID5B 0.21 ARID5B Homo sapiens AT rich interactive domain 5B (MRF1-like) (ARID5B), mRNA.
HERC5 0.23 HERC5 Homo sapiens hect domain and RLD 5 (HERC5), mRNA.
MX1 0.24 MX1
Homo sapiens myxovirus (influenza virus) resistance 1, interferon-inducible protein p78 (mouse) (MX1), mRNA.
ISG20 0.25 ISG20 Homo sapiens interferon stimulated exonuclease gene 20kDa (ISG20), mRNA.
ACTR10 0.26 ACTR10 Homo sapiens actin-related protein 10 homolog (S. cerevisiae) (ACTR10), mRNA.
MYH3 0.26 MYH3 Homo sapiens myosin, heavy polypeptide 3, skeletal muscle, embryonic (MYH3), mRNA.
IFI27 0.27 IFI27 Homo sapiens interferon, alpha-inducible protein 27 (IFI27), mRNA.
AXUD1 0.28 AXUD1 Homo sapiens AXIN1 up-regulated 1 (AXUD1), mRNA.
DUSP1 0.28 DUSP1 Homo sapiens dual specificity phosphatase 1 (DUSP1), mRNA.
IFIT2 0.28 IFIT2 Homo sapiens interferon-induced protein with tetratricopeptide repeats 2 (IFIT2), mRNA.
SGK 0.28 SGK Homo sapiens serum/glucocorticoid regulated kinase (SGK), mRNA.

124
0.28 HS.579631
AGENCOURT_10229596 NIH_MGC_141 Homo sapiens cDNA clone IMAGE:6563923 5, mRNA sequence
CYR61 0.29 CYR61 Homo sapiens cysteine-rich, angiogenic inducer, 61 (CYR61), mRNA.
CLCF1 0.3 CLCF1 Homo sapiens cardiotrophin-like cytokine factor 1 (CLCF1), mRNA.
IFIT3 0.3 IFIT3 Homo sapiens interferon-induced protein with tetratricopeptide repeats 3 (IFIT3), mRNA.
FLJ31875 0.31 FLJ31875 Homo sapiens hypothetical protein FLJ31875 (FLJ31875), mRNA.
HSPA1B 0.31 HSPA1B Homo sapiens heat shock 70kDa protein 1B (HSPA1B), mRNA.
JUN 0.31 JUN Homo sapiens jun oncogene (JUN), mRNA.
OASL 0.31 OASL Homo sapiens 2'-5'-oligoadenylate synthetase-like (OASL), transcript variant 1, mRNA.
PPP1R15A 0.31 PPP1R15A
Homo sapiens protein phosphatase 1, regulatory (inhibitor) subunit 15A (PPP1R15A), mRNA.
ARID3B 0.32 ARID3B Homo sapiens AT rich interactive domain 3B (BRIGHT- like) (ARID3B), mRNA.
CPEB3 0.33 CPEB3 Homo sapiens cytoplasmic polyadenylation element binding protein 3 (CPEB3), mRNA.
FOS 0.33 FOS Homo sapiens v-fos FBJ murine osteosarcoma viral oncogene homolog (FOS), mRNA.
HSPA1A 0.33 HSPA1A Homo sapiens heat shock 70kDa protein 1A (HSPA1A), mRNA.
MX2 0.33 MX2 Homo sapiens myxovirus (influenza virus) resistance 2 (mouse) (MX2), mRNA.
TRIB1 0.33 TRIB1 Homo sapiens tribbles homolog 1 (Drosophila) (TRIB1), mRNA.
ZFP36 0.33 ZFP36 Homo sapiens zinc finger protein 36, C3H type, homolog (mouse) (ZFP36), mRNA.
USP36 0.34 USP36 Homo sapiens ubiquitin specific peptidase 36 (USP36), mRNA.
DUSP5 0.35 DUSP5 Homo sapiens dual specificity phosphatase 5 (DUSP5), mRNA.
ERRFI1 0.35 ERRFI1 Homo sapiens ERBB receptor feedback inhibitor 1 (ERRFI1), mRNA.
IFIT1 0.35 IFIT1
Homo sapiens interferon-induced protein with tetratricopeptide repeats 1 (IFIT1), transcript variant 2, mRNA.
EDN1 0.36 EDN1 Homo sapiens endothelin 1 (EDN1), mRNA.

125
G1P3 0.36 G1P3
Homo sapiens interferon, alpha-inducible protein (clone IFI-6-16) (G1P3), transcript variant 1, mRNA.
RARRES3 0.36 RARRES3 Homo sapiens retinoic acid receptor responder (tazarotene induced) 3 (RARRES3), mRNA.
RGC32 0.36 RGC32 Homo sapiens response gene to complement 32 (RGC32), mRNA.
BCL3 0.37 BCL3 Homo sapiens B-cell CLL/lymphoma 3 (BCL3), mRNA.
HERC6 0.37 HERC6 Homo sapiens hect domain and RLD 6 (HERC6), transcript variant 4, mRNA.
IFIH1 0.37 IFIH1 Homo sapiens interferon induced with helicase C domain 1 (IFIH1), mRNA.
PIM1 0.37 PIM1 Homo sapiens pim-1 oncogene (PIM1), mRNA.
WARS 0.37 WARS Homo sapiens tryptophanyl-tRNA synthetase (WARS), transcript variant 1, mRNA.
ABTB2 0.38 ABTB2 Homo sapiens ankyrin repeat and BTB (POZ) domain containing 2 (ABTB2), mRNA.
PTGS2 0.38 PTGS2
Homo sapiens prostaglandin-endoperoxide synthase 2 (prostaglandin G/H synthase and cyclooxygenase) (PTGS2), mRNA.
0.38 HS.263832
BX096516 Soares_NhHMPu_S1 Homo sapiens cDNA clone IMAGp998J135216, mRNA sequence
BHLHB2 0.39 BHLHB2 Homo sapiens basic helix-loop-helix domain containing, class B, 2 (BHLHB2), mRNA.
ISG15 0.39 ISG15 Homo sapiens ISG15 ubiquitin-like modifier (ISG15), mRNA.
OAS2 0.39 OAS2
Homo sapiens 2'-5'-oligoadenylate synthetase 2, 69/71kDa (OAS2), transcript variant 3, mRNA.
RN7SK 0.39 RN7SK Homo sapiens RNA, 7SK, nuclear (RN7SK) on chromosome 6.
ATF3 0.4 ATF3 Homo sapiens activating transcription factor 3 (ATF3), transcript variant 4, mRNA.
CTGF 0.4 CTGF Homo sapiens connective tissue growth factor (CTGF), mRNA.
ELF3 0.4 ELF3
Homo sapiens E74-like factor 3 (ets domain transcription factor, epithelial-specific ) (ELF3), mRNA.
HMFN0839 0.4 HMFN0839 Homo sapiens lung cancer metastasis-associated protein (MAG1), mRNA.
MIDN 0.4 MIDN Homo sapiens midnolin (MIDN), mRNA.

126
PRICKLE1 0.4 PRICKLE1 Homo sapiens prickle homolog 1 (Drosophila) (PRICKLE1), mRNA.
STX3A 0.4 STX3A Homo sapiens syntaxin 3 (STX3), mRNA.
TMEM2 0.4 TMEM2 Homo sapiens transmembrane protein 2 (TMEM2), mRNA.
CITED2 0.41 CITED2
Homo sapiens Cbp/p300-interacting transactivator, with Glu/Asp-rich carboxy-terminal domain, 2 (CITED2), mRNA.
LATS2 0.41 LATS2 Homo sapiens LATS, large tumor suppressor, homolog 2 (Drosophila) (LATS2), mRNA.
UGCG 0.41 UGCG Homo sapiens UDP-glucose ceramide glucosyltransferase (UGCG), mRNA.
0.41 HS.543887
AGENCOURT_14535501 NIH_MGC_191 Homo sapiens cDNA clone IMAGE:30415823 5, mRNA sequence
BAG3 0.42 BAG3 Homo sapiens BCL2-associated athanogene 3 (BAG3), mRNA.
CCL5 0.42 CCL5 Homo sapiens chemokine (C-C motif) ligand 5 (CCL5), mRNA.
SP110 0.42 SP110 Homo sapiens SP110 nuclear body protein (SP110), transcript variant c, mRNA.
XAF1 0.42 XAF1 Homo sapiens XIAP associated factor-1 (XAF1), transcript variant 2, mRNA.
CD55 0.43 CD55
Homo sapiens CD55 molecule, decay accelerating factor for complement (Cromer blood group) (CD55), mRNA.
DCUN1D3 0.43 DCUN1D3
Homo sapiens DCN1, defective in cullin neddylation 1, domain containing 3 (S. cerevisiae) (DCUN1D3), mRNA.
EPSTI1 0.43 EPSTI1 Homo sapiens epithelial stromal interaction 1 (breast) (EPSTI1), transcript variant 2, mRNA.
FOXO3A 0.43 FOXO3A Homo sapiens forkhead box O3A (FOXO3A), transcript variant 2, mRNA.
GLTSCR1 0.43 GLTSCR1 Homo sapiens glioma tumor suppressor candidate region gene 1 (GLTSCR1), mRNA.
LGP2 0.43 LGP2 Homo sapiens likely ortholog of mouse D11lgp2 (LGP2), mRNA.
LOC387841 0.43 LOC387841
PREDICTED: Homo sapiens similar to ribosomal protein L13a, transcript variant 2 (LOC387841), mRNA.
CCRN4L 0.44 CCRN4L
Homo sapiens CCR4 carbon catabolite repression 4-like (S. cerevisiae) (CCRN4L), mRNA.

127
FHL2 0.44 FHL2 Homo sapiens four and a half LIM domains 2 (FHL2), transcript variant 1, mRNA.
IFI6 0.44 IFI6 Homo sapiens interferon, alpha-inducible protein 6 (IFI6), transcript variant 2, mRNA.
PARP14 0.44 PARP14 Homo sapiens poly (ADP-ribose) polymerase family, member 14 (PARP14), mRNA.
BCL6 0.45 BCL6
Homo sapiens B-cell CLL/lymphoma 6 (zinc finger protein 51) (BCL6), transcript variant 2, mRNA.
BTG1 0.45 BTG1 Homo sapiens B-cell translocation gene 1, anti-proliferative (BTG1), mRNA.
DKK4 0.45 DKK4 Homo sapiens dickkopf homolog 4 (Xenopus laevis) (DKK4), mRNA.
FOXA1 0.45 FOXA1 Homo sapiens forkhead box A1 (FOXA1), mRNA.
IFITM1 0.45 IFITM1
Homo sapiens interferon induced transmembrane protein 1 (9-27) (IFITM1), mRNA.
RAB30 0.45 RAB30 Homo sapiens RAB30, member RAS oncogene family (RAB30), mRNA.
SAMD9L 0.45 SAMD9L Homo sapiens sterile alpha motif domain containing 9-like (SAMD9L), mRNA.
TXNRD1 0.45 TXNRD1 Homo sapiens thioredoxin reductase 1 (TXNRD1), transcript variant 4, mRNA.
YTHDC1 0.45 YTHDC1 Homo sapiens YTH domain containing 1 (YTHDC1), transcript variant 1, mRNA.
C6orf128 0.46 C6ORF128 Homo sapiens chromosome 6 open reading frame 128 (C6orf128), mRNA.
IFI44 0.46 IFI44 Homo sapiens interferon-induced protein 44 (IFI44), mRNA.
IL29 0.46 IL29 Homo sapiens interleukin 29 (interferon, lambda 1) (IL29), mRNA.
PRKCH 0.46 PRKCH Homo sapiens protein kinase C, eta (PRKCH), mRNA.
STX11 0.46 STX11 Homo sapiens syntaxin 11 (STX11), mRNA.
TRIM26 0.46 TRIM26 Homo sapiens tripartite motif-containing 26 (TRIM26), mRNA.
DUSP19 0.47 DUSP19 Homo sapiens dual specificity phosphatase 19 (DUSP19), mRNA.
FAM46A 0.47 FAM46A Homo sapiens family with sequence similarity 46, member A (FAM46A), mRNA.
IRF7 0.47 IRF7 Homo sapiens interferon regulatory factor 7 (IRF7), transcript variant d, mRNA.

128
KLF6 0.47 KLF6 Homo sapiens Kruppel-like factor 6 (KLF6), transcript variant 2, mRNA.
S100A2 0.47 S100A2 Homo sapiens S100 calcium binding protein A2 (S100A2), mRNA.
TMEM27 0.47 TMEM27 Homo sapiens transmembrane protein 27 (TMEM27), mRNA.
TSC22D1 0.47 TSC22D1 Homo sapiens TSC22 domain family, member 1 (TSC22D1), transcript variant 1, mRNA.
ZNF342 0.47 ZNF342 Homo sapiens zinc finger protein 342 (ZNF342), mRNA.
ADM 0.48 ADM Homo sapiens adrenomedullin (ADM), mRNA.
ANTXR2 0.48 ANTXR2 Homo sapiens anthrax toxin receptor 2 (ANTXR2), mRNA.
CCNL1 0.48 CCNL1 Homo sapiens cyclin L1 (CCNL1), mRNA.
EFNB2 0.48 EFNB2 Homo sapiens ephrin-B2 (EFNB2), mRNA.
GPRC5A 0.48 GPRC5A Homo sapiens G protein-coupled receptor, family C, group 5, member A (GPRC5A), mRNA.
HS3ST2 0.48 HS3ST2 Homo sapiens heparan sulfate (glucosamine) 3-O-sulfotransferase 2 (HS3ST2), mRNA.
MAF 0.48 MAF
Homo sapiens v-maf musculoaponeurotic fibrosarcoma oncogene homolog (avian) (MAF), transcript variant 1, mRNA.
SPEN 0.48 SPEN Homo sapiens spen homolog, transcriptional regulator (Drosophila) (SPEN), mRNA.
0.48 HS.572444
Homo sapiens cDNA: FLJ21679 fis, clone COL09221
AHR 0.49 AHR Homo sapiens aryl hydrocarbon receptor (AHR), mRNA.
C18orf8 0.49 C18ORF8 Homo sapiens chromosome 18 open reading frame 8 (C18orf8), mRNA.
CPEB2 0.49 CPEB2
PREDICTED: Homo sapiens cytoplasmic polyadenylation element binding protein 2, transcript variant 2 (CPEB2), mRNA.
DDX58 0.49 DDX58 Homo sapiens DEAD (Asp-Glu-Ala-Asp) box polypeptide 58 (DDX58), mRNA.
EIF2C2 0.49 EIF2C2 Homo sapiens eukaryotic translation initiation factor 2C, 2 (EIF2C2), mRNA.
F2RL1 0.49 F2RL1 Homo sapiens coagulation factor II (thrombin) receptor-like 1 (F2RL1), mRNA.
IFITM2 0.49 IFITM2
Homo sapiens interferon induced transmembrane protein 2 (1-8D) (IFITM2), mRNA.
LDLR 0.49 LDLR Homo sapiens low density lipoprotein receptor

129
(familial hypercholesterolemia) (LDLR), mRNA.
PLEKHC1 0.49 PLEKHC1
Homo sapiens pleckstrin homology domain containing, family C (with FERM domain) member 1 (PLEKHC1), mRNA.
RNMT 0.49 RNMT Homo sapiens RNA (guanine-7-) methyltransferase (RNMT), mRNA.
SP100 0.49 SP100 Homo sapiens SP100 nuclear antigen (SP100), transcript variant 1, mRNA.
TRIM21 0.49 TRIM21 Homo sapiens tripartite motif-containing 21 (TRIM21), mRNA.
C15orf39 0.5 C15ORF39 Homo sapiens chromosome 15 open reading frame 39 (C15orf39), mRNA.
C1orf77 0.5 C1ORF77 Homo sapiens chromosome 1 open reading frame 77 (C1orf77), mRNA.
CDKN1A 0.5 CDKN1A
Homo sapiens cyclin-dependent kinase inhibitor 1A (p21, Cip1) (CDKN1A), transcript variant 2, mRNA.
DDIT3 0.5 DDIT3 Homo sapiens DNA-damage-inducible transcript 3 (DDIT3), mRNA.
DNAJA1 0.5 DNAJA1 Homo sapiens DnaJ (Hsp40) homolog, subfamily A, member 1 (DNAJA1), mRNA.
FBXO32 0.5 FBXO32 Homo sapiens F-box protein 32 (FBXO32), transcript variant 2, mRNA.
IRS2 0.5 IRS2 Homo sapiens insulin receptor substrate 2 (IRS2), mRNA.
NFKBIA 0.5 NFKBIA
Homo sapiens nuclear factor of kappa light polypeptide gene enhancer in B-cells inhibitor, alpha (NFKBIA), mRNA.
PARP12 0.5 PARP12 Homo sapiens poly (ADP-ribose) polymerase family, member 12 (PARP12), mRNA.
0.5 HS.495542
PREDICTED: Homo sapiens hypothetical gene supported by BC027323 (LOC441477), mRNA
LTB4R2 2.04 LTB4R2 Homo sapiens leukotriene B4 receptor 2 (LTB4R2), mRNA.
RNASE7 2.07 RNASE7 Homo sapiens ribonuclease, RNase A family, 7 (RNASE7), mRNA.
UAP1L1 2.14 UAP1L1 Homo sapiens UDP-N-acteylglucosamine pyrophosphorylase 1-like 1 (UAP1L1), mRNA.
MAPK13 5.63 MAPK13 Homo sapiens mitogen-activated protein kinase 13 (MAPK13), mRNA.

130
Appendix 3
Protocol for making pGL4.1 HSPA6 5’ truncation constructs
The HSPA6 -2962 to +48 (herein called 3kb) promoter fragment was PCR’ed from human genomic placental DNA (BD Biosciences cat# 636401)
PCR primers sequences o Forward: gatgCTCGAGtttggctgtgtccccacccgaatatca (KpnI
underlined) o Reverse: GGCTGAAGCTTCTTGTCGGATGCTGGA (HindIII
underlined)
PCR conditions using Roche High Fidelity PCR master kit
o 94C for 3 minutes
o 94C for 30 seconds
o 62C for 30 seconds 32x
o 68C for 3.5 minutes
o 68C for 5 minutes
HSPA6 3kb promoter was inserted using KpnI and HindIII sites into the pGL4.10 vector.
To generate HSPA6 5’-truncation constructs, pGL4.1 HSPA6 3kb construct was digested with KpnI (left) and a second restriction site (BglII for -1230; EcoRI for -647; NruI for -70) to remove the upstream DNA fragments. DNA was blunt ended, gel extracted, and ligated.
HSPA6 3kb sequence restriction enzyme sites

131
1 site only
2 sites only

132
Biotech center sequenced HSPA6 promoter (-2962 to +48) -2962 (introduced KpnI site) to -1231 bp
O TCATCTTGAATTCCCACAACACATGGGAGGGACCCAGTGGAAGGTAACTGAATCATGGGGCAGGTCTTTCCCATGCTGTTCTTGTGATAGTGAATAAGTCTCATGAGATCTGATGGTTTTAAAAAGGGGAGTTTCCCTGCACAAGCTCTCTCTTCTCTTGTTTGCCACCATGTGAGACATGACTTTCACCTTTTGCCATGATTGTGAGGCCTCCCAGCCACGTGGAACTGTAAGTCCATTAAACCTCTTTCTTTTGTAAATTGCCCCGTCTCAGGTATGTCTTTATTAGCAGTGTGAGAATGGGCTAACACATACAACTTGCTTTTTTTTTGTACTCAATATTGAGTCGTGAGCTTTGCACCACATTAGAATGTCTATTTAAGTCATTACTTTAAGGTCGGTTCTATTTTTAAAGCTACTCAAACTAAGCTACTAAACATAAGTGGATATATTTAAGTGTATGTATAAAATTTATACTAGGCCAGCTGCAGTGGCTCATGCCTGTAATCCCAAAGCTGTGGAAGGTAGAGGTGGGACTGATTGAGGCCACGAGTTCAAGGCTGCAGTGAGCTGTGATTGCATCACTGTACTCCAGCCTGAGGGACAGAGCAGGAACCAGAAAAAAATAAAATAAAAAGAAACAAACAAAAAAACCCCCAACAACCCTACAGTGGCTCTTTTAGAAAAAACAAACAAACAAAACCAAAACTGTACTGCATGCATAAGCTCCCCTATGCTATGTTTGAACCACTCTGAAGAGATCAATTAAAAAGAAGTGAGTGATATTGGAAGCATGCCTCTGTGATGCTGTGGTAACATTCATAGGCTGCGTTAGGGCTATGCCTGTAACTCTTGGAGATGAGTGGGTAAGTGGGGTTTTGAGGTGGCTGGGGGCTGGAAGAGAAGGTTGGAGGAGCCCACACAAGACAGCCCCTTAACACGCCGGGGCACAGAACCCCAGGCTGGGCCAACTTTTCCCTGCTGAGGTGAAGACCCGTCTCTTGCAGGCCGTTGGCAAATGTCTTGACTCTGGCATCCAGGTGTGACCAGCTTAGACCCTGAGAGTGAGTGAATTTAAAGTTGACAGCTTCTTTCCCTTTTGGAATTATGAAATAGGTTACTTCTTTTCAAGGACAGTTTGATTTTCCACTGTGTAAGTCATATATTGCACATTTCTTTAAACATTCCCTTTTTTCCTGAACTGATCACCTTACCAGTACGGCTGATCCTCTCAAGCAGCAAACTCTACCAGCTGTCACTGGTGCTCTCGGAGAGACGATTAACCAAGGAACCCAGCCCGGGAACAGTACTGACCTCTACTTCTGGACTCCTGCCTCCCTCTTAAAAAGTCCCTTGAACTTCCTAGTGGGTTCTAACCTGTCAAAGGAGAAAATAGCCATCTATGGAGTAAGGGTTTTTAGTTTCTCTTTTTACAAATGGAAGTTTCCTCTGAATCAGGCAAGTAACGTTAAATAGAAGCCAACTTTTAAGTTTCTCTAACACACTGCTAAATTGTAACACCAGACTGTACCACATACTCTCCAGCTGCCAGCTATTGCAGTTGCCATCCTTGTTACTATAGTGGTGAGTATCTCTGCCTGTCATGCGTGAGAGAGGGGGTCGATTCCCCGACGGGGAGGTCACGGGAAATTGTGTGAGGATTTTGTCAACCTTCAGAAGTCTCAGAAATGTCTCCTTGTTTTGGCTTTCAGCGGAAATCCGAACGCCAGCA
-1230 (Existing BglII site) to -648 bp O GATCTGAATGGAATGTTCTGGATTGAAGAAAGTGGGAAATGGCCTCAATTCA
CAAAGTCACAACCTGATAAAAACCAGTGTGACTTTACTGCCCAGTGAACCCATCTCGTCCTCCAGCCTTTAGGAGGTAGGTTGGACTGGAGCCTGCAGTAGTTTACTCTCCACCTGAGTCCTGGTCTCCAGCTGGGAACCCACTTAGGCCATAGAGAAAAACGCACACTGTGCCTCTCCACCGGGCCTCTGGAGACGAGGCTCCTCGGGGATACAAACAGTGGGGAGAACATGAGGGACATCCCGACCGTACTCTGCGTCCTCCTTTCCCAGGTGTTGCGTTCTCTCTTGGGCTGAGTGGCGAGGTCTCTCCCGAGTCCCAGGGCCACAGTGCAATGTCACATCTCCTTTGTGGAAAGTGACTGGTAAAGGAGAGAGAACAAAACTGGAGGAACGTAAAGTCTTCAGCCACCTGGTTTAATTTATTCAAGAGTGATTAATCCTAGATGAGAAAAAGAATTGAAATGGATCGGAAAAAAATGAAAGTGCATTGGCCGGGAATCGAACCCGGGCCTCCCGCGTGGCAGGCGAG
-647 (Existing EcoRI site) to -71 bp O AATTCTACCACTGAACCACCAATGCTACTGTCAGCTAAAGACCTGCAGTATT
GTCTCTTAAAGCTCACTATCTCTGGCCATTCGCTAAGGAACCAGGCACCGTCTTAAATCGCGGTTTGGAAAATATTTTGTTCAAGATAAAACTGTTTTAAGATAT

133
ACGTGTATATATCTTATATATCTGTATTCGCATGGTAACATATCTTCGGCCTTCCTGAGCCGCTGGGCTCTCAGCGGCCCTCCAAGGCAGCCCGCAGGCCCCTGTGTGCCTCAGGGATCCGACCTCCCACAGCCCCGGGGAGACCTTGCCTCTAAAGTTGCTGCTTTTGCAGCCTCTGCCACAACCGCGCGTCCTCAGAGCCAGCCGGGAGGAGCTAGAACCTTCCCCGCATTTCTTTCAGCAGCCTGAGTCAGAGGCGGGCTGGCCTGGCGTAGCCGCCCAGCCTCGCGGCTCATGCCCCGATCTGCCCGAACCTTCTCCCGGGGTCAGCGCCGCGCCGCGCCACCCGGCTGAGTCAGCCCGGGCGGGCGAGAGGCTCTCAACTGGGCGGGAAGGTGCGGGAAGGTGCGGAAAGGTTCG
-70 (Existing NruI site) to +48 O CGAAAGTTCGCGGCGGCGGGGGTCGGGTGAGGCGCAAAAGGATAAAAAG
CCCGTGGAAGCGGAGCTGAGCAGATCCGAGCCGGGCTGGCTGCAGAGAAACCGCAGGGAGAGCCTCACT
134
Protocol for making pGL4.1 HSPA6 internal deletion constructs
The Agilent QuikChange Lightning Site Directed Mutagenesis kit (Cat #210518) was used to generate the HSP deletion constructs (HSPA6 B, C, D, W, X, Y, and Z). As per the manufacturer’s instructions, ~100-150 bp can be accurately deleted from the sequence.
Deletion A was generated through “normal” cloning procedure.
pGL4.1 HSPA6 -647 deletion construct (B-D) primers. o B forward:
CTGTTTTAAGATATACGTGTATATATCTTGCCTCTAAAGTTGCTGCTTTTGCAGCC
o B Reverse: GGCTGCAAAAGCAGCAACTTTAGAGGCAAGATATATACACGTATATCTTAAAACAG
o C Forward: ACAGCCCCGGGGAGACGCCGCCCAGCCTCG
o C Reverse: CGAGGCTGGGCGGCGTCTCCCCGGGGCTGT
o D Forward: CGGGCTGGCCTGGCGTACGAAAGTTCGCGGC
o D Reverse: GCCGCGAACTTTCGTACGCCAGGCCAGCCCG
pGL4.1 HSPA6 -647 deletion construct (A) primers. o A Forward:
gatcGGTACCCTTATATATCTGTATTCGCATGGTAACATATC (KpnI site)
o A Reverse: ttggAAGCTTAGTGAGGCTCTCCCTGCGG (HindIII site)
pGL4.1 HSPA6 -1230 deletion construct (W-Z) primers. o W Forward:
CTCTGGCCTAACTGGCCGCAGTAGTTTACTCTCCACCTGAGTCC
o W Reverse: GGACTCAGGTGGAGAGTAAACTACTGCGGCCAGTTAGGCCAGAG
o X Forward: GGAGGTAGGTTGGACTGGAGCCTGCTCTGCGTCCTCCTTTCCCAGG
o X Reverse: CCTGGGAAAGGAGGACGCAGAGCAGGCTCCAGTCCAACCTACCTCC
o Y Forward: GAACATGAGGGACATCCCGACCGAGAGAGAACAAAACTGGAGGAAcG
o Y Reverse: CGTTCCTCCAGTTTTGTTCTCTCTCGGTCGGGATGTCCCTCATGTTC
o Z Forward: CCTTTGTGGAAAGTGACTGGTAAAGGAATTCTACCACTGAACCACC
o Z Reverse: GGTGGTTCAGTGGTAGAATTCCTTTACCAGTCACTTTCCACAAAGG

135
Biotech center sequenced HSPA6 promoter internal deletion sequence
W deletion sequence (-1230 to -1084) o gatctgaatggaatGTTCTGGATTGAAGAAAGTGGGAAATGGCCTCAATTCACAAA
GTCACAACCTGATAAAAACCAGTGTGACTTTACTGCCCAGTGAACCCATCTCGTCCTCCAGCCTTTAGGAGGTAGGTTGGACTGGAGCCTG
X Deletion sequence (-1083 to -928) o CAGTAGTTTACTCTCCACCTGAGTCCTGGTCTCCAGCTGGGAACCCACTTA
GGCCATAGAGAAAAACGCACACTGTGCCTCTCCACCGGGCCTCTGGAGACGAGGCTCCTCGGGGATACAAACAGTGGGGAGAACATGAGGGACATCCCGACCGTA
Y Deletion sequence (-927 to -808) o CTCTGCGTCCTCCTTTCCCAGGTGTTGCGTTCTCTCTTGGGCTGAGTGGCG
AGGTCTCTCCCGAGTCCCAGGGCCACAGTGCAATGTCACATCTCCTTTGTGGAAAGTGACTGGTAAAGG
Z Deletion sequence (-807 to -648) O AGAGAGAACAAAACTGGAGGAACGTAAAGTCTTCAGCCACCTGGTTTAATTT
ATTCAAGAGTGATTAATCCTAGATGAGAAAAAGAATTGAAATGGATCGGAAAAAAATGAAAGTGCATTGGCCGGGAATCGAACCCGGGCCTCCCGCGTGGCAGGCGAG
A Deletion sequence (-647 to -479) O AATTCTACCACTGAACCACCAATGCTACTGTCAGCTAAAGACCTGCAGTATT
GTCTCTTAAAGCTCACTATCTCTGGCCATTCGCTAAGGAACCAGGCACCGTCTTAAATCGCGGTTTGGAAAATATTTTGTTCAAGATAAAACTGTTTTAAGATATACGTGTATATAT
B Deletion sequence (-478 to -347) o CTTATATATCTGTATTCGCATGGTAACATATCTTCGGCCTTCCTGAGCCGCT
GGGCTCTCAGCGGCCCTCCAAGGCAGCCCGCAGGCCCCTGTGTGCCTCAGGGATCCGACCTCCCACAGCCCCGGGGAGAC
C Deletion sequence (-346 to -217) O CTTGCCTCTAAAGTTGCTGCTTTTGCAGCCTCTGCCACAACCGCGCGTCCT
CAGAGCCAGCCGGGAGGAGCTAGAACCTTCCCCGCATTTCTTTCAGCAGCCTGAGTCAGAGGCGGGCTGGCCTGGCGTA
D Deletion sequence (-216 to -71) O GCCGCCCAGCCTCGCGGCTCATGCCCCGATCTGCCCGAACCTTCTCCCGG
GGTCAGCGCCGCGCCGCGCCACCCGGCTGAGTCAGCCCGGGCGGGCGAGAGGCTCTCAACTGGGCGGGAAGGTGCGGGAAGGTGCGGAAAGGTTCG
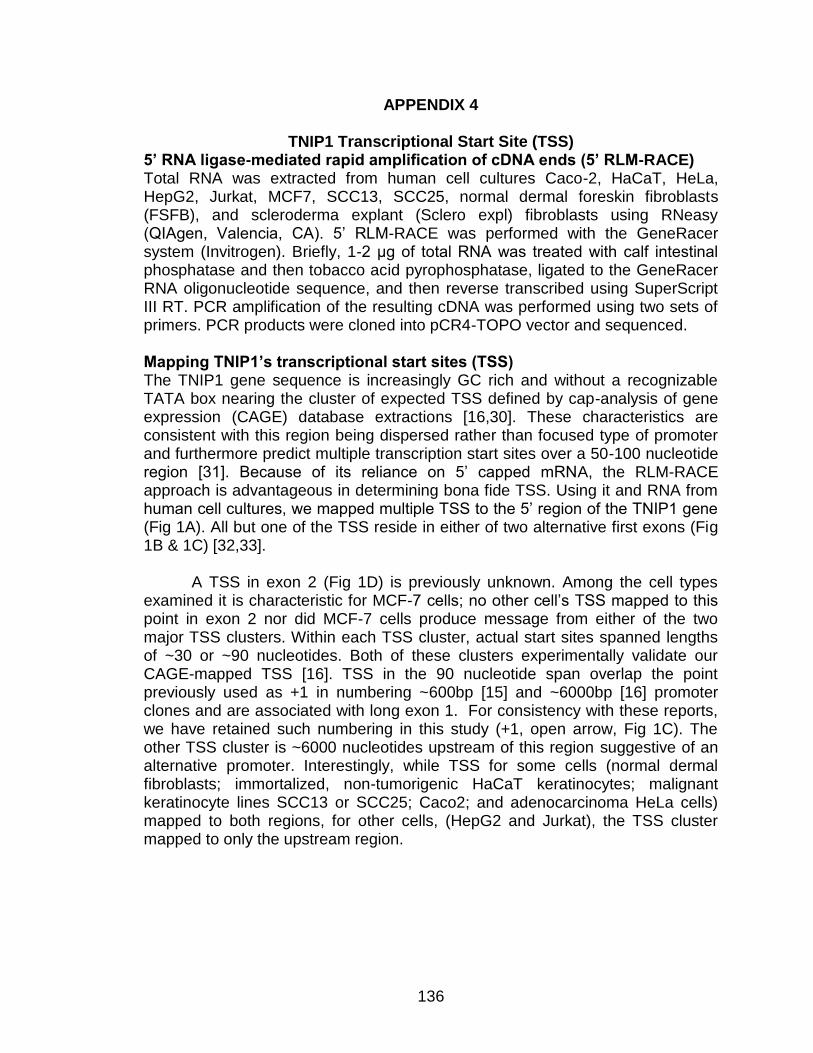
136
APPENDIX 4
TNIP1 Transcriptional Start Site (TSS) 5’ RNA ligase-mediated rapid amplification of cDNA ends (5’ RLM-RACE) Total RNA was extracted from human cell cultures Caco-2, HaCaT, HeLa, HepG2, Jurkat, MCF7, SCC13, SCC25, normal dermal foreskin fibroblasts (FSFB), and scleroderma explant (Sclero expl) fibroblasts using RNeasy (QIAgen, Valencia, CA). 5’ RLM-RACE was performed with the GeneRacer system (Invitrogen). Briefly, 1-2 μg of total RNA was treated with calf intestinal phosphatase and then tobacco acid pyrophosphatase, ligated to the GeneRacer RNA oligonucleotide sequence, and then reverse transcribed using SuperScript III RT. PCR amplification of the resulting cDNA was performed using two sets of primers. PCR products were cloned into pCR4-TOPO vector and sequenced. Mapping TNIP1’s transcriptional start sites (TSS) The TNIP1 gene sequence is increasingly GC rich and without a recognizable TATA box nearing the cluster of expected TSS defined by cap-analysis of gene expression (CAGE) database extractions [16,30]. These characteristics are consistent with this region being dispersed rather than focused type of promoter and furthermore predict multiple transcription start sites over a 50-100 nucleotide region [31]. Because of its reliance on 5’ capped mRNA, the RLM-RACE approach is advantageous in determining bona fide TSS. Using it and RNA from human cell cultures, we mapped multiple TSS to the 5’ region of the TNIP1 gene (Fig 1A). All but one of the TSS reside in either of two alternative first exons (Fig 1B & 1C) [32,33].
A TSS in exon 2 (Fig 1D) is previously unknown. Among the cell types
examined it is characteristic for MCF-7 cells; no other cell’s TSS mapped to this point in exon 2 nor did MCF-7 cells produce message from either of the two major TSS clusters. Within each TSS cluster, actual start sites spanned lengths of ~30 or ~90 nucleotides. Both of these clusters experimentally validate our CAGE-mapped TSS [16]. TSS in the 90 nucleotide span overlap the point previously used as +1 in numbering ~600bp [15] and ~6000bp [16] promoter clones and are associated with long exon 1. For consistency with these reports, we have retained such numbering in this study (+1, open arrow, Fig 1C). The other TSS cluster is ~6000 nucleotides upstream of this region suggestive of an alternative promoter. Interestingly, while TSS for some cells (normal dermal fibroblasts; immortalized, non-tumorigenic HaCaT keratinocytes; malignant keratinocyte lines SCC13 or SCC25; Caco2; and adenocarcinoma HeLa cells) mapped to both regions, for other cells, (HepG2 and Jurkat), the TSS cluster mapped to only the upstream region.
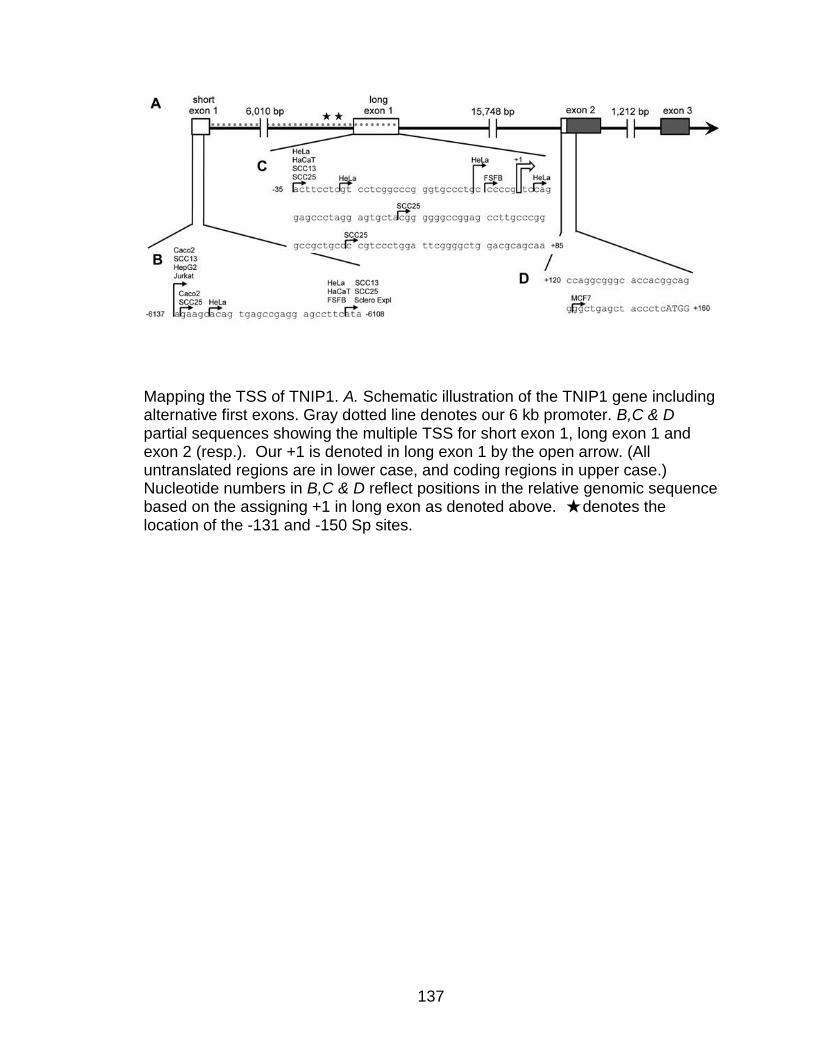
137
Mapping the TSS of TNIP1. A. Schematic illustration of the TNIP1 gene including alternative first exons. Gray dotted line denotes our 6 kb promoter. B,C & D partial sequences showing the multiple TSS for short exon 1, long exon 1 and exon 2 (resp.). Our +1 is denoted in long exon 1 by the open arrow. (All untranslated regions are in lower case, and coding regions in upper case.) Nucleotide numbers in B,C & D reflect positions in the relative genomic sequence based on the assigning +1 in long exon as denoted above. ★ denotes the location of the -131 and -150 Sp sites.
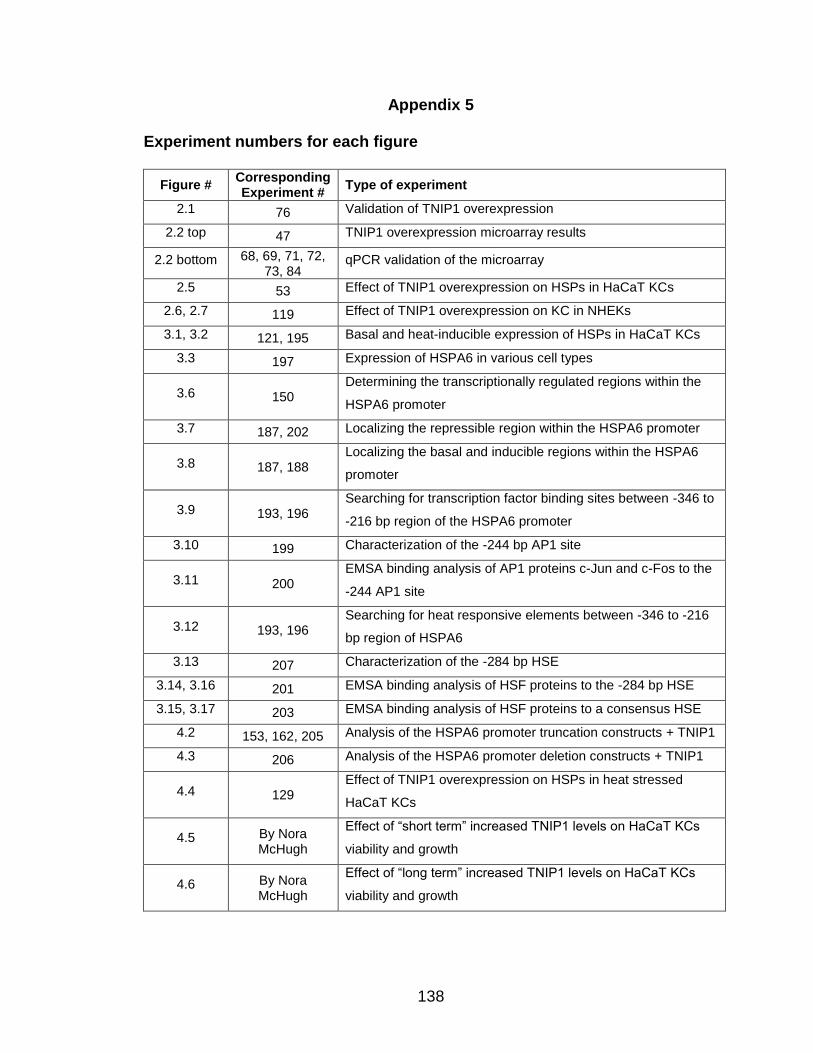
138
Appendix 5
Experiment numbers for each figure
Figure # Corresponding Experiment #
Type of experiment
2.1 76 Validation of TNIP1 overexpression
2.2 top 47 TNIP1 overexpression microarray results
2.2 bottom 68, 69, 71, 72, 73, 84
qPCR validation of the microarray
2.5 53 Effect of TNIP1 overexpression on HSPs in HaCaT KCs
2.6, 2.7 119 Effect of TNIP1 overexpression on KC in NHEKs
3.1, 3.2 121, 195 Basal and heat-inducible expression of HSPs in HaCaT KCs
3.3 197 Expression of HSPA6 in various cell types
3.6 150 Determining the transcriptionally regulated regions within the
HSPA6 promoter
3.7 187, 202 Localizing the repressible region within the HSPA6 promoter
3.8 187, 188 Localizing the basal and inducible regions within the HSPA6
promoter
3.9 193, 196 Searching for transcription factor binding sites between -346 to
-216 bp region of the HSPA6 promoter
3.10 199 Characterization of the -244 bp AP1 site
3.11 200 EMSA binding analysis of AP1 proteins c-Jun and c-Fos to the
-244 AP1 site
3.12 193, 196 Searching for heat responsive elements between -346 to -216
bp region of HSPA6
3.13 207 Characterization of the -284 bp HSE
3.14, 3.16 201 EMSA binding analysis of HSF proteins to the -284 bp HSE
3.15, 3.17 203 EMSA binding analysis of HSF proteins to a consensus HSE
4.2 153, 162, 205 Analysis of the HSPA6 promoter truncation constructs + TNIP1
4.3 206 Analysis of the HSPA6 promoter deletion constructs + TNIP1
4.4 129 Effect of TNIP1 overexpression on HSPs in heat stressed
HaCaT KCs
4.5 By Nora McHugh
Effect of “short term” increased TNIP1 levels on HaCaT KCs
viability and growth
4.6 By Nora McHugh
Effect of “long term” increased TNIP1 levels on HaCaT KCs
viability and growth

139
References
1. S. MacNeil, Progress and opportunities for tissue-engineered skin. Nature. 445, 874-880 (2007).
2. R. L. Eckert, E. A. Rorke, Molecular biology of keratinocyte differentiation. Environ. Health Perspect. 80, 109-116 (1989).
3. J. N. Barker, R. S. Mitra, C. E. Griffiths, V. M. Dixit, B. J. Nickoloff, Keratinocytes as initiators of inflammation. Lancet. 337, 211-214 (1991).
4. L. Eckhart, S. Lippens, E. Tschachler, W. Declercq, Cell death by cornification. Biochim. Biophys. Acta. 1833, 3471-3480 (2013).
5. B. J. Aneskievich, E. Fuchs, Terminal differentiation in keratinocytes involves positive as well as negative regulation by retinoic acid receptors and retinoid X receptors at retinoid response elements. Mol. Cell. Biol. 12, 4862-4871 (1992).
6. V. A. Tron et al., p53-regulated apoptosis is differentiation dependent in ultraviolet B-irradiated mouse keratinocytes. Am. J. Pathol. 153, 579-585 (1998).
7. D. D. Bikle, D. Ng, C. L. Tu, Y. Oda, Z. Xie, Calcium- and vitamin D-regulated keratinocyte differentiation. Mol. Cell. Endocrinol. 177, 161-171 (2001).
8. V. Perissi, M. G. Rosenfeld, Controlling nuclear receptors: the circular logic of cofactor cycles Nat. Rev. Mol. Cell Biol. 6, 542-554 (2005).
9. I. Gurevich, A. M. Flores, B. J. Aneskievich, Corepressors of agonist-bound nuclear receptors Toxicol. Appl. Pharmacol. 223, 288-298 (2007).
10. M. Westergaard et al., Modulation of keratinocyte gene expression and differentiation by PPAR-selective ligands and tetradecylthioacetic acid J. Invest. Dermatol. 116, 702-712 (2001).
11. M. Mao-Qiang et al., Peroxisome-proliferator-activated receptor (PPAR)-gamma activation stimulates keratinocyte differentiation J. Invest. Dermatol. 123, 305-312 (2004).
12. M. Schmuth et al., Peroxisome proliferator-activated receptor (PPAR)-beta/delta stimulates differentiation and lipid accumulation in keratinocytes. J. Invest. Dermatol. 122, 971-983 (2004).
13. K. Hanley et al., Farnesol stimulates differentiation in epidermal keratinocytes via PPARalpha. J. Biol. Chem. 275, 11484-11491 (2000).
14. F. O. Nestle, D. H. Kaplan, J. Barker, Psoriasis N. Engl. J. Med. 361, 496-509 (2009).
15. L. G. Komuves et al., Stimulation of PPARalpha promotes epidermal keratinocyte differentiation in vivo. J. Invest. Dermatol. 115, 353-360 (2000).
16. N. S. Tan et al., Critical roles of PPAR beta/delta in keratinocyte response to inflammation. Genes Dev. 15, 3263-3277 (2001).
17. M. Y. Sheu et al., Topical peroxisome proliferator activated receptor-alpha activators reduce inflammation in irritant and allergic contact dermatitis models. J. Invest. Dermatol. 118, 94-101 (2002).
18. H. Green, F. M. Watt, Regulation by vitamin A of envelope cross-linking in cultured keratinocytes derived from different human epithelia. Mol. Cell. Biol. 2, 1115-1117 (1982).
19. L. S. Winterfield, A. Menter, K. Gordon, A. Gottlieb, Psoriasis treatment: current and emerging directed therapies. Ann. Rheum. Dis. 64 Suppl 2, ii87-90; discussion ii91-2 (2005).
20. E. W. Harhaj, V. M. Dixit, Deubiquitinases in the regulation of NF-kappaB signaling Cell Res. 21, 22-39 (2011).

140
21. C. S. Seitz, Q. Lin, H. Deng, P. A. Khavari, Alterations in NF-kappaB function in transgenic epithelial tissue demonstrate a growth inhibitory role for NF-kappaB. Proc. Natl. Acad. Sci. U. S. A. 95, 2307-2312 (1998).
22. F. C. Victor, A. B. Gottlieb, TNF-alpha and apoptosis: implications for the pathogenesis and treatment of psoriasis. J. Drugs Dermatol. 1, 264-275 (2002).
23. I. Gurevich, B. J. Aneskievich, Liganded RARalpha and RARgamma interact with but are repressed by TNIP1 Biochem. Biophys. Res. Commun. 389, 409-414 (2009).
24. A. M. Flores et al., TNIP1 is a corepressor of agonist-bound PPARs Arch. Biochem. Biophys.(2011).
25. I. Gurevich, C. Zhang, N. Francis, B. J. Aneskievich, TNIP1, a Retinoic Acid Receptor Corepressor and A20-binding Inhibitor of NF-kappaB, Distributes to Both Nuclear and Cytoplasmic Locations J. Histochem. Cytochem. 59, 1101-1112 (2011).
26. A. Fritah, M. Christian, M. G. Parker, The metabolic coregulator RIP140: an update Am. J. Physiol. Endocrinol. Metab. 299, E335-40 (2010).
27. L. N. Wei, X. Hu, D. Chandra, E. Seto, M. Farooqui, Receptor-interacting protein 140 directly recruits histone deacetylases for gene silencing J. Biol. Chem. 275, 40782-40787 (2000).
28. C. Mauro et al., ABIN-1 binds to NEMO/IKKgamma and co-operates with A20 in inhibiting NF-kappaB J. Biol. Chem. 281, 18482-18488 (2006).
29. S. Wagner et al., Ubiquitin binding mediates the NF-kappaB inhibitory potential of ABIN proteins Oncogene. 27, 3739-3745 (2008).
30. T. Bouwmeester et al., A physical and functional map of the human TNF-alpha/NF-kappa B signal transduction pathway Nat. Cell Biol. 6, 97-105 (2004).
31. S. Cohen, A. Ciechanover, Y. Kravtsova-Ivantsiv, D. Lapid, S. Lahav-Baratz, ABIN-1 negatively regulates NF-kappaB by inhibiting processing of the p105 precursor Biochem. Biophys. Res. Commun. 389, 205-210 (2009).
32. T. L. Haas et al., Recruitment of the linear ubiquitin chain assembly complex stabilizes the TNF-R1 signaling complex and is required for TNF-mediated gene induction Mol. Cell. 36, 831-844 (2009).
33. J. Gallagher et al., Identification of Naf1/ABIN-1 among TNF-alpha-induced expressed genes in human synoviocytes using oligonucleotide microarrays FEBS Lett. 551, 8-12 (2003).
34. R. P. Nair et al., Genome-wide scan reveals association of psoriasis with IL-23 and NF-kappaB pathways Nat. Genet. 41, 199-204 (2009).
35. J. W. Han et al., Genome-wide association study in a Chinese Han population identifies nine new susceptibility loci for systemic lupus erythematosus Nat. Genet. 41, 1234-1237 (2009).
36. V. Gateva et al., A large-scale replication study identifies TNIP1, PRDM1, JAZF1, UHRF1BP1 and IL10 as risk loci for systemic lupus erythematosus Nat. Genet. 41, 1228-1233 (2009).
37. C. F. He et al., TNIP1, SLC15A4, ETS1, RasGRP3 and IKZF1 are associated with clinical features of systemic lupus erythematosus in a Chinese Han population Lupus. 19, 1181-1186 (2010).
38. A. Kawasaki et al., Association of TNFAIP3 interacting protein 1, TNIP1 with systemic lupus erythematosus in a Japanese population: a case-control association study Arthritis Res. Ther. 12, R174 (2010).
39. Y. Allanore et al., Genome-Wide Scan Identifies TNIP1, PSORS1C1, and RHOB as Novel Risk Loci for Systemic Sclerosis PLoS Genet. 7, e1002091 (2011).
40. K. Gupta, D. Ott, T. J. Hope, R. F. Siliciano, J. D. Boeke, A human nuclear shuttling protein that interacts with human immunodeficiency virus type 1 matrix is packaged into virions J. Virol. 74, 11811-11824 (2000).

141
41. V. P. Ramirez, I. Gurevich, B. J. Aneskievich, Emerging roles for TNIP1 in regulating post-receptor signaling. Cytokine Growth Factor Rev. 23, 109-118 (2012).
42. M. Favre, C. Butticaz, B. Stevenson, C. V. Jongeneel, A. Telenti, High frequency of alternative splicing of human genes participating in the HIV-1 life cycle: a model using TSG101, betaTrCP, PPIA, INI1, NAF1, and PML J. Acquir. Immune Defic. Syndr. 34, 127-133 (2003).
43. Y. Shiote et al., Multiple splicing variants of Naf1/ABIN-1 transcripts and their alterations in hematopoietic tumors Int. J. Mol. Med. 18, 917-923 (2006).
44. P. C. Encarnacao, V. P. Ramirez, C. Zhang, B. J. Aneskievich, Sp sites contribute to basal and inducible expression of the human TNIP1 (TNFalpha-inducible protein 3-interacting protein 1) promoter. Biochem. J. 452, 519-529 (2013).
45. Y. C. Tung, G. S. Yeo, From GWAS to biology: lessons from FTO Ann. N. Y. Acad. Sci. 1220, 162-171 (2011).
46. T. Berulava, B. Horsthemke, The obesity-associated SNPs in intron 1 of the FTO gene affect primary transcript levels Eur. J. Hum. Genet.(2010).
47. L. A. Hindorff et al., Potential etiologic and functional implications of genome-wide association loci for human diseases and traits Proc. Natl. Acad. Sci. U. S. A. 106, 9362-9367 (2009).
48. M. Uddin, M. Sturge, P. Rahman, M. O. Woods, Autosome-wide Copy Number Variation Association Analysis for Rheumatoid Arthritis Using the WTCCC High-density SNP Genotype Data J. Rheumatol. 38, 797-801 (2011).
49. M. S. Hayden, S. Ghosh, Shared principles in NF-kappaB signaling Cell. 132, 344-362 (2008).
50. S. Vallabhapurapu, M. Karin, Regulation and function of NF-kappaB transcription factors in the immune system Annu. Rev. Immunol. 27, 693-733 (2009).
51. G. Dong et al., A20, ABIN-1/2, and CARD11 mutations and their prognostic value in gastrointestinal diffuse large B-cell lymphoma Clin. Cancer Res. 17, 1440-1451 (2011).
52. Genetic Analysis of Psoriasis Consortium & the Wellcome Trust Case Control Consortium 2 et al., A genome-wide association study identifies new psoriasis susceptibility loci and an interaction between HLA-C and ERAP1 Nat. Genet. 42, 985-990 (2010).
53. E. A. Stahl et al., Genome-wide association study meta-analysis identifies seven new rheumatoid arthritis risk loci Nat. Genet. 42, 508-514 (2010).
54. G. Orozco et al., Study of the common genetic background for rheumatoid arthritis and systemic lupus erythematosus Ann. Rheum. Dis. 70, 463-468 (2011).
55. K. Hinata, A. M. Gervin, Y. Jennifer Zhang, P. A. Khavari, Divergent gene regulation and growth effects by NF-kappa B in epithelial and mesenchymal cells of human skin Oncogene. 22, 1955-1964 (2003).
56. M. Halvorsen, J. S. Martin, S. Broadaway, A. Laederach, Disease-associated mutations that alter the RNA structural ensemble PLoS Genet. 6, e1001074 (2010).
57. H. Igarashi et al., A pro-inflammatory role for A20 and ABIN family proteins in human fibroblast-like synoviocytes in rheumatoid arthritis Immunol. Lett.(2011).
58. C. A. Dinarello, Anti-inflammatory Agents: Present and Future Cell. 140, 935-950 (2010).
59. E. Sbidian et al., Efficacy and safety of oral retinoids in different psoriasis subtypes: a systematic literature review J. Eur. Acad. Dermatol. Venereol. 25 Suppl 2, 28-33 (2011).
60. L. Michalik, W. Wahli, Peroxisome proliferator-activated receptors (PPARs) in skin health, repair and disease Biochim. Biophys. Acta. 1771, 991-998 (2007).

142
61. M. Schmuth, Y. J. Jiang, S. Dubrac, P. M. Elias, K. R. Feingold, Thematic review series: skin lipids. Peroxisome proliferator-activated receptors and liver X receptors in epidermal biology J. Lipid Res. 49, 499-509 (2008).
62. W. Huang, C. K. Glass, Nuclear receptors and inflammation control: molecular mechanisms and pathophysiological relevance Arterioscler. Thromb. Vasc. Biol. 30, 1542-1549 (2010).
63. E. Ellinghaus et al., Genome-Wide Meta-Analysis of Psoriatic Arthritis Identifies Susceptibility Locus at REL. J. Invest. Dermatol. 132, 1133-1140 (2012).
64. J. Bowes et al., Confirmation of TNIP1 and IL23A as susceptibility loci for psoriatic arthritis Ann. Rheum. Dis.(2011).
65. K. El Bakkouri, A. Wullaert, M. Haegman, K. Heyninck, R. Beyaert, Adenoviral gene transfer of the NF-kappa B inhibitory protein ABIN-1 decreases allergic airway inflammation in a murine asthma model. J. Biol. Chem. 280, 17938-17944 (2005).
66. A. Wullaert et al., Adenoviral gene transfer of ABIN-1 protects mice from TNF/galactosamine-induced acute liver failure and lethality Hepatology. 42, 381-389 (2005).
67. S. Oshima et al., ABIN-1 is a ubiquitin sensor that restricts cell death and sustains embryonic development Nature. 457, 906-909 (2009).
68. J. Zhou et al., A20-binding inhibitor of NF-kappaB (ABIN1) controls Toll-like receptor-mediated CCAAT/enhancer-binding protein beta activation and protects from inflammatory disease Proc. Natl. Acad. Sci. U. S. A. 108, E998-E1006 (2011).
69. S. K. Nanda et al., Polyubiquitin binding to ABIN1 is required to prevent autoimmunity J. Exp. Med. 208, 1215-1228 (2011).
70. S. Zhang, M. Mahalingam, N. Tsuchida, Naf1alpha is phosphorylated in mitotic phase and required to protect cells against apoptosis. Biochem. Biophys. Res. Commun. 367, 364-369 (2008).
71. C. Jonak, G. Klosner, F. Trautinger, Significance of heat shock proteins in the skin upon UV exposure Front. Biosci. 14, 4758-4768 (2009).
72. F. Ritossa, A new puffing pattern induced by temperature shock and DNP in drosophila. Cellular and Molecular Life Sciences. 18, 571-573 (1962).
73. H. H. Kampinga et al., Guidelines for the nomenclature of the human heat shock proteins Cell Stress Chaperones. 14, 105-111 (2009).
74. G. Ravagnan et al., Polydatin, a natural precursor of resveratrol, induces beta-defensin production and reduces inflammatory response. Inflammation. 36, 26-34 (2013).
75. J. L. Curry et al., Innate immune-related receptors in normal and psoriatic skin. Arch. Pathol. Lab. Med. 127, 178-186 (2003).
76. Z. G. Zhao, Q. Z. Ma, C. X. Xu, Abrogation of heat-shock protein (HSP)70 expression induced cell growth inhibition and apoptosis in human androgen-independent prostate cancer cell line PC-3m. Asian J. Androl. 6, 319-324 (2004).
77. J. Hageman, M. A. van Waarde, A. Zylicz, D. Walerych, H. H. Kampinga, The diverse members of the mammalian HSP70 machine show distinct chaperone-like activities. Biochem. J. 435, 127-142 (2011).
78. L. Heldens et al., Protein refolding in peroxisomes is dependent upon an HSF1-regulated function. Cell Stress Chaperones. 17, 603-613 (2012).
79. E. J. Noonan, R. F. Place, C. Giardina, L. E. Hightower, Hsp70B' regulation and function Cell Stress Chaperones. 12, 393-402 (2007).
80. L. Puig, M. T. Fernandez-Figueras, C. Ferrandiz, M. Ribera, J. M. de Moragas, Epidermal expression of 65 and 72 kd heat shock proteins in psoriasis and AIDS-associated psoriasiform dermatitis. J. Am. Acad. Dermatol. 33, 985-989 (1995).

143
81. L. J. Gomez-Sucerquia, A. Blas-Garcia, M. Marti-Cabrera, J. V. Esplugues, N. Apostolova, Profile of stress and toxicity gene expression in human hepatic cells treated with Efavirenz. Antiviral Res. 94, 232-241 (2012).
82. A. M. Chow, P. Mok, D. Xiao, S. Khalouei, I. R. Brown, Heteromeric complexes of heat shock protein 70 (HSP70) family members, including Hsp70B', in differentiated human neuronal cells. Cell Stress Chaperones. 15, 545-553 (2010).
83. E. J. Noonan, R. F. Place, R. J. Rasoulpour, C. Giardina, L. E. Hightower, Cell number-dependent regulation of Hsp70B' expression: evidence of an extracellular regulator. J. Cell. Physiol. 210, 201-211 (2007).
84. K. Wada, A. Taniguchi, L. Xu, T. Okano, Rapid and highly sensitive detection of cadmium chloride induced cytotoxicity using the HSP70B' promoter in live cells. Biotechnol. Bioeng. 92, 410-415 (2005).
85. K. Wada, A. Taniguchi, T. Okano, Highly sensitive detection of cytotoxicity using a modified HSP70B' promoter. Biotechnol. Bioeng. 97, 871-876 (2007).
86. S. Rohmer, A. Mainka, I. Knippertz, A. Hesse, D. M. Nettelbeck, Insulated hsp70B' promoter: stringent heat-inducible activity in replication-deficient, but not replication-competent adenoviruses. J. Gene Med. 10, 340-354 (2008).
87. J. Bowes, A. Barton, The genetics of psoriatic arthritis: lessons from genome-wide association studies Discov. Med. 10, 177-183 (2010).
88. K. Heyninck, M. M. Kreike, R. Beyaert, Structure-function analysis of the A20-binding inhibitor of NF-kappa B activation, ABIN-1 FEBS Lett. 536, 135-140 (2003).
89. S. Zhang et al., A new ERK2 binding protein, Naf1, attenuates the EGF/ERK2 nuclear signaling Biochem. Biophys. Res. Commun. 297, 17-23 (2002).
90. J. A. Callahan et al., Cutting edge: ABIN-1 protects against psoriasis by restricting MyD88 signals in dendritic cells. J. Immunol. 191, 535-539 (2013).
91. W. H. Boehncke, A. Dahlke, T. M. Zollner, W. Sterry, Differential expression of heat shock protein 70 (HSP70) and heat shock cognate protein 70 (HSC70) in human epidermis Arch. Dermatol. Res. 287, 68-71 (1994).
92. F. Trautinger, I. Trautinger, I. Kindas-Mugge, D. Metze, T. A. Luger, Human keratinocytes in vivo and in vitro constitutively express the 72-kD heat shock protein J. Invest. Dermatol. 101, 334-338 (1993).
93. M. M. Simon et al., Heat shock protein 70 overexpression affects the response to ultraviolet light in murine fibroblasts. Evidence for increased cell viability and suppression of cytokine release J. Clin. Invest. 95, 926-933 (1995).
94. M. Oberringer et al., Differential expression of heat shock protein 70 in well healing and chronic human wound tissue. Biochem. Biophys. Res. Commun. 214, 1009-1014 (1995).
95. P. Boukamp et al., Normal keratinization in a spontaneously immortalized aneuploid human keratinocyte cell line. J. Cell Biol. 106, 761-771 (1988).
96. V. P. Ramirez, B. J. Aneskievich, Transgene Delivery to Cultured Keratinocytes via Replication-Deficient Adenovirus Vectors. Methods Mol. Biol.(2013).
97. W. Huang da, B. T. Sherman, R. A. Lempicki, Systematic and integrative analysis of large gene lists using DAVID bioinformatics resources. Nat. Protoc. 4, 44-57 (2009).
98. W. Huang da, B. T. Sherman, R. A. Lempicki, Bioinformatics enrichment tools: paths toward the comprehensive functional analysis of large gene lists. Nucleic Acids Res. 37, 1-13 (2009).
99. F. Minner, Y. Poumay, Candidate housekeeping genes require evaluation before their selection for studies of human epidermal keratinocytes. J. Invest. Dermatol. 129, 770-773 (2009).
100. K. Heyninck et al., The zinc finger protein A20 inhibits TNF-induced NF-kappaB-dependent gene expression by interfering with an RIP- or TRAF2-mediated

144
transactivation signal and directly binds to a novel NF-kappaB-inhibiting protein ABIN J. Cell Biol. 145, 1471-1482 (1999).
101. S. H. Yuspa, A. E. Kilkenny, P. M. Steinert, D. R. Roop, Expression of murine epidermal differentiation markers is tightly regulated by restricted extracellular calcium concentrations in vitro. J. Cell Biol. 109, 1207-1217 (1989).
102. M. Akerfelt, R. I. Morimoto, L. Sistonen, Heat shock factors: integrators of cell stress, development and lifespan. Nat. Rev. Mol. Cell Biol. 11, 545-555 (2010).
103. H. Saibil, Chaperone machines for protein folding, unfolding and disaggregation. Nat. Rev. Mol. Cell Biol. 14, 630-642 (2013).
104. M. Daugaard, M. Rohde, M. Jaattela, The heat shock protein 70 family: Highly homologous proteins with overlapping and distinct functions. FEBS Lett. 581, 3702-3710 (2007).
105. S. Leppa, R. Kajanne, L. Arminen, L. Sistonen, Differential induction of Hsp70-encoding genes in human hematopoietic cells. J. Biol. Chem. 276, 31713-31719 (2001).
106. E. Noonan, C. Giardina, L. Hightower, Hsp70B' and Hsp72 form a complex in stressed human colon cells and each contributes to cytoprotection. Exp. Cell Res. 314, 2468-2476 (2008).
107. M. Matsuda et al., Prevention of UVB radiation-induced epidermal damage by expression of heat shock protein 70. J. Biol. Chem. 285, 5848-5858 (2010).
108. S. B. Kwon et al., Impaired repair ability of hsp70.1 KO mouse after UVB irradiation J. Dermatol. Sci. 28, 144-151 (2002).
109. A. Sandelin, W. W. Wasserman, Prediction of nuclear hormone receptor response elements. Mol. Endocrinol. 19, 595-606 (2005).
110. M. Podvinec, M. R. Kaufmann, C. Handschin, U. A. Meyer, NUBIScan, an in silico approach for prediction of nuclear receptor response elements. Mol. Endocrinol. 16, 1269-1279 (2002).
111. K. Cartharius et al., MatInspector and beyond: promoter analysis based on transcription factor binding sites. Bioinformatics. 21, 2933-2942 (2005).
112. T. K. Leung, M. Y. Rajendran, C. Monfries, C. Hall, L. Lim, The human heat-shock protein family. Expression of a novel heat-inducible HSP70 (HSP70B') and isolation of its cDNA and genomic DNA. Biochem. J. 267, 125-132 (1990).
113. K. D. Pruitt, T. Tatusova, D. R. Maglott, NCBI Reference Sequence (RefSeq): a curated non-redundant sequence database of genomes, transcripts and proteins. Nucleic Acids Res. 33, D501-4 (2005).
114. W. D. Morgan et al., Two transcriptional activators, CCAAT-box-binding transcription factor and heat shock transcription factor, interact with a human hsp70 gene promoter. Mol. Cell. Biol. 7, 1129-1138 (1987).
115. S. Khalouei, A. M. Chow, I. R. Brown, Stress-induced localization of HSPA6 (HSP70B') and HSPA1A (HSP70-1) proteins to centrioles in human neuronal cells. Cell Stress Chaperones.(2013).
116. E. Kolker et al., MOPED: Model Organism Protein Expression Database. Nucleic Acids Res. 40, D1093-9 (2012).
117. B. J. Wu, R. I. Morimoto, Transcription of the human hsp70 gene is induced by serum stimulation. Proc. Natl. Acad. Sci. U. S. A. 82, 6070-6074 (1985).
118. K. Zachova et al., Novel modification of growth medium enables efficient E. coli expression and simple purification of an endotoxin-free recombinant murine hsp70 protein. J. Microbiol. Biotechnol. 19, 727-733 (2009).
119. S. Qiao et al., Thiostrepton is an inducer of oxidative and proteotoxic stress that impairs viability of human melanoma cells but not primary melanocytes. Biochem. Pharmacol. 83, 1229-1240 (2012).

145
120. M. Sachdeva, Q. Liu, J. Cao, Z. Lu, Y. Y. Mo, Negative regulation of miR-145 by C/EBP-beta through the Akt pathway in cancer cells. Nucleic Acids Res. 40, 6683-6692 (2012).
121. D. Gokhman, I. Livyatan, B. S. Sailaja, S. Melcer, E. Meshorer, Multilayered chromatin analysis reveals E2f, Smad and Zfx as transcriptional regulators of histones. Nat. Struct. Mol. Biol. 20, 119-126 (2013).
122. C. P. Reina, B. Y. Nabet, P. D. Young, R. N. Pittman, Basal and stress-induced Hsp70 are modulated by ataxin-3. Cell Stress Chaperones. 17, 729-742 (2012).
123. S. Koizumi, K. Suzuki, S. Yamaguchi, Heavy metal response of the heat shock protein 70 gene is mediated by duplicated heat shock elements and heat shock factor 1. Gene. 522, 184-191 (2013).
124. G. T. Williams, R. I. Morimoto, Maximal stress-induced transcription from the human HSP70 promoter requires interactions with the basal promoter elements independent of rotational alignment. Mol. Cell. Biol. 10, 3125-3136 (1990).
125. M. Fujimoto et al., HSF4 is required for normal cell growth and differentiation during mouse lens development. EMBO J. 23, 4297-4306 (2004).
126. M. Fujimoto, A. Nakai, The heat shock factor family and adaptation to proteotoxic stress. FEBS J. 277, 4112-4125 (2010).
127. J. Xu, Y. Kawai, I. J. Arinze, Dual role of C/EBPalpha as an activator and repressor of Galphai2 gene transcription. Genes Cells. 18, 1082-1094 (2013).
128. Y. K. Kim et al., Deletion of the inducible 70-kDa heat shock protein genes in mice impairs cardiac contractile function and calcium handling associated with hypertrophy. Circulation. 113, 2589-2597 (2006).
129. I. Gurevich et al., PPARgamma and NF-kappaB regulate the gene promoter activity of their shared repressor, TNIP1 Biochim. Biophys. Acta. 1819, 1-15 (2011).
130. A. J. Parsian et al., The human Hsp70B gene at the HSPA7 locus of chromosome 1 is transcribed but non-functional. Biochim. Biophys. Acta. 1494, 201-205 (2000).
131. K. J. Smith et al., Heat shock protein 70B' (HSP70B') expression and release in response to human oxidized low density lipoprotein immune complexes in macrophages. J. Biol. Chem. 285, 15985-15993 (2010).
132. C. Zhang, I. Gurevich, B. J. Aneskievich, Organotypic modeling of human keratinocyte response to peroxisome proliferators. Cells Tissues Organs. 196, 431-441 (2012).