Embed Size (px)
Citation preview

Gene expression:Microarray data analysis
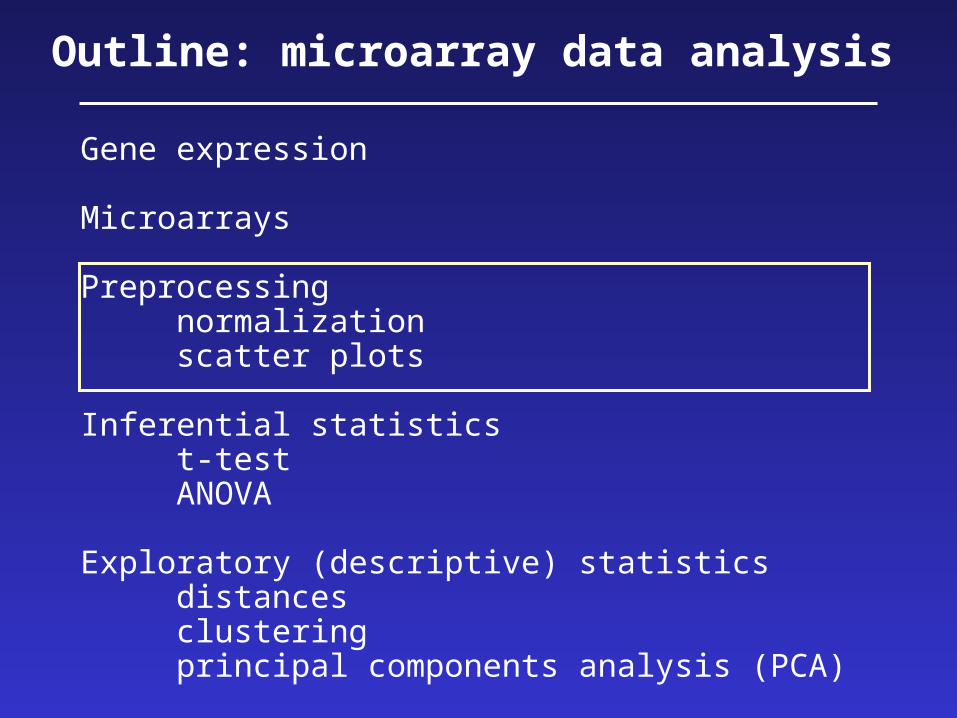
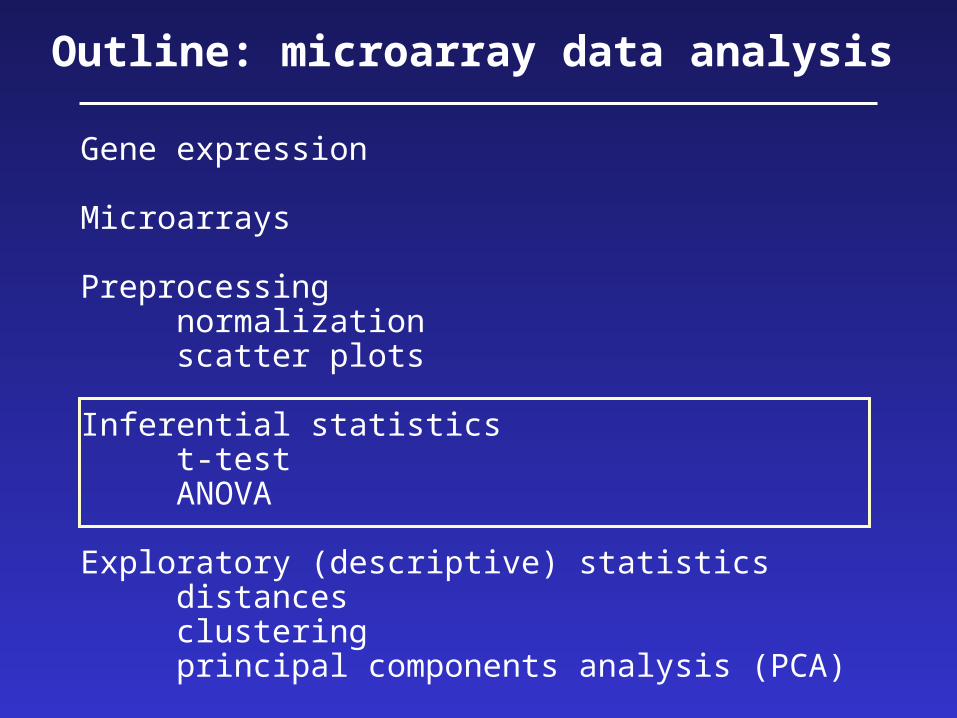
Outline: microarray data analysis
Gene expression
Microarrays
Preprocessingnormalizationscatter plots
Inferential statisticst-testANOVA
Exploratory (descriptive) statisticsdistancesclusteringprincipal components analysis (PCA)
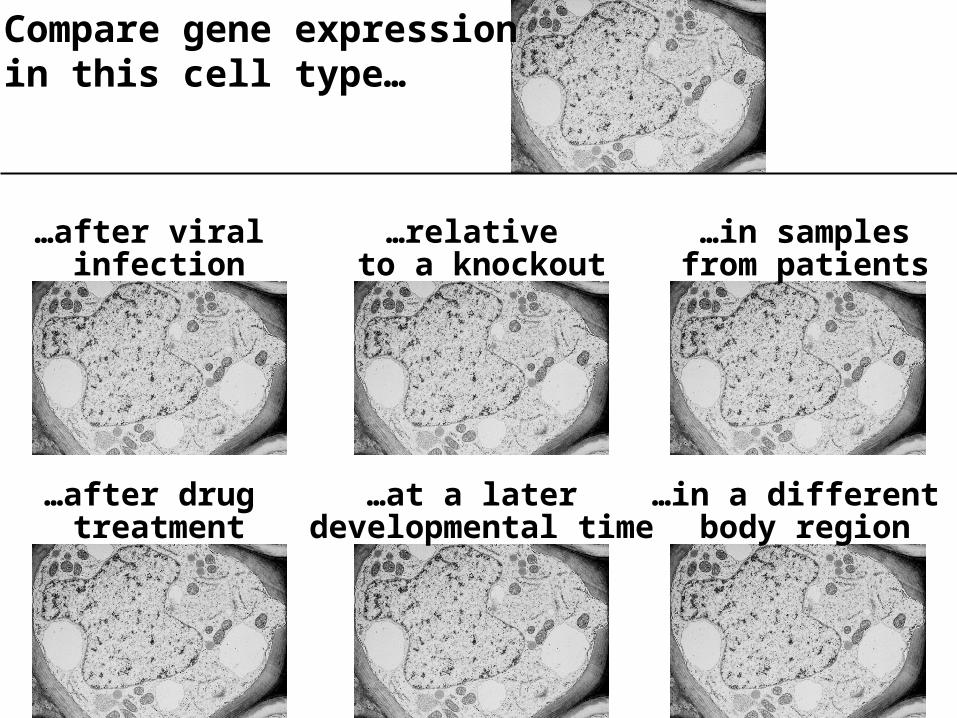
Compare gene expression in this cell type…
…after drug treatment
…at a later developmental time
…in a different body region
…after viral infection
…in samplesfrom patients
…relative to a knockout
• by region (e.g. brain versus kidney)
• in development (e.g. fetal versus adult tissue)
• in dynamic response to environmental signals
(e.g. immediate-early response genes)
• in disease states
• by gene activity
Gene expression is context-dependent,and is regulated in several basic ways
Page 157
UniGene: unique genes via ESTs
• Find UniGene at NCBI: www.ncbi.nlm.nih.gov/UniGene
• UniGene clusters contain many ESTs
• UniGene data come from many cDNA libraries. Thus, when you look up a gene in UniGene you get information on its abundance and its regional distribution.
Page 164
Outline: microarray data analysis
Gene expression
Microarrays
Preprocessingnormalizationscatter plots
Inferential statisticst-testANOVA
Exploratory (descriptive) statisticsdistancesclusteringprincipal components analysis (PCA)

Microarrays: tools for gene expression
A microarray is a solid support (such as a membraneor glass microscope slide) on which DNA of knownsequence is deposited in a grid-like array.
Page 173
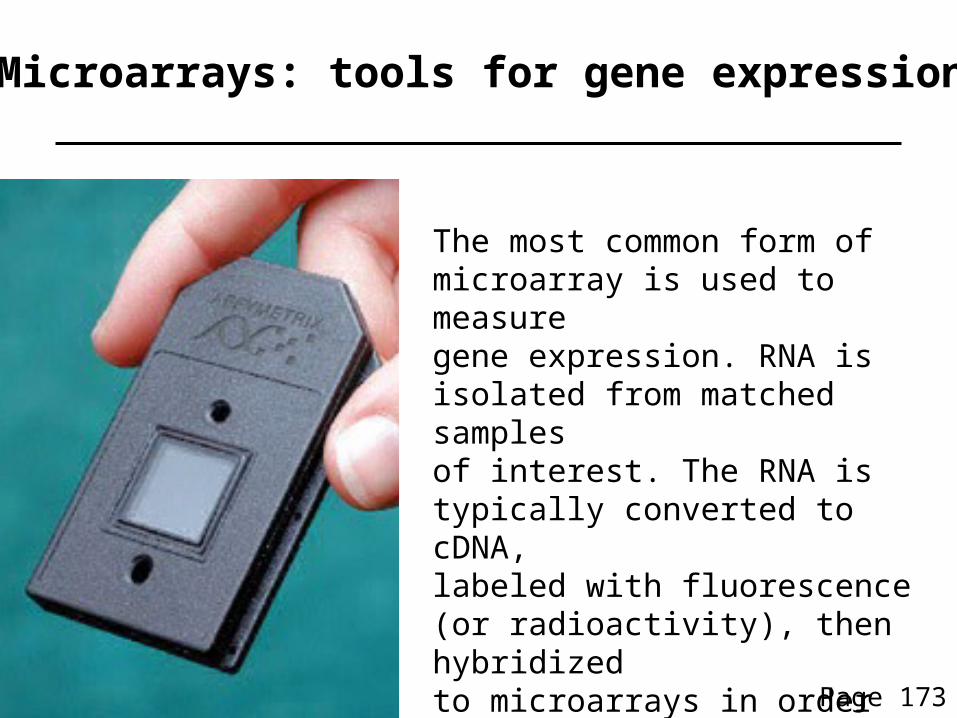
Microarrays: tools for gene expression
The most common form of microarray is used to measure gene expression. RNA is isolated from matched samples of interest. The RNA is typically converted to cDNA, labeled with fluorescence (or radioactivity), then hybridized to microarrays in order to measure the expression levelsof thousands of genes.
Page 173
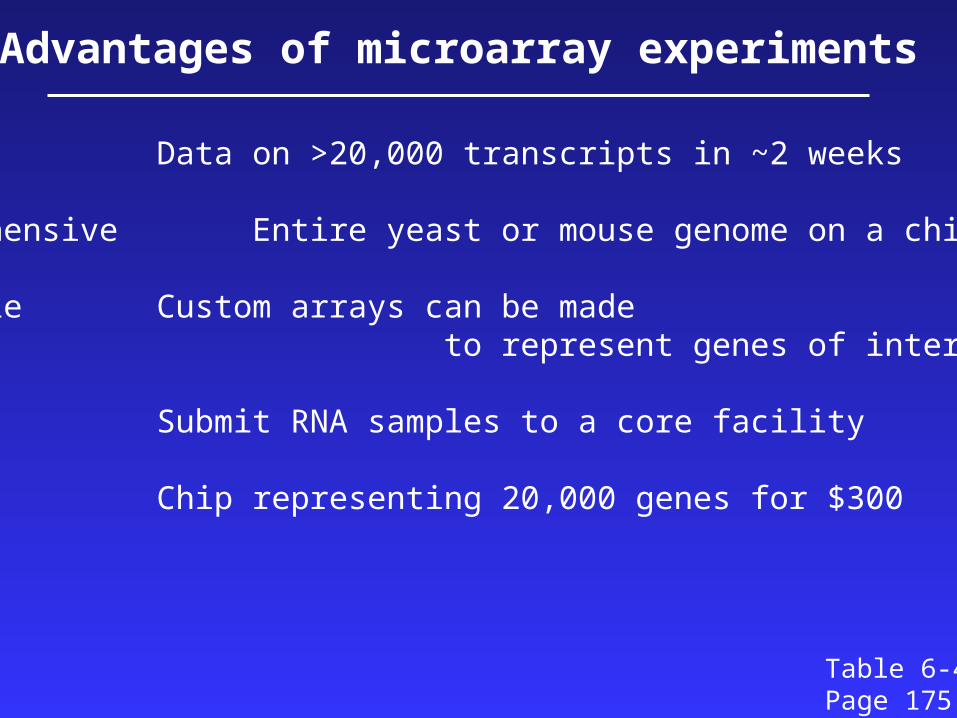
Fast Data on >20,000 transcripts in ~2 weeks
Comprehensive Entire yeast or mouse genome on a chip
Flexible Custom arrays can be made to represent genes of interest
Easy Submit RNA samples to a core facility
Cheap? Chip representing 20,000 genes for $300
Advantages of microarray experiments
Table 6-4Page 175
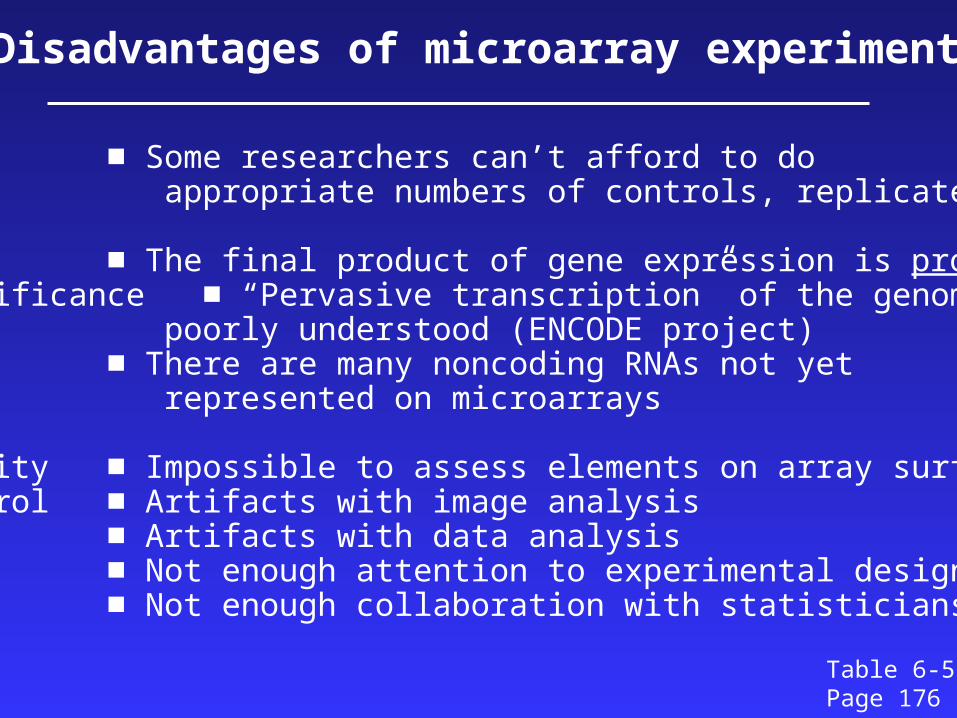
Cost ■ Some researchers can’t afford to do appropriate numbers of controls, replicates
RNA ■ The final product of gene expression is proteinsignificance ■ “Pervasive transcription” of the genome is
poorly understood (ENCODE project)■ There are many noncoding RNAs not yet represented on microarrays
Quality ■ Impossible to assess elements on array surfacecontrol ■ Artifacts with image analysis
■ Artifacts with data analysis■ Not enough attention to experimental design■ Not enough collaboration with statisticians
Disadvantages of microarray experiments
Table 6-5Page 176
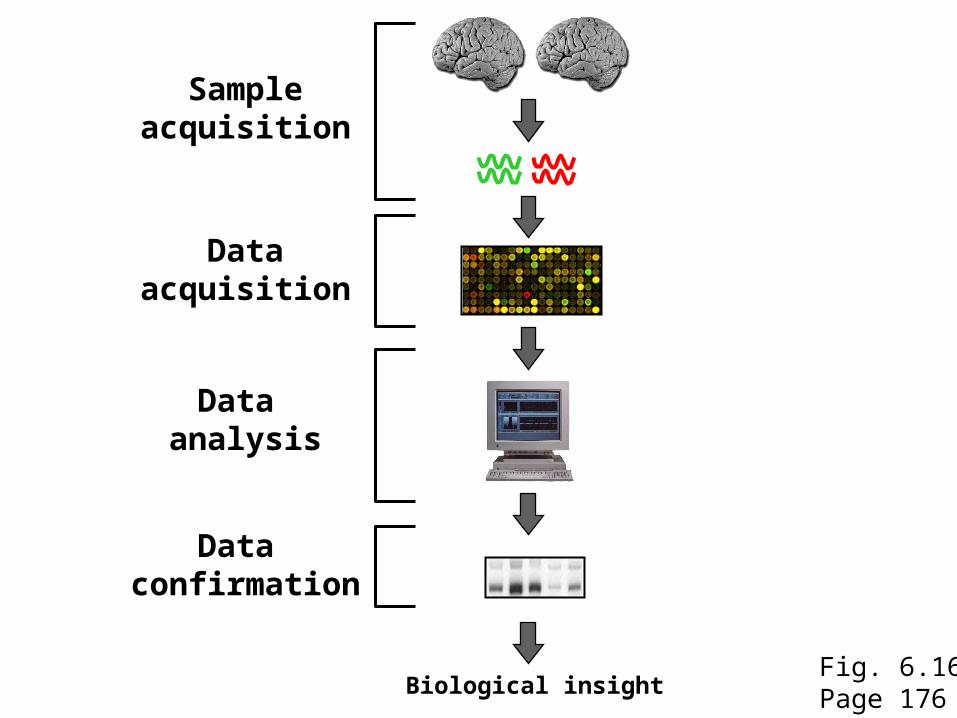
Biological insight
Sampleacquisition
Dataacquisition
Data analysis
Data confirmation
Fig. 6.16Page 176
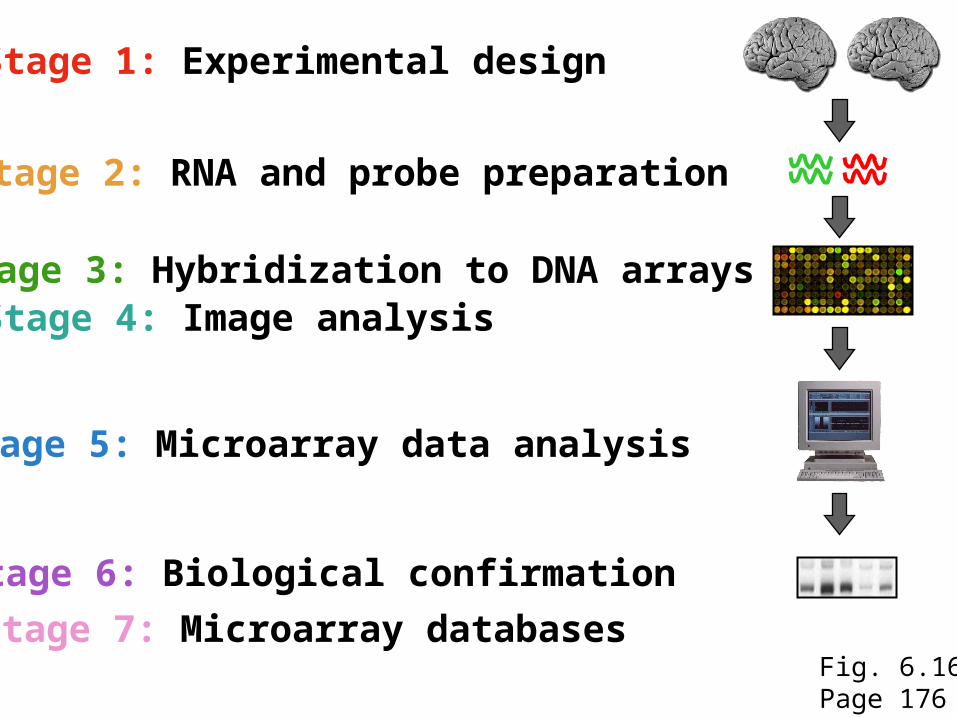
Fig. 6.16Page 176
Stage 1: Experimental design
Stage 3: Hybridization to DNA arrays
Stage 2: RNA and probe preparation
Stage 4: Image analysis
Stage 5: Microarray data analysis
Stage 6: Biological confirmation
Stage 7: Microarray databases
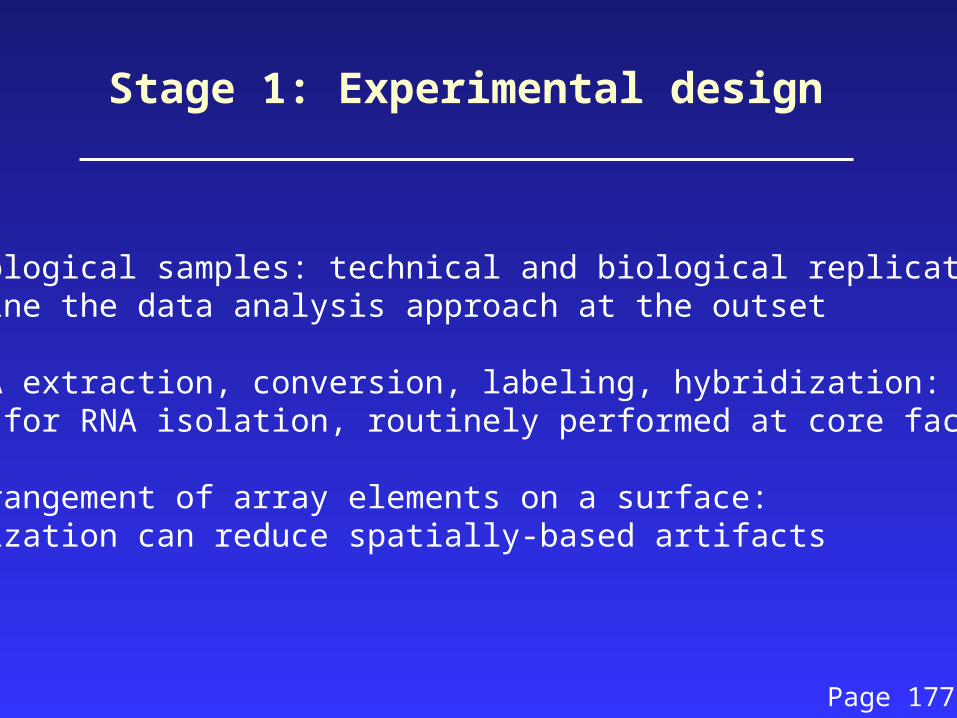
Stage 1: Experimental design
[1] Biological samples: technical and biological replicates:determine the data analysis approach at the outset
[2] RNA extraction, conversion, labeling, hybridization:except for RNA isolation, routinely performed at core facilities
[3] Arrangement of array elements on a surface:randomization can reduce spatially-based artifacts
Page 177
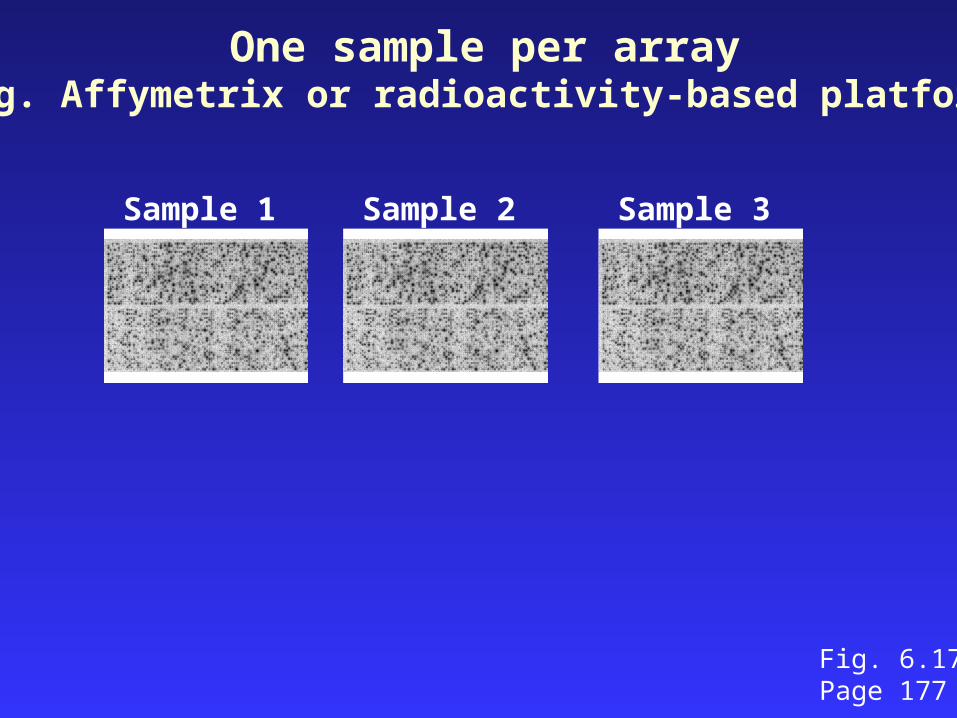
Sample 1 Sample 2 Sample 3
Fig. 6.17Page 177
One sample per array(e.g. Affymetrix or radioactivity-based platforms)
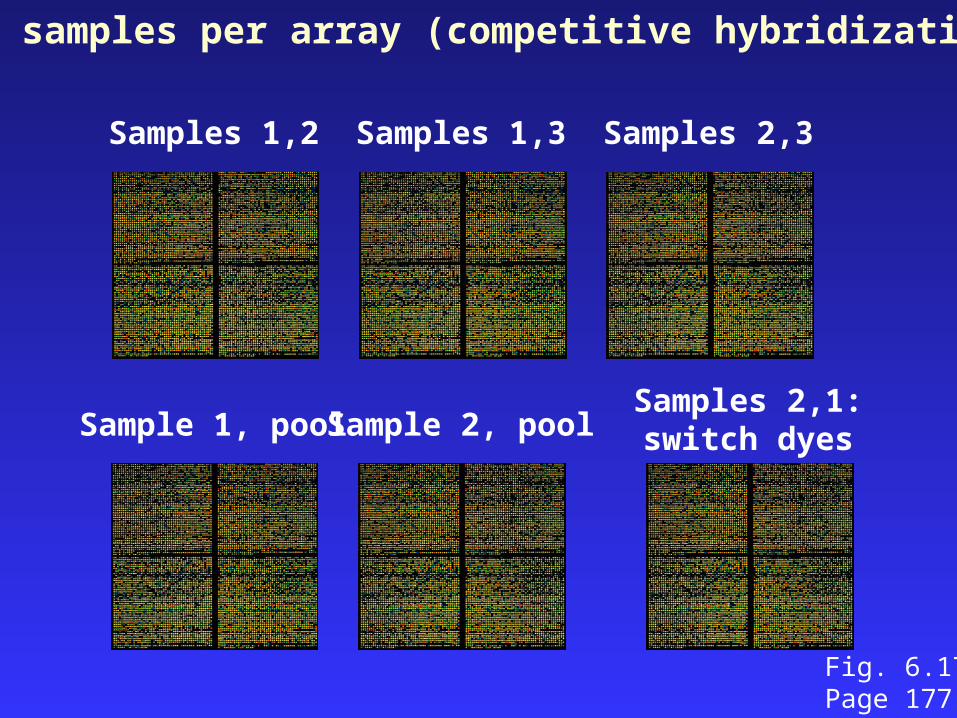
Samples 1,2 Samples 1,3 Samples 2,3
Sample 1, pool Sample 2, poolSamples 2,1:switch dyes
Fig. 6.17Page 177
Two samples per array (competitive hybridization)
Stage 2: RNA preparation
Page 178
For Affymetrix chips, need total RNA (about 5 ug)
Confirm purity by running agarose gel
Measure a260/a280 to confirm purity, quantity
One of the greatest sources of error in microarrayexperiments is artifacts associated with RNA isolation;be sure to create an appropriately balanced,randomized experimental design.
Stage 3: Hybridization to DNA arrays
Page 178-179
The array consists of cDNA or oligonucleotides
Oligonucleotides can be deposited by photolithography
The sample is converted to cRNA or cDNA
(Note that the terms “probe” and “target” may refer to theelement immobilized on the surface of the microarray, orto the labeled biological sample; for clarity, it may be simplest to avoid both terms.)
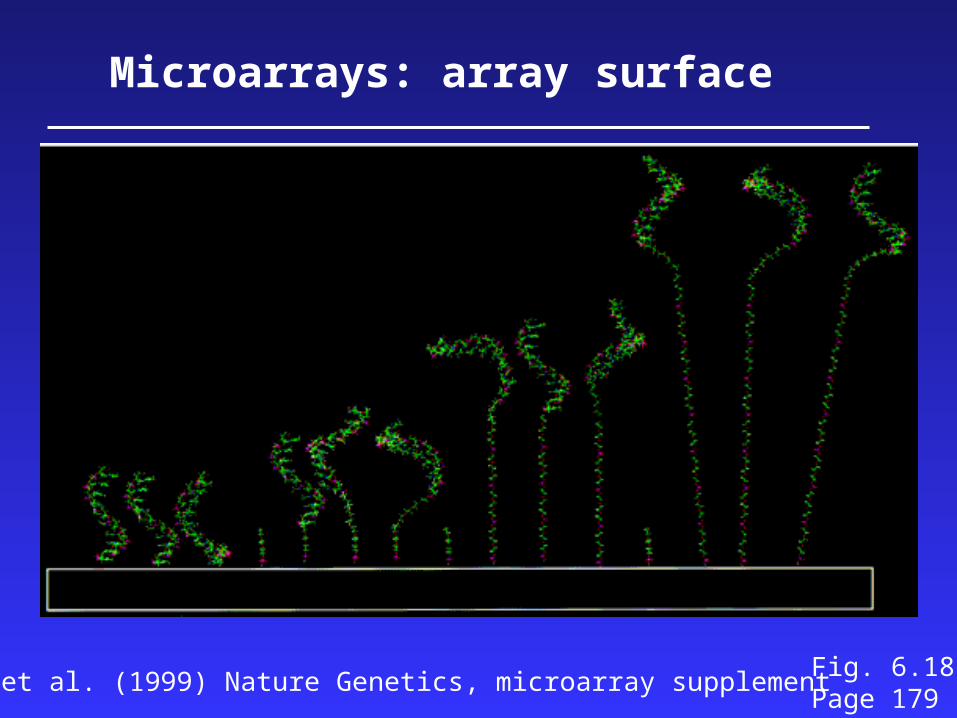
Microarrays: array surface
Fig. 6.18Page 179
Southern et al. (1999) Nature Genetics, microarray supplement
Stage 4: Image analysis
Page 180
RNA transcript levels are quantitated
Fluorescence intensity is measured with a scanner,or radioactivity with a phosphorimager
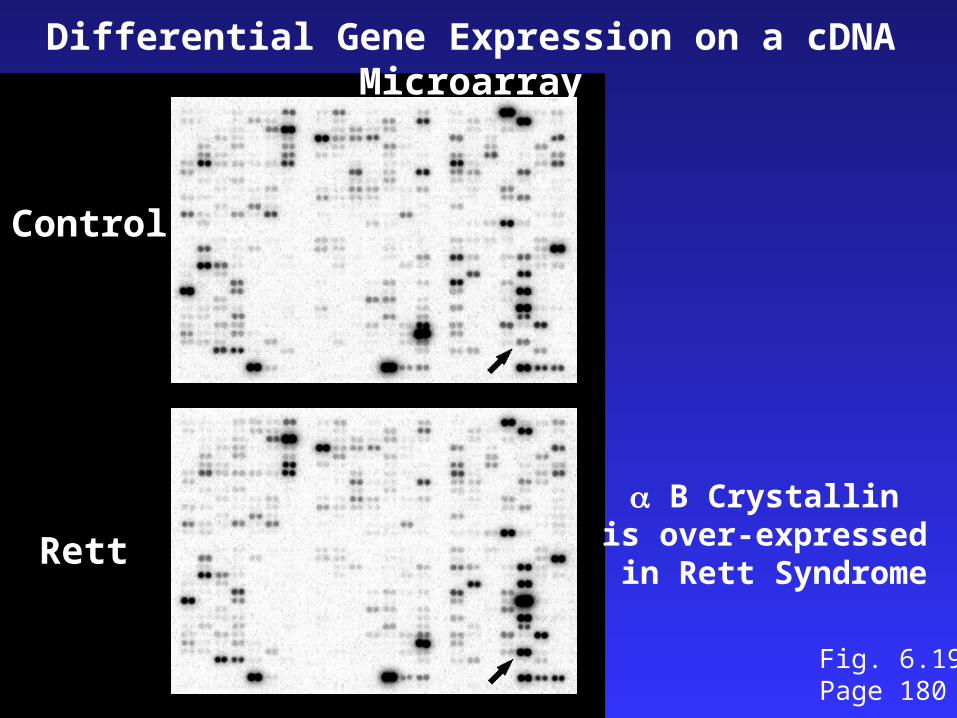
Rett
Control
Differential Gene Expression on a cDNA Microarray
B Crystallin is over-expressed in Rett Syndrome
Fig. 6.19Page 180

Fig. 6.20Page 181
Stage 5: Microarray data analysis
Page 180
Hypothesis testing • How can arrays be compared? • Which RNA transcripts (genes) are regulated?• Are differences authentic?• What are the criteria for statistical significance?
Clustering• Are there meaningful patterns in the data (e.g. groups)?
Classification• Do RNA transcripts predict predefined groups, such as disease subtypes?
Stage 6: Biological confirmation
Page 182
Microarray experiments can be thought of as“hypothesis-generating” experiments.
The differential up- or down-regulation of specific RNAtranscripts can be measured using independent assayssuch as
-- Northern blots-- polymerase chain reaction (RT-PCR)-- in situ hybridization
Stage 7: Microarray databases
Page 182
There are two main repositories:
Gene expression omnibus (GEO) at NCBI
ArrayExpress at the European Bioinformatics Institute (EBI)

MIAME
Page 182
In an effort to standardize microarray data presentationand analysis, Alvis Brazma and colleagues at 17institutions introduced Minimum Information About aMicroarray Experiment (MIAME). The MIAME framework standardizes six areas of information:
►experimental design►microarray design
►sample preparation ►hybridization procedures ►image analysis ►controls for normalization
Visit http://www.mged.org
Outline: microarray data analysis
Gene expression
Microarrays
Preprocessingnormalizationscatter plots
Inferential statisticst-testANOVA
Exploratory (descriptive) statisticsdistancesclusteringprincipal components analysis (PCA)
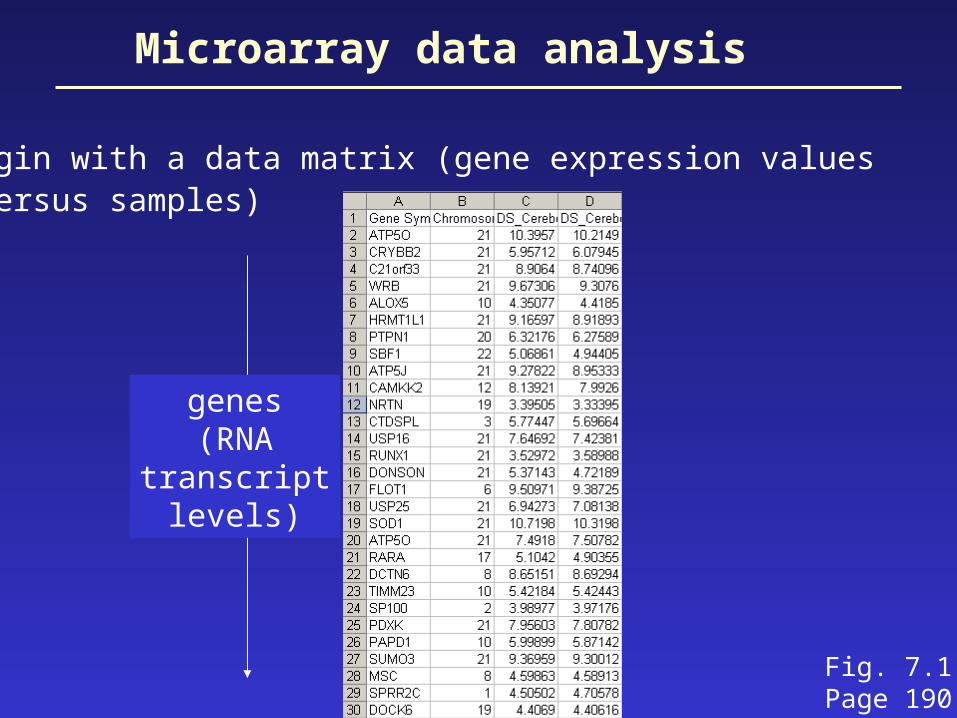
Microarray data analysis
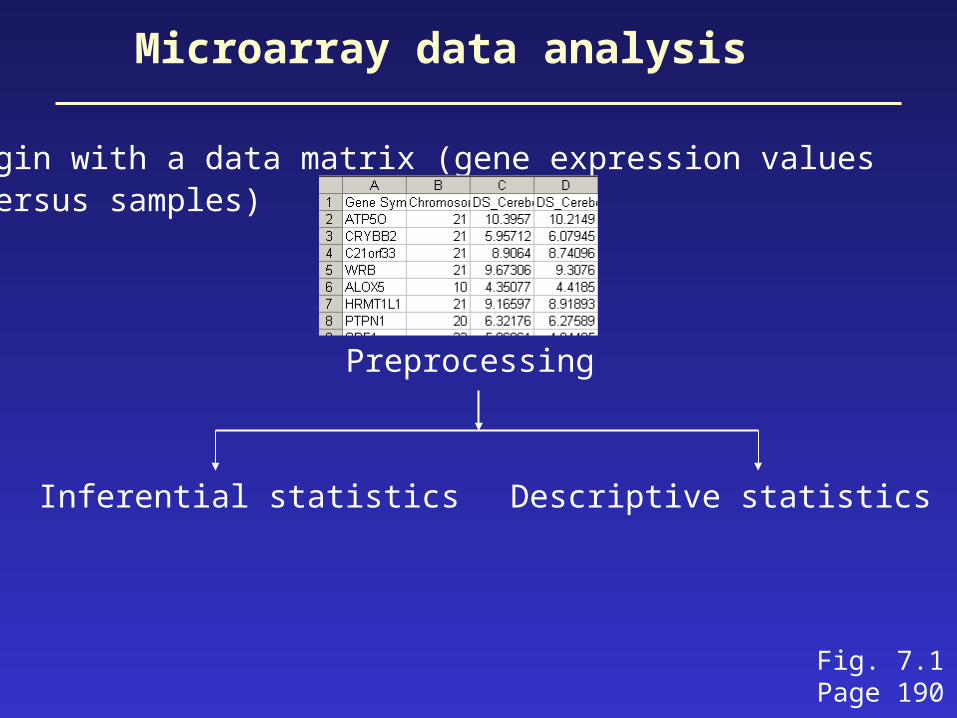
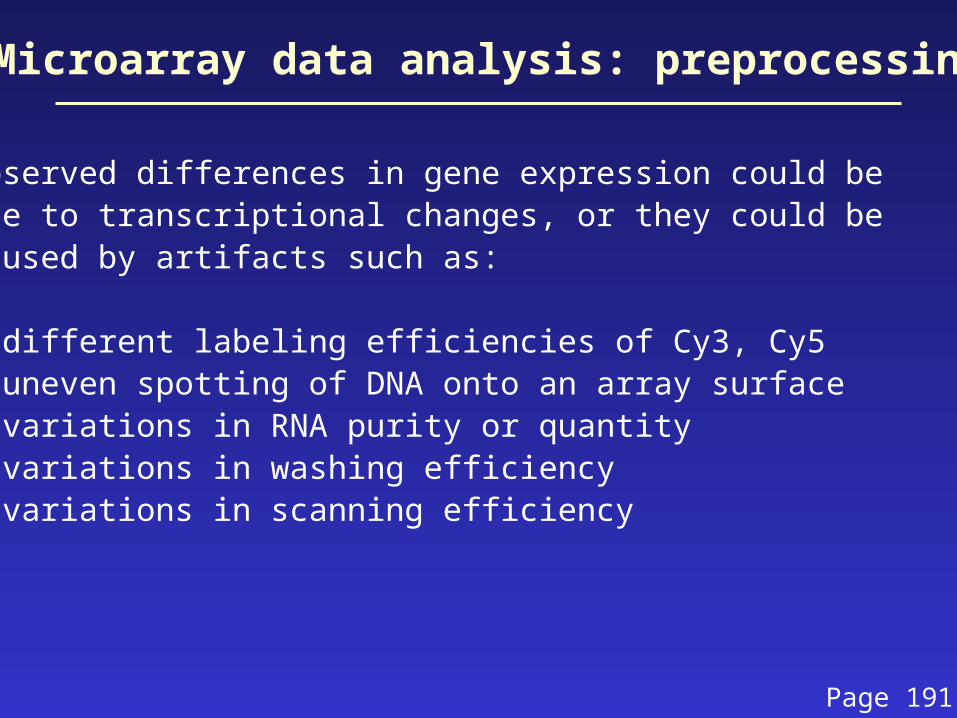
• begin with a data matrix (gene expression values versus samples)
Fig. 7.1Page 190
genes(RNA
transcriptlevels)
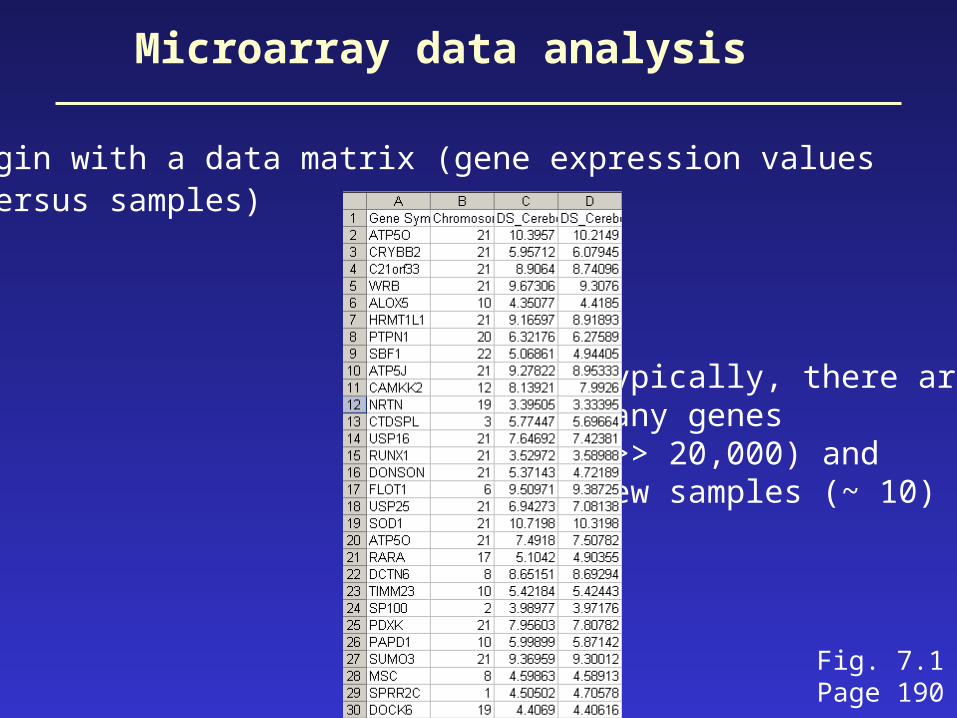
Microarray data analysis
• begin with a data matrix (gene expression values versus samples)
Typically, there aremany genes(>> 20,000) and few samples (~ 10)
Fig. 7.1Page 190
Microarray data analysis
• begin with a data matrix (gene expression values versus samples)
Preprocessing
Inferential statistics Descriptive statistics
Fig. 7.1Page 190
Microarray data analysis: preprocessing
Observed differences in gene expression could be due to transcriptional changes, or they could becaused by artifacts such as:
• different labeling efficiencies of Cy3, Cy5• uneven spotting of DNA onto an array surface• variations in RNA purity or quantity• variations in washing efficiency• variations in scanning efficiency
Page 191
Microarray data analysis: preprocessing
The main goal of data preprocessing is to removethe systematic bias in the data as completely aspossible, while preserving the variation in geneexpression that occurs because of biologicallyrelevant changes in transcription.
A basic assumption of most normalization proceduresis that the average gene expression level does notchange in an experiment.
Page 191

Data analysis: global normalization
Global normalization is used to correct two or moredata sets. In one common scenario, samples arelabeled with Cy3 (green dye) or Cy5 (red dye) andhybridized to DNA elements on a microrarray. Afterwashing, probes are excited with a laser and detectedwith a scanning confocal microscope.
Page 192
Data analysis: global normalization
Global normalization is used to correct two or moredata sets
Example: total fluorescence in Cy3 channel = 4 million unitsCy 5 channel = 2 million units
Then the uncorrected ratio for a gene could show2,000 units versus 1,000 units. This would artifactuallyappear to show 2-fold regulation.
Page 192
Data analysis: global normalization
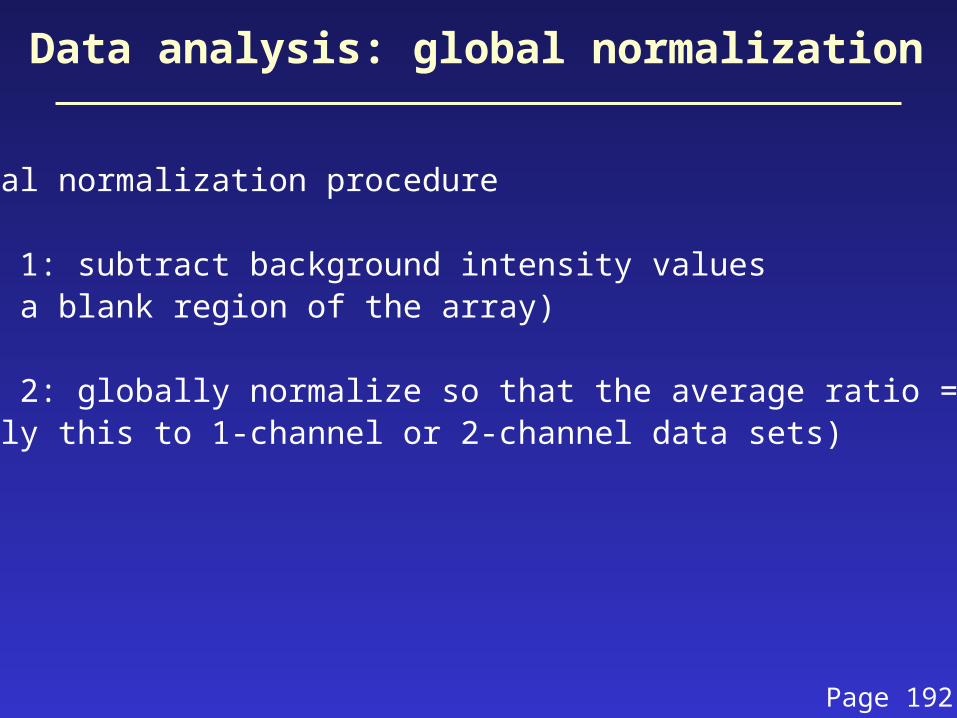
Global normalization procedure
Step 1: subtract background intensity values(use a blank region of the array)
Step 2: globally normalize so that the average ratio = 1(apply this to 1-channel or 2-channel data sets)
Page 192
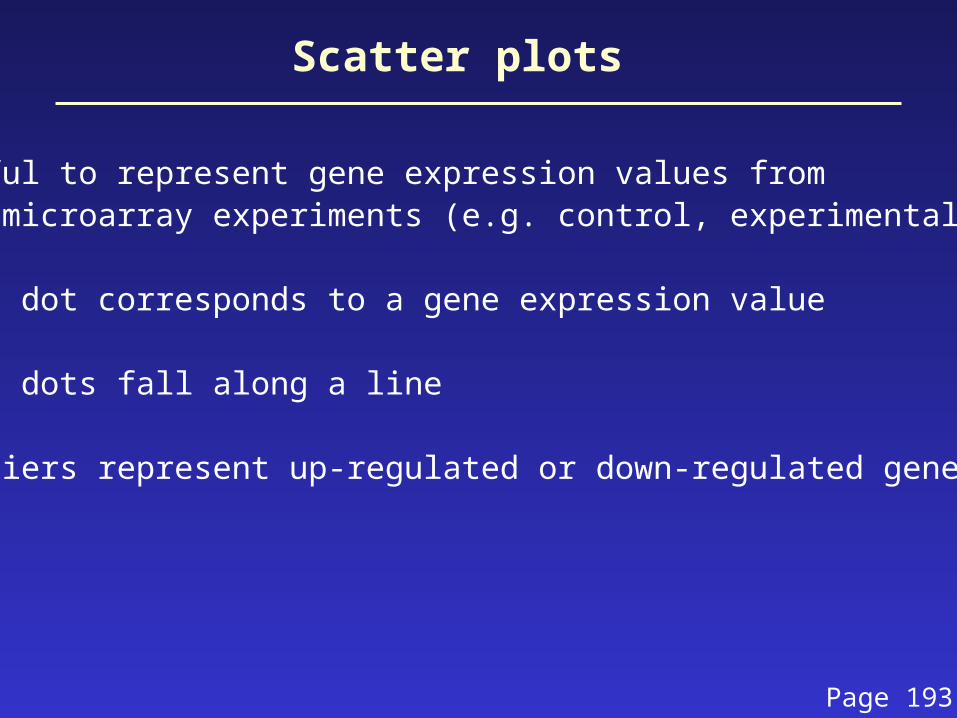
Scatter plots
Useful to represent gene expression values fromtwo microarray experiments (e.g. control, experimental)
Each dot corresponds to a gene expression value
Most dots fall along a line
Outliers represent up-regulated or down-regulated genes
Page 193
Outline: microarray data analysis
Gene expression
Microarrays
Preprocessingnormalizationscatter plots
Inferential statisticst-testANOVA
Exploratory (descriptive) statisticsdistancesclusteringprincipal components analysis (PCA)
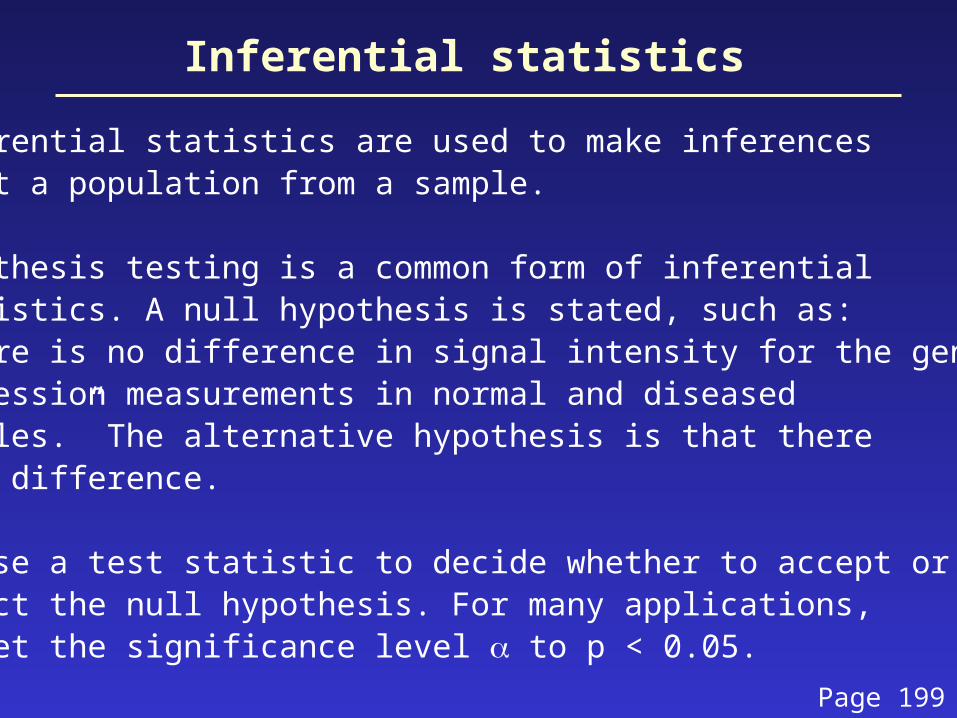
Inferential statistics
Inferential statistics are used to make inferencesabout a population from a sample.
Hypothesis testing is a common form of inferentialstatistics. A null hypothesis is stated, such as:“There is no difference in signal intensity for the geneexpression measurements in normal and diseasedsamples.” The alternative hypothesis is that thereis a difference.
We use a test statistic to decide whether to accept or reject the null hypothesis. For many applications, we set the significance level to p < 0.05.
Page 199
Inferential statistics
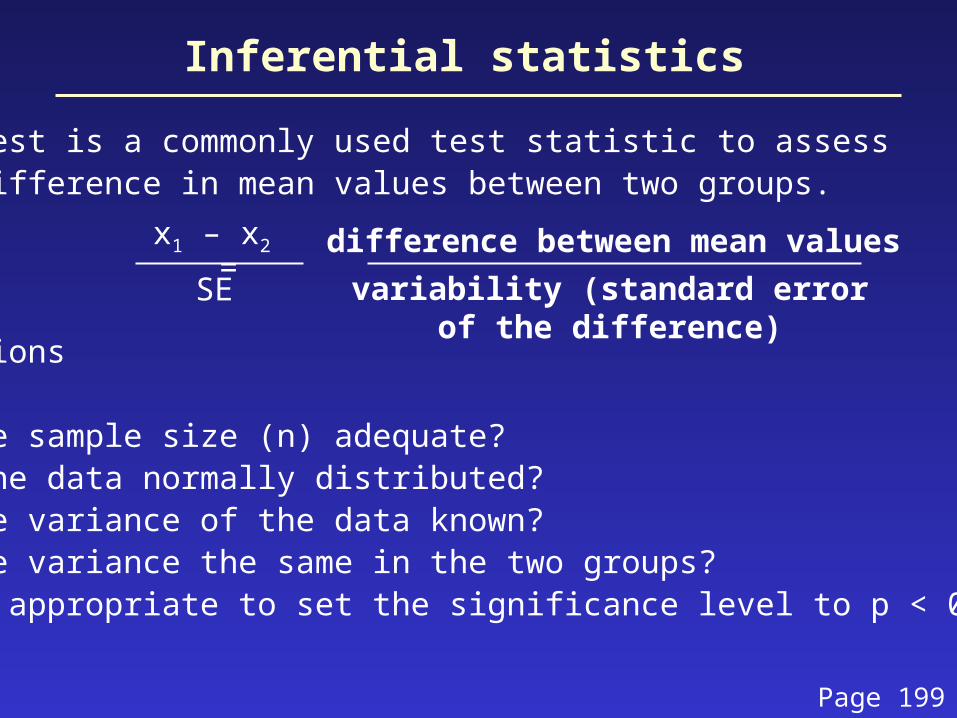
A t-test is a commonly used test statistic to assessthe difference in mean values between two groups.
t = =
Questions
Is the sample size (n) adequate?Are the data normally distributed?Is the variance of the data known?Is the variance the same in the two groups?Is it appropriate to set the significance level to p < 0.05?
Page 199
x1 – x2
SE
difference between mean values
variability (standard errorof the difference)
Inferential statistics
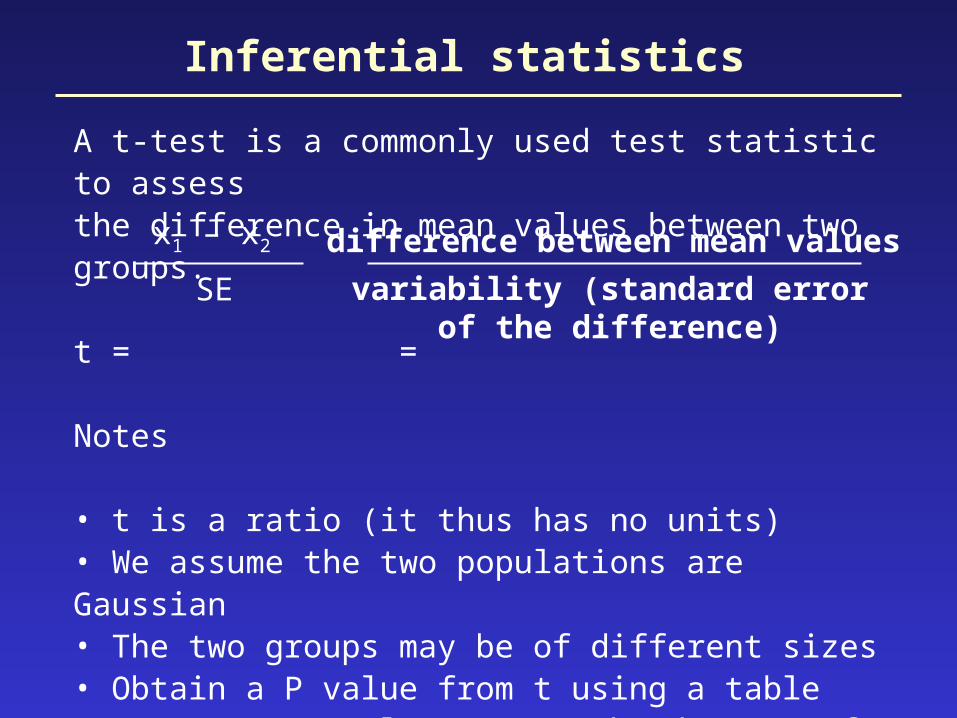
A t-test is a commonly used test statistic to assessthe difference in mean values between two groups.
t = =
Notes
• t is a ratio (it thus has no units)• We assume the two populations are Gaussian• The two groups may be of different sizes• Obtain a P value from t using a table• For a two-sample t test, the degrees of freedom is N -2.
For any value of t, P gets smaller as df gets larger
x1 – x2
SE
difference between mean values
variability (standard errorof the difference)
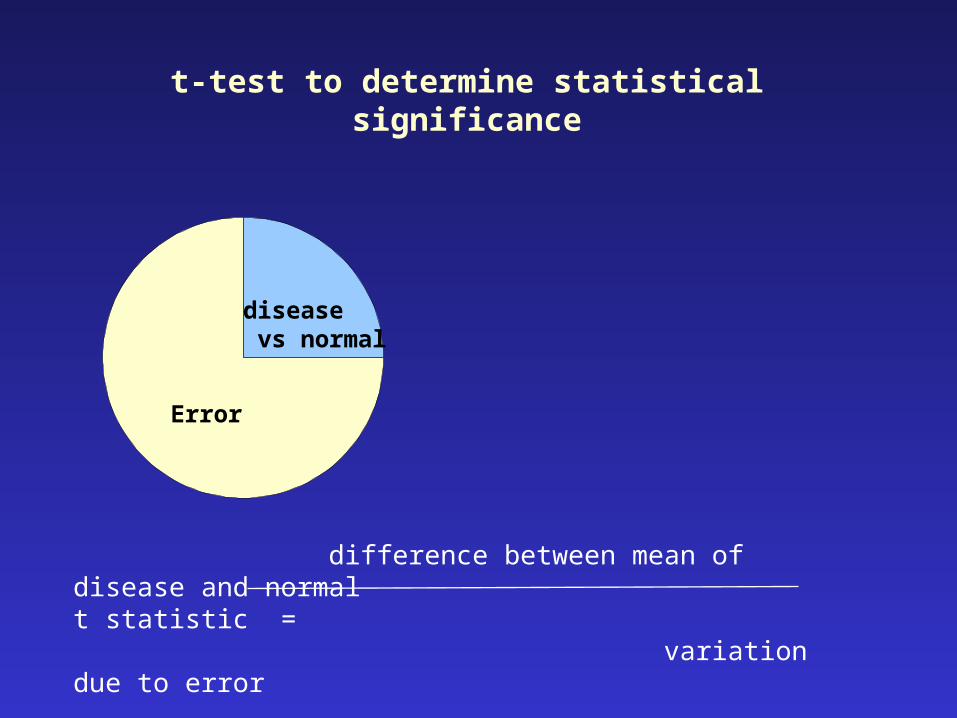
disease vs normal
Error
t-test to determine statistical significance
difference between mean of disease and normalt statistic = variation due to error
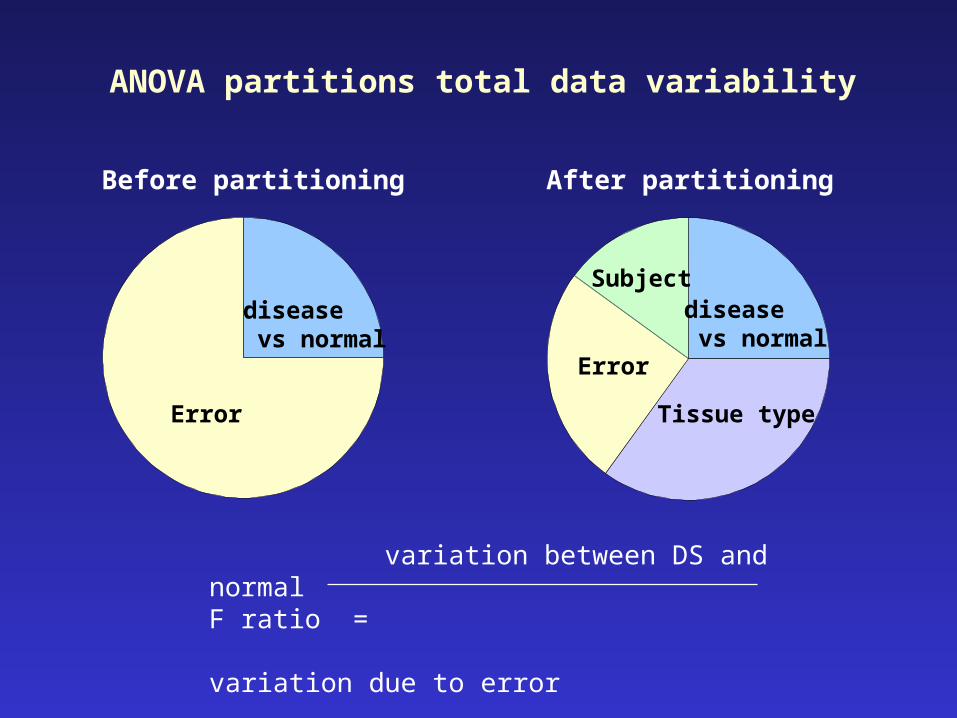
Error
Error
Tissue type
ANOVA partitions total data variability
variation between DS and normalF ratio = variation due to error
Before partitioning After partitioning
Subjectdisease vs normal
disease vs normal
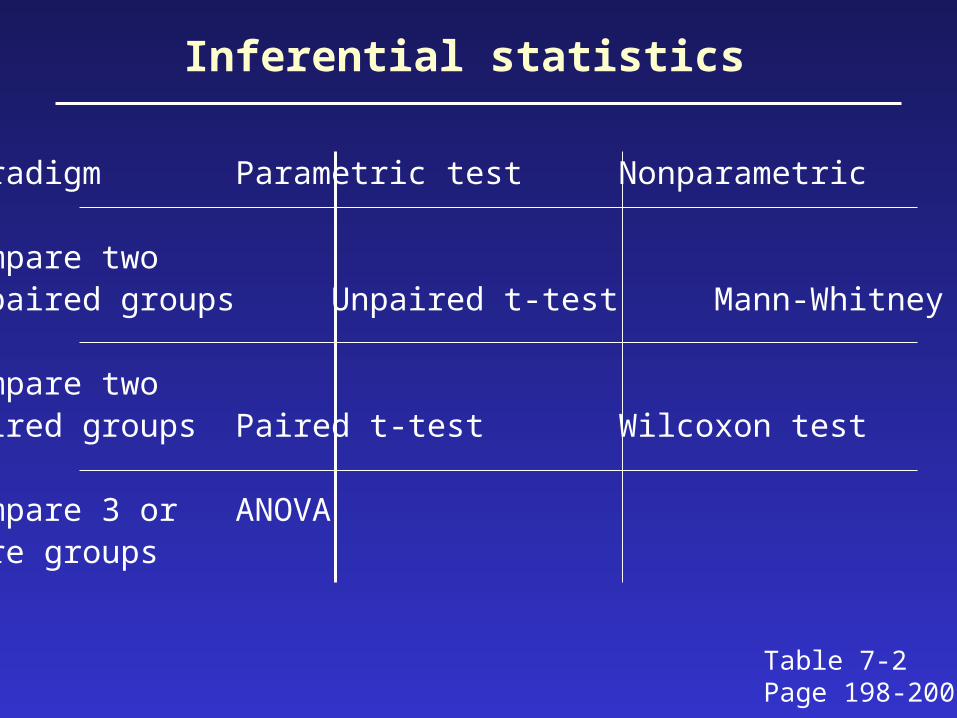
Inferential statistics
Paradigm Parametric test Nonparametric
Compare two unpaired groups Unpaired t-test Mann-Whitney test
Compare twopaired groups Paired t-test Wilcoxon test
Compare 3 or ANOVAmore groups
Table 7-2Page 198-200
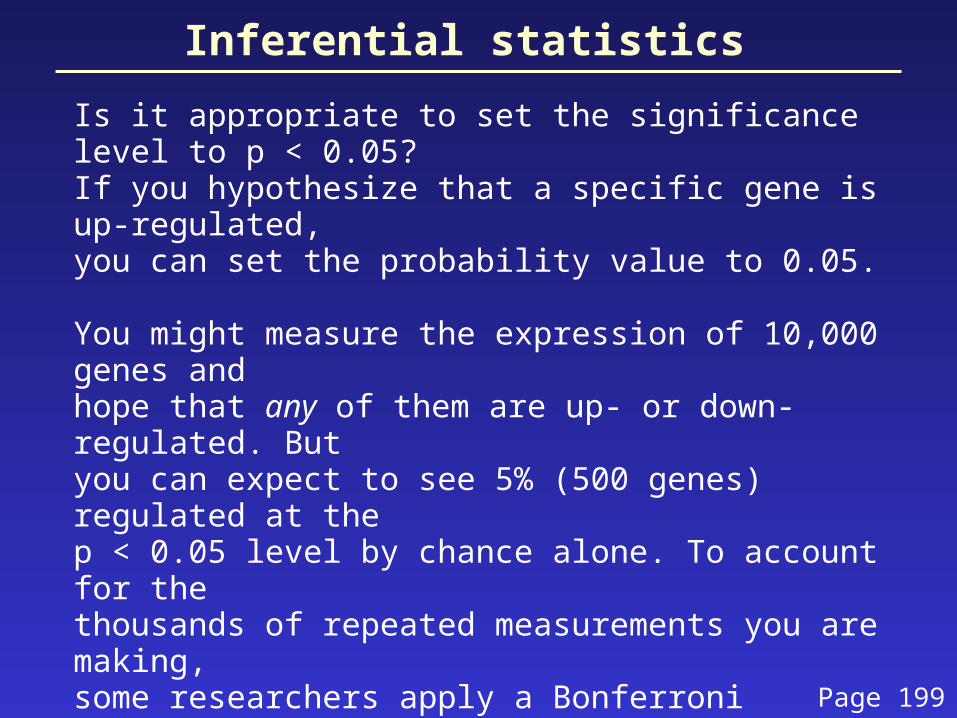
Inferential statistics
Is it appropriate to set the significance level to p < 0.05?If you hypothesize that a specific gene is up-regulated,you can set the probability value to 0.05.
You might measure the expression of 10,000 genes andhope that any of them are up- or down-regulated. Butyou can expect to see 5% (500 genes) regulated at thep < 0.05 level by chance alone. To account for thethousands of repeated measurements you are making,some researchers apply a Bonferroni correction.The level for statistical significance is divided by thenumber of measurements, e.g. the criterion becomes:
p < (0.05)/10,000 or p < 5 x 10⁻⁶
The Bonferroni correction is generally considered to be too conservative. Page 199
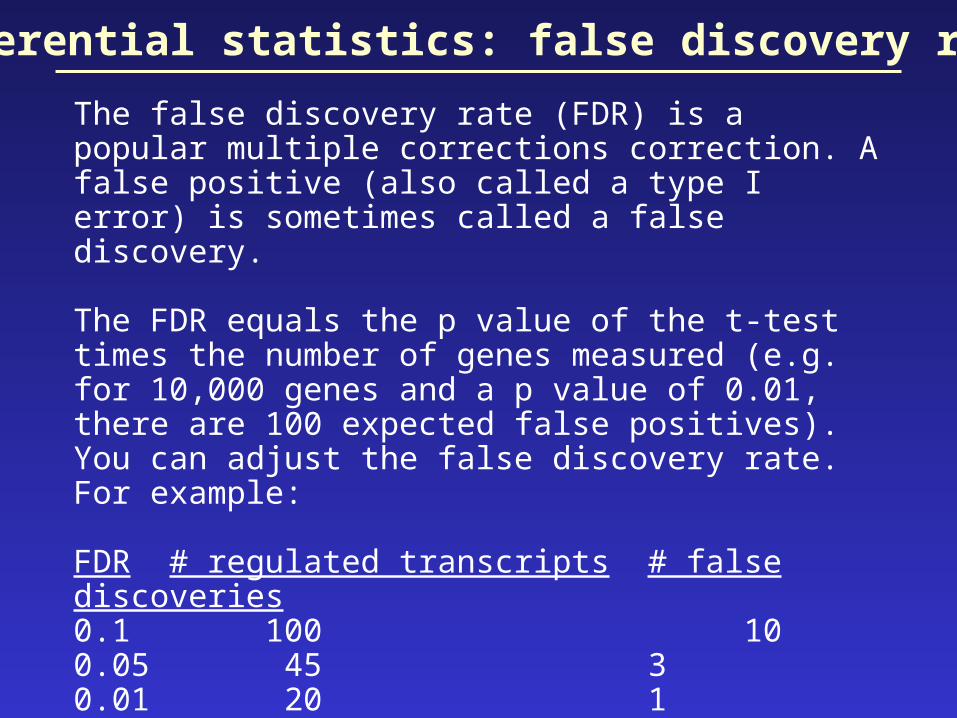
Inferential statistics: false discovery rate
The false discovery rate (FDR) is a popular multiple corrections correction. A false positive (also called a type I error) is sometimes called a false discovery.
The FDR equals the p value of the t-test times the number of genes measured (e.g. for 10,000 genes and a p value of 0.01, there are 100 expected false positives).You can adjust the false discovery rate. For example:
FDR # regulated transcripts # false discoveries0.1 100 100.05 45 30.01 20 1
Would you report 100 regulated transcripts of which 10 are likely to be false positives, or 20 transcripts of which one is likely to be a false positive?