Embed Size (px)
Citation preview

Gene expression and DNA microarrays
• Old methods.• New methods based on genome sequence.
– DNA Microarrays
• Reading assignment - handout – Chapter 4 - 195-232, 239-250, 255 MIAME– Box 4.1, 4.2 (Significance test only), 4.3, and
4.4.

Genome of the week
• E. coli O157:H7.– Comparison to the laboratory strain of E. coli.
• Causes haemorrhagic colitis – Initially identified in 1982 during an outbreak of severe
bloody diarrhea.– Linked to contaminated ground beef from Michigan– Can be lethal
• 75,000 cases per year

• Major findings:– Comparison of E. coli O157:H7 with E. coli K-12 (common lab strain) found that
the O157:H7 genome is ~ 1Mb larger than K-12 and contains 1,387 genes specific for O157:H7.
– Genomes share a 4.1 Mb backbone with species specific DNA interspersed throughout the genome
• K-islands - specific to K-12 (0.53Mb)• O-islands - specific
– Lateral transfer of DNA occurs much more frequently than previously thought. Especially high for enterobacteria.
• O-island specific DNA encoded genes required for virulence and a large number of phage and phage associated genes.
• Five sequences of E. coli - 4 pathogens and 1 lab strain.– Pathogens are as different from each other as they are from the non-pathogenic lab
strain.

Gene expression• What is gene expression?• Methods for measuring a single gene.
– Northern Blots– Reporter genes– Quantitative RT-PCR
• Operons, regulons, and stimulons.• DNA microarrays.
– Expression profiling– Identifying protein binding sites.– Comparing gene content of different strains.

What is gene expression?
• The amount of RNA produced from a gene.• Level of RNA produced from a gene is controlled by:
– Transcription– Stability/Degradation
• Transcriptome - Expressed transcripts in a cell under defined experimental conditions.– mRNA(5-10% of total RNA).– rRNA, tRNA - make up most of total RNA– scRNA (protein secretion), tmRNA (rescue stalled
ribosomes).

Regulons and Stimulons
• Operon - group of genes co-expressed on a single transcript.– One location of the genome
• Regulon - genes that are regulated by a single transcription factor.– Genes and operons throughout the genome
• Stimulon - collection of genes that are regulated in response to environmental changes.– Can be multiple regulons affected at once.
• Regulatory network - alternative term for regulon.

Analysis of gene expression at the single gene level.
• Northern Blots– Measure RNA levels by hybridization of a
labeled probe to total RNA.
• Reporter Genes– Use of an enzyme to measure the amount of
transcription from a promoter.
• Quantitative real-time RT-PCR.• Brief review in book.

Quantitative real time RT-PCR

Challenges Facing Genomics Challenges Facing Genomics D
epth
of
know
ledg
e
Breadth of knowledge
Detailed analysis of single gene
Genome sequencing
New tools in genomics:
microarrays and proteomics

Assaying the regulation of 1000s of genes in a single experiment
• DNA microarrays– DNA molecules printed at high density used to
determine the level of RNA or DNA in a sample.
– Can be thought of a “reverse Northern blots”
• Other technologies (described in chapter 4).– SAGE– Microbeads

DNA Microarrays -Introduction• Spotted DNA arrays (glass slides)
– Competitive binding of samples - internal control– Fluorescent detection - Cy3 and Cy5– Small sample sizes (10-30µl).– PCR or cDNA arrays - double stranded– Long oligonucleotide arrays - single stranded
• Better specificity, cheaper, easier to work with.
• Short oligonucleotide arrays– ex. Affymetrix
• DNA spotted onto nylon membranes (macroarrays)

Applications of DNA microarrays
• Expression profiling– Determining the relative levels of RNA in two or more
samples.
• DNA/DNA hybridizations– Investigate gene content between different strains– Determine gene dosage – 16S arrays - microbial communities (being developed).
• Identification of protein binding sites– ChIP-Chip. Immunoprecipitation of protein/DNA
complexes. Assaying those interactions with microarrays.

Uses of DNA microarrays• Detection of candidate genes
– Expression profiling– DNA/DNA hybridizations
• Annotation of gene function– Expression - compendium approach
• Defining regulatory networks– Expression profiling– ChIP/chip experiments
• Molecular phenotyping– Expression profiling– DNA/DNA hybridizations

Grow cells
Isolate RNAMake labeled cDNA
Mix and hybridize
Scan slideAnalyze data
Microarray experimental overview37C 25C
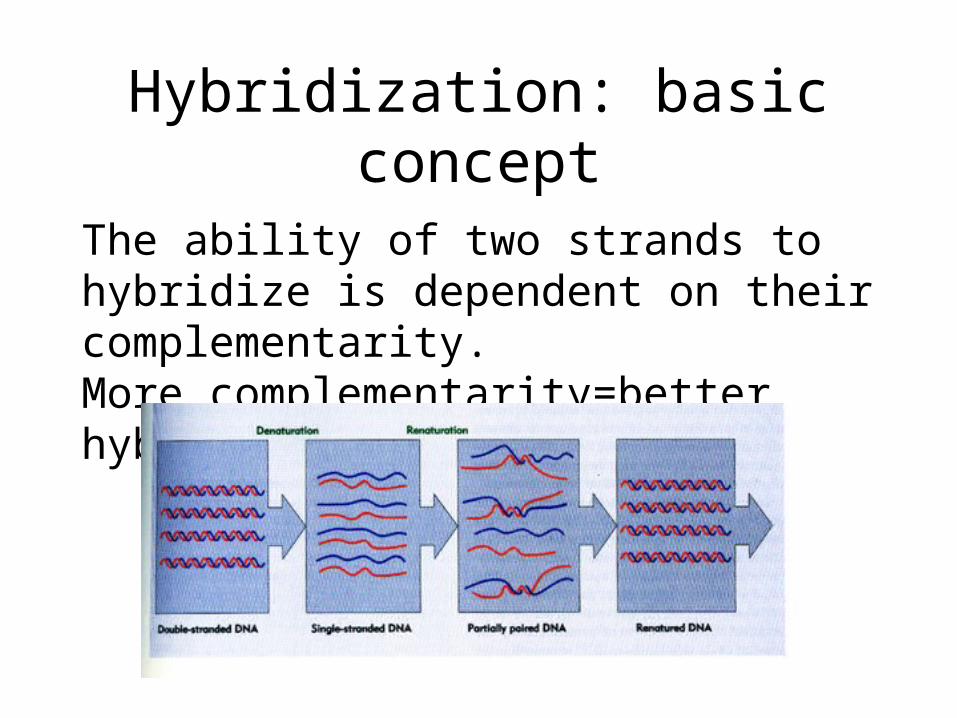
Hybridization: basic concept
The ability of two strands to hybridize is dependent on their complementarity.More complementarity=better hybridization

Bacterial DNA microarrays
• Small genome size
• Fully sequenced genomes, well annotated
• Ease of producing biological replicates
• Genetics
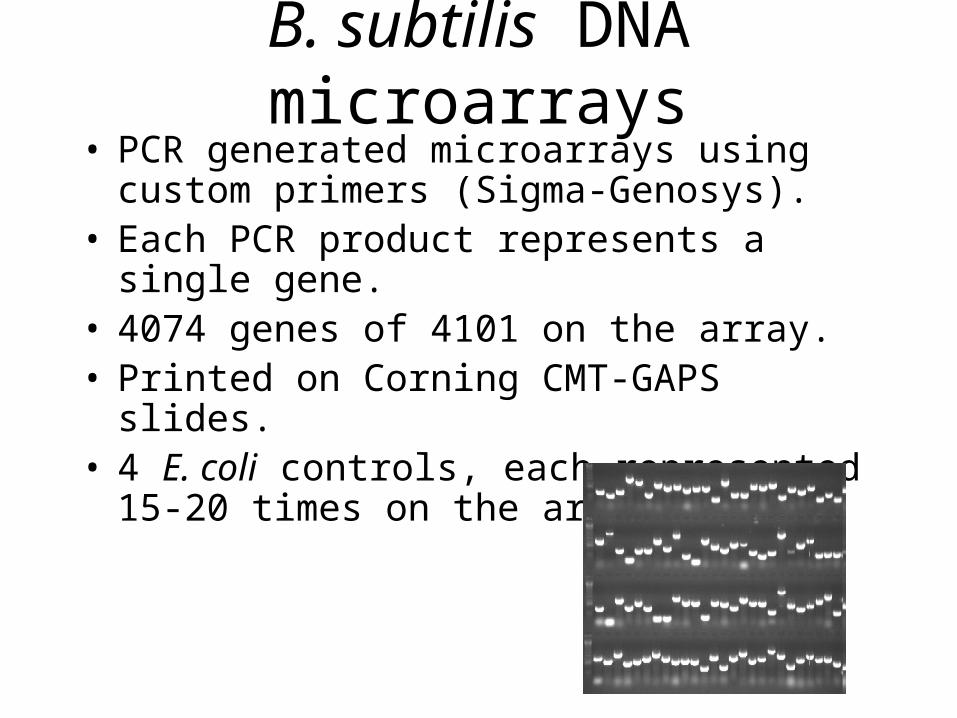
B. subtilis DNA microarrays• PCR generated microarrays using custom primers
(Sigma-Genosys).• Each PCR product represents a single gene.• 4074 genes of 4101 on the array.• Printed on Corning CMT-GAPS slides.• 4 E. coli controls, each represented 15-20 times on
the array.

How a DNA microarray works
• Comparing the genome content of two B. subtilis strains.
• The two strains differ only by the fact that JH642 is lysogenized with the bacteriophage SP
• JH642 vs PY79 genomic DNA hybridization.– PY79 does not contain SP.– SP spots will be red.

JH642
PY79
Array size = 16mm x16mmSpot size = 150M

SP genes E. coli controlJH642
PY79