Embed Size (px)
Citation preview

Gene Annotation and GO
SPH 247
Statistical Analysis of
Laboratory Data
May 5, 2015 SPH 247 Statistical Analysis of Laboratory Data
1

May 5, 2015
Slide Sources
• www.geneontology.org• Jane Lomax (EBI)• David Hill (MGI)• Pascale Gaudet (dictyBase)• Stacia Engel (SGD)• Rama Balakrishnan (SGD)
SPH 247 Statistical Analysis of Laboratory Data
2

May 5, 2015
A Common Language for Annotation of Genes from
Yeast, Flies and Mice
The Gene Ontologies
…and Plants and Worms
…and Humans
…and anything else!SPH 247 Statistical Analysis of
Laboratory Data3

May 5, 2015
Gene Ontology Objectives• GO represents categories used to classify
specific parts of our biological knowledge:– Biological Process– Molecular Function– Cellular Component
• GO develops a common language applicable to any organism
• GO terms can be used to annotate gene products from any species, allowing comparison of information across species
SPH 247 Statistical Analysis of Laboratory Data
4
Expansion of Sequence Info
May 5, 2015 SPH 247 Statistical Analysis of Laboratory Data
5
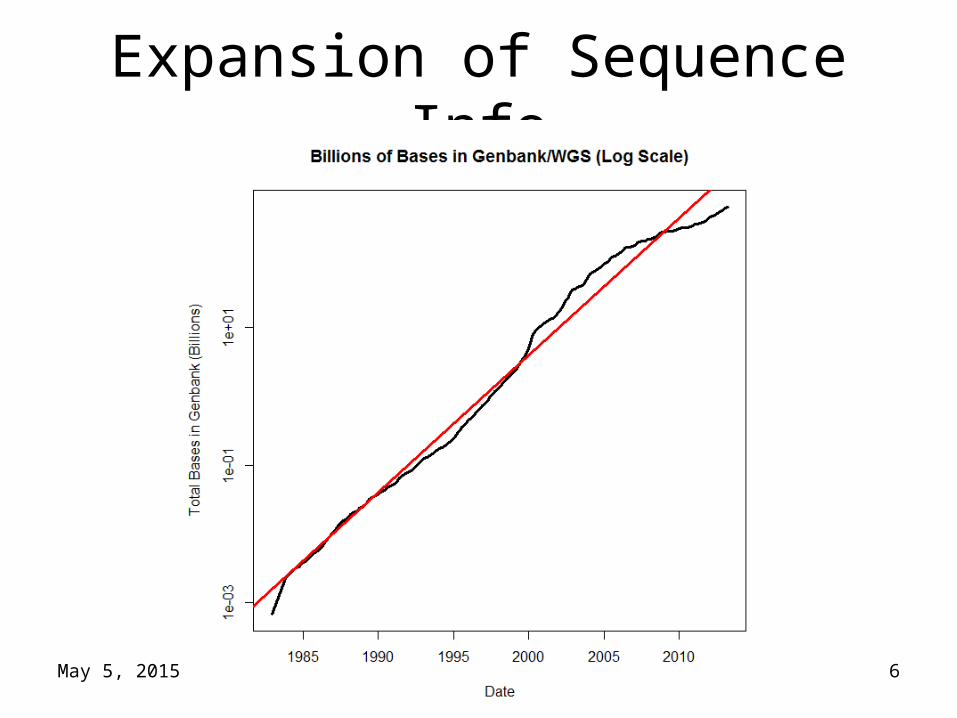
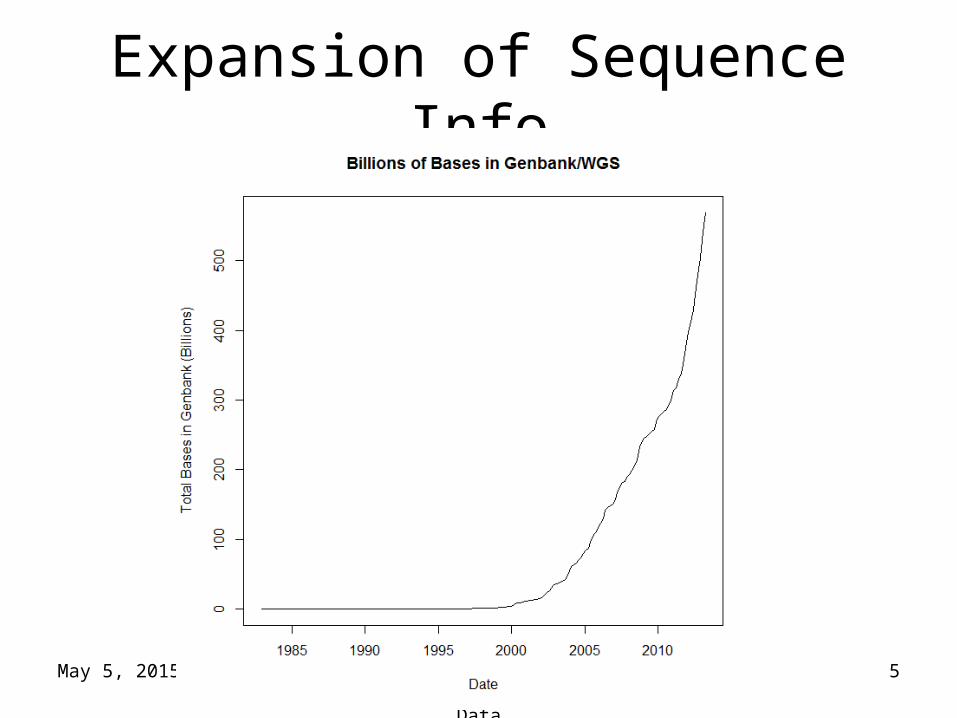
Expansion of Sequence Info
May 5, 2015 SPH 247 Statistical Analysis of Laboratory Data
6
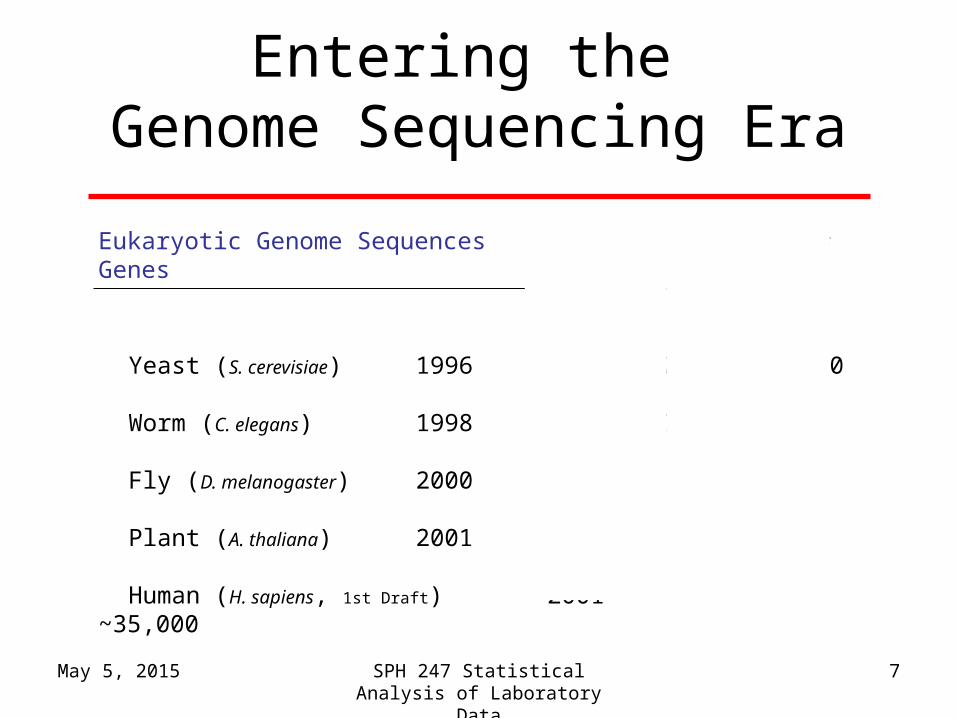
May 5, 2015
Eukaryotic Genome Sequences Year Genome # GenesSize (Mb)
Yeast (S. cerevisiae) 1996 12 6,000
Worm (C. elegans) 1998 97 19,100
Fly (D. melanogaster) 2000 120 13,600
Plant (A. thaliana) 2001 125 25,500
Human (H. sapiens, 1st Draft) 2001 ~3000 ~35,000
Entering the Genome Sequencing Era
SPH 247 Statistical Analysis of Laboratory Data
7
May 5, 2015
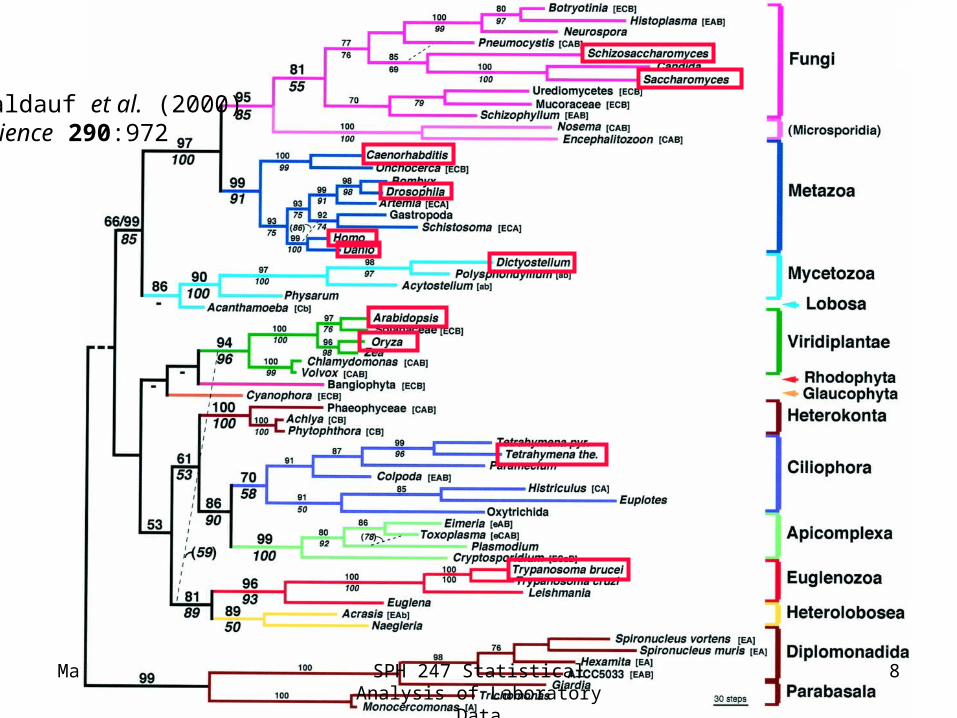
Baldauf et al. (2000)Science 290:972
SPH 247 Statistical Analysis of Laboratory Data
8

May 5, 2015
MCM3
MCM2
CDC46/MCM5
CDC47/MCM7
CDC54/MCM4
MCM6
These proteins form a hexamer in the species that have been examined
Comparison of sequences from 4 organisms
SPH 247 Statistical Analysis of Laboratory Data
9

May 5, 2015
http://www.geneontology.org/
SPH 247 Statistical Analysis of Laboratory Data
10
May 5, 2015
Outline of Topics
• Introduction to the Gene Ontologies (GO)
• Annotations to GO terms
• GO Tools
• Applications of GO
SPH 247 Statistical Analysis of Laboratory Data
11

May 5, 2015
What is Ontology?
• Dictionary:A branch of metaphysics concerned with the nature and relations of being.
• Barry Smith:The science of what is, of the kinds and structures of objects, properties, events, processes and relations in every area of reality.
16061700s
SPH 247 Statistical Analysis of Laboratory Data
13
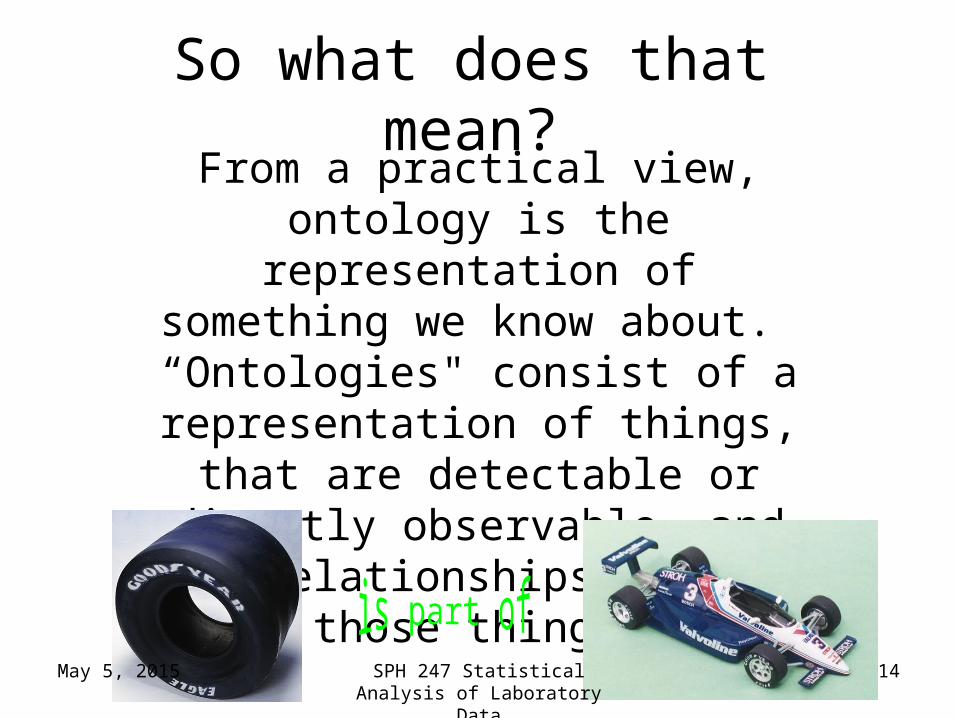
So what does that mean?From a practical view, ontology is the representation of something we know about. “Ontologies" consist of a representation of things, that are detectable or directly observable, and the relationships between those
things.
May 5, 2015 SPH 247 Statistical Analysis of Laboratory Data
14

May 5, 2015
Sriniga Srinivasan, Chief Ontologist, Yahoo!
The ontology. Dividing human knowledge into a clean set of categories is a lot like trying to figure out where to find that suspenseful black comedy at your corner video store. Questions inevitably come up, like are Movies part of Art or Entertainment? (Yahoo! lists them under the latter.) -Wired Magazine, May 1996
SPH 247 Statistical Analysis of Laboratory Data
15
May 5, 2015
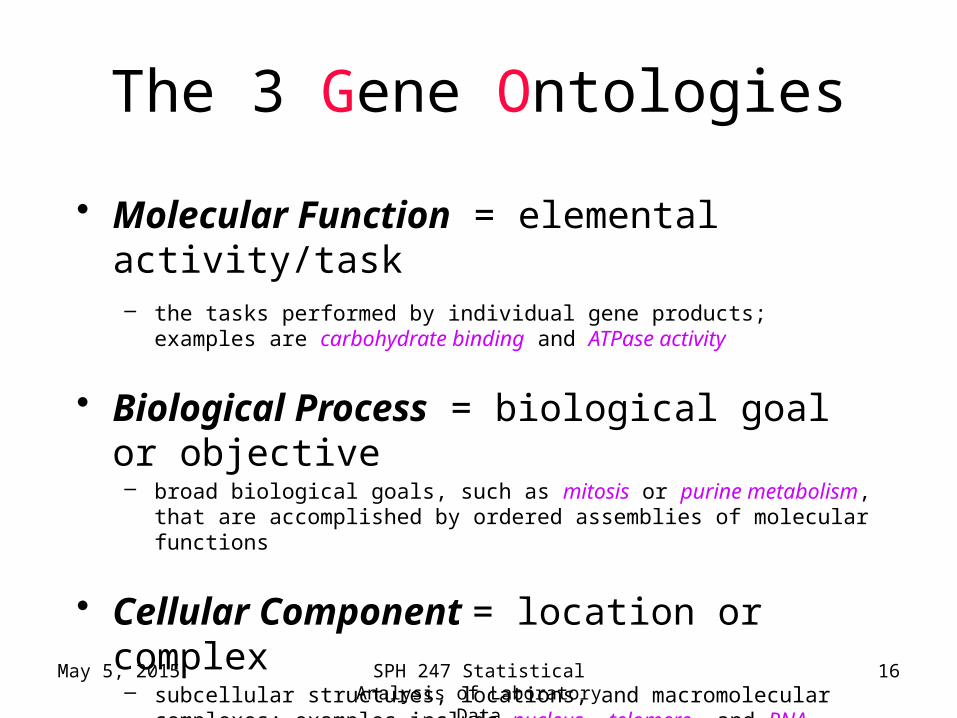
• Molecular Function = elemental activity/task– the tasks performed by individual gene products; examples are
carbohydrate binding and ATPase activity
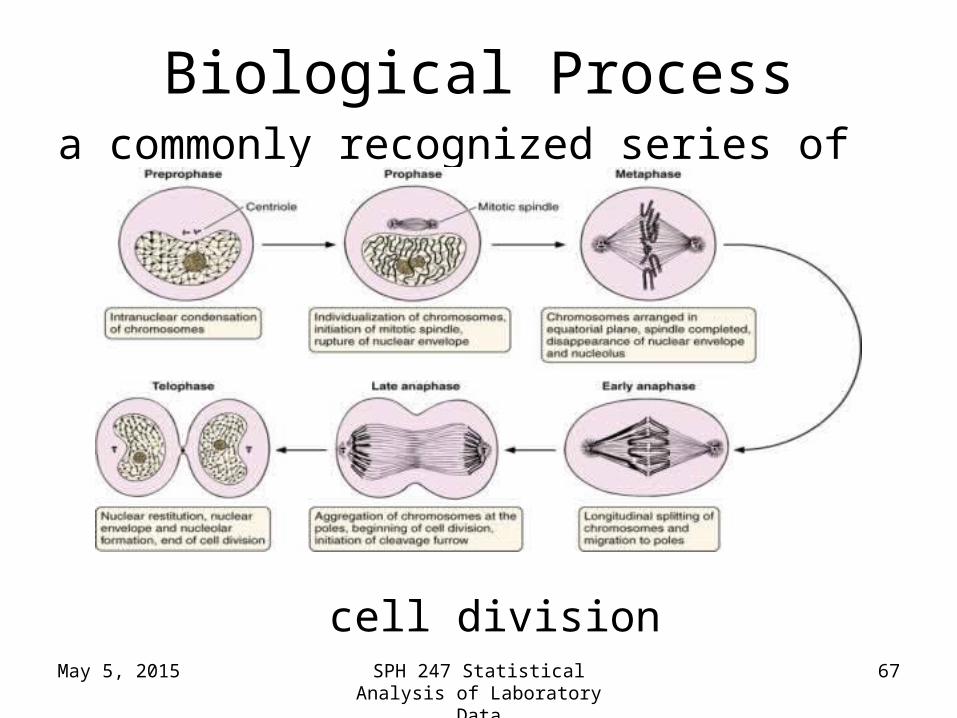
• Biological Process = biological goal or objective– broad biological goals, such as mitosis or purine metabolism, that are
accomplished by ordered assemblies of molecular functions
• Cellular Component = location or complex– subcellular structures, locations, and macromolecular complexes; examples
include nucleus, telomere, and RNA polymerase II holoenzyme
The 3 Gene Ontologies
SPH 247 Statistical Analysis of Laboratory Data
16
May 5, 2015
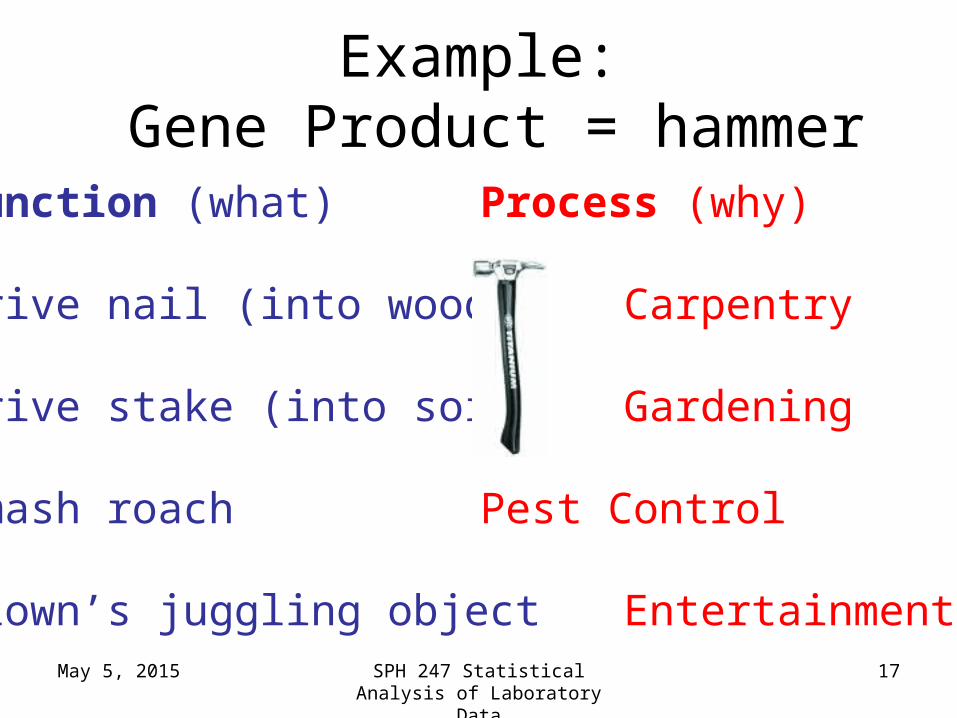
Function (what) Process (why)
Drive nail (into wood) Carpentry
Drive stake (into soil) Gardening
Smash roach Pest Control
Clown’s juggling object Entertainment
Example: Gene Product = hammer
SPH 247 Statistical Analysis of Laboratory Data
17
May 5, 2015
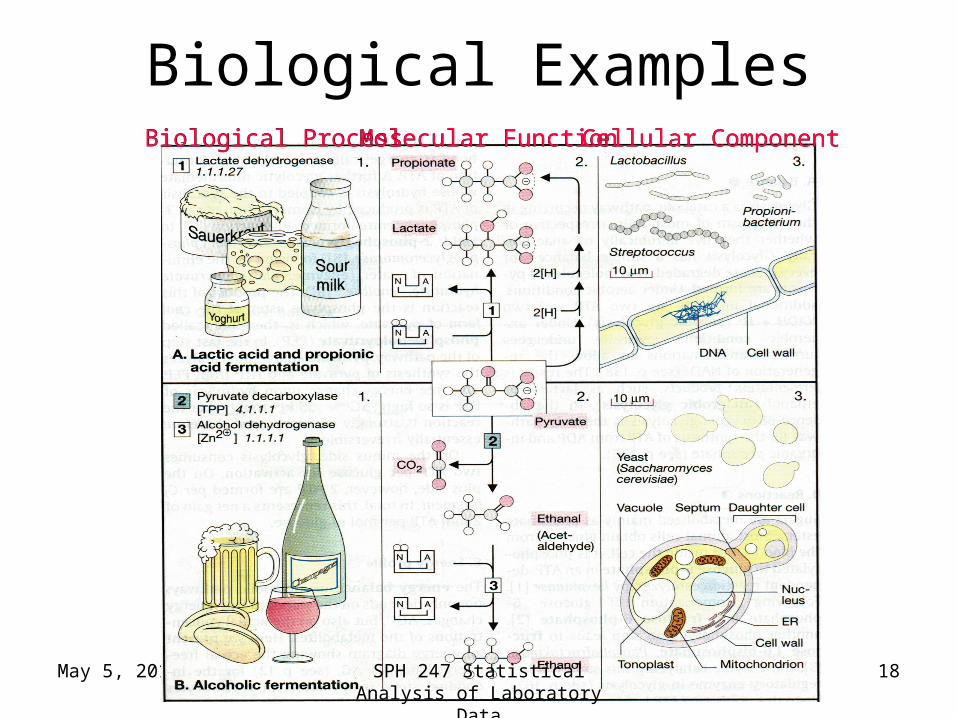
Biological ExamplesMolecular FunctionMolecular FunctionBiological ProcessBiological Process Cellular ComponentCellular Component
SPH 247 Statistical Analysis of Laboratory Data
18

May 5, 2015
term: MAPKKK cascade (mating sensu Saccharomyces)
goid: GO:0007244
definition: OBSOLETE. MAPKKK cascade involved in transduction of mating pheromone signal, as described in Saccharomyces.
definition_reference: PMID:9561267
comment: This term was made obsolete because it is a gene product specific term. To update annotations, use the biological process term 'signal transduction during conjugation with cellular fusion ; GO:0000750'.
Terms, Definitions, IDs
definition: MAPKKK cascade involved in transduction of mating pheromone signal, as described in Saccharomyces
SPH 247 Statistical Analysis of Laboratory Data
19

May 5, 2015
Ontology
Includes:
1. A vocabulary of terms (names for concepts)
2. Definitions
3. Defined logical relationships to each other
SPH 247 Statistical Analysis of Laboratory Data
20
May 5, 2015
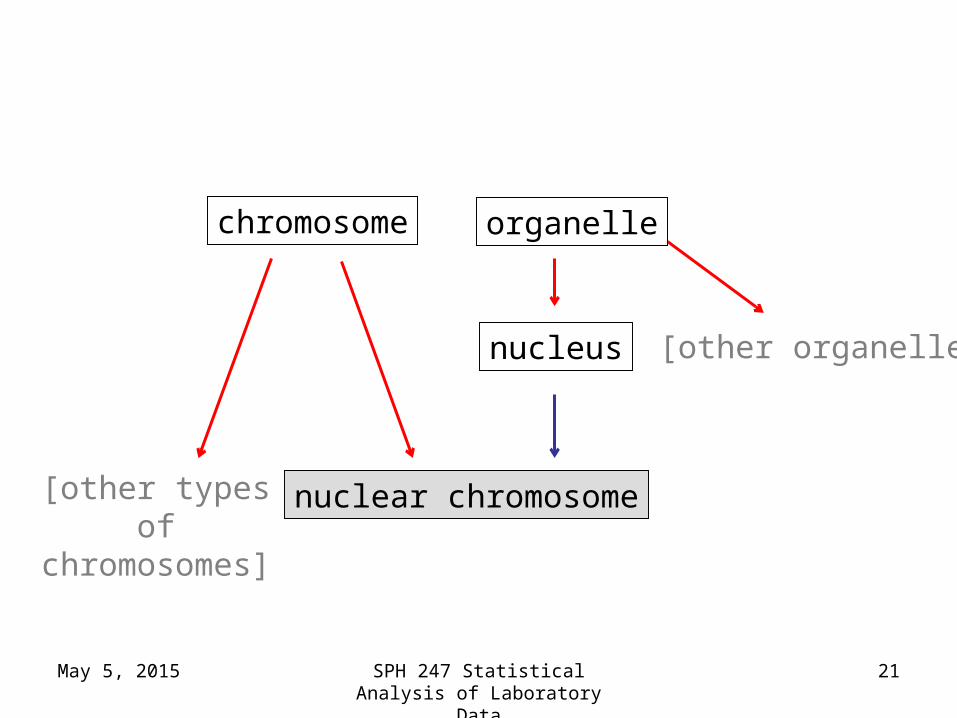
[other types of chromosomes]
[other organelles]
chromosome organelle
nucleus
nuclear chromosome
SPH 247 Statistical Analysis of Laboratory Data
21
May 5, 2015
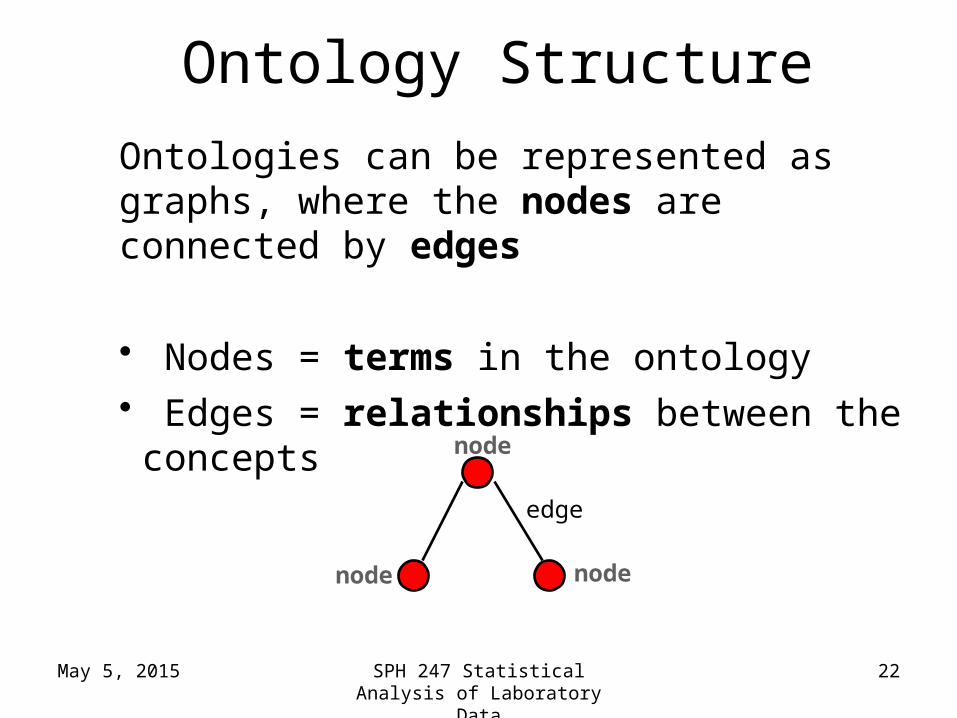
Ontologies can be represented as graphs, where the nodes are connected by edges
• Nodes = terms in the ontology• Edges = relationships between the concepts
node
nodenode
edge
Ontology Structure
SPH 247 Statistical Analysis of Laboratory Data
22
May 5, 2015
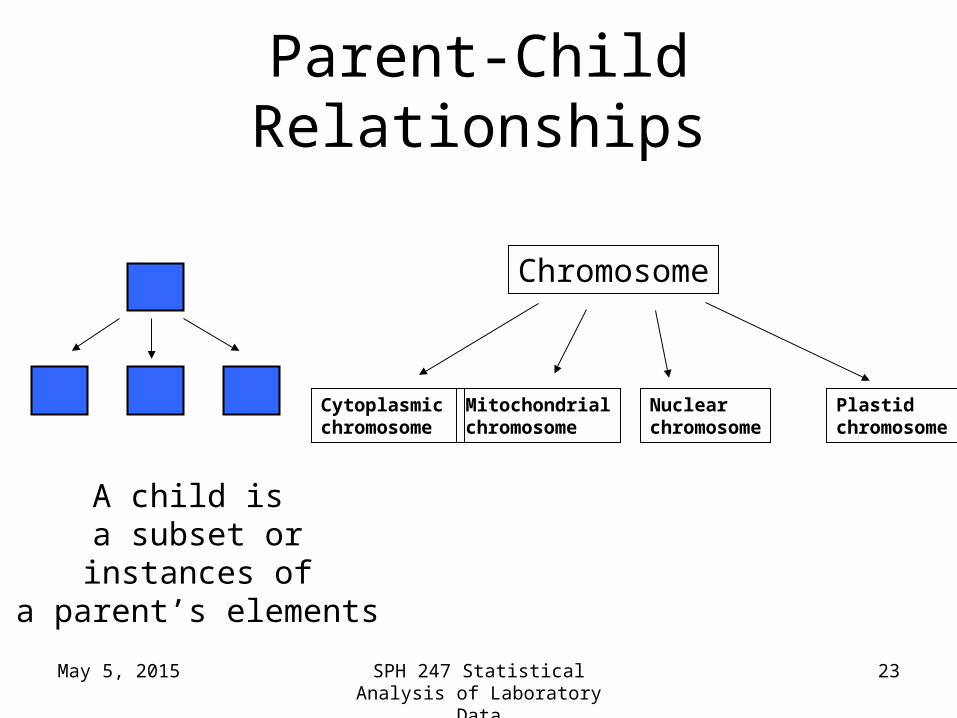
Chromosome
Cytoplasmic chromosome
Mitochondrialchromosome
Plastid chromosome
Nuclear chromosome
A child is a subset or instances of
a parent’s elements
Parent-Child Relationships
SPH 247 Statistical Analysis of Laboratory Data
23

May 5, 2015
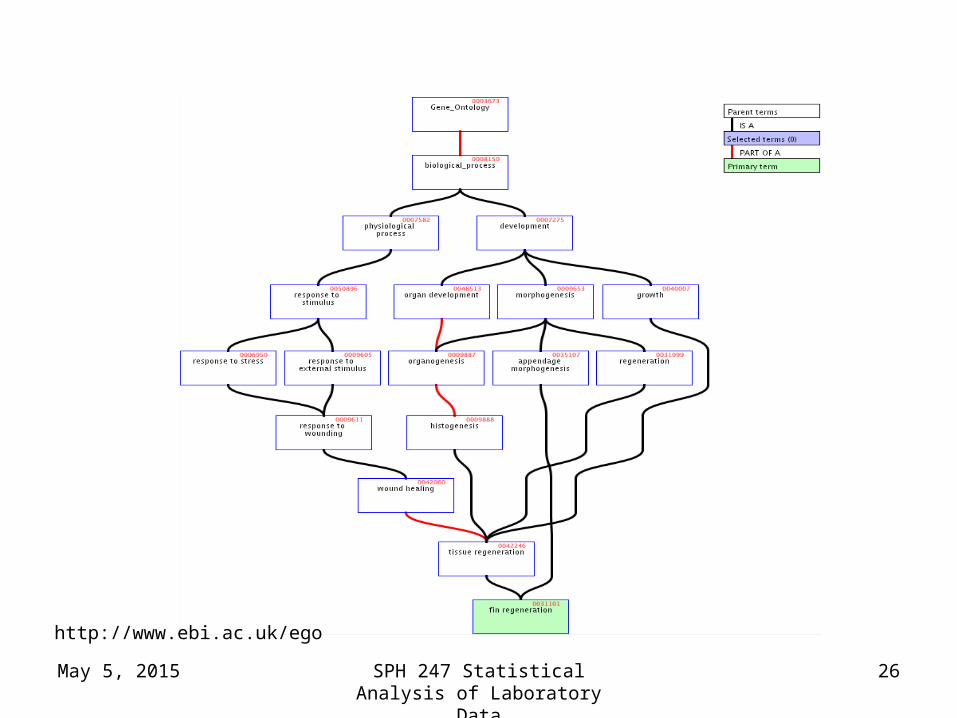
Ontology Structure• The Gene Ontology is structured as a hierarchical
directed acyclic graph (DAG)
• Terms can have more than one parent and zero, one or more children
• Terms are linked by two relationships– is-a– part-of
is_a part_of
SPH 247 Statistical Analysis of Laboratory Data
24

May 5, 2015
is-apart-of
[other types of chromosomes]
[other organelles]
chromosome organelle
nucleus
nuclear chromosome
Directed Acyclic Graph (DAG)
SPH 247 Statistical Analysis of Laboratory Data
25
May 5, 2015
http://www.ebi.ac.uk/ego
SPH 247 Statistical Analysis of Laboratory Data
26

May 5, 2015
Evidence Codes for
GO Annotations
http://www.geneontology.org/GO.evidence.shtml
SPH 247 Statistical Analysis of Laboratory Data
27

May 5, 2015
Evidence codes
Indicate the type of evidence in the cited source* that supports
the association between the gene product and the GO term
*capturing information
SPH 247 Statistical Analysis of Laboratory Data
28
May 5, 2015
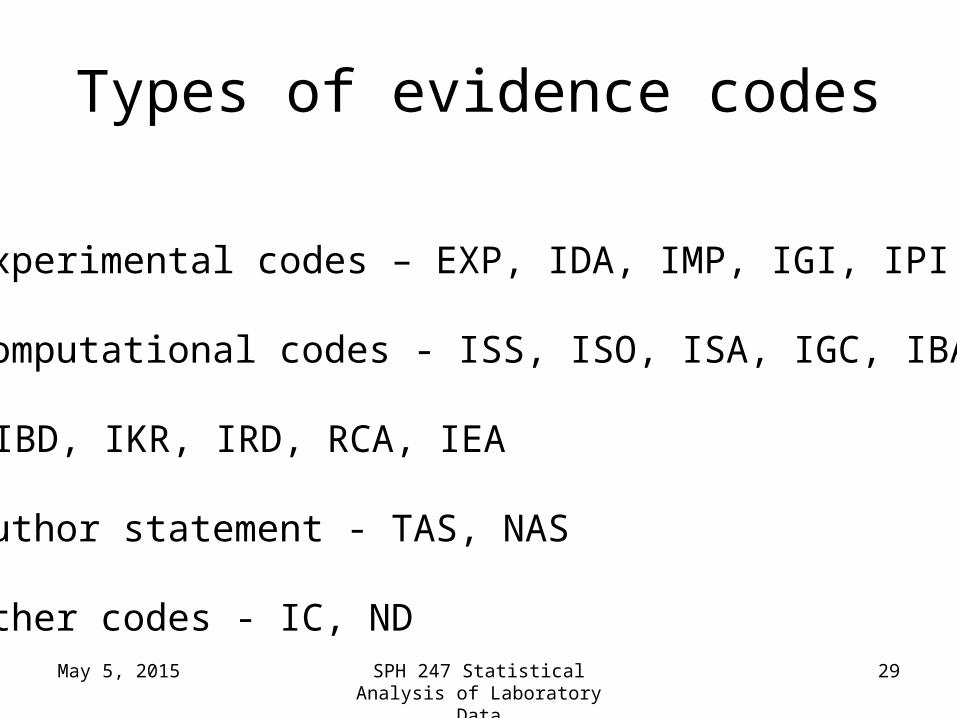
• Experimental codes – EXP, IDA, IMP, IGI, IPI, IEP
• Computational codes - ISS, ISO, ISA, IGC, IBA,
IBD, IKR, IRD, RCA, IEA
• Author statement - TAS, NAS
• Other codes - IC, ND
Types of evidence codes
SPH 247 Statistical Analysis of Laboratory Data
29

Experimental Evidence Codes
May 5, 2015 SPH 247 Statistical Analysis of Laboratory Data
30
Inferred from Experiment (EXP)Inferred from Direct Assay (IDA)Inferred from Physical Interaction (IPI)Inferred from Mutant Phenotype (IMP)Inferred from Genetic Interaction (IGI)Inferred from Expression Pattern (IEP)
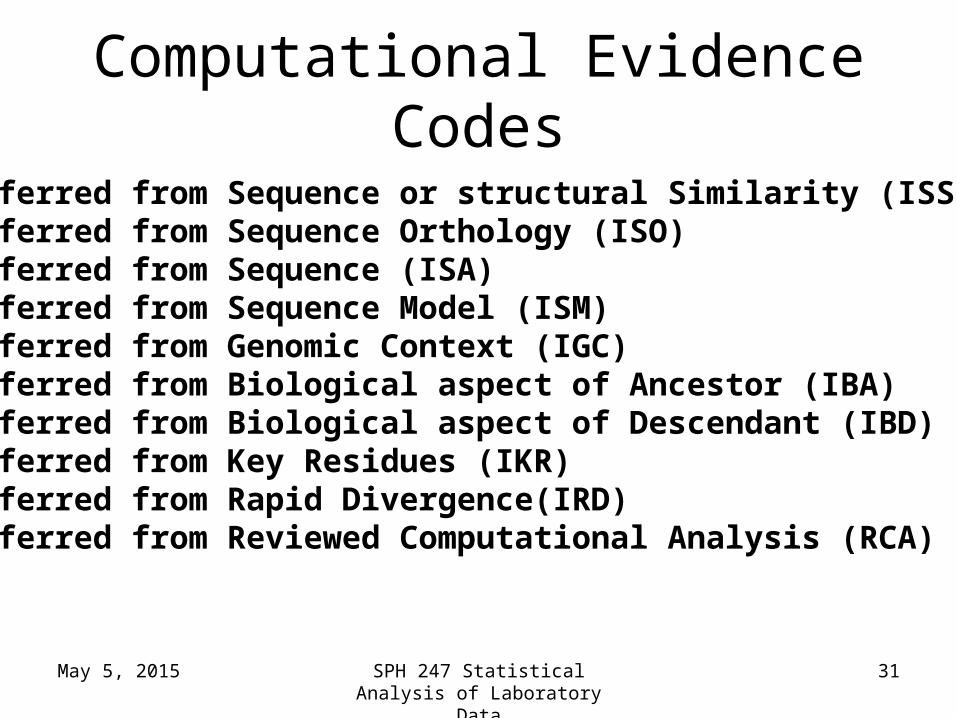
Computational Evidence Codes
May 5, 2015 SPH 247 Statistical Analysis of Laboratory Data
31
Inferred from Sequence or structural Similarity (ISS)Inferred from Sequence Orthology (ISO)Inferred from Sequence (ISA)Inferred from Sequence Model (ISM)Inferred from Genomic Context (IGC)Inferred from Biological aspect of Ancestor (IBA)Inferred from Biological aspect of Descendant (IBD)Inferred from Key Residues (IKR)Inferred from Rapid Divergence(IRD)inferred from Reviewed Computational Analysis (RCA)
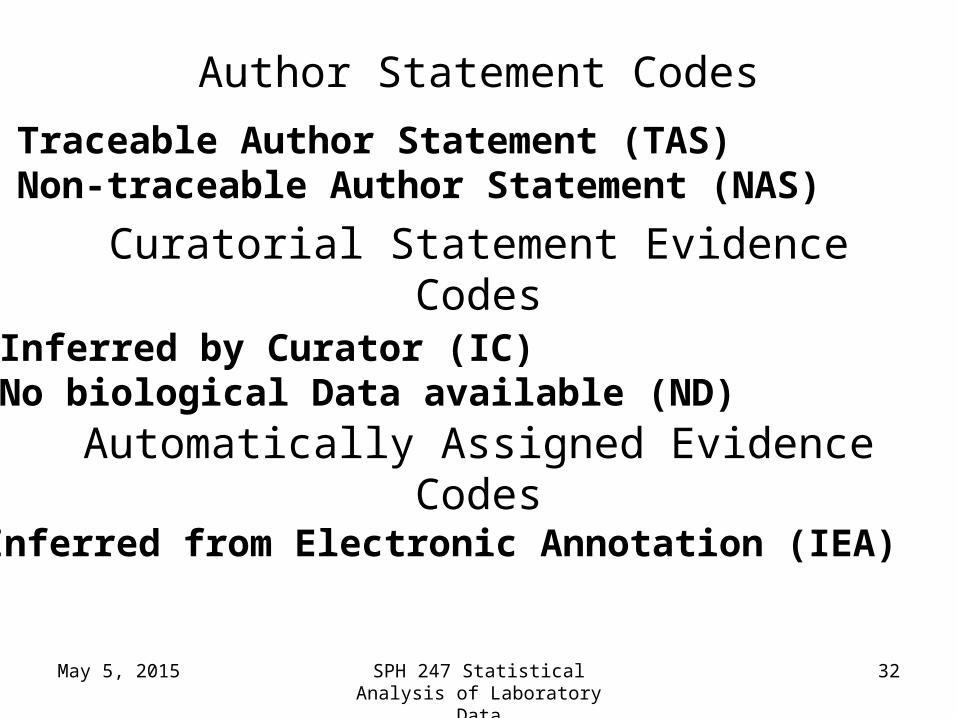
Author Statement Codes
May 5, 2015 SPH 247 Statistical Analysis of Laboratory Data
32
Traceable Author Statement (TAS)Non-traceable Author Statement (NAS)
Curatorial Statement Evidence Codes
Inferred by Curator (IC)No biological Data available (ND)
Automatically Assigned Evidence Codes
Inferred from Electronic Annotation (IEA)
May 5, 2015
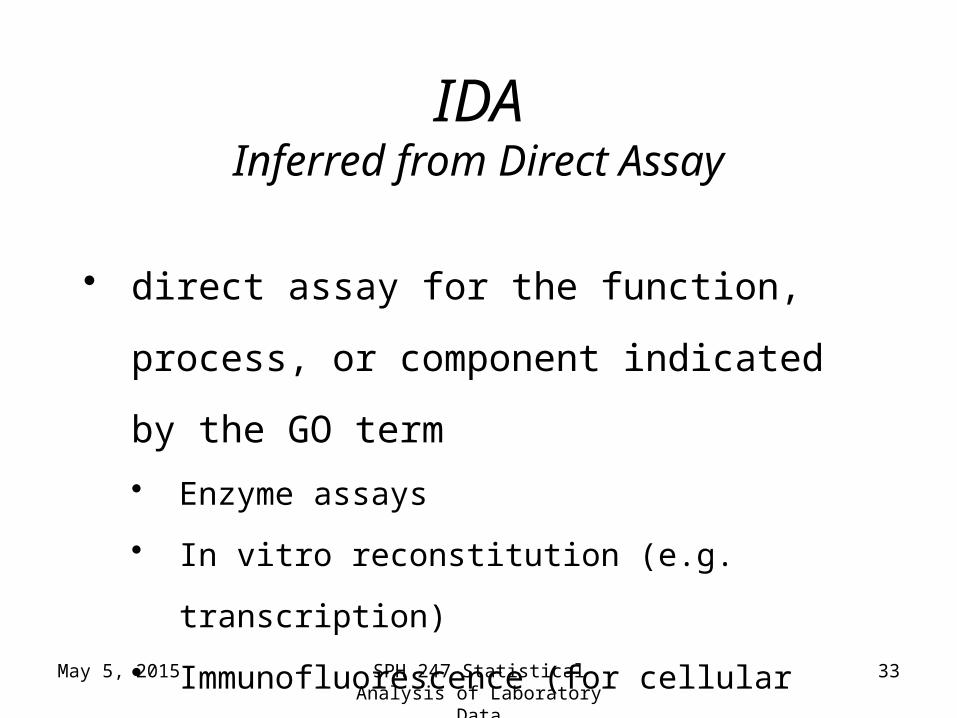
IDAInferred from Direct Assay
• direct assay for the function, process, or
component indicated by the GO term
• Enzyme assays
• In vitro reconstitution (e.g. transcription)
• Immunofluorescence (for cellular
component)
• Cell fractionation (for cellular component)SPH 247 Statistical Analysis of Laboratory Data
33
May 5, 2015
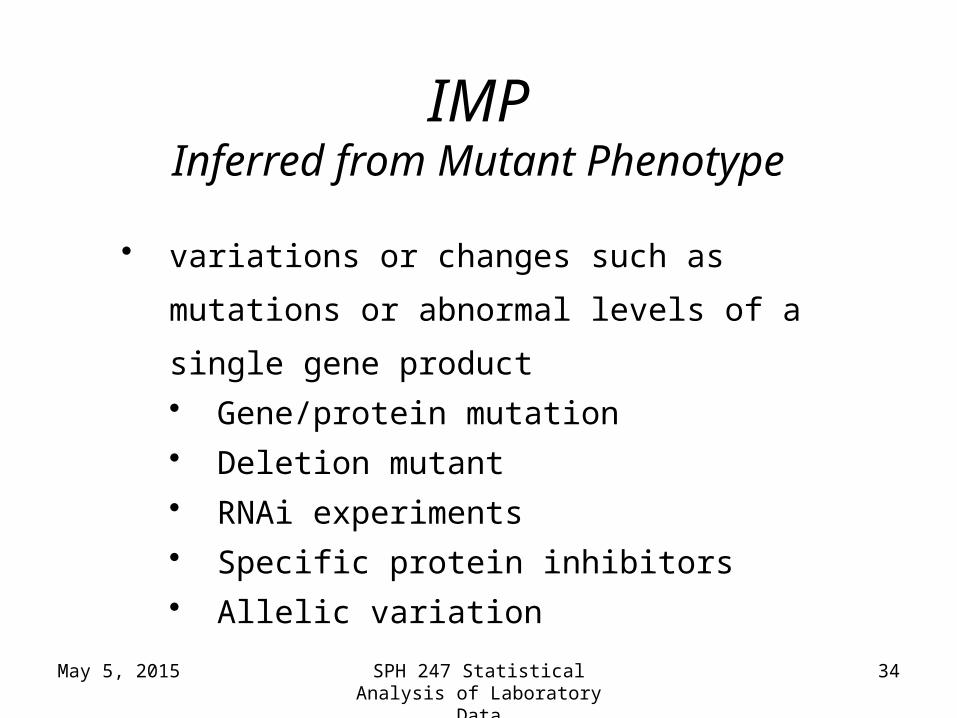
IMPInferred from Mutant Phenotype
• variations or changes such as mutations or
abnormal levels of a single gene product
• Gene/protein mutation• Deletion mutant• RNAi experiments• Specific protein inhibitors• Allelic variation
SPH 247 Statistical Analysis of Laboratory Data
34
May 5, 2015
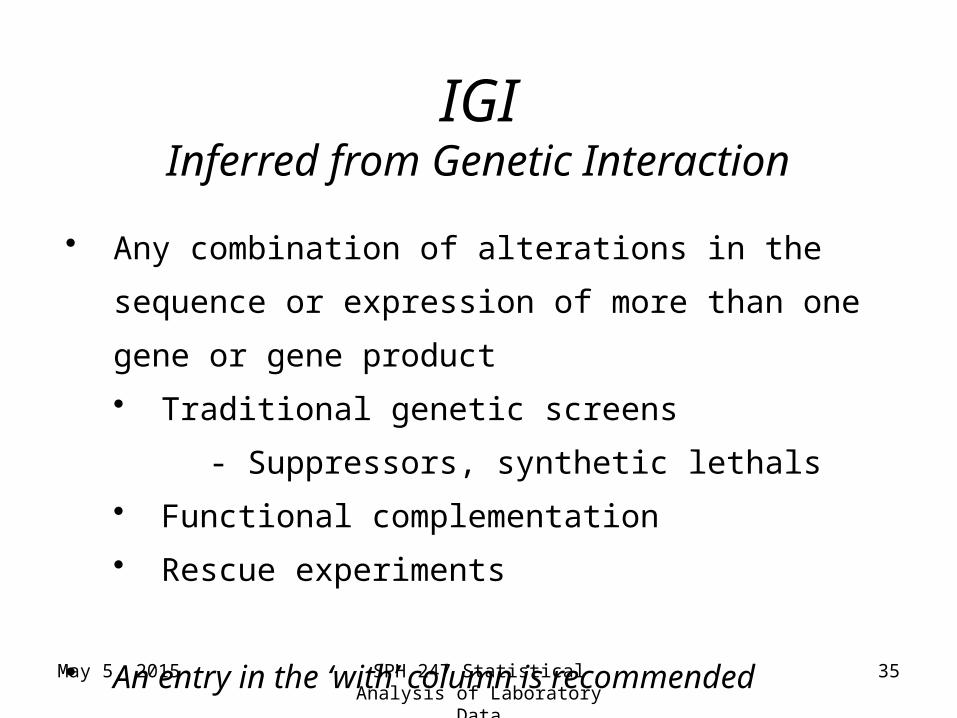
IGIInferred from Genetic Interaction
• Any combination of alterations in the sequence or
expression of more than one gene or gene product
• Traditional genetic screens
- Suppressors, synthetic lethals
• Functional complementation
• Rescue experiments
• An entry in the ‘with’ column is recommendedSPH 247 Statistical Analysis of
Laboratory Data35
May 5, 2015
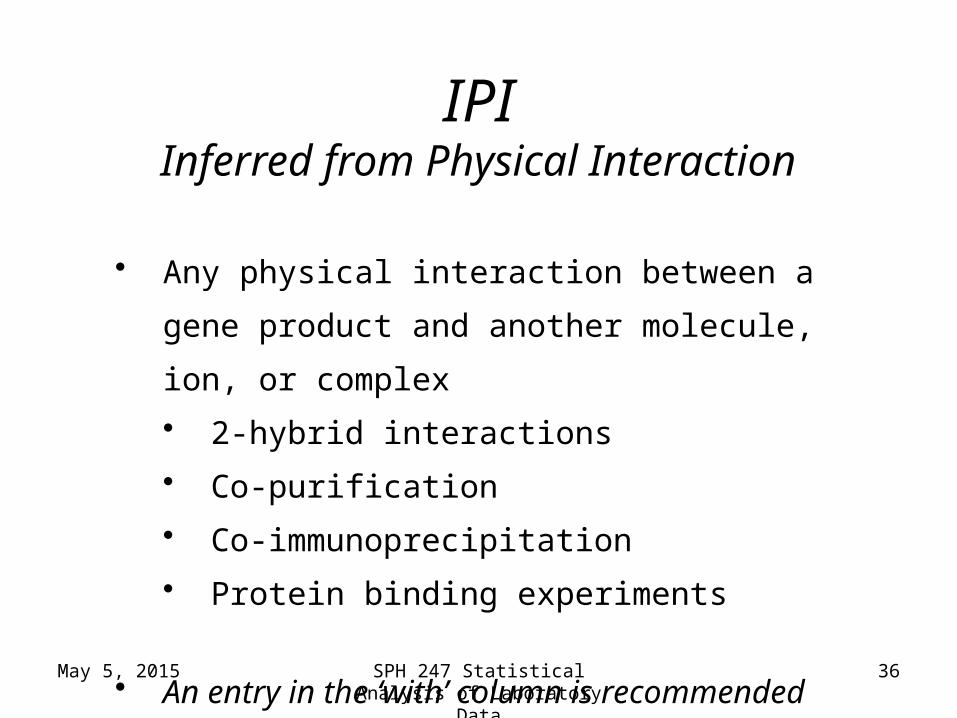
IPIInferred from Physical Interaction
• Any physical interaction between a gene product
and another molecule, ion, or complex
• 2-hybrid interactions
• Co-purification
• Co-immunoprecipitation
• Protein binding experiments
• An entry in the ‘with’ column is recommendedSPH 247 Statistical Analysis of
Laboratory Data36
May 5, 2015
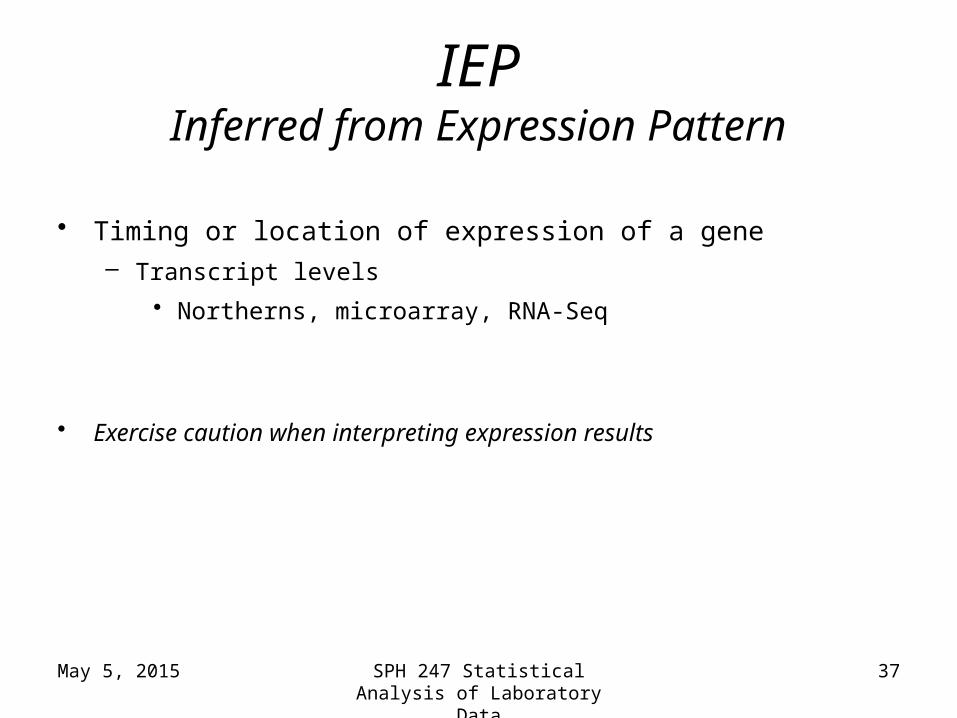
IEPInferred from Expression Pattern
• Timing or location of expression of a gene– Transcript levels
• Northerns, microarray, RNA-Seq
• Exercise caution when interpreting expression results
SPH 247 Statistical Analysis of Laboratory Data
37

May 5, 2015
ISSInferred from Sequence or structural Similarity
• Sequence alignment, structure comparison, or evaluation of
sequence features such as composition
– Sequence similarity
– Recognized domains/overall architecture of protein
• An entry in the ‘with’ column is recommended
SPH 247 Statistical Analysis of Laboratory Data
38

May 5, 2015
RCAInferred from Reviewed Computational Analysis
• non-sequence-based computational method– large-scale experiments
• genome-wide two-hybrid
• genome-wide synthetic interactions
– integration of large-scale datasets of several types
– text-based computation (text mining)
SPH 247 Statistical Analysis of Laboratory Data
39

May 5, 2015
IGCInferred from Genomic Context
• Chromosomal position
• Most often used for Bacteria - operons
– Direct evidence for a gene being involved in a process is
minimal, but for surrounding genes in the operon, the evidence
is well-established
SPH 247 Statistical Analysis of Laboratory Data
40

May 5, 2015
IEAInferred from Electronic Annotation
• depend directly on computation or automated transfer of
annotations from a database
– Hits from BLAST searches
– InterPro2GO mappings
• No manual checking
• Entry in ‘with’ column is allowed (ex. sequence ID)
SPH 247 Statistical Analysis of Laboratory Data
41

May 5, 2015
TASTraceable Author Statement
• publication used to support an annotation doesn't show
the evidence
– Review article
• Would be better to track down cited reference and use an
experimental code
SPH 247 Statistical Analysis of Laboratory Data
42
May 5, 2015
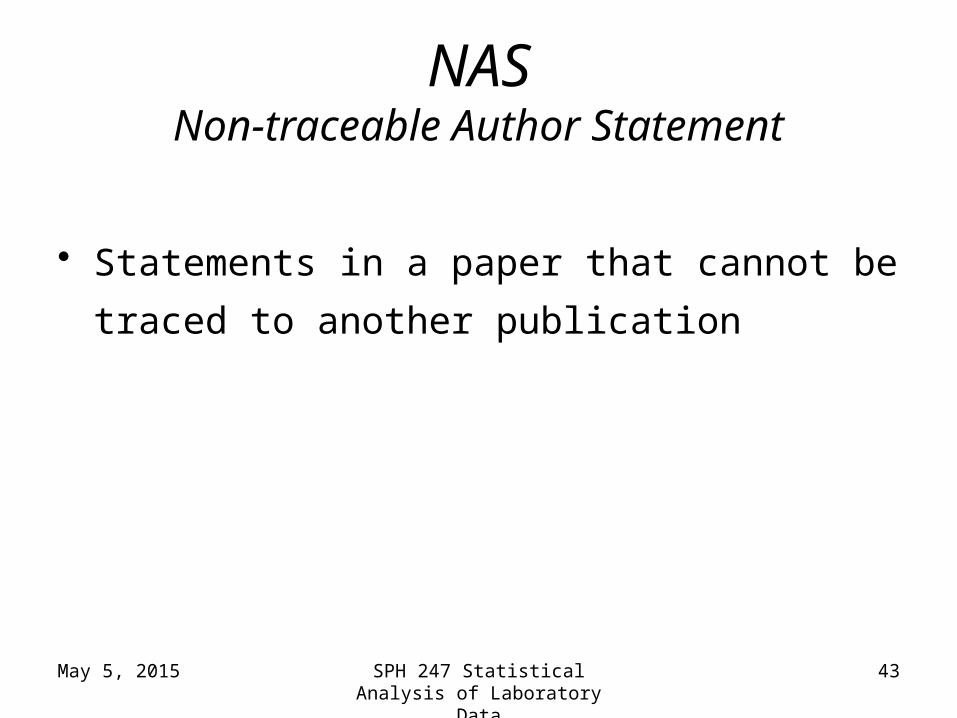
NASNon-traceable Author Statement
• Statements in a paper that cannot be traced to
another publication
SPH 247 Statistical Analysis of Laboratory Data
43
May 5, 2015
NDNo biological Data available
• Can find no information supporting an annotation to any term
• Indicate that a curator has looked for info but found nothing– Place holder– Date
SPH 247 Statistical Analysis of Laboratory Data
44
May 5, 2015
ICInferred by Curator
• annotation is not supported by evidence, but can be
reasonably inferred from other GO annotations for which
evidence is available
• ex. evidence = transcription factor (function)
– IC = nucleus (component)
SPH 247 Statistical Analysis of Laboratory Data
45
May 5, 2015
Ask yourself:
What is the experiment that was done?
Choosing the correct evidence code
SPH 247 Statistical Analysis of Laboratory Data
46
May 5, 2015
http://www.geneontology.org/GO.evidence.shtml
SPH 247 Statistical Analysis of Laboratory Data
47
Using the Gene Ontology (GO) for Expression
Analysis
May 5, 2015 SPH 247 Statistical Analysis of Laboratory Data
48

May 5, 2015
What is the Gene Ontology?
• Set of biological phrases (terms) which are applied to genes:– protein kinase– apoptosis– membrane
SPH 247 Statistical Analysis of Laboratory Data
49

May 5, 2015
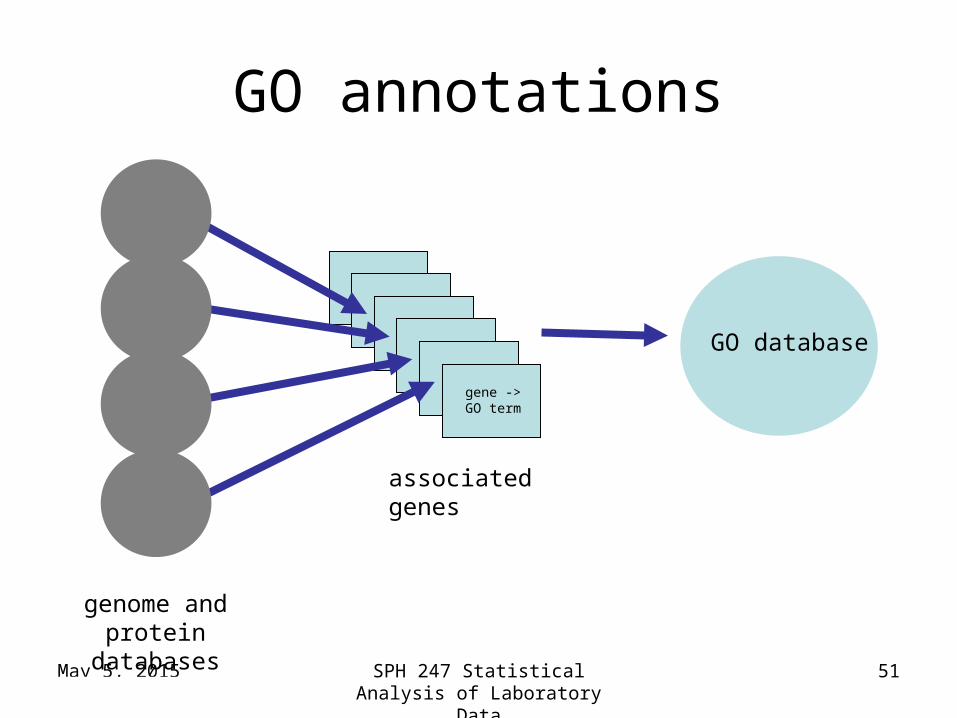
What is the Gene Ontology?
• Genes are linked, or associated, with GO terms by trained curators at genome databases– known as ‘gene associations’ or GO
annotations• Some GO annotations created
automatically
SPH 247 Statistical Analysis of Laboratory Data
50
May 5, 2015
gene -> GO term
associated genes
GO annotations
GO database
genome and protein databases
SPH 247 Statistical Analysis of Laboratory Data
51

May 5, 2015
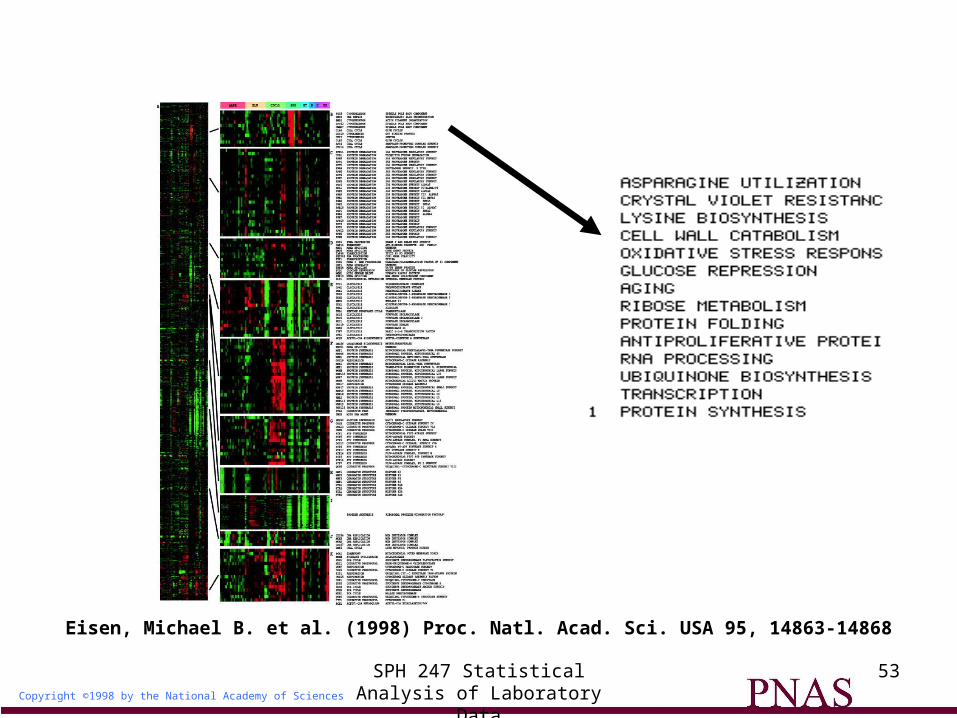
What is the Gene Ontology?
• Allows biologists to make inferences across large numbers of genes without researching each one individually
SPH 247 Statistical Analysis of Laboratory Data
52
May 5, 2015Copyright ©1998 by the National Academy of Sciences
Eisen, Michael B. et al. (1998) Proc. Natl. Acad. Sci. USA 95, 14863-14868
SPH 247 Statistical Analysis of Laboratory Data
53
May 5, 2015
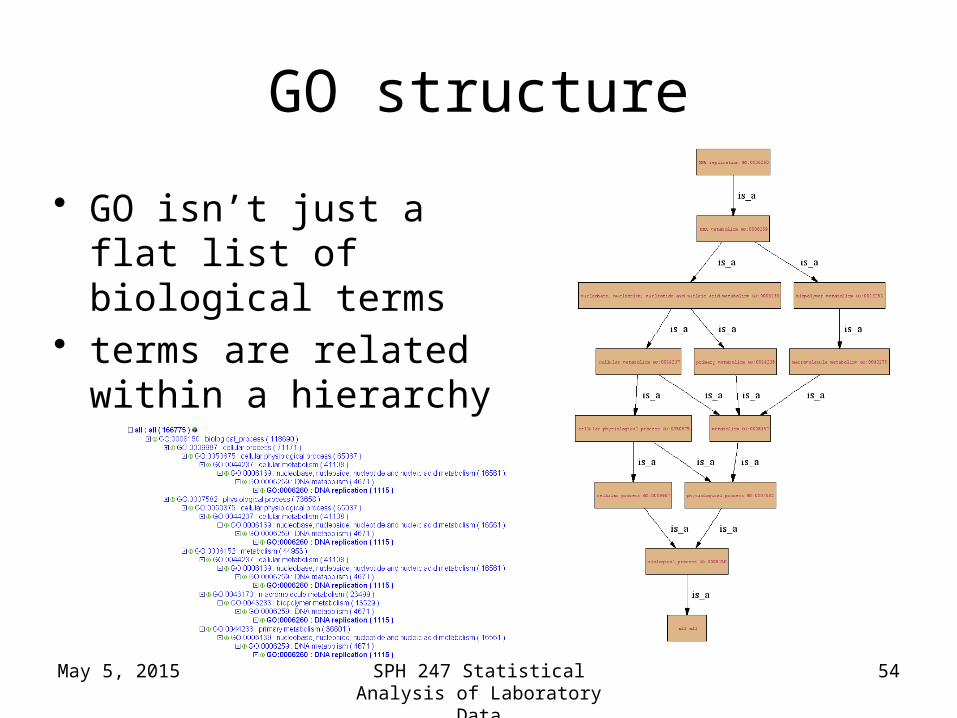
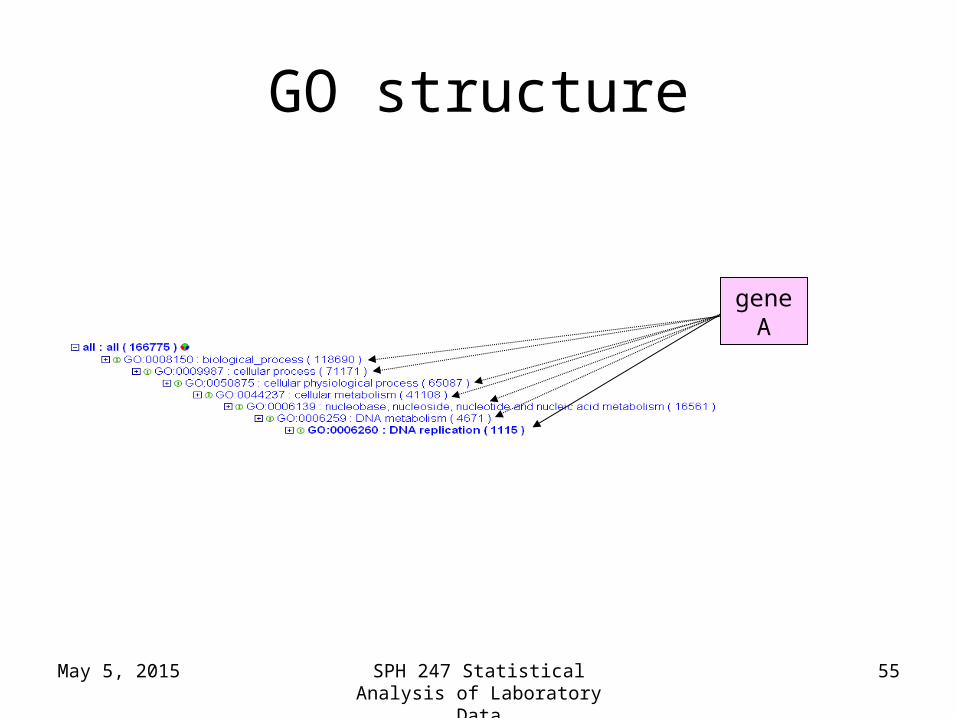
GO structure
• GO isn’t just a flat list of biological terms
• terms are related within a hierarchy
SPH 247 Statistical Analysis of Laboratory Data
54
May 5, 2015
GO structure
gene A
SPH 247 Statistical Analysis of Laboratory Data
55

May 5, 2015
GO structure
• This means genes can be grouped according to user-defined levels
• Allows broad overview of gene set or genome
SPH 247 Statistical Analysis of Laboratory Data
56
May 5, 2015
How does GO work?
• GO is species independent– some terms, especially lower-level, detailed
terms may be specific to a certain group• e.g. photosynthesis
– But when collapsed up to the higher levels, terms are not dependent on species
SPH 247 Statistical Analysis of Laboratory Data
57

May 5, 2015
How does GO work?
• What does the gene product do?• Where and when does it act?• Why does it perform these activities?
What information might we want to capture about a gene product?
SPH 247 Statistical Analysis of Laboratory Data
58

May 5, 2015
GO structure
• GO terms divided into three parts:– cellular component– molecular function– biological process
SPH 247 Statistical Analysis of Laboratory Data
59

May 5, 2015
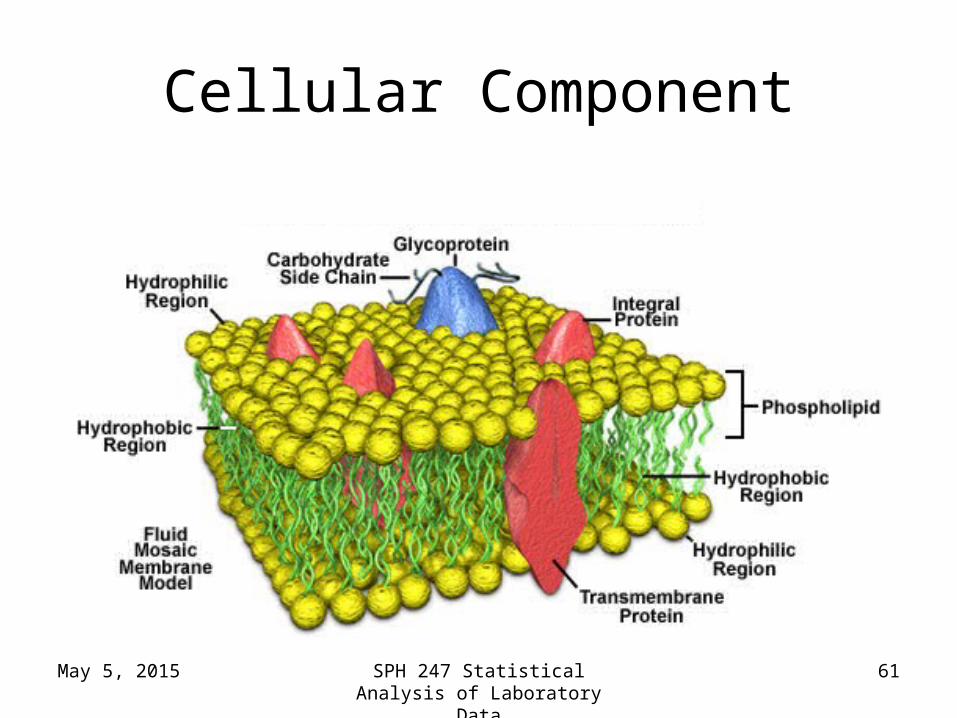
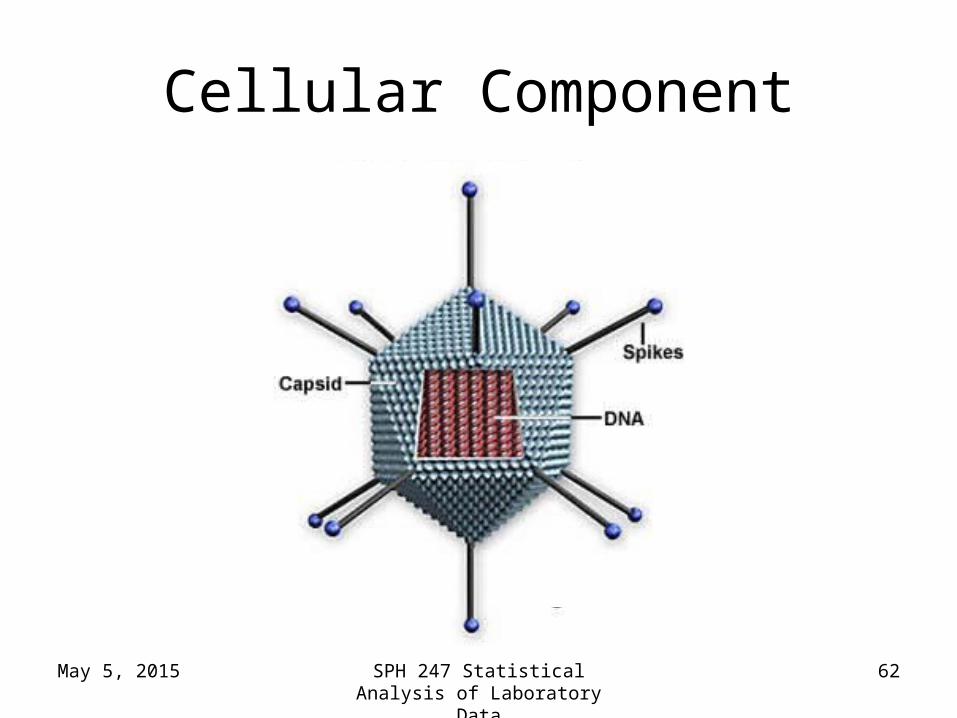
Cellular Component
• where a gene product acts
SPH 247 Statistical Analysis of Laboratory Data
60
May 5, 2015
Cellular Component
SPH 247 Statistical Analysis of Laboratory Data
61
May 5, 2015
Cellular Component
SPH 247 Statistical Analysis of Laboratory Data
62
May 5, 2015
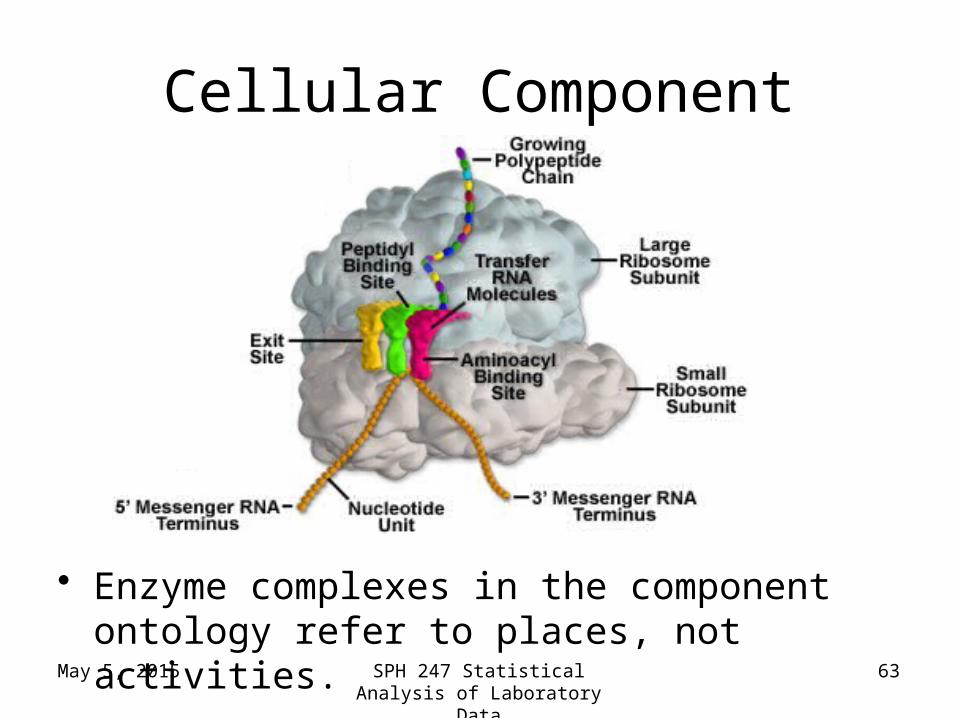
Cellular Component
• Enzyme complexes in the component ontology refer to places, not activities.
SPH 247 Statistical Analysis of Laboratory Data
63
May 5, 2015
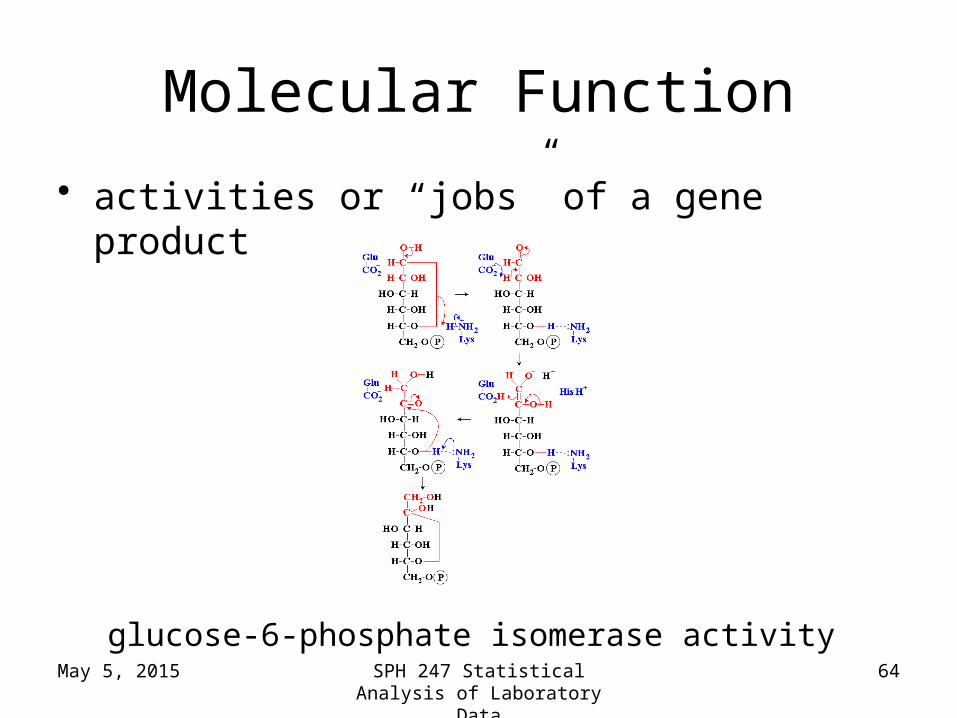
Molecular Function
• activities or “jobs” of a gene product
glucose-6-phosphate isomerase activitySPH 247 Statistical Analysis of
Laboratory Data64
May 5, 2015
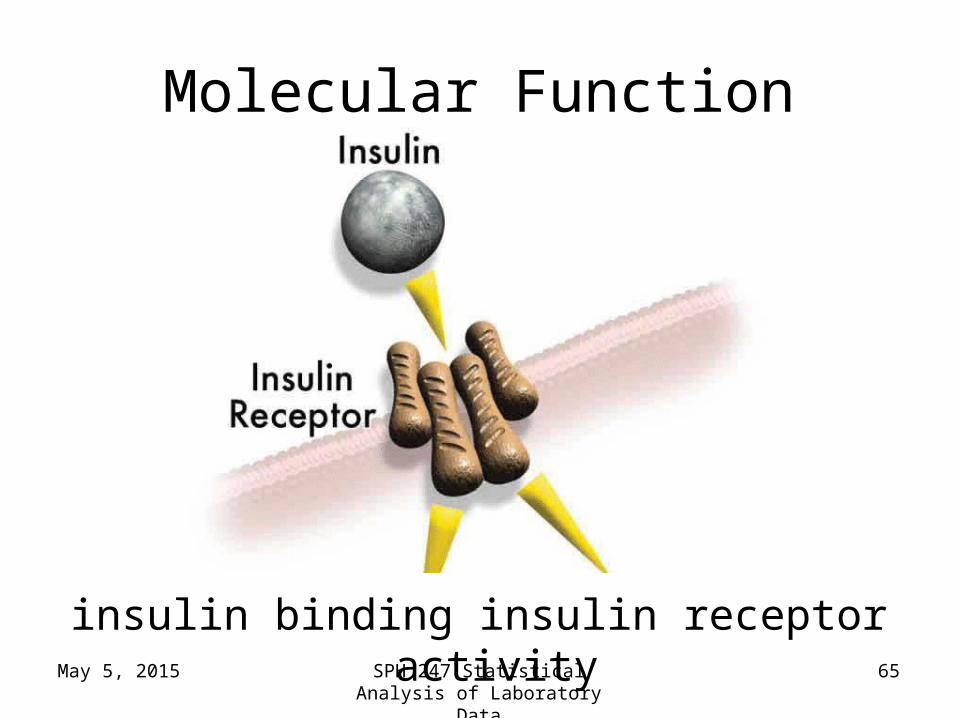
Molecular Function
insulin binding insulin receptor activitySPH 247 Statistical Analysis of
Laboratory Data65
May 5, 2015
Molecular Function
• A gene product may have several functions; a function term refers to a single reaction or activity, not a gene product.
• Sets of functions make up a biological process.
SPH 247 Statistical Analysis of Laboratory Data
66
May 5, 2015
Biological Processa commonly recognized series of events
cell divisionSPH 247 Statistical Analysis of
Laboratory Data67
May 5, 2015
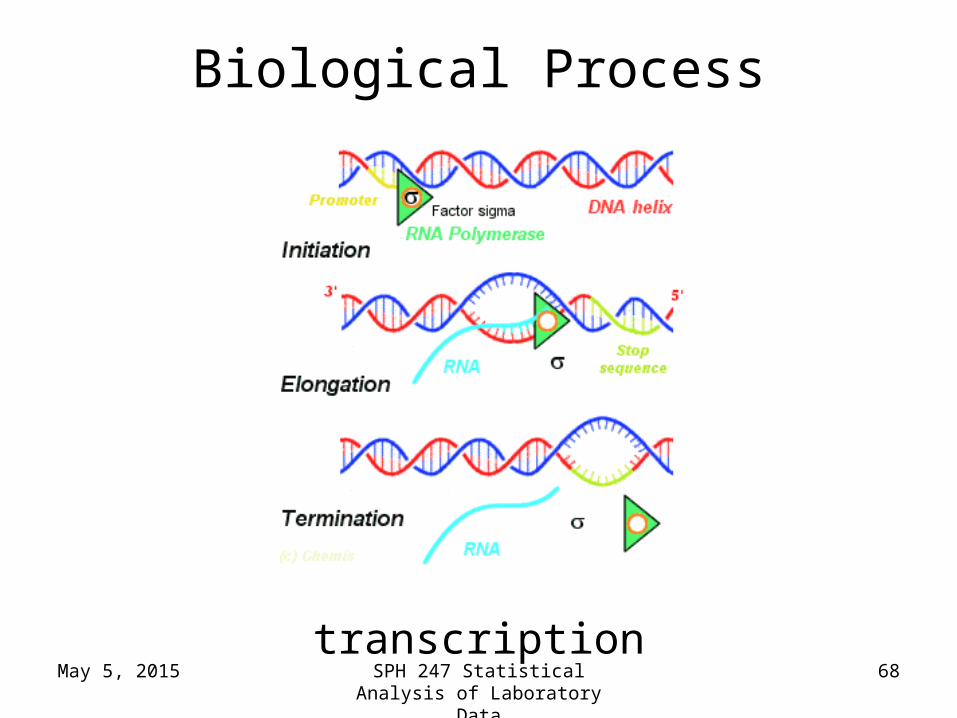
Biological Process
transcriptionSPH 247 Statistical Analysis of
Laboratory Data68
May 5, 2015
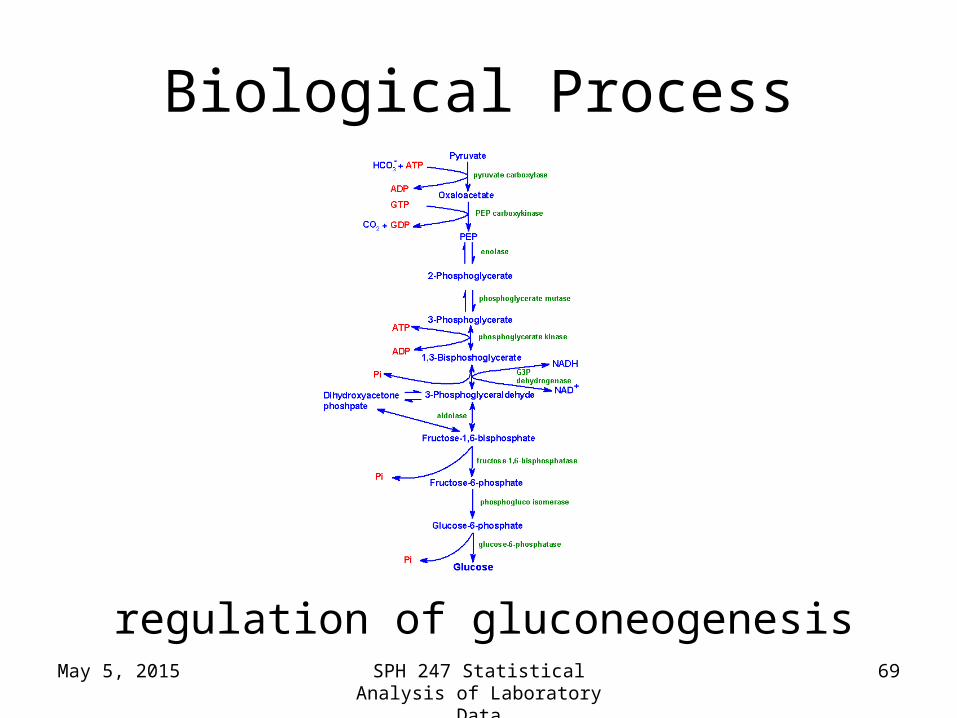
Biological Process
regulation of gluconeogenesisSPH 247 Statistical Analysis of
Laboratory Data69
May 5, 2015
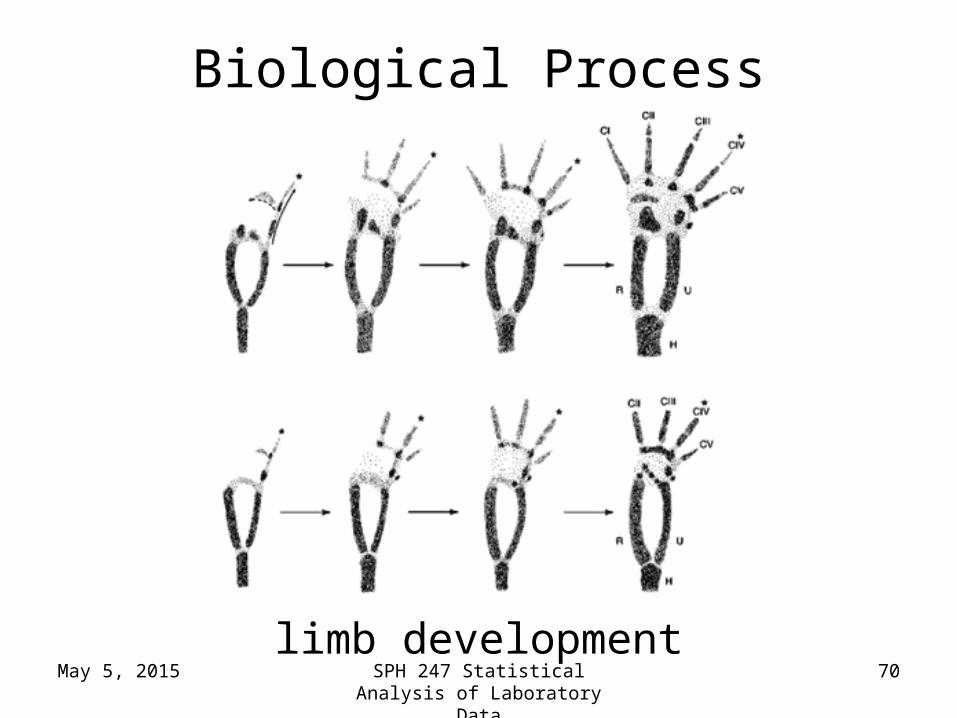
Biological Process
limb developmentSPH 247 Statistical Analysis of
Laboratory Data70
May 5, 2015
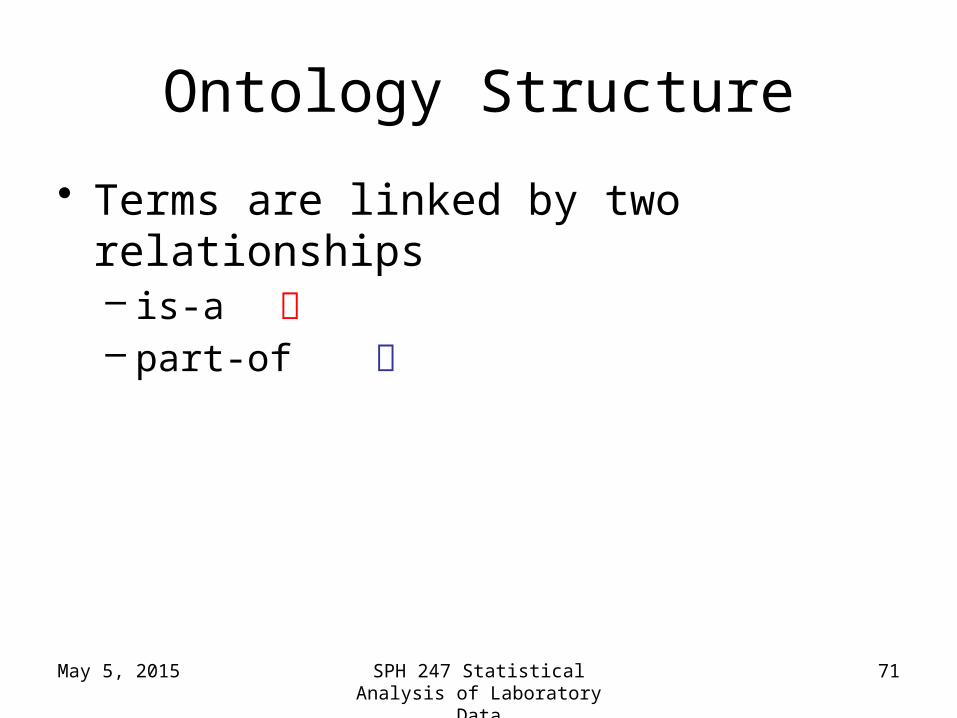
Ontology Structure
• Terms are linked by two relationships– is-a – part-of
SPH 247 Statistical Analysis of Laboratory Data
71
May 5, 2015
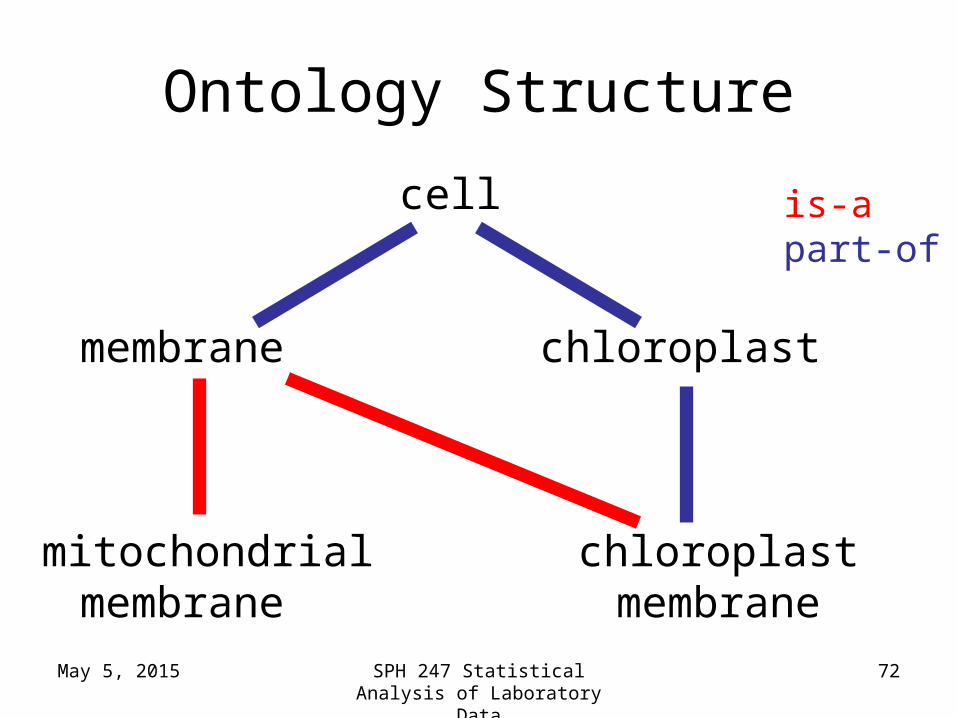
Ontology Structure
cell
membrane chloroplast
mitochondrial chloroplastmembrane membrane
is-apart-of
SPH 247 Statistical Analysis of Laboratory Data
72

May 5, 2015
Ontology Structure
• Ontologies are structured as a hierarchical directed acyclic graph (DAG)
• Terms can have more than one parent and zero, one or more children
SPH 247 Statistical Analysis of Laboratory Data
73

May 5, 2015
Ontology Structure
cell
membrane chloroplast
mitochondrial chloroplastmembrane membrane
Directed Acyclic Graph (DAG) - multiple
parentage allowed
SPH 247 Statistical Analysis of Laboratory Data
74
May 5, 2015
Anatomy of a GO term
id: GO:0006094name: gluconeogenesisnamespace: processdef: The formation of glucose fromnoncarbohydrate precursors, such aspyruvate, amino acids and glycerol.[http://cancerweb.ncl.ac.uk/omd/index.html]exact_synonym: glucose biosynthesisxref_analog: MetaCyc:GLUCONEO-PWYis_a: GO:0006006is_a: GO:0006092
unique GO IDterm name
definition
synonymdatabase ref
parentage
ontology
SPH 247 Statistical Analysis of Laboratory Data
75
May 5, 2015
GO tools
• GO resources are freely available to anyone to use without restriction– Includes the ontologies, gene associations
and tools developed by GO• Other groups have used GO to create
tools for many purposes:
http://www.geneontology.org/GO.tools
http://neurolex.org/wiki/Category:Resource:Gene_Ontology_Tools
SPH 247 Statistical Analysis of Laboratory Data
76
May 5, 2015
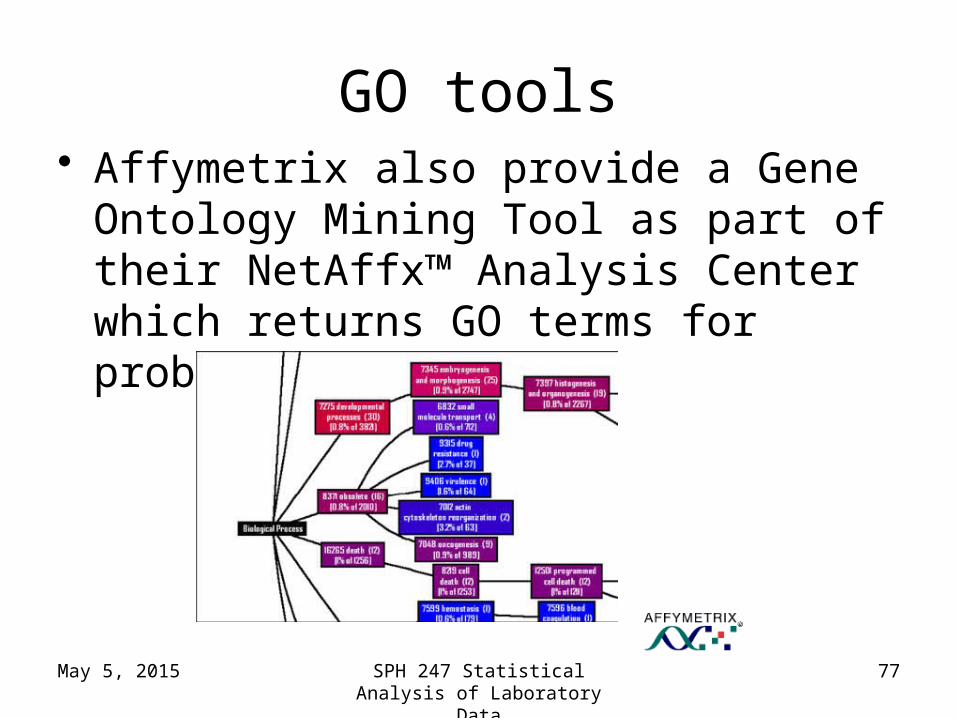
GO tools• Affymetrix also provide a Gene Ontology
Mining Tool as part of their NetAffx™ Analysis Center which returns GO terms for probe sets
SPH 247 Statistical Analysis of Laboratory Data
77
May 5, 2015
GO tools
• Many tools exist that use GO to find common biological functions from a list of genes:
http://neurolex.org/wiki/Category:Resource:Gene_Ontology_Tools
SPH 247 Statistical Analysis of Laboratory Data
78
May 5, 2015
GO tools
• Most of these tools work in a similar way:– input a gene list and a subset of ‘interesting’
genes– tool shows which GO categories have most
interesting genes associated with them i.e. which categories are ‘enriched’ for interesting genes
– tool provides a statistical measure to determine whether enrichment is significant
SPH 247 Statistical Analysis of Laboratory Data
79
May 5, 2015
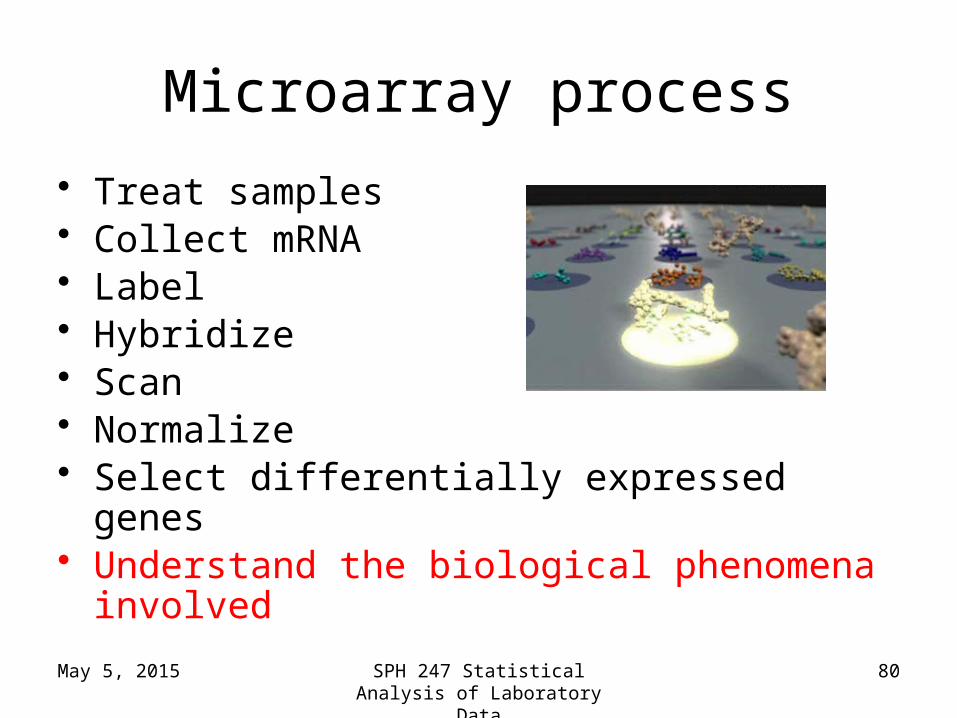
Microarray process
• Treat samples• Collect mRNA• Label• Hybridize• Scan• Normalize• Select differentially expressed genes • Understand the biological phenomena involved
SPH 247 Statistical Analysis of Laboratory Data
80

May 5, 2015
Traditional analysis
Gene 1ApoptosisCell-cell signalingProtein phosphorylationMitosis…
Gene 2Growth controlMitosisOncogenesisProtein phosphorylation…
Gene 3Growth controlMitosisOncogenesisProtein phosphorylation…
Gene 4Nervous systemPregnancyOncogenesisMitosis…
Gene 100Positive ctrl. of cell prolifMitosisOncogenesisGlucose transport…
SPH 247 Statistical Analysis of Laboratory Data
81
May 5, 2015
Traditional analysis
• gene by gene basis
• requires literature searching
• time-consuming
SPH 247 Statistical Analysis of Laboratory Data
82

May 5, 2015
Using GO annotations
• But by using GO annotations, this work has already been done for you!
GO:0006915 : apoptosis
SPH 247 Statistical Analysis of Laboratory Data
83
May 5, 2015
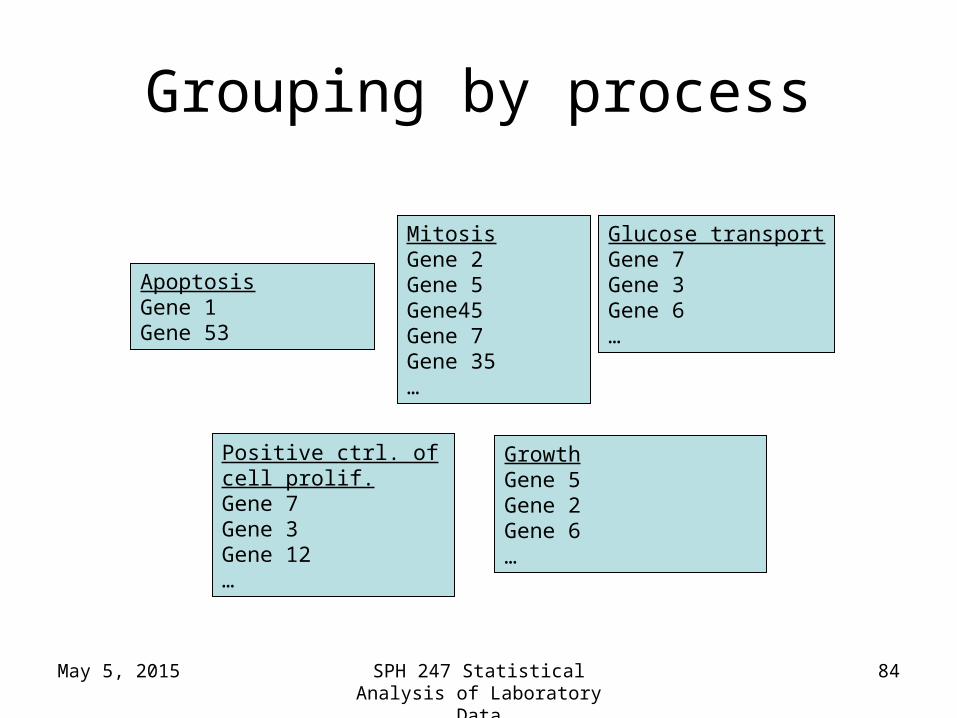
Grouping by process
ApoptosisGene 1Gene 53
MitosisGene 2Gene 5Gene45Gene 7Gene 35…
Positive ctrl. of cell prolif.Gene 7Gene 3Gene 12…
GrowthGene 5Gene 2Gene 6…
Glucose transportGene 7Gene 3Gene 6…
SPH 247 Statistical Analysis of Laboratory Data
84
May 5, 2015
GO for microarray analysis
• Annotations give ‘function’ label to genes
• Ask meaningful questions of microarray data e.g.– genes involved in the same process,
same/different expression patterns?
SPH 247 Statistical Analysis of Laboratory Data
85
May 5, 2015
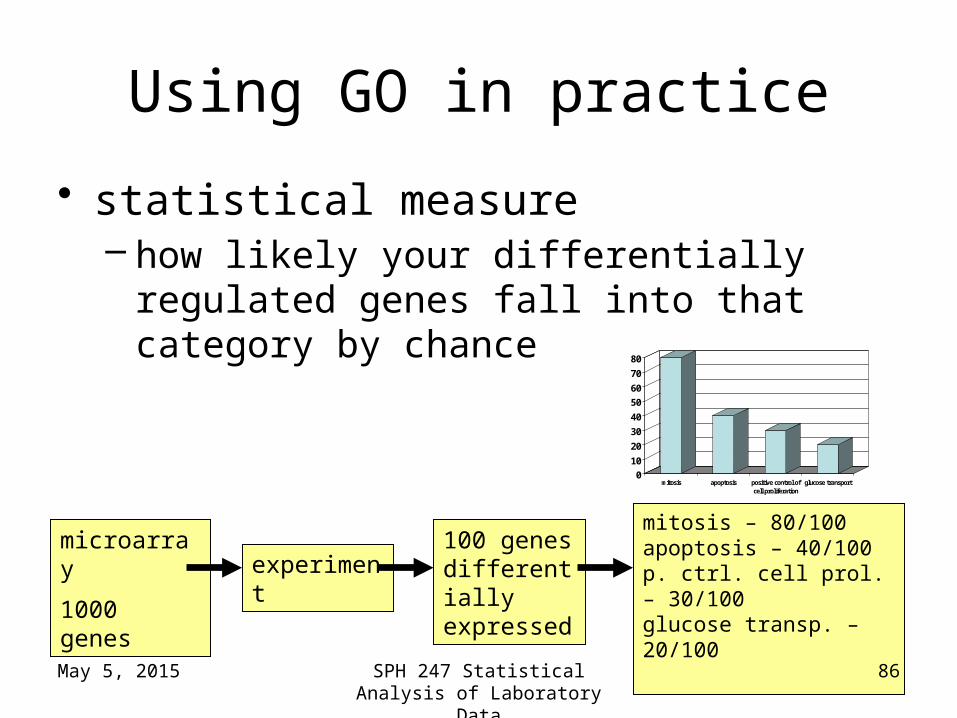
Using GO in practice
• statistical measure – how likely your differentially regulated genes
fall into that category by chance
microarray
1000 genesexperiment
100 genes differentially expressed
mitosis – 80/100apoptosis – 40/100p. ctrl. cell prol. – 30/100glucose transp. – 20/100
0
10
20
30
40
50
60
70
80
mitosis apoptosis positive control ofcell proliferation
glucose transport
SPH 247 Statistical Analysis of Laboratory Data
86
May 5, 2015
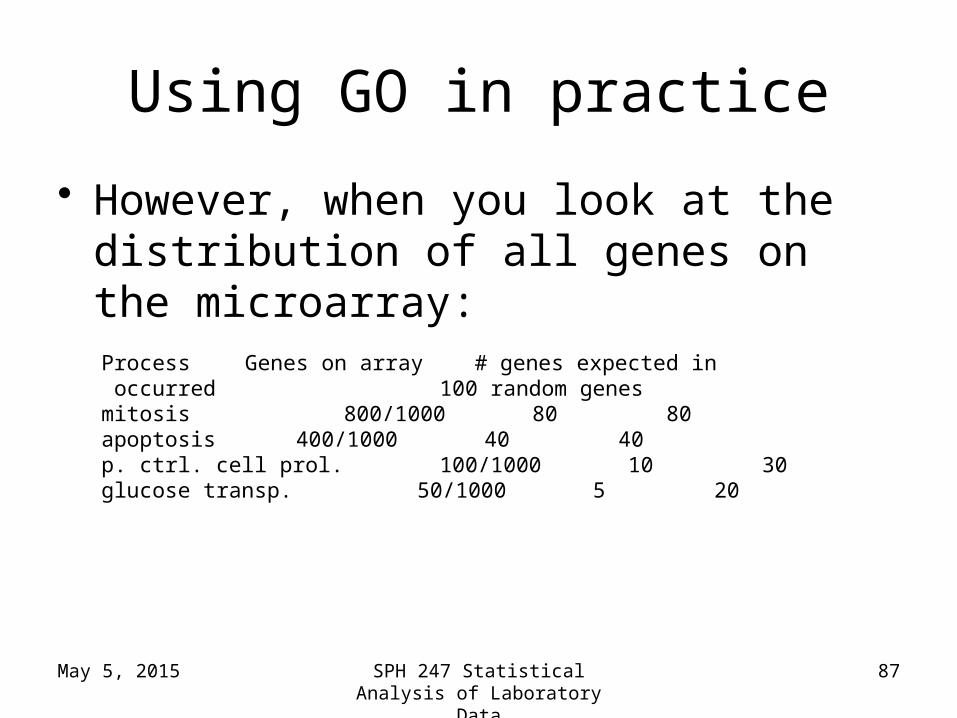
Using GO in practice
• However, when you look at the distribution of all genes on the microarray:
Process Genes on array # genes expected in occurred 100 random genes
mitosis 800/1000 80 80apoptosis 400/1000 40 40p. ctrl. cell prol. 100/1000 10 30 glucose transp. 50/1000 5 20
SPH 247 Statistical Analysis of Laboratory Data
87
May 5, 2015
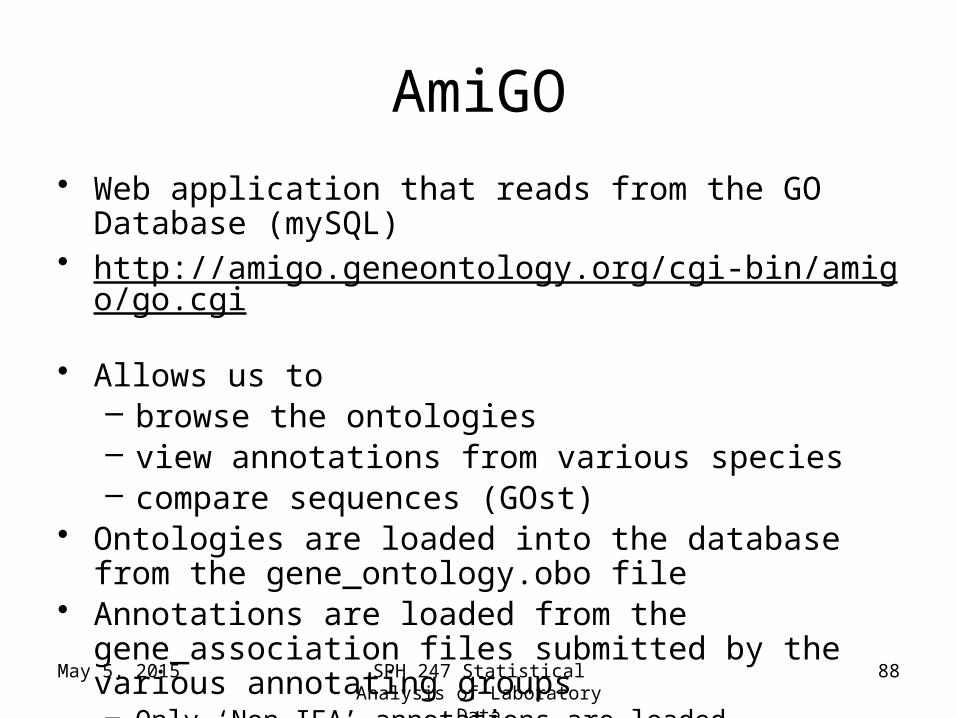
AmiGO
• Web application that reads from the GO Database (mySQL)
• http://amigo.geneontology.org/cgi-bin/amigo/go.cgi • Allows us to
– browse the ontologies– view annotations from various species– compare sequences (GOst)
• Ontologies are loaded into the database from the gene_ontology.obo file
• Annotations are loaded from the gene_association files submitted by the various annotating groups– Only ‘Non-IEA’ annotations are loaded
SPH 247 Statistical Analysis of Laboratory Data
88
May 5, 2015
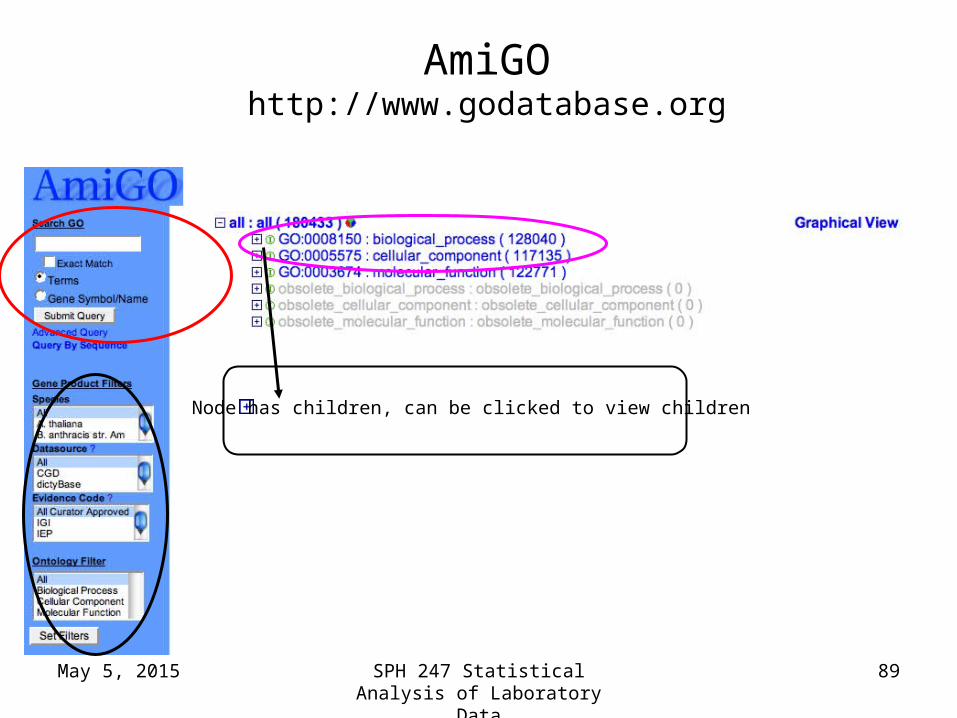
AmiGOhttp://www.godatabase.org
Node has children, can be clicked to view children
SPH 247 Statistical Analysis of Laboratory Data
89
May 5, 2015
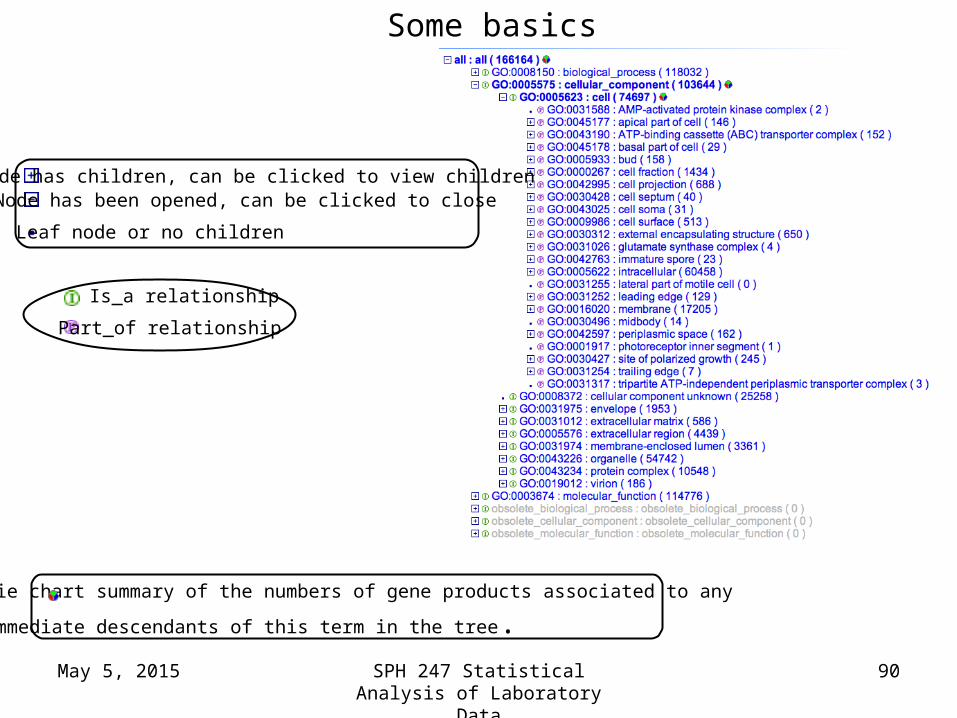
Leaf node or no children
Node has been opened, can be clicked to closeNode has children, can be clicked to view children
Is_a relationship
Part_of relationship
Some basics
pie chart summary of the numbers of gene products associated to any
immediate descendants of this term in the tree.SPH 247 Statistical Analysis of
Laboratory Data90

May 5, 2015
Searching the Ontologies
SPH 247 Statistical Analysis of Laboratory Data
91

May 5, 2015
Term Tree View
SPH 247 Statistical Analysis of Laboratory Data
92

May 5, 2015
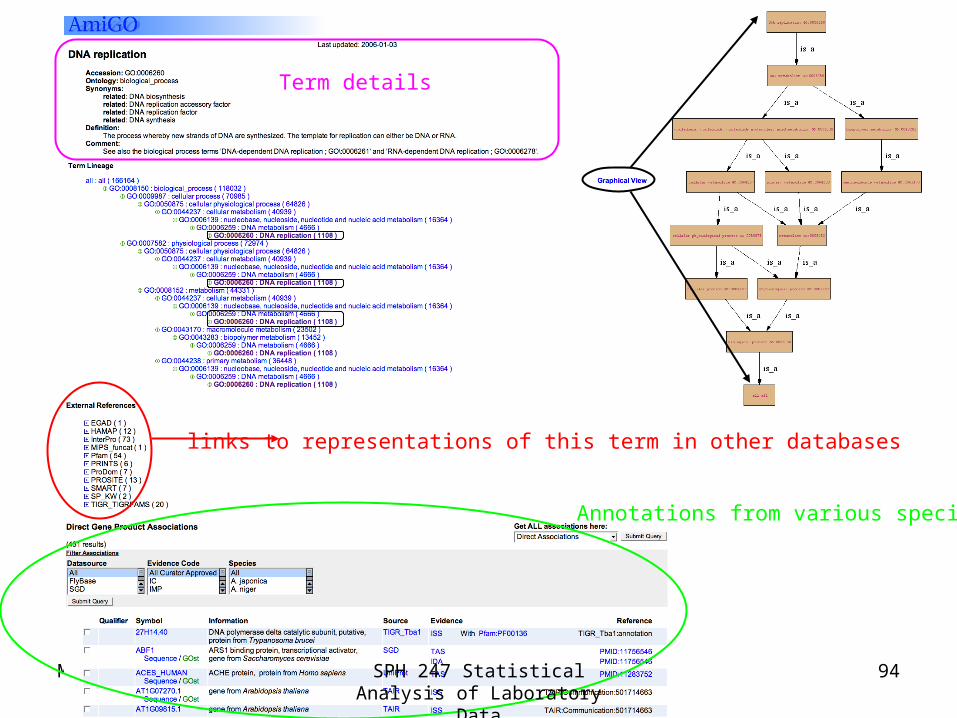
Click on the term name to view term details and annotations
SPH 247 Statistical Analysis of Laboratory Data
93
May 5, 2015
links to representations of this term in other databases
Term details
Annotations from various species
SPH 247 Statistical Analysis of Laboratory Data
94
May 5, 2015
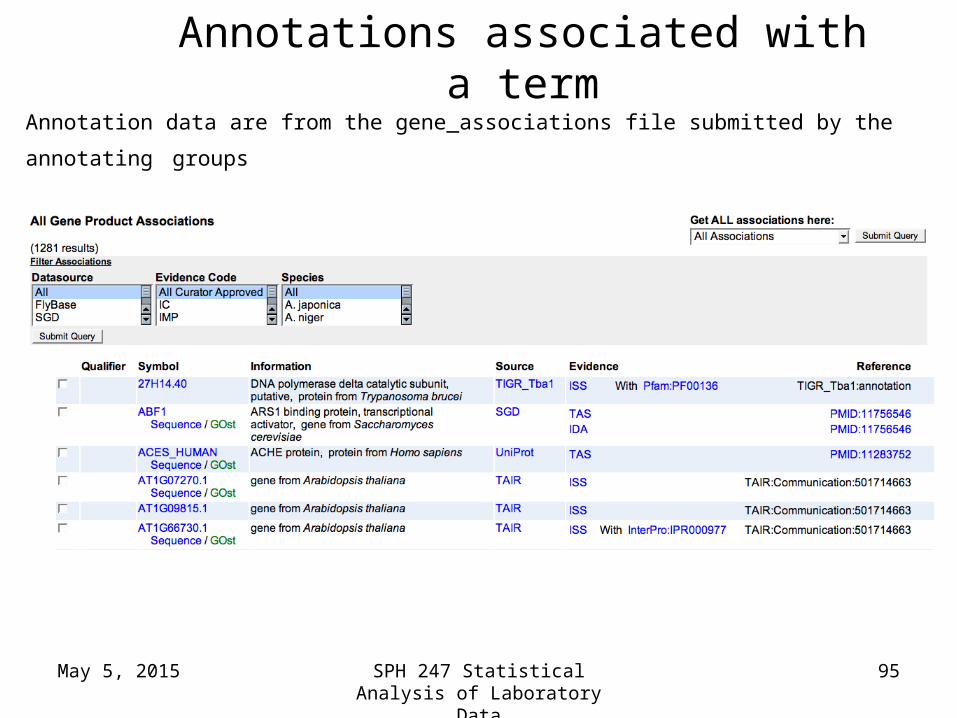
Annotations associated with a term
Annotation data are from the gene_associations file submitted by the annotating groups
SPH 247 Statistical Analysis of Laboratory Data
95
May 5, 2015
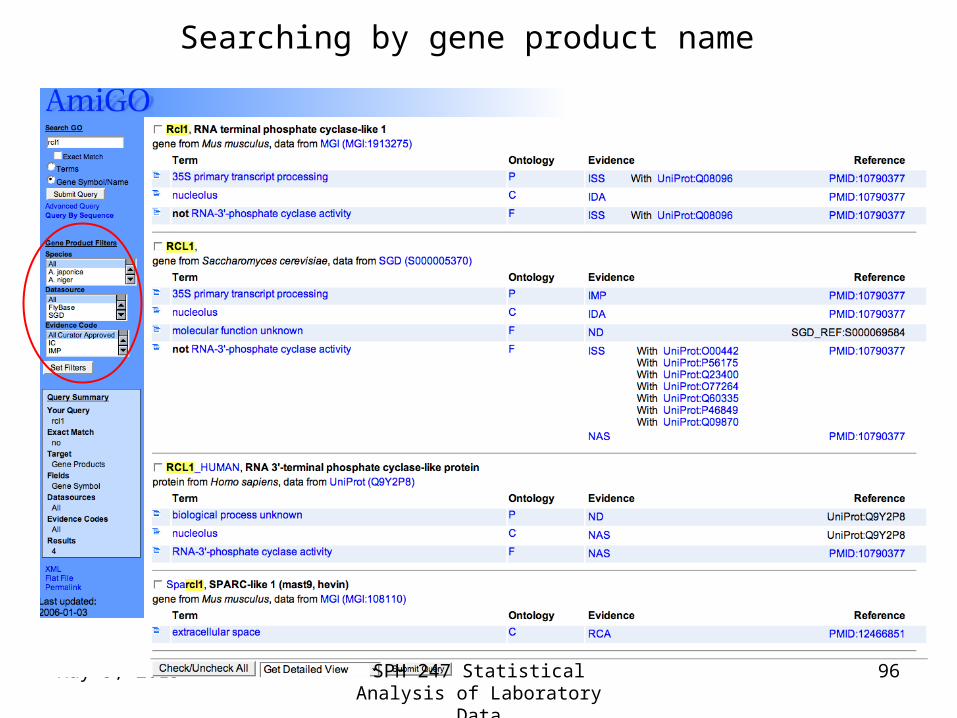
Searching by gene product name
SPH 247 Statistical Analysis of Laboratory Data
96
May 5, 2015
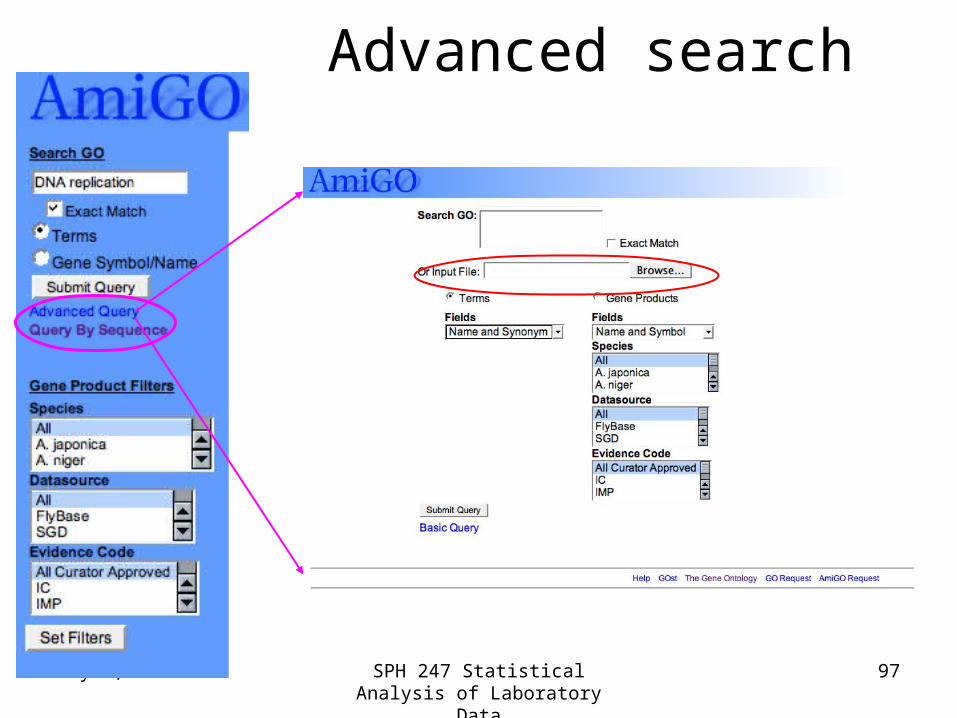
Advanced search
SPH 247 Statistical Analysis of Laboratory Data
97

May 5, 2015
GOST-Gene Ontology blaST• Blast a protein sequence against all gene products that have a GO
annotation• Can be accessed from the AmiGO entry page (front page)
SPH 247 Statistical Analysis of Laboratory Data
98
May 5, 2015
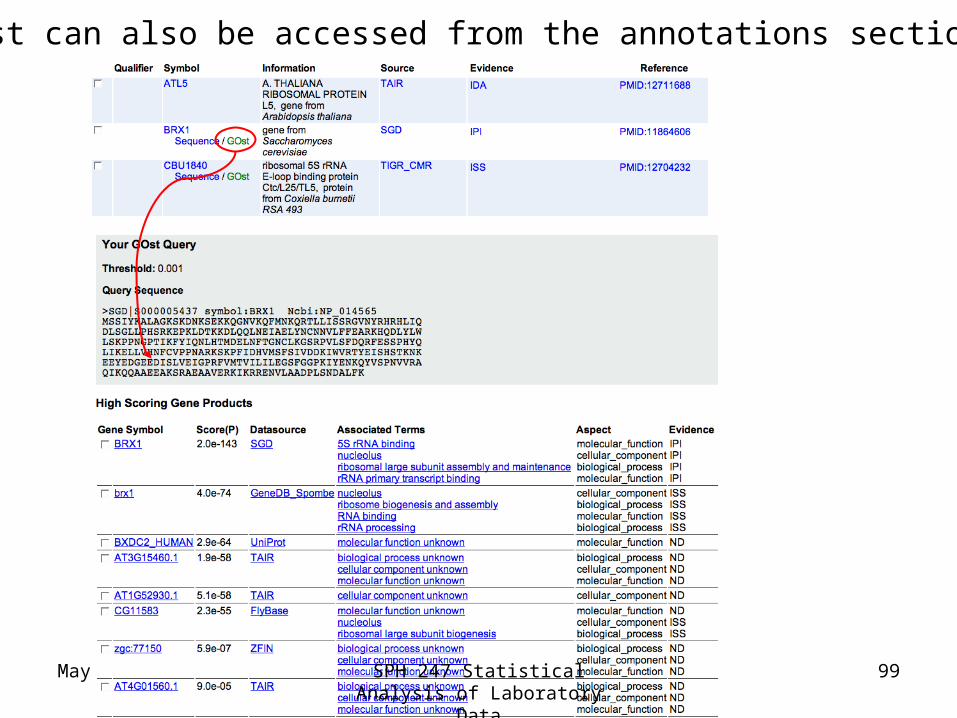
GOst can also be accessed from the annotations section
SPH 247 Statistical Analysis of Laboratory Data
99
May 5, 2015
Analysis of Gene Expression Data
• The usual sequence of events is to conduct an experiment in which biological samples under different conditions are analyzed for gene expression.
• Then the data are analyzed to determine differentially expressed genes.
• Then the results can be analyzed for biological relevance.
SPH 247 Statistical Analysis of Laboratory Data
100
May 5, 2015
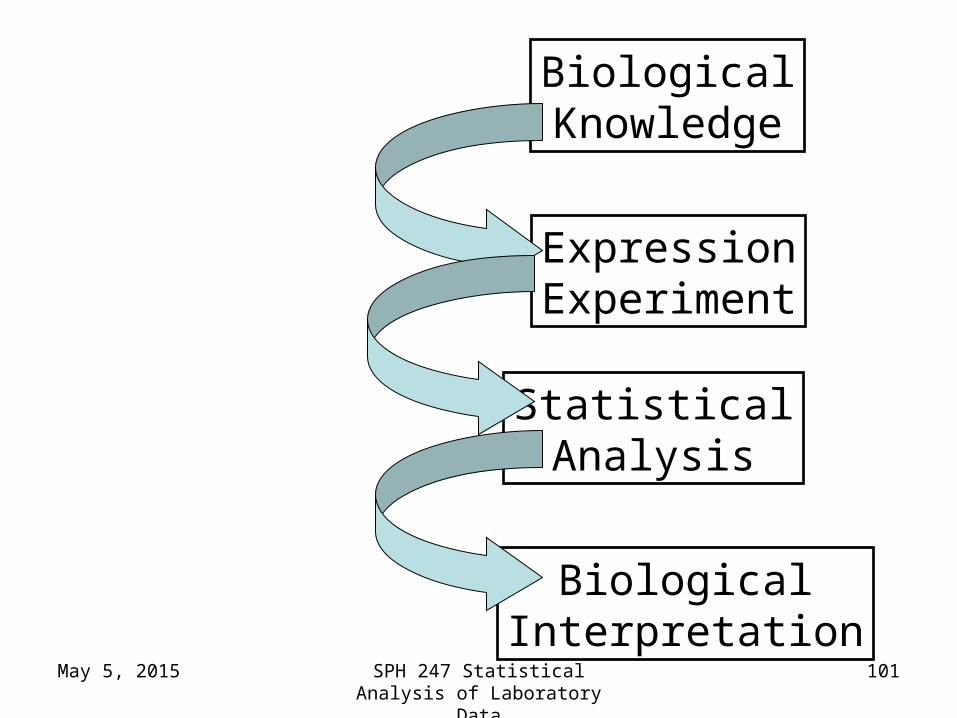
ExpressionExperiment
BiologicalKnowledge
BiologicalInterpretation
StatisticalAnalysis
SPH 247 Statistical Analysis of Laboratory Data
101
May 5, 2015
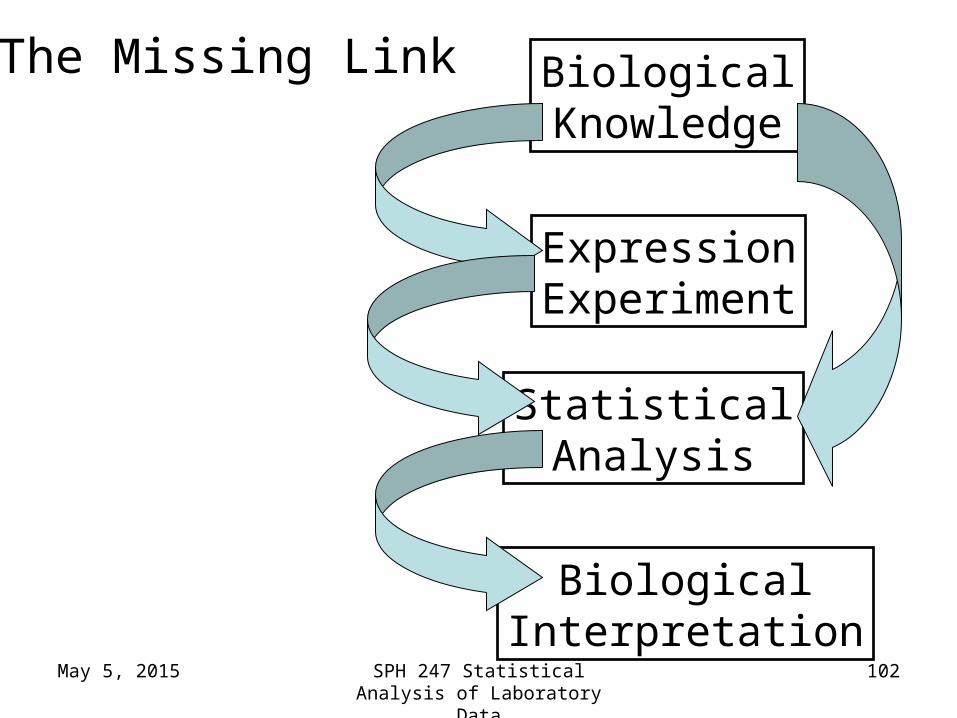
ExpressionExperiment
BiologicalKnowledge
BiologicalInterpretation
StatisticalAnalysis
The Missing Link
SPH 247 Statistical Analysis of Laboratory Data
102
May 5, 2015
Gene Set Enrichment Analysis (GSEA)
• Given a set of genes (e.g., zinc finger proteins), this defines a set of probes on the array.
• Order the probes by smallest to largest change (we use p-value, not fold change).
• Define a cutoff for “significance” (e.g., FDR p-value < .10).
• Are there more of the probes in the group than expected?
SPH 247 Statistical Analysis of Laboratory Data
103
May 5, 2015
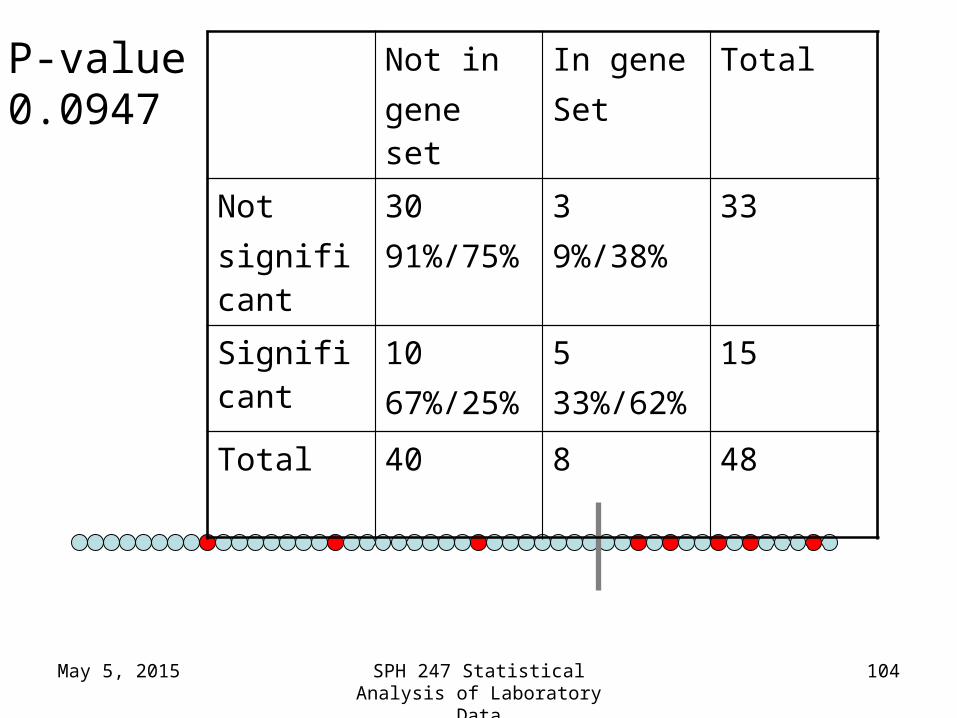
Not in gene set
In geneSet
Total
Not significant
3091%/75%
39%/38%
33
Significant 1067%/25%
533%/62%
15
Total 40 8 48
P-value0.0947
SPH 247 Statistical Analysis of Laboratory Data
104
May 5, 2015
GSEA for all cutoffs
• If one does GSEA for all possible cutoffs, and then takes the best result, this is equivalent to an easily performed statistical test called the Kolmogorov-Smirnov test for the genes in the set vs. the genes not in the set.
• Programs on www.broad.mit.edu/gsea/ • However this requires a single summary number
for each gene, such as a p-value.
SPH 247 Statistical Analysis of Laboratory Data
105
May 5, 2015
An Example Study• This study examined the effects of relatively low-dose
radiation exposure in-vivo in humans with precisely calibrated dose.
• Low LET ionizing radiation is a model of cellular toxicity in which the insult can be given at a single time point with no residual external toxic content as there would be for metals and many long-lived organics.
SPH 247 Statistical Analysis of Laboratory Data
106

May 5, 2015
The study design
• Men were treated for prostate cancer with daily fractions of 2 Gy for a total dose to the prostate of 74 Gy.
• Parts of the abdomen outside the field were exposed to lower doses.
• These could be precisely quantitated by computer simulation and direct measurements by MOSFETs.
SPH 247 Statistical Analysis of Laboratory Data
107

May 5, 2015
• A 3mm biopsy was taken of abdominal skin before the first exposure, then three more were taken three hours after the first exposure at sites with doses of 1, 10, and 100 cGy.
• RNA was extracted and hybridized on Affymetrix HG U133 Plus 2.0 whole genome arrays.
• The question asked was whether a particular gene had a linear dose response, or a response that was linear in (modified) log dose (0, 1, 10, 100 -> -1, 0, 1, 2).
SPH 247 Statistical Analysis of Laboratory Data
108

May 5, 2015
Why is this difficult?
• For a single patient, there are only 4 data points, so the statistical test is not very powerful.
• With 54,675 probe sets, very apparently significant results can happen by chance, so the barrier for true significance is very high.
• This happens in any small sized array study.
SPH 247 Statistical Analysis of Laboratory Data
109

May 5, 2015
• There are reasons to believe that there may be inter-individual variability in response to radiation.
• This means that we may not be able to look for results that are highly consistent across individuals.
• One aspect is the timing of transcriptional cascades.
• Another is polymorphisms that lead to similar probes being differentially expressed, but not the same ones.
SPH 247 Statistical Analysis of Laboratory Data
110

May 5, 2015
Gene 1
Gene 2
Gene 3
Gene1
Gene 2
Gene 3
3 Hours
SPH 247 Statistical Analysis of Laboratory Data
111
May 5, 2015
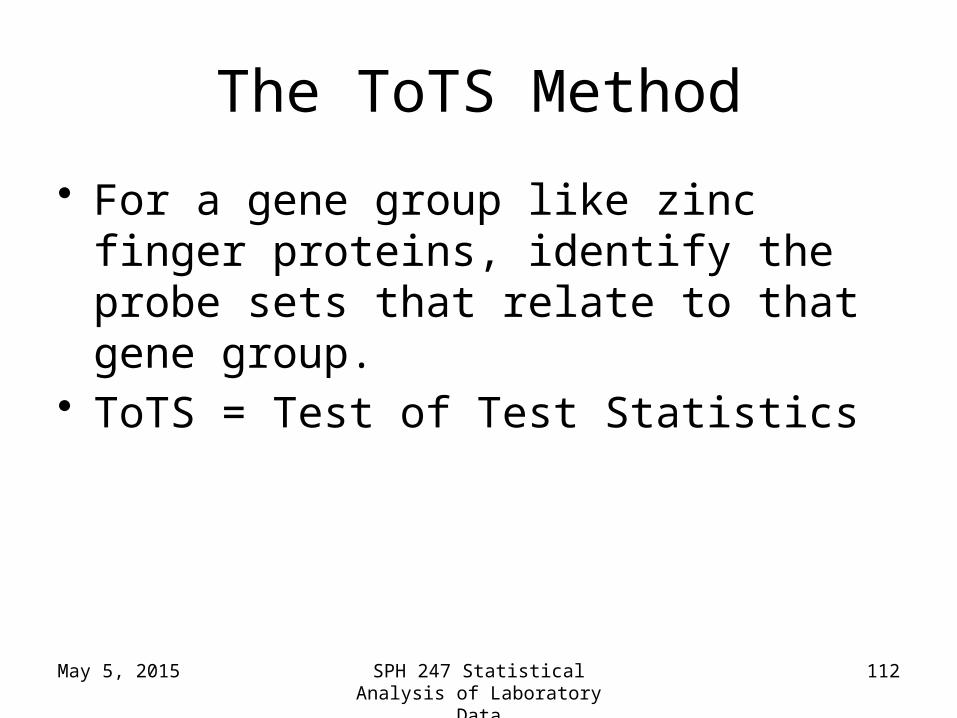
The ToTS Method
• For a gene group like zinc finger proteins, identify the probe sets that relate to that gene group.
• ToTS = Test of Test Statistics
SPH 247 Statistical Analysis of Laboratory Data
112

May 5, 2015
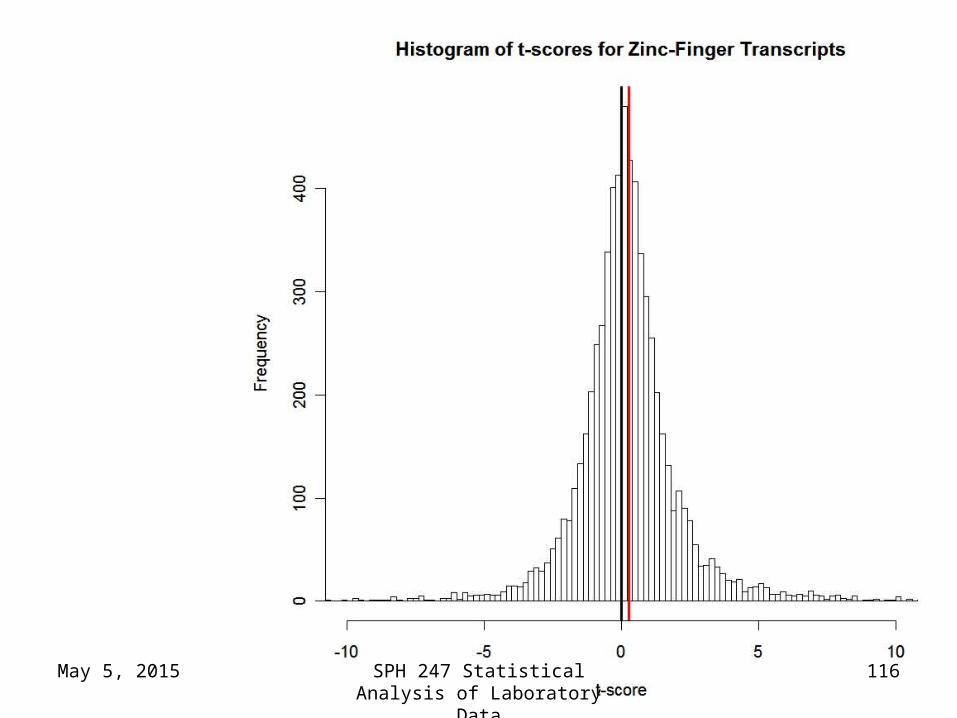
• For each probe set, conduct a statistical test to try to show a linear dose reponse.
• This yields a t-statistic, which may be positive or negative.
• Conduct a statistical test on the group of t-statistics, testing the hypothesis that the average is zero, vs. leaning to up-regulation or leaning to down-regulation
• This could be a t-test, but we used in this case the Wilcoxon test.
SPH 247 Statistical Analysis of Laboratory Data
113
May 5, 2015
• This can be done one patient at a time, but we can also accommodate inter-individual variability in a study with more than one individual by testing for an overall trend across individuals
• This is not possible using GSEA, so the ToTS method is more broadly applicable.
• This was published in October, 2005 in Bioinformatics.
SPH 247 Statistical Analysis of Laboratory Data
114

May 5, 2015
Integrity and Consistency
• For zinc finger proteins, there are 799 probe sets and 8 patients for a total of 6,392 different dose-response t-tests
• The Wilcoxon test that the median of these is zero is rejected with a calculated p-value of 0.00008.
• We randomly sampled 2000 sets of probe sets of size 799, and in no case got a more significant result. We call this an empirical p-value (0.000 in this case).
• This is needed because the 6,392 tests are all from 32 arrays
SPH 247 Statistical Analysis of Laboratory Data
115
May 5, 2015 SPH 247 Statistical Analysis of Laboratory Data
116

May 5, 2015
Patient Direction EPV1 Up 0.1252 Down 0.0443 Down 0.0014 Up 0.0005 Up 0.0036 Up 0.0007 Up 0.0008 Up 0.039All Up 0.000
SPH 247 Statistical Analysis of Laboratory Data
117

May 5, 2015
Major Advantages
• More sensitive to weak or diffuse signals• Able to cope with inter-individual variability
in response• Conclusions are solidly based statistically• Can use a variety of types of biological
knowledge
SPH 247 Statistical Analysis of Laboratory Data
118

Assessing Significance
• For each gene set, hypergeometric = Fisher’s exact test.
• Not robust to correlations.• Simple to implement• Requires specific cutoff• GSEA KS test is a generalization if used with the
standard KS significance points• Must be adjusted (say, by FDR) if many gene
sets are used.
May 5, 2015 SPH 247 Statistical Analysis of Laboratory Data
119

Assessing Significance
• Array permutation, compare significance of set to significance of same set under permutations.
• If there are 12 control and 12 treatment arrays, then there are 2,704,156 ways to choose 12 arrays from the 24 without regard to treatment assignment. P-values can be down to 4×10⁻⁷.
• Can only test the complete null if there is more than one factor.
May 5, 2015 SPH 247 Statistical Analysis of Laboratory Data
120
Assessing Significance
• Gene permutation can test any hypothesis.• Compare given gene set to random gene sets
from the same set of arrays. • This tests if the given gene set is extreme from a
random gene set.• Array permutation tests if a given gene set is
surprising regardless of other gene sets.• These are different hypotheses, but both may be
useful.
May 5, 2015 SPH 247 Statistical Analysis of Laboratory Data
121
May 5, 2015
Exercise
• Take the top 10 genes from the keratinocyte gene expression study and map their go annotations using AMIGO.
• Are there any obvious common factors?• Do you think this would work better if you
looked at all the significant genes and all the GO annotations, or would this be too difficult?
SPH 247 Statistical Analysis of Laboratory Data
122