Embed Size (px)
Citation preview

GENDER DIMENSIONS
Dr Lawrence IkamariPopulation Studies and Research
InstituteUniversity of [email protected]
1

Outline of the Presentation
Objectives of the presentation Introduction: Definitions & importance of
gender disaggregated data Gender dimensions in key demographic
parameters Gender dimensions in education and
labour force Gender dimensions in disability Concluding remarks
2
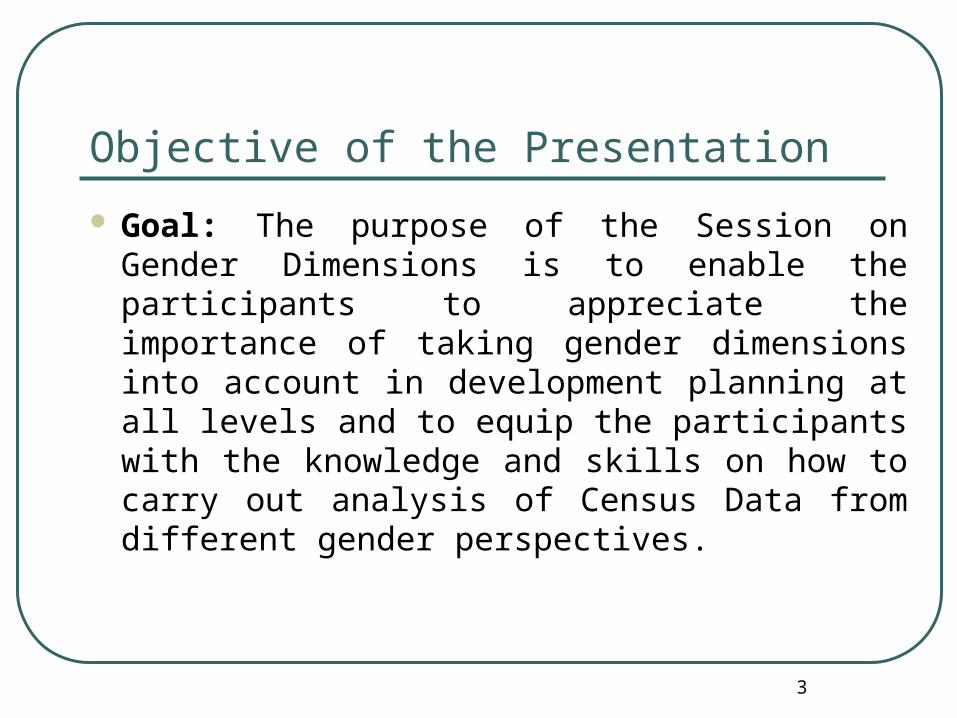
Objective of the Presentation
Goal: The purpose of the Session on Gender Dimensions is to enable the participants to appreciate the importance of taking gender dimensions into account in development planning at all levels and to equip the participants with the knowledge and skills on how to carry out analysis of Census Data from different gender perspectives.
3

Objective of the Presentation
At the end of the session participants will be able to:
State the rationale for gender disaggregated data
Describe the key gender concepts Describe how to prepare data for gender
analysis. Describe how to carry out gender analysis Describe how to present gender
disaggregated data4

Introduction: definitionsKey Concept in Gender Perspectives• Gender• Sex• Gender Analysis• Gender relations• Gender issues• Women issues• Gender inequality
5

Introduction: definitions
Key Concept in Gender Perspectives• Gender Parity Index• Gender Gaps• Gender Development Index (GDI)• Gender aware planning/gender
mainstreaming
6

Introduction: definitions
Gender Gender is a socio-cultural construct of the
society that determines the identity, roles or obligations/duties, and entitlements of women and men and girls and boys in the society. It therefore defines women and men’s position in their society. Gender classification changes with time, space and needs of a society
7

Introduction: definitions
Sex Sex is a biological identification of
females and males based on their physiological characteristics. Sex characteristics are natural and determined during conception; compared to gender which identifies qualities that are shaped through the history of social relations and interactions in society
8

Introduction: definitions of concepts
Sex ratio Sex ratio is the number of males per
100 women, and is sometimes also referred to as the gender ratio
9

Introduction: definitions
Gender relations Gender relations are social-cultural
relationships between men and women in a given society. They are socially constructed and not derived from biology. Gender relations distinguish social relations between men and women from those characteristics which can be derived from biological differences
10

Introduction: definitions Gender inequality Gender inequality means unequal access to
resources and benefits by women and men and therefore holds back the growth of individuals in society
Gender gaps Gender gaps refer to the differences between
women and men in relation to their participation in and benefits from different socio-economic sectors. Gender gaps come about as a result of unequal power relations between women and men and between boys and girls
11

Introduction: definitions The gender gap measures the magnitude of
disparities and is normally computed in percentage points or the difference between percentage for females and percentage for males.
Gender Parity Index Gender Parity Index (GPI) is a socioeconomic
index usually designed to measure the relative access to education for both females and males. It is calculated as the ratio of the number of female students enrolled at primary, secondary and tertiary levels of education to the number of male students in each level
12

Introduction: definitions
Gender analysis
This is the process of examining roles and responsibilities or any other situation in regard to women, men, boys and girls, with a view to identifying gaps, raising concern and addressing them, investigating and identifying specific needs for policy and programme development and implementation
13
Introduction: definitions
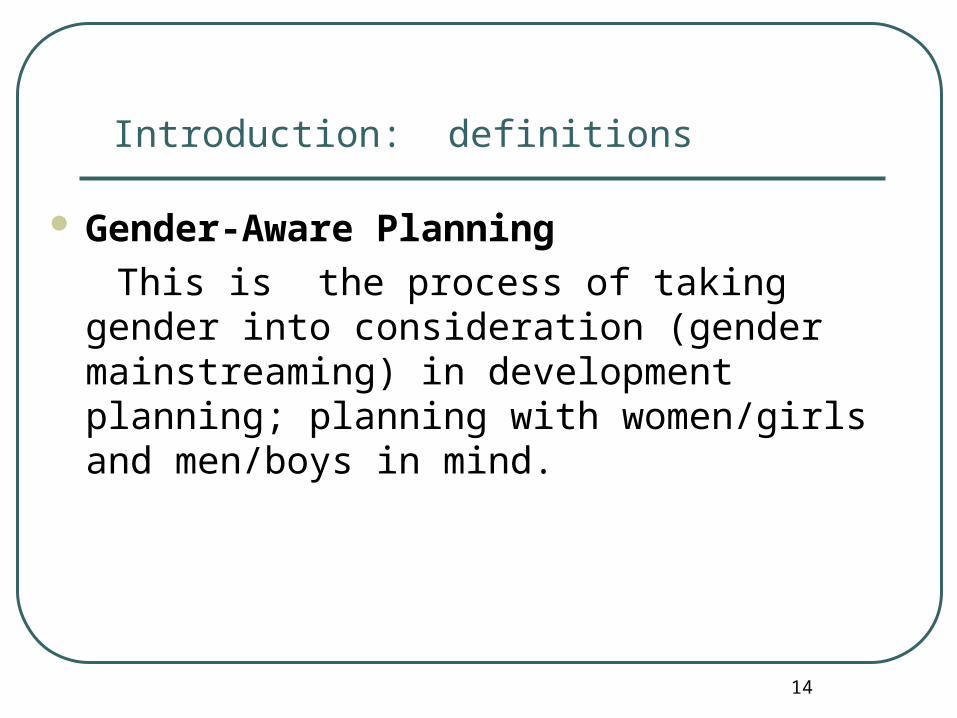
Gender-Aware Planning
This is the process of taking gender into consideration (gender mainstreaming) in development planning; planning with women/girls and men/boys in mind.
14

Introduction: definitions
Gender issues Gender issues refers to opportunities,
challenges and constraints that affect both women, men, girls and boys in the society. Gender issues are not synonymous with women’s issues
Women’s issues Women issues refer to opportunities, challenges
and constraints that affect women/girls only
15

Rationale for Gender disaggregated data
International and national commitment to promote gender equality and women empowerment•Many international conventions and instruments such as
CEDAW, Beijing Platform for Action, and the United Nations Universal Declaration of Human Rights
•ICPD 1994 Plan of Action
•Millennium Development Goals Enactment of various laws and policy frameworks,
and set up several bodies at national and lower levels in order to advance, coordinate and monitor Gender issues. E.G;
16
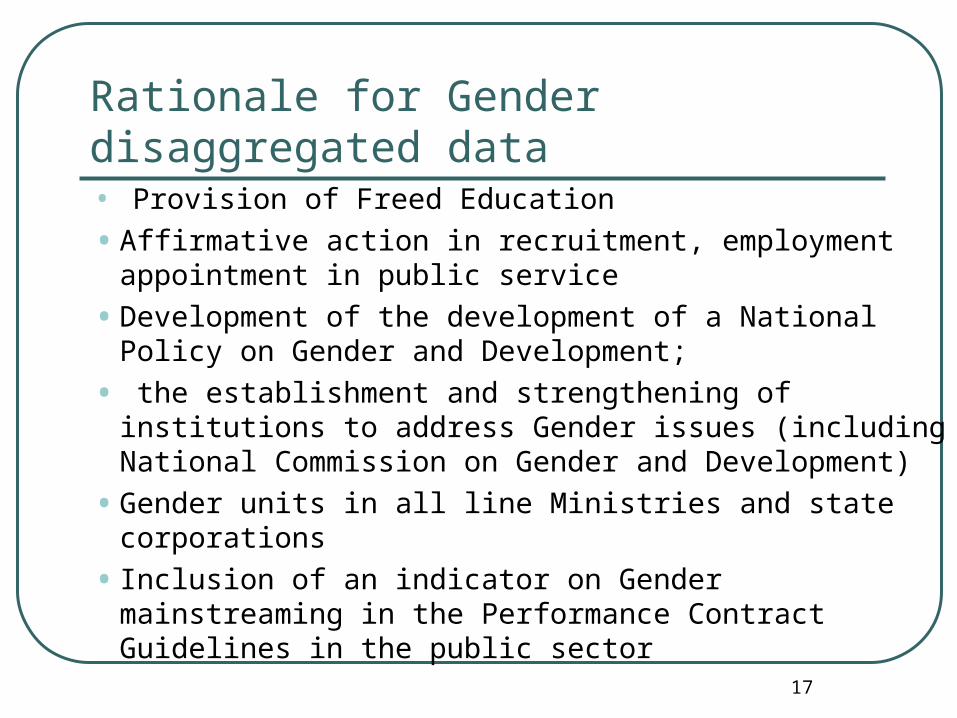
Rationale for Gender disaggregated data• Provision of Freed Education
•Affirmative action in recruitment, employment appointment in public service
•Development of the development of a National Policy on Gender and Development;
• the establishment and strengthening of institutions to address Gender issues (including National Commission on Gender and Development)
•Gender units in all line Ministries and state corporations
• Inclusion of an indicator on Gender mainstreaming in the Performance Contract Guidelines in the public sector
17

Rationale for Gender disaggregated data
• the Political Parties Act (2007) provides for at least one third representation of either Gender in political parties
• the Employment Act of 2007 prohibits termination of employment on account of pregnancy and provides for three months maternity leave and two weeks of paternity leave with full pay
•The New Constitution• Has several provisions for affirmative action
•Vision 2030• aims at providing high quality of life to all citizens by
the year 2030
18

Rationale for Gender disaggregated data
•Lack of gender disagregated data at the various planning levels
19

3: Gender dimensions
Gender dimensions by key demographic parameters
o Population age and sex
20

Methodology
In the 2009 Kenya Population and Housing Census Questionnaire, the information on Gender was captured using question (P-11) on the gender of members of the household where, 1=Male and 2=Female
There are two approaches to measuring Gender gaps. First is the incident approach where the denominator is the total female or male in a particular sector
21

Population distribution by age and sex
Data required: Population distributed by a specified age group
(e.g. 5 year group, 0-14, 15-24, 15-64, 65+ and by sex (either absolute or percentage)
Population distributed by a specified age group (e.g. 5 year age group, 0-14, 15-24, 15-64, 65+ by sex and by province (either absolute figures or percentages)
Method:Then graph the figures using a bar chart using
excel
22

Population distribution by age and sex, Kenya, 2009
23
3,000,000 2,000,000 1,000,000 0 1,000,000 2,000,000 3,000,000
0-45-9
10-1415-1920-2425-29
30-3435-3940-4445-4950-54
55-5960-6465-6970-7475++
Male Female

Percentage distribution of population distribution aged 0-14 years by sex and province, Kenya, 2009
24

Percentage distribution of population aged 15-24 by sex and province, Kenya 2009
25
51 56 51 53 50
4153 51 5249 44 49 47 50
5947 49 48
Perc
ent
Province
Female Male

Percentage of the population aged aged 65+ by Sex, Kenya: 2009
26

Population distribution by marital status and sex
Basic measures of marriage: Marital status: Percentage distribution of the
population by current marital status classified by sex and other attributes of interest
Singulate Mean Age at Marriage (SMAM): This is an estimate of the average number of years lived in a single status by those who ever marry before age 50. A high SMAM therefore means a later age at first marriage
(Show formula for calculating SMAM)27

Population distribution by marital status and sex, Kenya, 2009
28
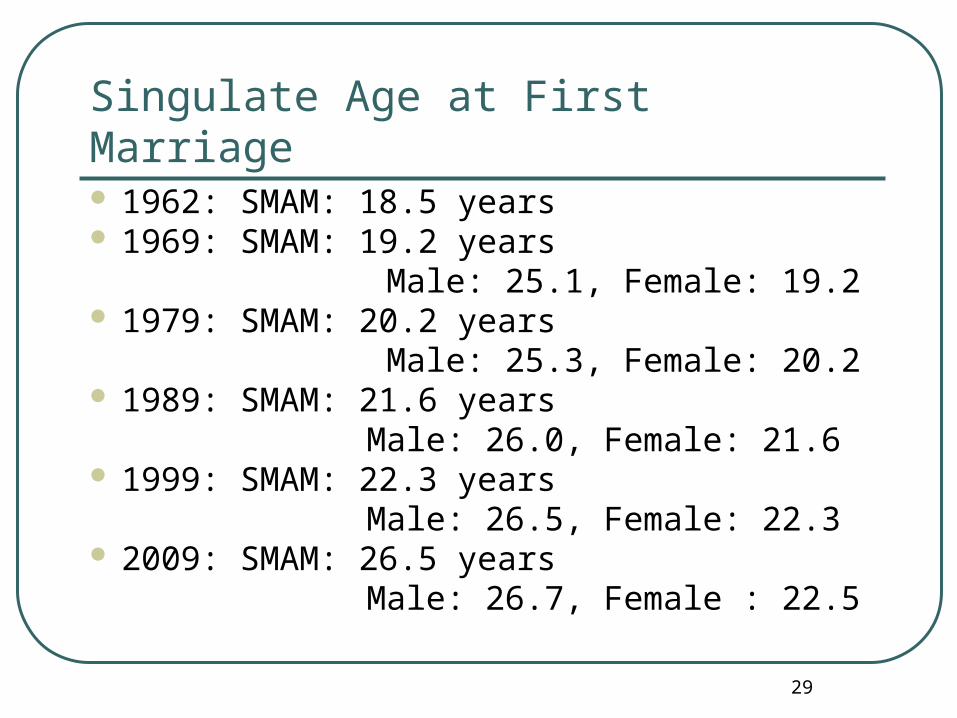
Singulate Age at First Marriage 1962: SMAM: 18.5 years 1969: SMAM: 19.2 years Male: 25.1, Female: 19.2 1979: SMAM: 20.2 years Male: 25.3, Female: 20.2 1989: SMAM: 21.6 years Male: 26.0, Female: 21.6 1999: SMAM: 22.3 years Male: 26.5, Female: 22.3 2009: SMAM: 26.5 years Male: 26.7, Female : 22.5
29

Trends in the singulate mean age at marriage, Kenya, 1989-2009 Census Data
Age group 1989 1999 2009
Female Male Female Male Female Male
15-19 81.2 97.9 81.2 97.1 84.4 96.820-24 35.3 79.1 38.0 77.1 41.4 79.625-29 15.8 38.3 21.0 41.3 21.0 41.730-34 9.0 14.4 11.3 16.4 12.2 18.235-39 6.3 8.6 8.0 8.6 9.1 9.840-44
5.1 6.9 5.8 5.6 7.4
6.745-48
4.1 6.1 4.8 4.8 6.4
4.9 Total
21.6 26.0
22.3 26.5 22.5
26.7
30

Trends in the singulate mean age at marriage (SMAM), Kenya and by Province; 1999-2009 Census Data
Province 1999 2009
Female Male Female Male
Nairobi 23.5 26.8 23.7 26.8Central 23.7 27.5 23.2 27.8Coast 21.3 26.7 22.0 26.7Eastern 23.1 27.2 22.9 27.7Nyanza 20.5 26.5 21.8 27.1Rifty Valley 20.9 25.4 21.4 25.5Western 22.1 26.3 22.4 26.7Kenya
22.3 26.5 22.5
26.731

Singulate Mean Age at Marriage (SMAM) by Sex and Province, Kenya 2009
32

Infant and under mortality by sex
Measures of mortality are desirable disaggregated by sex and
other attributes of interest. These can be obtained using indirect methods using QFIVE software. This requires basic data
• Number of children ever born classified by 5 year group of mother and sex
• Number of children dead classified by 5 year group of mother and sex
• Number of women aged 15-49 classified by 5 year group
33

Life expectation at birth by sex and province, Kenya: 2009
34

Gender Dimensions in Education
Data required:• School attendance among the
population aged at least 3 year classified by a specified age group, sex and other attribute of interest
•Educational attainment among the population aged at least 3 years classified by a specified age group, sex and other attribute of interest
35

Percentage of the population by school attendance status by sex, Kenya: 2009
36

37
Percentage distribution of the population aged at least 3 years by school attendance, sex and rural-urban residence

Percentage of the population attending school by age and sex, Kenya: 2009
38

Percentage of population age at least 3 years by sex, Kenya: 2009
39

Percentage of the population with no education by sex, residence and province, Kenya: 2009
40

Percentage of the population with completed primary education by sex, residence and province, Kenya: 2009
41

Percentage of the population with at least secondary education by sex, residence and province, Kenya: 2009
42

Gender dimensions in Labour force
Data required:• Economic activity among the
population aged 5 years and above classified by sex and attribute of interest
43

Percentage of the population age at least 5 years by sex and economic status, Kenya, 2009
44

Percentage of the population age at least 5 years by sex, economic status, rural-urban residence, Kenya, 2009
45

Percentage of the population by age, economic status and sex, Kenya: 2009
46
Age
Group Women Men Gender
GapWomen Men Gender
GapWomen Men Gender
GapWomen Men Gender
GapTotal 50.5 49.5 1.0 46.7 53.3 -6.6 46.8 53.2 -6.4 56.0 44.0 12.0
5 - 9 49.3 50.7 -1.4 47.5 52.5 -5.0 0.0 0.0 0.0 49.7 50.3 -0.6
10 - 14 48.8 51.2 -2.4 46.1 53.9 -7.8 0.0 0.0 0.0 49.6 50.4 -0.8
15 - 19 49.1 50.9 -1.8 47.4 52.6 -5.2 47.0 53.0 -6.0 50.1 49.9 0.2
20 - 24 53.7 46.3 7.4 50.0 50.0 0.0 49.1 50.9 -1.8 63.7 36.3 27.4
25 - 29 52.5 47.5 5.0 46.7 53.3 -6.6 47.5 52.5 -5.0 83.4 16.6 66.8
30 - 34 50.4 49.6 0.8 45.0 55.0 -10.0 44.6 55.4 -10.8 87.8 12.2 75.6
35 - 39 50.3 49.7 0.6 45.4 54.6 -9.2 43.9 56.1 -12.2 88.1 11.9 76.2
40 - 44 49.9 50.1 -0.2 45.4 54.6 -9.2 41.4 58.6 -17.2 87.0 13.0 74.0
45 - 49 50.3 49.7 0.6 46.1 53.9 -7.8 42.3 57.7 -15.4 86.6 13.4 73.2
50 - 54 50.1 49.9 0.2 45.6 54.4 -8.8 41.8 58.2 -16.4 82.2 17.8 64.4
55 - 59 49.6 50.4 -0.8 45.4 54.6 -9.2 42.5 57.5 -15.0 73.3 26.7 46.6
60 - 64 50.2 49.8 0.4 45.5 54.5 -9.0 45.7 54.3 -8.6 70.9 29.1 41.8
65+ 54.4 45.6 8.8 48.1 51.9 -3.8 52.6 47.4 5.2 68.0 32.0 36.0
Total Working Unemployed Inactive
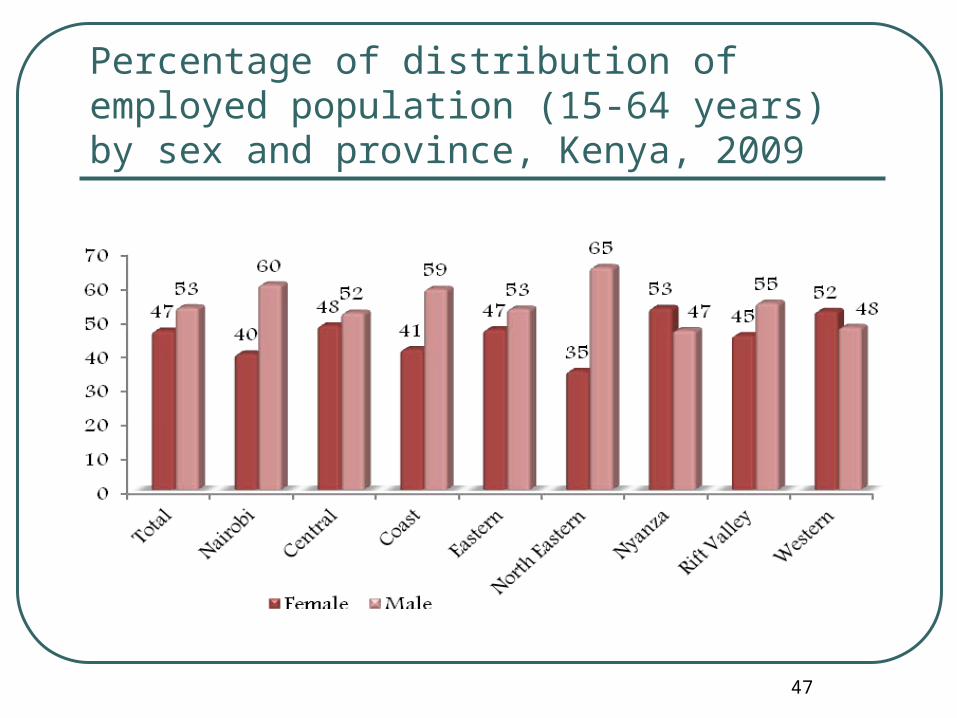
Percentage of distribution of employed population (15-64 years) by sex and province, Kenya, 2009
47

Percentage of the employed population by age, sex and economic activity, Kenya: 2009
48
Age Group
Worked for Pay Own/ Family business Own/ Agriculture Business
Women Men Gender
Gap Women Men Gender
Gap Women Men Gender
Gap 15 - 64 27 44 -17 21 18 3 50 36 14 15 - 19 23 23 -1 15 14 1 61 61 0 20 - 24 32 47 -15 20 16 4 46 35 11 25 - 29 32 52 -19 24 19 5 41 27 14 30 - 34 29 50 -21 25 21 4 44 28 16 35 - 39 27 48 -21 24 20 4 46 30 17 40 - 44 25 46 -21 22 20 3 50 32 18 45 - 49 22 44 -22 21 18 2 55 35 20 50 - 54 18 40 -21 19 18 1 61 40 21 55 - 59 13 30 -18 18 18 -1 68 49 18 60 - 64 9 22 -13 16 18 -2 73 57 15

Gender Dimensions in Disability
Data required:
Percentage of PWD by sex and attribute of interest
49

Percentage distribution of PWDs by Sex, Kenya: 2009
Sex Number %
Female 682,651 51.3
Male 647,715 48.7
Total 1,330,366 3.5 (of total
population)
50
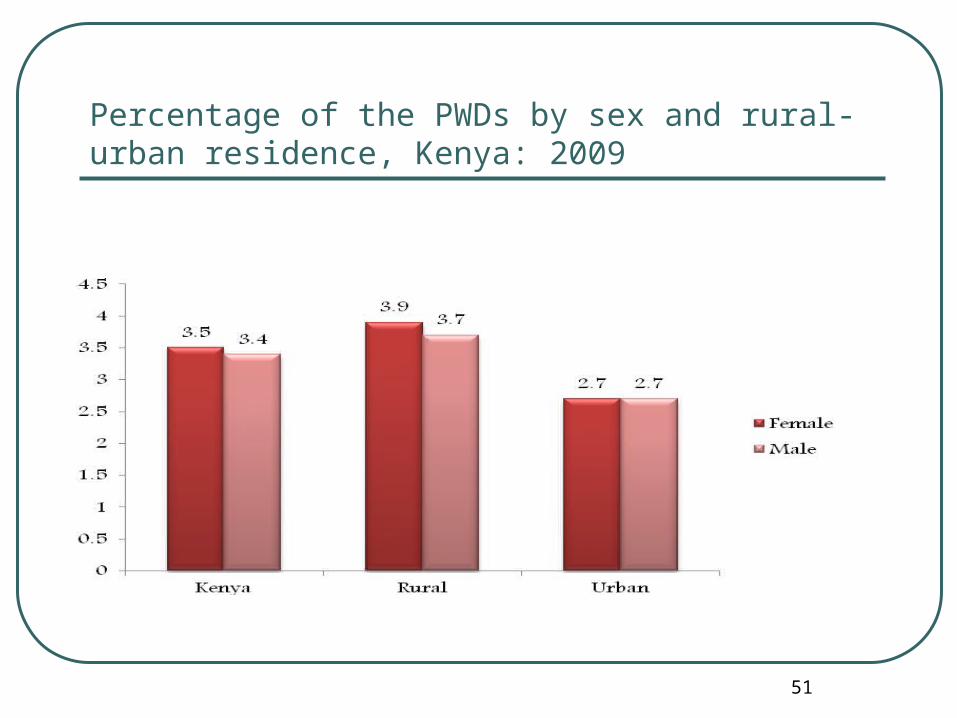
Percentage of the PWDs by sex and rural-urban residence, Kenya: 2009
51
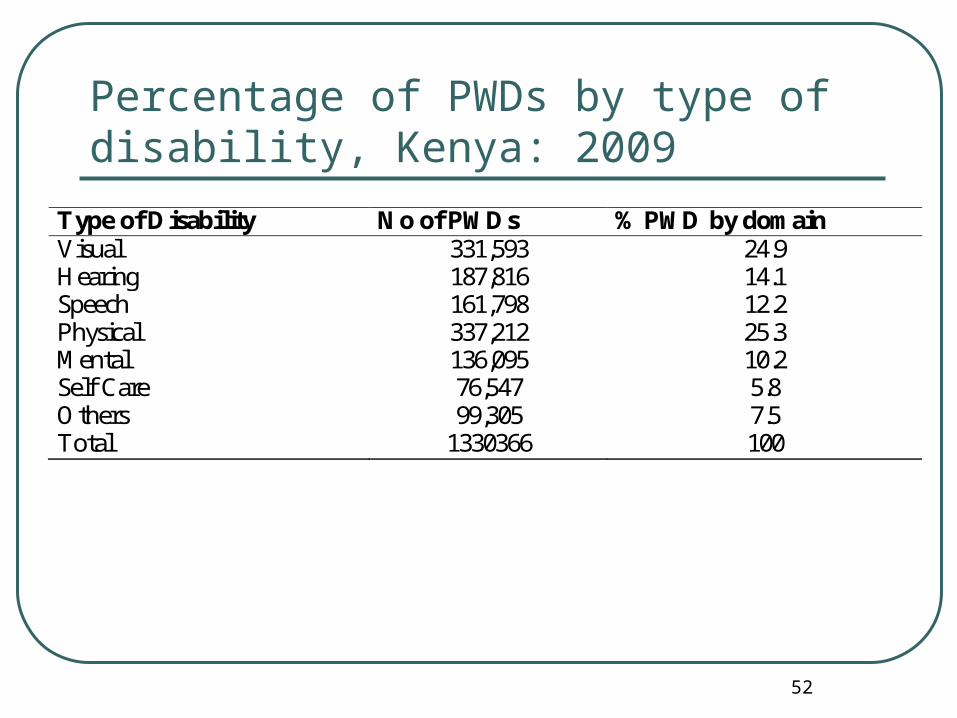
Percentage of PWDs by type of disability, Kenya: 2009
52
Type of Disability No of PWDs % PWD by domain Visual 331,593 24.9 Hearing 187,816 14.1 Speech 161,798 12.2 Physical 337,212 25.3 Mental 136,095 10.2 Self Care 76,547 5.8 Others 99,305 7.5 Total 1330366 100

Percentage of PWDs by school attendance status and sex, Kenya: 2009
53

Percentage of PWDs by type of disability, school attendance and sex, Kenya: 2009
54
Female MaleGender
Gap Female MaleGender
Gap Female MaleGender
Gap Female MaleGender
Gap
Visual 25 23 2 29 27 2 25 21 4 19 17 2
Hearing 20 19 1 11 10 1 15 15 0 16 13 3
Speech 17 18 -1 9 9 0 7 12 -5 12 16 -4
Physical 18 20 -2 28 31 -3 25 25 0 22 22 0
Mental 9 9 0 9 12 -3 9 14 -5 13 16 -3
Self-care 2 2 0 4 4 0 13 5 8 16 10 6
Other 9 8 1 10 7 3 6 4 2 5 5 0
Type of Disability
Currently Attending Previously Attended Never Attended DK

Percentage of PWDs by education attainment and sex, Kenya: 2009
55

Proportion of PWDs by economic Activity, Sex, residence and province, Kenya: 2009
56
Province/ Residence
Working Unemployed Inactive
Female Male Gender Gap Female Male
Gender Gap Female Male
Gender Gap
Kenya 53 58 -5 6 7 -1 41 34 6 Nairobi 49 63 -14 10 9 1 40 28 13 Central 49 54 -6 4 5 -1 47 40 7 Coast 45 56 -11 7 9 -2 48 35 13 Eastern 48 55 -7 5 6 -1 46 38 8 North Eastern 49 57 -8 16 18 -2 33 23 10 Nyanza 59 59 0 5 5 0 36 36 1 Rift Valley 51 59 -8 6 7 -1 42 33 9 Western 60 61 -1 4 5 -1 35 34 2 Total 53 58 -5 6 7 -1 41 34 6 Rural 55 59 -4 5 6 -1 40 34 5 Urban 45 57 -12 9 9 0 45 33 12 Peri-Urban 50 54 -4 6 7 -1 43 38 5
Appendix 1: Relevant ICPD & MDGS
ICPD & MDGS whose implementation and monitoring require gender disaggregated data
57

58
A SUMMARY OF ICPD GOALS FOR 2015
Achieve universal access to and completion of primary education, ensure the widest and earliest possible access by girls and women to secondary education and higher levels of education.
Provide universal access to full range of safe and reliable family planning methods and related reproductive health services.
Reduce infant mortality to below 35 infant deaths per 1000 live births and under five mortality rates to below 45 deaths per 1000 live births
Close the gap in maternal mortality between developing and developed countries. Aim to achieve a maternal mortality rate of below 60 deaths per 100,000 live births.

59
A SUMMARY OF ICPD GOALS FOR 2015 CTD.
Increase life expectancy at birth to more than 75 years. In countries with the highest mortality, aim to increase life expectancy at birth to more than 70 years.
Sources:
• United Nations Population Fund 1994: Programme of Action of the International Conference on Population and Development.
• United Nations 1994. Report of the International Conference on Population and Development , Cairo, 5-13 September 1994.

60
MILLENNIUM DEVELOPMENT GOALS 1 Eradicate extreme poverty and hunger Halve, between 1990 and 2015, the proportion of people
whose income is less than $1 a day. Halve, between 1990 and 2015, the proportion of people who
suffer from hunger. 2 Achieve universal primary education Ensure that, by 2015, children everywhere, boys and girls
alike, will be able to complete a full course of primary schooling 3 Promote gender equality and empower women Eliminate gender disparity in primary and secondary
education preferably by 2005 and in all levels of education no later than 2015
4Reduce child mortality Reduce by two-thirds, between 1990 and 2015, the under-five
mortality rate

61
MILLENNIUM DEVELOPMENT GOALS CTD.
5 Improve maternal health Reduce by three-quarters, between 1990 and 2015, the maternal
mortality ratio . 6 Combat HIV/AIDS, malaria, and other diseases Have halted by 2015 and begun to reverse the spread of HIV/AIDS Have halted by 2015 and begun to reverse the incidence of
malaria and other major diseases 7 Ensure environmental sustainability Integrate the principles of sustainable development into country
policies and program and reverse the loss of environmental resources.
Halve, by 2015, the proportion of people without sustainable access to safe drinking water
Have achieved, by 2020, a significant improvement in the lives of at least 100 million slum dwellers .


![[GaNita][Uonbi.ac.Ke] CalculusII for Economics](https://img.dokumen.tips/doc/110x75/55cf87f455034664618bdd86/ganitauonbiacke-calculusii-for-economics.jpg)