Embed Size (px)
Citation preview

PLEASE SCROLL DOWN FOR ARTICLE
This article was downloaded by: [Carl Brigham Library]On: 3 March 2009Access details: Access Details: [subscription number 905530425]Publisher RoutledgeInforma Ltd Registered in England and Wales Registered Number: 1072954 Registered office: Mortimer House,37-41 Mortimer Street, London W1T 3JH, UK
International Journal of TestingPublication details, including instructions for authors and subscription information:http://www.informaworld.com/smpp/title~content=t775653658
Gender Differences and Similarities in PISA 2003 Mathematics: A Comparisonbetween the United States and Hong KongOu Lydia Liu a; Mark Wilson b
a Educational Testing Service, Princeton b University of California, Berkeley
Online Publication Date: 01 January 2009
To cite this Article Liu, Ou Lydia and Wilson, Mark(2009)'Gender Differences and Similarities in PISA 2003 Mathematics: AComparison between the United States and Hong Kong',International Journal of Testing,9:1,20 — 40
To link to this Article: DOI: 10.1080/15305050902733547
URL: http://dx.doi.org/10.1080/15305050902733547
Full terms and conditions of use: http://www.informaworld.com/terms-and-conditions-of-access.pdf
This article may be used for research, teaching and private study purposes. Any substantial orsystematic reproduction, re-distribution, re-selling, loan or sub-licensing, systematic supply ordistribution in any form to anyone is expressly forbidden.
The publisher does not give any warranty express or implied or make any representation that the contentswill be complete or accurate or up to date. The accuracy of any instructions, formulae and drug dosesshould be independently verified with primary sources. The publisher shall not be liable for any loss,actions, claims, proceedings, demand or costs or damages whatsoever or howsoever caused arising directlyor indirectly in connection with or arising out of the use of this material.
International Journal of Testing, 9: 20–40, 2009Copyright C© Taylor & Francis Group, LLCISSN: 1530-5058 print / 1532-7574 onlineDOI: 10.1080/15305050902733547
Gender Differences and Similarities inPISA 2003 Mathematics: A Comparison
between the United States and HongKong
Ou Lydia LiuEducational Testing Service, Princeton
Mark WilsonUniversity of California, Berkeley
Differential gender performance in standardized mathematics assessment has longbeen a heated topic. Gender gaps of varied magnitude have been identified on large-scale assessments in the United States. To continue the investigation, this studyexamined male and female performance on the Programme for International StudentAssessment (PISA) 2003 mathematics along four in-depth dimensions (strand, con-tent topics, competency cluster, and item format). Furthermore, to identify the sharedand unique patterns of gender differences, students from Hong Kong were broughtinto the comparison. Males in both counties demonstrated superior performance,particularly on complex multiple choice items. Females scored higher on probabil-ity, algebra, and reproduction items. Hong Kong students showed a larger gendergap than U.S. students. However, the within-country gender differences were consid-ered small compared with the significant between-country performance differences.(Some PISA participants are not countries, but education systems representative ofcountries (e.g., Hong Kong). However, for purpose of simplicity, instead of using“countries/systems” every time, the generic term “countries” was used to refer tocountries or systems.) Hong Kong students predominantly outperformed U.S. stu-dents, including items that measure complex mathematical reasoning, an area welldocumented to favor U.S. students.
Keywords: gender differences, mathematics, PISA, U.S. & Hong Kong
Correspondence should be addressed to Ou Lydia Liu, Educational Testing Service, 666 RosedaleRoad, Mail Stop 16-R, Princeton NJ, 08541. E-mail: [email protected]
Downloaded By: [Carl Brigham Library] At: 21:54 3 March 2009

PISA MATH: UNITED STATES AND HONG KONG 21
INTRODUCTION
The issue of gender differences in large-scale mathematics assessments has stim-ulated a heightened level of interest in the United States. Results from variouslarge-scale domestic and international assessments showed that U.S. males havesignificantly outperformed females in mathematics (Langenfield, 1997; Mullis,Martin, & Foy, 2005; Mullis et al., 2000; National Center for Education Statistics[NCES], 2002, 2005; Organization for Economic Co-operation and Development[OECD], 2000, 2004). In fact, differential gender performance in math has beena broad-based issue in many countries (OECD, 2000, 2004; Mullis et al., 2005;Mullis et al., 2000). To promote gender equality in math achievement, researchershave called for investigations to target the specific areas in which substantial gen-der differences occur (Cole, 1997; Gallagher, 1998; Liu, Wilson, & Paek, 2008;Liu & Wilson, in press). This study undertook an in-depth investigation to examinegender differences in specific areas using four categorizations deemed important inmath learning (strand, content topic, item format, and competency cluster). To ex-amine the generalizability of the findings, students from Hong Kong were selectedfor comparison. Hong Kong has continuously been one of the top-performingcountries in many international mathematics tests. The inclusion of Hong Kongstudents served two purposes: (1) to identify both shared and unique features ofgender differences through comparing students in the two countries of differingperforming levels, and (2) to shed light on social, cultural, and instructional factorsthat may contribute to enhanced math performance for both males and females.
Math Gender Differences in the United States: K-12 and Beyond
Many efforts have been initiated to close the gender gap in math assessments inthe United States. However, male advantage in large-scale math tests still remainssubstantial in certain math areas. In the United States, the score differences on thehigh-stakes SAT
©Rmathematics test ranged from 33 to 42 points in favor of males
from 1967 to 2005 (College Board, 2005), and there is no sign of a closing gapin the near future. Males also performed significantly better on ACT mathematicsfrom 1995 to 2004 (NCES, 2006). As indicated by the largest national educationalassessment, National Assessment of Educational Progress (NAEP), U.S. fourth-grade males outperformed females in mathematics for all of the administrationsfrom 1990 to 2005, as did eighth-grade males on most of the administrations(NCES, 2005).
The gender discrepancy in math is likely to hinder women’s advanced edu-cational and occupational attainment. For the year 2003–2004, out of the 1060doctoral degrees granted in mathematics and statistics, 72% of the degree recipi-ents were males (NCES, 2005). In the same year, out of the 5923 doctoral degreesgranted in engineering, 83% of the doctorates went to males (NCES, 2005). Not
Downloaded By: [Carl Brigham Library] At: 21:54 3 March 2009

22 LIU, WILSON
surprisingly, females are also underrepresented in math-related professions. By2003, females comprised only 28% of the instructional faculty in degree-grantinginstitutions in mathematics, and only 8% in engineering (NCES, 2005). Nationalstatistics showed that mathematics and engineering are among the top income cat-egories in all fields of study (NCES, 2005). The disparity in math-related majorsand professions likely leads to a substantial divide in earning potentials betweenmales and females, putting females’ social economic status at a disadvantage.
Heterogeneity and Specificity of Gender Differences
Realizing the educational and social consequences of math gender differences,numerous studies have been designed to explore the patterns and reasons of thegender gap over the past three decades (Feingold, 1988; Halpern, Wai, & Saw,2005; Hyde & Linn, 1986; Hyde, 1991; Maccoby & Jacklin, 1974; Gallagher,1998; Willingham & Cole, 1997). A largely agreed upon conclusion is that mathgender differences are not homogeneous. Some math problems are likely to in-troduce a larger gender gap than others. Males tend to outperform females ontasks that involve reasoning and open-process problem solving (Burton, 1996;Doolittle & Cleary, 1987; Gallagher, 1992, 1998; O’Neill & McPeek, 1993), tasksthat measure visual-spatial skills, especially the ones that require mental rotation(Casey, Nuttall, Pezaris, & Benbow, 1995; Gierl, Bisanz, Bisanz, & Boughton,2003; Halpern, 1997), and tasks that demand “unconventional” problem-solvingstrategies. Unconventional items are often presented in contexts other than theusual textbook situations or require an unusual use of a familiar method. Usu-ally these problems are classified as “reasoning” problems (Armstrong, 1985;Gallagher & De Lisi, 1994).
On the contrary, females are found to be better at solving conventional itemsthat resemble textbook assessments (Gallagher & De Lisi, 1994). This is relatedto the fact that girls are more likely to use a memorization strategy when learningmath and pay more attention to classroom instruction and assignment. Althoughgirls do not perform as well on standardized math tests, they get better math gradesin school (Kimball, 1989).
When it comes to math content, males are noted to perform better on geometryitems, which require spatial ability to some degree (Carlton & Harris, 1989;O’Neill, Wild, & McPeek, 1989). Females are found to perform better on algebraitems, often purely presented by formulas, equation, or theory (Gallagher, 1998).
Item format has been identified as another factor that could impact standard-ized math performance. Males reportedly demonstrate superior performance onmultiple-choice items (Bolger & Kellaghan, 1990; DeMars, 2000, 1998; Murphy,1982) and their higher risk-taking tendency has been offered as one explanation.When responding to multiple-choice math tasks, males are likely to guess on theitems when they are not sure about the answer, and females are likely to leave them
Downloaded By: [Carl Brigham Library] At: 21:54 3 March 2009

PISA MATH: UNITED STATES AND HONG KONG 23
blank (Ben-Shakhar & Sinai, 1991; Hanna, 1986). On the contrary, females arefound to perform better on constructed-response items (DeMars, 2000, 1998). It ishypothesized that the better language skills of females enable them to express theirideas more effectively when responding to constructed-response questions (Bolger& Kellaghan, 1990; Bell & Hay, 1987; Marccoby & Jacklin, 1974; Murphy, 1982).At the same time, females are more likely to provide a detailed description of themathematical procedures required by most open-ended tasks, whereas males tendto skip the process and focus more on the results (Lane, Wang, & Magone, 1996).
However, findings from various studies are not always consistent with each otherregarding the role of item format. Liu and Wilson (in press) examined the PISA2000 and 2003 mathematics assessments and found that there were no measurablegender differences on multiple-choice items across the two administrations. Nei-ther did they find that females performed better on constructed-response items.Other studies have also reported that item format did not explain much of the scorevariation (Beller & Gafni, 1996; Breland, Danos, Kahn, Kubota, & Bonner, 1994;Gallagher et al., 2000). It is speculated that item format may interact with itemdifficulty in influencing student math performance (Beller & Gafni, 1996).
Limitations of Previous Investigations
As much as we know about the existence and causes of gender differences, cer-tain limitations of previous research thwarted the efficiency of the investigations.First, it is not uncommon that many studies based their analyses on total scores.Gender differences can be underestimated if males and females are each favoredby some items and the effect gets cancelled when the sum score is compared. Cole(1997) raised the same concern that the nature of math gender differences canbe distorted by looking at total score alone and paying no attention to constructcomponents. Furthermore, the sum score approach precludes the opportunity todiscern strengths and weaknesses in specific areas for each gender.
Second, the magnitude and generalizability are two important yet frequentlyignored issues in many math gender investigations. How large a difference wouldbe practically large enough to be important, as opposed to be statistically sig-nificant? Also, can the findings generalize to other countries? Some patterns ofgender differences may be shared by many countries; others might be unique to aparticular country. Comparison of gender differences across countries offers thepossibility to link the patterns of gender gap to social, cultural, and instructionalfactors that could possibly cause or affect the differences.
Objectives of this Study
This study serves two primary purposes: (1) to examine the gender differences inspecific domains based on four important categorizations (strand, content topic,
Downloaded By: [Carl Brigham Library] At: 21:54 3 March 2009

24 LIU, WILSON
item format, and competency cluster), and (2) to examine the similarities andcontrasts in gender differences between U.S. and Hong Kong students. These twocountries were selected for comparison because (a) they represent different per-formance levels on the math achievement continuum on previous internationalassessments. For example, on the 2000 PISA math assessments, Hong Kong stu-dents ranked first (mean = 560, SE = 3.3) among the 41 participating countriesand U.S. students ranked 20th (mean = 493, SE = 7.6) (OECD, 2003a); (b)they are located in different geographical regions in the world, with the UnitedStates representing the North America and Hong Kong representing the East Asia.They also embrace two distinct cultures of the West and the East that may havea profound impact on mathematics teaching (Stigler & Hiebert, 1999); and mostimportantly (c) they adopt two very different educational systems. Schools inthe United States feature variety in that they have the flexibility to adopt differ-ent curricula or different textbooks in math instruction. The standards for mathachievement may also vary from state to state. Compared with the decentralizedsystem in the United States and a great promotion for options, the educational sys-tem in Hong Kong is rather centralized in that textbooks are generally standardizedfor students in the same grade. A centralized system may have the drawback oflimiting to one kind of practice. On the other hand, it facilitates professional de-velopment on a grand scale. It is hoped that findings from the cross-cultural exam-ination will shed light on key factors that are associated with effective math teach-ing and learning, such as curriculum design, pedagogical strategies, and culturalinfluences.
METHODS
Instrument
This study used data from the Programme for International Student Assessment(PISA) 2003 mathematics. PISA was launched and developed by the OECD todefine educational goals, monitor educational progress, and provide a basis for in-ternational comparison (OECD, 2000). PISA has been administered on a three-yearcycle since 2000, and mathematics was the primary focus of the 2003 assessments.
There are 84 math items used in the 2003 assessments. To unravel the complex-ity, the analyses in this study were conducted on the basis of four categorizationsas follows.
Content Topic. Four overarching ideas have been chosen to represent themath content covered in this test: space and shape, change and relationships,quantity, and uncertainty. Each overarching idea can be perceived as a generalnotion involving some generalized content domain. Space and shape items mea-sure student understanding of the properties of objects and their relative positions.
Downloaded By: [Carl Brigham Library] At: 21:54 3 March 2009

PISA MATH: UNITED STATES AND HONG KONG 25
Images or visual representations are heavily involved in these items. Change andrelationships items capture changes in a variety of ways including numerical, sym-bolical, graphical, algebraic, and geometrical changes (OECD, 2003b). Studentfunctional thinking (thinking in terms of and about relationships) is emphasizedby these items. Quantity items measure understanding of relative size, the recog-nition of numerical patterns, and representation of quantities of real-life objects.Uncertainty items involve two major components: data and chance. Some coreareas measured by these items include producing data, data analysis, probability,and inference.
Competency Cluster. PISA has chosen to describe the cognitive activitiesaccording to three competency clusters: reproduction, connections, and reflection.The reproduction cluster essentially involves recollection of practiced knowledge.These competencies include the most commonly used skills such as carryingout standard computations. The connections cluster competencies carry on thereproduction cluster competencies to the next level by taking problem solvingto unconventional situations but still involve familiar or quasi-familiar settings.The reflection cluster competencies relate to students’ abilities to design solutionstrategies and implement them in problem situations that are more complicated orunconventional than those in the connections cluster.
Strand. The PISA 2003 math assessment has been organized around sevenstrands: algebra, discrete mathematics, functions, geometry, number, probability,and statistics. Note that the differentiation of the strands has some overlap withthe four overarching ideas. For example, most of the geometry items fall underspace and shape. However, the strands represent more specific domains than theoverarching ideas.
Item Format. The PISA 2003 math items are represented by five item for-mats: short response, multiple-choice, complex multiple-choice, open constructed-response, and closed constructed-response. Among all the item formats, complexmultiple-choice can be perceived as a relatively new item type, which studentsrarely encounter in daily quizzes or end of unit assessments in school. Most ofthe complex multiple-choice items start with an overriding theme as the problemstem, and then ask students to indicate true/false or yes/no to several statementsabout the stem. A sample item is illustrated in Table 1.
Participants
PISA seeks to measure how well students at age 15 are prepared to meet thechallenges of the so-called knowledge societies (OECD, 2000). The assessmentsare focused on measuring students’ ability to apply their knowledge and skills
Downloaded By: [Carl Brigham Library] At: 21:54 3 March 2009

26 LIU, WILSON
TABLE 1A Sample Complex Multiple-choice Item
Problem Prompt: there are 50boys in a class. Theaverage weight of the boysis 120 pounds.
Statement True/FalseIf there is a boy of weight 123 pounds in the
class, there must be a boy of weight 117pounds.
True/False
The majority of the boys must have weight120 pounds.
True/False
If you rank all of the boys from lightest toheaviest, then the middle one must weigh120 pounds.
True/False
Half of the boys in the class weigh below120 pounds and half above 120 pounds.
True/False
If both the heaviest and the lightest boy areexcluded, the mean will be the same.
True/False
For item security purpose, this is not the original item from the PISA 2003 mathematics assessmentbut sharing similar features.
in real-life settings. Data analyzed in this study included 5465 students (50.2%males) from the United States and 4478 students (49.6% males) from Hong Kongin the PISA 2003 math assessment. PISA adopted a stratified sampling procedureso that the students who participated in the study represented the population of 15year olds in each country.
The Rasch Partial Credit Model
The analyses were performed using the Rasch partial credit model (PCM; Masters,1982; Wright & Masters, 1982). This model was selected because the PISA mathassessment includes polytomously scored items and the difficulty level betweenthe two adjacent categories varies across items. For an item i with Ki = mi + 1response categories scored as x = 0, ..., mi , the probability of category responsex can be expressed as:
Pnix(θ ) = exp[ ∑x
x=0 (θn − (δi + τix)]
∑mi
r=0
[exp
∑rx=0 (θn − (δi + τix)
] (1)
where Pnix is the probability of PISA participant n scoring x on item i. θ standsfor the student ability estimate. The δi term is the location of the item on the mathability continuum and is often referred to as the item difficulty parameter. τix (x =0, 1, ..m) describes the additional step parameter for item i associated with eachcategory score of x. The software program ConQuest (Wu, Adams, & Wilson,1998) was used to perform the analyses.
Downloaded By: [Carl Brigham Library] At: 21:54 3 March 2009

PISA MATH: UNITED STATES AND HONG KONG 27
Plausible Values
Based on the Rasch PCM, ConQuest produces five sets of plausible values toindicate math competence in each domain for each student. For example, a studentwill have five plausible values on space and shape items as a domain; simi-larly, s/he will have another five plausible values on change and relationships;and so on for algebra, geometry, etc. The five plausible values were randomlydrawn from the distribution of ability estimates that could reasonably be as-signed to a student. It is important to recognize that plausible values are nottest scores and should not be treated as such (OECD, 2005a). Plausible valuesas a set represent the range of abilities that a student might have. Instead ofreporting one value for student ability estimate—namely, the point estimate—plausible values report a range of reasonable values for a student’s ability (Wu& Adams, 2002). Another type of ability estimate produced by ConQuest, calledthe Expected A Posteriori estimator (EAP), can be viewed as the mean of aninfinite set of plausible values for a particular student (OECD, 2004). The advan-tage of using plausible values instead of EAP lies in that by calculating statis-tics five times using the five sets of plausible values, measurement error canbe incorporated into the analysis. Both the plausible values and the EAP esti-mates appear in logit units, which is the log odds of the probability of a correctresponse.
Given the complexity of PISA assessments and the large number of items,multiple booklets, namely test forms, were designed and administered to students.There were 13 booklets in the PISA 2003 assessments. The estimate of itemparameters is not influenced by the incorporation of booklets because of thebalanced design of the assessments. However, the estimation of student proficiencymay be influenced as the order that items appear in each booklet varies. To correctfor the booklet effect, the booklet variable was included in the model calibration.For the ConQuest model statement, the model was item + item*step + booklet.See OECD (2005a) for technical details on booklet correction. Liu et al. (2008)also talks about booklet correction.
Comparisons of Gender Differences
Male and female math proficiencies in each domain based on the four categoriza-tions indicated by plausible values were compared. z statistic was used to indicatethe ratio of the estimated mean gender difference and the estimated standarderror of the mean difference. The null hypothesis is that there is no differencebetween male and female performance (i.e., mean difference equals zero), and thez statistics is considered significant at the α = .05 level. Note that the final errorvariance is composed of both the sampling variance and the imputation variance,
Downloaded By: [Carl Brigham Library] At: 21:54 3 March 2009
28 LIU, WILSON
and can be formulated as:
V = U ∗ + (1 + M−1)BM, (2)
where V indicates the final error variance, U ∗ is the mean sampling variance, M isthe number of plausible values for each student, and BM is the imputation variance,also denoted as the measurement error variance (see Appendix for computationaldetails). More details of the techniques can be found in the PISA 2003 technicalreport (OECD, 2005a). The SPSS
©R13 syntax provided in the PISA 2003 data
analysis manual (OECD, 2005b) were used to produce the mean gender differencesand the standard error of the differences. In addition, effect sizes indicated byCohen’s d (Cohen, 1969, 1988) are provided to indicate the magnitude of thedifferences for each comparison.
RESULTS
The person separation reliability was examined for each of the domains on thebasis of the four categorizations. The traditional reliability index Cronbach’s alphawas not available because of the booklet design—not all students responded to allthe items. The person separation reliability (Equation 3) indicates how well thisdomain of items separates students from a particular sample (Wright & Masters,1982),
R = 1 − MSE
var(θ̂). (3)
where var(θ̂) is the observed variance in student performance and MSE is themean measurement error variance. The person separation reliability ranges from.65 to .77 for the 19 item domains in the United States, and rages from .67 to .72in Hong Kong, suggesting reasonable reliabilities.
ConQuest also produces an unweighted fit mean square (UFMS) statistic asan indication of item fit. The UFMS is sensitive to unexpected responses fromexaminees on items that are well above or below their abilities. The UFMS statistichas an expected value of 1 and ranges from zero to infinity. An acceptable range forthis statistic is between .70 and 1.30 (Wright & Linacre, 1994). A value less than .70suggests that there is more observed variance in item responses than expected, anda value larger than 1.3 indicates there is less observed variance in item responsesthan expected. According to this criterion, all but two items showed reasonablefit.
Tables 2 and 3 present the descriptive statistics and gender performance com-parison based on each specific domain for the U.S. and Hong Kong students,
Downloaded By: [Carl Brigham Library] At: 21:54 3 March 2009
PISA MATH: UNITED STATES AND HONG KONG 29
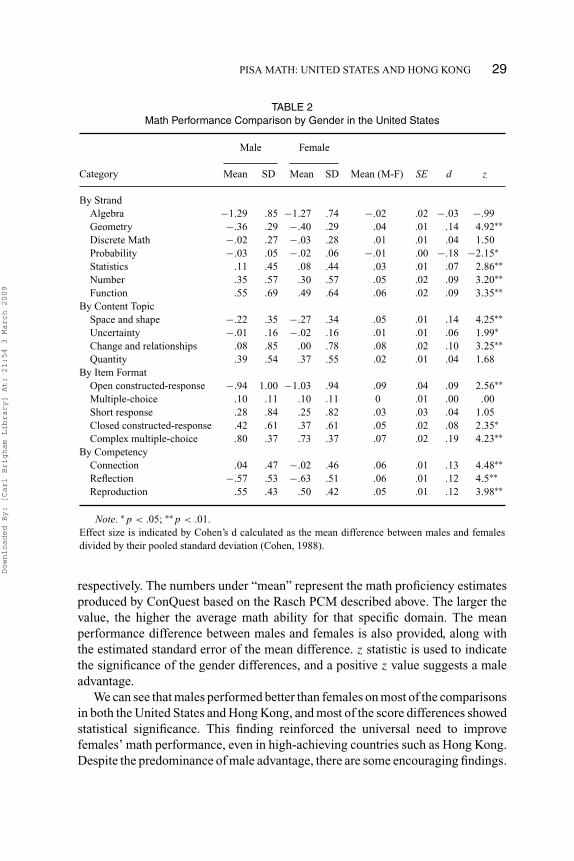
TABLE 2Math Performance Comparison by Gender in the United States
Male Female
Category Mean SD Mean SD Mean (M-F) SE d z
By StrandAlgebra −1.29 .85 −1.27 .74 −.02 .02 −.03 −.99Geometry −.36 .29 −.40 .29 .04 .01 .14 4.92∗∗Discrete Math −.02 .27 −.03 .28 .01 .01 .04 1.50Probability −.03 .05 −.02 .06 −.01 .00 −.18 −2.15∗Statistics .11 .45 .08 .44 .03 .01 .07 2.86∗∗Number .35 .57 .30 .57 .05 .02 .09 3.20∗∗Function .55 .69 .49 .64 .06 .02 .09 3.35∗∗
By Content TopicSpace and shape −.22 .35 −.27 .34 .05 .01 .14 4.25∗∗Uncertainty −.01 .16 −.02 .16 .01 .01 .06 1.99∗Change and relationships .08 .85 .00 .78 .08 .02 .10 3.25∗∗Quantity .39 .54 .37 .55 .02 .01 .04 1.68
By Item FormatOpen constructed-response −.94 1.00 −1.03 .94 .09 .04 .09 2.56∗∗Multiple-choice .10 .11 .10 .11 0 .01 .00 .00Short response .28 .84 .25 .82 .03 .03 .04 1.05Closed constructed-response .42 .61 .37 .61 .05 .02 .08 2.35∗Complex multiple-choice .80 .37 .73 .37 .07 .02 .19 4.23∗∗
By CompetencyConnection .04 .47 −.02 .46 .06 .01 .13 4.48∗∗Reflection −.57 .53 −.63 .51 .06 .01 .12 4.5∗∗Reproduction .55 .43 .50 .42 .05 .01 .12 3.98∗∗
Note. ∗p < .05; ∗∗p < .01.Effect size is indicated by Cohen’s d calculated as the mean difference between males and femalesdivided by their pooled standard deviation (Cohen, 1988).
respectively. The numbers under “mean” represent the math proficiency estimatesproduced by ConQuest based on the Rasch PCM described above. The larger thevalue, the higher the average math ability for that specific domain. The meanperformance difference between males and females is also provided, along withthe estimated standard error of the mean difference. z statistic is used to indicatethe significance of the gender differences, and a positive z value suggests a maleadvantage.
We can see that males performed better than females on most of the comparisonsin both the United States and Hong Kong, and most of the score differences showedstatistical significance. This finding reinforced the universal need to improvefemales’ math performance, even in high-achieving countries such as Hong Kong.Despite the predominance of male advantage, there are some encouraging findings.
Downloaded By: [Carl Brigham Library] At: 21:54 3 March 2009
30 LIU, WILSON
TABLE 3Math Performance Comparison by Gender in Hong Kong
Male Female
Category Mean SD Mean SD Mean (M-F) SE d z
By StrandAlgebra .45 .58 .41 .57 .04 .02 .07 2.36∗Geometry .55 .50 .48 .50 .07 .02 .14 3.89∗∗Discrete Math .48 .30 .45 .32 .03 .01 .10 2.56∗∗Probability .07 .06 .07 .06 0 .01 0 0Statistics .92 .45 .84 .45 .08 .01 .18 5.68∗∗Number .99 .47 .96 .47 .03 .01 .06 2.20∗Function 1.08 .62 1.01 .62 .07 .02 .11 3.52∗∗
By Content TopicSpace and shape .66 .52 .60 .51 .06 .01 .12 4.21∗∗Uncertainty .51 .17 .48 .18 .03 .01 .17 5.33∗∗Change and relationships .75 .65 .67 .65 .08 .02 .12 4.21∗∗Quantity 1.27 .59 1.23 .62 .04 .02 .07 2.21∗
By Item FormatOpen constructed-response .33 .78 .22 .78 .11 .02 .14 4.55∗∗Multiple-choice .24 .10 .22 .10 .02 .01 .20 4.13∗∗Short response 1.20 .71 1.14 .73 .06 .03 .08 2.43∗Closed constructed-response 1.18 .52 1.17 .52 .01 .02 .02 .50Complex multiple-choice 1.22 .38 1.15 .37 .07 .01 .19 5.46∗∗
By CompetencyConnection .05 .51 −.04 .50 .09 .01 .18 6.22∗∗Reflection .01 .13 −.01 .12 .02 0 .16 5.23∗∗Reproduction -.01 .12 .01 .12 −.02 0 -.17 −4.88∗∗
Note. ∗p < .05.; ∗∗p < .01.Effect size is indicated by Cohen’s d (Cohen, 1988).
In the United States, females scored higher in algebra without statistical signif-icance, and in probability (p < .05). In Hong Kong, females scored higher onreproduction items (p < .01).
Two other interesting findings emerged from the results when the United Statesand Hong Kong are compared in terms of the patterns of gender differences. WhileU.S. students showed no measurable performance difference on multiple-choiceitems (Liu & Wilson, in press), Hong Kong students showed the largest differenceon multiple-choice items. This may be due to the effects of the extensive coachingavailable to U.S. students, which could have narrowed gender differences so longas the coaching itself is not gender biased. On the other hand, in contrary to othertopics, Hong Kong males and females performed equally on probability items,which is a domain showing a large difference between U.S. males and females.
Downloaded By: [Carl Brigham Library] At: 21:54 3 March 2009
PISA MATH: UNITED STATES AND HONG KONG 31
-1.5
-1.0
-0.5
0.0
0.5
1.0
1.5
Algebra Geometry Discrete Math Probability Statistics Number Function
Mat
h P
rofic
ienc
y E
stim
ates
US Males
US Females
Hong Kong Males
Hong KongFemales
FIGURE 1Math proficiency estimates by strand.
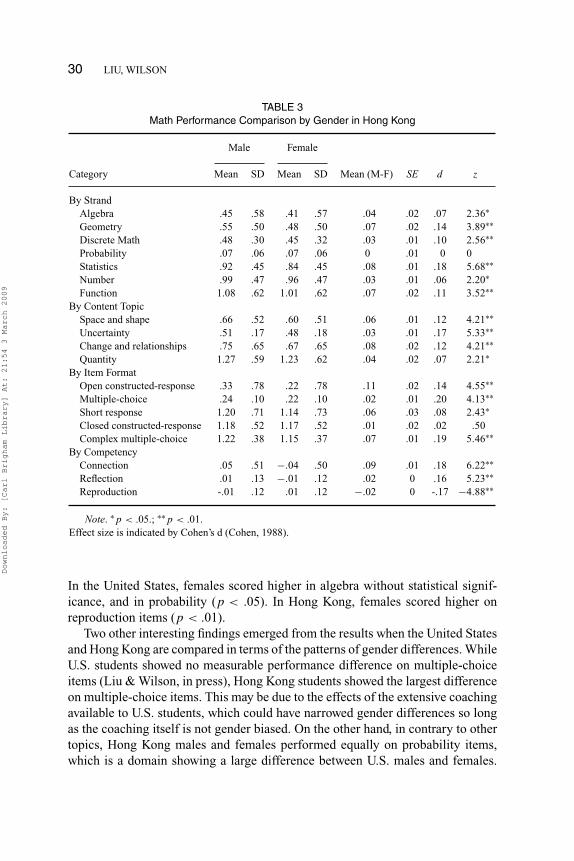
Figure 1 shows that Hong Kong students scored lowest on the probability itemsout of the seven strands. Their unexpected low performance on probability itemscould be due to the lack of sufficient coverage of this domain in Hong Kong’s mathcurriculum. Therefore, a “floor effect” occurred and no gender differences wereobserved.
In summary, all the gender score differences, regardless of the direction (in favorof males or females), have an effect size less than .20, which is considered smallin social science contexts (Cohen, 1988). Figures 1 to 4 present the mean abilityestimates based on the four categorizations for both U.S. Hong Kong students.The summary statistics are presented in Table 4. The national performance differ-ences are marked by prominent significance values and large effect sizes. Clearly,compared with the substantive national differences, the gender differences within
-1.5
-1.0
-0.5
0.0
0.5
1.0
1.5
Space and shape Uncertainty Change andrelationships
Quantity
Mat
h P
rofi
cien
cy E
stim
ates
US Males
US Females
Hong Kong Males
Hong Kong Females
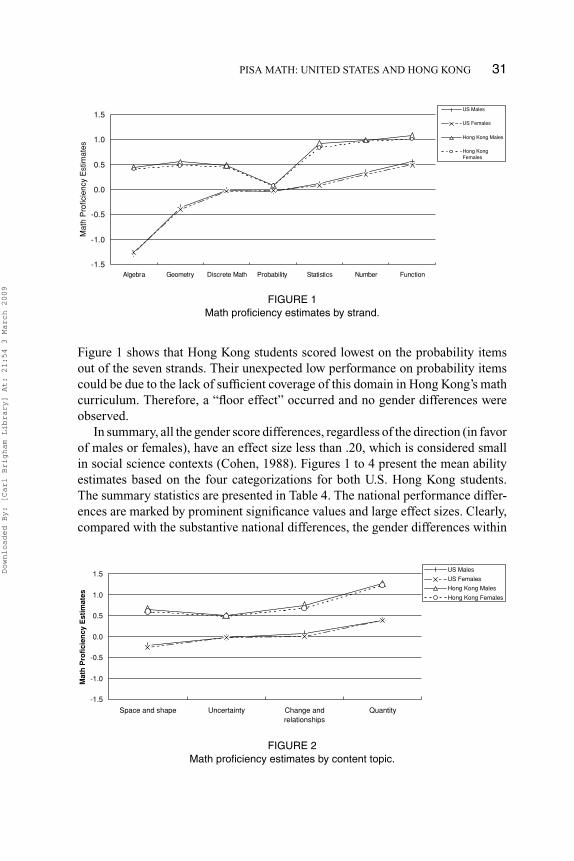
FIGURE 2Math proficiency estimates by content topic.
Downloaded By: [Carl Brigham Library] At: 21:54 3 March 2009

32 LIU, WILSON
-1.5
-1.0
-0.5
0.0
0.5
1.0
1.5
Openconstructed-
response
Multiple-choice Short response Closedconstructed-
response
Complex multiple-choice
Mat
h P
rofi
cien
cy E
stim
ates
US Males
US Females
Hong Kong Males
Hong Kong Females
FIGURE 3Math proficiency estimates by item format.
each country may be considered small. In the following sections, we comment onthe specific patterns of gender differences by each categorization.
Results by Strand
In the United States, the domain that showed the largest effect size (d = –.18) isprobability, in favor of girls. At the same time, no measurable difference has beenidentified on probability for Hong Kong students. Based on these two results, it isfair to say that females performed at least as well as males in this domain, if notbetter. Interestingly enough, probability is the domain that showed the smallestnational difference between the United States and Hong Kong (d = –.63 for malesand –.60 for females).
-1.5
-1.0
-0.5
0.0
0.5
1.0
1.5
noitcudorpeRnoitcelfeRnoitcennoC
Mat
h P
rofic
ienc
y E
stim
ates
US Males
US Females
Hong Kong Males
Hong Kong Females
FIGURE 4Math proficiency estimates by competency cluster.
Downloaded By: [Carl Brigham Library] At: 21:54 3 March 2009

PISA MATH: UNITED STATES AND HONG KONG 33
TABLE 4Math Performance Comparison between U.S. and Hong Kong Students
Male Female
Category M (US-HK) SE z d M (US-HK) SE z d
By StrandAlgebra −1.74 .02 −85.40∗∗∗ −2.39 −1.68 .02 −90.36∗∗∗ −2.54Geometry −.91 .01 −76.03∗∗∗ −2.23 −.88 .01 −73.91∗∗∗ −2.15Discrete Math −.50 .01 −61.03∗∗∗ −1.75 −.48 .01 −55.71∗∗∗ −1.60Probability −.10 .02 −23.83∗∗∗ −.63 −.09 .02 −21.66∗∗∗ −.60Statistics −.81 .01 −63.04∗∗∗ −1.80 −.76 .01 −59.89∗∗∗ −1.71Number −.64 .01 −43.34∗∗∗ −1.23 −.66 .01 −44.75∗∗∗ −1.26Function −.53 .02 −28.46∗∗∗ −.81 −.52 .02 −29.02∗∗∗ −.83
By Content TopicSpace and shape −.88 .01 −68.21∗∗∗ −1.99 −.87 .01 −69.25∗∗∗ −2.01Uncertainty −.52 .00 −109.98∗∗∗ −3.15 −.50 .00 −102.52∗∗∗ −2.94Change and relationships −.67 .02 −31.45∗∗∗ −.89 −.67 .02 −33.04∗∗∗ −.93Quantity −.88 .02 −54.25∗∗∗ −1.56 −.86 .02 −51.24∗∗∗ −1.47
By Item FormatOpen constructed-response −1.27 .03 −50.24∗∗∗ −1.56 −1.25 .02 −51.24∗∗∗ −1.45Multiple choice −.14 .00 −46.88∗∗∗ −1.33 −.12 .00 −40.25∗∗∗ −1.14Short response −.92 .02 −41.80∗∗∗ −1.18 −.89 .02 −40.46∗∗∗ −1.15Closed constructed-response −.76 .02 −47.36∗∗∗ −1.34 −.80 .02 −49.92∗∗∗ −1.41Complex multiple-choice −.42 .01 −39.17∗∗∗ −1.12 −.42 .01 −39.85∗∗∗ −1.14
By CompetencyConnection −.01 .01 −.71 −.02 .02 .01 1.46 .04Reflection −.58 .01 −55.27∗∗∗ −1.50 −.62 .01 −61.33∗∗∗ −1.67Reproduction .56 .01 65.11∗∗∗ 1.77 .49 .01 58.01∗∗∗ 1.59
Note. ∗∗∗p < .001.Effect size is indicated by Cohen’s d (Cohen, 1988).
U.S. females scored slightly higher than males in algebra. This is consis-tent with findings from previous research that girls significantly perform betteron algebra items regardless of the item format (Doolittle & Cleary, 1987; Gal-lagher, 1998). Note that this is also the domain that U.S. students performed leastwell as compared with Hong Kong students (d = –2.39 for males and –2.54 forfemales).
In Hong Kong, the domain that showed that largest effect size based on strandis statistics (d = .18). And the effect size of difference is relatively large (d =.14) in geometry in both the United States and Hong Kong, in favor of males.One likely explanation of male advantage on geometry items is that certain spatialskills are needed to solve geometry problems (Doolittle & Cleary, 1987). In fact,in the case of the PISA study, many geometry items are also classified as spaceand shape items.
Downloaded By: [Carl Brigham Library] At: 21:54 3 March 2009
34 LIU, WILSON
Results by Content Topics
Students displayed the largest gender differences on space and shape items in theUnited States (d = .14), and the difference is also relatively large in Hong Kong(d = .12). As discussed above, males have consistently displayed advantages insolving spatial items (Benbow, 1988; Gallagher, 1998; Linn & Petersen, 1986).A likely explanation is that males are more likely to be involved in activities thatare conductive to the development of spatial concepts and skills, such as playingcomputer games, playing sports, and spending time playing with car toys, etc.Hong Kong students showed the largest difference on uncertainty items (d =.17).Uncertainty items consist of both probability and statistics items. The large effectsize here is mainly caused by the performance difference on statistics items, sinceno gender difference has been found on probability items in Hong Kong. To acertain extent, probability items involve some calculations operations that mayfavor females.
The score differences between U.S. and Hong Kong students are smallest onchange and relationships items (d = –.89 for males and –.93 for females), andlargest on uncertainty items (d = –3.15 for males and –2.94 for females).
Results by Item Format
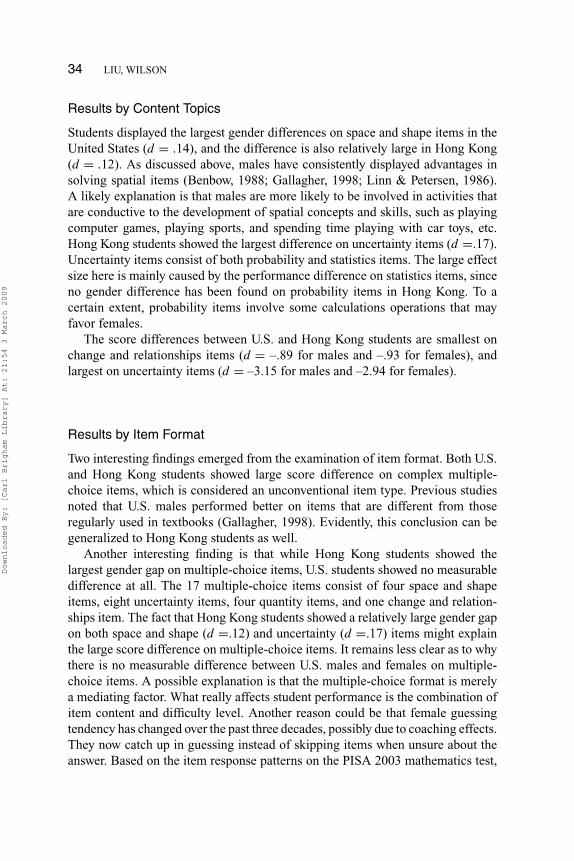
Two interesting findings emerged from the examination of item format. Both U.S.and Hong Kong students showed large score difference on complex multiple-choice items, which is considered an unconventional item type. Previous studiesnoted that U.S. males performed better on items that are different from thoseregularly used in textbooks (Gallagher, 1998). Evidently, this conclusion can begeneralized to Hong Kong students as well.
Another interesting finding is that while Hong Kong students showed thelargest gender gap on multiple-choice items, U.S. students showed no measurabledifference at all. The 17 multiple-choice items consist of four space and shapeitems, eight uncertainty items, four quantity items, and one change and relation-ships item. The fact that Hong Kong students showed a relatively large gender gapon both space and shape (d =.12) and uncertainty (d =.17) items might explainthe large score difference on multiple-choice items. It remains less clear as to whythere is no measurable difference between U.S. males and females on multiple-choice items. A possible explanation is that the multiple-choice format is merelya mediating factor. What really affects student performance is the combination ofitem content and difficulty level. Another reason could be that female guessingtendency has changed over the past three decades, possibly due to coaching effects.They now catch up in guessing instead of skipping items when unsure about theanswer. Based on the item response patterns on the PISA 2003 mathematics test,
Downloaded By: [Carl Brigham Library] At: 21:54 3 March 2009

PISA MATH: UNITED STATES AND HONG KONG 35
16% of the females were estimated as showing guessing behavior as compared to11% males in the United States (Liu, 2006).
Results by Competency Cluster
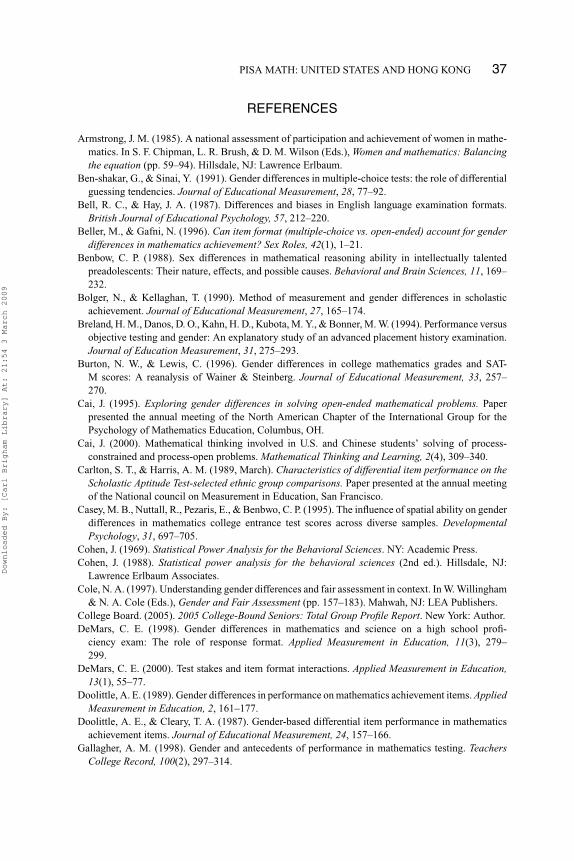
The magnitude of the gender gap in the three competency clusters is somewhatthe same for U.S. students, all in favor of males. The magnitude of the gendergap in Hong Kong is also similar for the three competency clusters, but with thereproduction cluster favoring females (d = –.17). As mentioned above, the repro-duction cluster is mainly comprised of computational problems. Females have beenreported to score higher on computation, which requires less complex cognitiveabilities than items measuring problem solving and reasoning (Doolittle, 1989;Doolittle & Cleary, 1987; Snow & Ennis, 1996). However, no female advantagein computational items has been found for the U.S. sample in this study.
Figure 4 shows that on average Hong Kong students scored almost the sameon the three competency clusters, whereas U.S. students gained the highest scoreon the reproduction cluster. Despite that Hong Kong students outperformed U.S.students on most of the comparisons, U.S. students scored considerably higher onreproduction items (d = 1.77 for males and 1.59 for females). The performancedifference was the smallest on the connection items between U.S. and Hong Kongstudents (d = –.02 for males and .04 for females), suggesting no difference in thisdomain.
CONCLUSIONS AND DISCUSSION
Results from both the United States and Hong Kong confirmed a slight maleadvantage in math performance for the representative sample of 15 year olds.Males demonstrated a consistent advantage in the majority of the comparisonsbased on strand, content topics, item format, and competency clusters in bothcountries. However, most of the effect sizes of the gender differences were small,below .20. Willingham and Cole (1997) raised the point that a small effect sizecould carry important implications if it represents a systematic difference betweentwo groups, which is the case here.
If the math gender gap merits serious attention in the United States, then itis more so in Hong Kong. Out of the total 19 comparisons based on strand (7),content topics (4), item format (5), and competency clusters (3), Hong Kongstudents showed a larger gender gap on 13 of the comparisons than their U.S.peers (Tables 2 and 3). In Hong Kong, the reproduction cluster is the only area thatfemales scored higher than males. And reproduction is a relatively easy domaincompared to other math areas. Responding to the original objective of identifyingthe differences and similarities of gender gap in both countries, the analyses yielded
Downloaded By: [Carl Brigham Library] At: 21:54 3 March 2009

36 LIU, WILSON
some interesting results. Males and females in both countries showed sizabledifferences on geometry and space and shape items, which evidently suggeststhat serious actions need to be taken to enhance female understanding of spatialknowledge, probably through some systematic curriculum instruction in school. Inaddition, both countries showed a notable male advantage on complex multiple-choice items. This should provoke interest from test developers as to why thisparticular item format may favor males. One hypothesis is that complex multiple-choice items, considered an unconventional item type, discouraged females fromtrying as hard as they can to provide correct answers to these questions. Thus,this finding could be a byproduct of math confidence or test anxiety. The twocountries also demonstrated some differences in the pattern of gender gaps. Thegender difference was fairly large for Hong Kong students and negligible for U.S.students on multiple-choice items, and the other way around on probability items.More importantly, this study has generated some interesting results beyond gendercomparisons. U.S. students surprisingly performed better than Hong Kong studentson reproduction items (Figure 4), an area well documented to favor East Asianstudents (Cai, 1995, 2000; Yang & Cobb, 1995). On the other hand, as a challengeto the widely disseminated belief that Chinese students are not better than U.S.students in solving higher-order math problems (Wang & Lin, 2006), Hong Kongstudents considerably outperformed U.S. students on reflection items, which areperceived as the most complicated items among the three competency clusters.As researchers and policy makers realized the substantial math achievement gapbetween the United States and some East Asian countries, underlying causes ofthe difference have been speculated and actions have been taken to improve thecontent coverage, instructional requirements, and course structures in the UnitedStates (Lewis, Tsuchida, & Coleman, 2002; Schmidt, McKnight, Cogan, Jakwerth,& Houang, 1999; Tsuchida & Lewis, 2002). The enhanced performance of U.S.students on reproduction items might be one of the fruitful results of these actionsand reforms. However, the improvement appears to be limited to lower-level mathabilities given that U.S. students still lag behind in solving complicated mathproblems. In addition, an analysis of the PISA student self-reported use of learningstrategies reveals that U.S. students heavily rely on memorization strategies ascompared to their Hong Kong counterparts (d = .50). Evidently, to fully preparefor the challenges in a competitive knowledge society, U.S. students urgently needto develop learning strategies to understand mathematics in a more systematic andmore intergraded way. Being able to perform procedural-level mathematics is farfrom enough, U.S. students need to horn skills in creative mathematical thinking,critical reasoning, evidence-based argumentation, and effective communicationconcerning mathematical matters. It is genuinely important to minimize the mathgender gap in the United States, yet a more compelling goal would be to enhancethe overall performance and close the achievement gap between U.S. students andtheir high performing counterparts around the world.
Downloaded By: [Carl Brigham Library] At: 21:54 3 March 2009
PISA MATH: UNITED STATES AND HONG KONG 37
REFERENCES
Armstrong, J. M. (1985). A national assessment of participation and achievement of women in mathe-matics. In S. F. Chipman, L. R. Brush, & D. M. Wilson (Eds.), Women and mathematics: Balancingthe equation (pp. 59–94). Hillsdale, NJ: Lawrence Erlbaum.
Ben-shakar, G., & Sinai, Y. (1991). Gender differences in multiple-choice tests: the role of differentialguessing tendencies. Journal of Educational Measurement, 28, 77–92.
Bell, R. C., & Hay, J. A. (1987). Differences and biases in English language examination formats.British Journal of Educational Psychology, 57, 212–220.
Beller, M., & Gafni, N. (1996). Can item format (multiple-choice vs. open-ended) account for genderdifferences in mathematics achievement? Sex Roles, 42(1), 1–21.
Benbow, C. P. (1988). Sex differences in mathematical reasoning ability in intellectually talentedpreadolescents: Their nature, effects, and possible causes. Behavioral and Brain Sciences, 11, 169–232.
Bolger, N., & Kellaghan, T. (1990). Method of measurement and gender differences in scholasticachievement. Journal of Educational Measurement, 27, 165–174.
Breland, H. M., Danos, D. O., Kahn, H. D., Kubota, M. Y., & Bonner, M. W. (1994). Performance versusobjective testing and gender: An explanatory study of an advanced placement history examination.Journal of Education Measurement, 31, 275–293.
Burton, N. W., & Lewis, C. (1996). Gender differences in college mathematics grades and SAT-M scores: A reanalysis of Wainer & Steinberg. Journal of Educational Measurement, 33, 257–270.
Cai, J. (1995). Exploring gender differences in solving open-ended mathematical problems. Paperpresented the annual meeting of the North American Chapter of the International Group for thePsychology of Mathematics Education, Columbus, OH.
Cai, J. (2000). Mathematical thinking involved in U.S. and Chinese students’ solving of process-constrained and process-open problems. Mathematical Thinking and Learning, 2(4), 309–340.
Carlton, S. T., & Harris, A. M. (1989, March). Characteristics of differential item performance on theScholastic Aptitude Test-selected ethnic group comparisons. Paper presented at the annual meetingof the National council on Measurement in Education, San Francisco.
Casey, M. B., Nuttall, R., Pezaris, E., & Benbwo, C. P. (1995). The influence of spatial ability on genderdifferences in mathematics college entrance test scores across diverse samples. DevelopmentalPsychology, 31, 697–705.
Cohen, J. (1969). Statistical Power Analysis for the Behavioral Sciences. NY: Academic Press.Cohen, J. (1988). Statistical power analysis for the behavioral sciences (2nd ed.). Hillsdale, NJ:
Lawrence Erlbaum Associates.Cole, N. A. (1997). Understanding gender differences and fair assessment in context. In W. Willingham
& N. A. Cole (Eds.), Gender and Fair Assessment (pp. 157–183). Mahwah, NJ: LEA Publishers.College Board. (2005). 2005 College-Bound Seniors: Total Group Profile Report. New York: Author.DeMars, C. E. (1998). Gender differences in mathematics and science on a high school profi-
ciency exam: The role of response format. Applied Measurement in Education, 11(3), 279–299.
DeMars, C. E. (2000). Test stakes and item format interactions. Applied Measurement in Education,13(1), 55–77.
Doolittle, A. E. (1989). Gender differences in performance on mathematics achievement items. AppliedMeasurement in Education, 2, 161–177.
Doolittle, A. E., & Cleary, T. A. (1987). Gender-based differential item performance in mathematicsachievement items. Journal of Educational Measurement, 24, 157–166.
Gallagher, A. M. (1998). Gender and antecedents of performance in mathematics testing. TeachersCollege Record, 100(2), 297–314.
Downloaded By: [Carl Brigham Library] At: 21:54 3 March 2009

38 LIU, WILSON
Gallagher, A. M. (1992). Sex differences in problem-solving strategies used by high-scoring examineeson the SAT-M. (college Board Rep. No. 92-2; ETS RR No. 92-93). New York: College EntranceExamination Board.
Gallagher, A. M., & De Lisi, R. (1994). Gender differences in scholastic aptitude test-mathematicsproblem solving among high ability students. Journal of Educational Psychology, 86(2),204–211.
Gallagher, A. M., De Lisi, R., Holst, P.C., McGillicuddy-De Lisi, A. V., Morely, M., & Cahalan, C.(2000). Gender differences in advanced mathematical problem solving. Journal of ExperimentalChild Psychology, 75, 165–190.
Gierl, M. J., Bisanz, J., Bisanz, G. L., & Boughton, K. A. (2003). Identifying content andcognitive skills that produce gender differences in mathematics: A demonstration of themultidimensionality-based DIF analysis paradigm. Journal of Educational Measurement, 40(4),281–306.
Feingold, A. (1988). Cognitive gender differences are disappearing. American Psychologist, 43, 181–191.
Halpern, D. F. (1997). Sex differences in intelligence: Implications for education. American Psychol-ogist, 52, 1091–1102.
Halpern, D., Wai, J., & Saw, A. (2005). A psychological model: why females are sometimes greaterthan and sometimes less than males in math achievement. In A. M. Gallagher & J. C. Kaufman(Eds.),Gender differences in mathematics (pp. 48–72). Cambridge: Cambridge University Press.
Hanna, G. (1986). Sex differences in the mathematics achievement of eighth graders in Ontario.Journal for Research in Mathematics Education, 17, 231–237.
Hyde, J. S. (1991). Half the human experience: The psychology of women (4th ed.). Lexington, MA:D.C. Heath.
Hyde, J. S., & Linn, M. C. (Eds.). (1986). The psychology of gender: advances through meta-analysis.Baltimore: Johns Hopkins University.
Kimball, M. M. (1989). A new perspective on women’s math achievement. Psychological Bulletin,105, 198–214.
Langenfield, T. E. (1997). Test fairness: Internal and external investigations of gender bias in mathe-matical testing. Educational Measurement: Issues and Practice, 16, 20–26.
Lane, S., Wang, N., & Magone, M. (1996). Gender related differential item functioning on a middleschool mathematics performance assessment. Educational Measurement: Issues and Practice, 15(4),21–27, 31.
Lewis, C. C., Tsucbida, I., & Coleman, S. (2002). The creation of Japanese and U.S. elementaryscience textbooks: Different process, different outcomes. In G. DeCoker (Ed.), National stan-dards and school reform in Japan and the United States (pp. 46–66). New York: Teachers CollegePress.
Linn, M. C., & Petersen, A. C. (1986). A meta-analysis of gd in spatial ability: Implications forma and science ach. In J. Hyde & M. Linn (Eds.), The psychology of gender: Advances throughmeta-analysis (pp.67–101). Baltimore: Johns Hopkins University.
Liu, O. L., Wilson, M., & Paek, I. (2008). A multidimensional Rasch analysis of gender differences inPISA mathematics. Journal of Applied Measurement, 9 (1), 18–35.
Liu, O. L., & Wilson, M. (in press). Gender Differences in Large-scale Math Assessments: PISA Trend2000–2003. Applied Measurement in Education.
Liu, O. L. (2006). Evaluating Differential Gender Performance on Large-scale Math Assessments:A Multidimensional Rasch Modeling and Mixture Approach. Unpublished doctoral dissertation,University of California, Berkeley.
Maccoby, E. E., & Jacklin, C. N. (1974). The Psychology of Sex Differences. London: Oxford UniversityPress.
Masters, G. N. (1982). A Rasch model for partial credit scoring. Psychometrika, 47, 149–174.
Downloaded By: [Carl Brigham Library] At: 21:54 3 March 2009

PISA MATH: UNITED STATES AND HONG KONG 39
Mullis, I. V. S., Martin, M. O., Gonzalez, E. J, Gregory, K. D., Garden, R. A., O’Connor, K. M.,Chrostowski, S. J., & Smith, T. A. (2000). TIMSS 1999 International Mathematics Report. ChestnutHill, MA: TIMSS & PIRLS International Study Center, Boston College.
Mullis, I. V. S., Martin, M. O., & Foy, P. (2005). IEA’s TIMSS 2003 International report on Achievementin the Mathematics Cognitive Domains. Chestnut Hill, MA: TIMSS & PIRLS International StudyCenter, Boston College.
Murphy, R. J. L. (1982). Sex differences in objective test performance. British Journal of EducationalPsychology, 52, 213–219.
National Center for Education Statistics (NCES). (2002). Digest of Education Statistics: 2001. Wash-ington, DC: U.S. Government Printing Office.
National Center for Education Statistics (NCES). (2005). Digest of Educational Statistics: 2005.Washington, DC: U.S. Government Printing Office.
National Center for Education Statistics (NCES). (2006). The Condition of Education 2006. Washing-ton, DC: U.S. Government Printing Office.
O’Neill, K. A., & McPeek, W. M. (1993). Item and test characteristics that are associated withdifferential item functioning. In P. W. Holland & H. Wainer (Eds.), Differential item functioning (pp.255–279). Hillsdale: NJ: Erlbaum.
O’Neill, K. A., Wild, C. L., & McPeek, W. M. (1989, March). Gender-related differential item perfor-mance on graduate admissions tests. Paper presented at the Annual Meeting of the National Councilon Measurement in Education, San Francisco.
Organization for Economic Co-operation and Development (OECD). (2000). Knowledge and Skillsfor Life: First Results from PISA 2000. Paris: Author.
Organization for Economic Co-operation and Development (OECD). (2003a). Literacy Skills for theWorld of Tomorrow: Further Results from PISA 2000. Paris: Author.
Organization for Economic Co-operation and Development (OECD). (2003b). The PISA 2003 Assess-ment Framework. Paris: Author.
Organization for Economic Co-operation and Development (OECD). (2004). Learning for Tomorrow’sWorld: First results from PISA 2003. Paris: Author.
Organization for Economic Co-operation and Development (OECD). (2005a). PISA 2003 TechnicalReport. Paris: Author.
Organization for Economic Co-operation and Development (OECD). (2005b). PISA 2003 Data Anal-ysis Manual: SPSS Users. Paris: Author.
Schmidt, W. H., McKnight, C. C., Cogan, L. S., Jakwerth, P. M., & Houang, R. T. (1999). Facing theconsequences. Boston: Kluwer Academic Publishers.
Snow, R., & Ennis, M. (1996). Correlates of high mathematical ability in a national sample of eighthgraders. In C. Benbow & D. Lubinski (Eds.), Intellectual talent: Psychometric and social issues (pp.301–327). Baltimore: Johns Hopkins University Press.
Stigler, J. W., & Hiebert, J. (1999). Teaching gap. New York: Free Press.Tsuchida, I., & Lewis, C. C. (2002). How do Japanese and U.S. elementary science books differ?
Depth, breadth, and organization of selected physical science units. In G. DeCoker (Ed.), Nationalstandards and school reform in Japan and the United States (pp. 35–45). New York: TeachersCollege Press.
Von Schrader, S ., & Ansley, T. (2006). Sex differences in the tendency to omit items on multiple-choicetests: 1980–2000. Applied Measurement in Education, 19(1), 41–65.
Wang, J., & Lin, E. (2006). Comparative studies on U.S. and Chinese mathematics learning andthe implications for standards-based mathematics teaching reform. Educational Researcher, 34(5),3–13.
Wright, B., & Masters, J. (1982). Rating Scale Analysis. Chicago: MESA.Wu, M., & Adams, R. J. (2002, April). Plausible Values—Why They Are Important. Paper presented at
the International Objective Measurement Workshop, New Orleans.
Downloaded By: [Carl Brigham Library] At: 21:54 3 March 2009

40 LIU, WILSON
Wu, M. L., Adams, R. J., & Wilson, M. R. (1998). ConQuest. Melbourne, Australia: ACER.Yang, M., & Cobb, P. (1995). A cross-cultural investigation into the development of place-value
concepts of children in Taiwan and the United States. Educational Studies in Mathematics, 28(1),1–33.
APPENDIX
The following six steps illustrate the procedure of how the z statistic is calculatedfor each comparison.
1. The estimated mean of the five sets of plausible values is denoted as θ̂1, . . . θ̂5.θ∗ is the mean of the five means, i.e.
θ∗ = 1
5
5∑
m=1
θ̂m.
2. The sampling variance of the five sets of plausible values is denoted as U1,. . . U5. U ∗ is the mean sampling variance, i.e.
U ∗ = 1
5
5∑
m=1
Um.
3. The imputation variance is denoted asBM . It is also known as the measurementerror variance, i.e.
BM = 1
M − 1
M∑
m=1
(θ̂m − θ∗)2 = 1
4
5∑
m=1
(θ̂m − θ∗)2.
4. The final error variance is denoted as V , i.e.
V = U ∗ + (1 + M−1)BM = U ∗ + 1.2BM.
5. The final standard error is the square root of the final error variance, i.e. SE= √
V .6. The z statistics is calculated as
θ∗(m−f )
SE, with a positive value suggesting higher
male performance.
Downloaded By: [Carl Brigham Library] At: 21:54 3 March 2009