Embed Size (px)
Citation preview

Gender and the Labour Market in South East England
Volume 1: The Context
Susan Corby Celia Stanworth
Sue Long Margaret Fox

The views expressed in this report are the authors and do not necessarily reflect those of the South East of England Development Agency (SEEDA). Acknowledgements The authors would like to acknowledge the assistance of the members of the steering group: Mr Patrick Baynes, Deputy Head, The Business School, University of Greenwich Ms Jacqui Hughes, South East of England Development Agency Dr David Perfect, Research Manager, Equal Opportunities Commission Baroness Prosser, Chair of the Women and Work Commission. Further enquiries to: Susan Corby and Celia Stanworth, Work and Employment Relations Unit (WERU), The Business School, University of Greenwich, Old Royal Naval College, London SE10 9LS. Tel: 020 8331 8000 Emails: [email protected] [email protected] ISBN: 1 86166 218 1 September 2005
TABLE OF CONTENTS
EXECUTIVE SUMMARY ................................................................................III
PART 1: BACKGROUND................................................................................1
1. Introduction ........................................................................................................................................1 1.1 Structure of the report ....................................................................................................................1 1.2. The changing context....................................................................................................................1 1.3 Research objective and questions ..................................................................................................2
2. Explanations for gender inequality...................................................................................................2 2.1 Human capital theory.....................................................................................................................2 2.2 Horizontal and vertical segregation ...............................................................................................3 2.3 Choice theories ..............................................................................................................................4 2.4 Radical theories .............................................................................................................................5
3. The legal framework ..........................................................................................................................5 3.1 Equality and the law ......................................................................................................................5 3.2 The use of the law..........................................................................................................................7
4. Organisational factors........................................................................................................................8 4.1 The business case...........................................................................................................................8 4.2 Equal opportunities policies and practices ............................................................................9 4.3 Cultures and attitudes.....................................................................................................................9 4.4 Pay and reward criteria ................................................................................................................10 4.5 Non-standard working patterns....................................................................................................11 4.6 Summary......................................................................................................................................11
PART 2: WOMEN IN THE SOUTH EAST OF ENGLAND LABOUR MARKET.......................................................................................................................13
5. An overview.......................................................................................................................................13 5.1 The research question ..................................................................................................................13 5.2 Methodology................................................................................................................................13 5.3 The economy of the South East region ........................................................................................14
6. Participation in the labour market .................................................................................................16 6.1 Economic activity ........................................................................................................................16 6.2 Employment rates ........................................................................................................................17 6.3 Self employment..........................................................................................................................18 6.4 Part-time work .............................................................................................................................19 6.5 Occupational distribution.............................................................................................................21 6.6 Career progression .......................................................................................................................23
7. Pay Issues ..........................................................................................................................................24 7.1 The median gender pay gap .........................................................................................................24 7.2 The lowest and highest deciles ....................................................................................................28
8. Education and Training ...................................................................................................................30 8.1 Qualification levels ......................................................................................................................30 8.2 Job-related training .....................................................................................................................34 8.2 Skills shortages ............................................................................................................................35
9. Summary and Conclusions ..............................................................................................................38 9.1 The context ..................................................................................................................................38
i

9.2 Women in the South East of England: a comparative picture......................................................38 9.3 Gender, pay and region................................................................................................................39 9.4 Gender, qualifications and skills..................................................................................................40 9.5 A final comment ..........................................................................................................................40
10. REFERENCES ........................................................................................41 TABLE OF FIGURES Figure 6.1: Economic Activity by Region & Gender .............................................................................16 Figure 6.2: Employment Rates by Region and Gender ..........................................................................17 Figure 6.3: Percentage Point Changes in Employment Rates 1999-2003, by Region and Gender.........19 Figure 6.4: The Percentage of Women and Men Working Part-Time by Region (spring 2003) ............20 Figure 6.5: Employed Men and Women in the South East by Occupational Group (spring 2004)........21 Figure 6.6: The Occupations of Male and Female Employees (LFS data, spring 2004) ........................22 Figure 6.7: Employed Men and Women in the London region by Occupational Group (spring 2004) .22Figure 6.8: Promotion Rates for Men and Women (BHPS 1999-2000) .................................................24 Figure 7.1: The Median Gross Hourly Earnings of Full-Time Workers on Adult Rates, by Region .....25 Figure 7.2: Gender Pay Gap: Median Gross Hourly Earnings for Full-Time Workers by Region.........26 Figure 7.3: The Gender Pay Gap in Great Britain by Industrial Sector, April 2003...............................27 Figure 7.4: The Male/Female Earnings Differential for the Upper Earnings Decile, by Region............29 Figure 8.1: Highest Qualification of Economically Active Population, England 1993/1998/ 2003.......30 Figure 8.2: Proportion of Employees Qualified to NVQ level 4 and above, by Region and Gender .....32 Figure 8.3: Proportion of Employees with No Qualifications, by Region and Gender ..........................33 Figure 8.4: Employees of Working Age Receiving Job-Related Training, by Region and Gender .......34 Figure 8.5: The Types of Staff Trained in the last 12 months in the South East Region........................35 Figure 8.6: Skills Employers found Difficult to Recruit.........................................................................37 TABLE OF TABLES Table 5.1: South East Region: Employee Jobs by Industry, December 2001.......................................15 Table 7.1: The Gender Pay Gap by Region for Lowest and Highest Paid Full-time Workers .............28 Table 8.1: Highest Qualification Level by Gender................................................................................31 Table 8.2: Vacancies, Hard to Fill Vacancies & Skill Shortage Vacancies by region..........................36 Table 8.3: Density of Recruitment Problems by Occupation ................................................................37
ii

GENDER AND THE LABOUR MARKET IN SOUTH EAST ENGLAND
Volume 1: The Context
Executive Summary The research This research was commissioned by the South East England Development Agency (SEEDA) and the European Social Fund (ESF). The objective is to identify good practice as well as barriers to women’s full contribution to the labour market in South East (SE) England. The research questions are:
• How does the labour market position of women in the SE region compare with that of men in the region and with that of women nationally?
• What policies and practices do employers in South East England adopt in
respect of gender equality?
• What barriers do employers and women employees in South-East England identify in respect of gender and employment?
Background This first volume focuses on the first of these questions and is organised in two parts. Part One sets the context. First, theoretical explanations for gender inequality are discussed, including human capital theory, preference theory, the horizontal segregation of women into a relatively narrow range of occupations and vertical segregation of women towards the bottom of occupational hierarchies. No single explanation, however, seems adequate. Secondly, the legal framework is examined. The sex discrimination legislation essentially focuses on formal, procedural fairness, rather than equality of outcomes as positive action is circumscribed. Moreover, those seeking to exercise their rights under equal pay and sex discrimination laws face barriers, essentially because of legal complexities and the lack of legal aid. Thirdly, we consider organisational factors: the strengths and weaknesses of the business case for equality, the prevalence of equality policies which are often not supported by equality practices, and the way that pay and reward systems, non-standard working patterns and long hours of work often militate against gender equality. Perhaps the most difficult to change are organisational cultures which are often not conducive to the full involvement of women.
iii

The SE Region In Part Two the labour market position of women in the SE region is compared with that of men in the Region and with both sexes nationally, using a range of published data on which secondary analysis was conducted for this report. First, the Regional context is analysed. The Region has the second largest economy in the UK, the largest in terms of population and exhibits the highest recent economic growth of any English region or UK country. In terms of sectoral employment, the dominant sectors are ‘distribution, hotels, catering, repairs’ and ‘financial and business services’ and nine out of the world’s top ten pharma-bio firms are based in the Region. Areas of deprivation exist, however, alongside relative affluence. Labour market participation To ascertain labour market participation a range of indicators were analysed. Activity rates among women and men in the South East are relatively high, though women’s activity rate is 10 percentage points lower than men’s. Self-employment is more prevalent in the SE Region than the UK as a whole, but in terms of part-time work the regional figures are similar to the UK average. The occupational breakdown shows that women are crowded into similar groups as the rest of the UK: sales and customer services; personal services; administrative and secretarial work. The proportion of women managers and senior officials in the SE Region, however, is higher than the UK average and has grown over the last decade. Contrary to the conventional wisdom, our analysis indicates that British women have promotion rates equal to men’s, though this analysis is not broken down by region and takes no account of grades before and after promotion. Pay Looking at the relative pay of men and women working in the Region, the gross gender pay gap in 2003 as measured by the median was wider in the SE, not only than Great Britain (GB) as a whole, but it was also greater than any other region or country in GB. Moreover, although women in the SE Region earned less in absolute terms than their London counterparts, the median gender pay gap was far wider in the SE than London: 19 per cent compared to 8 per cent. At the lowest decile of earnings the gender pay gap was fairly narrow and the South East was below the GB average, but the position was very different at the highest decile. Amongst the highest earners the gender pay was wider in the SE Region than any other region: 30 per cent compared to 20 per cent for GB as a whole. This finding suggests that affluence, far from reducing the gender pay gap, exacerbates it. Education, training and skills Data on qualifications and skills suggest that the percentage of women and men living in the SE region educated to degree level or equivalent are roughly the same. Also the percentage of workers educated to this level is higher than for the UK as a whole and second only to London among the English regions. Moreover, the SE region has a lower percentage of women without qualifications than any other region except London. In terms of training, more women than men in all regions received job-
iv
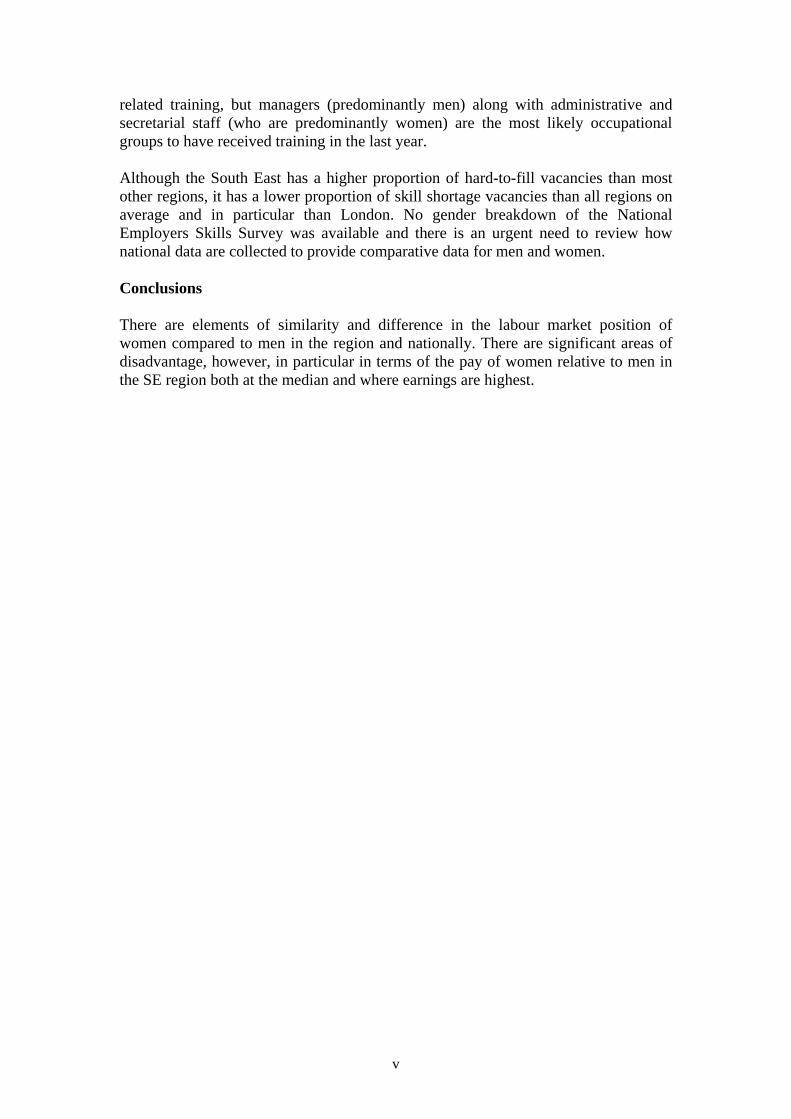
related training, but managers (predominantly men) along with administrative and secretarial staff (who are predominantly women) are the most likely occupational groups to have received training in the last year. Although the South East has a higher proportion of hard-to-fill vacancies than most other regions, it has a lower proportion of skill shortage vacancies than all regions on average and in particular than London. No gender breakdown of the National Employers Skills Survey was available and there is an urgent need to review how national data are collected to provide comparative data for men and women. Conclusions There are elements of similarity and difference in the labour market position of women compared to men in the region and nationally. There are significant areas of disadvantage, however, in particular in terms of the pay of women relative to men in the SE region both at the median and where earnings are highest.
v


Gender & the Labour Market in SE England: Volume 1 - The Context
GENDER AND THE LABOUR MARKET IN SOUTH EAST ENGLAND
Volume 1: The context
Susan Corby, Celia Stanworth, Susan Long, Margaret Fox
PART 1: Background 1. Introduction
1.1 Structure of the report In this first volume we first set out the broad aims and objectives of this research project. We then examine the various theoretical frameworks that attempt to explain women’s labour market disadvantage and discuss the legal position affecting women at work. As much of this research project, however, concerns the organisational level, we next examine research into women’s work and employment, including human resource practices that often de facto disadvantage women. In the second part of this volume, we present a statistical analysis comparing women with men in the South-East regional labour market; and women in the South East with women nationally. In volume 2 we look at the policies, practices and views of employers in the South East and those of female employees.
1.2. The changing context Equality between men and women at work is a relatively modern construct. In the early 1920s a few local authorities paid women the same as men for the same work but a case was brought against the London Borough of Poplar, alleging that an equal pay regime was a misuse of the rates. The House of Lords held that Poplar’s payment systems were unlawful as they were guided by ‘eccentric principles of socialist philanthropy, or by a feminist ambition to secure the equality of the sexes.’1
Society has come a long way since then. The UK first passed equal pay and sex discrimination legislation in 1970 and 1975 respectively and when it joined what was then called the European Community in 1973 it signed up to the 1957 Treaty of Rome. The Treaty (in what was Article 119, now Article 141) enshrines equal pay between men and women. This Article has been fleshed out by various directives in respect of equal pay and equal treatment, (eg 75/117/EEC, 76/207EEC, 79/7/EEC; 97/80/EC) together with the 1 Roberts v Hopwood [1925] AC 578 HL
1

Gender & the Labour Market in SE England: Volume 1 - The Context
directive on the safety and health of pregnant workers and directives on parental leave, part-time work, and fixed term work, which while having different Treaty bases, also have a direct or indirect bearing on the employment of women. As a result, there is much domestic law: directives have to be transposed into national law and as a result there is case law both from UK courts and from the European Court of Justice (ECJ). Yet inequality between men and women continues, as the statistics for the South-East region in this report show, with horizontal and vertical sex segregation by occupation and by industry and, associated with this, a persistent gender pay gap. Women as a whole earn less than men as a whole; are to be found in greater proportions than men at the bottom of organisations and in certain industries, (for example education but not construction) and the old argument, that it is only a matter of time, is less and less credible. As Dickens (1994:6) says: ‘the aggregate picture [for women] still echoes what must have been the cry of the Egyptian slaves – lousy pay and pyramids’.
1.3 Research objective and questions Against this background, and having been commissioned by the South East England Development Agency (SEEDA) and the European Social Fund (ESF), our research objective is to identify barriers that prevent women from making a full contribution in the labour market in the SEEDA area and to disseminate best practice. In line with this overarching objective, our research questions are:
• Analysing official statistics, how does the labour market position of women in the government region of the South-East of England compare with that of both men in the South East and with that of women in Great Britain/United Kingdom?
• What policies and practices do employers in South East England adopt in
respect of gender equality?
• What barriers do employers and women employees in South-East England identify in respect of gender and employment?
This volume focuses on the first of these research questions. Before doing so, however, we set the scene. We consider the various economic and sociological explanations for gender inequality and examine and critique the legal framework. Then we look at organisational factors.
2. Explanations for gender inequality
2.1 Human capital theory As we will show in Part Two, women overall earn less than men and are under-represented in the higher paid occupations and there are a number of explanations for
2

Gender & the Labour Market in SE England: Volume 1 - The Context
this. One explanation relates to human capital. Under the standard economic assumptions of a perfectly competitive labour market and the orthodox frameworks of supply and demand, it is argued that an employer will pay employees to the value of the contribution they make to the output of the firm. Human capital theory argues that, on average, women are less productive than men due to differences in innate, biologically determined abilities and/or acquired skills in the form of education, qualifications, training and experience. In particular, women often spend time out of the labour market to care for children (Anderson et al, 2001; Bradley, 1989). This theory, however, can be criticised. First, as Bradley (1989:30) says:
…. many sociologists would reject such biologistic explanations, claiming that the link between genes, hormones, instincts, physique and sex differences and behavioural patterns has never been satisfactorily proved and that reliance on biology ignores the extent to which all forms of human behaviour are cultural and variable.
Second, although the percentage of women in the UK completing higher education has risen in the last decade, the gender pay gap has narrowed only slightly. Third, human capital itself is not absolute as the concept of skill is socially constructed. Feminisation of a particular occupation or profession is perceived to have the effect of deskilling it and where women enter certain professions in significant numbers, new patterns of gender segregation emerge, as has occurred for instance in medical specialties (Corby, 1997). Conversely where men enter into traditionally female domains they redefine it. For instance in the main they are not midwives, but obstetricians. Fourth, while human capital theory may explain vertical segregation, it does not explain horizontal segregation. Fifth, standardising for characteristics, although women with continuous employment histories who work full-time are better paid than women with employment breaks, they are still paid less than men employed full-time (Joshi et al, 1999). Indeed, Olsen and Walby (2004), on the basis of a statistical model, found that women’s lesser education accounted for 8 per cent of the gender pay gap and women’s lesser employment experience accounted for 36 per cent, but direct discrimination and different labour market preferences and motivations accounted for 38 per cent of the gender pay gap.
2.2 Horizontal and vertical segregation Another explanation for the differences exhibited by men and women in the labour market is horizontal and vertical sex segregation. This concept was developed by a number of commentators including Hakim (1979) and Roos (1985). Horizontal sex segregation refers to the fact that women’s employment tends to be crowded into particular sectors and occupations in the labour market, unlike the pattern of male employment, where there is a much more even spread. In the UK in 2003 there were more than twice as many women than men in administrative and secretarial, personal service and sales and customer service occupations. The reverse was true in ‘blue-collar’ occupations (Begum, 2004). Blackwell (2001), in a cross-sectional and longitudinal study, found that occupational sex segregation was even greater for part-time than for full-time women; 44 per cent of women in the UK work part-time (Equal Opportunities Commission, 2004a). Vertical sex segregation, as opposed to horizontal sex segregation, reflects the under-representation of women in higher levels of all organisational hierarchies and occupations, in particular the lack of women in higher management roles in the UK.
3
Gender & the Labour Market in SE England: Volume 1 - The Context
Miller et al (2004) argue that occupational segregation arises out of occupational stereotyping, which in turn derives from sex role stereotyping. There is a set of widely held assumptions and cultural norms about the sorts of activities carried out by men and women in society and these assumptions influence individuals when they are making occupational choices. In other words, when school children are choosing subject specialisms and thinking about their future, their preferences are largely shaped by notions of gender congruence. In turn this perpetuates occupational segregation and there is a vicious circle. They also point out that less gendered occupations tend to have higher pay rates than female dominated occupations, so occupational segregation is a significant factor in the gender pay gap. It also acts to discourage men from entering predominantly female occupations (Breugel, 2001). The explanations for sex segregation are complex, however, and other factors include the need for women to reconcile work and family life, ‘masculine’ organisational cultures and practices and choice theories.
2.3 Choice theories Another explanation for differences between men and women in the labour market and consonant with orthodox economic frameworks are theories relating to choice. There are two facets to this: choice by employers (demand side) and choice by women (supply side). In terms of demand side explanations, a risk averse employer might prefer to employ individuals on the basis of judgements of group characteristics, say the employment of men in key/skilled roles because on average women take more time out of the labour market than men, or the employment of women in certain jobs because of their supposedly female attributes eg because women have ‘nimble’ fingers (Breugel, 2001). Alternatively, employers may have imperfect information and/or make irrational choices, preferring men for certain roles rather than women. An example is the study by Morgan and Knights (1991) of an insurance company where senior managers rejected women as sales people. This in turn leads women to ‘crowd’ into jobs where employers are not exercising their discriminatory taste. As supply of labour tends to exceed demand in these areas, women can only command low wages. Taste discrimination, however, is a more persuasive explanation of horizontal segregation than vertical segregation. (For a fuller discussion see Anderson et al 2001; Bradley, 1989). On the supply side, Hakim (1991, 2002) argues that women make early and fairly fixed choices between market work and family work. She divides women into three ideal types: adaptive women who prefer to combine work and family without giving a fixed priority to either; work-centred women whose family life is fitted round their work; and home-centred women whose priority is family life ( Hakim, 2002). Preference theory explains why many women choose careerless, part-time and short-term jobs. This gives employers a degree of monopsony in respect of home centred or adaptive women, because such women tend to prefer certain work in terms of hours and/or location and thus have restricted employment options.
4
Gender & the Labour Market in SE England: Volume 1 - The Context
Hakim, however, essentially ignores how choice is constructed and the fact that women’s choices may be influenced by expected constraints in the labour market (Anderson et al, 2001). Moreover, Fagan (2001) in an analysis of the 1995 British Household Panel Survey and the Equal Opportunities Commission 1989 hours of work survey found that the presence of pre-school children is associated with a sharp decline in work commitment for both sexes and Hakim’s ‘grateful slaves’ thesis (i.e. that work comes second to home for many women) ignores employer requirements in the construction of their workforce.
2.4 Radical theories We now turn from economic theories explaining the differences between men and women in the labour market to radical theories. One theory, developed by Marx, is the theory of the reserve army of labour, whose existence ensures that workers are unable to press for higher wages even in times of high labour demand (Burns, 1935). Are women a reserve army? It is strongly arguable that they are not. In the UK women are concentrated in certain sectors and in part-time jobs and there is little gender substitution. Furthermore, whereas the number of male manual jobs has decreased in recent years, the number of part-time female jobs has increased (Nolan, 2003). Another radical theory combines capitalism with patriarchy in what is often called dual systems theory. Patriarchy is defined by Walby (1990:20) as ‘a system of social structures in which men dominate, oppress and exploit women’. She argues essentially that men fear female competition in the labour market and also want a comfortable home with a wife servicing her husband’s domestic needs and not challenging his authority as a breadwinner. Walby (1990) further distinguishes between private and public patriarchy, with the latter superseding the former. In private patriarchy the principal strategy is exclusion. In public patriarchy the principal strategy is segregationist. An example of private patriarchy are the Treasury regulations of 1921 under which it was lawful to reserve for men particular appointments in the British civil service based abroad (Fredman and Morris, 1989). An example of public patriarchy is the use of time/hours of work to disadvantage women in the labour market and the assumption that home hinders ‘proper’ work (so training courses are held in hotels/centres away from home) (Buswell and Jenkins, 1994). In short, Walby (1990) argues that the privileging of productive activity over reproductive activity and the assumption that domestic labour is unrelated to economic value inevitably operates to women’s disadvantage in the labour market.
3. The legal framework
3.1 Equality and the law Having looked at some explanations for gender inequality, this report now turns from theory to the legal framework. In so doing, however, we do not summarise the details of the legislation. That is done in various legal textbooks; see, for instance Deakin and Morris (2004); Lewis and Sergeant, (2004); Pitt, (2004). Instead this section looks at
5

Gender & the Labour Market in SE England: Volume 1 - The Context
the law’s general approach towards equality, setting out the legal framework in which employers operate. Equality between men and women can be defined in a number of ways. The most basic concept is that like should be treated as like and that fairness requires consistent treatment. This concept derives from a liberal ideology which asserts the individual’s rights to universally applicable standards of justice and has been termed formal or procedural equality (Caruso 2003; Fredman, 2002; Hepple et al, 2002). An underlying assumption is that discrimination occurs when a person is subjected to a detriment because she is attributed with negative stereotypical qualities based on gender (Fredman, 2001, 2002). Other assumptions are that it is possible to eliminate gender bias by the use of ‘proper’ procedures and that it is possible for employers scientifically to choose the most meritorious employee or potential employee (Townshend-Smith, 2000). This in essence is the basis of the legal framework in respect of so-called direct discrimination. It may have driven overt expressions of discrimination underground but discrimination is often a more subtle process and there are a number of drawbacks with this approach. First, it is intensely individualistic. Second, the law focuses on the eradication of difference, not disadvantage: under sex discrimination and equal pay law, a woman (and the vast majority of sex discrimination and equal pay claims are brought by women (Hayward et al, 2003) has to find a male comparator whose relevant circumstances are not materially different from those of the complainant. Although under sex discrimination law the comparator can be notional or actual, under equal pay law there has to be an actual comparator and this can be problematic; but whether actual or notional, in practice this leads to the perpetuation of the idea of the male worker as the ‘standard’ or ‘norm’, whereas the woman worker continues to be considered as in some way unusual or even ‘deviant’ (Fredman 2002; Hepple et al, 2000; Mullally, 2003; O’Cinneide, 2003). Interestingly the ECJ, by ruling that a pregnant woman needs no comparator and cannot be compared to a sick man2, has implicitly recognised this drawback A further drawback with the like treated as like approach is that as long as men and women are treated equally, they can be treated equally badly3. Another definition of equality is equality of opportunity: distortions in the market have to be removed to ensure a level playing field. In gender terms, obstacles to the advancement of women have to be removed so as to ensure what is often called starting gate equality (Fredman, 2001, 2002; Mullally, 2003). First developed in the USA by way of case law under Title VII of the Civil Rights Act 1964, this is the basis of the legal framework in respect of indirect discrimination. A requirement, condition or practice which on its face is gender neutral but has a disparate impact on women (or men, as the law is symmetrical) is only lawful if it is objectively justifiable for non-gender tainted reasons and is proportionate to the end to be achieved4. This subordinates gender equality to utilitarian goals (Fredman, 2000) but there is a further dilution under equal pay law. An employer does not need objectively to justify a 2 Webb v Emo Air Cargo (UK) Ltd [1984] IRLR 482 ECJ 3 Glasgow City Council v Zafar [1997] IRLR 229 CS 4 Bilka-Kaufhaus GmbH v Weber von Hartz [1986] IRLR 317 ECJ
6

Gender & the Labour Market in SE England: Volume 1 - The Context
factor causing a gender pay gap, as long as he can show that the factor genuinely existed, was not tainted by gender and was material.5 Equality of opportunity is not the same as equality of results. Under equality of opportunity men and women are, at least theoretically, at the starting gate together, but the race is won by the fastest, i.e. the most meritorious. In contrast, equality of results means that there are substantively equal outcomes. Positive action is a corollary of both these forms of equality and Caruso (2003) distinguishes between hard measures of intervention designed to achieve equality of results in employment, often called affirmative action, and soft measures, associated with equality of opportunity. An example of the former is a timetable to achieve a certain gender quota of senior staff in an organisation, irrespective of merit, provided that staff selected to meet the quota can perform the job adequately. An example of the latter is women only managerial training, but with selection as a manager based on merit and comparison with other candidates irrespective of gender. Under European law only certain forms of positive action are permitted and none are required. Thus the European Court of Justice (ECJ) held that the University of Goteborg had unlawfully appointed a female professor because even though her qualifications were sufficient for the post, they were below the qualifications of a male candidate6. On the other hand, the ECJ held that where a female candidate and a male candidate are equally qualified in areas where women are traditionally under-represented, an employer can give preference to a woman, rather than tossing a coin, in recognition of the fact that women often face prejudice and/or stereotypical attitudes7. This proviso leaves unchallenged the notion of merit, though it goes further than ‘soft’ positive action measures: a woman can be selected in preference to a man in very limited circumstances (Costello, 2003). Jewson and Mason (1986) argue that often in practice these different forms of equality are conflated. Liberals often defend the fairness of formal or procedural equality by reference to outcomes, whilst those whose goal is equality of results often disguise themselves in liberal clothing as affirmative action is unlawful in the UK and the EU.
3.2 The use of the law The sex discrimination and equal pay legislation are individualistic: there is no provision for class actions as in the U.S.A8; but discrimination is not just a question of individual justice. It often affects groups. Moreover, individual enforcement goes hand in hand with an adversarial approach and this often poisons the atmosphere and results in defensive reactions, rather than proactive responses. This is because individuals and organisations often resent accusations of ‘discrimination’ as they
5 Tyldesley v TML Plastics Ltd [1996] IRLR 395 EAT; Strathclyde Regional Council v Wallace [1998] ICR 205 HL 6 Abrahamson and Anderson v Fogelqvist [2000] ECR 1-5539 ECJ 7 Marschall v Land Nordrhein-Westfalen [1988] IRLR 39 ECJ 8 The EOC can conduct formal belief investigations but rarely does so. Its investigation in 2003 of sexual harassment at Royal Mail sorting offices was its first for 10 years according to its 2003-04 annual report.
7
Gender & the Labour Market in SE England: Volume 1 - The Context
carry an implication of intent, though in fact intent is not material in assessing the merits of a case and may arise out of an unquestioned practice (O’Cinneide, 2003). Furthermore, where people bring claims, they face obstacles. Direct discrimination is often particularly difficult to prove and the law relating to sex discrimination and equal pay is complex and inaccessible (Hepple et al, 2000). These problems are compounded by the fact that there is no legal aid at employment tribunals. The Equal Opportunities Commission (EOC) has the power to give legal assistance and representation in cases which raise a question of principle or where it is unreasonable to expect the applicant to deal with a case unaided, having regard, inter alia, to the complexity of the case, but budgetary constraints make it inevitable that the EOC cannot respond positively to all the requests it receives (Fredman, 2002). Also trade unions may provide legal assistance and representation, but less than a third of women employees (29 per cent) were union members in 2003, with union density for part-time women at 23 per cent (Palmer et al, 2004). Over 70 per cent of claimants in sex discrimination and equal pay cases either reach a conciliated settlement under the auspices of the Advisory, Conciliation & Arbitration Service (Acas) or withdraw their case, rather than proceeding to a hearing (Employment Tribunal Service, 2004) and the lack of legal aid may be a significant factor in the high level of settlement and withdrawal. Where a claimant wins a sex discrimination case, the range of remedies is very limited. The aim essentially is to compensate for past discrimination, not to change employers’ practices. For instance interim relief cannot be granted and the tribunal has no power to order appointment, promotion, reinstatement or re-engagement (Hepple et al, n.d.). Moreover, in practice the amount of compensation is often low: the median award was only £5,425 in 2003-04, with the average at £12,971 (Employment Tribunal Service, 2004).
4. Organisational factors
4.1 The business case We now turn to employer policies and practices. These are shaped by the legal framework (see section 3 above), as well as the labour market but, irrespective of these, it is argued that it is in the organisation’s interest to promote gender equality, i.e. there is a business case for equality. Business case arguments have a number of strands. Organisations, it is argued, can attract a wider pool of applicants and secure higher quality employees if they recruit and select on the basis of merit, not stereotype, and recruit from non-traditional sources, for example married women returners; provide family friendly measures to aid retention; and train and promote those in the lower grades where women often disproportionately cluster. Another strand of the business cases focuses on organisational effectiveness. Organisations, it is argued, make better decisions if managers are diverse and have different perspectives, for instance because of their gender. They can also relate to their customers/clients more closely if they reflect their customers’ gender distribution (Corby, 2000). Indeed, business case arguments have been used by pressure groups, such as Opportunity Now (formerly Opportunity 2000), campaigning for an expansion of
8

Gender & the Labour Market in SE England: Volume 1 - The Context
women’s employment opportunities and increasingly they have been adopted by government and practitioners alike (Corby, 2000). In theory such arguments are persuasive, providing a way for the incorporation of equality into business strategy. In practice, however, the business case argument is contingent and partial and can lead away from equality, as well as towards it. For instance, where organisations experience labour market pressures the business case might point towards contracting out, rather than recruiting and training from non-traditional sources. Similarly the business case might point to a higher rate of labour turnover, rather than the establishment of a workplace nursery. Anderson and Metcalf (2003) also found that it was impossible to conclude whether gender diversity brought net business benefits. In short, the business case alone cannot provide enough pressure for change without an ethical dimension and, above all, without a strong legal under-pinning (Corby, 2000; Dickens 1994, 1998).
4.2 Equal opportunities policies and practices Whether or not the legislation and the business case have the ability to mobilise, The Workplace Employee Relations Survey (WERS) 1998 found that two thirds of workplaces had a gender policy (Cully et al. 1998). Although such policies can serve as a demonstration of commitment, they can also be an end in themselves. Indeed Hoque and Noon (2004) re-analysing the WERS dataset, including the employee survey, find that gender equality policies are mostly ‘empty shells’, i.e. they are not supported by family friendly practices. They also find that where there are equal opportunity practices, access is conditional on the employee’s position in the occupational hierarchy. In other words such practices are more readily available to senior than junior women. Leaving aside the formal supports for gender equality inherent in equal opportunity policies, studies have suggested how organisational cultures, attitudes, values and practices can disadvantage women, albeit often subtly (Cockburn, 1991; Dickens, 1998; Grimshaw and Rubery, 2001). Accordingly, in this section of the report we look at some of these practices, (which will be further explored in the third stage of our research), that are by no means exhaustive.
4.3 Cultures and attitudes Organisational cultures and male attitudes can lead to a problematic environment for women, especially those who work in a predominantly male area. Cockburn (1991) points out that men often resent senior women, arguing that they are ‘tokens’ who have got there by fluttering their eyelashes or because they are ‘hard as nails’. Women absorb such implicit messages and thus some become ambivalent about promotion. Moreover, where women apply for posts in areas dominated by men, they are often treated differently from male applicants with characteristics more typically associated with men being implicitly more highly valued (Collinson et al, 1990; Rubin, 1997). A Catalyst and Opportunity Now study (2000) of attitudes of chief executives and senior women found that senior women themselves perceived that they were excluded from male-dominated networks and faced a generally hostile culture. A study by
9

Gender & the Labour Market in SE England: Volume 1 - The Context
Deem (2003) of UK academic management similarly found that women felt that they had been held back by their gender, and that the criteria for preferment were skewed towards men. Maddock and Parkin (1994) consider that there are various sorts of culture that can pose difficulties for women. These include what they call ‘the gentlemen’s club’ where senior men are serviced by women who feel valued by their male bosses. This results, for instance, in nurses showing goodwill towards male doctors but not towards female doctors. Another culture, they say, is the ‘locker room’ where men exclude women by talking of sex and sport. Yet another culture they call ‘smart macho’ where male managers are driven by competitiveness and discriminate against those who cannot work at the same pace or put in the same hours. Indeed, long hours of work are often a means of gender differentiation. An analysis of the usual average hours worked in all fifteen member states of the European Union in 2001 showed that the working hours of full-time women in the UK (41 hours per week) were the second highest, while those of full-time men were the highest (46 hours per week) (Thewlis et al, 2004). Moreover, in Britain a quarter of workers regularly work over their contracted hours and reasons include not only business demands, but also ‘presenteeism’, (presence at work beyond contracted hours and irrespective of the tasks to be completed) especially among managers and professionals (DTI, 2003). Coyle (1995), in a study of five organisations, argues that excessively long working hours, which have become the norm for managers, may be particularly problematic for women. The lengthening in working hours, she says, is partly because of work intensification as a result of reduced staffing levels and delayering and partly because ‘presenteeism’ is regarded as an indicator of commitment. Accordingly, many women have ‘to make a stark choice between their careers and their families’ (Coyle, 1995:60).
4.4 Pay and reward criteria The values inherent in pay determination mechanisms may be a further source of discrimination. Bevan and Thompson (1995), looking at four organisations, found that the practice of merit pay led to discrimination as gender bias tended to enter into the process of translating appraisal ratings into pay awards. Similarly Rees and Garnsey (2003) found that competence frameworks, which have been adopted in many UK organisations in order to align individual behaviour with business aims and objectives, although ostensibly gender neutral, were in fact discriminatory. They found that many qualities women bring to work, such as co-operation, empathy, nurturing and coaching, failed to be recognised or rewarded in the case organisations studied. Furthermore, reward systems rarely cover items such as crèches or child care vouchers, even though Joshi et al (1999) have shown that there is a wage penalty in motherhood where women take time off work and/or reduce their hours to care for children. Moreover, often better fringe benefits accrue to higher grade work – more likely to be male – than lower-grade work where women predominate (Dickens, 1998). Attention has also been paid to the role of unions in pay determination. They are increasingly reaching out to women as their male heartlands decline and there are
10

Gender & the Labour Market in SE England: Volume 1 - The Context
examples of equality bargaining that have secured benefits of particular interest to women (Dickens, 1997). Moreover, Cully et al (1999) found that collective bargaining was associated with reduced pay dispersion and Grimshaw and Rubery (2001) found a positive relationship between the size of the gender pay gap and the level of wage inequality within organisations. McColgan (2000) maintains that in countries of the European Union where collective bargaining coverage is high, women generally do well in terms of their relative pay, especially where there is also centralised (industry level) collective bargaining. Less than a quarter of employees in the UK private sector, however, are covered by collective bargaining (Palmer et al, 2004) and Gilbert and Secker (1995) looking at electricity supply before and after privatisation, dispute the gender pay equalising role of centralised collective bargaining.
4.5 Non-standard working patterns Whenever working patterns move away from the ‘standard’ model of full-time, permanent jobs, workers tend to have fewer employment rights, less security and in some cases, inferior terms and conditions. Four out of every five part-time workers are women, and part-time working is the most common non-standard form of work in the UK (Stanworth 2000). The Part-time Workers Directive outlaws less favourable treatment of part-timers compared to full-timers in terms of pay and holidays, but because of job segregation there are often no comparators. Also women are disadvantaged because most part-time work is in low discretion and low paid occupations, and working reduced hours usually precludes workers from advancement of any kind (Gallie and White, 1994). Women also tend to be over-represented in short-term contract jobs in certain sectors. One example is higher education where casualised contracts are far more widespread for women than for men (AUT, 2004). Indeed, more than half of all temporary workers in the UK are female (Labour Market Trends, 2004). Women who return to work after maternity leave are often subject to occupational downgrading (Equal Opportunities Commission, 2004b) especially if they switch to part-time hours (Blackwell, 2001). Cockburn (1989:221) maintains that senior managers do not encourage men to treat their careers as interruptible; as long as this persists, even if employers provide generous maternity arrangements ‘women will still compete, with one hand tied behind them, with men both of whose hands are free to keep hold of power at work’.
4.6 Summary We have briefly summarised the main economic and sociological explanations for the prevalence of gender inequality in the labour market but find no single explanation adequate. We have also reviewed the law’s approach to equality finding that it focuses on formal, procedural fairness and equality of opportunity, rather than equality of results. Positive action to seek to rectify the legacy of discrimination is limited by law. In addition, we have highlighted the difficulties claimants face when seeking to exercise their legal rights particularly because of he complexity of the equal pay and sex discrimination laws and the lack of legal aid. We sound, however, a note of caution. The law is only one of many factors which impact on the labour market and
11

Gender & the Labour Market in SE England: Volume 1 - The Context
legislation alone is unlikely to eradicate gender discrimination. As the eminent labour lawyer Kahn-Freund (1954:43) said: ‘the first duty of a lawyer about to discuss the legal framework of [employment] relations is to warn his readers not to overestimate its importance’. Accordingly, we have also looked at a variety of ways in which gender inequality arises in practice within organisations and at the business case for equality. It is important to make it clear, however, that gender disadvantage at work can only be understood in a multi-stranded way, and various negative factors tend to reinforce each other. Against that background we now turn to the labour market position of women in the South-East of England.
12

Gender & the Labour Market in SE England: Volume 1 - The Context
PART 2: Women in the South East of England labour market 5. An overview
5.1 The research question The research question for this volume was: analysing official statistics, how does the labour market position of women in the government region of the South-East (SE) of England compare with that of both men in the South East and that of women in Great Britain/United Kingdom.
5.2 Methodology To answer the research question a number of datasets were downloaded from the UK data archive. First, to examine labour market activity, Regional Trends were used, and secondary analysis was conducted on the Labour Force Survey (LFS) data (spring 2004) to provide up-to-date evidence on the types of occupations in which men and women are employed. In addition, British Household Panel Survey (BHPS) data were used. Following the methodology adopted by Booth et al (1999) who used BHPS data to calculate promotion rates for the period 1991-1995, male and female promotion rates for 1999 and 2000 were calculated also using the BHPS. Although time consuming, this enabled some new information on the promotion rates of women to be presented. To calculate the gender pay gap, the New Earnings Survey (NES) 2003 was used. Importantly though, whereas traditionally those calculating the gender pay gap from the NES have used the mean, this report adopts the median (see sub-section 7.1). The use of the median and data by region and gender in respect of the highest and lowest decile required secondary analysis. As to educational qualifications, although Regional Trends (2004) included a chapter on education which provided information on the population of working age by highest qualification (eg degree, A-level etc), there was no gender breakdown by region. Accordingly secondary analysis of the Labour Force Survey data for spring 2004 had to be conducted to provide data on level of education by region and gender. When looking for evidence on skills and skills shortages across the UK a very comprehensive survey was found: National Employers Skills Survey, vol 2, 2003. The report from this survey, however, did not include any analysis by gender. To try to overcome this, access was gained to a site which allows users to interrogate the data interactively. This would have allowed the specification of variables that we
13

Gender & the Labour Market in SE England: Volume 1 - The Context
wanted to include in a Table. Unfortunately, however, this still did not provide for a breakdown of the statistics by gender. We also looked at a study by the Department of Work and Pensions (2002) in respect of pregnant women in the workplace but the cells were too small to analyse by region. Similarly we were unable to obtain regional data from the work of James (2004) on pregnancy related dismissal cases which went to a full employment tribunal hearing.
5.3 The economy of the South East region The South East of England stretches from Thanet in the east to Aylesbury Vale and Milton Keynes in the north, covering eight mainland counties and the Isle of Wight and roughly forming an ‘L’ shape round London.
The South Eastern Region
Although the South East region is the main focus of this report, it is noted that in many respects this region is intertwined with London, particularly because of commuting patterns and business and sectoral links. In addition there are shared interests with London and other regions/locations, for example the Thames Gateway, while through its airports and major ports the South East is a natural access point for many regions in Britain for continental Europe and the rest of the world (SEEDA, 2004a). With an estimated Gross Domestic Product (GDP) of £140 billion in 2002, the South East is the second largest regional economy in the UK, only marginally behind London. Moreover, between 1990 and 2000, the economic growth for this region exceeded other regions in the UK. In 2001 the largest industrial sector in the South East was financial and business services accounting for over a quarter of GDP (SEEDA, 2004a). Table 5.1 provides an overview of the industrial composition of the region. The highest share of employee jobs in the South East, in December 2001, were in ‘Distribution, hotels and catering, repairs’ (26 per cent), ‘Financial and business
14

Gender & the Labour Market in SE England: Volume 1 - The Context
services’ (23 per cent) and ‘Education, social work and health services’ (18 per cent). Although, the manufacturing industry was still important to the region (11 per cent of employee jobs were in this sector) it is clear from Table 5.1 that the majority of employee jobs were in the service sector.
The South East also attracts pharma/bio industries and currently employs almost one third of the UK’s natural science research and development workers. Furthermore, nine of the world’s top ten pharmaceutical companies are based in this region (SEEDA, 2004b). Table 5.1: South East Region: Employee Jobs by Industry, December 2001 Industry (Based on Standard Industrial Classification 1992) Employee Jobs
(%)
Agriculture, hunting, forestry and fishing 1.1
Mining, quarrying (inc oil and gas extraction) 0.1
Manufacturing 11.1
Electricity, Gas and Water 0.5
Construction 4.2
Distribution, hotels and catering, repairs 25.9
Transport, storage and communication 6.1
Financial and business services 23.2
Public administration and defence 4.4
Education, social work and health services 18.1
Other 5.3
100.00
Source: Regional Trends (38: 2004 edition) Table 5.4 p.74
The South East is the UK’s largest region in terms of population with over 8 million residents and, in 2002, the second largest region in terms of the number of individuals aged 16 and over (4.3 million) who were economically active. As shown in section 6 of this report, this region exhibits high economic activity and employment rates and there are more self-employed people in the South East than any other region. Levels of car ownership in the South East are the highest in the country with close to 74 per cent of the region’s workforce travelling to work by car (SEEDA 2004a). The International Labour Organisation (ILO) unemployment rate stood at 4 per cent in the South East compared to the UK average of 5 per cent. In absolute numbers, however, the region also has the third highest number (150,000) of unemployed people in England and significant levels of deprivation persist alongside substantial economic success. Districts with high levels of deprivation are found in Kent, East
15

Gender & the Labour Market in SE England: Volume 1 - The Context
Sussex, the Isle of Wight and Hampshire but, due to the size of the region, levels of deprivation are often disguised when quoted as percentages and proportions (SEEDA, 2004a).
6. Participation in the labour market
6.1 Economic activity Having briefly described the South East region of England, we now look at economic activity. In so doing we adopt the definition of the International Labour Organisation (ILO): individuals are defined as economically active if they working or are unemployed and actively seeking work in a certain period (this is usually the survey reference week). Women’s economic activity rates in the UK labour market have risen dramatically in the last quarter of the 20th century from 57 per cent in 1973 to 68 per cent in 1993 (Harkness, 1996) and to 73 per cent in 2000 (Regional Trends, 2004:76). From 2000 to 2003, this rate has remained stable while the male economic activity rate in the UK has fallen slightly (Regional Trends, 2004). Figure 6.1: Economic Activity by Region & Gender
Economic Activity Rates in spring 2003 by Region & Gender
0 20 40 60 80 100
UK
North EastNorth West
Yorkshire & the HumberEast MidlandsWest Midlands
EastLondon
South EastSouth West
EnglandWales
ScotlandNorthern Ireland
Reg
ion
Percentage
Female
Male
Source: Regional Trends 38: 2004 edition. Table 5.7 p76
Figure 6.1 shows that 77 per cent of women in the South East were working or actively seeking work in spring 2003, compared to over 85 per cent of men and that women’s economic activity rate in the South East was amongst the highest in the UK. Nevertheless across the UK as a whole and across all regions in England, women’s economic activity rates were below the comparable figures for men.
16

Gender & the Labour Market in SE England: Volume 1 - The Context
Looking at regional variations, women’s activity rate in the South East was similar to that of women in the South West and significantly higher (by nine percentage points) than the rate for London. A possible explanation for London’s relatively low female activity rate is that it has large concentrations of ethnic minorities, e.g. Bangladeshis, where traditionally women do not work outside the home. Interestingly, the London rate is similar to more depressed regions of the UK where there are small ethnic minority populations: women in Northern Ireland and the North East exhibited relatively low economic activity rates, 65 per cent and 67 per cent respectively. Among male workers, activity rates were lowest in North East (78 per cent), Wales (80 per cent) and Northern Ireland (82 per cent) and highest in the South East, the East and the South West (around 87 per cent).
In short, these findings show that economic activity among all workers, irrespective of gender, is high in the South East, the South West and the East. This suggests that there are good employment opportunities in these regions. In areas where there are poor prospects, individuals who invest in long periods of job-search may become discouraged and leave the labour market. This results in higher levels of economic inactivity in some regions of the UK.
6.2 Employment rates The ILO employment rate is used; it is defined as the percentage of all individuals of working age (16-59/64 years) who are in employment in the survey reference week expressed as a percentage of the relevant population. ‘In employment’ covers not only employees and workers, but also the self-employed and government supported trainees. Our analysis presented in Figure 6.2 shows that employment rates for women in the South East were relatively high at 75 per cent (only marginally below those for the South West). They were, however, 10 percentage points below that of men’s, a position similar to the percentage point difference in employment rates by gender in the UK. On a regional basis the most noticeable differences by gender occurred in Northern Ireland (15 percentage points) and London (13 percentage points). Regional Trends (2004: 72) reports that ILO employment rates in the UK as a whole remained relatively stable in 1999-2003, rising only slightly from 74 per cent in spring 1999 to 75 per cent in spring 2003. Nevertheless, there was some change in employment rates by gender in the five years from 1999 and Figure 6.3 gives a clear picture of these changes. It shows that among women in the South East there was a rise of 1 percentage point, whereas among men in the South East there was a fall of 2 percentage points. Looking at the UK as a whole in the period 1999-2003 female employment rates rose by 1 percentage point, compared to 0.7 for men.
17

Gender & the Labour Market in SE England: Volume 1 - The Context
Figure 6.2: Employment Rates by Region and Gender
Employment Rates in spring 2003 by Region and Gender
0 20 40 60 80 100
UK
North East
North West
Yorkshire & the Humber
East Midlands
West Midlands
East
London
South East
South West
England
Wales
Scotland
Northern Ireland
Regi
on
Percentage
Females
Males
Source: Regional Trends 38: 2004 edition. Table 5.1 p72
6.3 Self employment In 2004 there were 3.8 million self-employed people in the UK (Labour Market Trends, 2004). In the South East the proportion of self-employment jobs (14 per cent) was higher than for the UK as a whole (12 per cent) Furthermore, in the South East men were more likely to be self-employed than women; for example in spring 2002 approximately 18 per cent of working men were self-employed workers, compared to 9 per cent of working women (Regional Trends, 2004). This gender breakdown mirrors the UK position: for example in spring 2002 almost 16 per cent of working men were self-employed while for working women the proportion was much lower at 7 per cent. The proportion of women engaged in enterprise in the UK is similar to that of most European countries, but lower than that of the U.SA. (DTI Small Business Service, 2004).
18

Gender & the Labour Market in SE England: Volume 1 - The Context
Figure 6.3: Percentage Point Changes in Employment Rates 1999-2003, by Region and Gender
Percentage Point Changes in Employment Rates 1999-2003 by Region and Gender
-4 -2 0 2 4 6 8
UK
North EastNorth West
Yorkshire & HumberEast Midlands
West MidlandsEast
LondonSouth East
South West
EnglandWales
ScotlandNorthern Ireland
Regi
on
Percentage points
MalesFemales
Source: Regional Trends 38: 2004 edition. Table 5.1 p72
Regional Trends (2004) also reports self-employment by broad industry group and, in spring 2003, 62 per cent of self-employed workers were in the service sector, including ‘financial and business services’. The South East has a large share of small firms in the service sector and, according to Stanworth and Purdy (2003) the relatively high level of self-employed jobs in the South East compared to the UK may be explained by four main factors. Firstly there may be relative ease of obtaining venture capital; secondly there is a high level of market demand; thirdly there are better opportunities to provide products and services to governmental laboratories and research organisations that tend to be based in the region; and lastly a higher stock of people with managerial experience in the region – successful small firms tend to be run by those with managerial experience.
6.4 Part-time work Historically there has been a predominance of part-time work amongst women and changes in industrial composition, especially the growth in the service sector, has led to an increase in the demand for part-time jobs over the last three decades and may partially explain the rise in female labour market participation (Adnett, 1996; Pollert, 1991). Working part-time enables women to combine their responsibilities within the household with a degree of participation in the labour market.
19

Gender & the Labour Market in SE England: Volume 1 - The Context
Regional Trends uses Labour Force Survey data where respondents self classify as to whether they are part-time or full-time. Evidence from Regional Trends (2004) compiled for this report shows that approximately 47 per cent of women (both employed and self-employed) in the South East worked part-time, compared to just over 10 per cent of men. The figure for the proportion of women working part-time in the South East was just over two percentage points higher than in the UK as a whole, as it was for England, Scotland and Wales. The equivalent figure for Northern Ireland was significantly lower at 40 per cent. Figure 6.4: The Percentage of Women and Men Working Part-Time by Region (spring 2003)
The Percentage of Men and Women Working Part-Time in spring 2003, by region
0 10 20 30 40 50 60
North East
North West
Yorkshire & the Humber
East Midlands
West Midlands
East
London
South East
South West
Regi
on
Percentage
FemalesMales
Source: Regional Trends 38: 2004 edition. Figure 5.8 .1 p76
On a regional basis, the incidence of part-time working among women in the South East was noticeably higher than in London where it was just under 33 per cent, the lowest proportion of all regions. In other words the difference was 14 percentage points. The highest proportion of part-time working among women was in the South West where just over 50 per cent supplied labour on this basis. This was significantly higher than the proportion of part-time male workers in that region (approximately 13 per cent). The distribution of women working part-time by regions in England is shown in Figure 6.4. Working part-time is an important determinant of occupational choice and may limit opportunities for career progression. Part-time working is concentrated in low wage, low skill occupations, in health, education, hotels and catering and retail (Stanworth, 2000).
20

Gender & the Labour Market in SE England: Volume 1 - The Context
6.5 Occupational distribution Gender is important in explaining the type of work performed by individuals, as we noted in sub-section 2.2 above, where we also canvassed explanations for occupational segregation. Figure 6.5: Employed Men and Women in the South East by Occupational Group (spring 2004)
Employed Men and Women in the South East by Occupational Group (spring 2004)
0 5 10 15 20 25
Managers and senior officials
Professional occupations
Associate professional and technical
Administrative and secretarial
Skilled trades occupations
Personal service occupations
Sales and customer service occupations
Process, plant and machine operatives
Elementary occupations
Stan
dard
Occ
upat
iona
l C
lass
ifica
tion
Percentage
WomenMen
Source: Labour Force Survey Data Sample – March to May 2004. To gain an insight into the distribution of men and women in employment by standard occupational classification, Labour Force Survey data (March - May 2004) was used and secondary analysis was performed for this report. Figure 6.5 focuses on occupational distribution by gender in the South East. It shows that there was a rough gender equivalence in only three out of nine broad occupational categories. In the two occupational categories of personal services and administrative and secretarial occupations, South East women were found in significantly greater proportions than South East men. The personal service category includes care assistants and hairdressers. The two occupational categories in the South East where men were found in significantly higher proportions than women were the two occupational categories of skilled trades and process, plant and machine operatives. The skilled trades category includes construction trades and motor mechanics. A recent report shows that, between 1992 and 2002, the South East (and London) have exhibited significant growth in employment in the ‘managerial and professional’ and ‘associate professional and technical’ occupational groups and a decline in employment in ‘administrative and secretarial’, ‘skilled trades’ and ‘elementary’ occupations (Institute for Employment Research, 2003). In spite of this evidence that the South East has exhibited a fall in employment in the number of men and women employed as administrators or secretaries, Figure 6.5 shows that these jobs still attract high numbers of women. We then compiled Figure 6.6, which plots the distribution of men and women in employment in the UK (Spring 2004) by Standard Occupational Classification and compared Figures 6.5 and 6.6. We found that the gender breakdown by occupational
21

Gender & the Labour Market in SE England: Volume 1 - The Context
category in the South East and the gender breakdown by occupational category in the UK were broadly similar. For instance only a small proportion of women (less than 3 per cent) were employed in skilled trades or process, plant and machine operatives in the South East of England and in the UK. Furthermore, less than 5 per cent of men in the South East and the UK were employed in administrative and secretarial occupations and less than 3 per cent in personal service occupations. Women in the UK were also under-represented in managerial work: 19 per cent of men were employed as managers and senior officials, compared to less than 11 per cent of women. The proportion of female managers and senior officials in the South East (12 per cent), however, was slightly higher than for the UK. Figure 6.6: The Occupations of Male and Female Employees (LFS data, spring 2004)
Occupations by Gender (spring 2004)
0 5 10 15 20 25
Managers and senior officials
Professional occupations
Associate professional and technical
Administrative and secretarial
Skilled trades occupations
Personal service occupations
Sales and customer service occupations
Process, plant and machine operatives
Elementary occupations
Stan
dard
Occ
upat
iona
l Cla
ssifi
catio
n
Percentage
WomenMen
Source: Labour Force Survey Data Sample – March to May 2004 The Pearson Chi-Square test (p<0.001) provides strong evidence of a relationship between gender and occupational group. Figure 6.7: Employed Men and Women in the London region by Occupational Group
Employed Men and Women in the London by Occupational Group (spring 2004)
0 5 10 15 20 25
Managers and senior officials
Professional occupations
Associate professional and technical
Administrative and secretarial
Skilled trades occupations
Personal service occupations
Sales and customer service occupations
Process, plant and machine operatives
Elementary occupations
Stan
dard
Occ
upat
iona
l Cla
ssifi
catio
n
Percentage
WomenMen
Source: Labour Force Survey Data Sample – March to May 2004 The Pearson Chi-Square test (p<0.001) provides strong evidence of a relationship between gender and occupational group.
22

Gender & the Labour Market in SE England: Volume 1 - The Context
We also compared Figure 6.5 with Figure 6.7. Figure 6.7 shows the occupational distribution by gender in London. It can be seen that the proportions of women in ‘associate professional and technical’ and ‘professional occupations’ are slightly higher in London than the South East and also that there is a more even proportion of men to women in these occupations in London than the South East. We will return to these findings in Section 7. These national figures reflect findings from an analysis of European Union labour market statistics in the six year period to 2001 which found strong gender segregation in both sector and occupation (Thewlis et al, 2004). In addition, they reflect findings from the Organisation of Economic Co-operation and Development (OECD) (OECD, 2002) which show that, across the OECD, at least 75 per cent of the female workforce was concentrated in 19 out of 114 occupations; these included secretarial, domestic and sales occupations. When focusing on men, however, OECD statistics show that 75 per cent of the male workforce was concentrated in 30 occupations which included architects, construction workers and physical and engineering science technicians. These figures suggest that men are found in a much wider range of occupational groupings than women and that women tend to crowd into a limited range of occupations. They also suggest that men are located in predominantly higher paid work and women are located in predominantly lower paid work.
6.6 Career progression Career progression may be realised through internal career ladders or by changing employers. An investigation into whether promotion opportunities differ by gender was conducted by Booth et al (1999). Using data from the British Household Panel Survey (BHPS) for the period 1991-1995, they tested the hypothesis that women face a glass ceiling (a transparent barrier) when seeking promotion. As Booth et al (1999) point out, this survey is useful because it asks respondents why they stopped their previous job, thus including reasons such as redundancy, dismissal, retirement and promotion. The results provided evidence that women were more likely to be promoted than men with 12 per cent of full-time female workers being promoted for the period, 1991 to 1995. The probability of promotion for men was lower at 9 per cent. Adopting the methodology of Booth et al (1999) secondary analysis of the BHPS was carried out for the purpose of this study. This enables us to estimate promotion rates for 1999 and 2000. The data sample for this study was taken from the latest wave (2002) and was restricted to full-time workers aged 21 years and over (setting this age limit meant that all were old enough to be working in 1999). The sample comprised 4182 workers, of which 42 per cent were women. The proportion of women who commenced their current job during or prior to September 1999 was 72 per cent, while the corresponding proportion of men was 69 per cent. Job history files for 1999 and 2000 were then used to analyse reasons for stopping a previous job.
23

Gender & the Labour Market in SE England: Volume 1 - The Context
Figure 6.8 shows that proportion of employees reporting promotion9 as a reason for stopping their previous job in each year was higher among women than men. These findings suggest that the likelihood of promotion (1999-2000) is one in 11 for men compared to one in 10 for women. The difference is not statistically significant, suggesting that, at least, the promotion rates are equal. Unfortunately, the numbers involved are not high enough to break down promotion rates by gender and region and produce reliable statistics. Figure 6.8: Promotion Rates for Men and Women (BHPS 1999-2000)
Promotion Rates (BHPS 1998-2000) by Gender
0 2 4 6 8 10 12
1999
2000
Year
Promotion Rate %
WomenMen
Source: BHPS 1998-2000
The evidence from the analysis for this report, and the previous analysis by Booth et al (1999) goes against the conventional wisdom that promotional opportunities favour men. One explanation might be that these promotion rates estimated for the purpose of this study do not take account of levels of origins (grades before promotion) and destinations (grades after promotion). This is an area which needs further research.
7. Pay Issues
7.1 The median gender pay gap This section compares the median gross hourly earnings of men and women in the South East and across Great Britain and investigates the extent of the gross gender pay gap. The mean yields a larger gender pay gap than the median and for more than 30 years the standard measure of the gender pay gap has been the mean (IDS, 2004). We have used the median, not the mean however, as the median ignores the fact that very high earners tend to be men and therefore better captures the pay gap confronting the average person. Accordingly, we conducted secondary analysis on the New Earnings Survey (NES) 2003, the largest dataset on pay and earnings, to ascertain the median as most of the tables the NES produces are in respect of means, not medians. As we were finalising this report the Annual Survey of Hours and Earnings (ASHE), which supersedes the NES, was published. This carries out most of its gender analysis
9 Promotion rates are calculated as the number of full-time workers reporting promotion as a proportion of workers stopping their previous job.
24

Gender & the Labour Market in SE England: Volume 1 - The Context
in terms of medians, not means. We realise, however, that although, like the Office of National Statistics, we have used the median to measure the gender pay gap, whether one uses the median or mean is still subject to debate. We have used hourly (not weekly or annual) earnings to remove the influence of a differential in hours worked. We have also used full-time earnings only. This is because a comparison that includes both full-time and part-time jobs together will be affected by women’s greater propensity to work part-time and the lower hourly wages generally offered for part-time work (see sub-section 6.4). Of course pay medians do not necessarily indicate differences in rates of pay for comparable jobs, essentially because men and women have different work patterns such as the proportions in different occupations (see Figure 6.6.) and their seniority in occupational hierarchies. Nor do pay medians explain the differences in pay by gender. Some of the gender pay gap can be explained by differences in characteristics such as human capital investment, tenure in the job, occupational type, industry and size of workplace and the possibility that women with dependent children will have fewer years of experience in the labour market (Anderson et al, 2001; Gough, 2001; Harkness, 1996; Olsen and Walby, 2004). In this section, however, we do not look at the extent to which various factors contribute to the gender pay gap, just the overall position. Before focusing on the gender pay gap, it is useful to gain an insight into the extent of regional differences in median pay. Statistics provided by the New Earnings Survey (2003) show that there are regional disparities in earnings, irrespective of gender. Median gross hourly earnings by region for full time workers on adult rates (2003) are depicted in Figure 7.1. Figure 7.1: The Median Gross Hourly Earnings of Full-Time Workers on Adult Rates, by Region
Median Gross Hourly Earnings of Full-Time Workers on Adult Rates in April 2003
0 200 400 600 800 1000 1200 1400
ScotlandWales
England
North EastNorth West
Yorkshire & the HumberEast MidlandsWest Midlands
EastLondon
South EastSouth West
GB
Regi
on
Median Gross Hourly Earnings (pence)
Source: New Earnings Survey (2003) vol 2. Data from Table E7.
25

Gender & the Labour Market in SE England: Volume 1 - The Context
Figure 7.1 shows that the median gross hourly pay is highest in London (£12.46), followed by the South East (£10.76). These figures provide clear evidence that, although London and the South East are neighbouring regions, median pay in the South East is 14 per cent lower than in London. Earnings are relatively low in Wales and the North East of England where 50 per cent of full-time workers earned less than £8.76 and £8.58 respectively; this is lower than the median for Great Britain which was £9.68 in April 2003. Although the median gross hourly earnings in the South East are higher than the median for Great Britain and second only to London; when the gross gender pay gap is calculated there is evidence that women working in this region are poorly paid relative to men. This can be seen in Figure 7.2. Figure 7.2 shows that, in the South East, the gender pay gap of 19 per cent is the largest in the country. Accordingly, it is higher than for Great Britain as a whole, as well as being the highest across all regions in England. In London, however, the gender pay gap is significantly lower at 8 per cent. The difference in female pay relative to male pay in London and the South East is striking and these findings suggest that this is an area for further research. A possible explanation for the lower gender pay gap in London, compared to the South East is that the proportions of women in ‘associate professional and technical’ and ‘professional occupations’ are slightly higher in London than the South East, as we noted in sub-section 6.5, and also that there is a more even proportion of men to women in these occupations in London than the South East. The decline in the manufacturing and mining industries in the North of England and Wales, which have led to a fall in opportunities for male job-seekers, may explain the relatively low gender pay gaps of around 13 per cent in these areas. Men have had to take on lower paid work and, therefore, their pay is closer to that of their female counterparts. Figure 7.2: Gender Pay Gap: Median Gross Hourly Earnings for Full-Time Workers by Region.
Gross Gender Pay Gap based on Median Gross Hourly Earnings of Full-Time Male and Female Workers on Adult Rates in April 2003
0 5 10 15 20
ScotlandWales
England
North EastNorth West
Yorkshire & the HumberEast MidlandsWest Midlands
EastLondon
South EastSouth West
GB
Reg
ion
Gross Gender Pay Gap %
Source: New Earnings Survey (2003) vol 2. Using data from Table E7
26

Gender & the Labour Market in SE England: Volume 1 - The Context
The analysis conducted for this report is consistent with that carried out by Anderson et al (2001). Looking at full-time women’s mean hourly earnings as a percentage of those of men working full-time in 2000, they also found that the gender pay gap was larger in the South East than any other region/country in Great Britain: women working full-time women in the South East earned 77 per cent of their male equivalents. This was not the case, however, according to Anderson et al (2001) when the gender pay gap was measured by comparing the mean hourly earnings of part-time women with part-time men in 2000, when the South East came seventh out of 11 regions/countries in Great Britain. Also looking at average earnings ASHE 2004 found the largest gender pay gap in London with the South East coming second (24 per cent and 21 per cent respectively). As Gough (2001) points out, gender pay inequalities in the workplace are projected into old age as occupational pensions schemes are essentially based on earnings. To discover whether the gender pay gap varies across different industrial sectors, the pay gap by Standard Industrial Classification (SIC) 1992 is illustrated in Figure 7.3. For the purpose of this research the chart was compiled from New Earnings Survey data (April, 2003). As the survey did not analyse median gross pay figures by SIC, average gross hourly earnings were used instead; also it was not possible to show a detailed regional breakdown due to missing information in the NES statistics. The gender pay gap is not calculated for ‘other community, social and personal service activities’ and ‘mining and quarrying’ due to missing information. Figure 7.3: The Gender Pay Gap in Great Britain by Industrial Sector, April 2003
Gender Pay Gap by Industrial Sector, April 2003
0 5 10 15 20 25 30 35 40 45
Agriculture, hunting and forestry A
Mining and Quarrying C
Manufacturing D
Electricity, Gas and Water Supply E
Construction F
Wholesale and Retail Trade G
Hotels and Restaurants H
Transport, Storage and Communication I
Financial Intermediation J
Real Estate, Renting and Business Activities K
Public Administration and Defence L
Education M
Health and Social Work N
Other Community, Social and Personal Service Activities O
SIC
(199
2)
Gender Pay Gap %
Source: New Earnings Survey (2003) vol.2. Using data from Table E9
The results in Figure 7.3 suggest that there are significant differences in male and female pay across different industrial sectors. The most striking gender pay gap is in the finance sector where women’s average hourly pay is only 58 per cent of the
27

Gender & the Labour Market in SE England: Volume 1 - The Context
average hourly pay for men; a gender pay gap of 42 per cent. As one of the largest industrial sectors in the South East is financial and business services, these findings provide a partial explanation for the significant gender pay gap in the South East region. Figure 7.3 also provides evidence that the average hourly pay for men is higher than for women in all industrial sectors and that the gender pay gap is less than 10 per cent in three sectors: ‘education’, ‘agriculture, hunting and forestry’ and ‘transport, storage and communication’.
7.2 The lowest and highest deciles Having looked at pay in terms of the median, we then looked at pay in terms of the lowest and highest deciles. In the South East the male/female pay differential for the lowest decile in the earnings distribution was 66 pence per hour, compared to 62 pence for Great Britain as a whole and no region exhibited a pay differential of more than 90 pence per hour. Table 7.1: The Gender Pay Gap by Region for Lowest and Highest Paid Full-time Workers The Gender Pay Gap for Low and High
Paid Workers (gross hourly earnings of full-time workers by Region (April 2003)
Country/Region Lowest decile % Highest decile %
England 10.2 20.5
Wales 8.4 5.2
Scotland 9.4 20.7
North East 10.5 5.6
North West 9.8 14.6
Yorkshire & the Humber 14.2 12.8
East Midlands 12.7 15.8
West Midlands 14.7 13.3
South West 10.9 22.0
East 11.6 25.8
London 2.3 27.0
South East 10.3 30.3
Great Britain 10.4 19.9 Source: New Earnings Survey 2003, vol 2 We then looked at relative, rather than absolute, figures, see Table 7.1. The gross hourly earnings of full-time women working in the South East in the lowest decile were 90 per cent of those of full-time men in the lowest decile, ie a gender pay gap of
28

Gender & the Labour Market in SE England: Volume 1 - The Context
10 per cent. In Great Britain, the gender pay gap was larger: the hourly earnings of full-time women in the lowest decile were 83 per cent of those of men and in six regions in England the gender pay gap in the lowest decile was larger than it was in the South East. The picture, though, was very different when we looked at the highest decile. Looking at those working in the South East the absolute difference between women and men was £8.32, compared to £4.46 for Great Britain as a whole. Thus in absolute terms the gender pay gap in the highest decile in the South East was larger than for the highest decile across Great Britain. In percentage terms too the gender pay gap was larger in the South East in respect of full-time workers in the highest decile than the equivalent figure for Great Britain as a whole: 30 per cent compared to 20 per cent. Moreover the gender pay gap in the South East, focusing on the highest decile, was greater than for any other region. London, with a gender pay gap of 27 per cent, was close behind the South East. In contrast when we looked at Wales (5 per cent) and the North East (6 per cent), the gender pay gap was much narrower. One explanation for the pay gaps among the top earners is that of tenure. For example, Joshi et al (1999) discovered that women in full-time employment, who had taken a career break to have children, were paid less than women in full-time employment whose career was not interrupted, in spite of there being no difference in qualifications. On the other hand women whose careers were not interrupted were paid less than men whose careers were not interrupted; see sub-section 2.1 above. Further evidence of the pay differential between men and women in the upper earnings decile can be clearly seen in Figure 7.4.
Figure 7.4: The Male/Female Earnings Differential for the Upper Earnings Decile, by Region.
Male/Female Earnings Differentials across Great Britain for the Upper Earnings Decile (April 2003)
0 200 400 600 800 1000
GB
North EastNorth West
Yorkshire & the HumberEast MidlandsWest Midlands
EastLondon
South EastSouth West
EnglandWales
Scotland
Reg
ion
pence per hour
Upper earnings decile
Source: New Earnings Survey 2003
29

Gender & the Labour Market in SE England: Volume 1 - The Context
In short, the findings in this section indicate that women in the South East are among the better paid in Great Britain with 50 per cent earning more than £9.63 per hour. Affluence, however, exacerbates the gender pay gap. Focusing on the median, men earn considerably more than women in relative terms in regions where wage rates are higher, as they are in the South East. They also earn relatively more than women at the top end, as opposed to the bottom end, both in the South East and Great Britain as a whole.
8. Education and Training
8.1 Qualification levels Human capital theory proposes that investment in education and training increase potential opportunities and earnings within the labour market. (As already discussed in section 2.1, in the supply and demand framework it is argued that an employer will pay an employee a wage commensurate with the value of the contribution he/she makes to the output of the firm). There is a well established positive relationship between human capital investment and productivity, and the skills and abilities acquired are important in the development and efficient use of new technology. Figure 8.1: Highest Qualification of Economically Active Population, England 1993/1998/2003
Highest Qualification Held by Economically Active Population, England 1993, 1998 and 2003
29.6
20.9 22
.9
16.5
20.6
2.7
15.5
23.3
23.8
18.6 21
.5
4.2
11.7
19.6
19.3 22
.1
5.6
21.6
0
5
10
15
20
25
30
35
No Qua
lifica
tions
NVQ1NVQ2
NVQ3NVQ4
NVQ5
NVQ level
Perc
enta
ge 199319982003
Source: National Employers Skills Survey 2003 Volume 2 p.78
There is evidence that qualifications are becoming increasingly prevalent in today’s labour market; for example, Labour Force Survey data for 1993, 1998 and 2003 show that the proportion of the economically active population with no qualifications has fallen from 30 per cent in 1993 to 12 per cent in 2003. In contrast, there has been a
30

Gender & the Labour Market in SE England: Volume 1 - The Context
rise in the proportion of economically active individuals who have achieved NVQ levels 3, 4, and 5. The changes over the last decade are shown in Figure 8.1. The National Employers Skills Survey (Institute for Employment Research, 2003) suggests that some of the increase in the proportion of the economically active population achieving higher qualifications may be explained by older, less qualified workers retiring from the labour market. To gain further insight into the level of human capital investment in the UK, Labour Force Survey data for the spring quarter 2004 were analysed for this report. Education and training are often important factors in career progression, as are hours of work. To limit this effect the data sample, therefore, was restricted to those in employment who work at least 30 hours per week. The results of this secondary analysis throw further light on the levels of human capital investment. They indicate that the UK has a well educated workforce with 68 per cent of employees achieving qualifications of at least NVQ level 2, while approximately 30 per cent of those in employment were educated to NVQ level 4 (degree and equivalent) and above. The proportion with no qualifications was relatively low at 11 per cent. The highest level of qualification achieved by male and female employees is shown in Table 8.1. Table 8.1: Highest Qualification Level by Gender Highest Qualification Level Men
(%)
Women
(%)
Missing information 0.4 0.5
NVQ level 4 (degree or equivalent) and above 28.9 30.8
NVQ level 3 (A levels and equivalent) 16.6 13.1
Trade apprenticeships 11.8 2.6
NVQ level 2 (GCSE grades A-C and equivalent) 12.1 18.4
Below NVQ level 2 12.1 16.9
Other qualifications 8.3 6.7
No qualifications 9.9 11.2
100.0 100.0
Source: Labour Force Survey Data Sample – March to May 2004 The Pearson Chi-Square test (p<0.001) provides strong evidence of a relationship between gender and qualification level. The table shows that a higher proportion of women (31 per cent) than men (29 per cent), investing in human capital, have attained a qualification of at least NVQ level 4; but the percentage of women without any qualifications is 1 percentage point higher than for men. Also, the proportion of women with relatively low level qualifications (below NVQ level 2) is noticeably higher than for men (5 percentage
31

Gender & the Labour Market in SE England: Volume 1 - The Context
points). In other words women predominate at both the top and the bottom of the qualifications ‘ladder’. Male dominated trades offer apprenticeships but the results show that a small proportion of female employees (3 per cent) have gained this type of qualification. The level of qualifications may reflect the type of industries (SIC 92 classifications) in which men and women are employed. For example, analysis of the LFS data (Spring 2004) indicates that the highest proportions of women who have achieved at least NVQ level 4 qualifications are working in education (26 per cent) and health and social work (28 per cent). Men qualified to the same level are most likely to be employed in ‘other business activities’ (12 per cent) while 12 per cent are in education. To assess whether there were any regional disparities in the distribution of employees with this level of qualification, Figure 8.2 was compiled from Labour Force Survey data for the purposes of this report. Figure 8.2: Proportion of Employees Qualified to NVQ level 4 and above, by Region and Gender
Percentage in employment qualified to at least NVQ level 4, by region and gender (spring 2004)
0 10 20 30 40
North EastNorth West
Yorkshire & the HumberEast MidlandsWest Midlands
EastLondon
South EastSouth West
WalesScotlandN Ireland
UK
Reg
ion
Percentage
WomenMen
Source: Labour Force Survey Data Sample – March to May 2004
The Pearson Chi-Square test (p<0.01) provides strong evidence of a relationship between gender and region among employees with a qualification of NVQ level 4. The results of this secondary analysis by region and gender illustrated in Figure 8.2 indicates that 32 per cent of workers living in the South East were qualified to NVQ level 4 and that women were slightly more highly qualified than men. This finding undermines the explanation for the gender pay gap as a failure of women to invest in their human capital. (See section 7.) The South East had a greater proportion of men and women qualified to NVQ level 4 or equivalent than the UK as a whole and among regions in England came second only to London (38 per cent).
32

Gender & the Labour Market in SE England: Volume 1 - The Context
These findings may in part reflect industrial composition. In the South East region (see sub-section 5.3) in December 2001, 23 per cent of employee jobs were in financial and business services. Employment in this sector often requires a significant level of human capital investment in the form of qualifications. In 2001, the distribution of jobs in the financial and business sector showed only a slight propensity towards a male workforce with 25 per cent of male jobs and 22 per cent of female jobs being in this sector (Regional Trends, 2004:74). In the South East the most common occupations among women were in ‘education, social work and health services’ (28 per cent) where skills and qualifications are also important (Regional Trends: 2004: 74). When focusing on the employees with no qualifications, analysis by region and gender (Figure 8.3) indicates that the proportion of women without educational qualifications is higher than that of men in almost all regions in England. London is the only exception. It is also very noticeable that the country with the highest share of unqualified employees is Northern Ireland where around 18 per cent of men and 16 percent of women in this sample have no qualifications. Figure 8.3: Proportion of Employees with No Qualifications, by Region and Gender
Percentage in employment with no qualifications, by region and gender (spring 2004)
0 2 4 6 8 10 12 14 16 18 20
North East
North West
Yorkshire & the Humber
East Midlands
West Midlands
East
London
South East
South West
Wales
Scotland
N Ireland
UK
Reg
ion
Percentage
Women
Men
Source: Labour Force Survey Data Sample – March to May 2004
The Pearson Chi-Square test (p<0.01) provides strong evidence of a relationship between gender and region among employees with no qualifications. The LFS (spring 2004) data shows that men with no qualifications tend to work in the ‘construction’ and ‘retail trade repair’ industries, while their female counterparts tend to be employed in ‘hotels and restaurants’, ‘health and social work’, ‘education’ and ‘retail trade repairs’. We have already noted that highly qualified women also work in ‘health and social work’ and ‘education’, so it appears that these industries employ female workers whose skill levels vary considerably.
33

Gender & the Labour Market in SE England: Volume 1 - The Context
8.2 Job-related training In addition to educational qualifications, job related training is important in enhancing workers’ productivity. To enable women to fulfil their potential within the workplace they should be presented with opportunities to undertake training. Statistics provided by Regional Trends (2004) showing the regional distribution of working age10 men and women receiving job-related training11 are shown in Figure 8.4. Figure 8.4: Employees of Working Age Receiving Job-Related Training, by Region and Gender
Employees of Working Age Receiving Job-Related Training by Region and Gender (spring 2003)
0 5 10 15 20 25
North EastNorth West
Yorkshire & the HumberEast MidlandsWest Midlands
EastLondon
South EastSouth West
EnglandWales
ScotlandN Ireland
UK
Regi
on
Percentage of all employees of working age
WomenMen
Source: Regional Trends 38 (2004 edition) Table 4.16 p.66.
The analysis in Figure 8.4 shows that higher proportions of women than men received some form of job-related training not only in the South East but across all regions/countries across the UK and that job related training for women and men in the South East approximated to the UK average. The training required may differ depending on the type of work undertaken by the individual. For example, low skilled occupations such as those in the ‘elementary occupations’ group will not require the same level of training as occupations in the ‘professional’ group. For the purpose of this report Figure 8.5 was compiled using data from the National Employers’ Skills Survey (Institute for Employment Research, 2003) which unfortunately did not provide a gender breakdown. This was disappointing in such a comprehensive report. Figure 8.5 shows that the highest proportion of workers receiving training was in managerial occupations (47 per cent) while just over one third of employees in administrative and secretarial occupations had been trained in the last 12 months. As administrative and secretarial occupations are often carried out by women these findings may partially explain the propensity for women to receive job-related training (Figure 8.4).
10 Males aged 16 to 64 and females aged 16 to 59 years. 11 Job-related education or training received in the 4 weeks prior to interview
34

Gender & the Labour Market in SE England: Volume 1 - The Context
Figure 8.5: The Types of Staff Trained in the last 12 months in the South East Region
Types of Staff Trained in the last 12 months in the South East Region (2003)
46.8%
24.0%
17.7%
31.7%
16.6%
8.0%
23.0%
5.8%
12.7%
Managers
Professionals
Associate Professionals & TechnicalOccupations
Admin and Secretarial occupations
Skilled Trade Occupations
Personal Service Occupations
Sales and Customer Service Occupations
Process, Plant and Machine operatives
Elementary Occupations
Occ
upat
iona
l gro
up
Proportion trained in each occupational group
Source: National Employer Skills Survey 2003
8.2 Skills shortages
In spite of the increase in the number of economically active individuals who are educated to NVQ level 3 and above, there is evidence that employers experience recruitment problems. The National Employers Skills Survey (Institute for Employment Research, 2003) defines recruitment problems as vacancies that the employer describes as hard to fill (HtFVs). Skill shortage vacancies (SSVs) are hard to fill vacancies that occur because job-seekers lack the appropriate skills, experience or qualifications. Table 8.2 illustrates how these vacancies are distributed across regions in England. The highest share of vacancies as a percentage of total employment occur in the South East and the South West (both at 4 per cent). In the South East 19 per cent of these vacancies are classified as ‘skill shortage vacancies’ while 43 per cent are ‘hard to fill vacancies’. These findings indicate that, although the South East has a higher proportion of ‘hard to fill vacancies’ than the average for all regions in England, it has a lower proportion of ‘skill shortage vacancies’ than the English average, lower than in all except two other regions. For example, in the West Midlands 24 per cent of the vacancies are attributable to skill shortages. In London, the proportion of vacancies classed as ‘skill shortage vacancies’ (20 per cent) is slightly higher than in the South East, as well as being higher than for England as a whole (20 per cent).
The types of skills that employers in the survey found difficult to recruit are shown in Figure 8.6. It indicates that there are problems in recruiting workers with the appropriate technical and practical skills and a high proportion of vacancies classified as hard to fill and skill shortage vacancies occur in skilled trade occupations where
35

Gender & the Labour Market in SE England: Volume 1 - The Context
practical skills are important. Figure 8.6 shows, however, that employers also found it difficult to recruit workers with generic skills such as communication, problem solving, customer handling and team working. Table 8.2:Vacancies, Hard to Fill Vacancies & Skill Shortage Vacancies by region. Vacancies, HtFVs and SSVs as a proportion of employment, by region
Region Vacancies Vacancies
as % of
employment
HtFVs as %
of vacancies
SSVs as %
of vacancies
North East 25,845 2.7 41.3 21.3
North West 84,026 2.9 36.9 19.0
Yorkshire & the Humber 64,996 3.1 43.2 21.1
East Midlands 53,094 3.1 42.3 21.6
West Midlands 70,483 3.1 43.1 24.0
South West 73,913 3.6 46.8 17.3
East 75,835 3.4 40.4 18.2
London 105,018 2.6 28.6 20.5
South East 125,862 3.5 42.5 18.7
All Regions 679,072 3.1 40.0 19.9
Source: Skills in England (2003) Volume 2. p124 (using statistics from the National Employers Skills Survey, 2003. Base: Employee weighted) Evidence about the density of recruitment problems by occupation is shown in Table 8.3. Looking at skill shortage vacancies as a percentage of vacancies, perhaps unsurprisingly the highest percentage of vacancies (39 per cent) is in skilled trades. More surprisingly there are higher than average skill shortages (expressed as a percentage of vacancies) in the occupational groupings of personal services (24 per cent) and operatives (27 per cent). Although essentially these occupations do not require as high a level of skills as the skilled trades, managers, professionals or associate professionals, it is obvious that job-seekers lack the necessary skills and qualifications that employers require. In the female dominated ‘administrative and secretarial occupational group’, however, only 11 per cent of vacancies are attributable to skill shortages. A comparison of Table 8.3 with Figure 6.6 suggests that skill shortages are a problem in a variety of occupations, some of which may employ a higher proportion of men, others which tend to attract more women. The skills survey, however, did not provide data on skill shortages by gender, so we were unable to carry out such an analysis of skill shortages by gender.
36

Gender & the Labour Market in SE England: Volume 1 - The Context
Figure 8.6: Skills Employers found Difficult to Recruit
Skills found Difficult to Recruit
7
9
11
19
19
23
29
31
36
38
50
6
8
10
20
16
23
27
30
34
37
40
0 10 20 30 40 50 60
Foreign Language
IT Professional
General IT user
Numeracy
Management
Literacy
Problem Solving
Team Working
Customer Handling
Communication
Technical/Practical
Percentage of Htvs and SSVs arising from shortages of different types of skill
HtFVsSSVs
Source: Skills in England 2003 Volume 2. p115 (using statistics from the National Employers Skills Survey, 2003) Table 8.3: Density of Recruitment Problems by Occupation Occupation Vacancies Vacancies as
% of
employment
in occupation
Hard to Fill
Vacancies as
% of
vacancies
Skill Shortage
Vacancies as
% of
vacancies
Managers 35,237 1.3 34.5 18.2
Professionals 51,835 1.7 37.1 24.3
Associate Professionals 81,142 4.4 38.8 23.6
Administrative and Secretarial
84,010 2.9 23.2 11.1
Skilled Trades 63,391 3.3 62.5 39.0
Personal Services 74,169 6.1 51.4 23.7
Sales and Customer Service
116,662 3.4 32.0 12.4
Operatives 57,740 3.4 50.3 27.0
Elementary
Occupations
107,393 3.5 40.3 14.0
All Occupations 679,072 3.1 40.0 19.9
Source: National Employers Skills Survey, 2003 Volume 2. p118 (using statistics from the National Employers Skills Survey, 2003)
37

Gender & the Labour Market in SE England: Volume 1 - The Context
9. Summary and Conclusions
9.1 The context In part 1 of this volume, we observed that equality between men and women was a relatively modern construct which had yet to be realised in the world of work. We first looked at the various economic and sociological explanations for gender differences in the labour market, including human capital theory, choice and patriarchy, and considered that gender inequality is a complex phenomenon that cannot convincingly be explained mono-causally. We then turned to the legal framework in respect of gender. We found that the sex discrimination legislation focuses on formal equality between an individual woman and man (so-called direct discrimination) and at equality of opportunity (so-called indirect discrimination). Positive action to achieve equality of results is tightly constrained by law and only certain forms of positive action are permitted. Where claimants try to use the gender based law, especially the equal pay laws, they are confronted with complexity and there is no legal aid. Accordingly, it is unlikely that the law as it stands will lead to the eradication of gender disadvantage in the foreseeable future. We also looked at the strengths and weakness of the business case for gender equality and at studies of organisational policies and practices. Such studies suggest that various factors contribute to the holding back of women at work, including organisational culture, pay and reward criteria and long hours.
9.2 Women in the South East of England: a comparative picture In part 2 we compared the labour market position of women in the government region of the South East of England with the position of men in the region and the position of women nationally. To that end we conducted secondary analysis on a number of datasets. These included the Labour Force Survey, the New Earnings Survey, the British Household Panel Survey (BHPS), Regional Trends and the National Employers’ Skills Survey. The main findings from this research are set out below. The government region of the South East of England is not a poor region. It is the second largest regional economy in the UK, and the largest in terms of population, and exhibits the highest economic growth. However, alongside these indicators of affluence, the region has significant pockets of deprivation. The industrial sector breakdown for the South East region shows that the dominant sector is financial and business services with just under a quarter of employee jobs. The region also has nine out of the world’s top ten of the major pharmaceutical firms and has a large share of small firms in services and electronics. In addition, it has about one third of the UK’s science research and development workers. The South East has high activity rates. Activity rates amongst women in the region are among the highest in the UK and higher than those of London. Women’s activity rates in general have risen dramatically over the last 30 years, whereas that of men has declined. Looking at those in employment, and measuring percentage change over the period 1999-2003, this pattern is very broadly repeated, but men in
38

Gender & the Labour Market in SE England: Volume 1 - The Context
the South East suffered a bigger fall than in other regions. In comparison the rise in activity rates for women in the South East was just above the UK average. We also found that self-employment is more prevalent in the South East than in the UK as a whole, but women are under-represented in enterprise and that just under half - 45 per cent - of employed women work part-time in the South East, a figure similar to the UK as a whole. This compares with a much lower figure of only 35 per cent of women working part-time in London. The occupations where the highest levels of part-time work are found are those where women are over-represented: clerical work, personal services and sales. In terms of sector, the service sector makes much higher use of part-timers than manufacturing. The occupational breakdown shows that women are over-represented in sales and customer services, personal services and administrative and secretarial occupations. This is a similar picture to that of the UK as a whole, except that the proportion of women managers and senior officials is higher in the South East than the UK as a whole, and this occupational grouping has shown a significant growth in the South East over the last decade. Data prepared for this report from the BHPS shows that women are promoted at the same rate as men in Britain. This interesting finding, which goes against the conventional wisdom that men are more likely to be promoted than women, merits further research. For example the data give no indication of the level of the original job and the job to which respondents were promoted; and there is no regional breakdown because the datasets are too small.
9.3 Gender, pay and region Probably the most dramatic finding arising from the analysis conducted for this report is that the median gender pay gap in the South East is greater than that of any other region. Also the gap in the South East of 19 per cent is much greater than that of its next door region, London, which stands at 8 per cent. Indeed, although women’s median earnings in the South East were relatively high (only in London were women’s earnings higher), the disparity in relative pay between women and men in the South East was greater than anywhere else in GB. Looking in more detail at the spread of hourly earnings by region and gender, the lowest 10 per cent of earners typically exhibit a narrower gender pay gap than the highest 10 per cent and the South East was no exception. The gap in the South East for the lowest decile is 11 per cent, similar to that for Great Britain as a whole. This contrasts with gender pay gap in the highest decile, where the gap in the South East is 30 per cent compared to 20 per cent for Great Britain as a whole and is greater than that of any other region. Thus at the top end of the earnings scale, women in the South East are significantly more disadvantaged in terms of pay relative to men than are women in Britain generally. These findings are based on gross full-time adult hourly earnings in 2003 and suggest that high pay, far from reducing the gender pay gap, exacerbates it.
39

Gender & the Labour Market in SE England: Volume 1 - The Context
9.4 Gender, qualifications and skills National figures for highest qualifications by gender were compiled for this report for 2004. Regionally, 32 per cent of workers in the South East are educated to NVQ level 4 (first degree or equivalent) and above with women being slightly more qualified than men and this is similar to the UK generally. Thus there is relative equality in the proportions of well-educated men and women in the labour market, and the human capital model explanation for women’s disadvantage is undermined by this finding. At the other end of the scale, the South East has a lower percentage of women employees with no qualifications than the UK as a whole, lower than all regions except London. In terms of training, Regional Trends figures show that more women than men in all regions received job-related training in 2003. Training by occupation and region was available from the National Employer Skills Survey, but data were not broken down by gender. These show that managers and administrative and secretarial staff in the South East were the most likely to have had training in the last 12 months. Our analysis of the data also finds that although the South East has a higher proportion of hard-to-fill vacancies than the average for all regions in England, it has a lower proportion of skill shortage vacancies than average. We were dismayed to find that no gender breakdown of figures was available from the National Employers Skills Survey, which hampered the compilation of training and skills data for this report. There is an urgent need to review the collection of training and skills data, in order to provide comparative data for men and women.
9.5 A final comment To sum up, there are indications both of similarity and difference in terms of the labour market position of women in the South East compared to that of men in the South East and compared to that of women in the UK as a whole. Furthermore, there are a number of findings from this report that merit further research, especially in terms of the gender pay gap, where our analysis shows that relative affluence exacerbates, rather than reduces differences. In addition, the government needs to review the way in which data are collected, particularly in respect of training and skills surveys. By separating data for men and women, a much clearer evidence base will emerge for policy makers.
40

Gender & the Labour Market in SE England: Volume 1 - The Context
10. References Adnett, N. (1996) European Labour Markets, Addison Wesley Longman Anderson, T. and Metcalf, H. (2003) Diversity: stacking up the evidence, London: Chartered Institute of Personnel and Development. Anderson, T., Forth, J., Metcalf, H. and Kirby, S. (2001) The Gender Pay Gap, London: Women & Equality Unit, Cabinet Office. AUT (2004) The Unequal Academy, www.aut.org.uk, accessed on 15/10/2004, London: Association of University Teachers. Begum, N. (2004) ‘Employment by Occupation and Industry’, Labour Market Trends, June, 227-234. Bevan, S. and Thompson, M. (1992) Merit Pay, Performance Appraisal and Attitudes to Women’s Work, Report 234, Brighton: Institute of Manpower Studies. Blackwell, L. (2001) ‘Occupational Sex Segregation and Part-time Work in Modern Britain’, Gender, Work and Organization, 8, 2, 146-163. Booth, A.L., Francesconi, M. and Frank, J. (1999) “Glass Ceilings or Sticky Floors” http://www.essex.ac.uk/ilr/discussion/98-23.htm Bradley, H. (1989) Men’s Work, Women’s Work, Oxford: Polity Press. Breugel, I.(2001) ‘The Full Monty: men into women’s work?’ chap 13 in M. Noon and E. Ogbonna (Eds) Equality, Diversity and Disadvantage, Basingstoke: Palgrave. Burns, E. (Ed) (1935) A Handbook of Marxism, London: Victor Gollancz. Buswell, C. and Jenkins, S. (1994) ‘Equal Opportunities Policies, Employment and Patriarchy’, Gender, Work and Organization, 1, 2, 83-93. Caruso, D. (2003) ‘Limits of the Classic Method: Positive Action in the European Union after the New Equality Directives, Harvard International Law Journal, 44, 331-386. Catalyst/Opportunity Now (2000) Breaking the Barriers: women in senior management in the UK, London: Business in the Community. Cockburn, C. (1989) ‘Equal Opportunities: the short and long agenda’, Industrial Relations Journal, 20, 3, 213-225.
41

Gender & the Labour Market in SE England: Volume 1 - The Context
Cockburn, C. (1991) In the Way of Women: men’s resistance to sex equality in organizations, Basingstoke: Macmillan. Collinson, D., Knights, D. and Collinson, M. (1990) Managing to Discriminate, London: Routledge. Corby, S. (1997) ‘Opportunity 2000 in the National Health Service; a missed opportunity for women’, Journal of Management in Medicine, 11, 5, 269-278. Corby, S. (2000) ‘The Ethics of Equal Opportunities’ in R. Chapman (Ed) Ethics in Public Service for the New Millennium, Aldershot: Ashgate. Costello, C. (2003) ‘Positive Action’ in C. Costello and E. Barry (2003) Equality in Diversity: the new equality directives, Dublin: Centre for European Law. Coyle, A. (1995) Women and Organisational Change, Manchester: Equal Opportunities Commission. Cully, M., Woodland, S., O’Reilly, A. and Dix, G. (1999) Britain At Work, London: Routledge. Deakin, S. and Morris, G. (2004) Labour Law, 4th edition, London: Butterworths. Deem, R. (2003) ‘Gender, Organizational Cultures and the Practices of Manager-Academics in UK Universities’, Gender, Work and Organization, 10, 2, 239-259. Department of Work and Pensions (2002) Maternity and Paternity Rights in Britain2002: Survey of Parents, London: Department of Work and Pensions. Dickens, L. (1994) ‘The Business Case for Women’s Equality: Is the carrot better than the stick?’, Employee Relations, 16, 8, 5-18. Dickens, L. (1997) ‘Gender, Race and Employment Equality in Britain: inadequate strategies and the role of industrial relations actors’, Industrial Relations Journal, 28, 4, 282-290. Dickens, L. (1998) ‘What HRM Means for Gender Equality’ Human Resource Management Journal, 8, 1, 23-40. DTI (2003) The Business Context to Long Hours Working, Employment Relations Research, URN 03/833, November, London: Department of Trade and Industry. DTI Small Business Service (2004) A Government Action Plan for Small Business, URN 04/517, London: Department of Trade and Industry. Employment Tribunal Service (2004) Annual Report 2003-2004, London: Employment Tribunal Service. Equal Opportunities Commission (2004a) Facts About Women & Men in Great Britain, Manchester: Equal Opportunities Commission.
42

Gender & the Labour Market in SE England: Volume 1 - The Context
Equal Opportunities Commission (2004b) Tip of the Iceberg, Interim Report of the EOC’s investigation into discrimination against new and expectant mothers in the workplace, Manchester: Equal Opportunities Commission. Fagan, C. (2001) ‘Money and the Gender Order: work orientations and working time preferences in Britain, Gender, Work and Organization, 6, 3, 239-266. Fredman and Morris, (1989) The State as Employer, London: Mansell. Fredman, S. (2000) ‘Discrimination Law in the EU: labour market regulation or fundamental rights?, in H. Collins, P. Davies and R. Rideout, Legal Regulation in the Employment Relation, London: Kluwer. Fredman, S. (2001) ‘Equality: a new generation?’ Industrial Law Journal, 30, 2, 145-168. Fredman, S. (2002) Discrimination Law, Oxford: Oxford University Press. Gallie, D. and White, M. (1994) ‘Employer Policies, Employee Contracts and Labour Market Structure’, in J. Rubery and F. Wilkinson (Eds) Employer Strategy and the Labour Market, Oxford: OUP. Gilbert, K. and Secker, J. (1995) ‘Generating Equality? Equal pay, Decentralisation and the Electricity Supply Industry’, British Journal of Industrial Relations, 33, 2, 191-207. Gough, O. (2001) ‘The impact of the gender pay gap on post retirement earnings’, Critical Social Policy, 21, 311-334. Grimshaw, D. and Rubery, J. (2001) The Gender Pay Gap, Research Discussion Series, Manchester: Equal Opportunities Commission. Hakim, C. (1979) Occupational Segregation: a comparative study of the degree and pattern of the differentiation between men and women’s work in Britain, the United States and other countries, Research Paper No. 9, London: Department of Employment. Hakim, C. (1991) ‘Grateful Slaves and Self-made Women: fact and fantasy in women’s work orientations’, European Sociological Review, 7, 2, 101-121. Hakim, C. (2002) ‘Lifestyle Preferences as Determinants of Women’s Differentiated Labour Market Careers’, Work and Occupations, 29, 4, 428-459. Harkness, S. (1996) ‘The Gender Earnings Gap: Evidence from the UK’, Fiscal Studies 17, 2, 1-36. Hayward, B. Peters, M., Rousseau, N. and Seeds, K. (2004) Findings from the Survey of Employment Tribunal Applications 2003, Employment Relations Research Series 33, London: Department of Trade & Industry.
43

Gender & the Labour Market in SE England: Volume 1 - The Context
Hepple, B., Lester, A., Ellis, E., Rose, D. and Singh, R. (n.d.) Improving Equality Law: the options, London: Justice. Hepple, B., Coussey, M. and Choudhury, T. (2000) Equality: A New Framework, Report of the Independent Review of the Enforcement of the UK Anti-Discrimination Legislation, Oxford: Hart. Hoque, K. and Noon, M. (2004) ‘Equal Opportunities policy and practice in Britain: evaluating the ‘empty shell’ hypothesis’, Work, Employment and Society, 18, 3, 481-506. IDS (2004) ‘Significant fall in gender pay gap – or not?’ Diversity at Work, 6, December, 20-22. Institute for Employment Research (2003) National Employers Skills Survey 2003, London: Learning and Skills Council. James, G. (2004) Pregnancy Discrimination at Work: A review, Working Paper Series no. 14, Manchester: Equal Opportunities Commission. Jewson, N. and Mason, D. (1986) ‘The Theory and Practice of Equal Opportunities Policies’, Sociological Review, 34, 2, 307-334. Joshi, H., Paci, P. and Waldfogel, G. (1999) ‘The Wages of Motherhood: better or worse?’, Cambridge Journal of Economics, 23, 5, 543-564. Kahn-Freund, O. (1954) ‘The Legal Framework’ in Flanders, A. and Clegg, H. A. (Eds) The System of Industrial Relations In Great Britain, Oxford: Blackwell. Labour Market Trends (2004) Table B.11 on Employment, September, London, TSO, Stationery Office Lewis, D. and Sergeant, M. (2004) Essentials of Employment Law, 8th edition, London: Chartered Institute of Personnel and Development. Maddock, S. and Parkin, D. (1994) ‘Gender Cultures and How They Affect Women At Work’ in M. J. Davidson and R. J. Burke, Women in Management, London: Chapman. McColgan, A. (2000) ‘Regulating Pay Discrimination’, in H. Collins, P. Davies and R. Rideout, Legal Regulation in the Employment Relation, London: Kluwer. Miller, L., Neathey, F., Pollard, E. and Hill, D. (2004) Occupational segregation, gender gaps and skill gaps, Working paper series no. 15, Manchester: Equal Opportunities Commission. Morgan, G. and Knights, D. (1991) ‘Gendering Jobs: corporate strategy, managerial control and the dynamics of job segregation’, Work, Employment & Society, 5, 2, 181-200.
44

Gender & the Labour Market in SE England: Volume 1 - The Context
Mullally, S. (2003) ‘Beyond the Limits of Non-discrimination: Promoting Gender Equality’, in C. Costello and E. Barry (2003) Equality in Diversity: the new equality directives, Dublin: Centre for European Law. Nolan, P. (2003) ‘The Labour Market: history, structure and prospects’, in P. Edwards (Ed) Industrial Relations: theory and practice, 2nd edition, Oxford: Blackwell. O’Cinneide, C. (2003) ‘Making Use of Positive Action Duties’, in C. Costello and E. Barry (2003) Equality in Diversity: the new equality directives, Dublin: Centre for European Law. OECD (2002) ‘Women at Work: who they are and how they are faring’, Employment Outlook, Paris: Organisation for Economic Co-operation and Development. Olsen, W. and Walby, S. (2004) Modelling Gender Pay Gaps, Working paper series no. 17, Manchester: Equal Opportunities Commission. Palmer, T., Grainger, H. and Fitzner, G. (2004) Trade Union Membership 2003, London: Department of Trade & Industry. Pitt, G. (2004) Employment Law, 5th edition, London: Sweet and Maxwell. Pollert, A. (1991) Farewell to Flexibility? Oxford: Blackwell.
Roos, P. (1985) Gender and Work: a comparative analysis of industrial societies, Albany: State University of New York Press. Rubin, J. (1997) ‘Equality and the Culture of Organizational Assessment’, Gender, Work and Organization, 4, 1, 24-34. SEEDA (2004a) An Economic Profile of the South East, Guildford: South East England Agency. SEEDA (2004b) Business and International: Bio-pharma companies, Guildford: South East England Development Agency. Stanworth, C. (2000) ‘Flexible Working Patterns’, in D. Winstanley and J. Woodall (Eds) Ethical Issues in Contemporary Human Resource Management, Basingstoke: Macmillan. Stanworth, J. and Purdy, D. (2003) SME Facts and Issues: a compilation of current data and issues on UK small and medium sized firms, London: Westminster Business School, University of Westminster. Thewlis, M., Miller, L., and Neathey, F. (2004) Advancing women in the workplace:statistical analysis, Working paper series no. 12, Manchester: Equal Opportunities Commission.
45

Gender & the Labour Market in SE England: Volume 1 - The Context
Townshend-Smith, R. (2000) ‘Discrimination Law, Regulation and Rational Decision-Making in Employment’, in H. Collins, P. Davies and R. Rideout, Legal Regulation in the Employment Relation, London: Kluwer. Walby, S. (1990) Theorizing Patriarchy, Oxford: Blackwell.
46