Embed Size (px)
Citation preview

1
Gender and Employment in South Caucasus and Western CIS
Background Paper
Prepared for the UNDP Sub-regional Conference on
Employment: Promoting Job Rich and Sustainable Growth In Armenia, Azerbaijan, Belarus, Georgia, Moldova, And
Ukraine
Tbilisi, Georgia, 28-29 October 2015
Tamar Khitarishvili1
1 Research Scholar, Levy Economics Institute at Bard College, 75 Blithewood Ave., Annandale on Hudson, NY 12504, USA; (845) 758 7714; [email protected]; the author is a contributor to the chapter on gender dimensions of inequalities of the 2016 UNDP Regional Human Development Report for Europe and Central Asia.

2
Executive summary Gender disparities negatively impact labour markets, and limit the prospects for robust, sustainable, and inclusive growth in the countries of South Caucasus (Armenia, Azerbaijan, and Georgia) and Western CIS (Belarus, Moldova and Ukraine). Labour force participation, employment and unemployment: female labour force participation rates remain below men’s rates. The labour force participation and employment rates for men and women have either remained stable or declined over the last two decades. However, the rates for females remain lower than their male counterparts. On the other hand, unemployment rates have been generally lower for women than for men, except in Armenia and Azerbaijan.
Employment composition: female employment is less secure. Women are underrepresented as both wage earners and as employers in all six countries. In the countries with high rates of self-employment (e.g. Armenia, Georgia and Azerbaijan), women are overrepresented in the category of contributing family workers.
Wage gaps: women earn as much as 78 percent (Ukraine) and as little as 50 percent (Azerbaijan) of their male counterparts. Research has shown that some of the wage gaps are due to industrial and occupational segregation, or the result of women working fewer hours than men. However, a large portion of the gap could be attributed to gender discrimination. While gender wage inequality has improved in most countries in the region, it has increased in Belarus and more recently in Azerbaijan.
Entrepreneurship: female entrepreneurs face greater barriers in accessing credit and tend to have weaker networks in the region. Female-owned businesses tend to be smaller than those of their male counterparts, even though female-owned businesses tend to benefit more from expansion and they employ proportionately more women. Thus, encouraging female-owned business expansion can have a greater impact on overall growth and specifically on female employment.
Agriculture: women are less likely to be landowners than men. Women typically own smaller plots of land compared to men and are more likely to be contributing family workers. Women tend to engage in agricultural production aimed at own consumption whereas men tend to engage in the production of cash crops.
Time use: gender disparities are present in both paid and unpaid work. Gender gaps in unpaid and paid work vary from moderate (Moldova) to high (Armenia and Azerbaijan). However, in terms of total work time, women spend more time working than men. Gender gaps in time use are particularly large in child care and they tend to be higher in urban areas compared to rural areas.
Education: high degree of gender specialization by subject contributes to industrial segregation. There is relative gender parity in educational attainment at the primary and secondary levels. At the tertiary level female share in education is more than a half. However, there is substantial variation in the share of women by subject, underscoring the high degree of specialization that reinforces the industrial and occupational segregation by gender. Women returns to education tend to be higher than men’s.

3
Migration: migration has important implications for the economic and demographic future of the region. Gendered patterns of migration vary widely. In most countries of the region, external migration appears to be a male phenomenon although there is considerable variation by gender within countries. Less educated migrants move within the former Soviet space whereas more educated migrants are more likely to leave the region altogether. Internal migration is relatively low with females moving to urban areas primarily to study and males migrating to cities to work.
Reducing these gender inequalities has the potential to contribute to the process of inclusive growth and development in the countries of the South Caucasus and Western CIS and to the achievement of the Sustainable Development Goals of poverty and inequality reduction (WB 2012, Elborgh-Woytek et al. 2013, Woetzel et al. 2015). To achieve such reductions, a comprehensive strategy is needed that complements supply-side interventions with demand-side measures aimed at decent employment creation (Kabeer 2012). The role of women’s care and domestic responsibilities in limiting women’s engagement in labour markets as workers and as entrepreneurs has to be an integral part of such a strategy. To that end, child care provisioning can serve as an effective demand-side intervention that simultaneously alleviates supply-side constraints to women’s gainful employment (İlkkaracan et al. 2015; Antonopoulos and Kim 2011). Other constraints preventing the expansion of female-owned businesses must be addressed because female-owned businesses have greater economies of scale and hire proportionately more women.
Another key element in such a strategy entails harnessing the job creation potential of green economic policies and promoting gender equality in tertiary education by linking education and green economy initiatives. The countries of the South Caucasus and Western CIS are in a strong position to use the job creation potential of the green economy to reduce the industrial segregation by gender. For this to happen, the demand-side efforts aimed at the expansion of the green economy have to be matched by steps aimed at promoting a more balanced representation of women in different subjects at the higher education level. The achievement of these goals can only be possible if active measures to enhance women’s economic empowerment become of central concern to the regional and national policy dialogue for inclusive growth.
Context The collapse of the Soviet Union initiated an unprecedented social and economic transformation of the successor countries, which counted gender equality as a key legacy of their socialist past. This transformation was bound to alter the gender balance in the region. The transition experience of the region has amply demonstrated that the changes in the gender balance triggered by the economic expansion are unclear (WB 2012, Elborgh-Woytek et al. 2013, Woetzel et al. 2015). Moreover, it has underscored that active measures to enhance women’s economic empowerment should be of central concern to the policy dialogue aimed at inclusive growth and poverty and inequality reduction. In this paper, our goals are to highlight gender inequality in the labour markets in the countries of the South Caucasus (Armenia, Azerbaijan and Georgia) and Western CIS (Belarus, Moldova and Ukraine) and to propose steps aimed at reducing inequality in the context of inclusive growth through employment.

4
Gender disparities vary within the region. This diversity reflects the approaches taken during the transition period and underscores the complex interplay between economic, social, and demographic changes. For example, the countries of the South Caucasus have had higher levels of gender inequality than the countries of the Western CIS (Fig. 1). However, Moldova and Belarus are the closest in gender inequality measures, despite the fact that they are the poorest and the richest countries in this group based on their per capita GNI.
Figure 1.
Source: HDRO and WEF Global Gender Report (2014).
Growth without Jobs: Labour force participation, employment and unemployment The transition process has been associated with stable or declining labour force participation rates for working-age and young men and women (Fig. 2). The drop in the youth labour force participation rate was particularly sharp in Armenia and Moldova. In the process, the gender gaps in participation rates either remained stable or widened in the Western CIS, Armenia, and Georgia. In contrast, in Azerbaijan, the female labour force participation rate for working-age individuals increased markedly and the female youth participation rate surpassed its male counterpart in 2008. As a result, the gender gap in participation rates contracted sharply in Azerbaijan, especially among the young. It is noteworthy that although the gender parity in participation rates is the strongest in Moldova, this appears to be more a reflection of the weak state of labour markets than an indication of a level playing field for both men and women.
ARM
AZEBLR
GEO
MDA
UKR
5000
1000
015
000
2000
0G
NIP
C
.66 .68 .7 .72 .74WEF_GGG
GNI per capita (PPP, 2013) and WEF Global Gender Gap (2014)
ARM
AZE
BLR
GEO
MDA
UKR
.94
.96
.98
11.
02
HD
I_FM
_rat
io
.66 .68 .7 .72 .74WEF_GGG
HDI Female-Male Ratio (2013) and WEF Global Gender Gap (2014)

5
Figure 2.
Source: The Gender Statistics database
Labour force participation rates were to a large degree driven by the changes in employment rates (Fig. 3). For example, the sizable decline in the employment rate in Moldova paralleled the labour force participation rate. In the case of Azerbaijan, the increase in female labour force participation rate appears to stem from the notable increase in women’s employment rate, for both working-age and, since 2008, young women.
Figure 3.
Source: The Gender Statistics database
020
4060
800
2040
6080
1990 2000 2010 2020 1990 2000 2010 2020 1990 2000 2010 2020
ARM AZE GEO
BLR MDA UKR
15+ female 15+ male15 - 24 female 15 - 24 male
year_n
Graphs by List of countries
Employment to Population Ratio, female and male, 15+ and 15-24
2040
6080
2040
6080
1990 2000 2010 2020 1990 2000 2010 2020 1990 2000 2010 2020
ARM AZE GEO
BLR MDA UKR
15+ female 15+ male15 - 24 female 15 - 24 male
year_n
Graphs by List of countries
LFPR, female and male, 15+ and 15-24

6
The countries of the region have had limited success at tackling unemployment (Fig. 4), especially in Armenia and Georgia, in which the official unemployment rates have remained well above 15 percent. In Belarus, Moldova and Ukraine, the unemployment rates have been lower than in the South Caucasus, and tended to be more similar across age groups although it remains to be seen whether and how this situation will change, especially in the case of Ukraine. In contrast to the labour force participation and employment rates in these countries, as well as in Georgia, female unemployment rates are below their male equivalents, and have been for the last two decades. The opposite holds in Armenia and Azerbaijan.
Figure 4.
Source: The Gender Statistics database
Unemployment rates among individuals with secondary and tertiary education remain higher than among their less educated peers (Fig. 5). With the exception of Belarus, the biggest portion of the unemployed for both men and women is comprised of individuals with secondary education, followed by individuals with tertiary education. In Belarus, individuals with tertiary education constitute a bigger proportion of the unemployed. The percentage of the unemployed with primary education is low because of their smaller overall share of the workforce.
There are proportionately more unemployed women with tertiary education than men in all countries except Belarus and Azerbaijan. Especially in Azerbaijan, although women with tertiary education represent a smaller share of female employment than in other countries (13 percent, as compared to 24 percent and 30 percent for Armenia and Georgia, respectively), the demand for the skills offered by women with tertiary education appears to be higher than in other countries (Fig. 6).
020
4060
800
2040
6080
1990 2000 2010 2020 1990 2000 2010 2020 1990 2000 2010 2020
ARM AZE GEO
BLR MDA UKR
15+ female 15+ male15 - 24 female 15 - 24 male
year_n
Graphs by List of countries
Unemployment Rate, female and male, 15+ and 15-24
7
Figure 5.
Source: The Gender Statistics database
Figure 6.
Source: The Gender Statistics database
The changing composition of economies has not always been reflected in the composition of employment. One of the key factors commonly influencing labour market development is the output composition of the economy. Since the mid-1990s, all countries in this group experienced a contraction in the agricultural sector and most countries experienced a corresponding expansion of the service sector. Belarus has maintained a relatively large industrial sector, whereas Azerbaijan experienced an expansion of its industrial sector as a result of a growing oil industry (Fig. 7).
3.2
73.1
23.5
7.7
87.35.1
2.9
53.1
44.0
10.6
41.6
47.8
17.4
49.5
32.1
5.9
46.6
47.5
020
4060
8010
0
ARM AZE GEO BLR MDA UKR
2008 data
Composition of the Unemployed by Education, Females
primary secondarytertiary
10.2
70.2
19.2
9.4
72.8
17.8
6.1
58.6
35.2
9.5
34.0
56.5
19.7
61.7
18.0
8.7
58.2
33.1
020
4060
8010
0
ARM AZE GEO BLR MDA UKR
2008 data
Composition of the Unemployed by Education, Males
primary secondarytertiary
6.40 13.20 8.10 2.2020.50
66.40
73.80
58.90 67.70
50.20
27.2012.90
32.00 27.60 27.70
0
20
40
60
80
100
120
Armenia Azerbaijan Georgia Belarus Moldova
Female Labour Force Composition, by Education
tertiary
secondary
primary

8
Figure 7.
Source: The Gender Statistics database
Despite these shifts in the output structure, however, the sectoral composition of employment has hardly changed over the last two decades. The considerable size of agricultural employment in all countries but Belarus, despite its contracting role in output, suggests the predominance of low agricultural productivity in these countries2. On the other hand, in Azerbaijan, the share of employment in the industrial sector remained small relative to its growing industrial sector. This is likely due to the capital intensive nature of the oil sector. The service sector employs the largest portion of the workforce, especially among women. The exception is Belarus where the industrial sector is the primary employer of men.
Figure 8.
2 According to UNFPA (2014), in Ukraine 19.4 percent of female workforce and 19.6 percent of male workforce were employed in agriculture in 2011.
0
20
40
60
80
100
0
20
40
60
80
100
1990
1991 19
9219
93 1994
1995 19
9619
97 1998
1999 20
0020
01 2002
2003 20
0420
05 2006
2007 20
0820
09 2010
2011 20
1220
13 2014
1990
1991 19
9219
93 1994
1995 19
9619
97 1998
1999 20
0020
01 2002
2003 20
0420
05 2006
2007 20
0820
09 2010
2011 20
1220
13 2014
1990
1991 19
9219
93 1994
1995 19
9619
97 1998
1999 20
0020
01 2002
2003 20
0420
05 2006
2007 20
0820
09 2010
2011 20
1220
13 2014
1990
1991 19
9219
93 1994
1995 19
9619
97 1998
1999 20
0020
01 2002
2003 20
0420
05 2006
2007 20
0820
09 2010
2011 20
1220
13 2014
1990
1991 19
9219
93 1994
1995 19
9619
97 1998
1999 20
0020
01 2002
2003 20
0420
05 2006
2007 20
0820
09 2010
2011 20
1220
13 2014
1990
1991 19
9219
93 1994
1995 19
9619
97 1998
1999 20
0020
01 2002
2003 20
0420
05 2006
2007 20
0820
09 2010
2011 20
1220
13 2014
ARM AZE GEO
BLR MDA UKR
Agriculture Value Added, % of GDP Industry Value Added, % of GDP
Services etc. Value Added, % of GDP
Graphs by List of countries
Output composition
45.6
8.5
46.0
41.57.4
51.1
55.54.4
40.0
7.8
24.0
62.5
35.2
11.9
46.8
020
4060
8010
0
ARM AZE GEO BLR MDA UKR
average for available years
Industrial Composition of Female Employment
agriculture industryservices
41.0
23.9
35.1
37.2
17.0
45.8
50.9
13.8
35.3
13.1
43.3
37.4
39.1
22.5
33.3
020
4060
8010
0
ARM AZE GEO BLR MDA UKR
average for available years
Industrial Composition of Male Employment
agriculture industryservices

9
There are sizable differences in the wage employment rates of men and women in the six countries. Wage employment3 comprises a larger portion of employment in the Western CIS countries compared to the countries of the South Caucasus. In the case of Belarus, more than 90 percent of employed men and women are wage workers. Gender gaps in wage employment are larger in Armenia and Azerbaijan and more in favour of men compared to the rest of the countries.
The share of self-employment is higher among women than among men. This could indicate a higher degree of entrepreneurial engagement among women although it could also be a reflection of their greater financial vulnerability.
Figure 9.
Source: The Gender Statistics database
Among the self-employed4, own-account workers, who are self-employed individuals without employees, represent the biggest category. Their proportion is sizable in the countries of the South Caucasus and in Moldova, and much less so in Ukraine and in Belarus. Proportionately more men than women are own-account workers in Armenia, Georgia, Moldova, and Belarus (although in the case of Belarus the values and the gender difference are negligible). In Ukraine, and even more so in Azerbaijan, the gender relationship is reversed. In fact, in Azerbaijan, the majority of employed women are own-account workers.
3 For more details on the data availability by countries, see corresponding figures in the Appendix. 4 The category of self-employed includes own-account workers, who are self-employed individuals without employees; employers, who are self-employed individuals with employees; and contributing family workers, who are individuals who work without pay for their family business.
61.3
51.6
40.3
32.537.1 36.9
93.5 94.9
64.368.1
85.6 83.7
020
4060
8010
0
ARM AZE GEO BLR MDA UKR
average for available years
Proportion of Wage Employment, female and male
male female

10
Figure 10.
Source: The Gender Statistics database
Contributing family workers constitute a large portion of employment in the countries of the South Caucasus, which reflects the high share of agricultural employment in these countries. Women are overrepresented in this category compared to men. In fact, in the case of Armenia and Georgia, proportionately twice as many women as men work without pay for their family business. Finally, employers represent the smallest of all the employment types. The share of male employers in total male employment is about twice as large as the share of female employers in all countries but Azerbaijan, in which it is relatively high for both men and women compared to the other five countries in this group.
Figure 11.
Source: The Gender Statistics database
28.5 27.3
42.1
50.6
40.2
24.2
2.4 1.6
32.2
26.5
13.615.4
010
2030
4050
ARM AZE GEO BLR MDA UKR
average for available years
Proportion of Own-Account Workers, female and male
male female
11.0
24.8
19.722.5
20.2
38.0
0.1 0.12.3
4.9
0.5 0.7
010
2030
40
ARM AZE GEO BLR MDA UKR
average for available years
Proportion of Contributing Family Workers, female and male
male female
0.9
0.2
5.8
3.4
2.1
0.5
1.4
0.71.1
0.5
1.3
0.8
02
46
ARM AZE GEO BLR MDA UKR
average for available years
Proportion of Employers, female and male
male female

11
In sum, the analysis by employment type suggests that wage employment is very important in Belarus and Ukraine. Moldova is more similar to the South Caucasus countries in terms of the importance of self-employment, which seems to be connected to the relatively large size of the agricultural sector in these countries. Women are overrepresented in self-employment, primarily due to their higher proportion as contributing family workers. However, the evidence from Ukraine suggests that the educational attainment of self-employed men is higher than the educational attainment of self-employed women. This indicates that female self-employment is more likely to reflect necessity rather than opportunity compared to male self-employment (UNFPA 2014).
Challenges for inclusive economic growth through entrepreneurship Private sector growth has been viewed as a key to generating robust employment growth in transition countries (World Bank 2014). The experience of the Western CIS and the South Caucasus countries in expanding the private sector has varied. The current share of the private sector ranges from 30 percent in Belarus to 75 percent in Armenia, Azerbaijan, and Georgia. In the case of Belarus, the share of the private sector may be even smaller because the private sector contribution includes the output of the private enterprises in which the state owns the majority of shares (Smallbone and Welter 2010). The available data for the private sector shares of employment largely parallel the private sector shares of GDP. Male shares of private employment are consistently higher than female shares due to the stronger representation of women in the public sector.5 Countries with high shares of private sector employment have not necessarily been more successful at invigorating their labour markets. This has been to some degree because private sector employment has been dominated by own-account and contributing family workers in these countries.
In this context, understanding the determinants of small- and medium-size enterprise (SME) formation and expansion therefore may be essential to generating growth in private sector jobs. Drawing on the data from the Global Entrepreneurship Monitor survey available for Georgia, the established business ownership rate6 in 2014 was 7.3 percent and the entrepreneurial intention rate7 was 16 percent. Kazakhstan and Russia are the only other former Soviet countries for which these data are available and in these countries the business ownership rate and the entrepreneurial intention rate were 7.4 and 8.1 percent and 3.9 and 2.4 percent for Kazakhstan and Russia, respectively. By comparison, in the United Kingdom, these rates were 6.5 and 6.3. Hence, the entrepreneurial activity in
5 Due to the unavailability of gender disaggregated data on private sector employment in the UNECE database, we attempted to use the data available in the “Women and Men in Belarus” and “Women and Men in Ukraine” publications. However, the data from Belarus excludes individual entrepreneurs and persons working for them, persons engaged in personal agricultural plots and small businesses that employ 15 or fewer employees. According to Smallbone and Welter (2010), the number of registered own-account workers was about 212,000 and the number of SMEs was about 440,000 in the country of 10 million people. The data for Ukraine did not have the private/public breakdown. 6 Business ownership rate is the percentage of 18-64 population who are currently an owner-manager of an established business, i.e., owning and managing a running business that has paid salaries, wages, or any other payments to the owners for more than 42 months. 7 Entrepreneurial intention rate is the percentage of 18-64 population -- individuals involved in any stage of entrepreneurial activity excluded -- who are latent entrepreneurs and who intend to start a business within three years.

12
the transition region appears to be substantial. However, the main question is whether this entrepreneurial intention rate and activity can become a seedbed for innovation and job growth and what role women will play in this process.
Figure 12.
Women engage in entrepreneurial activities in different roles, such as business owners and managers. As business owners, since 2008, women have participated in the ownership of more than a third of formal firms in Belarus, Georgia, Moldova, and Ukraine, according to the World Bank Enterprise Survey data (Fig. 13). These rates are in line or higher than the OECD average of about 30 percent (OECD 2012). Eliseeva (2003) (cited in Aculai 2009) confirms the high share of female ownership participation in Belarus, which in recent years has been around 50 percent.8 On the other hand, the female business ownership rate in Azerbaijan is especially low at 4.1 percent in 2013.
There is surprisingly large yearly variation in the female ownership rates (Fig. 13). This may reflect a high turnover of firms although the sharp increase in 2008 and 20099 may also be due to the disproportionately strong impact of the recession on male-dominated industries, such as construction and transport in the region. Only in the case of Azerbaijan do we observe a consistent decline from 14.7 in 2005 to 4.1 percent in 2013.
Female ownership rates are not matched by women’s share of top management jobs. Whereas female ownership rates are comparable to the OECD average, women are less likely to manage firms. For example, in Armenia in 2013 only 19.1 percent of firms had a female top manager even though 25.3 percent of firms had female participation in ownership. In Belarus, 32.7 percent of SMEs had a female top manager while 43.6 percent of firms had female majority ownership. Nevertheless, the percentage
8 However, this value has to be interpreted in the context of a very small number of SMEs in Belarus. In 2008, there were about 440,000 SMEs in the country of 10 million people (Smallbone and Welter 2010). 9 The data for Belarus, Georgia, and Ukraine are from 2008 and for Armenia, Azerbaijan, and Moldova for 2009.
0.75 0.75 0.75
0.30
0.650.60
0.000.100.200.300.400.500.600.700.80
Armenia Azerbaijan Georgia Belarus Moldova Ukraine
Private Sector Share in GDP
source: EBRD Struct and Instl Change Indic
0.700.77
0.57
0.700.79
0.85
0.64
0.79
0.000.100.200.300.400.500.600.700.800.90
Female Male
Private Sector Share in Employment
Armenia Azerbaijan, 2008 GeorgiaBelarus Moldova Ukraine
source: UNECE database

13
of firms with female top managers considerably increased in Armenia, Belarus, Georgia, and Moldova, reaching one-third of managers of formal SMEs in 2013 in Georgia and Belarus.
Figure 13.
Source: The World Bank Business Enterprise Survey
Female-managed firms tend to be smaller in size but employ a larger proportion of women. For example, in 2009 in Ukraine, 38 percent of small firms were managed by females, compared to 17 percent of medium-size firms and 12 percent of large firms. On the other hand, they tend to hire proportionately more full-time female workers. For example, in 2009 in Georgia, almost 60 percent of full-time workers in firms with female participation in ownership were female compared to 31 percent in the firms without female participation in ownership. This potentially implies a greater female employment potential of the female-owned firms.
The World Bank Enterprise Survey data reflects labour market dynamics as they pertain to the SMEs in the formal sector. However, a large share of SME and own-account business activity in these countries occurs in the informal sector. According to Schneider et al. (2010), in 2006 the size of the informal economy in these countries varied from the low of 46 percent in Moldova to the high of 71.1 percent in Georgia (Fig. 14). The evidence on the female participation in the informal SME sector tends to suggest that women are equally represented in the formal and informal sectors. For example, the results of a survey covering formal and informal enterprises in Georgia indicate that about 30 percent of SMEs in Georgia are female-owned, almost identical to the results from the World Bank Enterprise Survey data (Academic Swiss Caucasus Net 2014). Gender breakdown of the category of employers from the Georgian household budget survey, which likely includes owners of SMEs and larger firms in both formal and informal sectors, suggests that the female share among employers in 2011 was very close to the two estimates at 30.15 percent.
These findings indicate that the female SME ownership rates in Georgia are similar in the formal and informal sectors. In the Armenian case, the female share among employers based on the 2013 household survey yields the estimate of 16.2 percent (National Statistics Survey of the Republic of
11.514.7
35.2
18.6
24.527.1
31.8
10.8
40.8
52.9 53.1
47.1
25.3
4.1
33.9
43.647.3
31.5
0
10
20
30
40
50
60
Armenia Azerbaijan Georgia Belarus Moldova Ukraine
Percentage of Firms with Female Participation in Ownership
2005 2008 or 2009 2013
13.5
4.7
19.8
24.8
20.6
27.9
19.1
2.4
32 32.7
25.7
18.8
0
5
10
15
20
25
30
35
Armenia Azerbaijan Georgia Belarus Moldova Ukraine
Percentage of Firms with Female Top Manager
2008 or 2009 2013

14
Armenia, 2014), which is below the World Bank Enterprise Survey rate of 25.3, potentially indicating that the female SME share in the informal sector in Armenia may be somewhat below its formal counterpart.
Figure 14.
The female shares among own-account workers tend to be higher than among SMEs10. The female share in self-employment, which is also a close proxy for own-account work in Moldova and Ukraine, was 42 percent in Moldova in 2010 and 50.3 percent in Ukraine in 2013 (NBS of Moldova, 2012; State Statistics Service of Ukraine, 2013). In Ukraine, the female share among own-account workers was 50 percent already in the late 1990s, and about 30 percent of enterprises with one to 50 employees were female-owned (Gray and Whiston 1999, cited in Aculai et al. (2009)). According to the ASCN survey about 50 percent of own-account entrepreneurs in Georgia are female (ASCN 2014). Similarly, in Armenia, this proportion stood at 46.5 percent in 2013 (National Statistical Service of Armenia, 2014). In Azerbaijan, 62 percent of informal workers were women (Guliev 2015). This evidence appears to indicate a negative relationship between size and female ownership.
Female entrepreneurship often reflects necessity rather than opportunity. The motives that cause men and women to become entrepreneurs are important for understanding the factors that drive enterprise performance. According to the World Bank’s Enterprise Survey results, the desire to increase income is the primary reason for starting the business for the majority of respondents, followed by the desire to be one’s own boss (WBa 2013, WBb 2013, WBc 2013). In contrast, the majority of the respondents in the ACSN survey in Georgia that included own-account workers and SME owners in formal and informal sectors cite not having a better choice of work as their main motivation, followed by the desire to increase income (ACSN 2014). These findings are consistent with own-account activities being primarily
10 Incidentally, the vast majority of own-account and contributing family workers function in the informal sector. For example, in Ukraine, about 89 percent of the self-employed women and 83 percent of self-employed men (more than 90 percent of whom are own-account workers in Ukraine) work in the informal sector (UNFPA 2014).
50.7
67.671.1
52.146
57.5
0
10
20
30
40
50
60
70
80
Armenia Azerbaijan Georgia Belarus Moldova Ukraine
Informal Economy as a % of GDP
Source: Schneider et al. (2010)

15
necessity driven subsistence and an alternative to being unemployed.11 SMEs appear to be more likely to be established for reasons associated with opportunity rather than necessity entrepreneurship. Taken together, these findings suggest that relative to men, female entrepreneurship is more likely to represent necessity rather than opportunity entrepreneurship.
The critical question is how to turn necessity entrepreneurship into opportunity entrepreneurship with a potential for innovation and job creation.12 Women appear to face greater obstacles in making this transition.
Access to credit is one factor that may hinder the establishment and growth of female-owned businesses (Fig. 15). Women in Moldova and Ukraine report greater difficulties in accessing credit and tend to draw on their personal networks more than men in obtaining credit for establishing or expanding their businesses (Welter and Smallbone 2010). They also tend to be more risk averse than men, potentially contributing to the gender gap in business-related borrowing, although the evidence linking women’s risk aversion to the smaller size of operations is inconclusive (Sattar 2012). According to the findings from the 2014 Global Findex survey, with the exception of Moldova, there is a sizable gender gap in the percentage of individuals reporting having borrowed to start, operate or expand a farm or business. This is one area in which we observe much bigger gender gaps in Belarus and Ukraine than in the rest of the countries analysed. However, when it comes to the general level of access to credit, there do not appear to be gender gaps in the share of men and women with an account at a financial institution (Demirguc-Kunt et al. 2015). However, there is substantial variation in the average share itself from 18 percent in Armenia to 72 percent in Belarus in 2014. We note that in the case of Belarus, the proportion of individuals that borrowed for business purposes is one of the lowest despite the high degree of financial services penetration, likely a reflection of the small size of its private sector.
Another important factor is that women have weaker networks to draw upon in establishing and running their businesses. Compared to male networks, female networks are less useful for business development (Welter et al. discussing Ukraine, Moldova and Uzbekistan, in UNECE 2010). In the case of Moldova, weak connections may also have been reflected in the lower probability of female-owned enterprises having been established via privatization (Aculai et al. 2009; NBS of the Republic of Moldova 2009), although this has been less of a problem in Ukraine (Aculai et al. 2009) and in Georgia, where 25 percent of privatized businesses in Georgia were female-owned although many of them were effectively managed by male family members (Jashi 2004). Women also face greater regulatory barriers and lack business education and training relative to men (Sattar 2012).
11 Despite this, it is noteworthy that almost 60 percent of the own-account workers and 75 percent of micro and small enterprise owners in the ACSN survey state that they would not stop their business in exchange for a fixed salary as an employee. 12 There seems to be a lot of variation across the countries in terms of innovative capacity. For example, in Armenia almost 50 percent of the formal SMEs allocate funds for research and development, whereas in Georgia and Azerbaijan this share stands at less than 10 percent (WB 2013a, WB 2013c).

16
Figure 15.
Source: The Gender Statistics database In part due to these constraints, women-owned SMEs tend to be smaller, even though their returns to scale are substantially larger, suggesting that they would benefit more from expansion (WB 2012). The smaller size translates into weaker overall performance measures even though, according to Sattar (2012), their profitability per unit of revenue is similar to businesses owned by men. Isakova et al. (2006) finds that in Ukraine women were more likely to break even rather than make a profit where other studies suggest that once they become entrepreneurs, women’s probability of success is as high as that of men (Atasoy 2015).
9.6
11.1
3.5 3.6
4.8 4.9
3.8
7.7
3.2
2.0
0.3
5.0
0.5
1.9
0.0
2.0
4.0
6.0
8.0
10.0
12.0
Armenia Azerbaijan Georgia Belarus Moldova Ukraine ECA
% o
f age
15+
Borrowed to start, operate, or expand a farm or business
male
female
18
29
40
72
19
53 51
15
26
40
72
19
5247
0
10
20
30
40
50
60
70
80
Armenia Azerbaijan Georgia Belarus Moldova Ukraine ECA
Account Penetration, Share with an Account
all adults
female
Note: 2014 data

17
More work is needed to understand why women are less likely to establish firms with employees, be larger in size, and function in the formal sector compared to men and more generally how to turn necessity entrepreneurship into opportunity entrepreneurship. Access to credit, weaker networks, and the lack of business knowledge are some of the constraints that female-headed businesses face. Alleviating these constraints can increase the potential for employment growth via the expansion of female-owned businesses. The expansion of female-owned businesses may have particularly strong impact on female employment because the female employment rates are higher in the firms owned by women, as the findings of the World Bank Enterprise Surveys demonstrate (Sattar 2012).
Rural development and agriculture Gender inequities are prevalent in rural areas and in the agricultural sector. In all six countries, more than a quarter of the population lives in rural areas, with this proportion varying between 25.7 percent in Belarus and 58.5 percent in Moldova (consistent with being the richest and the poorest countries among the six). Employment in rural areas is dominated by agriculture although its role has slightly diminished. For example, in Georgia, between 2004 and 2011 the share of agriculture in rural employment decreased from 60.5 percent to 58.3 percent, possibly suggesting the growth of non-agricultural employment opportunities. Nevertheless these numbers are very high compared to other countries in the transition region (FAO 2014).13 Such dependence on agriculture reveals the inherent vulnerability of the rural population’s livelihood to natural calamities. At the same time, it indicates a strong potential for non-agricultural or agriculture-related development in rural areas, which some of these countries have started to explore. Rural employment is further dominated by informal activities. For example, 81 percent of rural employment in Armenia is informal (UNECE 2012). Women’s role in rural areas and in agricultural employment varies widely, and is changing rapidly in some countries. The female share in the economically active population in agriculture ranges from only 16.2 percent in Armenia to 53.9 percent in Azerbaijan. This variation may reflect country-level differences in migration from rural areas and in the ageing of the population. These differences may also be due to the variation in the reporting of activities on the farm (FAO 2014; Lastarria-Cornhiel 2006). Women’s share in the economically active population in agriculture in the six countries declined between 1995 and 2010. This decline has been partly attributed to the shift in women’s activities from paid employment to unpaid activities as a result of the job losses that accompanied land privatization (USAID 2013) and to the higher share of young women leaving rural areas (UNDP, SIDA 2003).
There are important gender differences in the composition of agricultural employment. Overall, female agricultural workers tend to occupy less desirable forms of employment. In Armenia, Azerbaijan, Georgia, and Moldova own-account farmers and contributing family workers constitute a large share of agricultural employment. This share is higher for women than for men. During 2004-11, 72.41 percent of Georgian women employed in agriculture were contributing family workers compared to only 38.4 percent of men. Miluka (2009) finds that rural men in Moldova are more likely to work in agricultural 13 The averages are based on nationally representative household survey data for Albania, Bosnia & Herzegovina, Croatia, Kyrgyz Republic, Macedonia, Poland, Romania, Russia, Tajikistan, Turkey, and Ukraine, representing 74 percent of the region’s population of the region.

18
enterprises as wage workers. This evidence is also corroborated by 5.28 percent of Georgian men in agriculture being wage workers as opposed only 1.5 percent of women. In Belarus, where wage work is the predominant form of agricultural employment, only 74.1 percent of agricultural female workers are wage workers, compared to 87.3 percent of agricultural male workers (National Statistical Committee of the Republic of Belarus, 2010).
Women and men also tend to engage in different activities within agriculture, with most women engaged in lower skill, lower paid work. For example, women in rural areas in the southwestern part of Georgia are primarily occupied in low-value-added cattle farming and dairy production (Walker et al. 2014). The 2009 Moldovan farm survey results indicate that about 75.4 percent of women in the sample considered vegetable cultivation as their primary responsibility whereas 65.7 percent of men viewed the substantially higher-value added vineyard cultivation as their primary responsibility (Grigsby et al. 2012). In a related finding, the results of a 2013 agricultural survey in Georgia indicated that 1.5 percent of men in rural areas were engaged in agricultural processing activities compared to only 0.6 percent of women (Pellillo et al. 2014).
Women hold and manage smaller plots of land compared to their male counterparts. In Moldova, the average size of men’s plot is 1.21 hectares compared to 0.86 hectares managed by women (NBS of Moldova 2014). In Georgia, women’s proportion of land holdings (owned and leased) in terms of the total land in 2013 was 19 percent, which relative to the ownership shares, suggests that women’s plots are smaller than men’s.
Gender gaps in land ownership indicate relatively low disparities by world standards. In Georgia, Armenia, and Moldova, around 30 percent of land holders are female (e.g., female land ownership in the UK is 13.1 percent; Tajikistan, 17.1; Kyrgyzstan 12.4) (source: FAO Gender and Land Rights Database). In part this is due to the gender differences in the average age of the female and male populations as female land holders tend to be older than male land holders. In 2013, in Georgia 66 percent of female land holders were 60 years or older compared to 42 percent of men. Similarly, in Moldova, in 2011, 33 percent of female land holders were 65 years or older compared to 15 percent of male land holders (National Bureau of Statistics of the Republic of Moldova, 2014).
In sum, the picture of gender disparities in rural areas and in agriculture in the countries of the South Caucasus and Western CIS reveals that women are more likely to engage in low-value-added agricultural production compared to men. Similar to non-agricultural sectors, women operate on a smaller scale compared to men. Moreover, in the countries with a small wage employment share in agriculture, women are more likely to work as contributing family workers. In these countries in particular, the challenge will lie in improving income-earning opportunities of women by increasing the value added of female agricultural production in combination with the expansion in nonfarm earning opportunities through the development of agricultural cooperatives, agricultural processing, industry and social infrastructure, such as care provisioning.

19
Gender disparities in agriculture in Moldova
The data from the 2011 General Agricultural Census of the Republic of Moldova documents in greater detail gender disparities in rural women's access to assets, inputs and services. Women hold about one third of the agricultural land holdings in Moldova with their share ranging from 33 percent in UTA Gagauzia Region to the high of 41 percent in the Chisinau Municipality. The majority of male holders are 45- 54 years old whereas the majority of female land holders are 65 years old and above. In fact, in the oldest group women outnumber men. The vast majority of land holders have no education in agriculture, with this proportion slightly higher for females at 82.2 percent compared to men's 79.5 percent. Their time allocation differs as well. Women spend less time on agricultural activities than men do with 12.7 percent of women working eight hours or more compared to 15 percent of men. Women are also less likely to work as permanent or temporary workers on others' land holdings, as only 39 percent of permanent and temporary workers are females. Similar to non-agricultural entities, women manage smaller plots of land than men and on average have less livestock than men do. Furthermore, women own less than 12 percent of agricultural machinery and are less likely to produce crops for sale. In fact only 18 percent of female land holders produce industrial crops compared to 26 percent of male land holders. On the other hand, female land holders are more likely to be engaged in vegetable production. The majority of land of both men and women are occupied by cereal crops. Only about 1.6 percent of land holders are involved in income-earning non-agricultural activities and among them less than 30 percent are female. These data reveal the presence of gender gaps in many aspects of agricultural production.
Source: NBS of the Republic of Moldova (2014).
Unpaid work and care Similar to women in other countries, women in the countries of the South Caucasus and Western CIS carry the burden of unpaid work in the household, which limits their involvement in entrepreneurship and wage employment. The share of women who are not in the labour force who report domestic responsibilities as the primary reason behind their inactivity varies from nine percent in Belarus to 37 percent in Georgia. On the other hand, this share is negligible for men in the majority of the countries of South Caucasus and Western CIS (Fig. 16). Female entrepreneurs perform more unpaid work than their male counterparts. Among entrepreneurs, survey evidence from Moldova indicates that only six percent of female entrepreneurs reported not being involved in domestic activities in contrast to 22 percent of males. In Ukraine, these numbers stood at five percent and 37 percent for female and male respondents, respectively (Aculai et al. 2009).

20
Figure 16.
Time-use studies confirm that women bear most of the burden of unpaid work14. In Armenia, in 2008, women spent five times as much time on unpaid work as men, compared to three times as much time as men in Azerbaijan (Table 1). On the other hand, in Moldova, they spend 1.5 times as much time as men on unpaid work, which is below the OECD average of two. The gender gaps in time use are more pronounced in child care, possibly because proportionately more women stay at home to care for children. For example, women in Armenia spent six times and in Moldova 2.5 times as much time as men taking care of children.
Men work more hours than women. The gender disparity in paid work, too, is higher in Armenia and Azerbaijan and lower in Moldova. Women’s work hours are about 79 percent of men’s work hours in Moldova, whereas this proportion is 44 percent and 36 percent in Armenia and Azerbaijan, respectively. Despite the potentially positive interpretation of the low gap in time use in Moldova, it appears to be driven by both men and women working fewer hours than in other countries.
Despite these differences in the gender gaps in unpaid and paid time use in Armenia, Azerbaijan, and Moldova, the gender gap in total work hours is relatively low in all three countries (OECD 2012) but women still work more hours than men. In Moldova, this is because the gender gaps in both paid and unpaid work are low, and in Armenia and Azerbaijan this is because the high gender gaps in unpaid and paid work time mirror each other.
14 Time use surveys were available only for Armenia, Azerbaijan, and Moldova.
0.34
0.18
0.37
0.09
0.17
0.26
0.01
0.17
0.01 0.02 0.010.09
0.00
0.05
0.10
0.15
0.20
0.25
0.30
0.35
0.40
Armenia,2007
Azerbaijan Georgia Belarus, 2009 Moldova Ukraine
Share of Inactive Population due to Domestic Responsibilities, by gender 2012
female
male
source: UNECE database

21
Table 1. Paid and unpaid work time, hours.
Time Use Men Women FM Ratio Paid work and study Armenia (2004) 5.4 2.1 0.39 Armenia (2008) 5.45 2.4 0.44 Azerbaijan (2008) 4.7 1.7 0.36 Moldova (2011-12) 3.9 3.1 0.79 OECD 28 5.5 3.6 0.65 Unpaid work Armenia (2004) 1.1 5.8 5.27 Armenia (2008) 1.05 5.2 4.95 Azerbaijan (2008) 2.1 6.1 2.90 Moldova (2011-2012) 3.02 4.6 1.52 OECD 28 2.3 4.6 2.00 Childcare, main activity Armenia (2004) 0.1 0.7 7.00 Armenia (2008) 0.12 0.72 6.00 Moldova (2011-2012) 0.27 0.68 2.52 Total work Armenia (2004) 6.5 7.9 1.22 Armenia (2008) 6.5 7.6 1.17 Azerbaijan (2008) 6. 8 7.8 1.15 Moldova (2011-12) 6.92 7.7 1.11 OECD 28 7.8 8.2 1.05
Note: these values correspond to average time spent on activities, which is the product of the participation rate and the average time spent by those undertaking the activity.
The breakdown by location reveals that the gender gap in time use is lower in rural than in urban areas. The gap is especially prominent in unpaid work time even though men and women in rural areas spend more time on unpaid work time than in urban areas. This finding does not necessarily imply greater sharing of household responsibilities in rural areas but may simply be a reflection of the greater degree of gender specialization in unpaid work activities in rural areas (Walker et al. 2014). On the other hand, the gender gap in child care is higher in rural areas than in urban areas. A more careful look at the data reveals that this finding is due to men in rural areas being less likely to participate in child care. The rural men who do participate in child care spend more time taking care of their children than their urban counterparts. Women in rural areas spend less time and are less likely to participate in child care. Furthermore, evidence from Moldova indicates that parents in rural areas spend less time on child enrichment and educational activities than their urban counterparts (NBS of the RM 2013). However, urban/rural comparisons in child care have to be made with caution if secondary child care data are not available because the share of secondary child care may be higher in rural areas.

22
Table 2. Rural/Urban Breakdown of Time Use
rural urban Men Women
Men Women FM ratio Men Women
FM ratio RU ratio
RU ratio
Armenia (2008) paid work and study 5.68 2.35 0.41 4.96 2.43 0.49 1.15 0.97 unpaid work 1.47 5.93 4.03 0.83 4.88 5.88 1.77 1.22 total 7.15 8.28 1.16 5.79 7.31 1.26 1.23 1.13 primary childcare (AxB) 0.08 0.58 7.25 0.13 0.77 5.92 A: proportion taking care of children (percent)
8 34
15 40
B: time spent on childcare by individuals who take care of children (hours)
1.1 1.75 1.59 0.93 1.93 2.08
Source: Armenia Time Use Report for 2008.
In addition to the general availability of labour market opportunities, the participation of women with children in labour markets depends on the available social infrastructure and on the affordability of market substitutes. The available data indicate that in Belarus and Moldova all children three to five years of age are enrolled in pre-school. In Ukraine, the enrolment rate stands at 80 percent. The countries of the South Caucasus, on the other hand, trail far behind with the pre-primary enrolment rates ranging from about 25 percent in Azerbaijan to close to 60 percent in Georgia. Belarus, Moldova and Ukraine also lead in the day-care enrolment rates of children under three. The availability of the universal pre-primary education in Belarus and Moldova and close to universal pre-primary education in Ukraine may have enabled the high wage employment rates among women in these countries.
Figure 17.
0
20
40
60
80
100
120
1990 2000 2005 2006 2007 2008 2009 2010 2011 2012 2013 2014
School enrolment, 3- 5, preprimary (% gross)
Armenia
Azerbaijan
Georgia
Belarus
Moldova
Ukraine
ECA (all income)
source:UNESCO database

23
Figure 18.
In a comprehensive review of policies aimed at raising women’s economic empowerment, Buvinić et al. (2013) find that programmes providing access to affordable and reliable child care, childcare subsidies and public childcare provisioning are an effective approach for improving women’s labour market outcomes and earnings in developing and transition economies. Fong and Lokshin (2000) find that in Romania providing childcare vouchers increased the number of working mothers and raised household income. Lokshin (1999) compares the impact of family allowances, wage subsidies and childcare subsidies on maternal employment in Russia. He finds that childcare subsidies are the most effective at increasing maternal employment in terms of the number of work hours and the likelihood of wage employment, and at raising household income.
Evidence is also supportive of the positive employment impact of publicly provided preschool programmes (Barros et al. 2011). Such programmes have the additional benefit of direct employment creation and the accompanying increase in the demand for supporting jobs. İlkkaracan et al. (2015) and Antonopoulos and Kim (2011) investigate the direct and indirect effects of social care sector expansion and find that it supports decent employment creation, generates pro-women job allocation, and reduces poverty.
The effect of childcare provisioning is positive not only on paid female employment, but also on female entrepreneurship, as it allows women to expand their businesses and hence address the small size constraint, which is one of the main reasons for the weaker performance of female-owned businesses (Johnson 2005, cited in Kabeer 2012).
Human capital The enrolment rates in the South Caucasus and Western CIS are generally high among boys and girls and there is close to full gender parity at the primary and secondary levels. At the tertiary level, women represent the majority of students. Azerbaijan has made strong gains in the female share of tertiary students reaching parity at the beginning of 2000s.
0
5
10
15
20
25Enrolment Rate of Children under 3, per 100 children
Armenia
Azerbaijan
Georgia
Belarus
Moldova
Ukraine
source: UNECE database

24
Figure 19.
Source: The Gender Statistics database
However, this picture at the tertiary level masks high degree of gender segregation by subject. For example, women represent more than 70 percent of students in education and more than 65 percent of students in health and welfare15 (See Tables in the Appendix). Unlike in the rest of the transition region, women are significantly underrepresented in engineering, manufacturing, and construction, especially in Azerbaijan, where less than 20 percent of tertiary students in these subjects are female (WB 2012). On the other hand, Azerbaijani female students are equally represented in agriculture whereas in the rest of the group, the female share of students studying agriculture is less than 35 percent. There is considerable variation by country in Social Studies, Business and Law and Science, with the share varying from about 32 percent in Azerbaijan to about 75 percent in Belarus. In recent years, women have been almost equally represented in the sciences. In Georgia, women were overrepresented in sciences but their share decreased sharply in a span of seven years from almost 70 percent during 2002-03 academic year to below 50 percent during 2009–10 academic year.
Except for the equal representation in sciences, this picture is similar to the findings from European countries (Flabbi 2011). It has been well established that gender differences in the fields of study translate into gender differences in labour market outcomes in the form of industrial segregation by gender and gender wage gaps (Flabbi 2011). Therefore, addressing gender asymmetries in the educational composition of tertiary education today is imperative to reducing industrial segregation by gender and wage gaps tomorrow.
Align tertiary education with the private sector economy to improve labour markets, employment, and growth. A pressing issue with the utilization of human capital in transition countries has been the
15 The data for Moldova are unavailable.
5010
015
050
100
150
1990 2000 2010 2020 1990 2000 2010 2020 1990 2000 2010 2020
ARM AZE GEO
BLR MDA UKR
primary secondarytertiary
year
Graphs by List of countries
Ratio of female to male enrollment, by education level

25
mismatch between the skills and training received at tertiary institutions and those demanded by the economy, especially in the private sector. It is a striking fact that despite a high share of the workforce with tertiary education, employers in these countries consistently cite inadequate skills of workers as a major obstacle to the operation and growth of their enterprises (BEEPS; Rutkowski 2013). Using the data from the World Bank’s Skills Toward Employment and Productivity (STEP) survey for Armenia, Georgia, Macedonia and Ukraine, Kupets (2015) investigates the incidence and determinants of the education-job mismatch. She finds that 30 percent of urban workers in Armenia, Georgia, and Ukraine are overeducated for their jobs. These rates are comparable to those in more developed economies.
However, unlike those economies, in Armenia, Georgia, and Ukraine, the mismatch takes place not only at the beginning of the working life but all throughout it, albeit for different reasons. For older workers, the culprit appears to be the difference between the skills and knowledge acquired during the Soviet period and the current demands of the economies. For younger workers, it is the limited employment opportunities generated by firms for whom having higher education no longer carries accurate signals about workers’ abilities.
The female incidence of over-education is higher in Ukraine and lower in Armenia and Georgia. Kupets (2015) suggests that women in Ukraine use education to compensate for their relative lack of experience that stems from their child-rearing responsibilities. In Armenia and Georgia, on the other hand, their traditional role as a breadwinner may be forcing men to accept jobs for which they are overeducated. These conjectures merit careful investigation. Nevertheless, the findings reveal considerable challenges that the countries of South Caucasus and Western CIS face in restructuring their education systems and their links to labour markets.
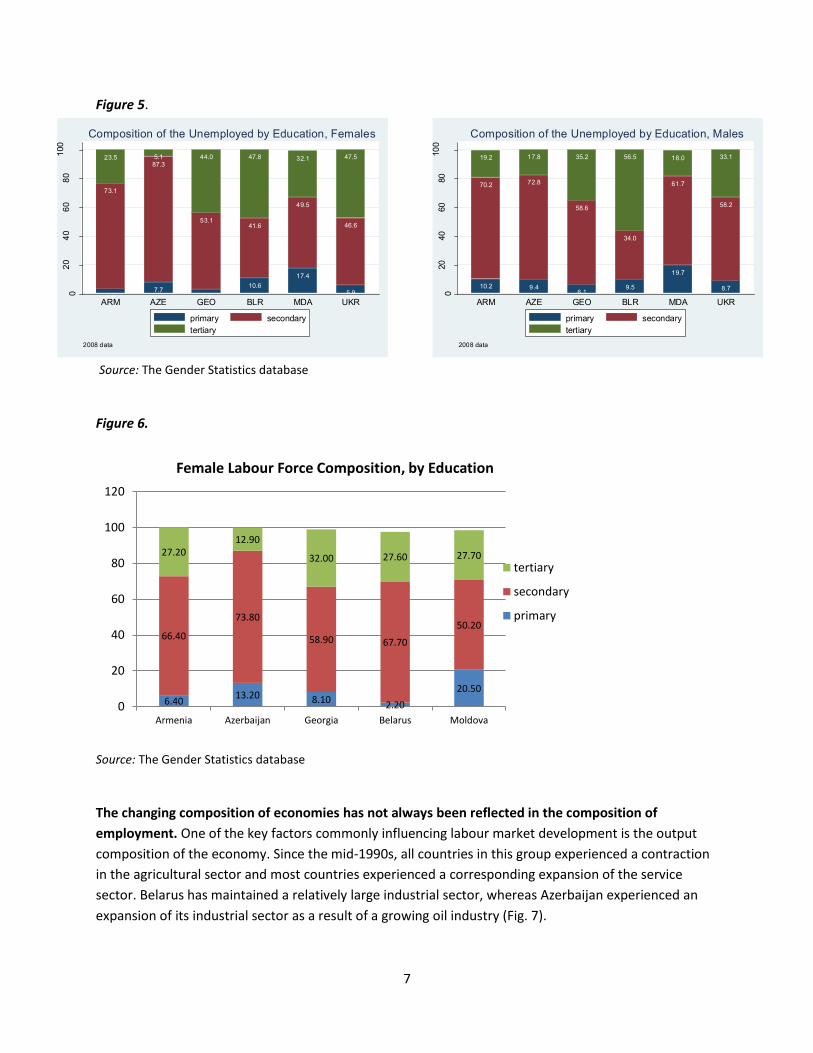
Gender pay gaps There is a large variation in the gender pay gap16 with a visible difference between the more-equal Western CIS countries and the less-equal South Caucasus countries. There is a generally downward trend in the magnitude of the gap since 2000 in all countries, except for Belarus and Azerbaijan. In the case of Azerbaijan, the spike in the gender pay gap observed since 2009 is particularly sharp (Fig. 20). The gender pay gap in the region can be partly attributed to the industrial and occupational segregation and fewer hours of employment among women, although the majority of the gap remains unexplained, arguably due to discrimination in the labour markets (World Bank 2012). Beyond the analysis of the gap at the mean of the distribution, we find the presence of the changes in the shape of the gender gap across wage distribution. Ganguli and Terrell (2005) find that the contraction in the gender wage gap in Ukraine that took place between 1986 and 2003 was primarily caused by the reduction in the gender wage gap at the bottom of the distribution (i.e., wages for the lowest paid men and women became closer).
On the other hand, Pignatti (2012) assesses a more recent 2003–07 period in Ukraine and finds that the continued contraction in the gap was driven by the drop in the upper part of the distribution (i.e.,
16 Here, the gender pay gap is defined as the difference between men’s and women’s average earnings from employment expressed as a percentage of men’s average earnings.
26
between the highest paid men and women), highlighting a shift that appears to have taken place between the two periods. Khitarishvili (2013) finds that the contraction in the gender wage gap in Georgia between 2004 and 2007 took place primarily at the top of the distribution, driven by rising wages in the public sector. After 2008, on the other hand, the reduction took place primarily at the bottom of the distribution due to the impact of the 2008 recession.
In contrast to the contractions in Ukraine and Georgia, Pastore and Verashchagina (2011) demonstrate that the gender wage gap in Belarus more than doubled between 1996 and 2006 and did so mostly at the bottom of the distribution. This increase was due to the higher level of industrial segregation. We emphasize that these analyses provide only a partial picture of the gender earnings gaps because they focus on wage workers only, excluding from the analysis as much as 60 percent of the employed workforce as is the case in Georgia. The difficulties with earnings measurement among the own-account workers and a high proportion of contributing family workers highlight the need to evaluate gender gaps using other measures.
Figure 20.
Source: UNECE database
To that end, we first supplement the gender pay gap numbers with the gender earnings gap using earned income estimates from the WEF Global Gender Gap Rankings (2014). Azerbaijan and Georgia remain the most gender unequal countries (Table 3). However, the rankings of other countries change. For example, Tajikistan is tied in the third place with Belarus.
We also consider the measure of wage equality for similar work, which reveals very similar levels of inequality. This particular measure seems to indicate that the extent to which gender discrimination is responsible for the gender gap appears to be similar among these countries. This finding suggests that the main reason for cross-country variation lies in the differences in observed characteristics, such as industrial and occupational segregation and potentially hours of work.
2030
4050
60
perc
enta
ge
2000 2005 2010 2015year
ARM AZEGEO BLRMDA UKR
Gender Pay Gap in Monthly Earnings

27
Table 3. Different measures of gender gap in earnings.
Gender Pay Gap (UNECE, 2012)
Earned Income Gap (WEF,2014)
Wage Equality for Similar Work, F/M ratio (WEF, 2014)
Armenia 35.6 (6) 41 (4) .66 Azerbaijan 53.21 (9) 56 (8) .74 Georgia 39.8 (7) 55 (7) .72 Belarus 25.5 (3) 37 (3) Moldova 25.62 (4) 23 (1) .70 Ukraine 22.23 (2) 35 (2) .69 Kazakhstan 6.8 (1) 42 (5) .71 Kyrgyz Republic 26.71 (5) 46 (6) .72 Tajikistan 50.92 (8) 37 (3) .71
Notes: 1 2013; 2 2011; 3 2010; no data available for Turkmenistan and Uzbekistan.
Finally, we look at the gender gap in the share of contributing family workers (i.e., self-employed who receive no compensation while contributing to family businesses). We find that in countries with high gender wage gaps, such as the countries of South Caucasus, the share of contributing family workers is higher for women than for men. For example, it is 25 percent for women in Armenia, compared to 11 percent for men. This implies that proportionately more women are not remunerated for the work that they do, supporting the hypothesis that gender inequalities in earnings are pervasive in all forms of employment in the region.
In sum, the empirical evidence reveals a range of outcomes in the gender wage gap and the changes in the distribution of the gender wage gap in the transition region, underscoring the complex interplay between economic and institutional mechanisms. Nevertheless, these studies underscore that a large portion of the gender wage gap remains unexplained, pointing to labour market discrimination as a cause of wage disparities.
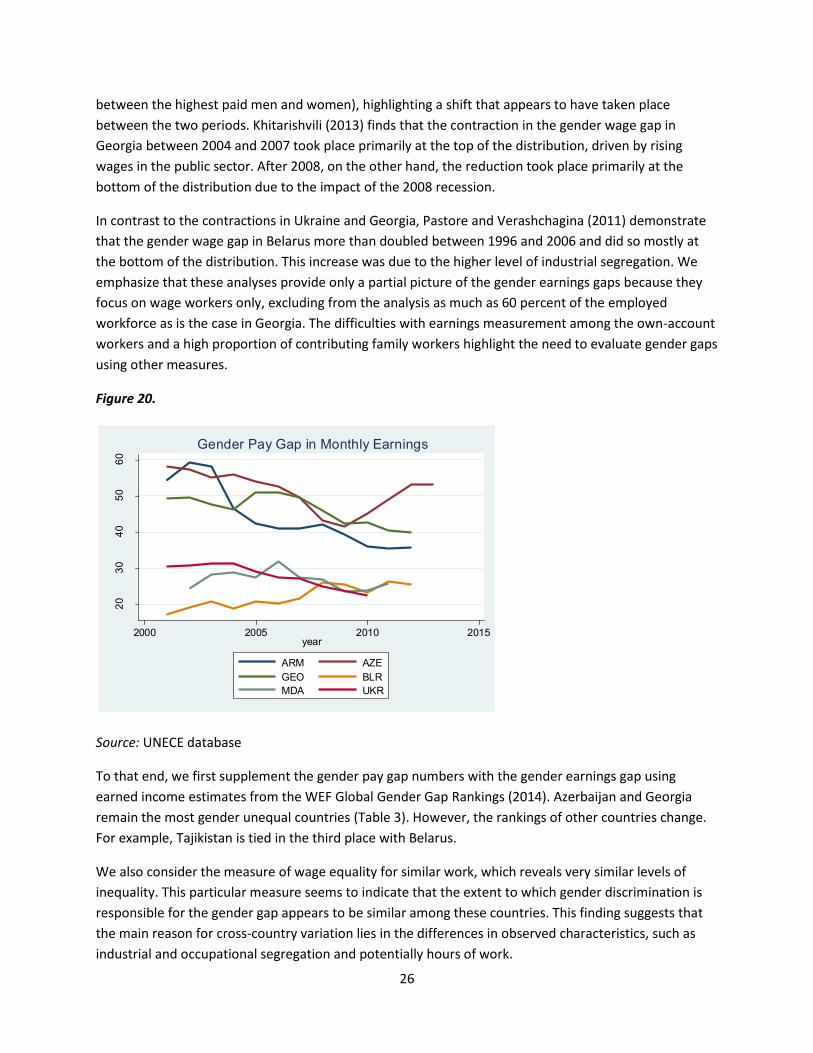
Migration Migration has enabled many households to escape poverty and sustain their livelihoods. The gender makeup of long-term migrants varies by country (Fig. 21). In Ukraine, Azerbaijan, and Moldova, long-term migration has been mostly a female phenomenon, whereas in the case of Armenia and Georgia, the majority of long-term migrants have been men. Belarus experienced large shifts in the last five years from mostly women to mostly men being long-term migrants. Behind this broad picture lies wide variations in the gender makeup according to the destination of migrants as well as their regional origin within countries. For example, in contrast to the overall dominance of female migrants in the case of Moldova, the Moldovans in Italy are predominantly men (Marchetti, et al. 2014). At the same time, although men are more likely to emigrate in Georgia than women, Zurabishvili (2013) documents that the majority of emigrants from the village of Tianeti in Georgia are women. These numbers reflect long-term emigration; the picture among short-term migrants may be different, although we know, for example, that similar to long-term emigrants, seasonal migrants from Armenia are predominantly male (Liebensteiner 2014).
28
Figure 21.
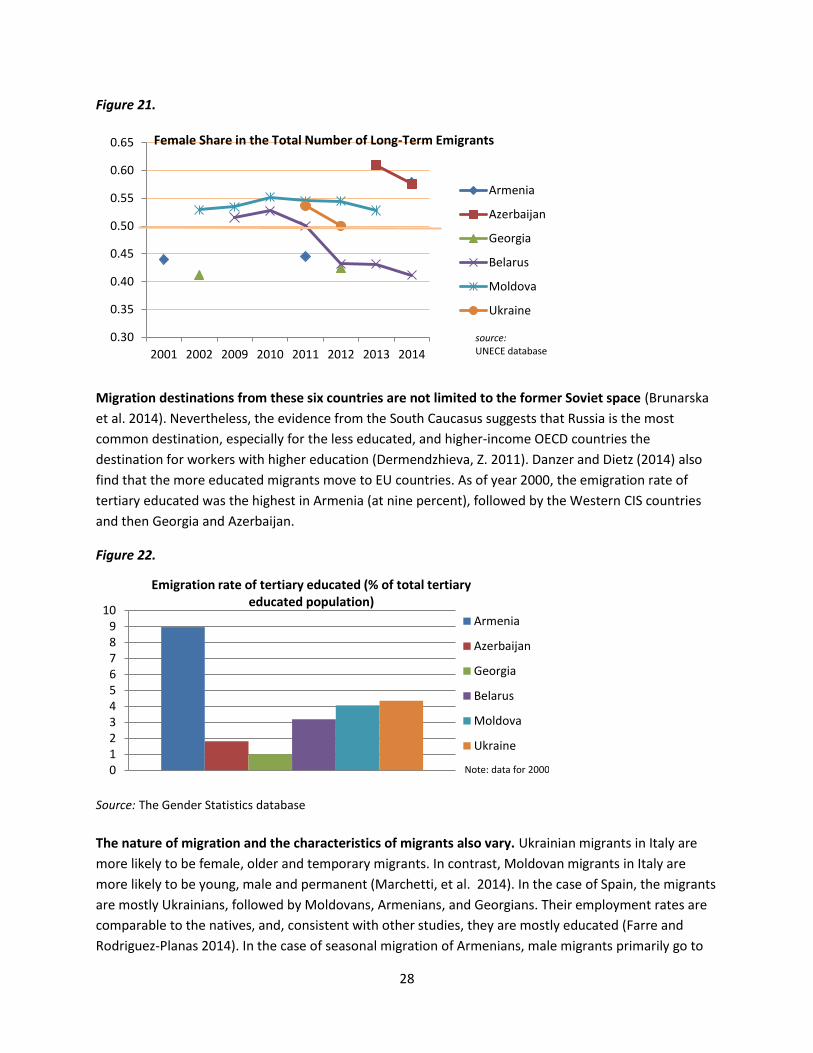
Migration destinations from these six countries are not limited to the former Soviet space (Brunarska et al. 2014). Nevertheless, the evidence from the South Caucasus suggests that Russia is the most common destination, especially for the less educated, and higher-income OECD countries the destination for workers with higher education (Dermendzhieva, Z. 2011). Danzer and Dietz (2014) also find that the more educated migrants move to EU countries. As of year 2000, the emigration rate of tertiary educated was the highest in Armenia (at nine percent), followed by the Western CIS countries and then Georgia and Azerbaijan.
Figure 22.
Source: The Gender Statistics database The nature of migration and the characteristics of migrants also vary. Ukrainian migrants in Italy are more likely to be female, older and temporary migrants. In contrast, Moldovan migrants in Italy are more likely to be young, male and permanent (Marchetti, et al. 2014). In the case of Spain, the migrants are mostly Ukrainians, followed by Moldovans, Armenians, and Georgians. Their employment rates are comparable to the natives, and, consistent with other studies, they are mostly educated (Farre and Rodriguez-Planas 2014). In the case of seasonal migration of Armenians, male migrants primarily go to
0.30
0.35
0.40
0.45
0.50
0.55
0.60
0.65
2001 2002 2009 2010 2011 2012 2013 2014
Female Share in the Total Number of Long-Term Emigrants
Armenia
Azerbaijan
Georgia
Belarus
Moldova
Ukraine
source:UNECE database
0123456789
10
Emigration rate of tertiary educated (% of total tertiary educated population)
Armenia
Azerbaijan
Georgia
Belarus
Moldova
Ukraine
Note: data for 2000.

29
closer countries (e.g., Russia, and work in low-skill occupations, such as construction) (Liebensteiner 2014).
Migration influences household dynamics. In the case of Armenia, men’s migration has had diverse effects on the lives of their wives. These women took on additional responsibilities, but their power dynamics and status do not appear to have changed. Therefore, arguably, gender inequalities (i.e., male breadwinners and women subordinate in the household) have been reinforced (Menjivar and Agadjanian 2007). On the other hand, the impact on the elderly due to migration appears to be positive in Moldova (Bohme et al. 2015). Moreover, siblings are more likely to stay back to provide care for the elderly, as has been found in the case of Moldova (Stohr 2015).
The impact of migration on local incomes and economic development is mixed. Dermendzhieva (2011) finds that migration has raised local incomes and demand and, in the case of Armenia, increased the likelihood of running a family business. In the case of Moldova, Blouchoutzim and Nikas (2014) find a positive relationship between the remittances and consumption. Also for Moldova, Bouton et al. (2011) find that local wages increase in response to emigration although the rate of increase varies by sector. However, Brown et al. (2013) find that in the case of Azerbaijan, remittances are negatively associated with financial deepening and are found to “deter bank intermediation and use of formal banking services.” Hence the evidence on the impact of remittances on economic development is mixed.
In contrast to international migration, internal migration in the countries of the South Caucasus and Western CIS has been low (WB 2012). However, during 1990-2010, women were more likely to move internally than men and they did so for reasons that differed from men’s. For example, until recently in Ukraine proportionately more internal female migrants moved to urban centres to study in higher education institutions whereas for men the dominant reason was employment opportunities (WB 2012). The ongoing military conflict has changed these dynamics and added another complicated dimension to the challenge of gainful job creation.
Conclusions and policy proposals
Gender disparities limit the prospects for robust, sustainable and inclusive growth in the countries of Central Asia, South Caucasus and Western CIS. The following are the key findings of the paper:
x Labour force participation, employment and unemployment: The labour force participation and employment rates for men and women have either remained stable or declined over the last two decades. However, the rates for females remain lower their male counterparts.
x Employment composition: Women tend to be underrepresented as both wage earners and as employers. In the countries with high rates of self-employment (e.g., Armenia, Georgia and Azerbaijan), women are overrepresented in the category of contributing family workers. Hence, female employment is less secure.
x Wage gaps: Women earn at most 78 percent (Ukraine) and as little as 50 percent (Azerbaijan) as their male counterparts. Some of the wage gaps are due to industrial and occupational segregation or women working fewer hours than men. However, a large portion of the gap could be attributed to gender discrimination. While gender wage inequality has improved in

30
most countries in the region, it has increased in Belarus, Uzbekistan, and, more recently, Azerbaijan.
x Entrepreneurship: Female entrepreneurs face greater barriers in accessing credit and tend to have weaker networks in the region. Female businesses tend to be smaller than those of their male counterparts, even though female-owned businesses have greater scale economies and employ proportionately more women. Thus, encouraging female-owned business expansion can have a greater impact on overall growth and specifically on female employment.
x Agriculture: Women are less likely to be landowners than men. They typically own smaller plots of land compared to men and are more likely to be contributing family workers. Women tend to engage in the agricultural production aimed at own consumption, negatively affecting their earning capacity, whereas men tend to engage in the production of cash crops.
x Time use: Gender disparities are present in both paid and unpaid work. They vary from moderate (Moldova) to high (Armenia and Azerbaijan). However, in terms of total work time women spend more time working than men. Gender gaps in time use are particularly large in child care and they tend to be higher in urban areas compared to rural areas.
x Education: High degree of gender specialization by subject contributes to industrial segregation. There is relative gender parity in educational attainment at primary and secondary levels. At the tertiary level, the female share in education is more than a half. However, there is substantial variation in the share of women by subject, underscoring the high degree of specialization that reinforces the industrial and occupational segregation by gender. Women’s returns to education tend to be higher than men’s.
x Migration: Migration has important implications for the economic and demographic future of the region. Gendered patterns of migration vary widely. In most countries of the region, external migration appears to be a male phenomenon although there is considerable regional variation by gender within countries. Less educated migrants move within the former Soviet space whereas more educated migrants are more likely to leave the region altogether. Internal migration is relatively low, with females moving to urban areas primarily to study and males migrating to cities to work.
Reducing these gender inequalities has the potential to contribute to inclusive growth and sustainable development in the countries of the South Caucasus and Western CIS and to the achievement of the Sustainable Development Goals of poverty and inequality reduction (WB 2012, Elborgh-Woytek et al. 2013, Woetzel et al. 2015). To achieve such reductions, a comprehensive evidence-based strategy is needed that complements supply-side interventions with demand-side measures for decent employment creation (Kabeer 2012). Such a strategy will include the following elements:
1. Remove legal and regulatory barriers to women’s economic empowerment. Although substantial progress has been made, pervasive gender-based occupational restrictions preventing women from engaging in employment and entrepreneurship remain in the region.
2. Implement policies to address women’s care and domestic responsibilities to promote decent employment opportunities, increase productivity and earnings. The role of women’s care and domestic responsibilities in limiting women’s engagement in labour markets as workers and as entrepreneurs has to be an integral part of a strategy to reduce gender inequality. Programmes

31
providing access to affordable and reliable childcare, childcare subsidies and public childcare provisioning are effective approaches for improving women’s labour market outcomes and earnings in developing and transition economies (Buvinić et al. 2013; İlkkaracan et al. 2015; Antonopoulos and Kim 2011).
3. Other constraints preventing the expansion of female-owned businesses must be addressed. This is because female-owned businesses tend to have greater economies of scale and hire proportionately more women.
4. Improve the productivity of agriculture and rural economy. A large proportion of the workforce in most countries of the region is employed in agriculture and in rural areas. Women in rural areas are proportionately more likely to be contributing family workers. Improving the productivity of agriculture will be key to changing gender gaps in the composition of employment in rural areas.
5. Harness the job creation potential of green economic policies. The countries of the South Caucasus and Western CIS are in a strong position to use the job creation potential of the green economy to reduce the industrial segregation by gender.
6. Promote gender equality in tertiary education by linking education and green economy initiatives. For this to happen, the demand-side efforts aimed at the expansion of the green economy have to be matched by steps aimed at promoting greater gender balance in tertiary education.
7. Include a strong impact evaluation element into the proposed policies. Impact evaluation elements need to be incorporated into the policy design. The impact evaluations can then contribute to providing a new evidence-based framework for how best to empower women (Buvinić et al. 2013, O’Sullivan 2014).
8. Make women’s empowerment a central concern in the national and regional dialogue for inclusive growth. The achievement of these goals is only possible if active measures to enhance women’s economic empowerment become of central concern to the policy dialogue for inclusive growth.

32
References
Academic Swiss Caucasus Net (2014) “Emergence of Entrepreneurship in Georgia: Midterm Results” Report.
Aculai, E., Bulgac A., Gryga V., Krasovksa O., and O. Linchevskaya (2009) “Researching the Gender Aspect in Business Development (the Case of Moldova, Ukraine and Belarus)” Lex ET Scientia International Journal 16(1).
Antonopoulos, R., and K. Kim (2011) “Public Job-creation Programs: The Economic Benefits of Investing in Social Care View Less: Case Studies in South Africa and the United States” Working Paper # 671, May.
Atasoy, H. (2015) “Latent Entrepreneurship in Transition Economies” IZA World of Labor.
Blouchoutzim A. and C. Nikas (2014) “Emigrants’ Remittances and Economic Growth in Small Transition Economies: The Cases of Moldova and Albania” East-West Journal of Economics and Business, 17 (2), pp. 97 – 117. Bohme, M.H., R. Persian and T. Stohr (2015) “Alone but Better Off? Adult Child Migration and Health of Elderly Parents in Moldova” Journal of Health Economics, 39, pp. 211 – 227, January. Bouton, L., Paul, S., and E.R. Tiongson (2011) “The Impact of Emigration on Source Country Wages: Evidence from the Republic of Moldova” The World Bank Policy Research Working Paper # 5764.
Brown, J. D., Earle J., Gimpelson V., Kapeliushnikov, R., Lehmann, H., Telegdy, Á., Vantu, I., Visan, R., and A. Voicu (2006) “Nonstandard Forms and Measures of Employment and Unemployment in Transition: A Comparative Study of Estonia, Romania and Russia” IZA Discussion Paper 1961.
Brunarska, Z., Nestorowicz, J., and S. Markowski (2014) "Intra- vs. extra-regional migration in the post-Soviet space" Eurasian Geography and Economics, 55(2), pp. 133 - 155. Danzer, A. and B. Dietz (2014) “Labour Migration from Eastern Europe and the EU’ Quest for Talents” Journal of Common Market Studies, 52(2), pp. 183 – 199, March.
Demirgüç-Kunt, A., Klapper, L., Singer, D., and P. Van Oudheusden (2015) "The Global Findex Database 2014: Measuring Financial Inclusion around the World" WB Policy Research Working Paper7255, April.
Dermendzhieva, Z. (2011) "Emigration from the South Caucasus: who goes abroad and what are the economic implications?" 23(3), pp. 377 - 398.
Elborgh-Woytek, K., Newiak, M., Kochhar, K., Fabrizio, S., Kpodar, K., Wingender, P., Clements, B., and G. Schwartz (2013) “Women, Work, and the Economy: Macroeconomic Gains from Gender Equity” IMF Staff Discussion Note 13/10, September.
FAO (2011) “The State of Food and Agriculture: Women in Agriculture, Closing the Gender Gap for Development 2010 - 2011” FAO.

33
FAO (2014) “Rural Women in Eastern Europe and Central Asia.”
Farré, L., and N. Rodríguez-Planas (2014) “Immigrants from Eastern Partnership (EaP) Countries in Spain” IZA Journal of European Labor Studies, 2014, 3(1), August.
Flabbi, L. (2011) “Gender Differences in Education, Career Choice and Labor Market Outcomes on a Sample of OECD countries” background paper for the World Development Report 2012.
Ganguli I., and K. Terrell (2006) “Institutions, Markets and Men's and Women's Wage Inequality: Evidence from Ukraine” Journal of Comparative Economics, 34(2), pp. 200 – 227.
Grigsby, M., Español, E., and David J. O’Brien (2012) “The Influence of Farm Size on Gendered Involvement in Crop Cultivation and Decision-making Responsibility of Moldovan Farmers” East
European Countryside, 18.
Guliev,F. (2015) “The Informal Economy in Azerbaijan,” Caucasus Analytical Digest, 75, July.
İlkkaracan, İpek, Kijong Kim, and Tolga Kaya. 2015 “The Impact of Public Investment in Social Care Services on Employment, Gender Equality, and Poverty: The Turkish Case”, Research Project Report. Levy Economics Institute of Bard College. August 2015.
Jashi, Ch. (2004) “Development of Women’s Entrepreneurship: the Case of Georgia” in UNECE (2004) Access to Financing and ICT for Women Entrepreneurs in the UNECE Region: Challenges and Good
Practices, Geneva and New York.
Kabeer, N. (2012) “Women’s Economic Empowerment and Inclusive Growth: Labor Markets and Enterprise Development” SIG Working Paper 2012/1.
Khitarishvili, T. (2013) “Evaluating the Gender Wage Gap in Georgia, 2004–2011” Levy Economics Institute of Bard College Working Paper # 768, July.
Kupets, O. (2015) “Education in Transition and Job Mismatch: Evidence from the Skills Survey in non-EU Transition Countries” KIER Discussion Paper Series.
Lastarria-Cornhiel, S. (2006) “Feminization of Agriculture: Trends and Driving Forces.” Rimisp-Latin American Center for Rural Development, Santiago, Chile. Liebensteiner, M. (2014) “Estimating the Income Gain of Seasonal Labor Migration” Review of Development Economics, 18(4), November, pp. 667 – 680.
Marchetti, S., Piazzalunga, D. and A. Venturini (2014) “Does Italy Represent an Opportunity for Temporary Migrants from the Eastern Partnership Countries?” IZA Journal of European Labor Studies, 3.
Menjívar, C., and V. Agadjanian (2007) “Men's Migration and Women's Lives: Views from Rural Armenia and Guatemala,” Social Science Quarterly 88(5), pp. 1243–1262, December.

34
National Bureau of Statistics of the Republic of Moldova (2009) “Women and Men in the Republic of Moldova: Analysis from a Territorial Perspective.”
National Bureau of Statistics of the Republic of Moldova (2014) “Women and Men in Agriculture in the Republic of Moldova” Statistical Booklet.
National Bureau of Statistics of the Republic of Moldova (2014) “Women and Men in Agriculture in the Republic of Moldova” Statistical Booklet.
National Statistical Committee of the Republic of Belarus (2010) “Women and Men of the Republic of Belarus: Statistical Book.”
National statistics Service of the Republic of Armenia (2008) "Report on Time Use Sample Survey in the Republic of Armenia."
National Statistical Service of the Republic of Armenia (2009) “Report on Time Use Survey in the Republic of Armenia” NSSRA with the assistance of Statistics Sweden and the financial support of SIDA.
National Statistical Service of the Republic of Armenia (2014) “Women and Men in Armenia.”
OECD (2011) “Development in Eastern Europe and the South Caucasus: Armenia, Azerbaijan, Georgia, Republic of Moldova, and Ukraine” OECD: Paris and Washington
OECD (2011) “Development in Eastern Europe and the South Caucasus: Armenia, Azerbaijan, Georgia, Republic of Moldova, and Ukraine” OECD: Paris and Washington.
OECD (2011) “How do People in the Asia/Pacific Region Spend Their Time?” in Society at a Glance Asia/Pacific Edition.
OECD (2012) “Closing the Gender Gap: Act Now” OECD.
Pastore, F. and Verashchagina, A. (2011) ”When does transition increase the gender wage gap?” Economics of Transition, 19, pp. 333–369.
Pellillo A., Kochlamazashvili I., and N. Kakulia (2014) “Agriculture and Rural Development in Western Georgia: A Baseline Assessment” December.
Pignatti, N. (2012) “Gender Wage Gap Dynamics in a Changing Ukraine” IZA Journal of Labor and Development, 1.
Schneider, F., A. Buehn and C.E. Montenegro (2010) “Shadow Economies All Over the World: New Estimates for 162 Countries from 1999 to 2007”
Smallbone, D., and F. Welter (2010) “Entrepreneurship and Government Policy in Former Soviet Republics: Belarus and Estonia Compared” Environment and Planning C: Government and Policy, 28, pp. 195 – 2010.

35
Stöhr, T. (2015) “Siblings’ interaction in migration decisions: who provides for the elderly left behind?“ J Journal of Population Economics, 28(3).
UNDP, SIDA (2003) “Gender Issues in Ukraine: Challenges and Opportunities” Kyiv.
UNECE (2012) “Promoting Gender Equality and Women’s Economic Empowerment on the Road to Sustainable Development: Good Practices from the UNECE Region.”
UNFPA (2014) “Analytical Research on Women’s Participation in the Labour Force in Ukraine.”
USAID (2013) “Gender Analysis of Agriculture in the Europe and Eurasia Region.”
Walker, J., Berekashvili N., and N. Lomidze (2014) “Valuing Time: Time Use Survey, the Capabilities Approach, and Gender Analysis” Human Development and Capabilities, 15(1), pp. 47 – 59.
Woetzel, J., Madgavkar, A., Ellingrud, K., Labaye, E., Devillard, S., Kutcher, E., Manyika, J., Dobbs, R., and M. Krishnan (2015) "How advancing women’s equality can add $12 trillion to global growth" McKinsey Global Institute Report, September.
World Bank, Arias O., S., and C. Sanchez-Paramo “Back to Work: Growing with Jobs in Europe and Central Asia.”
World Bank, Kuriakose, S. ed. (2013a) “Fostering Entrepreneurship in Armenia”,
World Bank, Kuriakose, S. ed. (2013b) “Fostering Entrepreneurship in Azerbaijan” World Bank.
World Bank, Kuriakose, S. ed. (2013c) “Fostering Entrepreneurship in Georgia” World Bank.
World Bank, Sattar, S. ed. (2012) “Opportunities for Men and Women: Emerging Europe and Central Asia,”
Zurabishvili, T. (2013) “Migration Network of Labor Migrants from Tianeti” unpublished manuscript.
Data sources used: WB Gender Statistics Database, UNECE Gender Statistics Database, FAO Gender and Land Rights Database http://www.fao.org/gender-landrights-database accessed Oct. 10 2015.

36
Appendix
Table A1. Selected data on women’s labour market participation and remuneration.
Female share of pop
Rural share of pop
Female share of economically active population
Female share of economically active pop in ag
Ag share of economically active women
Share of rural hh that are female headed
Female share of ag holders
Gender wage gap in ag
1995 2010 1995 2010 1995 2010 1995 2010 1995 2010 latest Armenia 52.6 53.4 33.7 36.3 48.4 50.2 25.9 16.2 8 3 33.1 30.0 91.4 Azerbaijan 51.1 51.1 47.8 47.8 47.3 47.9 53.8 53.9 33.1 25.6 24.4 105.4 Georgia 52.5 53.0 46.1 47.0 47.1 46.7 42.3 36.2 20.5 11.7 29.1 76.6 Belarus 53.1 53.5 32.1 25.7 48.4 49.1 28.8 18.7 9.6 3.4 92.5 Moldova 52.2 52.5 53.7 58.8 48.7 52.6 37.2 30.0 21.0 8.5 30.8 36.3 76.1a Ukraine 53.6 53.9 33.0 31.9 50.0 49.7 37.4 27.4 12.6 5.7 47.9 77.6 Source: FAO (2011); “Men and Women” publications for each country; a average for the economy.
Figure A1.
Figure A2.
0
10
20
30
40
50
60Proportion of Female Tertiary Students in
Agriculture
Armenia
Azerbaijan
Georgia
Belarus
Ukraine
15
20
25
30
35
40
Proportion of Female Tertiary Students in Engineering, Manufacturing and Construction
Armenia
Azerbaijan
Georgia
Belarus
Ukraine

37
Figure A3.
Figure A4.
0
10
20
30
40
50
60
70
80
Proportion of Female Tertiary Students in Science
Armenia
Azerbaijan
Georgia
Belarus
Ukraine
0
10
20
30
40
50
60
70
80
Proportion of Female Tertiary Students in SS, Business and Law
Armenia
Azerbaijan
Georgia
Belarus
Ukraine