Embed Size (px)
Citation preview

Summary and Signature Page 2
Specific Comments 3
Site Information 4
Equipment Information 4
Table Position Accuracy 4
Magnetic Field Homogeneity 4
Slice Thickness Accuracy 4
Slice Crosstalk 5
Soft Copy Displays 6
RF Coil Performance Evaluation
Coil Inventory List 7
Body - Integrated 8
Breast - 8 Ch. 9
Cardiac - 8 Ch. 15
Head 8 Ch 17
Head Split Top 18
Knee - 8 Ch. 20
Knee T/R 21
Neurovascular Array - 8 Ch. 23
Shoulder - 3 Ch. 26
Spine - 8 Ch. 28
Torso 31
Wrist 32
35
40
43
50
GE Site
Appendix C: ACR Phantom Analysis
Appendix D: Explanation of RF Coil Test Format
1-Sep-08
Table of Contents
Appendix A: Magnet Homgeneity Map
Appendix B: Slice Thickness / Profiles / RF Crosstalk
GE Signa Excite HD - 3TYearly Performance Evaluation

Site Name: GE Site MRAP #Address: Survey Date:
City, State, Zip Report Date:MRI Mfg: Model: Field:
MRI Scientist: Moriel NessAiver, Ph.D. Signature:
Pass
Fail
*
N/A
1. Magnetic field homogeneity:2. Slice position accuracy:3. Table positioning reproducibility:4. Slice thickness accuracy:5. RF coils' performance:
a. Volume QD Coilsb. Phase Array Coilsc. Surface Coils
6. Inter-slice RF interference (Crosstalk):7. Soft Copy Display
Pass
Fail
*
N/A
1. Set up and positioning accuracy: (daily)2. Center frequency: (daily)3. Transmitter attenuation or gain: (daily)4. Geometric accuracy measurments: (daily)5. Spatial resolution measurements: (daily)6. Low contrast detectability: (daily)7. Head Coil SNR (daily)8. Body Coil SNR (weekly)9. Fast Spin Echo (FSE/TSE) ghosting levels: (daily)
10. Film quality control: (weekly)11. Visual checklist: (weekly)
*See comments page for description of any failures.
9/5/08
3T
Evaluation of Site's Technologist QC Program
Equipment Evaluation Tests
GE Excite HD
MRI Equipment Evaluation Summary & Signature Page
00139-05
9/1/08
GE Site GE Excite HD 3T 2

1.
2.
3.
4.
5.
6.
7.
8.
9.
10.
11.
12.
13.
NOTE: Please be sure to read appendix D for an explanation of the format of this document.
Specific Comments and Recommendations
The breast coil has an effectively dead channel. When using bilateral mode, 7 channels were good, one bad. When
using EITHER the left side or the right side only, there were 3 good channels and one bad.
There is no difference between ports A & B (if the coil can use either.)
The magnet homogeneity is good.
The display console is good and there is good agreement between the screen and the film.
Everything else looks fine.
GE Site GE Excite HD 3T 3

Site Name: GE Site
Equipment InformationMRI Manufacturer: Model: SN: Software:
Camera Manufacturer: Model: SN: Software:PACS Manufacturer: Model: SN: Software:
ACR Phantom Number used:
1. Table Positioning Reproducibility:Table motion out/in:
Measured Phantom Center
2. Magnetic Field Homogeneity See appendix A for field plots.
Last Year CF: This Year CF: CF Change:GRE TR: 500, TE: 10 & 15 Flip Angle: 45, FOV: 40
5 mm skip 5 mm, BW: 10.4KHz, 256x128, 2nex
Axial: Comments:
Coronal:Sagittal:
3. Slice Thickness AccuracyFOV: 250mm Matrix: 256x256 (Slice #1 from ACR Phantom) All values in mm
NSA
1111114
Comments:
8.0%
5.61 12.2%FSE(16) 3000 5 -10.4%
SE (20/80) 2000 80
MRI Equipment Performance Evaluation Data Form
1234 14.0_M4_629a
Title eMailFax
Out/In Out/In
Contact
-0.40 -0.41-0.40
Phone
IsoCenter Out/In
5.2%5.2%
Pass
% Error
-0.39
-1498
PASS
127,727,086
Sequence TR Target
0.17 0.24 0.32 Shim is very good.0.09 0.16
500 20 90
90
5.40
SE (Site T1) 500 90
T1 MEMP SE 650 10 632.1 80 4.80
5
5
580 90 4.48
5.26
-4.0%GRE 200
SE (20/80) 2000 20 90
5
5.26 5
Comment:
5
5.2%14
CalcTE Flip
5.26SE (ACR)
GE Twinspeed
J0061
127,728,584
0.280.16 0.26 0.40
15 cm 20 cm 25 cm
GE Site GE Excite HD 3T 4

4. Slice Crosstalk (RF interference)
Sequence Type TR TE Flip Angle
FOV (cm2)
Matrix NSA Thickness # of slices
SE Min Full 400 12 90 25 256x256 1 5 11
T1 MEMP 650 10 63 25 256x256 1 5 11
GRE in Phs 200 2.1 80 25 256x256 4 5 11
Skip SE Min Full T1 MEMP GRE In-
Phase
0 4.94 5.13 4.57
0.2 5 5.17 4.58
0.5 5.03 5.19 4.7
1 5.21 5.32 4.89
1.5 5.33 5.38 4.81
2 5.43 5.41 4.76
2.5 5.45 5.44 4.82
5 5.46 5.41 4.9110 5.46 5.4 4.8
The following data were obtained using the ACR phantom slice thickness wedges to measure the slice profile of three
common T1 weighted sequences when the slice gap varies from 200% down to 0% (contiguous) As the slices get closer
together it is expected that the edges of the slices will overlap causing a deterioration of the slice profile. The data shown
below clearly demonstrates this effect. The T1 MEMP sequence is a spin echo sequence with a a 63° flip angle. Both this
sequence and the standare SE sequence shows a drop in the profile once the gap drops below 50%. The interference is less
with the smaller flip angle and longer TR (as expected) The GRE sequence is more complicated to evaluate because the images
were not as sharp and the profile wedges were not well defined. All of the slice profiles can be seen in Appendix B.
There you can see how the SE profile is very square while the GREs are more triangular.
T1 Weighted Slice Thicknesses
4.5
4.75
5
5.25
5.5
0 1 2 3 4 5 6 7 8 9 10
Slice Gap (mm)
Thic
knes
s (m
m) SE Min Full
T1 MEMPGRE In-Phase
GE Site GE Excite HD 3T 5

5. Soft & Hard Copy Displays
Luminance Meter Make/Model: Tektronix J16 Digital Photometer Cal Expires:
Monitor Description: Efilm workstation
Luminance Measured: Ft. lamberts
SMPTE
Which Monitor
Center of Image
Display
Top Left Corner
Top Right
Corner
Bottom Left
Corner
Bottom Right
CornerMAX MIN Percent
Delta OK?
Console 86.7 77.9 79.2 83 84.5 86.7 77.9 11% Y
Density Ft-Lamber
Film Density
0 0.15 -3.14
5 0.30 -2.67
10 0.48 -2.38
20 1.03 -1.87
30 2.84 -1.51
40 5.47 -1.23
50 9.73 -0.98
60 16.22 -0.78
70 26.80 -0.62
80 42.90 -0.46
90 67.80 -0.34
95 83.40 -0.27
100 86.70 -0.21
Measured Data
4/6/06
% delta =200% x (max-min)/(max+center) (>30% is action limit)
Uniformity
The monitor is excellent and the agreemen between the screen and film is good.
Minimum Brightness must be > 26.24 Ft. Lamberts
LCD & Film Response Curve
0.1
1.0
10.0
100.0
0 20 40 60 80 100% Density
Lo
g F
t-Lam
bert
-3.0
-2.5
-2.0
-1.5
-1.0
-0.5
0.0
Ideal CurveLCDFilm
GE Site GE Excite HD 3T 6

Site Name
ACR Magnet #
Coil DescriptionActive Model Rev. Mfg. Date SN Channels
GE Site05 Nickname Signa 3
Coil and Other Hardware Inventory List
Manufacturer
Body Integrated 1
Breast 8 Ch GE 2415544 Sep, 2006 370 8
Cardiac 8 Ch GE 2411986 Oct, 2005 8
Head 8 Ch GE 5147134-2 Aug, 2006 U28780 8
Head Split Top GE 795WH3 Apr, 2006 7953WH3 1
Knee 8ch Invivo 104504 Sep, 2006 U29317 8
Knee T/R Invivo U222191 1
Neurovascular Array 8 Ch USAI 2414390 Sep, 2006 582 8
Shoulder 3 Ch USAI 2414331 May, 2006 321 3
Spine 8 Ch USAI 2415542 Jul, 2006 329 8
Torso USAI 2415410 Dec, 2006 344 8
Wrist HD Mayo Clinic BC-10 3HB10R006 1
7

Test Date: 9/1/2008RF Coil Performance Evaluation
Coil: Body IntegratedMfg.:
Mfg. Date:
Model:
Revision:
SN:
Phantom: Body sphere
SequenceSE
TR300
TE20
PlaneT
FOV48
Nx256
Ny256
NSA1
BW15.6
Thickness3
Gap-
TX gain: 166 R1: 13 R2: 28Coil Mode: Body
The SNR of the Body coil is 4 times higher than last year!
Analysis of Test Image
Coil ID: 907
# of Channels 1
Mean1,0681,068
Max1,1301,132
Min997
1,002
Background
-0.315.8
NoiseSD
9.708.70
Measured Data Calculated ResultsMeanSNR
77.980.4
MaxSNR
82.485.3
Normal-ized
30.431.4
Uni-formity
93.7%93.9%
NoiseType
NEMAAir
LabelN
A
�G�E� �S�i�t�e Signa 3 8

Test Date: 9/1/2008RF Coil Performance Evaluation
Coil: Breast 8 ChMfg.: GE
Mfg. Date: 9/1/2006
Model: 2415544
Revision:
SN: 370
Phantom: HD Breast Phantom
SequenceSE
TR300
TE20
PlaneT
FOV48
Nx256
Ny256
NSA1
BW15.6
Thickness3
Gap-
TX gain: 160 R1: 13 R2: 29Coil Mode: HD Breast Port A
Channel #7 is one fourth of what it should be.
Analysis of Composite Image
Measured Data Calculated ResultsAnalysis of Uncombined Images
Coil ID: 901
Channel 1 Channel 2
Composites
Mean53041342944150548348
643
Max1,3951,0051,070999
1,1141,015119
1,476
# of Channels 8
Mean1,4581,457
Max1,8771,875
Min1,0631,063
Background
1.07.6
NoiseSD
2.772.11
Measured Data Calculated ResultsMeanSNR
372.2452.5
MaxSNR
479.2582.3
Normal-ized
145.4176.8
Uni-formity
72.3%72.4%
NoiseType
NEMAAir
Ch12345678
1.711.421.501.291.251.590.501.88
NoiseSD
NoiseType
AirAirAirAirAirAirAirAir
MeanSNR
% ofMean
203.1190.6187.4224.0264.7199.162.9
224.1
77%72%71%85%
100%75%24%85%
MaxSNR
% ofMax
534.6463.8467.5507.5584.0418.3156.0514.5
92%79%80%87%
100%72%27%88%
Channel 3 Channel 4
Channel 5 Channel 6 Channel 7 Channel 8
LabelNA
�G�E� �S�i�t�e Signa 3 9

Test Date: 9/1/2008RF Coil Performance Evaluation
Coil: Breast 8 ChMfg.: GE
Mfg. Date: 9/1/2006
Model: 2415544
Revision:
SN: 370
Phantom: HD Breast Phantom
SequenceSE
TR300
TE20
PlaneC
FOV40
Nx256
Ny256
NSA1
BW15.6
Thickness3
Gap-
TX gain: 160 R1: 12 R2: 29Coil Mode: HD Breast Port A
Channel 7 is 1/4th of what it should be.
Analysis of Composite Image
Measured Data Calculated ResultsAnalysis of Uncombined Images
Coil ID: 901
Channel 1 Channel 2Composites - NEMA
Mean1,25269263874687262573
1,382
Max1,6111,0211,0031,0401,238997100
1,663
# of Channels 8
Mean1,5671,6721,5681,672
Max1,9801,9341,9851,934
Min1,3981,5041,3981,503
Background
-0.70.111.311.3
NoiseSD
3.593.703.053.04
Measured Data Calculated ResultsMeanSNR
308.7319.6336.9360.4
MaxSNR
390.1369.7426.5416.9
Normal-ized
173.6179.8189.5202.7
Uni-formity
82.8%87.5%82.6%87.5%
NoiseType
NEMANEMA
AirAir
Ch12345678
2.482.062.131.841.782.280.672.72
NoiseSD
NoiseType
AirAirAirAirAirAirAirAir
MeanSNR
% ofMean
330.8220.1196.3265.7321.0179.671.4
333.0
99%66%59%80%96%54%21%
100%
MaxSNR
% ofMax
425.7324.8308.6370.4455.8286.697.8
400.7
93%71%68%81%
100%63%21%88%
Channel 3 Channel 4
Channel 5 Channel 6 Channel 7
LabelNNAA
Composites - Air
�G�E� �S�i�t�e Signa 3 10

Test Date: 9/1/2008RF Coil Performance Evaluation
Coil: Breast 8 ChMfg.: GE
Mfg. Date: 9/1/2006
Model: 2415544
Revision:
SN: 370
Phantom: HD Breast Phantom
SequenceSE
TR300
TE20
PlaneT
FOV48
Nx256
Ny256
NSA1
BW15.6
Thickness3
Gap-
TX gain: 160 R1: 13 R2: 29Coil Mode: HD Breast Port B
Channel 7 is 1/4th of what it should be.
Analysis of Composite Image
Measured Data Calculated ResultsAnalysis of Uncombined Images
Coil ID: 901
Channel 1 Channel 2
Composites
Mean51440943143848147635
594
Max1,340971
1,044986
1,0641,005
871,399
# of Channels 8
Mean1,4051,404
Max1,8181,816
Min1,0161,018
Background
0.57.4
NoiseSD
9.082.04
Measured Data Calculated ResultsMeanSNR
109.4451.0
MaxSNR
141.6583.4
Normal-ized
42.7176.2
Uni-formity
71.7%71.8%
NoiseType
NEMAAir
Ch12345678
1.661.411.481.301.211.540.481.82
NoiseSD
NoiseType
AirAirAirAirAirAirAirAir
MeanSNR
% ofMean
202.9190.1190.8220.8260.5202.547.8
213.9
78%73%73%85%
100%78%18%82%
MaxSNR
% ofMax
529.0451.3462.3497.0576.2427.7118.8503.7
92%78%80%86%
100%74%21%87%
Channel 3 Channel 4
Channel 5 Channel 6 Channel 7 Channel 8
LabelNA
�G�E� �S�i�t�e Signa 3 11

Test Date: 9/1/2008RF Coil Performance Evaluation
Coil: Breast 8 ChMfg.: GE
Mfg. Date: 9/1/2006
Model: 2415544
Revision:
SN: 370
Phantom: HD Breast Phantom
SequenceSE
TR300
TE20
PlaneC
FOV40
Nx256
Ny256
NSA1
BW15.6
Thickness3
Gap-
TX gain: 160 R1: 12 R2: 29Coil Mode: HD Breast Port B
Channel 7 is 1/4th of what it should be.
Analysis of Composite Image
Measured Data Calculated ResultsAnalysis of Uncombined Images
Coil ID: 901
Channel 1 Channel 2Composites - NEMA
Mean1,19968863473983160048
1,301
Max1,5411,013987
1,0341,19096563
1,589
# of Channels 8
Mean1,5091,6161,5091,616
Max1,8911,8811,8961,875
Min1,3481,4571,3481,455
Background
-0.3-0.011.011.0
NoiseSD
3.494.203.003.00
Measured Data Calculated ResultsMeanSNR
305.8272.1329.6353.0
MaxSNR
383.2316.7414.2409.6
Normal-ized
172.0153.1185.4198.6
Uni-formity
83.2%87.3%83.1%87.4%
NoiseType
NEMANEMA
AirAir
Ch12345678
2.442.042.121.821.712.200.642.59
NoiseSD
NoiseType
AirAirAirAirAirAirAirAir
MeanSNR
% ofMean
322.0221.0196.0266.1318.5178.749.1
329.2
98%67%60%81%97%54%15%
100%
MaxSNR
% ofMax
413.9325.4305.1372.3456.0287.464.5
402.0
91%71%67%82%
100%63%14%88%
Channel 3 Channel 4
Channel 5 Channel 6 Channel 7
LabelNNAA
Composites - Air
�G�E� �S�i�t�e Signa 3 12

Test Date: 9/1/2008RF Coil Performance Evaluation
Coil: Breast 8 ChMfg.: GE
Mfg. Date: 9/1/2006
Model: 2415544
Revision:
SN: 370
Phantom: HD Breast Phantom
SequenceSE
TR300
TE20
PlaneT
FOV48
Nx256
Ny256
NSA1
BW15.6
Thickness3
Gap-
TX gain: 160 R1: 13 R2: 29Coil Mode: HD BreastLeft
Channel 3 is dead in both the Left and Right only modes.
Analysis of Composite Image
Measured Data Calculated ResultsAnalysis of Uncombined Images
Coil ID: 901
Channel 1 Channel 2
Mean46040453
590
Max1,077959129
1,396
# of Channels 8
Mean760760
Max1,5151,517
Min141140
Background
0.24.7
NoiseSD
2.181.74
Measured Data Calculated ResultsMeanSNR
246.6286.2
MaxSNR
491.5571.3
Normal-ized
96.3111.8
Uni-formity
17.0%16.9%
NoiseType
NEMAAir
Ch1234
1.231.650.561.91
NoiseSD
NoiseType
AirAirAirAir
MeanSNR
% ofMean
245.1160.562.0
202.4
100%65%25%83%
MaxSNR
% ofMax
573.8380.9151.0479.0
100%66%26%83%
Channel 3 Channel 4
LabelNA
Composites
�G�E� �S�i�t�e Signa 3 13

Test Date: 9/1/2008RF Coil Performance Evaluation
Coil: Breast 8 ChMfg.: GE
Mfg. Date: 9/1/2006
Model: 2415544
Revision:
SN: 370
Phantom: HD Breast Phantom
SequenceSE
TR300
TE20
PlaneC
FOV48
Nx256
Ny256
NSA1
BW15.6
Thickness3
Gap-
TX gain: R1: R2:Coil Mode: HD BreastRight
Channel 3 is dead in both the Left and Right only modes.
Analysis of Composite Image
Measured Data Calculated ResultsAnalysis of Uncombined Images
Coil ID: 901
Channel 1 Channel 2
Mean52240928
420
Max1,35097594
1,004
# of Channels 8
Mean685684
Max1,4131,413
Min9494
Background
0.34.4
NoiseSD
2.191.52
Measured Data Calculated ResultsMeanSNR
221.2294.9
MaxSNR
456.3609.2
Normal-ized
86.4115.2
Uni-formity
12.5%12.5%
NoiseType
NEMAAir
Ch1234
1.771.370.551.27
NoiseSD
NoiseType
AirAirAirAir
MeanSNR
% ofMean
193.3195.633.4
216.7
89%90%15%
100%
MaxSNR
% ofMax
499.8466.4112.0518.1
96%90%22%
100%
Channel 3 Channel 4
LabelNA
Composites
�G�E� �S�i�t�e Signa 3 14

Test Date: 9/1/2008RF Coil Performance Evaluation
Coil: Cardiac 8 ChMfg.: GE
Mfg. Date: 10/1/2005
Model: 2411986
Revision:
SN:
Phantom: Cardiac phantom
SequenceSE
TR300
TE20
PlaneT
FOV48
Nx256
Ny256
NSA1
BW15.6
Thickness3
Gap-
TX gain: 169 R1: 13 R2: 29Coil Mode: HD Cardiac Port A
There is no significant difference between Ports A & B
Analysis of Composite Image
Measured Data Calculated ResultsAnalysis of Uncombined Images
Coil ID: 900
Channel 1 Channel 2
Composites
Mean191209203174194237243178
Max1,7631,4361,3181,5151,4101,6061,6961,330
# of Channels 8
Mean878879
Max2,0122,014
Min287286
Background
-0.312.0
NoiseSD
2.402.75
Measured Data Calculated ResultsMeanSNR
258.7209.5
MaxSNR
592.9479.9
Normal-ized
101.181.8
Uni-formity
25.0%24.9%
NoiseType
NEMAAir
Ch12345678
1.701.811.831.611.881.941.992.01
NoiseSD
NoiseType
AirAirAirAirAirAirAirAir
MeanSNR
% ofMean
73.675.772.770.867.680.180.058.0
92%95%91%88%84%
100%100%72%
MaxSNR
% ofMax
679.6519.9472.0616.6491.5542.5558.5433.6
100%77%69%91%72%80%82%64%
Channel 3 Channel 4
Channel 5 Channel 6 Channel 7 Channel 8
LabelNA
�G�E� �S�i�t�e Signa 3 15

Test Date: 9/1/2008RF Coil Performance Evaluation
Coil: Cardiac 8 ChMfg.: GE
Mfg. Date: 10/1/2005
Model: 2411986
Revision:
SN:
Phantom: Cardiac phantom
SequenceSE
TR300
TE20
PlaneT
FOV48
Nx256
Ny256
NSA1
BW15.6
Thickness3
Gap-
TX gain: 169 R1: 13 R2: 29Coil Mode: HD Cardiac Port B
There is no significant difference between Ports A & B
Analysis of Composite Image
Measured Data Calculated ResultsAnalysis of Uncombined Images
Coil ID: 900
Channel 1 Channel 2
Composites
Mean178208193171185232228173
Max1,6431,4241,2551,4901,3521,5801,5961,296
# of Channels 8
Mean845845
Max1,9071,907
Min274275
Background
0.211.0
NoiseSD
2.502.56
Measured Data Calculated ResultsMeanSNR
239.0216.3
MaxSNR
539.5488.2
Normal-ized
93.484.5
Uni-formity
25.1%25.2%
NoiseType
NEMAAir
Ch12345678
1.611.801.731.581.811.911.851.95
NoiseSD
NoiseType
AirAirAirAirAirAirAirAir
MeanSNR
% ofMean
72.575.773.170.967.079.680.858.1
90%94%91%88%83%99%
100%72%
MaxSNR
% ofMax
668.7518.4475.4618.0489.5542.1565.3435.5
100%78%71%92%73%81%85%65%
Channel 3 Channel 4
Channel 5 Channel 6 Channel 7 Channel 8
LabelNA
�G�E� �S�i�t�e Signa 3 16

Test Date: 9/1/2008RF Coil Performance Evaluation
Coil: Head 8 ChMfg.: GE
Mfg. Date: 8/6/2006
Model: 5147134-2
Revision:
SN: U28780
Phantom: Head TLT sphere
SequenceSE
TR300
TE20
PlaneT
FOV36
Nx256
Ny256
NSA1
BW15.6
Thickness3
Gap-
TX gain: 163 R1: 13 R2: 29Coil Mode: 8HRBrain
There is a 7% drop in SNR since last year.
Analysis of Composite Image
Measured Data Calculated ResultsAnalysis of Uncombined Images
Coil ID: 898
Channel 1 Channel 2
Composites
Mean458492541480438448502426
Max1,1261,2451,3721,2241,1391,1841,1951,030
# of Channels 8
Mean1,5371,536
Max1,9021,902
Min1,1931,192
Background
1.113.3
NoiseSD
3.042.84
Measured Data Calculated ResultsMeanSNR
357.6354.4
MaxSNR
442.5438.9
Normal-ized
248.3246.1
Uni-formity
77.1%77.1%
NoiseType
NEMAAir
Ch12345678
2.212.302.592.632.202.212.332.07
NoiseSD
NoiseType
AirAirAirAirAirAirAirAir
MeanSNR
% ofMean
135.8140.2136.9119.6130.5132.8141.2134.9
96%99%97%85%92%94%
100%96%
MaxSNR
% ofMax
333.9354.7347.1305.0339.3351.1336.1326.1
94%100%98%86%96%99%95%92%
Channel 3 Channel 4
Channel 5 Channel 6 Channel 7 Channel 8
LabelNA
�G�E� �S�i�t�e Signa 3 17

Test Date: 9/1/2008RF Coil Performance Evaluation
Coil: Head Split TopMfg.: GE
Mfg. Date: 4/1/2006
Model: 795WH3
Revision:
SN: 7953WH3
Phantom: ACR
SequenceSE
TR300
TE20
PlaneT
FOV40
Nx256
Ny256
NSA1
BW15.6
Thickness3
Gap-
TX gain: R1: R2:Coil Mode: Head
Analysis of Test Image
Coil ID: 905
# of Channels 1
Mean3,6053,602
Max4,4864,488
Min2,6682,660
Background
2.29.2
NoiseSD
6.825.12
Measured Data Calculated ResultsMeanSNR
373.8461.0
MaxSNR
465.2574.4
Normal-ized
210.3259.3
Uni-formity
74.6%74.4%
NoiseType
NEMAAir
LabelN
A
�G�E� �S�i�t�e Signa 3 18

Test Date: 9/1/2008RF Coil Performance Evaluation
Coil: Head Split TopMfg.: GE
Mfg. Date: 4/1/2006
Model: 795WH3
Revision:
SN: 7953WH3
Phantom: Oil filled sphere
SequenceSE
TR300
TE20
PlaneT
FOV36
Nx256
Ny256
NSA1
BW15.6
Thickness3
Gap-
TX gain: 152 R1: 13 R2: 29Coil Mode: Head
Analysis of Test Image
Coil ID: 905
# of Channels 1
Mean1,0651,064
Max1,1201,119
Min1,0211,022
Background
0.511.8
NoiseSD
7.326.51
Measured Data Calculated ResultsMeanSNR
102.9107.1
MaxSNR
108.2112.6
Normal-ized
71.574.4
Uni-formity
95.4%95.5%
NoiseType
NEMAAir
LabelN
A
�G�E� �S�i�t�e Signa 3 19

Test Date: 9/1/2008RF Coil Performance Evaluation
Coil: Knee 8chMfg.: Invivo
Mfg. Date: 9/1/2006
Model: 104504
Revision:
SN: U29317
Phantom: Knee phantom.
SequenceSE
TR300
TE20
PlaneT
FOV30
Nx256
Ny256
NSA1
BW15.6
Thickness3
Gap-
TX gain: 168 R1: 13 R2: 29Coil Mode: HD TR Knee PA
Analysis of Composite Image
Measured Data Calculated ResultsAnalysis of Uncombined Images
Coil ID: 912
Channel 1 Channel 2
Composites
Mean695662586426646515521638
Max1,9781,8781,8391,4721,6031,5591,7391,372
# of Channels 8
Mean2,0422,043
Max2,7622,762
Min1,3621,362
Background
-0.314.7
NoiseSD
3.043.06
Measured Data Calculated ResultsMeanSNR
475.0437.5
MaxSNR
642.5591.5
Normal-ized
475.0437.5
Uni-formity
66.1%66.1%
NoiseType
NEMAAir
Ch12345678
2.432.672.762.432.542.512.532.26
NoiseSD
NoiseType
AirAirAirAirAirAirAirAir
MeanSNR
% ofMean
187.4162.5139.1114.9166.7134.5134.9185.0
100%87%74%61%89%72%72%99%
MaxSNR
% ofMax
533.4460.9436.6397.0413.6407.0450.4397.8
100%86%82%74%78%76%84%75%
Channel 3 Channel 4
Channel 5 Channel 6 Channel 7 Channel 8
LabelNA
�G�E� �S�i�t�e Signa 3 20

Test Date: 9/1/2008RF Coil Performance Evaluation
Coil: Knee T/RMfg.: Invivo
Mfg. Date:
Model:
Revision:
SN: U222191
Phantom: 8ch Knee phantom and my wrist bottle in foot.
SequenceSE
TR300
TE20
PlaneT
FOV36
Nx256
Ny256
NSA1
BW15.6
Thickness3
Gap-
Coil Mode: QUADKNEE
Analysis of Test Image
Coil ID: 904
Test Images
# of Channels 1
Mean12,4814,24312,4794,240
Max13,9574,79513,9304,798
Min10,8683,77710,8773,765
Background
1.73.112.312.4
NoiseSD
29.1412.496.746.75
Measured Data Calculated ResultsMeanSNR
302.9240.21213.3411.6
MaxSNR
338.7271.51354.4465.8
Normal-ized
210.4166.8842.6285.9
Uni-formity
87.6%88.1%87.7%87.9%
NoiseType
NEMANEMA
AirAir
LabelN
N
A
A
TX gain: 77 R1: 10 R2: 28
�G�E� �S�i�t�e Signa 3 21

Test Date: 9/1/2008RF Coil Performance Evaluation
Coil: Knee T/RMfg.: Invivo
Mfg. Date:
Model:
Revision:
SN: U222191
Phantom: 8ch Knee phantom and my wrist bottle in foot.
SequenceSE
TR300
TE20
PlaneS
FOV40
Nx256
Ny256
NSA1
BW15.6
Thickness3
Gap-
Coil Mode: QUADKNEE
Analysis of Test Image
Coil ID: 904
Test Images
# of Channels 1
Mean11,8954,09211,8984,090
Max13,4435,27413,4465,275
Min10,8591,76510,8571,766
Background
-2.91.412.811.4
NoiseSD
8.035.746.516.02
Measured Data Calculated ResultsMeanSNR
1047.6504.21197.7445.2
MaxSNR
1183.9649.81353.5574.2
Normal-ized
589.3283.6673.7250.4
Uni-formity
89.4%50.1%89.3%50.2%
NoiseType
NEMANEMA
AirAir
LabelN
N
A
A
TX gain: 77 R1: 9 R2: 29
�G�E� �S�i�t�e Signa 3 22

Test Date: 9/1/2008RF Coil Performance Evaluation
Coil: Neurovascular Array 8 ChMfg.: USAI
Mfg. Date: 9/1/2006
Model: 2414390
Revision:
SN: 582
Phantom: Two-piece NVA phantom set.
SequenceSE
TR300
TE20
PlaneT
FOV36
Nx256
Ny256
NSA1
BW15.6
Thickness3
Gap-
TX gain: 165 R1: 13 R2: 30Coil Mode: a HDNV Head
Analysis of Composite Image
Measured Data Calculated ResultsAnalysis of Uncombined Images
Coil ID: 902
Channel 1 Channel 2
Composites
Mean281236272239216225350301
Max612510534519467459718621
# of Channels 8
Mean835835
Max982982
Min708708
Background
-0.214.0
NoiseSD
2.752.87
Measured Data Calculated ResultsMeanSNR
214.7190.7
MaxSNR
252.5224.2
Normal-ized
149.1132.4
Uni-formity
83.8%83.8%
NoiseType
NEMAAir
Ch12345678
2.472.232.412.592.352.342.582.28
NoiseSD
NoiseType
AirAirAirAirAirAirAirAir
MeanSNR
% ofMean
74.669.474.060.560.263.088.986.5
84%78%83%68%68%71%
100%97%
MaxSNR
% ofMax
162.4149.9145.2131.3130.2128.5182.4178.5
89%82%80%72%71%70%
100%98%
Channel 3 Channel 4
Channel 5 Channel 6 Channel 7 Channel 8
LabelNA
�G�E� �S�i�t�e Signa 3 23

Test Date: 9/1/2008RF Coil Performance Evaluation
Coil: Neurovascular Array 8 ChMfg.: USAI
Mfg. Date: 9/1/2006
Model: 2414390
Revision:
SN: 582
Phantom: Two-piece NVA phantom set.
SequenceSE
TR300
TE20
PlaneS
FOV48
Nx256
Ny256
NSA2
BW15.6
Thickness3
Gap-
TX gain: 177 R1: 13 R2: 29Coil Mode: HDNV Array
Analysis of Composite Image
Measured Data Calculated ResultsAnalysis of Uncombined Images
Coil ID: 902
Channel 1 Channel 2Composites - NEMA
Mean563317393544549392396516
Max1,144610767
1,0901,100897705
1,048
# of Channels 8
Mean1,122956
1,121955
Max1,6111,8791,6101,879
Min662644661645
Background
0.90.35.85.8
NoiseSD
1.681.981.191.19
Measured Data Calculated ResultsMeanSNR
472.3341.5617.3525.9
MaxSNR
678.2671.1886.61034.7
Normal-ized
130.594.3
170.5145.3
Uni-formity
58.2%51.1%58.2%51.1%
NoiseType
NEMANEMA
AirAir
Ch12345678
1.330.921.001.311.050.930.961.01
NoiseSD
NoiseType
AirAirAirAirAirAirAirAir
MeanSNR
% ofMean
277.4225.8257.5272.1342.6276.2270.3334.8
81%66%75%79%
100%81%79%98%
MaxSNR
% ofMax
563.7434.5502.6545.3686.5632.1481.2680.0
82%63%73%79%
100%92%70%99%
Channel 3 Channel 4
Channel 5 Channel 6 Channel 7
LabelNNAA
Composites - Air
�G�E� �S�i�t�e Signa 3 24

Test Date: 9/1/2008RF Coil Performance Evaluation
Coil: Neurovascular Array 8 ChMfg.: USAI
Mfg. Date: 9/1/2006
Model: 2414390
Revision:
SN: 582
Phantom: Two-piece NVA phantom set.
SequenceSE
TR300
TE20
PlaneC
FOV48
Nx256
Ny256
NSA1.5
BW15.6
Thickness3
Gap-
TX gain: 177 R1: 13 R2: 29Coil Mode: HDNV Array
Analysis of Composite Image
Measured Data Calculated ResultsAnalysis of Uncombined Images
Coil ID: 902
Channel 1 Channel 2Composites - NEMA
Mean213318364191364351387323
Max455738781374772832
1,057712
# of Channels 8
Mean892611891610
Max1,5311,0301,5321,029
Min632157631156
Background
0.50.55.95.8
NoiseSD
1.411.261.221.21
Measured Data Calculated ResultsMeanSNR
447.4342.9478.6330.4
MaxSNR
767.9578.1822.9557.3
Normal-ized
142.7109.4152.6105.4
Uni-formity
58.4%26.5%58.3%26.3%
NoiseType
NEMANEMA
AirAir
Ch12345678
1.340.931.001.301.050.950.991.02
NoiseSD
NoiseType
AirAirAirAirAirAirAirAir
MeanSNR
% ofMean
104.2224.1238.596.3
227.2242.1256.2207.5
41%87%93%38%89%95%
100%81%
MaxSNR
% ofMax
222.5520.0511.8188.5481.8573.9699.7457.4
32%74%73%27%69%82%
100%65%
Channel 3 Channel 4
Channel 5 Channel 6 Channel 7
LabelNNAA
Composites - Air
�G�E� �S�i�t�e Signa 3 25

Test Date: 9/1/2008RF Coil Performance Evaluation
Coil: Shoulder 3 ChMfg.: USAI
Mfg. Date: 5/01/2006
Model: 2414331
Revision:
SN: 321
Phantom: Shoulder sphere
SequenceSE
TR300
TE20
PlaneT
FOV36
Nx256
Ny256
NSA1
BW15.6
Thickness3
Gap-
TX gain: 164 R1: 13 R2: 29Coil Mode: HD SHOULDER
These axial images were acquired at the center of the phantom and NOT at the ‘+’ mark on the coil like last year.
Analysis of Composite Image
Measured Data Calculated ResultsAnalysis of Uncombined Images
Coil ID: 903
Channel 1 Channel 2
Mean518251577
Max1,171436921
# of Channels 3
Mean878878
Max1,5401,539
Min422422
Background
-0.28.1
NoiseSD
3.212.64
Measured Data Calculated ResultsMeanSNR
193.4217.9
MaxSNR
339.3382.0
Normal-ized
134.3151.3
Uni-formity
43.0%43.0%
NoiseType
NEMAAir
Ch123
2.962.391.86
NoiseSD
NoiseType
AirAirAir
MeanSNR
% ofMean
114.768.8
203.3
56%34%
100%
MaxSNR
% ofMax
259.2119.5324.5
80%37%
100%
Channel 3
LabelNA
Composites
�G�E� �S�i�t�e Signa 3 26

Test Date: 9/1/2008RF Coil Performance Evaluation
Coil: Shoulder 3 ChMfg.: USAI
Mfg. Date: 5/01/2006
Model: 2414331
Revision:
SN: 321
Phantom: Shoulder sphere
SequenceSE
TR300
TE20
PlaneC
FOV36
Nx256
Ny256
NSA1
BW15.6
Thickness3
Gap-
TX gain: 164 R1: 13 R2: 29Coil Mode: HD SHOULDER
Analysis of Composite Image
Measured Data Calculated ResultsAnalysis of Uncombined Images
Coil ID: 903
Channel 1 Channel 2
Mean503347560
Max1,7871,287883
# of Channels 3
Mean943943
Max1,8421,841
Min375374
Background
0.08.0
NoiseSD
2.952.62
Measured Data Calculated ResultsMeanSNR
226.1235.9
MaxSNR
441.6460.5
Normal-ized
157.0163.8
Uni-formity
33.8%33.8%
NoiseType
NEMAAir
Ch123
2.922.391.86
NoiseSD
NoiseType
AirAirAir
MeanSNR
% ofMean
112.995.1
197.3
57%48%
100%
MaxSNR
% ofMax
401.0352.9311.1
100%88%78%
Channel 3
LabelNA
Composites
�G�E� �S�i�t�e Signa 3 27

Test Date: 9/1/2008RF Coil Performance Evaluation
Coil: Spine 8 ChMfg.: USAI
Mfg. Date: 7/01/2006
Model: 2415542
Revision:
SN: 329
Phantom: Dual 3T spine phantoms
SequenceSE
TR300
TE20
PlaneS
FOV48
Nx256
Ny256
NSA2
BW15.6
Thickness3
Gap-
TX gain: 166 R1: 13 R2: 29Coil Mode: HDCTL123
Analysis of Composite Image
Measured Data Calculated ResultsAnalysis of Uncombined Images
Coil ID: 899
Channel 1 Channel 2Composites
Mean707549438435325360
Max2,8441,7961,7451,7621,8641,788
# of Channels 8
Mean1,5451,545
Max3,0913,091
Min623622
Background
0.36.5
NoiseSD
1.851.52
Measured Data Calculated ResultsMeanSNR
590.6666.1
MaxSNR
1181.61332.6
Normal-ized
163.1184.0
Uni-formity
33.5%33.5%
NoiseType
NEMAAir
Ch123456
1.571.291.381.181.391.23
NoiseSD
NoiseType
AirAirAirAirAirAir
MeanSNR
% ofMean
295.1278.9208.0241.6153.2191.8
100%95%70%82%52%65%
MaxSNR
% ofMax
1187.1912.4828.6978.5878.8952.6
100%77%70%82%74%80%
Channel 3
Channel 4 Channel 5
LabelNA
Extra Pics
�G�E� �S�i�t�e Signa 3 28

Test Date: 9/1/2008RF Coil Performance Evaluation
Coil: Spine 8 ChMfg.: USAI
Mfg. Date: 7/01/2006
Model: 2415542
Revision:
SN: 329
Phantom: Dual 3T spine phantoms
SequenceSE
TR300
TE20
PlaneS
FOV48
Nx256
Ny256
NSA1
BW15.6
Thickness3
Gap-
TX gain: 167 R1: 13 R2: 29Coil Mode: HDCTL34 PE AP
Analysis of Composite Image
Measured Data Calculated ResultsAnalysis of Uncombined Images
Coil ID: 899
Channel 1 Channel 2
Mean597560638602
Max2,2911,9692,5101,891
# of Channels 8
Mean1,4301,430
Max3,1263,126
Min502501
Background
-0.67.3
NoiseSD
3.362.14
Measured Data Calculated ResultsMeanSNR
301.0437.9
MaxSNR
658.0957.2
Normal-ized
117.6171.1
Uni-formity
27.7%27.6%
NoiseType
NEMAAir
Ch1234
1.911.712.111.67
NoiseSD
NoiseType
AirAirAirAir
MeanSNR
% ofMean
204.8214.6198.1236.2
87%91%84%
100%
MaxSNR
% ofMax
786.0754.6779.5742.0
100%96%99%94%
Channel 3 Channel 4
LabelNA
Composites
�G�E� �S�i�t�e Signa 3 29

Test Date: 9/1/2008RF Coil Performance Evaluation
Coil: Spine 8 ChMfg.: USAI
Mfg. Date: 7/01/2006
Model: 2415542
Revision:
SN: 329
Phantom: Dual 3T spine phantoms
SequenceSE
TR300
TE20
PlaneS
FOV48
Nx256
Ny256
NSA1
BW15.6
Thickness3
Gap-
TX gain: 167 R1: 13 R2: 29Coil Mode: HDCTL56 PE AP
Analysis of Composite Image
Measured Data Calculated ResultsAnalysis of Uncombined Images
Coil ID: 899
Channel 1 Channel 2
Mean693688653668
Max2,6682,4032,6932,247
# of Channels 8
Mean1,6051,605
Max3,6233,627
Min513512
Background
0.37.0
NoiseSD
3.512.07
Measured Data Calculated ResultsMeanSNR
323.4508.1
MaxSNR
730.01148.2
Normal-ized
126.3198.5
Uni-formity
24.8%24.7%
NoiseType
NEMAAir
Ch1234
1.951.771.811.65
NoiseSD
NoiseType
AirAirAirAir
MeanSNR
% ofMean
232.9254.7236.4265.3
88%96%89%
100%
MaxSNR
% ofMax
896.6889.7975.0892.4
92%91%
100%92%
Channel 3 Channel 4
LabelNA
Composites
�G�E� �S�i�t�e Signa 3 30

Test Date: 9/1/2008RF Coil Performance Evaluation
Coil: TorsoMfg.: USAI
Mfg. Date: 12/1/2006
Model: 2415410
Revision:
SN: 344
Phantom: Two large Torso phantoms... one of which is centered.
SequenceSE
TR300
TE20
PlaneT
FOV48
Nx256
Ny256
NSA1
BW15.6
Thickness3
Gap-
TX gain: 171 R1: 13 R2: 29Coil Mode: 8US TORSOPA
Analysis of Composite Image
Measured Data Calculated ResultsAnalysis of Uncombined Images
Coil ID: 1774
Channel 1 Channel 2
Composites
Mean266305280297262268295272
Max1,5281,1021,1291,7401,7201,1641,2131,786
# of Channels 8
Mean1,1691,168
Max2,3502,349
Min596593
Background
1.113.8
NoiseSD
3.203.02
Measured Data Calculated ResultsMeanSNR
258.4253.4
MaxSNR
519.4509.7
Normal-ized
100.999.0
Uni-formity
40.5%40.3%
NoiseType
NEMAAir
Ch12345678
2.212.622.922.132.142.362.671.92
NoiseSD
NoiseType
AirAirAirAirAirAirAirAir
MeanSNR
% ofMean
78.976.362.891.480.274.472.492.8
85%82%68%98%86%80%78%
100%
MaxSNR
% ofMax
453.1275.6253.4535.3526.7323.2297.7609.6
74%45%42%88%86%53%49%
100%
Channel 3 Channel 4
Channel 5 Channel 6 Channel 7 Channel 8
LabelNA
�G�E� �S�i�t�e Signa 3 31

Test Date: 9/1/2008RF Coil Performance Evaluation
Coil: Wrist HDMfg.: Mayo Clinic
Mfg. Date:
Model: BC-10
Revision:
SN: 3HB10R006
Phantom: Small wrist bottle.
SequenceSE
TR300
TE20
PlaneT
FOV15
Nx256
Ny256
NSA1
BW15.6
Thickness3
Gap-
TX gain: 151 R1: 11 R2: 29Coil Mode: HD WristCoil
Analysis of Test Image
Coil ID: 1775
# of Channels 1
Mean8,3528,345
Max8,8728,879
Min7,4977,470
Background
6.734.1
NoiseSD
22.0718.31
Measured Data Calculated ResultsMeanSNR
267.6298.7
MaxSNR
284.3317.8
Normal-ized
1070.51194.7
Uni-formity
91.6%91.4%
NoiseType
NEMAAir
LabelN
A
�G�E� �S�i�t�e Signa 3 32

Test Date: 9/1/2008RF Coil Performance Evaluation
Coil: Wrist HDMfg.: Mayo Clinic
Mfg. Date:
Model: BC-10
Revision:
SN: 3HB10R006
Phantom: Small wrist bottle.
SequenceSE
TR300
TE20
PlaneC
FOV20
Nx256
Ny256
NSA1
BW15.6
Thickness3
Gap-
TX gain: 152 R1: 10 R2: 29Coil Mode: HD WristCoil
Analysis of Test Image
Coil ID: 1775
# of Channels 1
Mean6,0946,096
Max8,7258,731
Min1,5331,532
Background
-2.319.3
NoiseSD
15.8510.52
Measured Data Calculated ResultsMeanSNR
271.9379.7
MaxSNR
389.3543.9
Normal-ized
611.8854.4
Uni-formity
29.9%29.9%
NoiseType
NEMAAir
LabelN
A
�G�E� �S�i�t�e Signa 3 33

Test Date: 9/1/2008RF Coil Performance Evaluation
Coil: Wrist HDMfg.: Mayo Clinic
Mfg. Date:
Model: BC-10
Revision:
SN: 3HB10R006
Phantom: Small wrist bottle.
SequenceSE
TR300
TE20
PlaneS
FOV20
Nx256
Ny256
NSA1
BW15.6
Thickness3
Gap-
TX gain: 153 R1: 0 R2: 29Coil Mode: HD WristCoil
Analysis of Test Image
Coil ID: 1775
# of Channels 1
Mean6,0696,071
Max8,5268,532
Min1,5131,515
Background
-2.119.4
NoiseSD
18.0010.38
Measured Data Calculated ResultsMeanSNR
238.4383.3
MaxSNR
335.0538.6
Normal-ized
536.5862.4
Uni-formity
30.1%30.2%
NoiseType
NEMAAir
LabelN
A
�G�E� �S�i�t�e Signa 3 34

-20
-20
0
0
0
0
0
20
20
20
-40
-40
-20
-20
-20
-20
0
0
0
0
0
0
0
0
20
2020
40
Superior
Inferior
Rig
ht
Left
Cor
onal
Superior
Inferior
Ant
eriro
r
Pos
terio
r
Sag
ittal
Anterior
Posterior
Rig
ht
LeftAxi
al
AxialDIAMETER MIN MAX RANGE PPM MEAN STDEV
10 -8.3 5.2 13.5 0.11 -1.40 3.215 -14.3 7.4 21.6 0.17 -2.58 5.120 -22.2 8.5 30.7 0.24 -4.39 7.125 -32.6 8.6 41.2 0.32 -7.05 9.728 -45.2 8.6 53.7 0.42 -9.21 11.630 -58.1 8.6 66.7 0.52 -10.87 13.1
Appendix A: Magnet Homogeneity Field Maps GE Site - Signa 3Excite HD 1.5T - 3 central planes
Measured September 1, 2008
CoronalDIAMETER MIN MAX RANGE PPM MEAN STDEV
10 -1.3 4.9 6.2 0.05 0.87 1.315 -2.2 9.2 11.4 0.09 1.94 2.320 -5.1 15.1 20.1 0.16 3.43 3.825 -11.6 23.6 35.2 0.28 5.39 5.828 -18.0 38.5 56.5 0.44 6.84 7.630 -25.4 56.2 81.6 0.64 7.93 9.1
SagittalDIAMETER MIN MAX RANGE PPM MEAN STDEV
10 -5.5 5.1 10.6 0.08 0.83 2.115 -11.2 9.1 20.3 0.16 0.50 3.720 -18.0 14.5 32.5 0.26 -0.00 5.825 -26.8 23.7 50.5 0.40 -0.66 8.428 -34.2 37.3 71.5 0.56 -1.13 10.530 -44.1 52.6 96.8 0.76 -1.46 12.2

Appendix A: Magnet Homogeneity Field Maps GE Site - Signa 3
Excite HD 1.5TMeasured September 1, 2008
GE Site - Signa 3 - Axial Field Plot - 9/1/08
0.00
0.25
0.50
0.75
1.00
1.25
1.50
-9 -6 -3 0 3 6 9cm from Isocenter (S/I)
pp
m
10cm15cm20cm25cm28cm30cm
FOV Diameter
GE Site - Signa 3 - Coronal Field Plot - 9/1/08
0.00
0.25
0.50
0.75
1.00
1.25
1.50
-9 -6 -3 0 3 6 9
cm from Isocenter (P/A)
pp
m
10cm15cm20cm25cm28cm30cm
FOV Diameter
GE Site - Signa 3 - Sagittal Field Plot - 9/1/08
0.00
0.25
0.50
0.75
1.00
1.25
1.50
-9 -6 -3 0 3 6 9cm from Isocenter (R/L)
pp
m
10cm15cm20cm25cm28cm30cm
FOV Diameter

Axial Field Plots
-20
0
00
20
H9
-20
0
0
0
20
H8
-200
0
0
20
H7
-40
-20
-20
0
0
00
20
H6
-60-40
-40
-20
-20
-20
-20
0
0
0
0
H5
-60-40
-40
-20
-20-20 -20
0
0
0
0
0
H4
-60
-40-40
-40
-20
-20
-20
-20
0
0
0
0
0
H3
-60
-40
-40
-40
-20
-20
-20-20
0
0
0
00
0
H2
-40
-40
-40
-20
-20
-20
-20
0
0
0
0
0
0
H1
-40
-40
-20
-20
-20
-20
0
0
0
0
0
0
Isocenter
-40-20
-20
0
0
0
0
F1
-40-20
-20
0
0
0
0
F2
-40-20
-20
0
0
0
0
F3
-200
0
0
20
F4
-200
0
0
20
F5
-200
0
0
20
F6
0
00
20
F7
-20
0
0
0F8
-20
0
0
0F9
Axial Field Plots

Coronal Field Plots
0
0
20
20
20
A9
0
0
20
20
20
A8
00
20 20
2040
A7
00
20
20
20
20
40
A6
0
0 0
20
20
20
20
40
A5
0
0
20
20
20
40
A4
0
0
0
0
20
20
20
A3
0
0
0
20
20
20
20
A2
0
0
20
20
20
40A1
0
0
20
2020
40Isocenter
0
0
20
2020
20 40P1
0
0
20
20
20
20
40
P2
00
20
20
20
20P3
0 0
20
20
20
P4
0
0
20
20
40
P5
0
0
20
20
40
P6
0
0
20
20
40
P7
00
0
20
20
P8
0 0
0
20
P9
Coronal Field Plots

Sagittal Field Plots
-20
-20
0
0
20 40R9
-20
-20
00
0
0
2040
R8
-20
-20
00
0
0
20
40
R7
-20
-20
0
0
0
0
2040
R6
-20
-20
0
0
0
0
20
R5
-20
-20
00
0
0
20
20
R4
-20
-20
00
0
0
20
2040R3
-20
-20
00
0
0
20
20
2040R2
-20
-20
0
0
0
0
20
2020R1
-20
-20
0
0
0
0
0
20
20
20
Isocenter
-20
-20
0
0
0
0
0
20
2040L1
-20
-20
0
0
0
0
020L2
-20
-20
0
0
0
0
20L3
-40
-20
-20
0
0
0
0
20
L4
-40
-20
-20
0
0
0
0
20
L5
-40
-20
-20
0
0
0
0
20
L6
-40
-20
-20
0 0
0
0
20
L7
-40
-20
-20
0
0
0
0
20
L8
-40-2
0
-20
0
0
0
20
L9
Sagittal Field Plots

Appendix B: RF Slice Profiles and Crosstalk
0 50 100 1500
20
40
60
80
100
Upper=56.28 Lower=53.01
Slice Thickness=5.46
SE sk 10
0 50 100 1500
20
40
60
80
100
Upper=56.40 Lower=52.84
Slice Thickness=5.46
SE sk 5
0 50 100 1500
20
40
60
80
100
Upper=56.43 Lower=52.75
Slice Thickness=5.45
SE sk 2.5
0 50 100 1500
20
40
60
80
100
Upper=56.34 Lower=52.38
Slice Thickness=5.43
SE sk 2
0 50 100 1500
20
40
60
80
100
Upper=55.18 Lower=51.53
Slice Thickness=5.33
SE sk 1.5
0 50 100 1500
20
40
60
80
100
Upper=53.95 Lower=50.30
Slice Thickness=5.21
SE sk 1.0
0 50 100 1500
20
40
60
80
100
Upper=52.29 Lower=48.54
Slice Thickness=5.03
SE sk 0.5
0 50 100 1500
20
40
60
80
100
Upper=51.54 Lower=48.60
Slice Thickness=5.00
SE sk 0.2
0 50 100 1500
20
40
60
80
100
Upper=50.94 Lower=47.98
Slice Thickness=4.94
SE sk 0.0
Slice thickness as a function of slice gap
0 2 4 6 8 10Slice Gap
4.0
4.5
5.0
5.5
6.0
Slic
eTh
ickn
ess
Spin EchoTR/TE = 400/12BW = 19.23 KHznex = 1Scan time: 1:43

Appendix B: RF Slice Profiles and Crosstalk
0 50 100 1500
20
40
60
80
100
Upper=55.51 Lower=52.65
Slice Thickness=5.40
MEMP SK 10
0 50 100 1500
20
40
60
80
100
Upper=55.78 Lower=52.51
Slice Thickness=5.41
MEMP SK 5
0 50 100 1500
20
40
60
80
100
Upper=55.78 Lower=53.10
Slice Thickness=5.44
MEMP SK 2.5
0 50 100 1500
20
40
60
80
100
Upper=55.90 Lower=52.36
Slice Thickness=5.41
MEMP SK 2
0 50 100 1500
20
40
60
80
100
Upper=55.66 Lower=52.14
Slice Thickness=5.38
MEMP SK 1.5
0 50 100 1500
20
40
60
80
100
Upper=54.87 Lower=51.55
Slice Thickness=5.32
MEMP SK 1.0
0 50 100 1500
20
40
60
80
100
Upper=53.65 Lower=50.33
Slice Thickness=5.19
MEMP SK 0.5
0 50 100 1500
20
40
60
80
100
Upper=53.30 Lower=50.20
Slice Thickness=5.17
MEMP SK 0.2
0 50 100 1500
20
40
60
80
100
Upper=52.94 Lower=49.78
Slice Thickness=5.13
MEMP SK 0.0
Slice thickness as a function of slice gap
0 2 4 6 8 10Slice Gap
4.0
4.5
5.0
5.5
6.0
Slic
eTh
ickn
ess
Spin Echo - T1 MEMPTR/TE = 650/10FLIP = 63°BW = 19.23 KHznex = 1Scan time: 2:47

Appendix B: RF Slice Profiles and Crosstalk
0 50 100 1500
20
40
60
80
100
Upper=43.90 Lower=52.84
Slice Thickness=4.80
InPhs sk 10
0 50 100 1500
20
40
60
80
100
Upper=45.14 Lower=53.89
Slice Thickness=4.91
InPhs sk 5
0 50 100 1500
20
40
60
80
100
Upper=43.45 Lower=54.10
Slice Thickness=4.82
InPhs sk 2.5
0 50 100 1500
20
40
60
80
100
Upper=43.07 Lower=53.24
Slice Thickness=4.76
InPhs sk 2
0 50 100 1500
20
40
60
80
100
Upper=42.95 Lower=54.74
Slice Thickness=4.81
InPhs sk 1.5
0 50 100 1500
20
40
60
80
100
Upper=43.47 Lower=55.83
Slice Thickness=4.89
InPhs sk 1.0
0 50 100 1500
20
40
60
80
100
Upper=43.26 Lower=51.44
Slice Thickness=4.70
InPhs sk 0.5
0 50 100 1500
20
40
60
80
100
Upper=41.93 Lower=50.57
Slice Thickness=4.58
InPhs sk 0.2
0 50 100 1500
20
40
60
80
100
Upper=41.83 Lower=50.41
Slice Thickness=4.57
InPhs sk 0.0
Slice thickness as a function of slice gap
0 2 4 6 8 10Slice Gap
4.0
4.5
5.0
5.5
6.0
Slic
eTh
ickn
ess
GRE - In PhaseTR/TE = 200/2.1FLIP = 80°BW = 83.32 KHznex = 4Scan time: 3:25

1.0 1.0 1.0 0.9 0.91.0 1.0 1.0 0.9 0.952.2 52.4 54.9 51.9 45.653.1 52.8 57.4 53.3 44.05.26 5.26 5.61 5.26 4.48-1.2 -1.2 -1.1 -1.2 -1.3191.1 191.1 191.1 191.1 191.0191.1 191.1 191.2 191.1 191.4
190.9 190.9 190.9 190.9 190.8191.0 191.0 191.0 190.9 191.2190.8 190.8 190.8 190.9 191.2
23456789
190.6 190.6 190.5 190.6 190.6
4412 4606 2363 4525 17015119 5299 2762 5272 20793140 3303 1538 3112 119376.0% 76.8% 71.5% 74.2% 72.9%
0.6% 0.5% 0.5% 0.0% 0.2%352 342 200 341 132
10 10 8 10 0
10 10 10 10 1010 10 10 10 1040 40 36 40 29
-1.9 -1.8 -1.9 -1.9 -2.1-0.7 -0.6 -0.8 -0.7 -0.8
Sagittal Locator1 Length of phantom, end to end (mn 148± 2)
Slice Location #1(SE 500/20) (SE 2000/20) (SE 2000/80) (Site T1) (Site T2)
= calculated field
Resolution
Slice Thickness(fwhm in mm)
(1.10, 1.00, 0.90 mm)
TopBottom
Wedge (mm)
Diameter (mm) (190±2)
10111213
Slice Location #5
Diameter (mm) (190±2)
Slice Location #714151617181920212223
Signal(mean only)
Big ROIHighLow
Uniformity (>87.5%)
Background Noise Top Bottom
LeftRight
(mean ±std dev)
Ghosting Ratio (<2.5%) SNR (no spec)
2425262728
Slice Location #8Slice Location #9Slice Location #10Slice Location #11
1.4%2.5%3.6%5.1%
Total # of Spokes (>=9)
Low Con Detectability
10 10 8 10 9
2930
Slice Location #11Wedge (mm)Slice Position Error
±±
±±
21.7 11.16 24.8 12.47 23.9 11.87 25.1 13.51 26.7 13.2024.1 13.94 26.8 14.43 24.2 11.73 26.1 13.02 26.6 12.67
51.8 16.93 54.1 17.94 39.9 17.34 26.1 14.80 28.5 14.58
48.2 17.19 40.1 16.82 32.5 15.41 21.3 14.85 30.7 15.11
Test Date: 9/1/2008
148.4
ACR T1 ACR PD ACR T2 Site T1 Site T2
GE Site Signa 3Head Split Top
The low uniformity is expected because I did not use any homogeneity correction.
Coil Used:
= + = -= +
= + = -= +
±±
±±
±±
±±
±±
±±
±±
±±
Calculated value 5.0±0.7

TestID: 339Magnet ID: Coil ID: 905
PulseSequence
(ETL)
SE
TR(ms)
500
TE(ms)
20
FOV(cm)
25
PhaseSampleRatio
1
Numberof
Slices
11
Thick-ness(mm)
5
SliceGap
5
NSA(Nex)
256
FreqMatrix
2561
BandWidth(kHz)
19.2
ScanTime
(min:sec)
2:09
PhaseMatrix
StudyDescription
ACR T1
256
256
256
Dual Echo SE
Dual Echo SE
SE
FSE(20)
2000
2000
400
3617
20
80
12
123
25
25
24
24
1
1
1
1
11
11
11
11
5
5
5
5
5
5
5
5 256
256
256
256
256
1
1
1
2
19.2
19.2
19.2
31.2
8:32
8:32
1:43
1:32
ACR PD
ACR T2
Site T1
Site T2
Sequence parameters Test Date: 9/1/2008
Test ID 339
GE Site Signa 3
Head Split Top
112
Coil Used:

Appendix C: ACR Phantom Analysis ACR T1
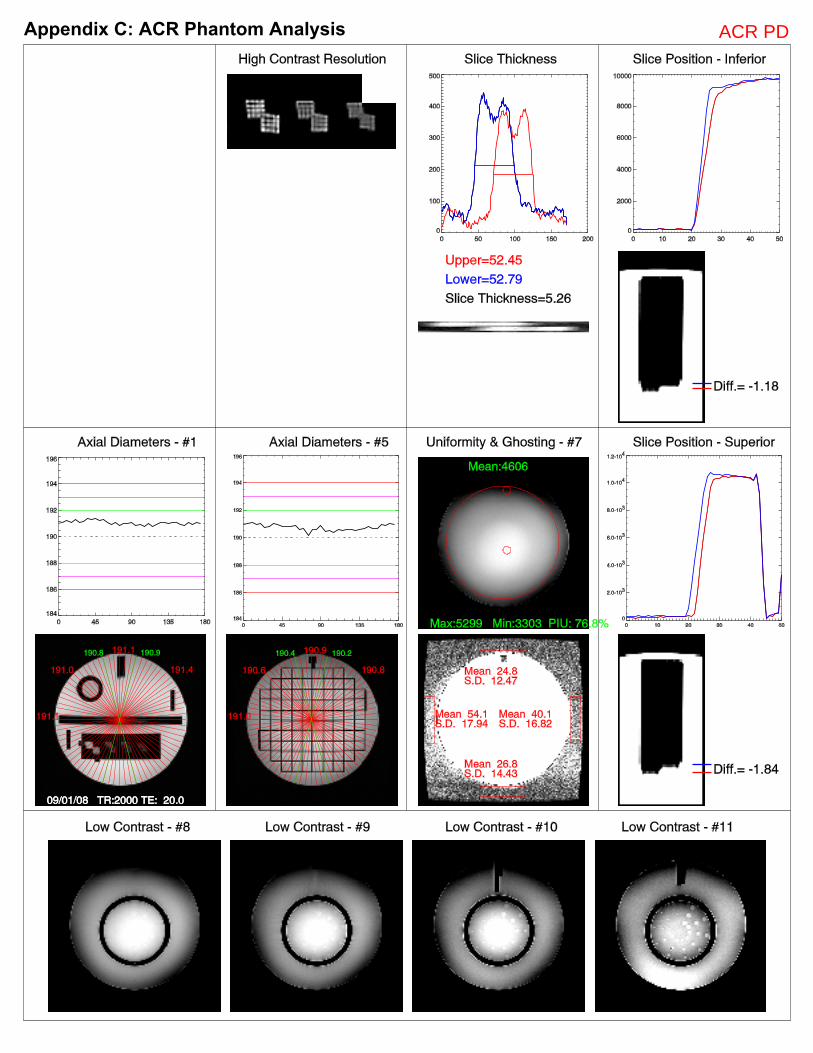
Appendix C: ACR Phantom Analysis ACR PD

Appendix C: ACR Phantom Analysis ACR T2

Appendix C: ACR Phantom Analysis Site T1
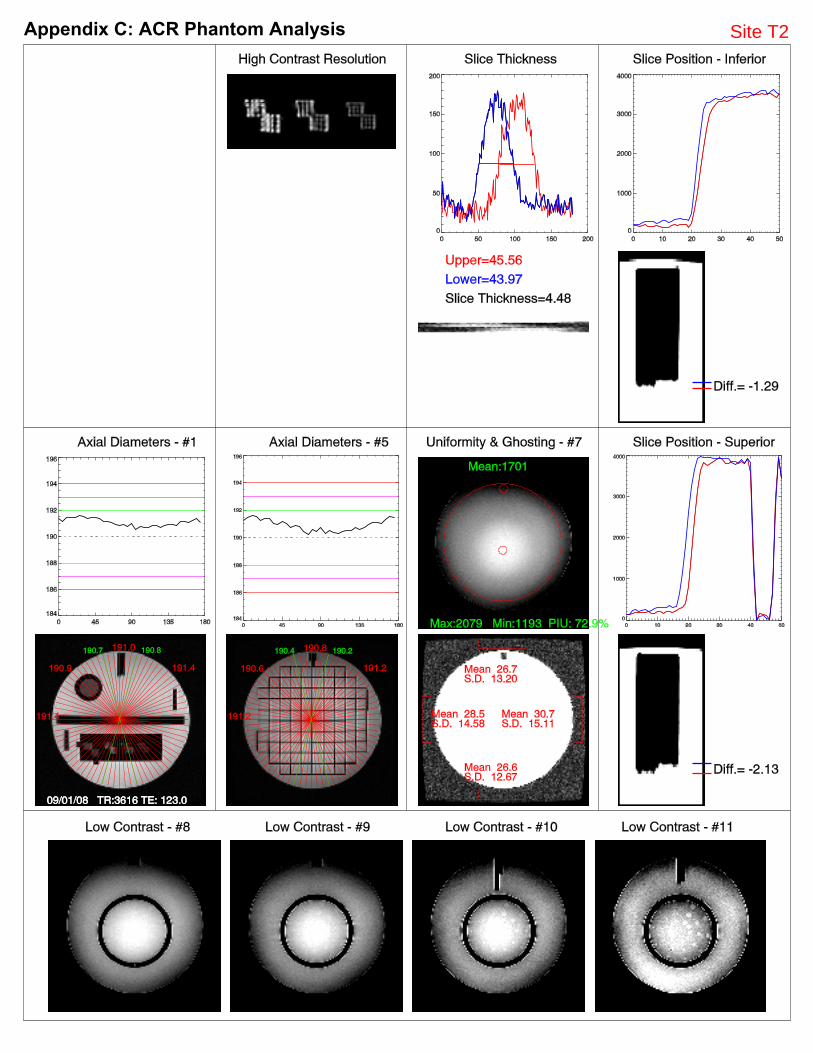
Appendix C: ACR Phantom Analysis Site T2

Appendix D:Explanation of RF Coil Testing Report
IntroductionThe primary goal of RF coil testing is to establish some sort of base line for tracking coil performance overtime. The most common measure is the Signal to Noise Ratio or SNR. In addition, we can look at overallsignal uniformity, ghosting level (or better - lack of ghosting) and in the case of phased array coils we lookat the SNR of each and every channel and at symmetry between channels. Unfortunately, there is no singlebest method for measuring SNR. Below I explain the different methods used and the rationale for each.
SNROne needs to measure the signal in the phantom (either mean or peak or both) and then divide that by thebackground noise. Measuring the signal is fairly straightforward, the noise can be more problematic. Thesimplest method is to measure the standard deviation (SD) in the background ‘air’. However, MRI imagesare the magnitude of complex data. The noise in the underlying complex data is Gaussian but it follows aRician distribution when the magnitude is used. The true noise can be estimated by multiplying the mea-sured SD by 1.526.
During the reconstruction process, most manufacturers perform various additional operations on the images,This could include geometric distortion correction, low pass filtering of the k-space data resulting in lowsignal at the edge of the images, RF coil intensity correction (PURE, CLEAR, SCIC, etc), and other pro-cessing during the combination of phased array data and parallel imaging techniques. All of these methodsdistort the background noise making it impossible to obtain an accurate (and reproducible) estimate of theimage noise in the air region. The alternative is to use a method which I shall refer to as the NEMA(National Electrical Manufacturers Association) method. The signal in the phantom area is a sum of theproton signal and noise. Once the signal to noise ratio exceeds 5:1, the noise in the magnitude image iseffectively Gaussian. To eliminate the proton signal, you acquire an image twice and subtract them. Themeasured SD in the phantom region should now be the true SD times the square root of 2. When determin-ing the SNR using the NEMA method, calculate the mean signal of the average of the two source imagesthen divide by .7071 x the SD measured in the same area as the mean signal.
Unfortunately, this doesn’t always work. It is absolutely imperative that the RF channel scalings, both trans-mit and receive, be identical with both scans. Any ghosting in the system is not likely to repeat exactly forboth scans and will cause a much higher SD. Finally, the phantom needs to be resting in place prior to thescan long enough for motion of the fluid to have died down. Depending on the size and shape of the phan-tom, this could take any where from 5 to 20 minutes.
One of the most common causes of ghosting is vibration from the helium cold-head. The best way to elimi-nate this artifact is to turn off the cold head, which will increase helium consumption. Because this vibra-tion is periodic, the ghosting is usually of an N over 2 (N/2) nature. The affect inside the signal region ofthe phantom can be minimized by using a FOV that is twice the diameter of the phantom (measured in thePE direction.) If the noise is to be measured in the air, then be sure to NOT make measurements to eitherside of the phantom in the PE direction.
Scan parameters also significantly affect measured SNR. For most of the testing performed in this documentI used a simple Spin Echo with a TR of 300, a TE of 20 and a slice thickness of 3mm and a receiver BW of15.6 KHz. The FOV was varied depending on the size of the coil and the phantom used. All of the parame-ters used for each test can be found on each page immediately below the coil description.
52

Report LayoutEach page of this report lists the data from a single test. The top third of the page describes the coil andphantom information, followed by the scan parameters used. The middle third contains the numbers mea-sured and calculated results. This section will contain one table if the coil being tested is a single channelcoil (i.e. quadrature or surface coils) and two tables if it is a multi-channel phased array coil. The entries inthe table will be described further below. The bottom section contains a few lines of comments (ifnecessary), a picture of the coil with the phantom as used for the testing and one or more of the images thatwere used for the measurements.
There is usually one image for each composite image measurement and one image for each separate channelmeasurement. Each image shows the ROI (red line) where the mean signal was measured and two smallerROIs (green lines) where the signal minimum and maximum was found. In the top left corner of each imageis the mean signal in the large ROI. The bottom left corner contains the large ROI’s area (in mm2). The topright corner contains two numbers a mean and a standard deviation. If the NEMA method was used, thenthe top right corner will list the mean and SD of the large ROI (labeled ROI M and ROIsd) applied to thesubtraction image. If the noise was measured in the background air the the numbers are labeled Air M andAirSD.
Data TablesThe meaning of most of the entries in the data table are should be self evident with a few exceptions. Thefirst column in each table is labeled “Label”. In the composite analysis, this field may be empty or containsome sort of abbreviation to identify some aspect of the testing. Some possibilities are the letter N forNEMA, A for Air, L for Left, R for Right, C for CLEAR, NoC for No CLEAR. In the Uncombined Imagetable, the label usually contains the channel number or similar descriptor. The column labeled “Noise Type”will be either Air or SubSig which stands for Subtracted Signal, i.e. the NEMA method. Both tables containa column for Mean SNR and Max SNR which are the Mean or Max signal divided by the SD of the noisescaled by either 1.526 (Air) or 0.7071 (NEMA).
Composite Image Table: The final two columns in this table are “Normalized” and “Uniformity”. It can berather difficult to compare the performance of different coils particularly if different scan parameters areused. (Of course, it’s even more difficult from one scanner to another.) I have standardized most of my test-ing to use a spin echo with a TR/TE of 300/20msec and a thickness of 3 mm. The FOV changes to depend-ing on the size of the phantom used although I try to use a FOV that is at least twice the diameter of thephantom as measured in the PE direction. For one reason or another, a change may be made in the scanparameters (either accidentally or intentionally such as turning on No Phase Wrap to eliminate aliasing, etc.).In order to make it easier to compare SNR values I calculate a “Normalized” SNR value. This value is theo-retically what the SNR would be if a FOV of 30cm, 256x256 matrix, 1 average, receiver BW of 15.6 KHzand slice thickness of 3mm had been used. Obviously, the final number is affected by the T1/T2 values ofthe phantoms used as well as details of the coil and magnet field strength but it can be useful in certain situa-tions.
The “Uniformity” value is defined by the ACR as 1 - (max-min)/(max+min). This is most important whenlooking at volume coils or for evaluating the effectiveness of surface coil intensity correction algorithms(such as PURE, CLEAR or SCIC).
Uncombined Image Table: This table has two columns labeled “% of Mean” and “% of Max”. When ana-lyzing multi-channel coils it is important to understand the relationship between the different channels, theinherent symmetry that usually exists between channels. In a 8 channel head or 4 channel torso phased arraycoil, all of the channels are usually have about the same SNR. These two columns list how the SNR (eitherMean or Max) of each channel compares to the SNR of the channel with the maximum value.
53