Embed Size (px)
Citation preview
Presented by
Date
Event
GDB (GNU Debugger) for AArch64 and ARM
Progress 2015 & 2016 PlansYao Qi
BKK16-304 March 9, 2016
Linaro Connect BKK16
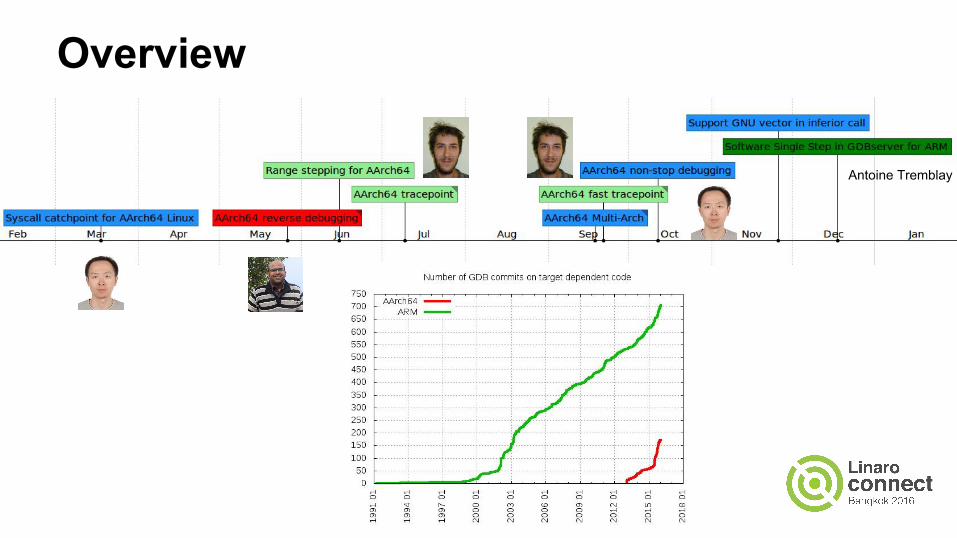
Overview
Antoine Tremblay
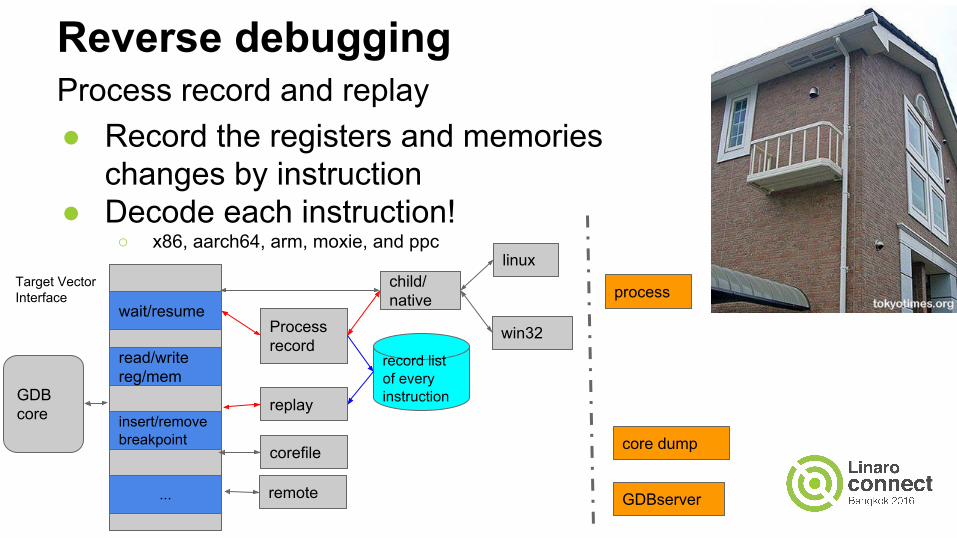
Reverse debuggingProcess record and replay● Record the registers and memories
changes by instruction● Decode each instruction!
○ x86, aarch64, arm, moxie, and ppc
GDB core
Target Vector Interface
wait/resume
read/writereg/mem
insert/removebreakpoint
...
Processrecord
replay
corefile
remote
child/native
linux
win32
record list of every instruction
process
core dump
GDBserver
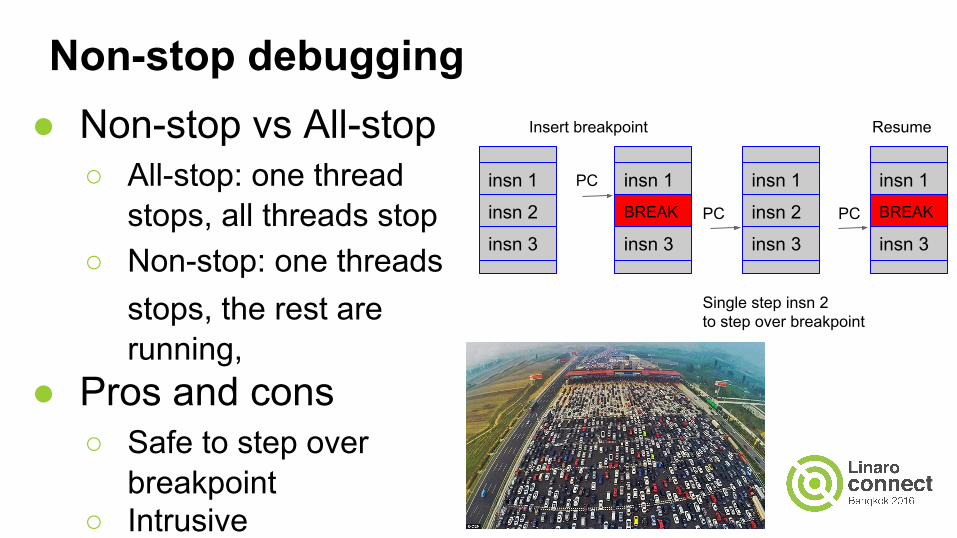
Non-stop debugging● Non-stop vs All-stop
○ All-stop: one thread stops, all threads stop
○ Non-stop: one threads stops, the rest are running,
● Pros and cons○ Safe to step over
breakpoint○ Intrusive
insn 1
insn 2
insn 3
insn 1BREAK
insn 3
insn 1
insn 2
insn 3
insn 1BREAK
insn 3
PC
PC PC
Insert breakpoint Resume
Single step insn 2to step over breakpoint
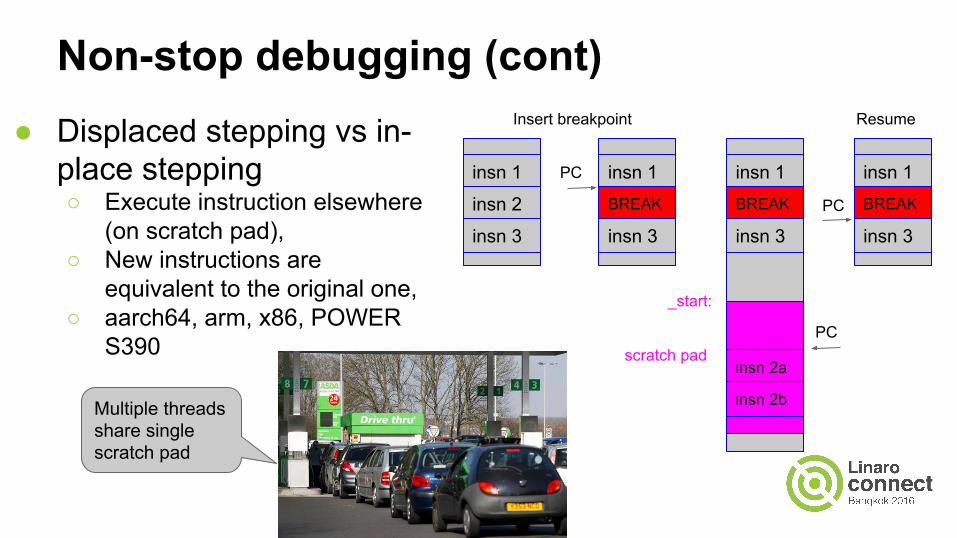
Non-stop debugging (cont)● Displaced stepping vs in-
place stepping○ Execute instruction elsewhere
(on scratch pad),○ New instructions are
equivalent to the original one,○ aarch64, arm, x86, POWER
S390
insn 1
insn 2
insn 3
insn 1BREAK
insn 3
insn 1BREAK
insn 3
insn 1BREAK
insn 3
PC
PC
Insert breakpoint Resume
insn 2a
_start:
scratch padPC
insn 2bMultiple threads share single scratch pad
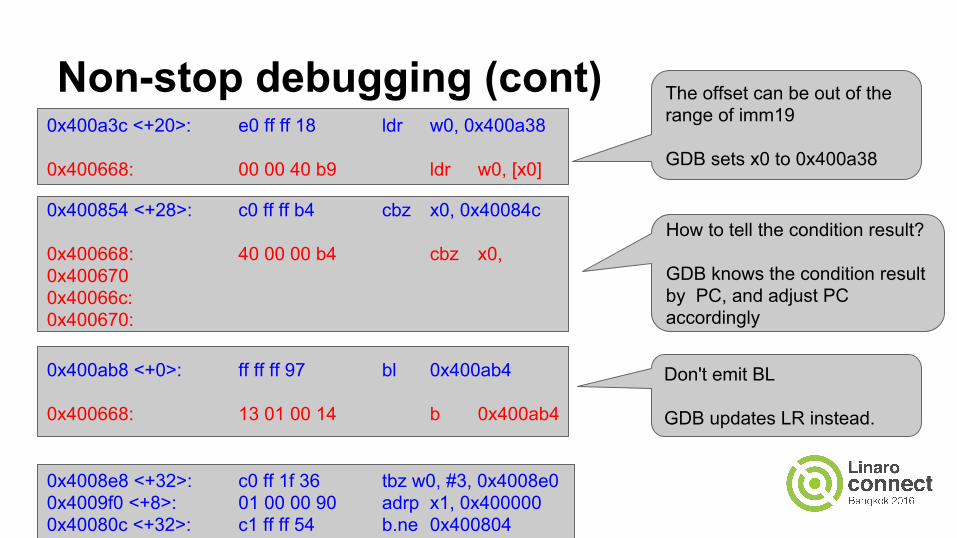
Non-stop debugging (cont)0x400a3c <+20>: e0 ff ff 18 ldr w0, 0x400a38
0x400668: 00 00 40 b9 ldr w0, [x0]
0x400854 <+28>: c0 ff ff b4 cbz x0, 0x40084c
0x400668: 40 00 00 b4 cbz x0, 0x4006700x40066c:0x400670:
0x400ab8 <+0>: ff ff ff 97 bl 0x400ab4
0x400668: 13 01 00 14 b 0x400ab4
0x4008e8 <+32>: c0 ff 1f 36 tbz w0, #3, 0x4008e00x4009f0 <+8>: 01 00 00 90 adrp x1, 0x4000000x40080c <+32>: c1 ff ff 54 b.ne 0x400804
The offset can be out of therange of imm19
GDB sets x0 to 0x400a38
How to tell the condition result?
GDB knows the condition resultby PC, and adjust PCaccordingly
Don't emit BL
GDB updates LR instead.
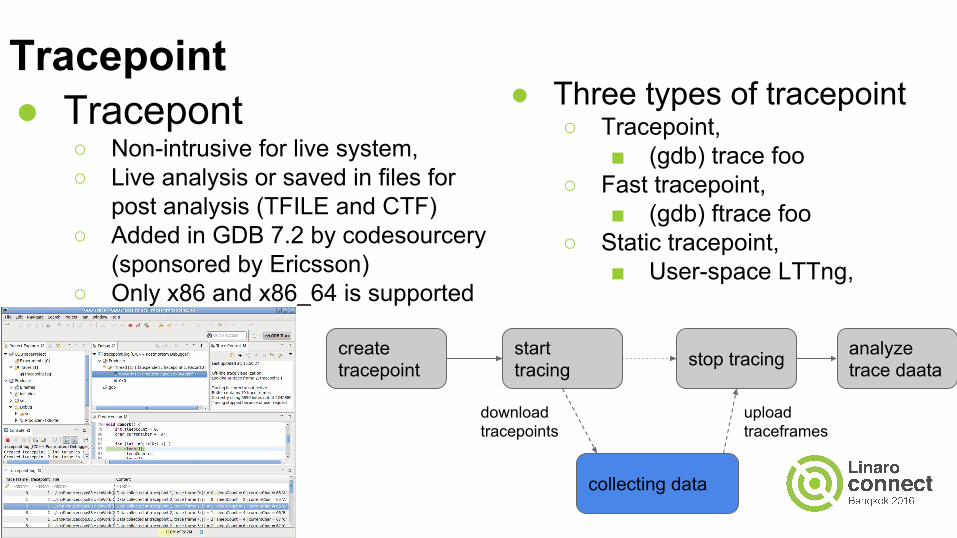
Tracepoint● Tracepont
○ Non-intrusive for live system,○ Live analysis or saved in files for
post analysis (TFILE and CTF)○ Added in GDB 7.2 by codesourcery
(sponsored by Ericsson)○ Only x86 and x86_64 is supported
● Three types of tracepoint○ Tracepoint,
■ (gdb) trace foo○ Fast tracepoint,
■ (gdb) ftrace foo○ Static tracepoint,
■ User-space LTTng,
create tracepoint
start tracing
collecting data
stop tracing analyze trace daata
download tracepoints
upload traceframes
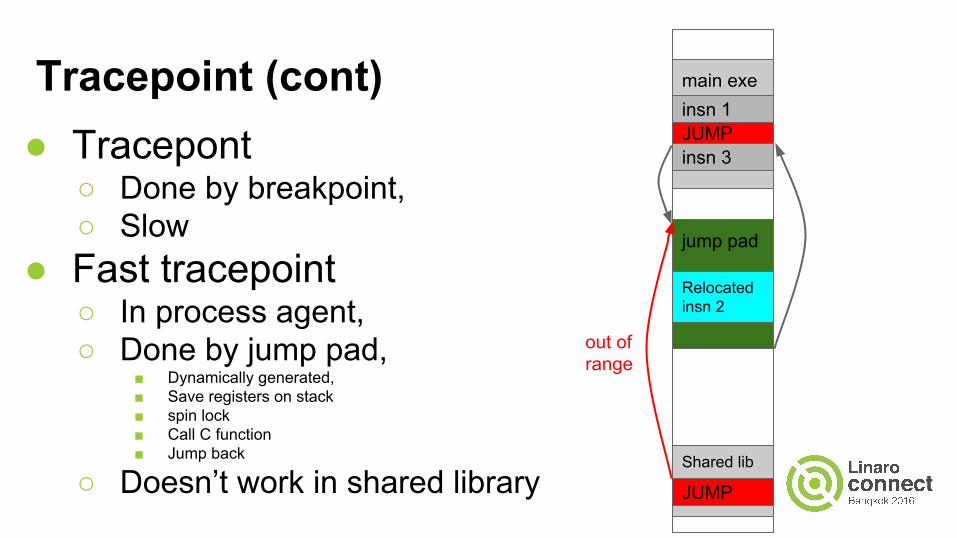
Tracepoint (cont)● Tracepont
○ Done by breakpoint,○ Slow
● Fast tracepoint○ In process agent,○ Done by jump pad,
■ Dynamically generated,■ Save registers on stack■ spin lock■ Call C function■ Jump back
○ Doesn’t work in shared library
main exe
JUMPinsn 1
insn 3
Relocatedinsn 2
Shared lib
JUMP
out of range
jump pad
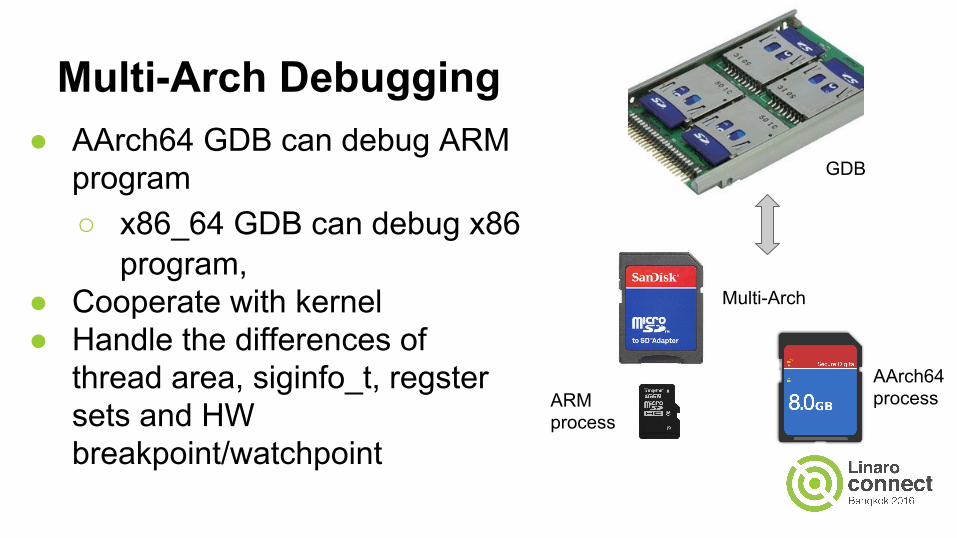
Multi-Arch Debugging● AArch64 GDB can debug ARM
program○ x86_64 GDB can debug x86
program,● Cooperate with kernel● Handle the differences of
thread area, siginfo_t, regster sets and HW breakpoint/watchpoint
GDB
AArch64 processARM
process
Multi-Arch
Plan● Compile and inject code
in GDB○ libcc1.so in GCC 5.0 and
higher,○ X86, POWER and S390 is
supported,● Improve GDB
performance in remote debugging,
● More tests to process record/reply for ARM and AArch64
● Kernel-awareness

End
Thank you