Embed Size (px)
Citation preview

GCSE Geography Revision Guide
Unit 2: People and the Planet
1. Population Dynamics 2. Consuming Resources
3. Living Spaces 4. Making a living
5. Changing Countryside 7. Development Dilemmas
OPTION TOPICS
CORE TOPICS

Topic 1: Population Dynamics
What you need to know:
What has happened to the global population – historical, current and future trends?
Role of socio-cultural and economic factors affecting birth and death rates
Factors driving recent changes in fertility and mortality rates
How and why population change varies
How and why population structures change
Issues relating to youthful and ageing populations
Why some countries wish to control their population?
The impact and effectiveness or polices to control population
Differing policies that exist to mange migration
Why countries adopt different migration policies
Tensions that arise as a result of migrations

Key terms Birth rate the amount of babies born per 1000 of the population
per year
Death rate the amount of deaths per 1000 of the population per
year
Population balance birth and death rates are almost equal and the
population remains level
Natural
Increase/decrease
the difference between birth and death rates
Fertility rate the average number of children born to a women
Immigrants people moving into a country
Emigrants people moving out of a country
Migration movement of people into and out of an area or country
Migration balance: Positive more immigrants than emigrants – increase
population
• Negative decrease population – less immigrants
than emigrants – decrease population
Replacement Level the amount of babies needed to be born for the
population to remain the same
Pro- natalist policy A population policy that encourages births to increase
the population
Anti-natalist policy A population policy that tries to reduce the birth rate
and therefore reduce population growth
Open door migration
policy
A population policy that encourages international
migration
Points based migration
policy
A population policy that only allows skilled people to
migrate to that country.
What has happened to the global population – historical, current and future trends?
• The world population is growing at an alarming rate in 2008 at least another 65
million people were added to the global total of 6.6 billion.
• Since 2000 the rate of growth has begun to slow down
• Exponential Growth has been occurring (the amount of time take n for the
population to double e.g. in 1804 it had taken the population 300 years to double
from ½ billion to 1 billion. In 1999 the doubling time had fallen to 39 years)
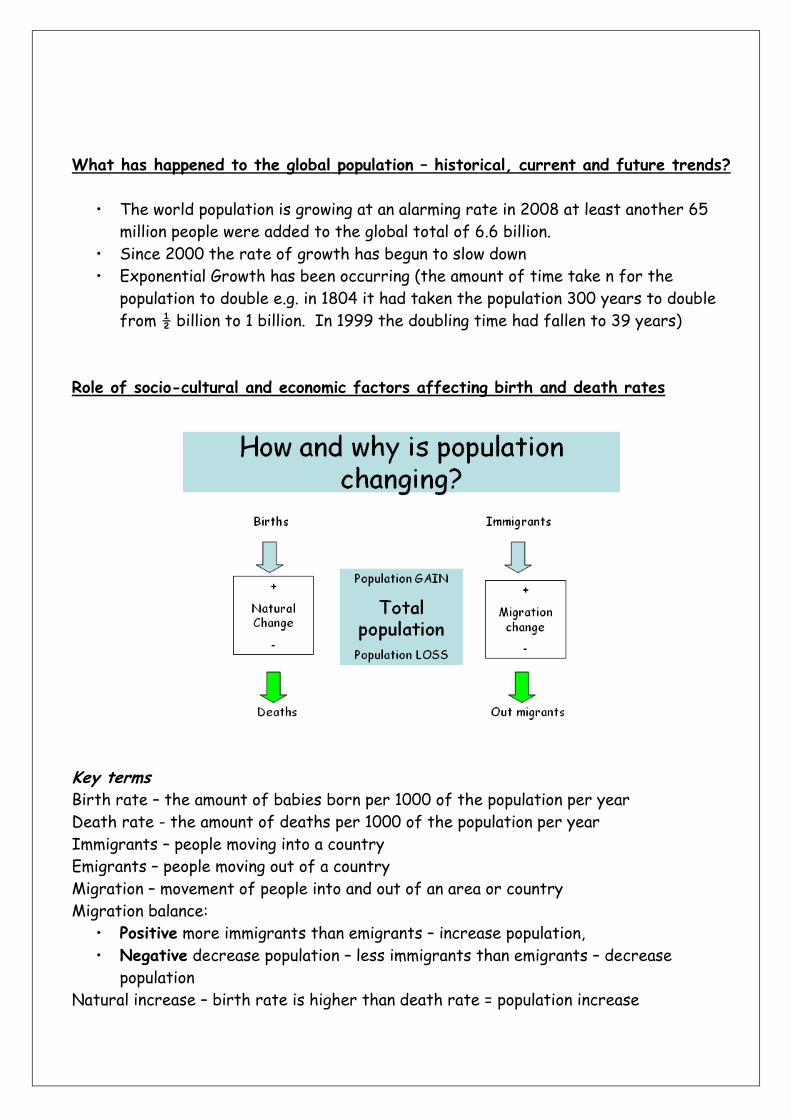
Role of socio-cultural and economic factors affecting birth and death rates
Key terms Birth rate – the amount of babies born per 1000 of the population per year
Death rate - the amount of deaths per 1000 of the population per year
Immigrants – people moving into a country
Emigrants – people moving out of a country
Migration – movement of people into and out of an area or country
Migration balance:
• Positive more immigrants than emigrants – increase population,
• Negative decrease population – less immigrants than emigrants – decrease
population
Natural increase – birth rate is higher than death rate = population increase

Replacement Level – the amount of babies needed to be born for the population to
remain the same
Why has population been increasing?
Mainly due to a decline in death rates and infant mortality rates:
1) Development of modern medicines. This has meant that more and more people are
kept alive due to modern practices.
2) Introduction of vaccination and immunisation programmes e.g. smallpox vaccination
that helps people to live longer.
3) Cleaner drinking water and better sewage disposal, a lot more people have access
to clean drinking water than before.
4) Better healthcare – more doctors, nurses and hospitals, means that people can be
treated and not die.
5) More hygienic housing.
6) Better diets, e.g. promoting eating ‘5 a day’
How and why population change varies
Demographic Transition Model
Stage 1: High fluctuating
- High birth rate due to no birth control and high infant mortality
- High death rate due to disease and famine
Stage 2: Early expanding
- High birth rate
- Falling death rates due to improved health care and nutrition
Stage 3: late expanding
- Falling birth rates due to birth control and wanting smaller families

- Falling death rates
Stage 4: low fluctuating
- Low birth and death rates due to working women delaying age to start their families
Stage 5: Decline
- Death rate higher than birth rate due to a ‘grey’ population
Factors driving recent changes in fertility and mortality rates
Population pyramids show important features of a population – age and gender. The
diagram below shows how to read one:
Population pyramids can be seen to link to the DTM

Population pyramids can be also used to work out the dependency ratio (is a
relationship between those who are and are not working in an area (usually a country).
Issues relating to youthful and ageing populations
Countries often suffer from problems due to the structure of their population.
Youthful population - This is when there are a very high percentage of people under
the age of 15.
Problems:
• Pressure on housing – not enough housing, people living in slums. This is very
common around the big cities (New Delhi), where millions of people live in shanty
towns with no running water, roads, sewage of any kind.
• Pressure on schooling – illiterate population. India’s literacy rate is 60%,
Cambodia’s literacy rate is 69%
• Pressure on food supplies - famine, food distribution difficulties. Natural
disasters accentuate this problem e.g. droughts.
• Pressure on health services – a growth in diseases being spread around and not
being dealt with adequately to stop the spread.
Ageing population
- This is when a country has a large number of people over the age of 65 in their
country.
Problems:
• Health care
– Provide more health care e.g. retirement homes, hospital beds, more
undertakers, etc.
– Skilled health care workers, e.g. nurses, doctors, etc.
–
• Pensions
– 3 solutions

• Increase tax – not popular
• Raise retirement age – not popular
• Abolish state pensions – not popular
Contrasting countries Japan vs. Mexico
Ageing Population – Japan
Facts Causes Effects
- 20.8% of population
aged +65
- 26.8 million
pensioners
- Birth rate below
replacement level
- People living longer
(79 for men & 85 for
women). Due to healthy
diet and high GDP
- Birth rate declining
due to increase age of
first child (2006 29.2
years) and number of
marriages has
decreased
- Increase cost of
pensions as fewer
workers
- Government raised
retirement age from
60 to 65
- Increase in numbers
in nursing homes
- Increase cost of
medical care
Youthful population: Mexico
Facts Causes Effects
- 31% of population
under 15
- Population grew 50
million in 40 years
- Average age in 26
- Low death rate at
4.78 deaths per 1000.
due to vaccinations and
doctors
- falling birth rate but
large % of young
people
- Will take 50 years
for Mexico to loose it’s
youthful population
- Increase need for
school places
- Young people unable
to find work so
emigrate to USA
- Growing
manufacturing industry
- Strongly catholic but
abortion has been
legalised to reduce
number of children

Why some countries wish to control their population?
Countries often need to manage their population to gain an optimum population (when
resources and population equally balance = sustainable). Governments often step into
manage their populations to stop them passing the tipping point that leads to
overpopulation.
Case Study: Anti-Natalist – China’s one child Policy
What? Why? Effects
Introduced in 1970s –
couples not allowed to
have more than one
child.
Couples with one child
were given benefits
e.g. cash bonuses,
better childcare and
improved housing.
Unauthorised
pregnancies pressured
to have abortions
-High growth rate of
population
- Pressure on land and
food supplies due to
large population
-Birth rate fell from
34 per 1000 in 1970 to
13 per 1000 in 2008
- Annual population
growth rate fell from
2.4% to 0.6%
-Total population grown
from 996 million in
1980 to 1,320 million
today
-Chinese tradition to
prefer sons so sex
selective abortions
occurred (120 males to
100 females
- Shortage of women
at marrying age
Pro-Natalist: Estonia
What? Why? Effects
Introduce ‘mother’s
salary’ where women
were paid to have
children
- 15 months fully paid
maternity leave
-Estonia became
independent from
Russia in 1992
- Falling population due
to fertility rate
declining from 2.2 in
1988 to 1.4 in 1998
-By 2006 fertility rate
rose to 1.5 (still below
replacement level)

- People planning fewer
children due to
increase poverty,
single lifestyles and
young people migrating
overseas
Differing policies that exist to mange migration
UK Case Study
Open Door - Post War immigrants came to UK from colonies in the Caribbean due to an Act of
Parliament giving all Commonwealth (ex-colonial) citizens free entry into the UK.
(1950-1960s ¼ million people came from the Caribbean).
+ve = Met shortage of unskilled and semi-skilled labour
= Helped with the reconstruction of the country post war
-ve = public money spent on meeting needs of the immigrants e.g. housing etc
= 1970s recession, the immigrants lead to increased unemployment
Point Based system If you wish to come and work to settle down you need to gain a certain amount of
points. This was established 2008 and contains 5 tiers of migrants. Tier one has
highly skilled workers such as scientists, down to
Tier five who are temporary workers e.g. musicians playing in a concert.
In 2004 eastern European countries of Czech Republic, Estonia, Hungary, Poland,
Latvia, Lithuania, Slovakia and Slovenia joined the EU (A8 – Accession countries). This
meant that citizens of these countries are free to move and work in other EU member
countries. In most cases these economic migrants stay only until they feel they have
made enough money to take home
Source advantages Host Advantages
- Immigrants send money/remittances
home to their families
- Less pressure on resources and jobs in
places like Poland etc
- Immigrants bring skills back to their
country
- meets need of shortage of unskilled and
semi-skilled labour
- helped to reconstruct UK after the war
- Increases culture in the UK
- Immigrants contribute to the UK economy
by the taxes they pay

- Immigrants often take mainly low paid jobs
- Less than 5% claim any sort of state
benefit
Source disadvantages Host disadvantages
- Loss of working population from Poland
for example
- Decline in birth rate as most migrants
are young men
-
- public money spent on immigrants e.g.
housing and healthcare
- during the 1970s recession the immigrants
added to the number of unemployed
- Increased hostility towards the immigrants
Tensions that arise as a result of migrations
The UK immigration of ethnic groups lead to conflict as there was hostility towards
them. These ethnic groups banded together into particular areas to reduce the risk
of being victimised. The UK government stepped in and stated that all citizens
regardless of ethnicity should enjoy equal opportunities. Today much more harmonious
as people have begun to realise the positives of having them; they add to country’s
skill base and culture.

Topic 2: Consuming Resources
What you need to know:
How resources can be defined and classified
The impacts of obtaining and consuming one renewable, sustainable and non-
renewable resources
Inequalities in supply and consumption of one global resource
Future pressures on both supply and consumption of this resource in view of recent
global economic growth
Theories about the population-resource equation
How well these theories stand up to current global resource supply and demand
How resource demand might be reduced
The potential for alternative and renewable resources
Whether technology can ‘fix’ the problem
Key Terms Alternative energy Energy sources that provide an alternative to fossil
fuels
Boserupian theory The view that when population grows it stimulates
technological changes that produce increases in
output, ensuring that living standards can be
maintained for the growing population
Carbon footprint A measurement of all the greenhouse gases we
individually produce, through burning fossil fuels for
electricity, transport etc.
Human resource The skills and abilities of the population
Malthusian theory The view that population growth is the main reason
why a society would collapse
Material resource A natural substance that humans choose to use
Natural resource Those materials found in the natural world that are
useful to man, and that we have the technology and
willingness to use
Non-renewable
resource
Those resource – like coal or oil- that cannot be
remade, because it would take millions of years for
them to form again
Renewable resource Resources, such as forests, that can be maintained by

management
Sustainable
development
Development that meets the needs of the present
without compromising the ability of future
generations to meet their own needs
Sustainable resource Resources – such as wood –that can be renewed if we
act to replace them as we use them
How resources can be defined and classified
There are three main types:
1) Natural resources e.g. wood
2) Human resources e.g. skills of a population e.g. Doctors
3) Material or capital resources e.g. good and equipment already in society)
You can also define resources via their availability
- Non-renewable resources – cannot be remade because they take millions of years to
form again e.g. coal or oil
- Sustainable resources – Can be deliberately be renewed so that it can last into the
future e.g. planting trees
- Renewable resources – renew themselves so do not need to be managed e.g. solar and
wind power
The impacts of obtaining and consuming one renewable, sustainable and non-
renewable resources
Resource Benefits Costs
Non-renewable e.g. Tar
Sand oil
- Extraction would bring
further money to oil
companies
- could avoid the costs of
switching to other fuels
such as hydrogen
- Extraction uses huge
amounts of water
- only 5 year supply
- need removal of forest
to get to the oil
Sustainable and renewable
e.g. Bio fuels
- C02 absorbed when they
are grown
- engines need little
change to cope with bio
fuels
- need huge area of land
to grow the crop
- reduces habitat variety
due to monoculture
Sustainable but limited
e.g. Solar energy
- Unlimited
- Environmentally friendly
so limited carbon
emissions
- Intermittent as new
ways of storing electricity
are needed
- Current production is
tiny
- Relatively expensive
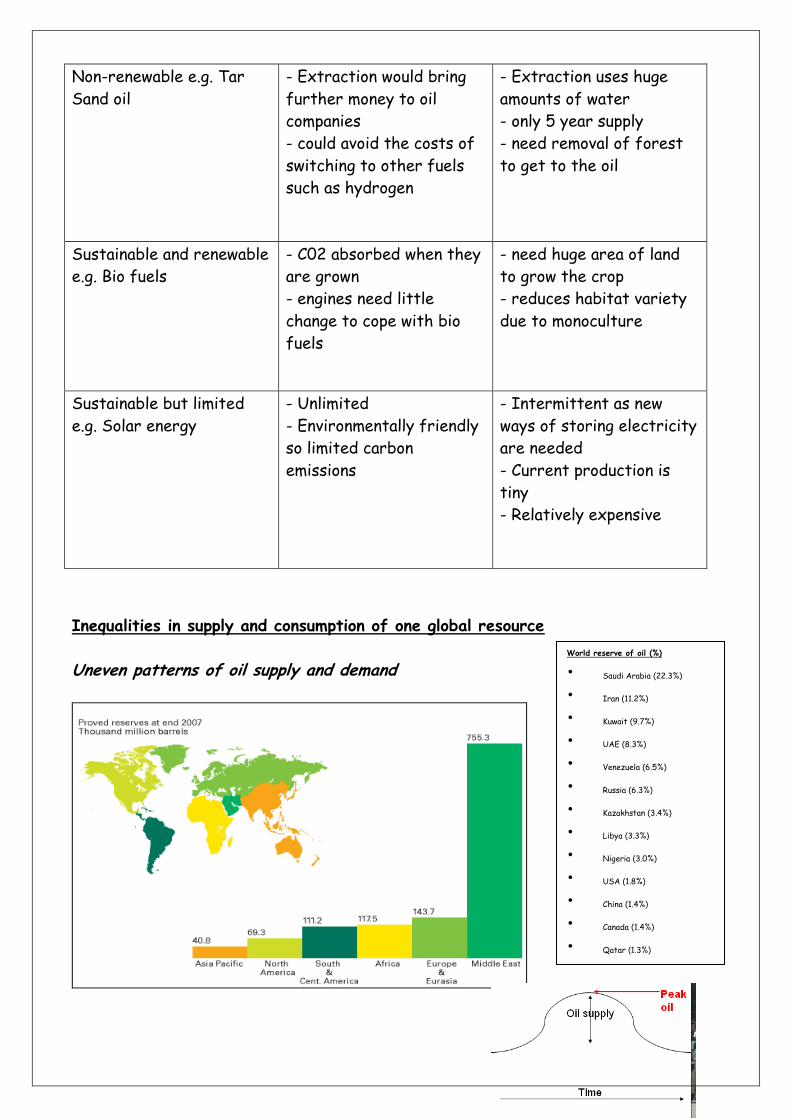
Inequalities in supply and consumption of one global resource
Uneven patterns of oil supply and demand
World reserve of oil (%)
• Saudi Arabia (22.3%)
• Iran (11.2%)
• Kuwait (9.7%)
• UAE (8.3%)
• Venezuela (6.5%)
• Russia (6.3%)
• Kazakhstan (3.4%)
• Libya (3.3%)
• Nigeria (3.0%)
• USA (1.8%)
• China (1.4%)
• Canada (1.4%)
• Qatar (1.3%)

Current production is focused in the Middle East, especially Saudi Arabia. However
many of these countries have reached ‘peak oil’ (production of relatively cheaply
obtained oil has reached its maximum so there is now a fall in production).
Consumption is largely related to the wealth of a country and its reliance on cars.
70% of the world’s oil is used transporting goods and people within and between
countries.
The USA has less than 5% of the
population but uses 25% of the oil
mainly due to:
- Lack of public transport
systems
- Low density urban settlements
so need long journeys to work,
school etc
- History of low petrol prices
Future pressures on both supply and consumption of this resource in view of
recent global economic growth
China and India are continuing to grow rapidly with a combined population of 1,400
million using 71 million cars. In most cases as the population grows the demand for
cars will increase as the hope to get ‘the American Dream’. To achieve this Tata
Motors based in India has begun production a car priced at £1500, this increasing the
demand for oil and adding to C02 emissions.
Theories about the population-resource equation
Malthus Theory (1766-1834) - Population increases faster than food
supply so there would come a time when the
world could not cope.
- Population increases geometrically (1, 2, 4,
8, and 16)
- Food supply increases arithmetically (1, 2,
3, 4, and 5)

- Population would outgrow the amount of food available leading to famine, war and
disease
Malthus argued that there were ways to prevent population from extending beyond
the food supplies necessary to support it (optimum population). This includes a
combination of
1. ‘Negative’: Methods people choose to reduce human fertility e.g. China’s one child
policy, sterilisation
2.’ Positives’: Anything which increases mortality: e.g. low living standards, disease
Malthus argued that this would kept the carrying capacity in check the
Number of plants, animals or human which can be adequately supported (carried) by
the land
Boserup Theory 1965
- Population growth has a positive impact on people as
it forces them to invent a way out of a problem when
resources start to run out e.g. GM crops
- Overpopulation leads to innovation and higher
productivity in use of land (irrigation, weeding, crop
intensification, better seeds) and labour (tools, better
techniques) e.g. GM Crops and the Green Revolution
‘Limits to Growth’ – Club of Rome
They concluded that is current growth
trends continued along side
industrialisation, pollution, food
production and resource depletion the
limits to growth on the planet will be
reached in the next 100 years.
The result of this will be sudden and
uncontrollable decline in population and
industrial capacity.
How well these theories stand up to current global resource supply and demand
Malthus predictions turned out to be wrong as food production has increased rapidly.
In the 19th and 20th Century the population increased but alongside the quality of life
and living standards rose across the globe. Neo-Malthusians suggest that the theory
has some truth due to the high levels of famine in the world today.
How resource demand might be reduced

Reducing the dependence on oil - Plastic water bottles are made from oil and then oil is used to transport them
across great distances.
- Now carrying refillable bottles of water and recycling the bottle
- Switch to hydrogen run cars as they release no harmful emissions. E.g. The Ford
Edge car is first alternative fuel car to be able to travel similar distances to
traditional petrol cars.
Individual action - changing habits e.g. using public transport and switching to energy efficient light
bulbs etc.
- Recycling and conservation
- Buying food from local farm shops to reduce ‘food miles’
Corporate Action: - Example of Interface Carpets based in the USA has identified various goals to
improve its environmental performance e.g. eliminating waste in all areas of the
business and using renewable energy resources such solar and wind power.
- Google Headquarters uses hydrogen cars which are renewable and also provides a
bus shuttle to pick up its employers to reduce their car usage
The aim is to achieve ‘SUSTAINABLE DEVELOPMENT’:
‘This is development that meets the needs of the present without compromising
the ability of future generations to meet their own needs’
The potential for alternative and renewable resources
In 1995 the UK generated 2% of its electricity from renewable sources compared
with the EU average of 14%. The government set its target of reaching 10% by 2010.
This they believe is achievable as the average costs for wind, hydro, landfill gas and
waste-burning fell dramatically during the 1990s. However, UK government achieved
only 6% by 2010. There is still however a huge market for the UK to switch towards
more renewable resources of energy.
Whether technology can ‘fix’ the problem
Technological fix is the idea that we can resolve problems we might have by inventing
solutions to them. The problem of finding alternative fuels to replace ‘cheap’ oil would
need high amounts of effort from governments, corporations and researchers to cope
with the issue of ‘peak oil’.

Topic 3: Living Spaces
What you need to know:
Defining a ‘good living space’ and how it may vary with age and stage in the life
cycle etc
The processes that lead to variations in the quality of living spaces
Perceptions of living spaces and how these vary spatially between urban and rural
How personal choices about living spaces are affected by age and life cycle
Pressures on rural areas in developed countries to provide more living spaces
The pressures on living spaces in urban areas, their impacts, and the compromises
made in creating good quality living space
The need for more affordable quality living spaces in urban and rural areas
The links between quality of living spaces and economic wealth

Attempts to create high-quality living spaces in urban and rural areas for all urban
populations
Key Terms
Accessible rural areas Countryside within easy reach of urban areas
Cultural background The origins of an individual’s or group’s belief system
Economic status The position held by an individual, group or country in
terms of their economic power
Expatriate community Overseas communities made up of non-national’s e.g.
the British living in Spain
Global city A major urban area that has a significant role in
controlling the international flows of capital and trade
Global hub A major centre of global communications, such as an
international airport
Greenfield sites A piece of land that has not been built on before, but
is now being considered for development
Inner city living space Residential areas within city centre areas

Organic agriculture Farming systems that use no artificial chemicals
Pull factor Something that attracts people to a location
Push factor Something that makes people wish to leave a location
Redevelopment Development which aims to stimulate growth in areas
that have experienced decline
Regeneration Growth in areas that have experienced decline in the
past
Remote rural areas Rural areas that are distant from and thus little
affected by urban areas and their populations
Rural Idyll The common perception that rural areas are quiet and
attractive – and therefore good places to live
Sustainable living space Living spaces that are designed in such as way to have
a small impact on the environment and thus more
durable than others
Urban sprawl Urban growth, usually weakly controlled, into
surrounding rural and semi-rural areas
Defining a ‘good living space’ and how it may vary with age and stage in the life
cycle etc
People’s idea of what makes good living spaces tends to vary due to age and their
economic background. You tend to form a strong bond with a living space if it meets
your needs and it has access to the things you like doing.
Factors affecting how we view places:
Age Younger people seek out more variety in their social lives
and this makes cities more attractive. Older people or
those with families tend to find rural areas more
attractive.
Mobility Personal mobility will affect how isolation we feel. Rural
areas tend to have more problems with mobility with a

reliance on private cars
Cultural background This impacts on how we see places and how attractive we
find them
Knowledge and perception Highlights the ‘idea’ of a place without people actually
knowing the area e.g. crime rates etc
Economic status Areas that offer job security are deemed more
attractive
The factors that lead to variations in the quality of living spaces
Perceptions of living spaces and how these vary spatially between urban and rural
The rural idyll is an image that people have of the rural life in developed countries e.g.
less traffic, crime and villages shops etc. This idea creates high demand for housing
meaning that there is an increasing amount of poverty 3% in rural areas, compared to
1% in urban areas.
Rural areas are often used as weekend retreats for urbanites who venture to the
countryside each weekend. The village’s population also grows during the summer
months due to holiday homes. However during the winter the population declines
leading to closures of pubs etc.
LEDC: Rush for the cities
Social factors: crime rates,
healthcare, education, risk of
disease etc
Political factors: opportunity to
vote, freedom of speech and
movement
Economic factors: access to
services, job opportunities,
transport links etc
Environmental factors:
available water, soil fertility,
likelihood of hazards etc

On the other hand in developing countries there is a rush for the cities as young
people search for jobs and schools for their children. This is called ‘rural-urban
migration’. The idea of the ‘bright lights syndrome’ attracting rural people to the
cities has lead to slums developing in the cities of the LEDC’s.
How personal choices about living spaces are affected by age and life cycle
20 are moving back to the city: This process is called ‘re-urbanisation’ where young people (25-35) who are relatively
well off move back into the cities for:
o good night life
o close to work
o close to high quality shopping
o good public transport so no need for a car
o culture and leisure facilities close by
Retiring to the sun: Many older people are choosing to retire to eastern and southern Spain:
o warmer climate than the UK
o Modern health facilities
o House prices are lower than the UK
o Lower heating costs and household bills than the UK
o Cheap to fly home to see friends and family
Pressures on rural areas in developed countries to provide more living spaces
With the growing populations there are pressures to build on ‘Greenfield sites’ (areas
which have not been built on before e.g. countryside).
Increasing housing demand and supply in North Wiltshire: - In 1996 the county of Wiltshire were expected to need 60,000 more homes by
2016 in order to attract more businesses and grow
- Land use in the area is 81% rural and only 19% urban
- The government has emphasised the reuse of Brownfield sites (areas that have
previously been built on e.g. abandoned factories)
- The new homes are to be built 44% on Brownfield sites and 56% on Greenfield
sites as long as they are not close to areas of outstanding natural beauty or there
are physical issues e.g. flooding

The pressures on living spaces in urban areas, their impacts, and the compromises
made in creating good quality living space
Why urban areas are in demand? Tokyo: in 2007 the population was 12.8 million (10% of
Japan). The main issue is living in the city due to fact that a
typical Japanese home is less than 100m2 with a flat taking
up 40m2. This is because the land prices in Tokyo are very
high at £1000 per m2.
Solution: Building underground cities which are underground
spaces connected by trains and roads under the surface.
Solution: Urban Geog-grid – vast network of underground
city spaces linked by tunnels. Cost = £40 billion, will house
0.5 million.
USA: Las Vegas
Located in the state of Nevada with 1.6 million living
their. The main issue is that due to its location the
climate is very hot and dry. In order to supply Las Vegas
with the millions of litres water required, it is pumped
from Lake Mead and the ground water. This means that
the area is running out of water as it is not being
replenished:
Impacts:
Las Vegas used more water per person than any other city in the world
Groundwater levels have dropped by more than 90m
Off-road vehicles are damaging the desert and local wildlife
Urban temperatures are 5° above the average in Las Vegas
Attempts to create high-quality living spaces in urban and rural areas for all
urban populations
MEDC Examples:
1) Barcelona (Spain)
Created a scheme called ‘bicing’ where people buy a year’s membership for £30 which
allows them to pick up a bike from one of the 400 stations that are located around the
city. There are over 6000 bikes and more than 175000 members.
2) Martin (Hampshire)

Looked to control their food system so that it could become less dependent on
supermarkets etc. Residents have joined Future Farms which is a community
allotment of 3 hectares growing vegetables and raising animals. It is sold by the
villagers for profit as well as for their own food.
3) Compact Communities
Attempts to reduce the environmental impact of our living spaces by making the best
use of space. Transport systems are located within the housing areas so there is less
need to travel. Housing is dense so it provides enough people to support the local
services and use public transport.
LEDC Examples:
1) Masdar (United Arab Emirates)
A new settlement for 50,000 people has been built 17km outside the capital. It is
claimed to be the first ‘zero-carbon, zero waste’ city. For example wind towers are
placed on top of buildings to suck cool air in and warm air out. Rooftops are covered
with solar panels and the city will be car free due to extensive public transport.
2) Eco-villages in Brazil
Ecoovila is a small eco-village located in the city of Porto Alegre. The aim was to
develop affordable housing for everyone and use eco-friendly building materials. All
houses face the sun so they soak up its energy, houses are cooled by underground
chambers in the homes, grass roofs reduce inside temperatures and help to insulate.
They have used local material such as clay bricks and sewage is treated in a biological
reed-bed system.
Topic 4: Making a Living
What you need to know:
Understand how the balance between employment sectors is changing
Process of industrialisation and deindustrialisation and the impacts of these
Factors leading to diversification of rural economy in a developed country
Understand the environmental impact of employment change in urban areas of a
developing country

Understand the environmental impact of de-industrialisation and economic
diversification in one area within a developed country
Identify the potential for regeneration and environmental change on Brownfield
sites
Identify the potential for greener growth in urban areas.
Key Terms
Brownfield site A piece of land that has been used and abandoned,
and is now awaiting some new use
Clark fisher model A generalised description of how societies’
employment structures change as they develop
Deprived area An area in which there is a damaging lack of the
material benefits that are considered to be basic
necessities e.g. employment, housing etc.

Derelict land Land on which factories or houses have been
demolished
Employment structure The proportions of people who work in primary,
secondary, tertiary or quaternary jobs
Formal sector Work where people are formally employed, with
permanent jobs and regular pay
Green sector The part of economic activity that pays attention to
environmental issues
Industrial Stage The economic stage when manufacturing industry
develops
Informal sector Forms of employment that are not officially
recognised e.g. people working for themselves on the
streets of developing cities
Post-industrial stage Period in the development of a society when
manufacturing industry declines in importance and is
replaced by other forms of employment
Pre-industrial stage That period in development of a society when
manufacturing industry has yet to develop
Primary employment Working in the primary sector – extracting and
exploiting raw materials e.g. miner
Quaternary employment Working in jobs that are related to ICT and research
Regeneration Growth in areas that have experienced decline in the
past
Secondary employment Working in the secondary sector, making things
Sustainable
Telecommuter Person who works away from the office through the
use of the internet
Tertiary employment Working in the service sector, producing ‘intangible
goods’ e.g. teacher
Understand how the balance between employment sectors is changing
Employment can be divided into four main groups or sectors:
Primary industry – people extract raw material from the land or sea e.g. farming
Secondary industry – people are involved in manufacturing e.g. house building
Tertiary industry – provide a services e.g. selling goods or nursing
Quaternary industry – provide information and expert help e.g. IT

Employment structures: The proportion of people working in each of the primary,
secondary and tertiary sector
These are a method of showing employment structure and should be read in the
direction of the arrows
World Employment Structures
Globally LEDC’s such as
Nigeria and Kenya have high
amounts of primary
industries due to the fact
that there is a lack of
education and they are
mainly subsidence farmers.
MEDC's such as UK and USA
tend to focus on Tertiary
activities due to higher
education rates and tertiary
jobs are higher paid.
Primary is low due to the
fact that most MEDC’s have
taken to importing food
stuffs etc as it is cheaper.
Tertiary services support
and promote quaternary
services

In the pre-industrial stage low-income countries are mainly employed in primary
production, middle income countries are focused on secondary industries and finally
high-income countries are dominated by the tertiary sector.
This model tell us how employment changes over time and how the balance of
employment changes as a country develops. However it does assume that there is a
simple straight development path from LEDC’s to MEDC’s.
Process of industrialisation and deindustrialisation and the impacts of these
Industrialisation is a social and economic process which changes pre-industrial
societies (farming) to industrial ones. The industrial output is a good way of
measuring how industrialised a country is.
Deindustrialisation is the decline in manufacturing (secondary) industry and the
growth in tertiary and quaternary industries.
Mexico: an industrialising country
Mexico was originally mainly focused on agriculture but the growth of industry meant
many people moved from the rural areas to the cities. In 1950s manufacturing
became the biggest provider of wealth. Manufacturing has been attracted here due
to:
Reasons for
De-industrialisation
Greater competition from
countries such as China and
India Reduced demand for
traditional products due to
new technologies
Mechanisation has increased productivity and
reduced the number of workers needed

- a large and highly skilled workforce
- large consumer market (plenty of people to buy the products)
- Low distribution costs
- Close to government who make the decisions
Re-export businesses have sprung up which are located close to the USA boarder,
they are owned by foreign companies who process goods imported from the USA and
re-export duty free (no tax!). This has caused many problems such as the growth of
the ‘informal sector’ e.g. shining shoes.
Germany: a de-industrialised country
Germany has the 4th largest economy in the world. Deindustrialisation in the 1980s
forced manufacturing to move to lower-cost sites (many abroad) and the growth of
service industries. The decline in manufacturing meant that Germany had to act to
save its economy by setting up small manufacturing businesses. Germany now has 31%
of people employed in manufacturing but many people are now involved in knowledge-
based industries.
Factors leading to diversification of rural economy in a developed country
Diversify = create more variety in jobs and industry so that people are not dependent
on just one activity e.g. farming.
`
There has been a decline in farming this has meant that farmers have had to diversify
their livelihoods in order to survive:
- Food Festival e.g. Ludlow Food Festival = celebration of local food that attracts
lots of people
- Rural sports e.g. Trout fishing in Cumbria. Includes ideas such as paintballing,
shooting etc
Challenges for the
countryside
Lack of affordable homes due to
purchasing of second homes in
rural areas = increasing house
prices
Change in farming:
- Low wages, increasing
mechanisation, cheaper imports
- Supermarkets have driven prices
down
Lack of transport links
- Public transport is infrequent and
expensive
Local depopulation
- Younger people move out of rural
areas due to lack of jobs etc
Disappearance of local services e.g.
bus services, health services have
declined

- Farm diversification e.g. Runnage Farm Dartmoor has accommodation. Increase of
40% to UK farm incomes due to diversification.
Understand the environmental impact of employment change in urban areas of a
developing country
Mexico City has seen the growth of its manufacturing industries which in turn
attracts over 1000 people per day to the city. The growth of industry has created
many problems:
1. Pollution of the air by both factories and cars. Mexico City is surrounded by
mountains so the air cannot move freely around and this means pollutants such as
nitrogen oxides become trapped becoming ‘photo-chemical smog’.
2. The new firms and around 20 million people all demand fresh water. Providing this is
an issue as the city takes water from underground aquifers which are becoming
empty. As they empty the land also sinks (9mm per year).
3. Water supply is polluted by firms who dump chemical waste into rivers
4. Waste disposal system cannot cope. Although the authorities collect 10,000 tones
per day, the city produces 11,000 tonnes per day; the rest is thrown into the streets.
Understand the environmental impact of de-industrialisation and economic
diversification in one area within a developed country
Economic impacts Social Impacts Environmental Impacts - UK use to be a large
shipbuilding area but has
declined over the years
- Loss of personal income
- Loss of taxes to national
and local governments
- Rising demand for income
support services
- Loss of income in the local
areas due people’s lack of
spending power (cant afford
to buy things)
- Family breakdown
- Alcoholism and crime
- Permanent
unemployment
Positive:
- More available land
- Less water used in industrial
processes
- Less energy required for
machines
- Reduced traffic congestion
- Reduced noise and air pollution
Negative
- Derelict Land
- Empty factory buildings
- Good manufactured further
away = transport issues
Identify the potential for regeneration and environmental change on Brownfield
sites
Brownfield site = an area of land which has been built on before and is suitable for
redevelopment
Greenfield site = an area of land that has not previously been built on before
Developing Brownfield sites does have some negatives:
- Often more expensive to develop because of clean up costs
- Regulations for reclaiming the sites can often be a barrier to new development
- Some of these sites can be important wildlife habitats
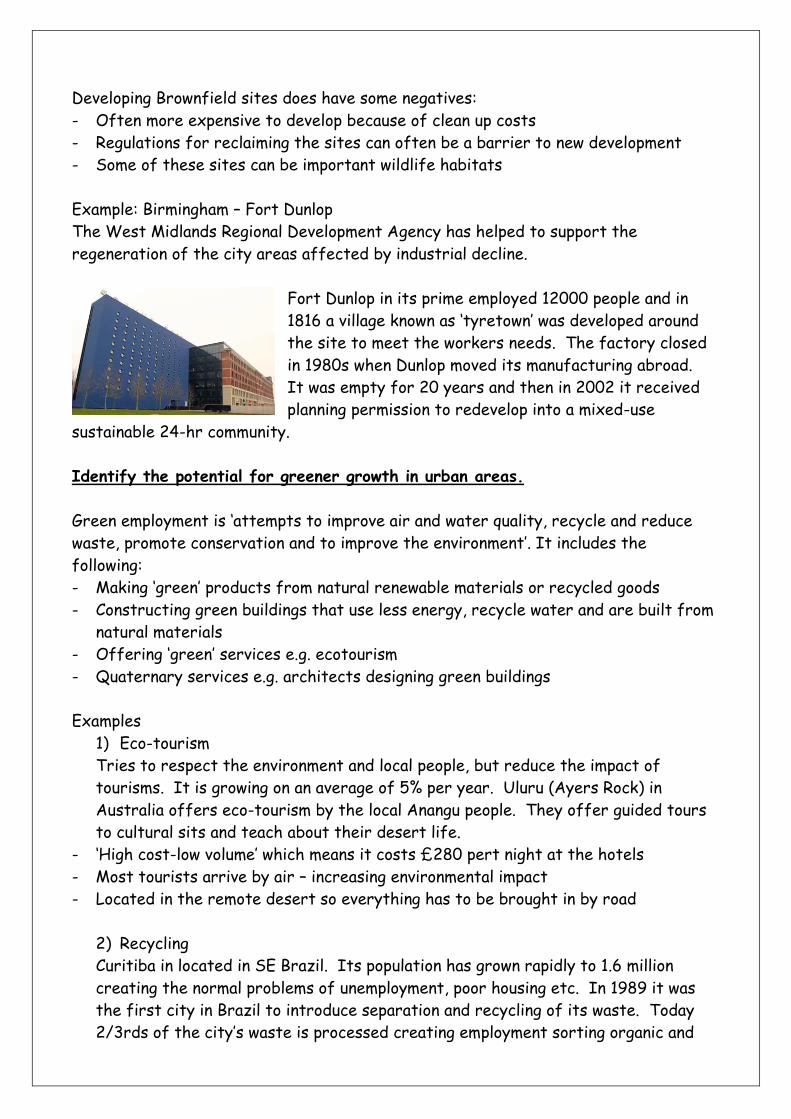
Example: Birmingham – Fort Dunlop
The West Midlands Regional Development Agency has helped to support the
regeneration of the city areas affected by industrial decline.
Fort Dunlop in its prime employed 12000 people and in
1816 a village known as ‘tyretown’ was developed around
the site to meet the workers needs. The factory closed
in 1980s when Dunlop moved its manufacturing abroad.
It was empty for 20 years and then in 2002 it received
planning permission to redevelop into a mixed-use
sustainable 24-hr community.
Identify the potential for greener growth in urban areas.
Green employment is ‘attempts to improve air and water quality, recycle and reduce
waste, promote conservation and to improve the environment’. It includes the
following:
- Making ‘green’ products from natural renewable materials or recycled goods
- Constructing green buildings that use less energy, recycle water and are built from
natural materials
- Offering ‘green’ services e.g. ecotourism
- Quaternary services e.g. architects designing green buildings
Examples
1) Eco-tourism
Tries to respect the environment and local people, but reduce the impact of
tourisms. It is growing on an average of 5% per year. Uluru (Ayers Rock) in
Australia offers eco-tourism by the local Anangu people. They offer guided tours
to cultural sits and teach about their desert life.
- ‘High cost-low volume’ which means it costs £280 pert night at the hotels
- Most tourists arrive by air – increasing environmental impact
- Located in the remote desert so everything has to be brought in by road
2) Recycling
Curitiba in located in SE Brazil. Its population has grown rapidly to 1.6 million
creating the normal problems of unemployment, poor housing etc. In 1989 it was
the first city in Brazil to introduce separation and recycling of its waste. Today
2/3rds of the city’s waste is processed creating employment sorting organic and

inorganic waste. Recovered materials are then sold to local factories and the
money is used to fund social programmes e.g. schooling.
Topic 5: Changing Countryside
What you need to know:

Issues facing rural areas in developing countries, e.g. rural isolation, economic
decline, depopulation.
Pressures on rural areas in developed countries.
The impact of changes to the national and global economy on rural areas in
developing economies.
Urban-rural links and their impact on rural areas in one developed country, and
the pressures created
Initiatives taken in rural areas in developing countries can help to address
issues of isolation and economic decline.
Declining rural areas can develop more sustainably if appropriate action is taken
Initiatives taken in rural areas under pressure in developed countries can help
to address the issues.
Rural areas under pressure can develop more sustainably in future if
appropriate action is taken.
Key Terms
Accessible countryside Countryside within easy reach of urban areas

Chocolate box village A rural settlement that appears to match the
picturesque image sometimes used on boxes of
chocolates
Commuter belt A residential area within relatively easy reach and
often surrounding a city, where many residents travel
to and from the city daily
Counterurbanisation The movement of people and employment from major
cities into smaller settlements and rural areas located
just beyond the city
Diversification
Environmental
degradation
Negative impacts of the natural environment,
generally through human action
Globalisation The process, led by transnational companies, whereby
the world’s countries are becoming part of one vast
economy
Grassroots scheme A scheme that originates within a local community
rather than being imposed from above
Honey pot A place of special interest or appeal that attracts
large number of visitors and tends to become
overcrowded at peak times
Rural depopulation The decline of population in rural areas and regions
SSSI Site of Special Scientific Interest – a small area that
has officially been protected because of its wildlife
or geology
Telecottaging Working from home in the country, using computer
communication
Urban Fringe The countryside surrounding an urban area
Issues facing rural areas in developing countries, e.g. rural isolation, economic
decline, depopulation
Less food
produced
Food
insecurity
Rural-urban

Spiral of Decline
Physical and human processes affecting developing areas:
1. Environmental degradation due to deforestation and desertification
clearance of vegetation in order to farm means soil erosion increases increasing
droughts lack of food
2. Population change high rates of natural increase pressure on natural
resources
3. Urbanisation more people are leaving the countryside as they are attracted to
the cities for jobs only elderly and females left in the countryside to do the
farming
4. Human hazards diseases and wars cause higher death rates less people to
produce the food
5. Globalisation land can be turned into exotic crop growing for people thousands
of miles away
Named Example: Malawi
Key Facts: - Annual GSP $800
- 50% of the population lives below the poverty line
- 33% are underfed
- Owes $1.8 billion in debt
Problems faced:
1) Rural isolation in southern Malawi
- Only 1 for every 139 people have access to a telephone
- Rural economy has hardly grown as it is poor infrastructure e.g. during wet season
it takes hours to travel 20 km
2) Rural Poverty
- Every day farmers spend 43 minutes collecting wood, 48 minutes walking to farm
plots and 128 minutes walking to market

- Rural areas have fewer healthcare facilities
- Primary schooling is free, but secondary schooling costs a family most of their
year’s income
3) Depopulation
- More people are leaving the countryside as they are attracted to urban areas for
jobs, education and healthcare. This results in the elderly and female population
being left behind.
The impact of changes to the national and global economy on rural areas in
developing economies
Named Example: Malawi
Growth of large estates created during the 19th Century colonisation of Malawi by
Britain. They estates plantations for tea, coffee and tobacco. They hire local
landless farmers and the get paid 1p per kg of tea leave picked.
Tobacco Tenants- Malawi has 1.4 million child labourers. These farmers are allocated
a plot of land by estate owners to produce a specific amount. Many tenants lack
medication, proper housing and safe drinking water.
Small holders – the majority of farmers in rural areas, 1.8million families and produce
80% of its food. They are using subsistence farming as they only produce enough
food for themselves.
Pressures on rural areas in developed countries
1) Decline in agricultural employment
The amount of land being farmed has decreased, but what it produces has
increased. The UK now grows around 60% of its food. Farming has also declined in
the urban fringe as more land is converted into building plots
2) Farm diversification
Due to the decline in farming, many farmers are not making enough profit from
food production alone. So they are finding other ways of making money out of the
farm or turning their farms into completely different businesses.
Examples: farm buildings turned into cottage industries e.g. making greeting cards
or renovated into second homes.
Spiral of decline in rural areas
People become
dissatisfied with
worsening quality of life
People leave for better
opportunities elsewhere

Urban-rural links and their impact on rural areas in one developed country, and
the pressures created
****Named Case Study: Lake District *****
The Lake District, in Cumbria, is one of the UK’s most popular National Parks.
(National Parks are outstanding areas of natural beauty). Due to its popularity and
accessibility it has a variety of problems:
1) Accessibility – under pressure due to how easy it is to get to the Lake District e.g.
Motorways bring people from Preston, Manchester etc
- UK car ownership has risen
- Rail access is good and improving
2) Traffic Congestion is a major problem e.g. 85% of people arrive by car causing
congestion on the narrow rural lanes
3) House prices are high due to summer homes pushing the prices of housing higher
beyond the reach of local people
4) Second homes – 40% of houses are second homes which destroys the local
communities
5) Seasonal unemployment – jobs in tourism are seasonal and low paid
6) Footpath erosion – 7 million visitor days each year cause footpaths to become
trampled and plants died.
Initiatives taken in rural areas under pressure in developed countries can help to
address the issues: LAKE DISTRICT CASE STUDY CONTINUED!
Making farming greener: - Arable rotation = rotating vegetables e.g. peas etc can fix nitrogen and reduce the
amount of fertiliser needed
- Organic Farming = Relies on crop rotation, compost and biological pest control to
maintain the soil and control pests. Does not use chemical fertilisers so it is
environmental friendly.
- Hedgerows = these control livestock and help to prevent soil erosion and water run-
off.

Housing problem in the Lake District
- charge second home owners more than 100% council tax to raise money
- Limit second home ownership
- Convert disused farm buildings into affordable housing
- Stop the Right to buy, to preserve the amount of council housing.
Traffic problem in the Lake District 1) Build Bypasses around key towns e.g. Ambleside – would improve journey times
and increase road capacity
2) Park and Ride at key towns – reduce town centre traffic
3) Limit car parking = reduce the number of parking spaces to put visitors off
arriving by car
4) Charge vehicles entering the national park = could use the money raised to
maintain the parks
Initiatives taken in rural areas in developing countries can help to address
issues of isolation and economic decline
***Named Case Study: Ethiopia***
Crops and a shop: Ethiopia is one of the poorest and least developed countries in the world. Due to
its location the climate is hot and arid making farming extremely difficult. FARM-
Africa is a non-governmental organisation which works with local rural communities
in Eastern Africa. The organisation helps them to built canal to channel water into
the fields, received starter kit of seeds and loans to open a small shop to sell items
like soap and salt.
Ethiopia’s millennium villages Millennium Promise is a non-governmental organisation who aims to end rural
hunger, disease and poverty. It is a ‘bottom-up’ approach which uses the following
ideas:
- building micro dams and safe water points
- refurbishing classrooms in local schools
- Distributing insecticide-treated bed nets to tackle malaria
Fish Farming World Vision has set up a project to develop fish farming in Malawian families
affected by HIV/AIDS. It helps farmers to dig small, rain-fed ponds designed for
common freshwater fish. Kitchen waste is used to feed the fish and provides a good
source of income to the families. It has helped reduce children malnutrition from
45% to 15%. It has also doubled the income of 1200 households.
Topic 7: Development Dilemmas
What you need to know:
Economic development can lead to regional economic differences in developing
countries
Disparities can develop between urban and rural areas in the same country
Development models in developing countries are usually ‘top-down’ or ‘bottom-up’
The impact of top-down development in a developing country
Characteristics of bottom up development
Impacts of bottom up development in a developing country
The characteristics of sustainable development in rural areas
Are top-down or bottom-up schemes more appropriate for rural areas in
developing countries in future?

Key Terms
Appropriate Technology Equipment that the local community is able to use
relatively easily and without much cost
Bottom-up approach Development projects that come from local
communities rather than central government or
external agencies
Core region The most important social, economic and political area
of a country or global region – the centre of power
Disparity A great difference – between parts of a country in
terms of wealth
Environmental Impact
Assessment
A method of evaluating the effects of plans and
policies on the environment
Hydro-electric power The use of fast flowing water to turn turbines which
produce electricity
Human Development
Index
A measure of development that uses four economic
and social indicators to produce an index figure that
allows comparison between countries
Micro-Hydro Schemes Small-scale HEP that generate electricity locally
Millennium Development
Goals (MDGs)
The development goals agreed by the world
governments at the UN summit in September 2000
Non-government
organisations
Charities such as WaterAid who do not report back to
a specific government or country
Periphery The outer limits or edge of an area, often remote or
isolated from the core
Poverty A state of shortage of money and goods, usually
measured in terms of average wealth and income in
society
Poverty Cycle A set of processes that maintain a group or society in
poverty
Top-down approach Approach in which projects are set up and organised
by governments, often with little consultation with
local communities

Economic development can lead to regional economic differences in developing
countries
Development means improvement for people and the economy. Within a country
there tends to be disparity between the core areas (urban areas with the majority
of people and services) and the periphery (rural remote countryside).
Upward spiral caused by Multiplier effect
Measuring Development:
1) Economic Wealth
Measured as Gross Domestic Product (GDP) per capita = the total value of goods and
services in a nation measured over a year
2) Human Development Index (HDI) gives a country a score between 0 and 1 and is
based on life expectancy, education and income.
3) Birth rates – The number of babies born per thousand per year
4) Death rate - The number of deaths per thousand per year
5) Infant mortality rate – The numbers of babies who die before the age of 5 per
thousand per year
6) Access to clean water
7) % rural population – The amount of people who live in peripheral/countryside areas
8) Types of employment – amount/percentage of people employed in primary,
secondary, tertiary etc
9) Level of literacy – the numbers/amount of people who can read and write
Need houses, water and
services
Growth continues and
settlement and economy
expand
Demand for more workers
Workers need to build and
provide these Need Food
Shops open, more services
needed
Needs workforce People move there
Growth of industry
Investment
Disparities can develop between urban and rural areas in the same country: India
Core area: Maharashtra Is India’s richest core region with the highest GDP and contains India’s largest
city, Mumbai. It has grown due to various reasons:
- Services e.g. banking, IT and call centres. Mumbai’s universities produce English
speakers who are employed by large Western companies e.g. BT.
- Manufacturing: cotton, food processing, steel, engineering and cement are
commonly exported.
- Entertainment: Mumbai has the world’s largest film industry- Bollywood
- Leisure and business services – hotels and restaurants
Periphery area: Bihar Bihar is India’s poorest state with 86% of population live in rural areas with most
working in farming.
- Average incomes are only 6000 rupees (£75) per person per year. This is 33% of
India’s average income
- 55% of households live below the poverty line and 80% of people work in low-level jobs
- It gets very little investment from companies because its people cant afford basic
services
- In 2003, only 58.5% had electricity and 12% water-flushed toilets
- School attendance is low with only 35% of children attending primary school and
8% reached upper primary.
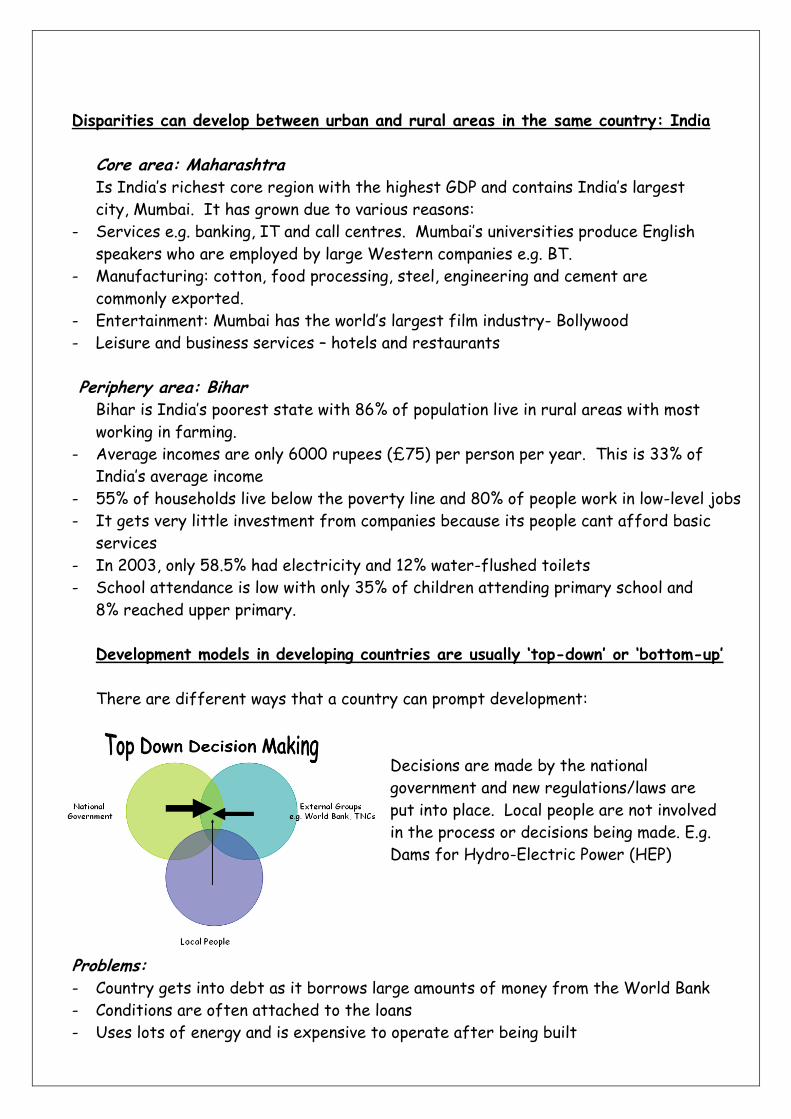
Development models in developing countries are usually ‘top-down’ or ‘bottom-up’
There are different ways that a country can prompt development:
Decisions are made by the national
government and new regulations/laws are
put into place. Local people are not involved
in the process or decisions being made. E.g.
Dams for Hydro-Electric Power (HEP)
Problems: - Country gets into debt as it borrows large amounts of money from the World Bank
- Conditions are often attached to the loans
- Uses lots of energy and is expensive to operate after being built

- Often take resources away from peripheral
areas that need it
Local people are fully involved in the process and
decision-making and therefore the development
scheme are often more appropriate to the local
needs of the people.
E.g. Building a biogas digester
The impact of top-down development in a developing country: Santo Antonio Dam in
Brazil
Background:
- Part of the Madeira River Project
- Madeira River Basin covers 1.5 million km2 and the dam is located 5km upstream
from Porto Velho
- Cost $5.3 billion to build and will produce 3,150 MW of electricity
Social Economic Environmental
Advantages - 20,000 jobs
created
- Attracted 100,000
people to the area
- Health, education
etc have improved
- Education and
training centre for
immigrants
created
- Produce the
cheapest electricity
in Brazil
- Will supply 8% of
Brazil’s electricity
- Better
infrastructure
(roads and
waterways) in centre
of S. America
- HEP is renewable and
avoids use of
oil/nuclear
- Fish channels in the
dam allows fish to
migrate
- Two forests will be
planted
- Suggestions by public
have been included in
basic environmental
plans
Disadvantages -Dam built despite
local opposition
- 3,000 people forced
to leave their homes
- Indigenous peoples’
land at risk of
flooding
- Increase in malaria
due to greater water
- cost $22 billion
- Too much reliance on
HEP (76% of
electricity)
- High sediment loads
can block turbines
reducing their
effectiveness
- commercial fishing at
- River food webs will be
affected
-Final flooded area was
x2 as large as predicted
(+1000km2)
-Project fined £3.3
million for killing 11
tonnes of fish

area risk, from the dam
Impacts of bottom up development in a developing country: Micro-hydro schemes
in Peru
Micro-Hydro schemes are those with an
electricity generating capacity of less
than 100KW. The water is diverted
from a stream to a high point of the
valley side and then down a pipe to turn
a turbine.
These are considered appropriate for
the local skills level and help spread
technology to the rural periphery. They
are low cost and involve the local people
Peru:
In the poorest area of Peru 44% of people live on less than $2 a day. Rainfall in the
area is high so a charity called ‘Practical Action’ helped install 50 schemes providing
electricity for 30,000 people.
Social Economic Environmental
Advantages - Local people involved
in all stages of the
scheme
- Health care is
improved as
electricity allows
storage of medicines
- Electricity for schools
- Training of local
people to operate the
technology gives them
skills
- Cheaper
electricity than a
large HEP scheme
- Scheme uses local
skills and cheap
technology
- 60% of people in
the area said that
their income had
increased
- Avoids flooding large
areas of land that
would take away
farmland
- Avoid the need to
burn wood from local
trees for fuel
- Replaces fossil fuel
use
Disadvanta
ges
-Poor people have to pa
for the electricity which
is metered
- Some villages have
doubled in size creating
population pressures
- Demand for
electricity is variable
- Initial capital cost
is high for a poor
village e.g. £500 per
household
Some specialised
equipment had to be
imported
- Small storage dam is
needed which alters the
flow of the river and
spoils the scenery

The characteristics of sustainable development in rural areas
Are top-down or bottom-up schemes more appropriate for rural areas in
developing countries in future?
Achieving sustainable development can become a problem for developing countries as
they are stuck in a cycle of poverty. Large top-down schemes that focus on national
problems (e.g. Santo Antonio Dam) may overlook the rural poor and do very little to
improve the lives of local people living in the periphery. Small-scale, bottom-up
schemes are often more appropriate and more sustainable in the long term.
Cycle of Poverty
Nature-small overall impact
on the natural environment
Social – long term benefits
for the local population e.g.
education, energy etc
Appropriate technology –
method and equipment used
are at a level people can
understand and use
Local Decision making –
local people involved in all
stages of planning and
choice
Affordable – initial cost and
maintenance is low enough
for local people to afford
them
FEATURES OF
SUSTAINABLE
SCHEMES
Subsistence farming
Little or no surplus
farm produce
No investment in
land improvement,
machinery or
materials
Little or no income

It is hard for developing countries to improve the well-being of the population whilst
still ensuring the conservation of ecosystems and resources.