Embed Size (px)
Citation preview

GCE MARKING SCHEME
GEOLOGY AS/Advanced
SUMMER 2010

INTRODUCTION The marking schemes which follow were those used by WJEC for the Summer 2010 examination in GCE GEOLOGY. They were finalised after detailed discussion at examiners' conferences by all the examiners involved in the assessment. The conferences were held shortly after the papers were taken so that reference could be made to the full range of candidates' responses, with photocopied scripts forming the basis of discussion. The aim of the conferences was to ensure that the marking schemes were interpreted and applied in the same way by all examiners. It is hoped that this information will be of assistance to centres but it is recognised at the same time that, without the benefit of participation in the examiners' conferences, teachers may have different views on certain matters of detail or interpretation. WJEC regrets that it cannot enter into any discussion or correspondence about these marking schemes. PAGE Geology - GL1 1 Geology - GL2a 5 Geology - GL3 14 Geology - GL4 20 Geology - GL5 27

1
GL1
Q.1 (a) � Correct use of scale e.g. 60 cm depth (1) [2] � Trough shaped / Concave up (or equivalent) (1) � Irregular (1) � Cross cutting (or equivalent) (1) � Unconformable / unconformity / erosional surface(1) (b) (i) � size quoted e.g. max clast size 25 cm, mean 10-15 cm (1) [3] � Coarse (1) � Rounded clasts (1) � Poorly sorted (1) � Matrix supported (1) � Clastic / granular / fragmental (1) (ii) Conglomerate (1) [1] (c) (i) Septum (1) [1] (ii) Coral eroded out of rock (1) [3] � Coral redeposited (1) � Derived fossil (1) � Coral = marine (1) � Marine by uniformitarianism (1) (d) (i) � Not preserved in life position (2) [2] or � Moved (1) � after death / before preservation (1) (ii) � Plant roots point down (1) [2] � So in life position / Not been moved (1) (e) False (but only credit if well justified) (1) [3] � Tree fossils indicate land environment (1) � Coal indicates non marine environment (1) � Corals = marine (1) Credit other sensible answers (e.g. coral could be from sandstone if marine) 17 marks

2
Q.2 (a) (i) � Destroyed by metamorphism (1) [2] � Effects of heat and pressure � No fossils preserved (1) � Lack of hard parts (1) � Lack of living organisms at time (1) (ii) � Goniatite (1) [2] � Only one alive in Carboniferous (1) (b) � Normal (1) [2] � Fault plane dips to downthrow side / younger rocks or Footwall has moved up or Hanging wall has moved down (1) (c) (i) � Rocks below are dipping, rocks above horizontal (1) [2] � Rocks below are faulted, rocks above are not (1) � Some rocks below metamorphosed, rocks above not (1) � Sandstone above lies directly on top of many different rocks (or
equiv) (1) (ii) � Carboniferous rocks lie directly on Cambrian rocks (1)R [2] � There is a time gap / hiatus (1) � (Ordovician and Silurian) rocks are missing (1) � Erosion of rock (1) or equivalent
(d) (i) � Well rounded / spherical (1) [2] � Well sorted (1) � Frosted / pitted grain surface (1) (ii) � Explanation of rounding / sphericity by attrition in air [2] and/or by abrasion (1) � Explanation of sorting by air (1) � Explanation of frosting / pitted surfaces by attrition in air and/or by abrasion (1) (iii) � Cross bedding drawn correctly [3] (i.e. max 45 ° and concave up) (1) � Drawn sloping down to south (1) • Appropriate scale (approx 1-100m) (1)
17 marks

3
Q.3 (a) (i) → ← → [2] 3 correct = 2 marks 2 correct = 1 mark 1 or 0 correct = 0 marks (ii) Trench labelled correctly (1) [1] (b) � Subduction/benioff zone (1) [4] � Friction / pressure (1) � Stress Release (1) � Volcanic activity / rising or moving magma (1)R � Detail on impact of moving magma (1) (c) (i) Slate / schist / gneiss / marble / metaquartzite (1) [1] (ii) • High temp and pressure (1) [2] • Plate convergence or equivalent (1) (d) (i) • Partial melting (1)R [2] • Of oceanic crust / basaltic / mafic plate (1) • Contamination by ocean trench sediment or island arc (1) (ii) • Mantle origin for magma (1)R [2] • Mantle is ultra mafic (1) or equivalent Credit other sensible answers 14 marks

4
Q.4 (a) (i) 60 m (accept 55-65 m) (1) [1] (ii) 320 m (accept 310-330 m) (1) [1] (b) • Line on graph below line for 1 km intrusion (1) [2] • Line starts at same point on y-axis (1) (c) • Crystalline / crystals (1) [3] • Mosaic / granoblastic / sugary (1) • 0.8-2.0 mm (1) • Equicrystalline / equigranular (1) • Random (1) • Interlocking / fused (1) (d) (i) • Correct distance from pluton (1) [2] i.e. within 1 cm of pluton • In shale (1) (ii) Short distance from base of lava in sandstone parent (1)R [3]
Explanation that it forms from metamorphism of sandstone (1) Explanation that it forms because of heat from the lava flow (1) Explanation that it forms beneath the lava flow only (1) 12 marks

5
GL2a
Q Marks Expected Answer Acceptable Answer Do Not Accept 1(a) (i)
(ii)
(iii)
(iv)
� �
2
�
1
� 1
� � � �
4
Crystal J • flesh/pink
Crystal K • colourless/ grey
Crystal J
• has cleavage/2 good cleavages Crystal K
• has no cleavage/conchoidal fracture
Crystal J size
• 15 mm Crystal J at a faster rate of cooling … (any 2 from)
• false • J is larger than K • J slower to cool
Crystal J formed after… (any 2 from)
• false • J has good shape • J formed before
• brown/fawn/buff/orange
• none
Award the mark if only Crystal J or K is described
Max 1 if correct size/cooling statement but crystals are not/incorrectly labelled
• K is smaller than J/K faster to cool Max 1 if correct size/cooling statement but crystals are not/incorrectly labelled
• J is a phenocryst/K has poor shape/K formed after/K forms the groundmass
white – if this appears in a list of colours, award 0 mark white/transparent/glassy/black – if these appear in a list of colours, award 0 mark Answers which do not refer to named crystals/do not distinguish between the two/where there is an incorrect statement for either mineral If more boxes are ticked, deduct 1 mark for each box which is wrongly chosen to a minimum of 0.
(b)
� �
2
• The rock texture becomes coarser The textural changes are gradual
If more boxes are ticked, deduct 1 mark for each box which is wrongly chosen to a minimum of 0.
Total 10

6
Q Marks Expected Answer Acceptable Answer Do Not Accept
2(a)
(i)
(ii)
(iii)
�
1 �
1 � � � �
4
For centres where Specimen B is a sandstone (“medium” clast size)
• e.g. within the range: 0.5 to 2.0mm
• to intersect within “medium” Drawing to show
• clasts – more rounded than angular • clasts – mixed shape/size • pore spaces/cement • scale [in size range of a)(i)]
For centres where Specimen B is a “gritstone” (“coarse” clast size)
• e.g. within the range: 2 to 4 mm
• to intersect within “coarse” Scale can be represented in various ways, e.g. scale bar
× 2 See marked examples below:
Not “fine”/ less than 1/16 mm
clasts
clasts - mixed
pore spaces/cement
scale
clasts
clasts - mixed
scale
clasts - mixed
although this is “crystalline”, credit is give for the mixed size. No scale is given.

7
Q Marks Expected Answer Acceptable Answer Do Not Accept
(b) � � � �
4
Marks are to be awarded for describing the evidence Figure 1
• fining-up cycle Photograph 2
• plant fossil Photograph 3
• cross-bedding Specimen B
• arkosic sandstone or • grain shape linked to abrasion
(during river transport)
• repeated/cyclic/fining-up/grading of or graded beds/decreasing or changing energy level/erosional bases/meandering river sequence
credit answers where there is an argument that this could be a turbidite sequence in deep marine environments
• preserved in flood plain sediment (as shown in Figure 1)
• credit references to channel fill deposits
credit answers where there is an argument that this could be other environments with current activity e.g. shallow marine/aeolian
• pale coloured sediment/ immature/feldspar
Answers referring to deltaic, shallow marine or aeolian environments Marine plant or the fact that the fossil was found in fine sediment which is not linked to a fluvial environment The terms “sandstone”, “orthoquartzite” or “greywacke”
Total 10

8
Q Marks Expected Answer Acceptable Answer Do Not Accept
3(a)(i) (ii)
� � �
3
� �
2
Drawing to show • minimum of 3 porphyroblasts (e.g.
in “H-shape”) in a fine groundmass
• good shape • random orientation
• contact/thermal • random orientation/low pressure
See marked examples below:
• proximity to igneous body on Map1/ andalusite or chiastolite or spotted rock
Regional or just “metamorphism”
porphyroblasts in fine matrix
good shape
random
the pattern of porphyroblasts is not that seen in the photograph
good shape
random
there was no instruction to draw to scale. The pattern can be recognised, so the candidate gets the benefit
porphyroblasts in fine matrix
good shape
random

9
Q Marks Expected Answer Acceptable Answer Do Not Accept
(b) � � �
3
Texture • crystalline
Composition • calcite/CaCO3/carbonate
Rock type • marble
• sugary,equigrannular/saccharoidal/etc
• acid reaction
clastic/fragmental texture contains quartz calcite/any derivative of a non-limestone (e.g. hornfels/metaquartzite)/metamorphic rock)
(c) � � � �
4
The evidence is only marked if the evaluation is correct. Locality II Map 1
• True - Rock Unit E is concordant with country rock therefore is not a dyke
Locality II Map 1 and Photograph 4
• False - there is metamorphism at the basal contact of Rock Unit E so it could be a sill or a lava flow
Locality III Map 1 and Specimen D
• True - there is metamorphism at the top contact of Rock Unit E so it is a sill
Locality IV Specimen E
• True - Dolerite is a texture of an intrusion rather than a lava flow
• a dyke would be discordant
• lava flow would also alter at the base
• lava flow would not alter at the top
• rock is medium textured/lava flow would be fine textured
Evidence if evaluation is wrong True - answers referring to sill only
Total 12

10
Q Marks Expected Answer Acceptable Answer Do Not Accept 4(a)(i)
(ii)
(iii)
� 1
� � �
3 �® �
2
• Dip - 80o
• Older • East of fault • Normal movement
Throw
• 500m Calculation at top contact of Rock Unit E
• spot heights 750m (West of F1) – 250m (East of F1)
• borehole 750m (West of F1) - (100m depth down borehole) 250m relative to sea level
• Dip 75o - 85o
An erratum was issued to instruct candidates to alter the Map 1 spot height of 300m to 250m. If there is evidence that a candidate has not done so, accept 450m as the throw and credit the calculation if it is based on the original spot heights.
Not vertical/90o If more boxes are ticked, deduct 1 mark for each box which is wrongly chosen to a minimum of 0. The Eastern spot height at 750m which calculates the throw of F2 not F1.
(b)(i)
(ii)
(iii)
�
1 � �
2 �®
1
• The fourth box [where the sequence is B (younger)/G /F (older)]
• Labelled APT trending North – South
• drawn within Rock Unit B
• limbs of equal dip reason
• limbs/ outcrops of Rock Unit G have an equal width
• symmetrical pattern of outcrop/
“ equal thickness” of outcrop
If more boxes are ticked, deduct 1 mark for each box which is wrongly chosen to a minimum of 0. Any APT not drawn North - South APT drawn at the boundaries of Rock Unit B or not within Rock Unit B. If more boxes are ticked, deduct 1 mark for each box which is wrongly chosen to a minimum of 0. Limbs dipping at 45o/equal dips. If no acceptable reason is given, award 0 mark.
Total 10

11
Q Marks Expected Answer Acceptable Answer Do Not Accept 5
see below
Candidates are asked to complete the sketch, not to construct, so the mark scheme allows for some variations in dips/positions of beds.
• Approximate dip values for fold limbs (35o – 55o)
• Credit horizontal D/E/C between F1 and F2 if borehole not used to get heights relative to sea level
Any dip on unconformity (base C) Non-vertical APT of fold Vertical fault F1
Total 12
Any cross-cut
at unconformity/fault
Horizontal beds at correct heights either
using borehole data/spot heights
Draw horizontal base of C
• Near X or Y
Draw west fold limb at 45o
• B/G or G/F Draw east fold limb at 45o
• G/F
Inclined F1
Draw pluton
Vertical fold axis
Draw B/G between faults
– at 45o
Draw horizontal base of
• D/E or E/C
• C
Draw B/G to East of F2
– at 45o

12
Q Marks Expected Answer Acceptable Answer Do Not Accept 6
A “hiatus” time gap implies a break in the deposition of rocks during which time the processes of the rock cycle have caused earth movements and/or weathering and erosion, before renewed deposition starts again. A wide range of responses will be expected which can be from any of the following: Fieldwork evidence (from one or more localities):
• written descriptions • sketches (annotated) • maps (annotated) • sketch sections (annotated)
Map 1 evidence:
• written descriptions • maps (annotated) • sketch sections (annotated)
Photograph 5 evidence:
• written descriptions • sketches (annotated) • sketch sections (annotated)
Marks to be allocated to Basic Statements (to a maximum of 3) and Details of any/all of these (to a maximum of 5) The planar surface acting as the contact of the rock units involved must not be faulted (e.g. a thrust), although it is anticipated that only the higher level responses will address this. Full marks can still be awarded if this is not discussed. e.g. Basic Statement
• Rock units with different dips Detail (fieldwork/Map 1/Photo 5)
• observation or measurement of dips • cross cutting/overlap of rocks by an
overlying (sedimentary) rock unit. e.g. Basic Statement
• Rock units with different structures Detail (fieldwork/Map 1)
• observation or measurement of dips • cross cutting/overlap of structures
(fold and/or faults) by an overlying (sedimentary) rock unit.
e.g. Basic Statement
• Rock units with different major rock groups
Detail (fieldwork/Map 1) • Observation of igneous, metamorphic
and sedimentary rocks • cross cutting/overlap of igneous or
metamorphic rocks by an overlying (sedimentary) rock unit.
A locality name as evidence for a mark without any description. The unconformity at the base of C cutting (i.e. younger than) Faults F1 and F2

13
Q Marks Expected Answer Acceptable Answer Do Not Accept basics
� � � Max 3 details � � � � � Max 5
e.g. Basic Statement • Rock units with different ages
Detail (fieldwork/Map 1) • detail of the contact – weathered
surfaces/bored surfaces/included fragments/change in fossil ages
e.g. Basic Statement
• Rock units with sedimentary environments of deposition
Detail (fieldwork) • e.g. continental aeolian/red beds
overlying deep marine turbidites
Total 6

14
GL3
Q.1 (a) (i) → (1) [1] (ii) Intermediate (Andesite) (1R) Island arc – Andesite Crater / ash / pyroclasts / =explosive Silica rich / viscous / subduction of ocean lithosphere (Max 2 marks) [3] (b) Holistic Suffocation / respiratory problems Weight causes roof collapse Problems for aviation Crops ruined Lahar potential (any 2 described) [2] (c) (i) [2]
(ii) Subic further but same thickness as Clark (1) Wind direction (1) blowing from NE to SW (1) (Max 2 marks) [2]
(d) Describe (2 max) Pyroclastic deposits – nearer volcano blanketing the slopes Lahars – further from volcano and confined to valleys Explain – Holistic (2 max) Nature of flow / material, Speed / force of flow Slope angle [3]
Total 13 marks
Location Thickness of ash deposit / cm
Distance from crater / km
Clark US Air Base
20
• 18 Subic • 20 32

15
Q.2 (a) (i) On Fig 2 – at WT / surface interface (or downhill) (1) [1] (ii) Cone of depression drawn (1) Accuracy (outside mine workings) (1) (Max 2 marks) [2] (iii) Explain : where extraction exceeds (1) rate of recharge (1)
(Max 2 marks) [2] (b) (i) Pyrite (or other metal pollutants)(1R) Water table lowered – weathered by contact with air and water (1) as more exposed by mining / increase in surface area (1) as water table rises – weathered products dissolve (acid water) (1) (Max 3 marks) [3] (ii) Limestone reacts with acid (1) Increase the pH (1) To more neutral(1) (Max 2 marks) [2] (c) One of the following described: Stability of working faces Rock falls Ground subsidence Gas explosions Flooding Waste tipping. Holistic (Max 2 marks) [2]
Total 12 marks

16
Q.3 (a) Describe any two monitoring techniques used to predict hazardous geological
events, evaluating its degree of its success in hazard prediction. Holistic for any hazardous geological event Expect:
Volcanic: Ground deformation (tiltmeters, GPS, satellites etc)
Gravity measuring Thermal measuring Gas monitoring (SO2, CO, etc ) Seismic (see below) Seismic: Changes in seismic activity Groundwater levels / pressure Tilting Radon gas emissions Electromagnetic signals Electrical resistivity Animal behaviour Earthquake lights. Mass movement: Mapping / surveying Creep / strain measurement Groundwater pressure Seismic
(Max 5 marks per monitoring technique- max 7 if no evaluation) [10]
(b) Using named examples, explain the extent to which the destructive effects of hazardous geological events may be managed and controlled to reduce risk.
Holistic – a combination of hazard mitigation Expect – Volcanic – control of lava speed and direction, evacuation etc Seismic – stress release along faults, building design etc Mass Movement – slope stabilisation, drainage, retaining structures, etc (If no attempt at extent – max 12) [15]
Total 25 marks

17
Q.4 (a) Explain how two of the following factors can trigger mass movements of rock
and soil: (i) Angle of slope Slopes above 35 degrees are often unstable in unconsolidated
material (exception – solifluction etc) Gravity overcomes friction = rockfall / slides, rotational slip,
slumping, debris flows. Examples.
(ii) Lithology Shale, clay etc. are incompetent and will flow / slip under load
pressure and lubrication – rotational slip. Examples Sandstone / Limestone – joint patterns/bedding. Crystalline igneous and metamorphic = strong but less stable if
cleavage present. Permeability (iii) Groundwater / rainfall Water acts as a lubricant to accelerate movement by reducing friction
between blocks / particles. Pore pressure, erosion. Examples (Aberfan)
(iv) Ground vibration Vibration acts to reduce friction between blocks / particles. Action of
heavy traffic, earthquakes. Examples (Mt St Helens) (5 marks each to include credit for examples and diagrams) [10]
(b) Describe the attempts that are made to manage and control unstable slopes.
Reprofile to below the stable angle (approx. 35 degrees depending on other factors) Drainage control – drains, pipes etc to remove surface water to improve cohesion. Planting trees – reduces interception, removes water and roots bind the soil. Engineering structures:- Gabions, retaining walls, shotcrete, rock bolts etc. Prevention of instability caused by human activity/reduction of erosion at toe. Monitoring techniques – mapping, air photos-satellite imagery, surveying, measurement of creep / strain, groundwater pressures. Credit for examples [15]
Total 25 marks

18
Q.5 (a) Describe how marine erosion and deposition may be influenced by civil
engineering activity in coastal areas.
Cliff erosion is slowed by groynes / seawalls / rip rap etc which • Protect base of cliff from undercutting • Provide stability for toe of landslide etc • Increases the size of the beach (in the case of groynes) – reduces energy
of waves Coastal stability is increased by • Reducing steepness of the cliff • Draining cliff (planting trees or use of drainage pipes) Coastal deposition – longshore drift pattern changed. • Reduction in amount of sediment available • Reduction in deposition in unprotected parts of the coast • Results in increased marine erosion in unprotected area • Diagrams essential, examples given credit.
Erosion and deposition must be covered. No diagrams – marked out of 8 max [10]
(b) Explain the geological factors and rock properties that must be taken into account when planning to build a rock tunnel.
Examples of unfavourable / unstable geological structures relating to Effect of dip of strata/cleavage – daylighting on slopes in tunnels or cuttings Stable friction angles (~35 degrees) Fracturing of fault planes Density of joints / erosion / weathering of joints Effect of water – pore pressure Effect of differing rock strengths – shale / clay v sandstone / granite, etc Case studies credited (Max 15 marks) [15]
Total 25 marks
19
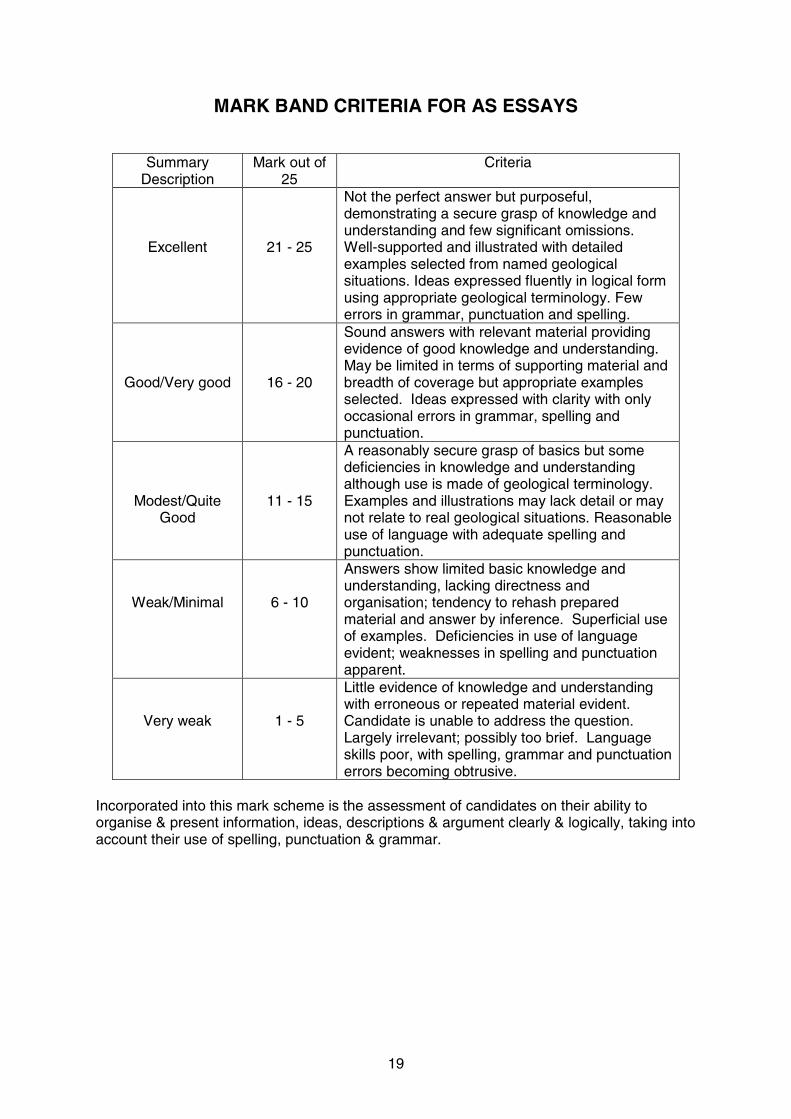
MARK BAND CRITERIA FOR AS ESSAYS
Summary Description
Mark out of 25
Criteria
Excellent
21 - 25
Not the perfect answer but purposeful, demonstrating a secure grasp of knowledge and understanding and few significant omissions. Well-supported and illustrated with detailed examples selected from named geological situations. Ideas expressed fluently in logical form using appropriate geological terminology. Few errors in grammar, punctuation and spelling.
Good/Very good
16 - 20
Sound answers with relevant material providing evidence of good knowledge and understanding. May be limited in terms of supporting material and breadth of coverage but appropriate examples selected. Ideas expressed with clarity with only occasional errors in grammar, spelling and punctuation.
Modest/Quite Good
11 - 15
A reasonably secure grasp of basics but some deficiencies in knowledge and understanding although use is made of geological terminology. Examples and illustrations may lack detail or may not relate to real geological situations. Reasonable use of language with adequate spelling and punctuation.
Weak/Minimal
6 - 10
Answers show limited basic knowledge and understanding, lacking directness and organisation; tendency to rehash prepared material and answer by inference. Superficial use of examples. Deficiencies in use of language evident; weaknesses in spelling and punctuation apparent.
Very weak
1 - 5
Little evidence of knowledge and understanding with erroneous or repeated material evident. Candidate is unable to address the question. Largely irrelevant; possibly too brief. Language skills poor, with spelling, grammar and punctuation errors becoming obtrusive.
Incorporated into this mark scheme is the assessment of candidates on their ability to organise & present information, ideas, descriptions & argument clearly & logically, taking into account their use of spelling, punctuation & grammar.

20
GL4
Q.1 (a) A – Basalt / mafic / basic (1) B – Andesite / Rhyolite / acidic / silicic / intermediate (1) [2] (b) (i) X = 1300 ºC / range 1250-1350 ºC (1) Do not accept 'partial melt' X = Solid (1) [2] (ii) Line from X to surface (1) at 1200 ºC (1) [2] (iii) Rising convection currents (1)
Decompression melting / pressure reduction (1) Melting point crossed / partial melting occurs (1) (max 3 marks) [3]
(c) Origin - Seawater / wet sediment / release of water from hydrous sediment (1) brought down by subduction (1) (max 2 marks)
Effect - Lowers melting temperature (1) (max 1 mark) [3] (d) Gravity differentiation (1) Early crystals, more dense, settle out (1) Leaving magma above more silicic (1) or Contamination (1) Stoping intrusion (1) xenoliths fall into the magma (1) Become assimilated (1) and change the original composition
Holistic – 3 marks max [3]
Total 15 marks

21
Q.2 (a) (i) ~150 / range 140-160 (1) [1] (ii) Palaeozoic (1) [1] (b) (i) Cambrian fauna static – low (1)
Palaeozoic fauna dominate up to End-Permian (1) Modern fauna dominate after P/T extinction (1) Numbers given (1) (max 3 marks) [3]
No credit if Phanerozoic confused with Palaeozoic (ii) Approx 250/500×100 = 50% (1) (range 45-55%) (1) [2] (iii) Holistic: • Impact event / meteor • Volcanism • Methane hydrate gasification • Sea level fluctuations • Anoxia • Hydrogen sulfide emissions • The supercontinent Pangaea • Combination of causes • Described (max 3 marks) [3] No credit for snowball earth (wrong time, etc) (c) (i) Benthonic mud grubbers v pelagic forms (swimmers)
Non burrowers (beneath the benthos) v burrowers (Accept – Increase in predation Innovation in feeding / breathing techniques) [2]
(ii) Preservation is poor / biased / incomplete (1) Exceptional preservation shows true diversity Plus two examples from below:
Fossil record is biased in favour of Marine organisms Mineralised hard parts Low energy environments Rapid burial
Fossil record is incomplete Natural processes of
Bacterial decay Predation / scavenging Diagenesis / tectonic / metamorphism Weathering / erosion [3]
Total 15 marks

22
Q.3 (a) (i) [3]
Fold element Description
Fold type • Antiform / anticline
Symmetry Symmetrical – limbs the same length
Orientation of the axial plane trace
• N-S
Direction of plunge of fold axis • S
(ii) Wavelength = shorter / smaller (1) Symmetry = asymmetrical / non-symmetrical (1) [2] (iii) Shale – incompetent, ductile / plastic behaviour (2 max)
Sandstone – competent – elastic, less ductile behaviour (2 max) (max 3 marks) [3]
(b) (i) Dyke (1) [1] (ii) Shale – centred / symmetrical around axial plane (1), mirroring south
of fault (1) [2]
(c) 1. Yes – Fault and fold are formed by crustal shortening Evidence – fault is reverse / σ max is horizontal (1)
No – Faulting was after the folding Evidence – different orientation of σ max / fault cross-cuts fold (1) 2 Yes – Dyke formed after folding (cuts shale / sandstone / fold (1) Can’t tell – No evidence of cross cutting (1)
(max 4 marks) [4]
Total 15 marks

23
Q.4 (a) (i) A near continuous continental landmass (1)
Stretching from S pole to N (1) 2 major continental areas separated by a narrow ocean (1) (max 2 marks) [2]
(ii) Large landmass at poles (1) Away from warm water influence (continentality) (1) Cold – capable of supporting thick glacial ice accumulations (1) Restricting free circulation of polar and tropical waters (1) Mountain belts disrupt atmospheric circulation (1) (2 marks) [2]
(iii) Holistic Tillites (angular, poorly sorted, unstratified) Dropstones – deposited from floating ice Striations – abrasion caused by moving ice Accept other glacial deposition (moraine, drumlin, erratic, etc) (max 2 marks) [2] (b) (i) Energy: Coarsening-up sequence / cyclothem - fine shale to coarse – quartz sand (1)
Lower to higher energy (low with coal swamp) Low energy = fine and high energy = coarse (1) 'Calm → turbulent' - grain size variation (1) Environment: Change from deeper water to shallower water - grain size variation /sediments
Change from offshore marine shelf to terrestrial (deltic) - (marine and freshwater fossils)
(max 3 marks) [3] (ii) Land, near sea (1) in Tropics (1) (2 marks) [2] (iii) Holistic
Colder period / continental ice sheets– ice advances – sea level drops – delta develop
Coal forests form (up to 3 marks)
Warmer period / little ice around – ice melts – sea-level rises – floods land / marine shale and goniatites – kills plants forests die (up to 3 marks)
Cyclothem – cyclical – repeated patterns
Reference to controlling Milankovitch cycles (R) / tilt, eccentricity, etc (max 4 marks) [4]
Total 15 marks

24
Q.5 (a) (i) Dip – 75° (1) [1] Do not accept 85° (ii) Diagram and/or script to show:
Strike orientation (NE–SW) / pour water on to give true dip direction (1)
Dip – direction at 90º to strike (NW) (1) Angle – of dip = 75º (1) Credit ref to way up not proven (max 3 marks) [3]
(b) [3]
Fault characteristics on geological map Southern Upland Fault
Dip direction and angle (degrees) NW at approximately 85 º
Orientation of Strike • NE–SW
Downthrow direction
• NW
Fault type • Normal
(c) (i) Max – ~15.5 mm = 775 m (750–1000) Min – ~ 5.5 mm = 275 m (250–300) (2 marks 1+1) [2] (ii) Dip of the granite explained in a diagram. (Steeper dip – narrower outcrop & vice versa) (max 2 marks) [2] (iii) Holistic
Thermal conductivity of country rock Effect of fluids from granite Variations in permeability (porosity / fracturing) Other sensible Any one explained (2 marks) [2]
Total 13 marks

25
Q.6 (a) (i) Coarse grained – high energy Imbrication – current direction Poor sorting – rapid deposition Other sensible (max 3 marks) [3]
(ii) Describe (1) Thinner to north, series of wedges
Explain (1) Further from source / reduction in energy
(max 2 marks) [2] (b) (i)
(max 3 marks) 1 mark per sector [3] (ii) 2 descriptions (1+1)
Current flowed mainly towards the north Spread in fan shape between NW–NE Majority between WSW and ENE / few south (max 2 marks) [2]
(iii) East (accept ENE–ESE) (1) [1] (c) Holistic:
Southern Upland Fault – scarp Southern uplands were higher (upthrown) than valley (downthrown) Flashfloods descend from highlands to lowlands down fault scarp (max 2 marks) [2]
Total 13 marks
26
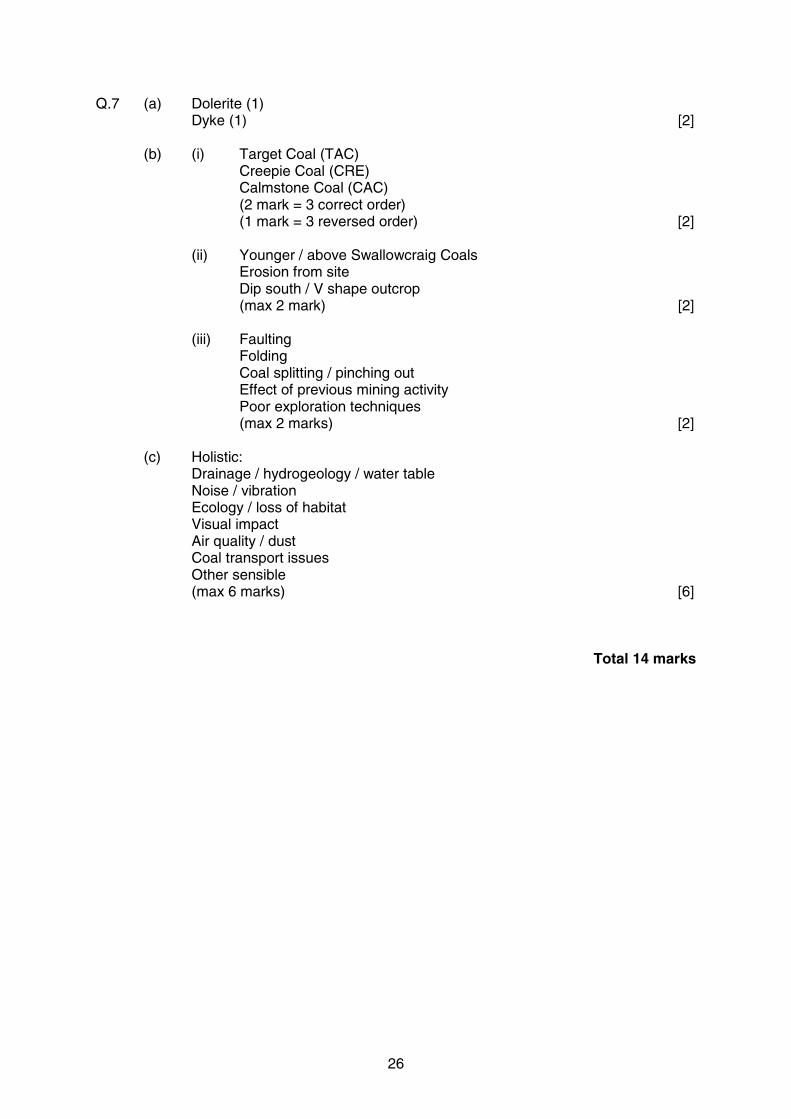
Q.7 (a) Dolerite (1) Dyke (1) [2] (b) (i) Target Coal (TAC)
Creepie Coal (CRE) Calmstone Coal (CAC) (2 mark = 3 correct order) (1 mark = 3 reversed order) [2]
(ii) Younger / above Swallowcraig Coals
Erosion from site Dip south / V shape outcrop (max 2 mark) [2]
(iii) Faulting
Folding Coal splitting / pinching out Effect of previous mining activity Poor exploration techniques (max 2 marks) [2]
(c) Holistic:
Drainage / hydrogeology / water table Noise / vibration Ecology / loss of habitat Visual impact Air quality / dust Coal transport issues Other sensible (max 6 marks) [6]
Total 14 marks
27
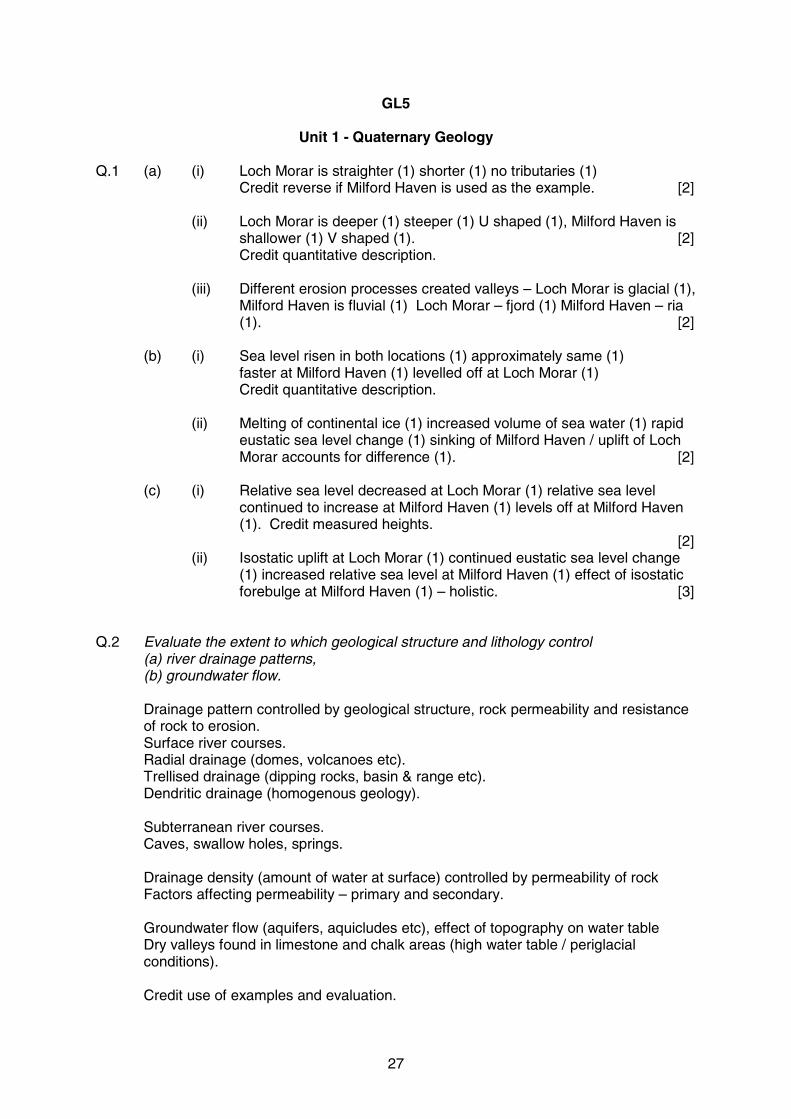
GL5
Unit 1 - Quaternary Geology Q.1 (a) (i) Loch Morar is straighter (1) shorter (1) no tributaries (1) Credit reverse if Milford Haven is used as the example. [2] (ii) Loch Morar is deeper (1) steeper (1) U shaped (1), Milford Haven is shallower (1) V shaped (1). [2] Credit quantitative description. (iii) Different erosion processes created valleys – Loch Morar is glacial (1),
Milford Haven is fluvial (1) Loch Morar – fjord (1) Milford Haven – ria (1). [2]
(b) (i) Sea level risen in both locations (1) approximately same (1) faster at Milford Haven (1) levelled off at Loch Morar (1) Credit quantitative description. (ii) Melting of continental ice (1) increased volume of sea water (1) rapid
eustatic sea level change (1) sinking of Milford Haven / uplift of Loch Morar accounts for difference (1). [2]
(c) (i) Relative sea level decreased at Loch Morar (1) relative sea level
continued to increase at Milford Haven (1) levels off at Milford Haven (1). Credit measured heights.
[2] (ii) Isostatic uplift at Loch Morar (1) continued eustatic sea level change
(1) increased relative sea level at Milford Haven (1) effect of isostatic forebulge at Milford Haven (1) – holistic. [3]
Q.2 Evaluate the extent to which geological structure and lithology control (a) river drainage patterns, (b) groundwater flow. Drainage pattern controlled by geological structure, rock permeability and resistance
of rock to erosion. Surface river courses. Radial drainage (domes, volcanoes etc). Trellised drainage (dipping rocks, basin & range etc). Dendritic drainage (homogenous geology).
Subterranean river courses. Caves, swallow holes, springs. Drainage density (amount of water at surface) controlled by permeability of rock Factors affecting permeability – primary and secondary. Groundwater flow (aquifers, aquicludes etc), effect of topography on water table
Dry valleys found in limestone and chalk areas (high water table / periglacial conditions).
Credit use of examples and evaluation.
28
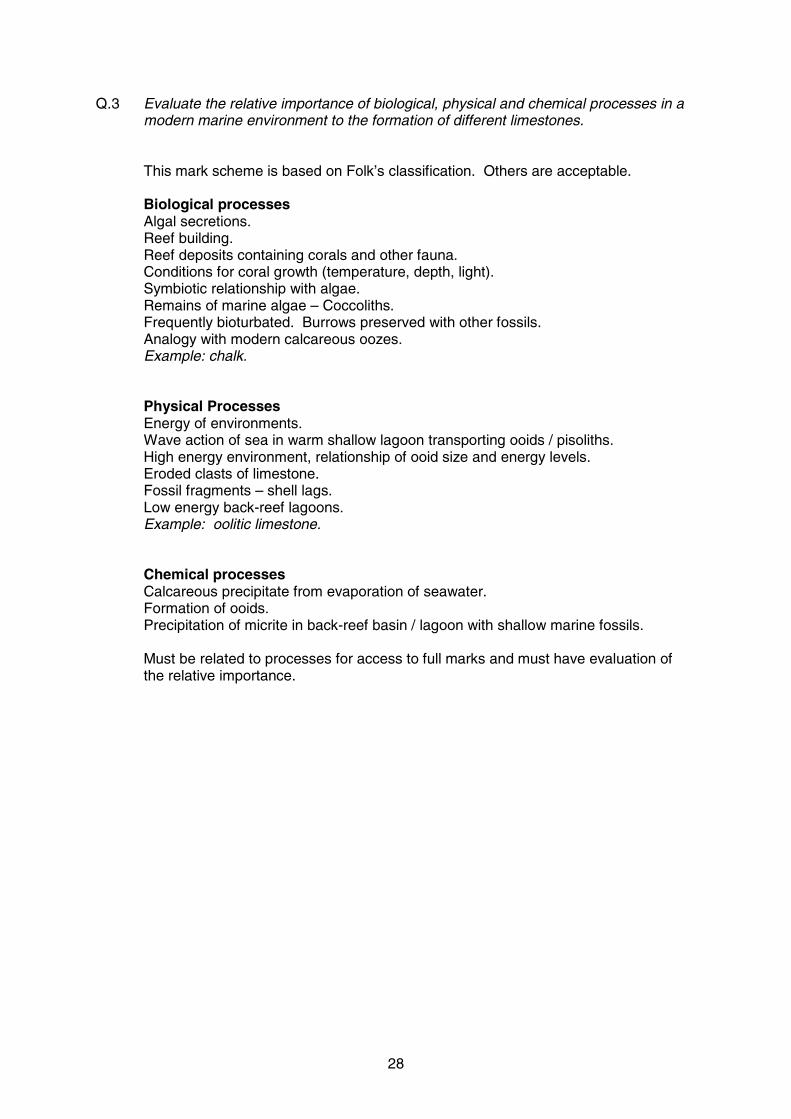
Q.3 Evaluate the relative importance of biological, physical and chemical processes in a modern marine environment to the formation of different limestones.
This mark scheme is based on Folk’s classification. Others are acceptable.
Biological processes Algal secretions. Reef building. Reef deposits containing corals and other fauna. Conditions for coral growth (temperature, depth, light). Symbiotic relationship with algae. Remains of marine algae – Coccoliths. Frequently bioturbated. Burrows preserved with other fossils. Analogy with modern calcareous oozes. Example: chalk. Physical Processes Energy of environments. Wave action of sea in warm shallow lagoon transporting ooids / pisoliths. High energy environment, relationship of ooid size and energy levels. Eroded clasts of limestone. Fossil fragments – shell lags. Low energy back-reef lagoons. Example: oolitic limestone. Chemical processes Calcareous precipitate from evaporation of seawater. Formation of ooids. Precipitation of micrite in back-reef basin / lagoon with shallow marine fossils.
Must be related to processes for access to full marks and must have evaluation of the relative importance.

29
Q.4 (a) Describe how ice cores provide evidence for atmospheric change.
(b) Evaluate the use of fossils to provide evidence for climatic fluctuations in Britain during the Quaternary.
(a) Ice Cores Continuous records can be obtained from drilling where ice has accumulated
for a long time (Antarctica, Greenland).
Inclusions in the snow of each year remain in the ice, such as wind-blown dust, ash, bubbles of atmospheric gas.
Water molecules containing heavier isotopes have a lower vapour pressure, when the temperature falls, the heavier water molecules will condense faster than the lighter water molecules. The relative concentrations of the heavier isotopes in the snow indicate the temperature of condensation at the time, allowing for ice cores to be used in local temperature reconstructions.
Air bubbles trapped in the ice cores allow for measurement of the atmospheric concentrations of trace gases such as carbon dioxide, methane and nitrous oxide.
Volcanic eruptions leave identifiable ash layers that can be dated. Dust in the core can be linked to increased desert area or wind speed.
(b) Pollen evaluation Well preserved, easily fossilised abundant material. Widespread (advantage
or disadvantage)? Sampled from sediments of different types, particularly lake deposits. Relative abundance of pollen types used to reconstruct vegetation community. Fluctuating climate causes change in the vegetation community. Pollen therefore acts as proxy data for climate. Glacial / pretemperate climate dominated by juniper & birch. As climate warms vegetation dominated by deciduous trees (oak, elm, alder). As climate cools, conifers (pine & fir) begin to dominate followed by birch. Use of pollen diagrams to present data. Doesn’t allow for quantified climatic reconstruction. Only reconstructs a proxy for the climate.
Vertebrates evaluation Examples of Quaternary vertebrates – woolly mammoths, hippopotamus, hyena, bison etc.
Application of uniformitarianism – relating modern mammals to fossils Mammoths found preserved in glacial ice, heavy fur coats as an indicator of colder conditions.
Use of individual species, rather than community, to reconstruct climate – mutual climatic range.
Problems of fossilisation for large vertebrates. 'Snapshot' of climatic conditions rather than continuous sequence.
Other evaluation
Credit for other organisms used e.g. beetles, forams (for oxygen isotopes).

30
GL5
Unit 2 Geology of Natural Resources
Q.1 (a) (i) 1mm [1] (ii) Well-rounded (1) well sorted (1) no cement / matrix (1) [2]
(b) (i) 200 °C at 5 km 5
200(1) 40 °C per km (1) [2]
(ii) Oil – 1800 m (1) accept 1750–1850 m Gas – 95 °C (1) accept 90–100 °C [2] (c) (i) 2 x 1 marks for any correct locations on Figs 1c (1) and 1d (1) [2] (ii) Oil is less dense than porewater (1) and due to buoyancy will rise
through it and form a layer above the porewater (1) – credit reference to migration pathways – pore spaces, joints, bedding planes, faults (1) (Holistic). [3]
(iii) Sequestration of carbon dioxide (1) to combat global warming (1) enhance oil / gas recovery from unproductive fields (1) storage of fluids (1) [3]
Q.2 (a) Describe the method of extraction from the ground of one type of geological raw material (mineral or rock.)
(b) Evaluate the potential environmental issues caused by the extraction of a named raw material from the ground and explain how these problems can be minimised.
Description:
Explanation depends upon case study of raw material. Expect – coal extraction by deep mining / open cast. Salt extraction by brine pumping / underground mining. Offshore / onshore oilfield development. Quarrying for roadstone / aggregate. Sand and gravel extraction. Evaluation:
N.B. Higher grades so need to evaluate the problems. Potential environmental problems e.g. noise, dust, pollution of water courses by chemical / waste, waste disposal etc., and the ways by which these may be minimised e.g. restricted blasting, baffle banks, settling tanks, backfill etc.
How significant are the problems and the way(s) that they are minimised?
Case studies to show planning to satisfy local or national legislation for max levels of pollution.

31
Q.3 Evaluate the use of two of the following techniques in the exploration for metallic and/or non-metallic mineral resources. (i) Drilling and downhole logging (ii) Geochemical prospecting (iii) Satellite remote sensing (iv) geophysical surveying (i) Drilling and downhole logging.
Borehole drilling to assess 3 dimensional shape and size of ore-body. Assessment of grade and tonnage of ore body – rock geochemistry / chemical analysis - atomic absorption spectrometry (AA) / X-ray fluorescence spectrometry (XRF) / inductively coupled plasma mass spectography (ICPMS). Assessment of results – decision to mine or not.
Downhole logging is the process of measuring physical, chemical and structural properties of penetrated geological formations using logging tools that are either lowered into the borehole on a wireline cable (wireline logging) or placed just behind the drill bit as part of the drill pipe itself (logging-while-drilling). The tools employ various acoustic, nuclear and electrical measurement techniques to acquire downhole logs of properties such as sonic velocity, density and electrical resistivity. The wireline cable provides real-time communication between the tools and the surface; logging-while-drilling tools typically record the logs in downhole memory devices, which are subsequently downloaded when the tool returns to the ship.
(ii) Geochemical prospecting
Sampling stream, soil or vegetation to find particular trace element concentrations which might indicate the presence of an economic resource. Concentrations vary with distance from the ore body. Copper and lead.
Advantages Sampling allows large catchment area to be investigated quickly / all elements have characteristic signatures which may show up in vegetation / response and are easily recognised in soil and water samples / very dependable and cost effective.
Disadvantages Contamination can be a problem (earlier mining, processing, wind blown, flooding).
Background rocks, variations in water pH and ore concentrations can give misleading results. Access may be difficult over wider areas.
32
(iii) Satellite remote sensing Radiation is absorbed and reflected in different ways by different materials. Materials emit different types of radiation depending upon temperature and molecular structure.
Emitted and reflected radiation can be monitored, analysed and displayed as a visual image.
Suitable for major metalliferous deposits (e.g. copper, iron).
Advantages Provides a large scale image relatively cheaply without need of fieldwork. Inaccessible areas studied easily. Large scale structures show up which might be missed in the field. Satellites are generally in place – only need to buy image required.
Disadvantages Used for only basic reconnaissance. Does not provide stereo images. Colours can be misleading.
Credit to be given to those who interpret SRS as aerial photographic surveys or geophysical aerial surveys.
(iv) Geophysical surveying
Techniques e.g. seismic magnetic gravity
Description - seismic / explosions / land / ship / reflection / record of 2-way time / graphical representation to identify structures / oil traps.
- magnetometer / land / plane / ship / graphical representation of magnetic readings / depends on changes in magnetic properties or distribution of rocks i.e. structures.
- gravimeter / land / plane / ship / changes in gravity / changes in density of the underlying rocks / reflects the structure(s).
Graphical representation (incl labelled diagrams) Q.4 Evaluate the contribution that igneous activity makes to the formation of mineral deposits by rock cycle processes. Reference to cumulates/magmatic segregation / pegmatites / hydrothermal.
Credit relevant examples / links to tectonic settings / rock cycle.
Mainly metallic minerals – credit examples – cassiterite, chalcopyrite, galena, sphalerite, haematite, wolframite etc.
Sedimentary processes also important.
Residual, placer, secondary enrichment deposits and chemical precipitates for metallic and non-metallic minerals.
Manganese nodules, BIFs, supergene enrichment, evaporates etc.
China clay, halite / gypsum, bauxite / links to the rock cycle: weathering / erosion / transport / deposition.

33
GL5
Unit 3 - Evolution
Q.1 (a) SW England and SW Ireland (1) E-W (1) Any L.Palaeozoic (or older )(1) NW-SE (1) [4]
(b) limbs dip at equal angles (1) antiformal (1) anticline (1) open (1) NE/SW axial plane (1)
60 ° / 70 ° interlimb angle (1) (wavelength – approx 40m?) [3]
(c) Younger (1) Intrusive (1) [2]
(d) Holistic: plate collision / partial melting at base of crust / differentiation / lighter / less dense / diapiric / lithosphere - mantle melt [2]
(e) Holistic: collision of plates carrying continental crust (1) Trend of folds suggests convergence from SE / NW (1) Crustal thickening suggests granites (1) Thickening of crust high temp and pressure suggested by metamorphism (1) Compression suggested by folding (1) Iapetus suture represents junction between the two plates (1) Iapetus suture where ocean has disappeared due to subduction (1)
Any 4
Q.2 Evaluate the evidence provided by sedimentary rocks, fossils and palaeomagnetism for latitude and climate change between the Carboniferous and Permo-Triassic of Great Britain.
Latitude and climate sedimentary rocks fossils palaeomagnetism Carboniferous : Tropical shallow marine and terrestrial Equatorial rainforest Drifting across the equator
limestones coal measures
reef corals equatorial plants
equator
Permo-Triassic : Semi-arid and desert terrestrial and hypersaline marine
red beds, breccias, sandstones (textures) dune cross bedding, mud cracks evaporites
absent from red beds reef building corals in shallow seas
20 ° N of equator
Descriptions of the above. Breadth versus depth but sedimentary rocks, fossils, palaeomagnetism, Carboniferous and Permo-Triassic must all be considered at some level for full marks.
Evaluation: Climatic change interpreted as evidence for latitude change assuming that major climatic zones have been consistent throughout the Phanerozoic. Uniformitarianism for interpretation of fossils and sedimentary rocks. Palaeomagnetism evidence from magnetic minerals / polar wandering curves. Assumes geographic and magnetic poles close together. Assumes no corruption of data e.g. metamorphism of magnetic rocks. Assumes accuracy of radiometric dating. Both lines of evidence, taken together, reinforce correct conclusion.

34
Q.3 (a) Describe the evidence for plate tectonic events affecting the Atlantic Ocean and the North Sea during the Cretaceous and the Cenozoic. (b) Evaluate the significance of chalk deposits as evidence for high global sea levels during the Cretaceous. (a) TIP Late Cretaceous / Tertiary abundant igneous activity in NW Britain / basaltic volcanicity in Scotland and N Ireland and associated plutonic centres. Dyke swarms / later granitic intrusions due to melting of continental crust / mantle plume develops beneath NW Britain and Greenland / active rifting and development of spreading centre / opening of the N Atlantic. North Sea
Tensional tectonics related to opening of N Atlantic / N-S orientation of graben Jurassic and early Cretaceous active rifting shown by normal faults /
thermal relaxation leads to deposition of thick Cretaceous / Tertiary sediments, not cut by faults, passive rifting, crustal thinning, sedimentation and minor volcanics. (b) Chalk deep water coccolith ooze extensively developed on continental shelves at times of high sea level and little erosional material from continents / presence of shelf fossils e.g. bivalves. Q.4 Evaluate the evidence which suggests that continental red beds originated from
aeolian and / or fluvial sedimentary processes. Evidence:
Aeolian
Sandstone textures Dune cross bedding Calcrete nodular limestones formed by evaporation Lack of fossils
Fluvial
Fining upwards cycles River channel, channel lag, point bar, flood plain, cross bedded sandstones Flash flood conglomerates, breccias, alluvial fans Lake deposits, mudstones with fossil fish, mudcracks Fossil fresh water fish
Evaluation: Both types present. Accurate interpretation dependent on Uniformitarianism.
Palaeogeographic map indicates aeolian sediments in mountainous regions which are the source for fluvial deposits.
Fault scarps control distribution of alluvial fans. Cross bedded sandstones often difficult to interpret dune versus current).

35
GL5
Unit 4 - Geology of the Lithosphere
Q.1 (a) Normal faults = extension / Pmax vertical (2) thinned (1) [2] (b) (i) Arrows away from the plate margins ×3 [3] (ii) Away from ridge axis / spreading directions / at right angles to axis / parallel to transform faults (1) [2] (c) (i) On the continental crust (1) to SW (1) either side of continental rift (1) -
associated with thinned crust. [2] (ii) Low [1] (d) Holistic: obvious structural features are shallow / crustal (<30km) / rift faulting
(continental and / or ridge) / shallow depths / due to tension / thinning / shallow transform faults [3]
(e) Ocean basins expand further / continental rift becomes oceanic (1) triple
junction (1). [2] Q.2. The rate of sea floor spreading may be calculated using the pattern of magnetic
anomalies or mantle plume hotspot data. Outline these two methods and evaluate their relative effectiveness.
Descriptions:
Symmetrical magnetic pattern of normal and reversed anomalies across CPM axis (Oldest) volcanic lavas in a chain e.g. Hawaii plotted against distances of separation.
Rate = distance / time. Distance measured (probably) from map / survey of magnetic stripes. GPS. Time = age of sea-floor rock / basalt lava. Age is radiometric. This would give an “absolute” rate. Graph for average rate. Variable rate? Evaluation:
Accuracy : Collection of specimens? Both very difficult (reversals on sea-floor / oldest lavas with volcanoes).
Distance = very accurate = theoretically to mm (GPS). But – where is the ridge axis? (one side to the other? equal rate in both directions?) Assumed (usually?) that hot spots are stationary. Age +/- 10%? (depends on method).

36
Q.3. Describe the characteristics of subduction zones and evaluate their importance in an understanding of plate tectonics.
Description:
DPM (– well labelled diagram possible full marks). Evaluation:
Subduction as part of the theory. Convective? More dense due to cooling. Subduction at island arcs / cordillera . Density differences between colliding plates. Convection. (plate movement mechanisms – ridge push etc) Part of Wilson cycle. Partial melting / water content / associated volcanism / descending slab more dense. (phase changes to higher T/P minerals) Q.4. (a) Describe how fold mountains are formed and (b) Evaluate the importance of isostasy during their formation.
Description:
DPM (– well labelled diagrams possible for full marks).
Evaluation:
Continental collision / continental crust may thicken at their edges, thus may move downwards rather than up due to isostasy. 'Continental collisions building mountains up' is a simplification.
The crust thickens and the upper part of the thickened crust may become a mountain range.
Some continental collisions not in isostatic equilibrium e.g. Himalayas.
Erosion results in downward movement of the surface but isostasy is upwards to compensate.
37
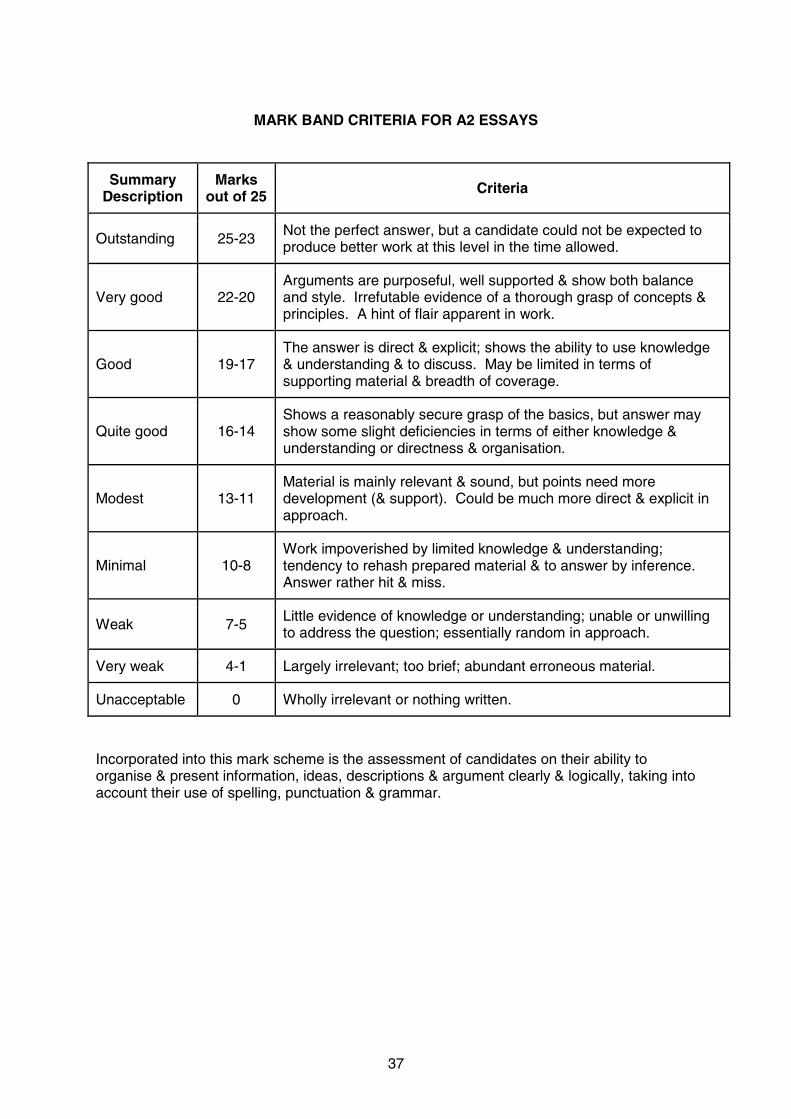
MARK BAND CRITERIA FOR A2 ESSAYS
Summary Description
Marks out of 25 Criteria
Outstanding 25-23 Not the perfect answer, but a candidate could not be expected to produce better work at this level in the time allowed.
Very good 22-20 Arguments are purposeful, well supported & show both balance and style. Irrefutable evidence of a thorough grasp of concepts & principles. A hint of flair apparent in work.
Good 19-17 The answer is direct & explicit; shows the ability to use knowledge & understanding & to discuss. May be limited in terms of supporting material & breadth of coverage.
Quite good 16-14 Shows a reasonably secure grasp of the basics, but answer may show some slight deficiencies in terms of either knowledge & understanding or directness & organisation.
Modest 13-11 Material is mainly relevant & sound, but points need more development (& support). Could be much more direct & explicit in approach.
Minimal 10-8 Work impoverished by limited knowledge & understanding; tendency to rehash prepared material & to answer by inference. Answer rather hit & miss.
Weak 7-5 Little evidence of knowledge or understanding; unable or unwilling to address the question; essentially random in approach.
Very weak 4-1 Largely irrelevant; too brief; abundant erroneous material.
Unacceptable 0 Wholly irrelevant or nothing written.
Incorporated into this mark scheme is the assessment of candidates on their ability to organise & present information, ideas, descriptions & argument clearly & logically, taking into account their use of spelling, punctuation & grammar.

38
QUICK GUIDE
Description K / U Discussion Terminology
Outstanding 23-25 Not perfect BUT Thorough
Very good 20-22 Thorough grasp Well supported. Hint of flair + EVALUATION Sound
Good 17-19 Direct/explicit Limited support - breadth. Lacks detail - depth Significant
Quite Good 14-16 Basics Slight deficiencies. Limited scope relevance Basic
Modest 11-13 Mainly relevant Needs much more development
Minimal 8-10 Limited/rehash Hit and miss Little
Weak 5-7 Little evidence Question not addressed
Very Weak 1-4 Irrelevant/erroneous Too brief
Unacceptable 0
Thus key dividing lines are:
Outstanding - Across the board – no significant weaknesses
Very good - EVALUATION
Good - Good read - some omissions in content/detail/discussion
Quite Good - Essay title has been addressed but not a convincing argument
Modest - Bit difficult to follow. Do they really know? Addressed the question but need much more discussion = mark scheme
Minimal/Weak/Very Weak - Rehash at best - irrelevant material/no essay to mark/mark per point ?
GCE GEOLOGY MS - Summer 2010 / JF

WJEC 245 Western Avenue Cardiff CF5 2YX Tel No 029 2026 5000 Fax 029 2057 5994 E-mail: [email protected] website: www.wjec.co.uk