Embed Size (px)
Citation preview

Global Research
August 2008
Sector
GCC Telecom Sector
GCC
Ringing all the way ...
Global Investment House KSCCSharq, Global TowerP.O. Box 28807 Safat13149 KuwaitTel: (965) 295 1000Fax: (965) 295 1005E-mail: [email protected]://www.globalinv.net
Global Investment House stock market indices can be accessedfrom the Bloomberg page GLOHand from Reuters Page GLOB
Omar M. El-Quqa, CFAExecutive Vice [email protected] No:(965) 2951110
Faisal Hasan, CFAHead of [email protected] No:(965) 295 1270
Chandresh BhattAssistant Vice [email protected] No:(965) 295 1282
Abeer GoudaSenior Financial [email protected] No:(965) 295 1272
Vinod ShenoyFinancial [email protected] No:(965) 295 1274

Table of Contents
Investment Summary ---------------------------------------------------------------------------------1
World Telecom Sector Overview -------------------------------------------------------------------5
GCC Telecom Sector Overview --------------------------------------------------------------------7
Fixed Line Services --------------------------------------------------------------------------------7 Cellular Services ------------------------------------------------------------------------------------8
Broadband Services ------------------------------------------------------------------------------ 11
Country-wise Telecom Profile in GCC --------------------------------------------------------- 14
Kuwait --------------------------------------------------------------------------------------------- 14 Qatar ------------------------------------------------------------------------------------------------ 15
Saudi Arabia--------------------------------------------------------------------------------------- 16
UAE ------------------------------------------------------------------------------------------------ 17 Oman ----------------------------------------------------------------------------------------------- 18
Bahrain --------------------------------------------------------------------------------------------- 19
Player Profiles ---------------------------------------------------------------------------------------- 20
Mobile Telecommunications Company (Zain) ----------------------------------------------- 21 National Mobile Telecommunications Company (Wataniya) ------------------------------ 33
Saudi Telecom (STC) ---------------------------------------------------------------------------- 43
Etihad Etisalat Company (Mobily) ------------------------------------------------------------- 58 Emirates Telecommunications Corporation (Etisalat) --------------------------------------- 71
Qatar Telecom (Qtel) ---------------------------------------------------------------------------- 92
Bahrain Telecommunications Company (Batelco) -----------------------------------------103
Oman Telecommunications Company (OTEL) ---------------------------------------------116

Global Research - GCC Global Investment House
August 2008 GCC Telecom Sector 1
Investment Summary
• In the recent years the GCC telecom players are on an expansion spree following measures from Saudi Arabia, Bahrain, Oman, and UAE to allow additional service providers in the respective countries. This should result in inducing higher competition and further drop in ARPUs in the region and resultant contracting profitability of the players. The service providers should aim to increase their market shares by providing differentiated value added services and providing content based services (like mobile video streaming) to enhance the ARPUs.
• The GCC region registered a decline of 6.9% in fixed line subscribers from 5.8mn subscribers in 2006 to 5.4mn subscribers in 2007 on account of increasing shift of customer base to the more convenient mobile voice services.
• Increasing disposable income and convenience of use is encouraging the cellular penetration in the region. Other important contributing factor to the increased cellular penetration is the relaxation in telecom regulations allowing second or third player in each country apart from the incumbent local carriers (usually the first state run telco service provider in each country). The GCC region registered a 5 year (2002-07) growth in cellular subscribers at a CAGR of 37.6 %. The MENA region has seen the highest worldwide 5 year (2002-07) growth in cellular subscribers at a CAGR of 52.9% against the worldwide increase of 23.3%. With the country wise cellular markets reaching or crossing the 100% penetration levels within the GCC region, all the six member countries registered double digits CAGR during the 5 year (2002-07) period.
• In 2007, Asia and MENA region were the major growth contributors with YoY growth rates of 36.8% and 33.9% respectively. UAE topped the list of high growth contribution with a YoY growth rate of 34.6% with its internet user base increasing from 1.7mn in 2006 to 2.3mn in 2007. The next highest contributor was Saudi Arabia that reported a 31.9% YoY increase in the internet users’ base from 4.7mn in 2006 to 6.2mn in 2007. The high proportion of youth in the demographics, with 55% to 65% of the total population under the age of 30 years is driving the internet usage in the GCC region.
• The higher rate of internet penetration and improved infrastructure services in terms of shift from Dial up to cable is helping increase the broadband subscriber base in the GCC region. The analysis of 5 year (2002-07) CAGR in broadband subscribers worldwide indicates that the GCC region is amongst the top three growth regions in the world. The worldwide broadband subscriber base increased at a 5 year (2002-07) CAGR of 38.9%.
Companies under coverage
As a part of the GCC Telecom coverage we are covering Qatar Telecom (Qtel), Mobile Telecommunications Company (Zain), National Mobile Telecommunications Company (Wataniya), Saudi Telecom (STC), Etihad Etisalat Company (Mobily), Emirates Telecommunications Corporation (Etisalat), Oman Telecommunications Company (OTEL) and Bahrain Telecommunications Company (Batelco) in this report.

Global Research - GCC Global Investment House
2 GCC Telecom Sector August 2008
• Mobile Telecommunications Company (Zain) was established in 1983 in Kuwait as the region’s first mobile operator. Since 2003, it has grown significantly becoming the 4th largest telecommunications company in the world in terms of geographic presence with a footprint in 22 countries spread across the Middle East and Africa providing mobile voice and data services to over 50.74mn active customers (as at 30 June 2008). In August 2008 the company is raising its equity capital through rights issue. The company’s paid up capital will be increased by 75% through rights. We have used Sum-Of-The-Parts (SOTP) valuation method for company’s operations in different countries. Based on consolidation of the individual country operations, our SOTP valuation estimates the fair value of Zain’s stock at KD1.77, which is 2.7% higher than the current market price of the stock of KD1.72 per share (as at Aug. 31, 2008). We, therefore, reiterate our “HOLD” recommendation on the stock.
• National Mobile Telecommunications Company (Wataniya) has grown rapidly through acquisitions in the MENA region and Asia. Apart from Kuwait, the company has operations in Maldives (100% stake), Saudi Arabia (55.61% stake), Tunisia (50% stake), Algeria (71% stake) and in 2007 it got a license to launch second mobile services in Palestine (57% stake). In March 2007, Qatar Telecom (Qtel) acquired 51% of Wataniya Telecom shares from Kuwait Projects Company Holding KSC (KIPCO) group for a total cash consideration of US$3.8bn. We have used Sum-Of-The-Parts (SOTP) valuation method for company’s operations in different countries. Based on consolidation of the individual country operations, our SOTP valuation estimates the fair value of Wataniya’s stock at KD2.58, which is 38.6% higher than the current market price of KD1.86 (as at Aug. 31, 2008). We, therefore, revise our recommendation on the stock from HOLD to “BUY”.
• Saudi Telecom (STC), was the sole provider of telecommunication services in Saudi Arabia until its monopoly in the mobile market ended when the second mobile license was granted in 2004 to Etihad Etisalat Company (Mobily). In March 2007, a consortium led by Zain of Kuwait won the third mobile, and launched its services in 2008. In April 2007, three fixed line licenses were granted in Saudi, ending STC’s monopoly over fixed lines. As a result of increasing competition, the company started expanding outside its home market beginning with the Maxis deal which gave STC foothold in Malaysia, India, and Indonesia, Later, STC won the bid for a 26% stake in Kuwait’s third mobile service operator. Finally, STC acquired a 35% stake in Oger Telecom, which gave STC presence in Turkey and South Africa. We expect STC’s revenues to grow by a CAGR of 9.2% during our forecast period (2008-2011). Our DCF valuation estimates the fair value of STC’s stock at SR78.75, which is 21.6% higher than the current market price of the stock. We therefore reiterate our “BUY” recommendation for STC.
• Etihad Etisalat Company (Mobily), is Saudi’s second mobile operator. Mobily launched its services in May 2005. Within three years of operations, the company managed to grab a market share of 41% by the end of 2007, with 11.1mn subscribers. Mobily has been targeting the data and internet segment aggressively. In 2007, the company acquired a 99.9% stake of the local data provider Bayanat Al-Oula, and set up Mobily InfoTech, a fully owned subsidiary in India, which will provide information technology and consulting services. In addition, Mobily got the approval to acquire 96% of Zagel International Communication Network Company which is specialized in providing internet services in Saudi Arabia. We believe that Mobily’s latest acquisitions will strengthen its position

Global Research - GCC Global Investment House
August 2008 GCC Telecom Sector 3
in the wireless broadband internet segment. Our DCF valuation estimates the fair value of Mobily’s stock at SR68.84, which is 49.6% higher than the current market price of the stock. We therefore reiterate our “BUY” recommendation for Mobily.
• Emirates Telecommunications Corporation (Etisalat) was the sole provider of telecommunication in the UAE until its monopoly was broken when Emirates Integrated Telecommunications Company (EITC) know as “DU” won the second license for fixed line, mobile, and internet services in 2005. The group is present in 15 countries in Africa and Asia. We expect the share of international operations of the group’s top line results to increase from 6% in 2007 to 11% in 2011. We have used Sum-Of-The Parts (SOTP) valuation method for the company’s operations in different countries. Based on the consolidation of the individual company operations, our SOTP valuation estimates the fair value of Etisalat’s stock at AED27, which is 50% higher than the current market price of the stock. We therefore initiate our coverage for Etisalat with a “BUY” recommendation.
• Qatar Telecom (Qtel) provides domestic and international telecommunication services in Qatar and wireless telecommunication services in the Asia and MENA region through its subsidiaries. The year 2007 was a transformative one for Qtel – characterized by many partnerships and acquisitions in the MENA and Asia regions. These activities have broadened Qtel’s geographic presence to 16 countries (2006 – 2 countries) with the ability to reach over 560mn people. In 2007, the Qtel group’s subscriber base has grown from 1.72mn in 2006 to over 16mn – an increase of over 850%. In March 2007, Qatar Telecom (Qtel) acquired 51% of Wataniya Telecom shares from Kuwait Projects Company Holding KSC (KIPCO) group. In June 2008, Qtel acquired a 40.8% stake in PT Indosat Tbk, Indonesia’s second-largest phone company, from its subsidiary Asia Mobile Holding Pte. Ltd. We have used Sum-Of-The-Parts (SOTP) valuation method for the company’s operations in different countries. Based on consolidation of the individual country operations, our SOTP valuation estimates the fair value of Qtel’s stock at QR282.4, which is 77.2% higher than the current market price of QR159.4er share (as at Aug. 31, 2008). We, therefore, revise our recommendation on the stock from “HOLD” to “BUY”.
• Bahrain Telecommunications Company (Batelco) is the incumbent telecom operator in Bahrain. The subsidiaries/associates of Batelco are Umniah (Jordan), Qualitynet (Kuwait), Sabafon (Yemen), Batelco Egypt and Atheeb (Saudi Arabia). Batelco posted a double digit YoY net income growth rate of 13.6% increasing from BD89.3mn in 2006 to BD101.5mn in 2007. Batelco has adopted the right strategy of exploring and investing in low penetrated markets both in cellular and broadband space. Its aim to grow geographically into the MENA region with a goal to generate 70.0% of its revenues from international operations by the end of 2010 seems to be achievable given the success they have achieved so far in their investments. The estimated fair value for Batelco works out to BD0.837 per share which offers and upside of 18.7% on the market price of BD0.705 per share (as at Aug. 31, 2008). Hence, we initiate on the stock with a “BUY” recommendation.
• Oman Telecommunications Company (OTEL) is the incumbent telecom service provider in Oman. Nawras is a competitor of OTEL in the cellular segment. OTEL

Global Research - GCC Global Investment House
4 GCC Telecom Sector August 2008
registered a topline YoY growth of 12.9% increasing from RO323.6mn in 2006 to RO365.3mn in 2007. The net profit increased from RO80.7mn in 2006 to RO112.0mn in 2007 registering a YoY growth rate of 38.8%. We believe that the Omani telecom sector is to see unprecedented competition in the coming years attracting cellular players now that TRA is considering a third cellular player. OTEL should continue to retain its market share in this competitive scenario by enhancing revenue growth in Fixed and Mobile segment, while retaining valued customers through loyalty programs. The estimated fair value for OTEL works out to RO2.339 per share which offers and upside of 18.0% on the market price of RO1.983 per share (as at Aug 31, 2008). Hence, we initiate on the stock with a “BUY” recommendation.
Table 1 : “Global” Valuation Matrix
Company Local Currency
Price* Target Reco. Upside / (Downside)
Market Cap.
(US$ bn)
BV** EPS** P/BV (x) P/E (x) EV/EBITDA (x)
M Cap./Sales (x)
2008F 2009F 2008F 2009F 2008F 2009F 2008F 2009F 2008F 2009F 2008 F 2009 F
Zain KD 1.72 1.77 HOLD 2.7% 27.3 0.708 0.751 0.080 0.104 2.4 2.3 21.6 16.6 10.6 9.0 3.8 3.2
Wataniya KD 1.86 2.58 BUY 38.6% 3.5 0.674 0.748 0.193 0.215 2.8 2.5 9.6 8.7 5.3 4.7 1.9 1.7
STC SR 64.75 78.75 BUY 21.6% 34.5 19 20.2 7.200 7.900 3.4 3.2 8.9 8.2 5.2 4.6 2.8 2.6
Mobily SR 46.00 68.84 BUY 49.6% 6.1 15.6 19.7 3.800 4.600 3.0 2.3 12.2 10.1 8.4 7.1 2.2 2.0
Etisalat AED 18.00 27.01 BUY 50.1% 29.3 5.3 6.16 1.660 1.670 3.4 2.9 10.8 10.8 5.4 4.7 3.9 3.4
Qtel QR 159.4 282.4 BUY 77.2% 6.4 78.8 74.2 17.4 27.9 2.0 2.1 9.2 5.7 5.1 3.7 1.2 0.9
Batelco BD 0.705 0.837 BUY 18.7% 2.7 0.345 0.402 0.072 0.076 2.0 1.8 9.8 9.2 7.1 6.3 3.0 2.7
Omantel RO 1.983 2.339 BUY 18.0% 3.9 0.527 0.632 0.190 0.223 3.8 3.1 10.4 8.9 6.3 5.2 3.5 3.1
* Market Price as of August 31, 2008
** In Respective Local Currencies
Source: Global Research

Global Research - GCC Global Investment House
August 2008 GCC Telecom Sector 5
World Telecom Sector Overview
The worldwide communications (Telecoms, Television and Radio) market and the Telecom market in specific are evolving at a very brisk pace. In view of increasing disposable income in the developed and the emerging economies the Telecom sector is now moving from the erstwhile infrastructure driven to more demand driven. Also, the aspect of convergence of voice, data and entertainment are becoming the new trend when the consumption patterns are changing with increasing demand for bundled services.
Telecom sector evolving on the back of “quad play” (including a combination of television, internet, fixed voice and mobile)…
• According to Ofcom UK, Telecoms service revenues increased by 5 year (2001-06) CAGR of 10.0% from US$420.5bn in 2001 to US$676.2bn in 2006 across 12 major developed and developing countries (USA, UK, France, Germany, Italy, Canada, Japan, Sweden, Ireland, Spain, Poland and Netherlands). Mobile is driving most of the growth and accounts for over 50% of total telecoms revenues in all countries except Sweden and Canada. However, with increasing maturity in mobile markets, growth rates have slowed in Europe and Japan.
• Mobile networks capable of delivering high-speed data services are beginning to take off. The number of 3G connections has increased by 200% in most of 12 major developed and developing countries between 2005 and 2006.
• Broadband accounting for 9% of total telecoms revenue across 12 comparator countries
in 2006 (up from less than 2% in 2001) is the fastest growing sector amongst voice.
• Other than the US (which is characterised by regional operators), in terms of market share of the leading operators the UK has the most diversified mobile and broadband markets of the countries analysed. It also has the second most diversified fixed-line market (after Germany) as measured by the market share of the incumbent.
• The decline of fixed-line voice is a characteristic of all the countries. However, there is large variation in measures of fixed to mobile substitution. Approximately 38% of Italian households are mobile only, compared to just 10% in Germany. In terms of call volumes, 49% are made over mobile networks in Spain compared to fewer than 20% in Germany.
• Total broadband connections across the 12 comparator countries increased by 600% between 2001 and 2006. This growth has been driven primarily by DSL broadband which increased its share of connections in every country and is now the largest broadband platform in all countries analysed except the US.
• Likely uneven distribution of high-speed fibre networks is leading to a lower proportion of Japanese consumers (39%) to be satisfied with the speed of their broadband connection than in any other country surveyed. The highest levels of satisfaction with broadband speed were in the US (85%), despite the high proportion of low-speed lines.
• Levels of next-generation access deployments vary significantly according to different market conditions. Japan is the clear leader among the countries analysed with around 30% of broadband connections being delivered via fibre-to-the-home.
Global Research - GCC Global Investment House
6 GCC Telecom Sector August 2008
The convergence has impacted the world wide communications market as follows
• Multi-service communications offerings, which include a combination of television, internet, fixed voice and mobile, are now available in many countries. ‘Quad-play’ bundles, involving all four services, are generally offered by the incumbent telco, but also in some cases by the cable operators.
• The US leads the world in the sale of audio-visual content, which is reflected in the revenues generated by its online TV and video industry. These were 250% higher than the next biggest market, the UK.
• The internet is taking an increasing share of advertising spend across the key comparator countries. The online share is largest in the UK, at 14.4%.
• User-generated content is proliferating, although professional producers appear to provide the most popular content on websites hosting User-generated content. As of the beginning of Nov’07 the three most viewed channels ever on YouTube.com were all contributed by professional American TV and music producers.
• France is the clear market leader in IPTV with 1.5mn subscribers at the end of 2006. IPTV has been a key driver of triple-play offers in France, which have also promoted VoIP take-up to the highest levels in Europe.
• Device convergence in the mobile handset is becoming widespread. For example, between 37% and 82% of internet users across the key comparator countries surveyed by Ofcom use their mobile phone to take photos.
• Over 75% of mobile phone users in the UK, France, Germany and Italy send SMS text messages. This compares with only 17% of mobile users in Japan, who prefer to send email from their mobile phone instead.
• The internet user base in more mature markets tends to include a greater share of younger and older users. The US is the key example of this, where 9% of internet users are over 65 and 20% are 17 or under. The US is the only market among comparator countries where more women than men use the internet.
• A greater proportion of UK internet users (39%) visit social networking sites than in any other key European country surveyed. They also visit these sites more frequently and spend more time on them.
• Search and navigation, and portals, comprise the most-visited types of website in most countries. Google’s lead is greater in Europe than in the US and Japan, where other search engines provide more competition.

Global Research - GCC Global Investment House
August 2008 GCC Telecom Sector 7
GCC Telecom Sector Overview
The trends in US, UK and other major telecom markets are percolating into the GCC region as well, however with some time lag. The increasingly popular mobile services are leading to a decline in fixed line voice subscribers. Though, convergence in this region is far behind its developed international peers with few countries in the region implementing enhanced 3.5G and related data services, the region is pretty much reaching saturation in terms of cellular voice penetration. Value added services and innovation should lead to sustainability of growth in the future.
In the recent years the GCC telecom players are on an expansion spree following measures from Saudi Arabia, Bahrain, Oman, and UAE to allow additional service providers in the respective countries. This should result in inducing higher competition and further drop in ARPUs in the region and resultant contracting profitability of the players. The service providers should aim to increase their market shares by providing differentiated value added services and providing content based services (like mobile video streaming) to enhance the ARPUs.
Though geographic expansion provides an opportunity to grow the customer base, the latest technological developments in the region including Mobile Number Portability (MNP) allows easy churn in customer base and loss of customer to a better service provider. Hence, to maintain profitability the service providers must also aim at optimizing the customer acquisition costs.
Fixed Line ServicesFixed line services are suffering on account of increasing shift of customer base to the more convenient mobile voice services. In 2007, the worldwide fixed line subscribers declined by 0.9% to reach 1,271.2mn from 1,282.5mn in 2006.
Table 1: GCC vs. Worldwide Fixed Line Subscribers
mn 2002 2003 2004 2005 2006 2007
World 1,082.7 1,134.9 1,203.4 1,261.5 1,282.5 1,271.2
Asia 420.5 472.9 535.3 591.9 613.4 606.5
Americas 298.4 295.4 293.5 294.7 287.8 285.7
Europe 320.6 320.9 327.0 326.2 330.1 326.8
Oceania 12.6 12.7 12.6 12.3 12.1 11.8
Rest of Africa 10.8 11.4 10.9 11.9 12.8 12.6
MENA 19.7 21.5 24.1 24.6 26.2 27.8
GCC 4.5 4.6 4.9 5.1 5.8 5.4
Source: ITU and Global Research
This declining trend was also seen in Asia, Americas and Europe where the mobile penetration is on the rise. The Asian market is growing on account of rising volumes backed by increasing disposable income major contributors being India and China who have underwent high economic growth rates of 8 to 11% in the recent years. Also, availability of very cheap handsets in the range of US$20 is encouraging mass consumption of cellular services.

Global Research - GCC Global Investment House
8 GCC Telecom Sector August 2008
MENA sector is the only exception that has shown a 6.1% YoY increase in the fixed line subscribers in 2007. However, the growth in fixed line subscribers is declining as the YoY growth rate decelerated in 2007 at 6.1% compared to 6.7% in 2006. The GCC region however registered a decline of 6.9% from 5.8mn subscribers in 2006 to 5.4mn subscribers in 2007.
However, during the period 2002-2007, the worldwide fixed lines have increased at a 5 year (2002-07) CAGR of 3.3% representing a minor growth rate vis-à-vis a whopping double digit 23.3% growth in cellular subscribers.
Chart 1: Comparative YoY change in 2007 - Fixed Line vs. Cellular Subscribers
-6.9%
19.6%
25.6%
14.7%9.9%
7.7%
33.0%
40.1%
47.7%
-1.1%-0.9% -0.7% -1.0% -2.5% -1.9%
6.1%
-10.0%
-5.0%
0.0%
5.0%
10.0%
15.0%
20.0%
25.0%
30.0%
35.0%
40.0%
45.0%
50.0%
World Asia Americas Europe Oceania Rest of Africa MENA GCC
Fixed line Cellular
Source: ITU and Global Research
The Growth in MENA during the same period was 7.2% on the back of high growth rates in highly populous Morocco and Egypt that registered a 5 year (2002-07) CAGR of 16.3% and 7.7% respectively.
Chart 2: GCC vs. Worldwide - 5 year (2002-07) CAGR of Fixed Line Subscribers
3.3%
7.6%
-0.9% -1.2%
7.2%
3.6%
0.4%
3.1%
-2.0%-1.0%0.0%1.0%2.0%3.0%4.0%5.0%6.0%7.0%8.0%9.0%
World Asia Americas Europe Oceania Rest of Africa MENA GCC
Source: ITU and Global Research
The other growth contributors in these regions were Yemen (12.3%), Syria (10.5%) and Algeria (9.5%). The GCC region however displayed only a modest 5 year (2002-07) CAGR of 3.6% due to an increase in fixed line subscribers in Qatar (6.1%).
Cellular Services
Increasing disposable income and convenience of use is encouraging the cellular penetration in the region.
Global Research - GCC Global Investment House
August 2008 GCC Telecom Sector 9
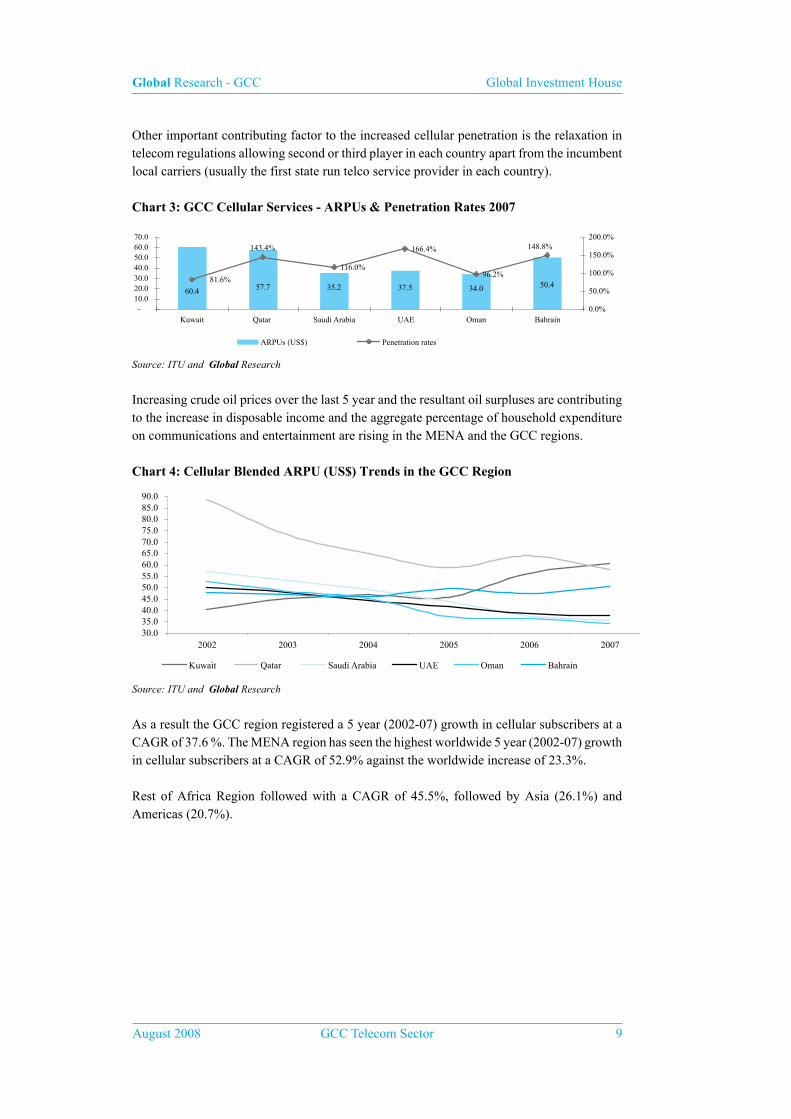
Other important contributing factor to the increased cellular penetration is the relaxation in telecom regulations allowing second or third player in each country apart from the incumbent local carriers (usually the first state run telco service provider in each country).
Chart 3: GCC Cellular Services - ARPUs & Penetration Rates 2007
50.434.037.535.257.760.4
116.0%
166.4%
96.2%
148.8%143.4%
81.6%
-10.020.030.040.050.060.070.0
Kuwait Qatar Saudi Arabia UAE Oman Bahrain0.0%
50.0%
100.0%
150.0%
200.0%
ARPUs (US$) Penetration rates
Source: ITU and Global Research
Increasing crude oil prices over the last 5 year and the resultant oil surpluses are contributing to the increase in disposable income and the aggregate percentage of household expenditure on communications and entertainment are rising in the MENA and the GCC regions.
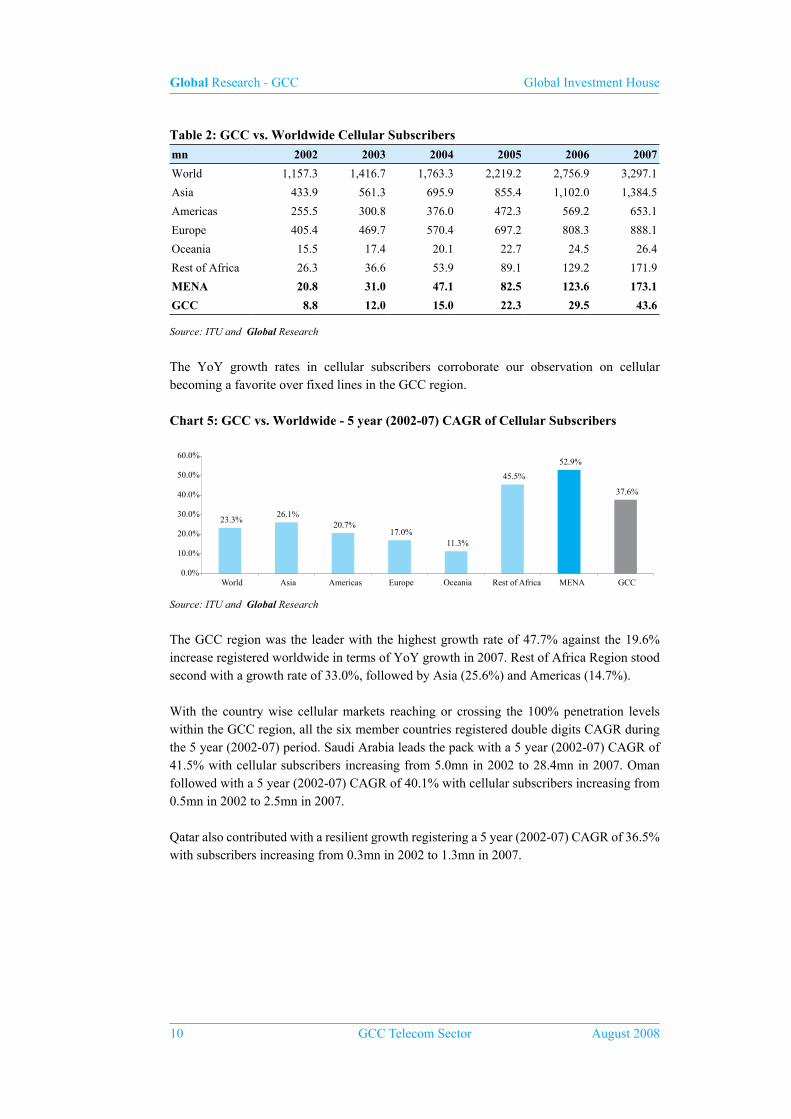
Chart 4: Cellular Blended ARPU (US$) Trends in the GCC Region
30.035.040.045.050.055.060.065.070.075.080.085.090.0
2002 2003 2004 2005 2006 2007
Kuwait Qatar Saudi Arabia UAE Oman Bahrain
Source: ITU and Global Research
As a result the GCC region registered a 5 year (2002-07) growth in cellular subscribers at a CAGR of 37.6 %. The MENA region has seen the highest worldwide 5 year (2002-07) growth in cellular subscribers at a CAGR of 52.9% against the worldwide increase of 23.3%.
Rest of Africa Region followed with a CAGR of 45.5%, followed by Asia (26.1%) and Americas (20.7%).
Global Research - GCC Global Investment House
10 GCC Telecom Sector August 2008
Table 2: GCC vs. Worldwide Cellular Subscribers
mn 2002 2003 2004 2005 2006 2007
World 1,157.3 1,416.7 1,763.3 2,219.2 2,756.9 3,297.1
Asia 433.9 561.3 695.9 855.4 1,102.0 1,384.5
Americas 255.5 300.8 376.0 472.3 569.2 653.1
Europe 405.4 469.7 570.4 697.2 808.3 888.1
Oceania 15.5 17.4 20.1 22.7 24.5 26.4
Rest of Africa 26.3 36.6 53.9 89.1 129.2 171.9
MENA 20.8 31.0 47.1 82.5 123.6 173.1
GCC 8.8 12.0 15.0 22.3 29.5 43.6
Source: ITU and Global Research
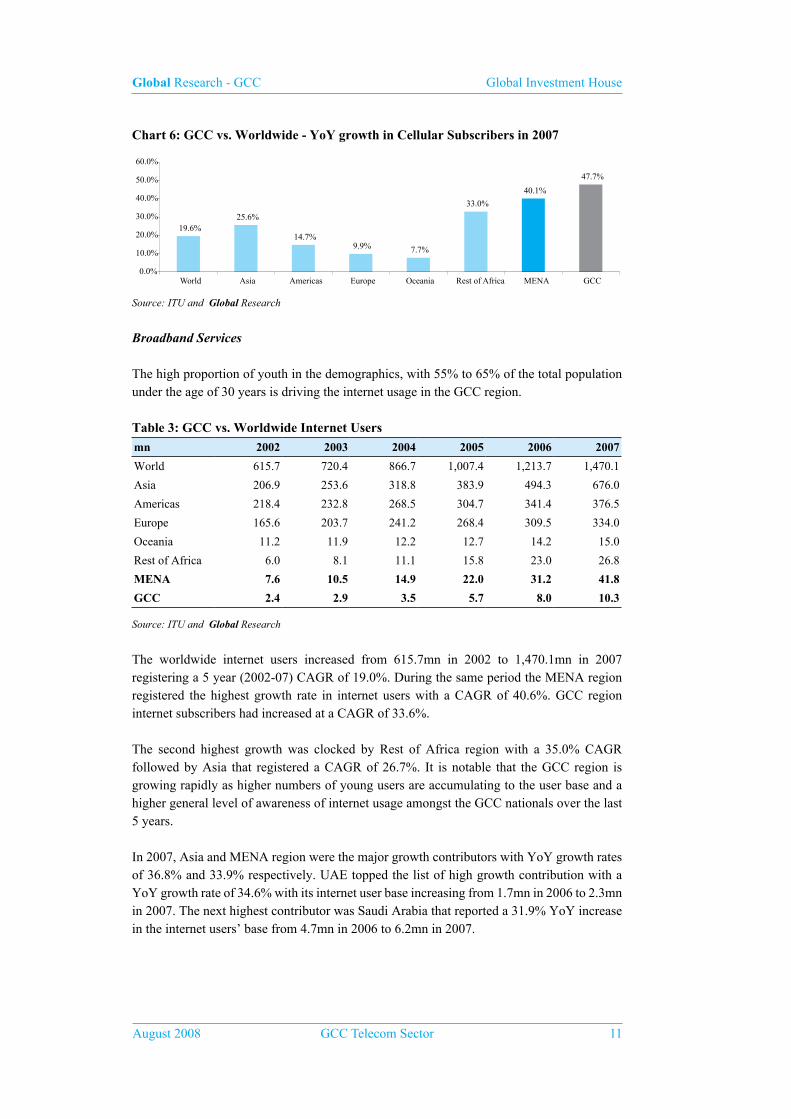
The YoY growth rates in cellular subscribers corroborate our observation on cellular becoming a favorite over fixed lines in the GCC region.
Chart 5: GCC vs. Worldwide - 5 year (2002-07) CAGR of Cellular Subscribers
23.3%26.1%
20.7%17.0%
11.3%
45.5%
52.9%
37.6%
0.0%
10.0%
20.0%
30.0%
40.0%
50.0%
60.0%
World Asia Americas Europe Oceania Rest of Africa MENA GCC
Source: ITU and Global Research
The GCC region was the leader with the highest growth rate of 47.7% against the 19.6% increase registered worldwide in terms of YoY growth in 2007. Rest of Africa Region stood second with a growth rate of 33.0%, followed by Asia (25.6%) and Americas (14.7%).
With the country wise cellular markets reaching or crossing the 100% penetration levels within the GCC region, all the six member countries registered double digits CAGR during the 5 year (2002-07) period. Saudi Arabia leads the pack with a 5 year (2002-07) CAGR of 41.5% with cellular subscribers increasing from 5.0mn in 2002 to 28.4mn in 2007. Oman followed with a 5 year (2002-07) CAGR of 40.1% with cellular subscribers increasing from 0.5mn in 2002 to 2.5mn in 2007.
Qatar also contributed with a resilient growth registering a 5 year (2002-07) CAGR of 36.5% with subscribers increasing from 0.3mn in 2002 to 1.3mn in 2007.
Global Research - GCC Global Investment House
August 2008 GCC Telecom Sector 11
Chart 6: GCC vs. Worldwide - YoY growth in Cellular Subscribers in 2007
19.6%25.6%
14.7%9.9% 7.7%
33.0%
40.1%
47.7%
0.0%
10.0%
20.0%
30.0%
40.0%
50.0%
60.0%
World Asia Americas Europe Oceania Rest of Africa MENA GCC
Source: ITU and Global Research
Broadband Services
The high proportion of youth in the demographics, with 55% to 65% of the total population under the age of 30 years is driving the internet usage in the GCC region.
Table 3: GCC vs. Worldwide Internet Users
mn 2002 2003 2004 2005 2006 2007
World 615.7 720.4 866.7 1,007.4 1,213.7 1,470.1
Asia 206.9 253.6 318.8 383.9 494.3 676.0
Americas 218.4 232.8 268.5 304.7 341.4 376.5
Europe 165.6 203.7 241.2 268.4 309.5 334.0
Oceania 11.2 11.9 12.2 12.7 14.2 15.0
Rest of Africa 6.0 8.1 11.1 15.8 23.0 26.8
MENA 7.6 10.5 14.9 22.0 31.2 41.8
GCC 2.4 2.9 3.5 5.7 8.0 10.3
Source: ITU and Global Research
The worldwide internet users increased from 615.7mn in 2002 to 1,470.1mn in 2007 registering a 5 year (2002-07) CAGR of 19.0%. During the same period the MENA region registered the highest growth rate in internet users with a CAGR of 40.6%. GCC region internet subscribers had increased at a CAGR of 33.6%.
The second highest growth was clocked by Rest of Africa region with a 35.0% CAGR followed by Asia that registered a CAGR of 26.7%. It is notable that the GCC region is growing rapidly as higher numbers of young users are accumulating to the user base and a higher general level of awareness of internet usage amongst the GCC nationals over the last 5 years.
In 2007, Asia and MENA region were the major growth contributors with YoY growth rates of 36.8% and 33.9% respectively. UAE topped the list of high growth contribution with a YoY growth rate of 34.6% with its internet user base increasing from 1.7mn in 2006 to 2.3mn in 2007. The next highest contributor was Saudi Arabia that reported a 31.9% YoY increase in the internet users’ base from 4.7mn in 2006 to 6.2mn in 2007.

Global Research - GCC Global Investment House
12 GCC Telecom Sector August 2008
Chart 7: GCC vs. Worldwide - 5 year (2002-07) CAGR in Internet Users
19.0%
26.7%
11.5%15.1%
6.1%
35.0%
40.6%
33.6%
0.0%
5.0%
10.0%
15.0%
20.0%
25.0%
30.0%
35.0%
40.0%
45.0%
World Asia Americas Europe Oceania Rest of Africa MENA GCC
Source: ITU and Global Research
Qatar also registered an impressive double digit YoY growth rate of 21.1% increasing its internet users’ base from 0.3mn in 2006 to 0.4mn in 2007.
Chart 8: GCC vs. Worldwide - YoY growth in Internet Users in 2007
21.1%
36.8%
10.3%7.9%
5.5%
16.3%
33.9%
28.8%
0.0%
5.0%
10.0%
15.0%
20.0%
25.0%
30.0%
35.0%
40.0%
World Asia Americas Europe Oceania Rest ofAfrica
MENA GCC
Source: ITU and Global Research
The higher rate of internet penetration and improved infrastructure services in terms of shift from Dial up to cable is helping increase the broadband subscriber base in the GCC region. Table 4: GCC vs. Worldwide Broadband Subscribers
mn 2002 2003 2004 2005 2006 2007
World 66.0 103.7 157.7 216.2 284.4 341.8
Asia 26.9 43.1 64.1 83.3 104.2 127.0
Americas 24.9 34.7 48.9 64.1 82.2 93.5
Europe 13.7 25.0 43.0 65.3 91.3 112.6
Oceania 0.3 0.6 1.2 2.4 4.5 5.6
Rest of Africa 0.0 0.0 0.1 0.2 0.5 0.5
MENA 0.1 0.2 0.4 0.9 1.7 2.7
GCC 0.1 0.1 0.2 0.3 0.6 1.0
Source: ITU and Global Research
The analysis of 5 year (2002-07) CAGR in broadband subscribers worldwide indicates that the GCC region is amongst the top three growth regions in the world. The worldwide broadband subscriber base increased at a 5 year (2002-07) CAGR of 38.9%.

Global Research - GCC Global Investment House
August 2008 GCC Telecom Sector 13
Chart 9: GCC vs. Worldwide - 5 year (2002-07) CAGR in Broadband Subscribers
38.9% 36.4% 30.3%
52.3%
78.8%
132.8%
89.8%71.6%
0.0%
20.0%
40.0%
60.0%
80.0%
100.0%
120.0%
140.0%
World Asia Americas Europe Oceania Rest of Africa MENA GCC
Source: ITU and Global Research
The rest of Africa region was the top growth region with a CAGR of 132.8% during the same period whereas Oceania and the GCC region registered a CAGR of 78.8% and 71.6% respectively.
Chart 10: GCC vs. Worldwide - YoY growth in Broadband Subscribers in 2007
20.2% 21.8%13.8%
23.2% 23.0%
5.2%
57.7%
68.9%
0.0%
10.0%
20.0%
30.0%
40.0%
50.0%
60.0%
70.0%
World Asia Americas Europe Oceania Rest of Africa MENA GCC
Source: ITU and Global Research
In 2007, the GCC region registered the highest growth rate at a YoY rate of 68.9% compared to the worldwide YoY growth rate of 20.2%.
The member countries that contributed to this increase were Saudi Arabia and Qatar. The subscriber base in Saudi Arabia displayed an astronomical YoY growth of 175.0% increasing from 0.2mn subscribers in 2006 to 0.6mn in 2007 on the back of increased spending on IT infrastructure. Qatar followed, growing from 0.05mn subscribers in 2006 to 0.07mn in 2007 registering a YoY growth of 50.2%. We expect the broadband penetration to increase further as a result of the young demographics and increased focus on developing the IT infrastructure in the region.

Global Research - GCC Global Investment House
14 GCC Telecom Sector August 2008
GCC Country-wise Telecom Profile
Kuwait
The Kuwait telecom market is the first to open itself to competition in 1999 in the GCC region for cellular services, though the fixed line market is yet under monopoly government control.
Table 5: Country Telecom Profile – Kuwait
000s 2002 2003 2004 2005 2006 2007
Cellular Subscribers 1,401.8 1,761.4 2,109.7 2,277.0 2,530.0 2,773.7
Cellular Penetration 57.9% 69.2% 76.6% 76.1% 79.5% 81.6%
Pre paid subscribers % 69.0% 76.2% 80.1% 79.5% 79.6% 78.3%
Post paid subscribers % 31.0% 23.8% 19.9% 20.5% 20.4% 21.7%
Blended ARPU (US$) 40.3 45.0 46.8 45.7 56.3 60.4
Fixed Line Subscribers 481.9 486.9 497.0 504.8 516.9 517.0
Fixed Line Penetration % 20.4% 19.6% 19.5% 18.8% 18.7% 18.1%
Broadband Subscribers 10.5 13.0 20.0 25.0 25.0 25.0
Broadband Penetration % 0.4% 0.5% 0.8% 0.9% 0.9% 0.9%Source: ITU and Global Research
Regulatory Environment
Ministry of Communications (MOC) plays the role of the regulator in Kuwait in the absence of an independent Telecom Regulatory Authority (TRA). The fixed line services in Kuwait are completely controlled and operated by the MOC. However, following the trends in the international market and the regional changes with requirement of higher data transfers should lead to a relaxation in this segment and should lead to a higher penetration. The fixed line penetration declined from 20.4% in 2002 to 18.1% in 2007 on account of loss of subscribers to the cellular segment.
Cellular Penetration and ARPUs
Mobile Telecommunications Company and National Mobile Telecommunications Company are the two listed cellular service providers in Kuwait. The MOC opened up the cellular services to competition in 1999, the first country to do that in the GCC region then. This has helped increase the penetration in the region from 57.9% in 2002 to 81.6%. Though the proportion of prepaid subscribers has increased from 69.0% in 2002 to 78.3% in 2007, the ARPUs have increased at a 5 year (2002-07) CAGR of 8.4% from US$40.3 in 2002 to US$60.4 in 2007. We observe that this has occurred due to lower competition on account of only two cellular operators in the country and increasing subscription to high priced value added services.

Global Research - GCC Global Investment House
August 2008 GCC Telecom Sector 15
Qatar
The Telecom market in Qatar is highly monopolized until 2007 and is expected to see growing competition in 2008 or early 2009 onwards with liberalization setting in.
Table 6: Country Telecom Profile – Qatar
000s 2002 2003 2004 2005 2006 2007
Cellular Subscribers 266.7 376.5 490.3 716.8 919.8 1,264.4
Cellular Penetration 43.2% 52.5% 64.9% 90.0% 109.7% 143.4%
Pre paid subscribers % 51.4% 63.5% 72.2% 78.1% 79.9% 83.4%
Post paid subscribers % 48.6% 36.5% 27.8% 21.9% 20.1% 16.6%
Blended ARPU (US$) 88.7 73.1 64.9 58.6 63.8 57.7
Fixed Line Subscribers 176.5 184.5 190.9 205.4 228.3 237.4
Fixed Line Penetration % 26.3% 26.0% 25.8% 26.3% 27.2% 28.3%
Broadband Subscribers 0.2 3.0 10.7 25.1 46.8 70.3
Broadband Penetration % 0.0% 0.4% 1.4% 3.2% 5.6% 8.4%
Source: ITU and Global Research
Regulatory Environment
Supreme Council of Information and Communication Technology (ictQatar) was set up in 2004 as the regulator of telecommunication sector in Qatar. The regulatory environment was highly monopolistic with Qatar Telecom providing both fixed line and cellular services until the decree law No. 34 of 2006 was promulgated to liberalize and open the telecom sector in Qatar.
Cellular Penetration and ARPUs
In continuation to the liberalization decree in 2006 and commercial bidding, Qatar’s second mobile license has been granted to Vodafone in Jun’08. In early 2009, consumers should be able to choose the company that best serves them. Following the years depicting lower cellular penetration since 2002, the penetration level has increased on account of proposed liberalization. The cellular penetration has increased from 43.2% in 2002 to 143.4% in 2007, the third highest in the region after UAE (166.4%) and Bahrain (148.8%).

Global Research - GCC Global Investment House
16 GCC Telecom Sector August 2008
Saudi Arabia
The largest market by size in the GCC region, Saudi Arabian telecom market is growing resiliently in the recent years breaching the 100% penetration mark in the cellular services. However, the level of penetration is low in the fixed line services. The kingdom is characterized by one fixed line and two cellular service providers. A third cellular services provider and a second fixed line services provider are expected to start operations in 2008.
Table 7: Country Telecom Profile – Saudi Arabia
000s 2002 2003 2004 2005 2006 2007
Cellular Subscribers 5,008.0 7,238.2 9,175.8 14,164.2 19,662.6 28,381.0
Cellular Penetration 23.3% 32.9% 40.5% 61.3% 83.0% 116.0%
Pre paid subscribers % 42.0% 52.8% 53.3% 67.4% 76.6% 83.1%
Post paid subscribers % 58.0% 47.2% 46.7% 32.6% 23.4% 16.9%
Blended ARPU (US$) 57.0 53.0 48.9 43.8 37.2 35.2
Fixed Line Subscribers 3,417.0 3,502.6 3,695.1 3,844.0 3,951.0 3,996.0
Fixed Line Penetration % 15.1% 15.0% 15.4% 15.6% 15.7% 16.2%
Broadband Subscribers 34.8 46.0 68.7 67.8 218.2 600.0
Broadband Penetration % 0.2% 0.2% 0.3% 0.3% 0.9% 2.4%
Source: ITU and Global Research
Regulatory Environment
The Independent telecom regulatory authority of Saudi Arabia, the Communications & Information Technology Commission (CITC) was established in 2001. The incumbent fixed line and cellular player Saudi Telecom (STC) established in 1998 is the largest provider followed by Emirates Telecommunications Corporation (ETISALAT) who won the second cellular provider license in 2004. Mobile Telecommunications Company, Kuwait (ZAIN) is expected to commence operations as the third cellular service provider by 2H08 and Bahrain Telecommunications Company (BATELCO) through Atheeb is expected to launch the country’s second fixed line services in 3Q08.
Cellular Penetration and ARPUs
Increasing number of players in the telecom market is driving the penetration and the country’s cellular penetration has breached the 100% levels in 2007 when it clocked an all time high cellular penetration rate of 101.4%. Increasing competition and slashing prices is driving down the ARPUs year after year. The cellular ARPUs have declined from US$57.0 in 2002 to US$35.2 in 2007 thereby declining at a 5 year (2002-07) CAGR of 9.2%. Apart from competition the increasing composition of prepaid subscribers that increased from 50.0% in 2002 to 60.0% in 2007 is also contributing to decline in ARPUs.
Broadband Penetration
The increasing component of youth in the population is driving the internet users in the country and also the broadband subscribers. The broadband penetration has increased from a negligible 0.2% in 2002 to 2.4% in 2007, with subscribers registering a 5 year (2002-07) CAGR of 76.7%.
Global Research - GCC Global Investment House
August 2008 GCC Telecom Sector 17
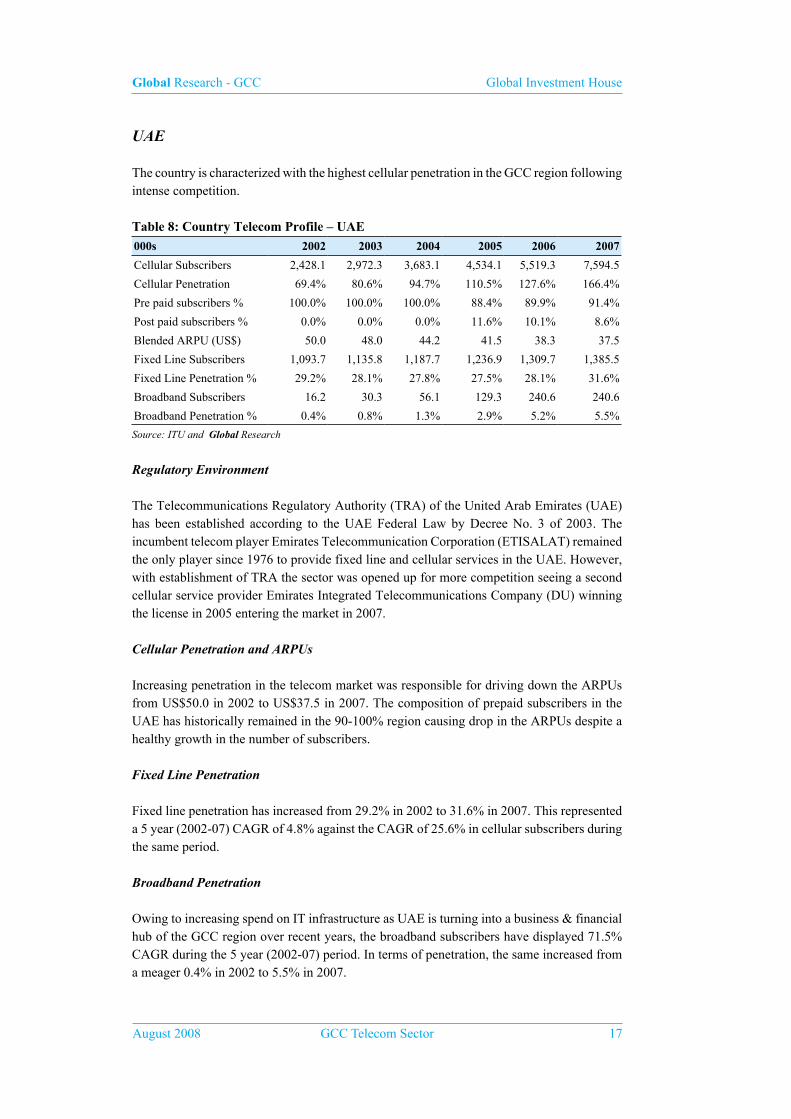
UAE
The country is characterized with the highest cellular penetration in the GCC region following intense competition.
Table 8: Country Telecom Profile – UAE
000s 2002 2003 2004 2005 2006 2007
Cellular Subscribers 2,428.1 2,972.3 3,683.1 4,534.1 5,519.3 7,594.5
Cellular Penetration 69.4% 80.6% 94.7% 110.5% 127.6% 166.4%
Pre paid subscribers % 100.0% 100.0% 100.0% 88.4% 89.9% 91.4%
Post paid subscribers % 0.0% 0.0% 0.0% 11.6% 10.1% 8.6%
Blended ARPU (US$) 50.0 48.0 44.2 41.5 38.3 37.5
Fixed Line Subscribers 1,093.7 1,135.8 1,187.7 1,236.9 1,309.7 1,385.5
Fixed Line Penetration % 29.2% 28.1% 27.8% 27.5% 28.1% 31.6%
Broadband Subscribers 16.2 30.3 56.1 129.3 240.6 240.6
Broadband Penetration % 0.4% 0.8% 1.3% 2.9% 5.2% 5.5%
Source: ITU and Global Research
Regulatory Environment
The Telecommunications Regulatory Authority (TRA) of the United Arab Emirates (UAE) has been established according to the UAE Federal Law by Decree No. 3 of 2003. The incumbent telecom player Emirates Telecommunication Corporation (ETISALAT) remained the only player since 1976 to provide fixed line and cellular services in the UAE. However, with establishment of TRA the sector was opened up for more competition seeing a second cellular service provider Emirates Integrated Telecommunications Company (DU) winning the license in 2005 entering the market in 2007.
Cellular Penetration and ARPUs
Increasing penetration in the telecom market was responsible for driving down the ARPUs from US$50.0 in 2002 to US$37.5 in 2007. The composition of prepaid subscribers in the UAE has historically remained in the 90-100% region causing drop in the ARPUs despite a healthy growth in the number of subscribers.
Fixed Line Penetration
Fixed line penetration has increased from 29.2% in 2002 to 31.6% in 2007. This represented a 5 year (2002-07) CAGR of 4.8% against the CAGR of 25.6% in cellular subscribers during the same period.
Broadband Penetration
Owing to increasing spend on IT infrastructure as UAE is turning into a business & financial hub of the GCC region over recent years, the broadband subscribers have displayed 71.5% CAGR during the 5 year (2002-07) period. In terms of penetration, the same increased from a meager 0.4% in 2002 to 5.5% in 2007.
Global Research - GCC Global Investment House
18 GCC Telecom Sector August 2008
Oman
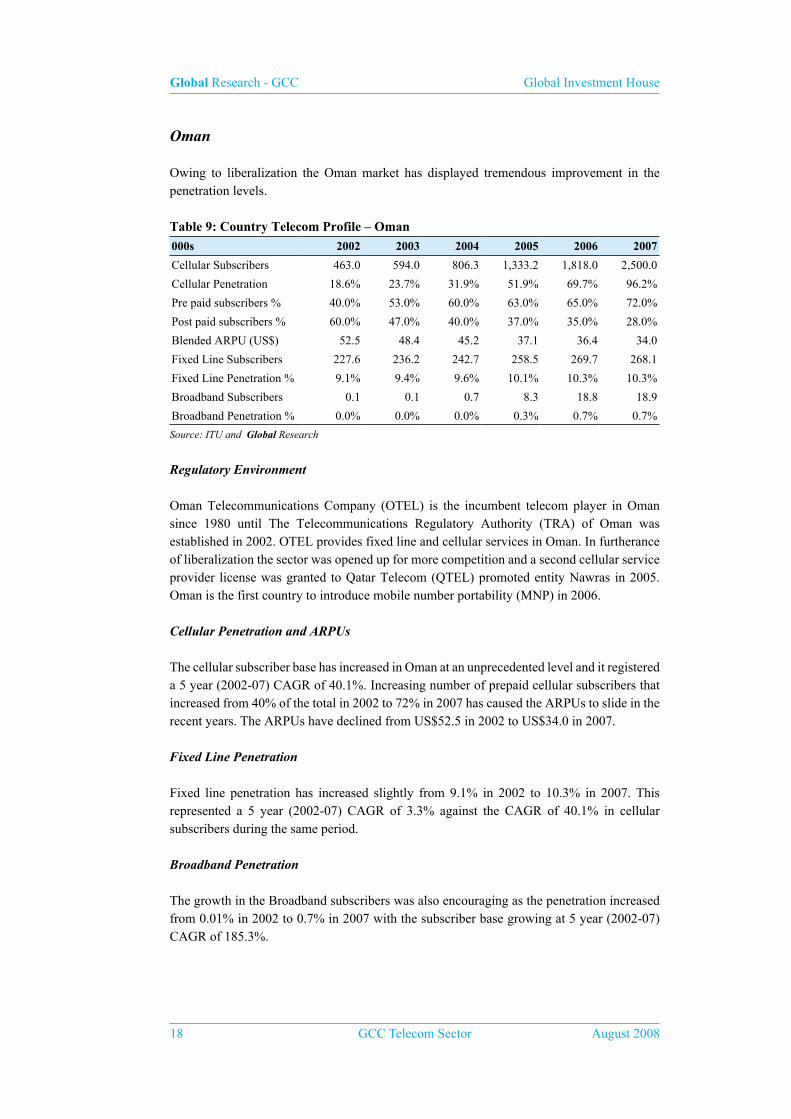
Owing to liberalization the Oman market has displayed tremendous improvement in the penetration levels.
Table 9: Country Telecom Profile – Oman
000s 2002 2003 2004 2005 2006 2007
Cellular Subscribers 463.0 594.0 806.3 1,333.2 1,818.0 2,500.0
Cellular Penetration 18.6% 23.7% 31.9% 51.9% 69.7% 96.2%
Pre paid subscribers % 40.0% 53.0% 60.0% 63.0% 65.0% 72.0%
Post paid subscribers % 60.0% 47.0% 40.0% 37.0% 35.0% 28.0%
Blended ARPU (US$) 52.5 48.4 45.2 37.1 36.4 34.0
Fixed Line Subscribers 227.6 236.2 242.7 258.5 269.7 268.1
Fixed Line Penetration % 9.1% 9.4% 9.6% 10.1% 10.3% 10.3%
Broadband Subscribers 0.1 0.1 0.7 8.3 18.8 18.9
Broadband Penetration % 0.0% 0.0% 0.0% 0.3% 0.7% 0.7%
Source: ITU and Global Research
Regulatory Environment
Oman Telecommunications Company (OTEL) is the incumbent telecom player in Oman since 1980 until The Telecommunications Regulatory Authority (TRA) of Oman was established in 2002. OTEL provides fixed line and cellular services in Oman. In furtherance of liberalization the sector was opened up for more competition and a second cellular service provider license was granted to Qatar Telecom (QTEL) promoted entity Nawras in 2005. Oman is the first country to introduce mobile number portability (MNP) in 2006.
Cellular Penetration and ARPUs
The cellular subscriber base has increased in Oman at an unprecedented level and it registered a 5 year (2002-07) CAGR of 40.1%. Increasing number of prepaid cellular subscribers that increased from 40% of the total in 2002 to 72% in 2007 has caused the ARPUs to slide in the recent years. The ARPUs have declined from US$52.5 in 2002 to US$34.0 in 2007.
Fixed Line Penetration
Fixed line penetration has increased slightly from 9.1% in 2002 to 10.3% in 2007. This represented a 5 year (2002-07) CAGR of 3.3% against the CAGR of 40.1% in cellular subscribers during the same period.
Broadband Penetration
The growth in the Broadband subscribers was also encouraging as the penetration increased from 0.01% in 2002 to 0.7% in 2007 with the subscriber base growing at 5 year (2002-07) CAGR of 185.3%.

Global Research - GCC Global Investment House
August 2008 GCC Telecom Sector 19
Bahrain
Liberalization has also affected the Bahrain telecom market in a positive manner with higher penetration rates. It has the second highest cellular penetration in the GCC region.
Table 10: Country Telecom Profile – Bahrain
000s 2002 2003 2004 2005 2006 2007
Cellular Subscribers 389.0 443.1 649.8 748.7 907.4 1,116.0
Cellular Penetration 55.6% 62.4% 90.3% 102.6% 122.6% 148.8%
Pre paid subscribers % 76.0% 75.0% 75.0% 75.0% 75.0% 75.0%
Post paid subscribers % 24.0% 25.0% 25.0% 25.0% 25.0% 25.0%
Blended ARPU (US$) 48.0 47.0 46.0 49.4 47.3 50.4
Fixed Line Subscribers 175.4 185.8 191.6 193.5 194.2 194.2
Fixed Line Penetration % 25.1% 26.2% 26.6% 26.5% 26.2% 25.9%
Broadband Subscribers 5.0 9.7 15.0 21.4 38.6 38.6
Broadband Penetration % 0.7% 1.4% 2.1% 2.9% 5.2% 5.1%
Source: ITU and Global Research
Regulatory Environment
The Telecommunications Regulatory Authority (TRA) of Bahrain was established by Legislative Decree No. 48 of 2002 promulgating the Telecommunications Law. Bahrain Telecommunications Company (BATELCO) was established in 1981 as the incumbent telecom player. Following liberalization, Mobile Telecommunications Company (ZAIN) was awarded the second cellular service provider license in 2003. The competition also intensified in the fixed line segment with the licenses for second and third fixed line operators being granted to Lightspeed Communications and Kalaam Telecom respectively.
Cellular Penetration and ARPUs
The cellular penetration has increased from 55.6% in 2002 to a whopping 148.8% in 2007. The entry of new player in the arena gave ample choice to the customers and thus the customer base increased at a 5 year (2002-07) CAGR of 23.5% from 0.4mn in 2002 to 1.1mn in 2007. ARPUs have fluctuated over the 5 year period but remained in the range of US$46.0 to US$50.4 as a result of stable 75% prepaid concentration in the total cellular subscriber base.
Fixed Line Penetration
The competition in the fixed line segment is intensifying with three operators in play; however the penetration is relatively flat at 25.9% in 2007 as compared to 25.1% in 2002 and has not declined as the consumers’ interest was maintained due to provision of internet related facilities through fixed line connections. This was quite different from the declining fixed line penetration trend seen in other countries in the GCC region.

PLAYER PROFILES
Global Research - GCC Global Investment House
August 2008 GCC Telecom Sector 21
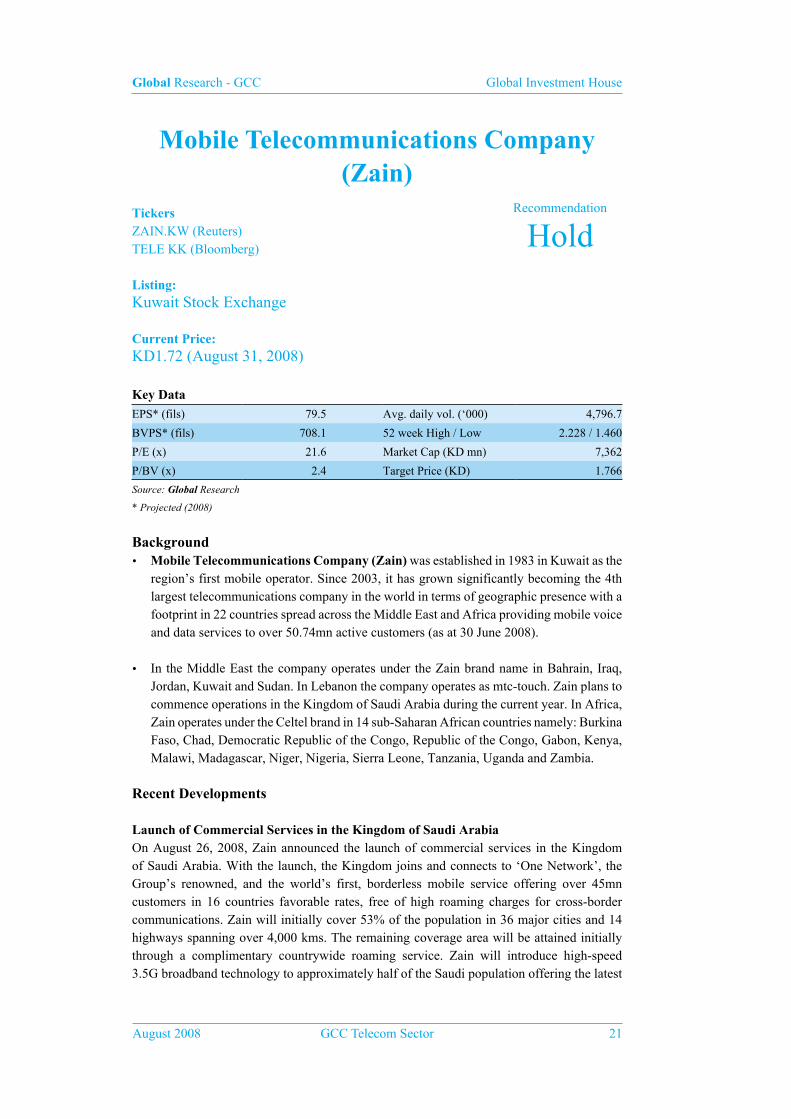
Mobile Telecommunications Company(Zain)
TickersZAIN.KW (Reuters)TELE KK (Bloomberg)
Listing:Kuwait Stock Exchange
Current Price: KD1.72 (August 31, 2008)
Key Data
EPS* (fils) 79.5 Avg. daily vol. (‘000) 4,796.7
BVPS* (fils) 708.1 52 week High / Low 2.228 / 1.460
P/E (x) 21.6 Market Cap (KD mn) 7,362
P/BV (x) 2.4 Target Price (KD) 1.766
Source: Global Research
* Projected (2008)
Background• Mobile Telecommunications Company (Zain) was established in 1983 in Kuwait as the
region’s first mobile operator. Since 2003, it has grown significantly becoming the 4th largest telecommunications company in the world in terms of geographic presence with a footprint in 22 countries spread across the Middle East and Africa providing mobile voice and data services to over 50.74mn active customers (as at 30 June 2008).
• In the Middle East the company operates under the Zain brand name in Bahrain, Iraq, Jordan, Kuwait and Sudan. In Lebanon the company operates as mtc-touch. Zain plans to commence operations in the Kingdom of Saudi Arabia during the current year. In Africa, Zain operates under the Celtel brand in 14 sub-Saharan African countries namely: Burkina Faso, Chad, Democratic Republic of the Congo, Republic of the Congo, Gabon, Kenya, Malawi, Madagascar, Niger, Nigeria, Sierra Leone, Tanzania, Uganda and Zambia.
Recent Developments
Launch of Commercial Services in the Kingdom of Saudi ArabiaOn August 26, 2008, Zain announced the launch of commercial services in the Kingdom of Saudi Arabia. With the launch, the Kingdom joins and connects to ‘One Network’, the Group’s renowned, and the world’s first, borderless mobile service offering over 45mn customers in 16 countries favorable rates, free of high roaming charges for cross-border communications. Zain will initially cover 53% of the population in 36 major cities and 14 highways spanning over 4,000 kms. The remaining coverage area will be attained initially through a complimentary countrywide roaming service. Zain will introduce high-speed 3.5G broadband technology to approximately half of the Saudi population offering the latest
HoldRecommendation
Global Research - GCC Global Investment House
22 GCC Telecom Sector August 2008
3.5G services that include television, video-calling, rich multimedia content and even faster internet access. Zain’s network will be further expanded in stages to eventually cover the entire Kingdom. Zain Saudi Arabia is a publicly listed company on the Saudi Stock Exchange ‘Tadawul’.
Expansion of One Network In April 2008, Zain launched borderless ‘One Network’ mobile service to Bahrain, Iraq, Jordan and Sudan. This service will allow Zain’s 15mn customers to communicate in between and to be treated as local customers in terms of pricing while using their home network service. In November 2007, Zain’s subsidiary Celtel International expanded its ‘One Network’, the world’s first borderless mobile network in Africa. This ‘One Network’ in Africa covers 12 countries.
Celtel Re-branded to ZainIn August 2008, Zain announced that it has re-branded its entire African operations from Celtel to Zain. Fourteen country operations across Africa will immediately rebrand to Zain, namely Burkina Faso, Chad, the Republic of Congo, the Democratic Republic of Congo, Gabon, Kenya, Madagascar, Malawi, Niger, Nigeria, Sierra Leone, Tanzania, Uganda and Zambia. Zain also announced the creation of the world’s first cross-continental borderless network, extending and linking its ‘One Network’ service between Africa and the Middle East. The service will be available to 500 million people stretching from the west coast of Africa to the Middle East.
Zain to Increase Equity Capital In August 2008 the company is raising its equity capital through rights issue. The company’s paid up capital will be increased by 75% through rights which is priced at 850 fils per share (premium of 750 fils). The company’s equity capital will increase to KD428.03mn from the current KD189.4mn. The capital increase will allow Zain to finance its future expansion plans as well as meet its financial commitments.
Analysis of Country Operations
Group level PerformanceIn FY2007, total active customers of Zain increased to 42.50mn versus 27.04mn in FY2006, an increase of 57.2%. As of year end 2007, Zain’s African operations – through its subsidiary Celtel International – represented 64% of the company’s customer base while the operations in Middle East countries of Iraq, Sudan, Jordan, Kuwait, Lebanon and Bahrain represented the remaining customers. Zain’s African operations registered a 59% increase in customers in 2007, while the Middle Eastern operations registered a 53% increase over the same period. The company’s customer increase was driven primarily by its high growth African operations including Nigeria, Uganda and Tanzania. In the Middle East, the operations in Iraq, Bahrain and Sudan showed solid growth.
At the end of July 2008, Zain’s group customer base increased to 50.74mn from 42.50mn at the end of 2007, registering a YTD growth of 19.4% and a YoY growth of 57.8%.

Global Research - GCC Global Investment House
August 2008 GCC Telecom Sector 23
Chart 01:Country-wise Customer Segmentation - June 2008
Chart 02:Customer segmentation of African countries– June 2008
Source: Company Reports and Global Research
Middle East Operations
KuwaitIn 2007 Kuwait witnessed a growth of 9.6% in total subscriber base for GSM to reach 2.77mn customers, which indicates penetration rate of 82% on total population and 106% on addressable population. Zain leads the GSM segment in Kuwait with a market share of 57% whereas NMTC accounts for the rest of the market share i.e. 43% as there are only two GSM operators in the country.
In GSM segment, the total customer addition in 2007 was 244,009. In 2007, NMTC gained a larger slice of total market additions with a customer addition of 129,009 which helped it to increase its market share from 42% in 2006 to 43% in 2007. Zain increased its customer strength by 115,000 customers.
In Kuwait, out of the total subscriber base of 2.77mn as of Dec. 2007, 2.17mn customers (78.3%) were prepaid customers while 602,506 (21.7%) customers were postpaid. Zain accounted for 72.5% of the total postpaid customers and 52.5% of total prepaid subscribers while NMTC accounted for 27.5% of total postpaid customers and 47.5% of total prepaid customers.
Saudi Telecom Company (STC), the third operator is likely to start its operation in 2008. In 2007, the government of Kuwait issued a third mobile license to STC for US$907.6mn. MTC’s Kuwait operation had a total of 1.58mn customers by year end 2007, representing an increase of 7.9% over 2006. Out of the total subscriber base, 72.3% were prepaid customers while 27.7% were postpaid customers. For FY2007, Kuwait operations reported revenues of KD359.4mn, contributed 21.4% to total revenues of MTC for the year. EBITDA was at KD194.1mn representing an EBITDA margin of 54%. Net profit from Kuwait operations
Kuwait 3.3%
Jordan 3.9%
Iraq 15.6%
Bahrain1.1%
Lebanon 1.4%
Sudan 9.1%
Africa 65.6%
Burkina Faso 3.5%
Chad 2.3%
Congo Brazzaville 3.5%
DRC 8.1%
Gabon 2.2%
Kenya 5.7%
Madagascar 2.7%
Malawi 2.9%
Niger 2.6%
Nigeria 44.5%
Sierra Leone 1.3%
Tanzania 8.5%
Uganda 5.4%
Zambia 6.9%
Global Research - GCC Global Investment House
24 GCC Telecom Sector August 2008
increased by 53.1% to reach KD216.1mn. In 2007, its Kuwait operations had a high ARPU of US$70, which declined marginally to US$69 at the end of 1H-2008. During 1H-2008, MTC increased its customer base to 1.66mn, a y-t-d increase of 84,000 customers.
JordanZain’s Jordan operation had a total of 1.858mn customers at the end of 2007, representing a 5.2% decline in total customers compared to 2006. In 2007, ARPU for Jordan operations increased to US$19 from US$17 in 2006. Revenues for FY2007 were KD135.3mn, a decline of 4%, compared to KD141mn reported for FY2006. EBITDA was at KD62.5mn representing an EBITDA margin of 46.2%. It reported a decline of 14% in its net profit to reach at KD32.6mn for FY2007.
BahrainBahrain has the highest mobile penetration rate in the region and is leading the way in offering new innovative services such as triple play and Wi-Max. In 2007, Zain’s Bahrain operations increased its total customer base by 92% to 448,000 customers. Its revenues in FY2007 reached to KD42.9mn, registered a growth of 32.4% over FY2006. In 2007, ARPU for Bahrain operations increased to US$42 from US$31 in 2006. Its EBITDA increased by 34% to reach at KD13.5mn. In FY2007, it reported significant growth of 39.2% in net profit to reach at KD4.7mn as compared to KD3.4mn reported in FY2006.
IraqIn Iraq, at the end of 2007 Zain had total customer base of 7.287mn, representing a 128% increase over 2006. Zain’s leading position in the Iraqi market has been further strengthened by the acquisition of Iraqna, one of Iraq’s three mobile operators. Iraq is predominantly a prepaid customer market for the Zain Group as there are only 55,000 postpaid customers and the rest all are prepaid customers. For FY2007, Zain Iraq reported revenues of KD159.1mn representing a growth of 60% for the year. In 2007, ARPU for its Iraq operations declined to US$13 from US$14 in 2006. EBITDA increased by 70.7% to reach KD50.4mn. In FY2007, Iraq operations reported a significant growth of 149% in its bottom-line to reach KD13.2mn from KD5.3mn in FY2006. LebanonZain has a 4-year management contract to operate one of Lebanon’s two GSM operations. In June 2004, MTC won a 4-year management contract to operate one of Lebanon’s two GSM operations. This year, Lebanon is in the midst of privatizing the two state-owned cellular networks, which are currently managed by the Kuwait’s Mobile Telecommunications Company Lebanon (MTC Touch) and the German-Saudi consortium Alfa. MTC has developed the Lebanese operation to full potential in hope that it will be added to the Group’s portfolio as soon as the government undertakes the process of privatization. At the end of 2007, Zain’s Lebanon operation had a total customer base of 630,000 customers which grew by 12.5% over 2006. MTC Touch’s revenues reached KD17.2mn in FY2007, registering an increase of 2% over FY2006. The disclosed revenues are from the management contract and not the total revenues of the operation which are collected by the Government of Lebanon. Its EBITDA and net profit increased by 7.9% and 6.4% to reach at KD3.03mn and KD2.7mn respectively.

Global Research - GCC Global Investment House
August 2008 GCC Telecom Sector 25
SudanIn February 2006, Zain acquired 100% of Mobitel in a deal valued at US$1.33bn. Mobitel, Sudan’s first mobile operator was successfully re-branded to Zain in September 2007. Zain’s Sudan operation had a total of 3.883mn customers at the end of 2007, increasing from 2.754mn in 2006. Its revenues increased by 16% to KD224.8mn in FY2007. EBITDA was KD92.2mn which declined by 21.7% and its net profit declined by 22.1% to reach KD74.7mn in FY2007. In 2007, ARPU for Sudan operations declined to US$20 from US$25 in 2006.
Sub-Saharan Africa (Celtel)As of December 31, 2007, Zain’s African operations, through its subsidiary Celtel International – represented 64% of the company’s customer base and registered a 59% increase in total customers. The company’s customer increase was driven primarily by its high growth African operations including Nigeria, Uganda and Tanzania.
NigeriaAs the competition became intense during the first quarter of 2008, Zain Nigeria (formerly Celtel Nigeria) focused on its key strategic initiatives, controlled 31% market share and was able to sustain its no. 2 position in the mobile telecom market. In addition, Zain Nigeria launched its Blackberry offering into the mass market and was the first operator to offer the Blackberry Red Phone. Adopting the One Network with the neighboring countries has led to increased subscriber acquisition. At the end of 2007, Zain Nigeria had a total customer base of 11.042mn, representing an increase of 73.5%. Zain Nigeria’s operation was accounting for 26% of Zain total customer base in 2007. Its revenues increased by 20.5% to KD332.4mn, EBITDA increased by 5.4% KD111.6mn and its net profit declined by 36.7% to KD23.6mn.
Tanzania Zain’s Tanzania operation had over 2.5mn active customers by year end 2007, representing a 65% increase compared to 2006. Its market share was 39% at the end of the year. The operation’s customers accounted for 6% of Zain total customer base. Its revenues increased by 56% to KD75.2mn, EBITDA increased by 55% KD27.6mn and its net profit grew significantly by 96% to KD14.7mn.
Gabon In Zain’s African operations Gabon is a high APRU market which increased to US$33 in 2007 from US$31 for 2006. Zain Gabon had a total of 666,000 active customers by year end 2007, representing a 30% increase compared to 2006. Its revenues increased by 42% to KD66.1mn, EBITDA increased by 26% KD31.7mn and its net profit grew by 11% to KD14.9mn.
KenyaZain’s Kenya operation had over 2mn active customers by year end 2007, representing an 8% increase over 2006. The operation’s customers accounted for 5% of Zain’s total customer base. In 2007, Zain Kenya’s total revenues grew by 11% to KD55.1mn whereas its EBITDA declined by 38% to KD9mn. It registered an increased net loss of KD6.1mn from KD3.2mn reported for 2006.

Global Research - GCC Global Investment House
26 GCC Telecom Sector August 2008
Other African OperationsIn case of Zain’s Uganda operation the year 2007 was the year of significant achievement as it increased its customer base from 470,000 to over 1.4mn, a growth of 205%. Among Zain’s other major operations in Africa are Democratic republic of Congo which accounted for 5% of the total group revenue. The other major revenue contributors to Zain were Zambia 4.3%, Gabon 3.9%, Tanzania 4.5%, Burkina Faso 1.7%, Niger, Chad and Uganda each contributed 1.6%. Many of these African countries have low penetration rate and offer high growth potential.
Financial Performance In FY2007, Zain reported total revenues of KD1.68bn, EBITDA of KD725.3mn and net profit of KD320.4mn as compared to our projected total revenues of KD1.66bn, EBITDA of KD716.8mn and net profit of KD335.3mn. Zain’s actual performance as compared to our projections for FY2007 showed variations (actual v/s projection) of 1.3% in total revenues, 1.2% in EBITDA, -4.4% in net profit and -4.5% in total assets.
Revenues for the 12-months of FY2007 grew to KD1.68bn, an increase of 29.3% compared to revenues of KD1.3bn reported for FY2006. EBITDA grew to KD725.3mn, an increase of 22.2%, resulting into an EBITDA margin of 43.2%. Its EBITDA margin declined from 45.8% in FY2006 to 43.2% in FY2007. Its finance cost and depreciation & amortization grew by 40.3% and 45.7% to KD123.6mn and KD236.1mn, respectively. Net profit attributable to shareholders of the parent company for FY2007 increased by 8.6% to KD320.4mn as compared to KD295mn reported for FY2006.
In FY2007, the size of consolidated balance sheet of Zain grew by 25.1% to KD4.4bn. Its gross fixed assets increased by 33.3% to reach KD2.3bn. The company’s net intangible assets, represented by goodwill and license fees, increased to KD1.6bn in FY2007 from KD1.5bn for FY2006. The increase in intangibles was mainly due to acquisitions and increase in stake in subsidiaries. In FY2007, the company’s borrowings from banks increased to KD2bn from KD1.4bn in FY2006 which was for its African Celtel operations.
In 1H-2008, Zain Group’s consolidated revenues increased by 17% on y-o-y basis to reach KD936mn. Its EBITDA grew by 10.8% to KD350mn representing an EBITDA margin of 37.4%. Net profit declined from KD149mn reported in 1H-2007 to KD148mn in 1H-2008, witnessing a fall of 0.7%.
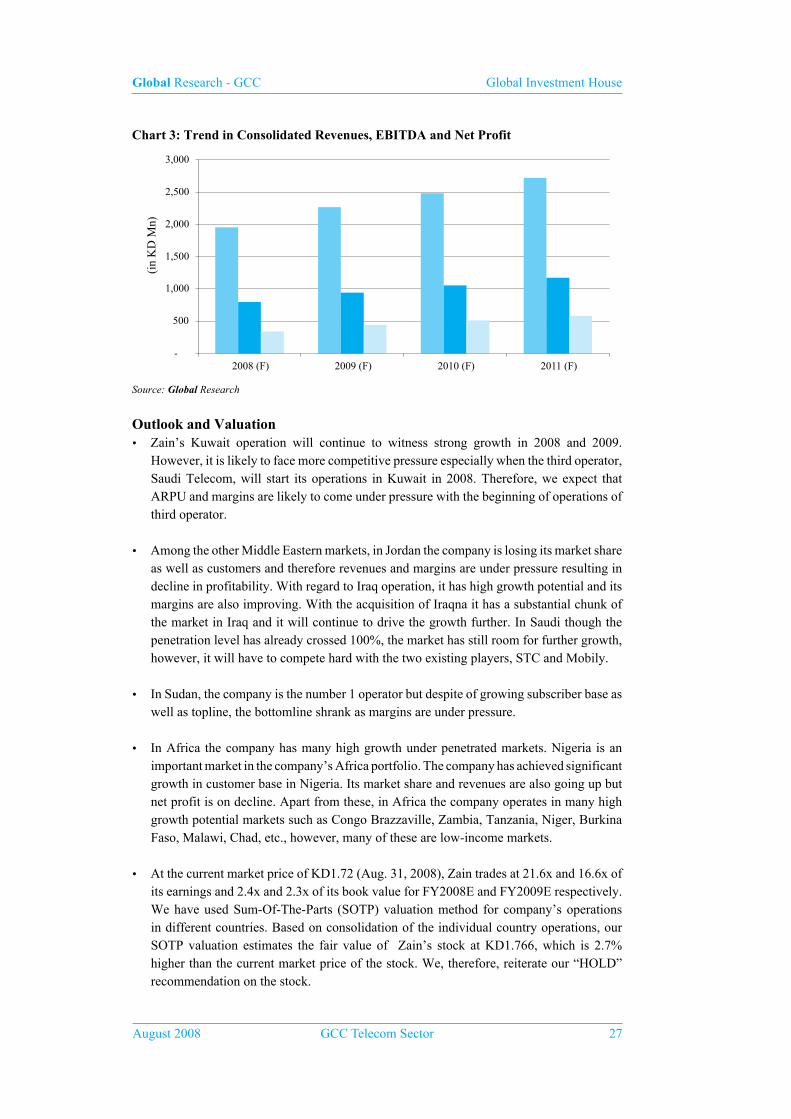
Future Trend in Consolidated Revenues & ProfitabilityGoing forward we forecast a 4 year (2007-2011) CAGR of 11.7% in consolidated revenues, 13.7% in EBIDTA and 19.7% in net profit. The contribution of Kuwait operation to the group revenue was 21.4% in 2007, which we expect to decline to 19.7% in 2008, 17.7% in 2009, 16% in 2010 and 14.2% in 2011, due to increasing revenue contribution from other operations.
Global Research - GCC Global Investment House
August 2008 GCC Telecom Sector 27
Chart 3: Trend in Consolidated Revenues, EBITDA and Net Profit
-
500
1,000
1,500
2,000
2,500
3,000
2008 (F) 2009 (F) 2010 (F) 2011 (F)
(in
KD
Mn)
Source: Global Research
Outlook and Valuation• Zain’s Kuwait operation will continue to witness strong growth in 2008 and 2009.
However, it is likely to face more competitive pressure especially when the third operator, Saudi Telecom, will start its operations in Kuwait in 2008. Therefore, we expect that ARPU and margins are likely to come under pressure with the beginning of operations of third operator.
• Among the other Middle Eastern markets, in Jordan the company is losing its market share as well as customers and therefore revenues and margins are under pressure resulting in decline in profitability. With regard to Iraq operation, it has high growth potential and its margins are also improving. With the acquisition of Iraqna it has a substantial chunk of the market in Iraq and it will continue to drive the growth further. In Saudi though the penetration level has already crossed 100%, the market has still room for further growth, however, it will have to compete hard with the two existing players, STC and Mobily.
• In Sudan, the company is the number 1 operator but despite of growing subscriber base as well as topline, the bottomline shrank as margins are under pressure.
• In Africa the company has many high growth under penetrated markets. Nigeria is an important market in the company’s Africa portfolio. The company has achieved significant growth in customer base in Nigeria. Its market share and revenues are also going up but net profit is on decline. Apart from these, in Africa the company operates in many high growth potential markets such as Congo Brazzaville, Zambia, Tanzania, Niger, Burkina Faso, Malawi, Chad, etc., however, many of these are low-income markets.
• At the current market price of KD1.72 (Aug. 31, 2008), Zain trades at 21.6x and 16.6x of its earnings and 2.4x and 2.3x of its book value for FY2008E and FY2009E respectively. We have used Sum-Of-The-Parts (SOTP) valuation method for company’s operations in different countries. Based on consolidation of the individual country operations, our SOTP valuation estimates the fair value of Zain’s stock at KD1.766, which is 2.7% higher than the current market price of the stock. We, therefore, reiterate our “HOLD” recommendation on the stock.

Global Research - GCC Global Investment House
28 GCC Telecom Sector August 2008
Table 1: SOTP – Valuation Summary
Country Operations Equity Value (in KD mn)
Jordan 454.9
Kuwait 1,798.8
Iraq 305.2
Nigeria 1,071.8
Other African Countries 1,485.4
Sudan 1,164.1
Others 811.8
Cash & Bank Balances 469.0
Total Equity Value 7,561.1
Number of shares outstanding (in mn) 4,280.3
Per share value (KD) 1.766
Source: Global Research

Global Research - GCC Global Investment House
August 2008 GCC Telecom Sector 29
BA
LA
NC
E S
HE
ET
Mob
ile T
elec
omm
unic
atio
ns C
ompa
ny K
SCA
mou
nt in
Kuw
aiti
Din
ar20
05 (
A)
2006
(A
)20
07 (
A)
2008
(F
)20
09 (
F)
2010
(F
)20
11 (
F)
Ass
ets:
B
ank
& c
ash
equi
vale
nts
91,
788,
000
371
,731
,000
1
48,2
26,0
00
325
,938
,789
2
12,9
48,7
85
120
,783
,497
1
25,4
96,6
37
S
hort
-ter
m D
epos
its
201
,091
,000
1
02,5
91,0
00
113
,037
,000
1
80,5
60,1
60
99,
308,
088
101
,790
,790
1
11,9
69,8
69
I
nves
tmen
ts 1
4,56
6,00
0 1
8,45
5,00
0 2
3,00
2,00
0 3
3,58
7,85
2 2
5,19
0,88
9 3
0,22
9,06
7 3
6,27
4,88
0
Tra
de &
bill
ing
rece
ivab
le 6
3,92
1,00
0 1
37,0
96,0
00
170
,718
,000
2
40,5
55,0
89
260
,498
,747
2
91,5
20,6
86
346
,856
,876
Inc
ome
rece
ivab
le 3
,892
,000
4
,760
,000
1
1,66
4,00
0 1
4,65
6,74
6 1
7,00
0,88
6 1
8,61
3,12
9 2
0,42
3,63
9
Oth
er r
ecei
vabl
es 4
9,71
8,00
0 8
1,66
7,00
0 1
06,7
64,0
00
134
,255
,792
1
47,3
41,0
15
161
,313
,783
2
04,2
36,3
90
I
nven
tori
es 7
,025
,000
1
4,79
1,00
0 2
2,04
7,00
0 3
0,44
4,77
8 3
9,59
3,15
0 4
9,65
5,61
2 6
0,81
5,09
4
Pro
visi
on f
or d
oubt
ful d
ebt
(37
,510
,000
) (
39,0
38,0
00)
(42
,870
,000
) (
48,1
63,1
98)
(48
,125
,092
) (
53,2
08,0
50)
(65
,029
,005
)T
otal
Cur
rent
Ass
ets
394
,491
,000
6
92,0
53,0
00
552
,588
,000
9
11,8
36,0
08
753
,756
,468
7
20,6
98,5
12
841
,044
,379
I
nves
tmen
t Sec
uriti
es 1
47,1
11,0
00
134
,842
,000
1
79,4
68,0
00
245
,412
,440
3
06,7
65,5
50
368
,118
,660
4
41,7
42,3
92
I
nves
tmen
ts in
Ass
ocia
tes-
Gro
ss 2
36,3
83,0
00
-
259
,640
,000
3
37,5
32,0
00
421
,915
,000
5
27,3
93,7
50
I
nves
tmen
ts in
Ass
ocia
tes
236
,383
,000
8
,026
,000
2
59,6
40,0
00
337
,532
,000
4
21,9
15,0
00
527
,393
,750
6
59,2
42,1
88
L
oan
to a
n as
soci
ate
170
,875
,000
2
42,8
76,0
00
242
,876
,000
2
42,8
76,0
00
242
,876
,000
Fix
ed a
sset
s 4
99,8
53,0
00
1,1
31,1
89,0
00
1,4
95,6
02,0
00
1,9
43,0
20,1
12
2,2
52,4
96,4
17
2,4
16,6
67,9
78
2,5
42,3
95,3
23
I
ntan
gibl
e A
sset
s 7
56,8
38,0
00
1,4
77,5
57,0
00
1,6
37,2
55,0
00
1,6
75,0
34,6
67
1,6
26,0
29,9
05
1,5
77,2
37,2
44
1,5
34,3
50,7
13
D
efer
red
tax
asse
ts 6
,723
,000
4
0,61
8,00
0 6
4,72
4,00
0 8
7,37
7,40
0 1
13,5
90,6
20
124
,949
,682
1
37,4
44,6
50
O
ther
fin
anci
al a
sset
s 1
4,90
8,00
0 6
,648
,000
6
,850
,000
7
,535
,000
8
,288
,500
9
,117
,350
1
0,02
9,08
5 T
otal
Ass
ets
2,0
56,3
07,0
00
3,4
90,9
33,0
00
4,3
67,0
02,0
00
5,4
50,6
23,6
27
5,7
25,7
18,4
60
5,9
87,0
59,1
76
6,4
09,1
24,7
30
Lia
bilit
ies:
T
rade
pay
able
s 5
8,87
7,00
0 1
02,3
10,0
00
142
,587
,000
1
45,7
59,1
35
175
,491
,761
1
81,6
60,0
89
205
,504
,756
Due
to s
uppl
iers
and
oth
er a
ccru
als
150
,676
,000
2
76,9
94,0
00
337
,690
,000
3
00,6
26,1
07
435
,885
,632
5
17,9
90,4
57
627
,527
,526
Oth
er P
ayab
les
31,
362,
000
48,
092,
000
74,
477,
000
87,
455,
481
118
,575
,514
1
29,7
57,2
07
166
,625
,478
Due
to B
anks
248
,417
,000
4
60,7
21,0
00
453
,747
,000
5
33,3
99,2
45
404
,941
,836
3
93,8
47,4
27
363
,137
,989
Due
to m
inor
ity in
tere
st h
olde
rs 1
31,1
54,0
00
155
,262
,000
1
8,50
9,00
0 1
8,50
9,00
0 1
8,50
9,00
0 1
8,50
9,00
0 1
8,50
9,00
0 T
otal
Cur
rent
Lia
bilit
ies
620
,486
,000
1
,043
,379
,000
1
,027
,010
,000
1
,085
,748
,968
1
,153
,403
,743
1
,241
,764
,179
1
,381
,304
,748
Oth
er n
on-c
urre
nt li
abili
ties
21,
016,
000
16,
023,
000
28,
411,
000
48,
080,
990
50,
485,
039
53,
009,
291
55,
659,
756
Def
erre
d ta
x lia
bilit
ies
5,8
79,0
00
9,9
80,0
00
31,
763,
000
36,
527,
450
42,
006,
568
48,
307,
553
55,
553,
686
Lon
g te
rm D
ebt
190
,342
,000
9
21,1
17,0
00
1,5
31,5
12,0
00
1,0
57,1
29,3
55
1,0
39,0
39,8
24
911
,677
,623
8
48,0
87,5
54
Due
to m
inor
ity in
tere
st h
olde
rs -
-
-
-
-
-
-
T
otal
non
-cur
rent
liab
ilitie
s 2
17,2
37,0
00
947
,120
,000
1
,591
,686
,000
1
,141
,737
,794
1
,131
,531
,431
1
,012
,994
,467
9
59,3
00,9
95
Min
oriti
es I
nter
est
32,
844,
000
146
,002
,000
1
66,3
79,0
00
192
,209
,592
2
24,9
00,9
49
261
,857
,855
2
61,8
57,8
55
Ow
ner’
s E
quity
:
pai
d-up
equ
ity c
apita
l 1
09,7
23,0
00
126
,182
,000
1
89,3
98,0
00
428
,030
,673
4
28,0
30,6
73
428
,030
,673
4
28,0
30,6
73
t
reas
ury
shar
es (
15,5
76,0
00)
(15
,576
,000
) (
15,5
76,0
00)
(15
,576
,000
) (
15,5
76,0
00)
(15
,576
,000
) (
15,5
76,0
00)
s
hare
pre
miu
m 6
24,4
65,0
00
624
,465
,000
6
24,4
65,0
00
1,6
90,7
71,4
03
1,6
90,7
71,4
03
1,6
90,7
71,4
03
1,6
90,7
71,4
03
l
egal
res
erve
54,
862,
000
63,
091,
000
94,
699,
000
214
,015
,336
2
14,0
15,3
36
214
,015
,336
2
14,0
15,3
36
v
olun
tary
res
erve
54,
862,
000
63,
091,
000
63,
091,
000
63,
091,
000
63,
091,
000
63,
091,
000
63,
091,
000
f
orei
gn c
urre
ncy
tran
slat
ion
rese
rve
2,3
52,0
00
(24
,390
,000
) (
26,0
14,0
00)
(26
,014
,000
) (
26,0
14,0
00)
(26
,014
,000
) (
26,0
14,0
00)
F
air
Val
ue R
eser
ve 5
5,54
0,00
0 4
1,77
8,00
0 6
7,70
4,00
0 1
33,6
48,4
40
195
,001
,550
2
56,3
54,6
60
329
,978
,392
Ret
aine
d ea
rnin
gs 2
99,5
12,0
00
470
,055
,000
5
71,9
38,0
00
530
,738
,421
6
54,3
40,3
75
847
,547
,603
1
,110
,142
,327
Sha
re b
ased
com
pens
atio
n re
serv
e -
5
,736
,000
1
2,22
2,00
0 1
2,22
2,00
0 1
2,22
2,00
0 1
2,22
2,00
0 1
2,22
2,00
0 T
otal
Sha
reho
lder
’s E
quity
1,1
85,7
40,0
00
1,3
54,4
32,0
00
1,5
81,9
27,0
00
3,0
30,9
27,2
73
3,2
15,8
82,3
37
3,4
70,4
42,6
75
3,8
06,6
61,1
31
Tot
al L
iabi
litie
s 2
,056
,307
,000
3
,490
,933
,000
4
,367
,002
,000
5
,450
,623
,627
5
,725
,718
,460
5
,987
,059
,176
6
,409
,124
,730
So
urce
: C
ompa
ny R
epor
ts a
nd G
loba
l Res
earc
h
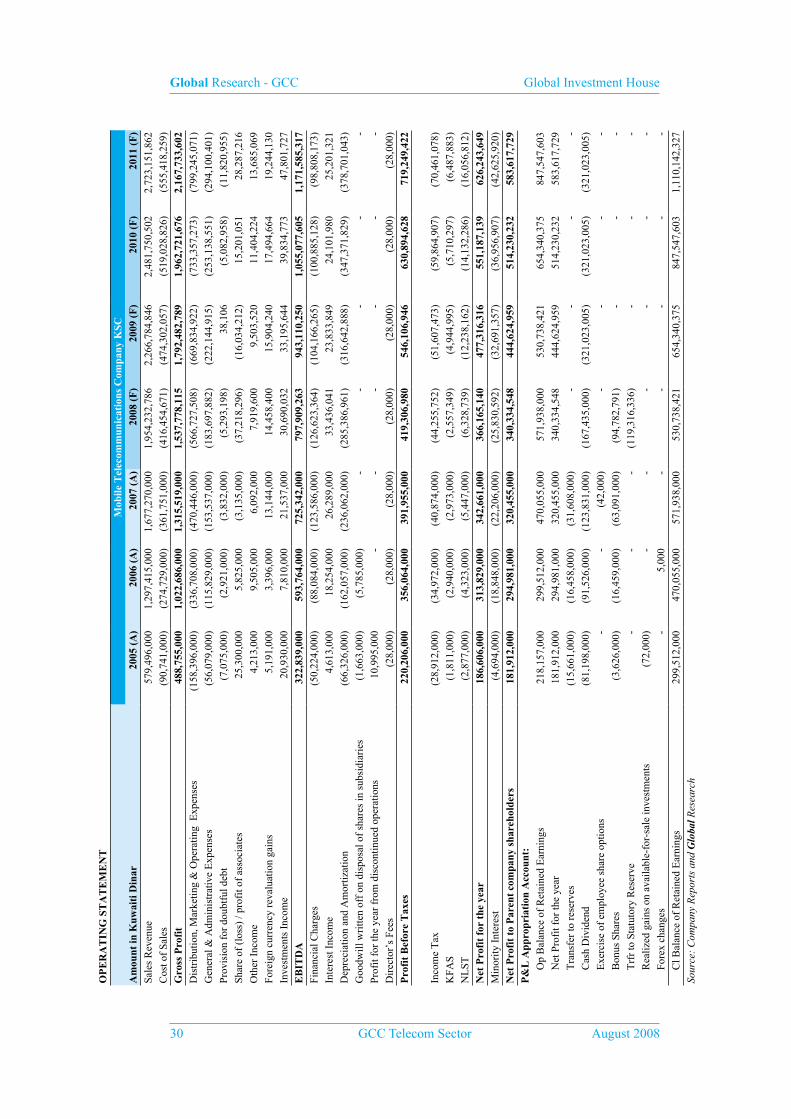
Global Research - GCC Global Investment House
30 GCC Telecom Sector August 2008
OP
ER
AT
ING
ST
AT
EM
EN
TM
obile
Tel
ecom
mun
icat
ions
Com
pany
KSC
Am
ount
in K
uwai
ti D
inar
2005
(A
)20
06 (
A)
2007
(A
)20
08 (
F)
2009
(F
)20
10 (
F)
2011
(F
)
Sale
s R
even
ue 5
79,4
96,0
00
1,2
97,4
15,0
00
1,6
77,2
70,0
00
1,9
54,2
32,7
86
2,2
66,7
84,8
46
2,4
81,7
50,5
02
2,7
23,1
51,8
62
Cos
t of
Sale
s (
90,7
41,0
00)
(27
4,72
9,00
0) (
361,
751,
000)
(41
6,45
4,67
1) (
474,
302,
057)
(51
9,02
8,82
6) (
555,
418,
259)
Gro
ss P
rofi
t 4
88,7
55,0
00
1,0
22,6
86,0
00
1,3
15,5
19,0
00
1,5
37,7
78,1
15
1,7
92,4
82,7
89
1,9
62,7
21,6
76
2,1
67,7
33,6
02
Dis
trib
utio
n, M
arke
ting
& O
pera
ting
Exp
ense
s (
158,
396,
000)
(33
6,70
8,00
0) (
470,
446,
000)
(56
6,72
7,50
8) (
669,
834,
922)
(73
3,35
7,27
3) (
799,
245,
071)
Gen
eral
& A
dmin
istr
ativ
e E
xpen
ses
(56
,079
,000
) (
115,
829,
000)
(15
3,53
7,00
0) (
183,
697,
882)
(22
2,14
4,91
5) (
253,
138,
551)
(29
4,10
0,40
1)
Prov
isio
n fo
r do
ubtf
ul d
ebt
(7,
075,
000)
(2,
921,
000)
(3,
832,
000)
(5,
293,
198)
38,
106
(5,
082,
958)
(11
,820
,955
)
Shar
e of
(lo
ss)
/ pro
fit o
f as
soci
ates
2
5,30
0,00
0 5
,825
,000
(
3,13
5,00
0) (
37,2
18,2
96)
(16
,034
,212
) 1
5,20
1,05
1 2
8,28
7,21
6
Oth
er I
ncom
e 4
,213
,000
9
,505
,000
6
,092
,000
7
,919
,600
9
,503
,520
1
1,40
4,22
4 1
3,68
5,06
9
Fore
ign
curr
ency
rev
alua
tion
gain
s 5
,191
,000
3
,396
,000
1
3,14
4,00
0 1
4,45
8,40
0 1
5,90
4,24
0 1
7,49
4,66
4 1
9,24
4,13
0
Inve
stm
ents
Inc
ome
20,
930,
000
7,8
10,0
00
21,
537,
000
30,
690,
032
33,
195,
644
39,
834,
773
47,
801,
727
EB
ITD
A 3
22,8
39,0
00
593
,764
,000
7
25,3
42,0
00
797
,909
,263
9
43,1
10,2
50
1,0
55,0
77,6
05
1,1
71,5
85,3
17
Fina
ncia
l Cha
rges
(50
,224
,000
) (
88,0
84,0
00)
(12
3,58
6,00
0) (
126,
623,
364)
(10
4,16
6,26
5) (
100,
885,
128)
(98
,808
,173
)
Inte
rest
Inc
ome
4,6
13,0
00
18,
254,
000
26,
289,
000
33,
436,
041
23,
833,
849
24,
101,
980
25,
201,
321
Dep
reci
atio
n an
d A
mor
tizat
ion
(66
,326
,000
) (
162,
057,
000)
(23
6,06
2,00
0) (
285,
386,
961)
(31
6,64
2,88
8) (
347,
371,
829)
(37
8,70
1,04
3)
Goo
dwill
wri
tten
off
on d
ispo
sal o
f sh
ares
in s
ubsi
diar
ies
(1,
663,
000)
(5,
785,
000)
-
-
-
-
-
Prof
it fo
r th
e ye
ar f
rom
dis
cont
inue
d op
erat
ions
10,
995,
000
-
-
-
-
-
-
Dir
ecto
r’s
Fees
(28
,000
) (
28,0
00)
(28
,000
) (
28,0
00)
(28
,000
) (
28,0
00)
(28
,000
)P
rofi
t B
efor
e T
axes
220
,206
,000
3
56,0
64,0
00
391
,955
,000
4
19,3
06,9
80
546
,106
,946
6
30,8
94,6
28
719
,249
,422
Inco
me
Tax
(28
,912
,000
) (
34,9
72,0
00)
(40
,874
,000
) (
44,2
55,7
52)
(51
,607
,473
) (
59,8
64,9
07)
(70
,461
,078
)
KFA
S (
1,81
1,00
0) (
2,94
0,00
0) (
2,97
3,00
0) (
2,55
7,34
9) (
4,94
4,99
5) (
5,71
0,29
7) (
6,48
7,88
3)
NL
ST (
2,87
7,00
0) (
4,32
3,00
0) (
5,44
7,00
0) (
6,32
8,73
9) (
12,2
38,1
62)
(14
,132
,286
) (
16,0
56,8
12)
Net
Pro
fit
for
the
year
186
,606
,000
3
13,8
29,0
00
342
,661
,000
3
66,1
65,1
40
477
,316
,316
5
51,1
87,1
39
626
,243
,649
Min
ority
Int
eres
t (
4,69
4,00
0) (
18,8
48,0
00)
(22
,206
,000
) (
25,8
30,5
92)
(32
,691
,357
) (
36,9
56,9
07)
(42
,625
,920
)N
et P
rofi
t to
Par
ent
com
pany
sha
reho
lder
s 1
81,9
12,0
00
294
,981
,000
3
20,4
55,0
00
340
,334
,548
4
44,6
24,9
59
514
,230
,232
5
83,6
17,7
29
P&
L A
ppro
pria
tion
Acc
ount
:
O
p B
alan
ce o
f R
etai
ned
Ear
ning
s 2
18,1
57,0
00
299
,512
,000
4
70,0
55,0
00
571
,938
,000
5
30,7
38,4
21
654
,340
,375
8
47,5
47,6
03
N
et P
rofi
t for
the
year
181
,912
,000
2
94,9
81,0
00
320
,455
,000
3
40,3
34,5
48
444
,624
,959
5
14,2
30,2
32
583
,617
,729
T
rans
fer
to r
eser
ves
(15
,661
,000
) (
16,4
58,0
00)
(31
,608
,000
) -
-
-
-
C
ash
Div
iden
d (
81,1
98,0
00)
(91
,526
,000
) (
123,
831,
000)
(16
7,43
5,00
0) (
321,
023,
005)
(32
1,02
3,00
5) (
321,
023,
005)
E
xerc
ise
of e
mpl
oyee
sha
re o
ptio
ns
-
-
(42
,000
) -
-
-
-
B
onus
Sha
res
(3,
626,
000)
(16
,459
,000
) (
63,0
91,0
00)
(94
,782
,791
) -
-
-
T
rfr
to S
tatu
tory
Res
erve
-
-
-
(11
9,31
6,33
6) -
-
-
R
ealiz
ed g
ains
on
avai
labl
e-fo
r-sa
le in
vest
men
ts (
72,0
00)
-
-
-
-
-
-
F
orex
cha
nges
-
5,0
00
-
-
-
-
-
C
l Bal
ance
of
Ret
aine
d E
arni
ngs
299
,512
,000
4
70,0
55,0
00
571
,938
,000
5
30,7
38,4
21
654
,340
,375
8
47,5
47,6
03
1,1
10,1
42,3
27
Sour
ce:
Com
pany
Rep
orts
and
Glo
bal R
esea
rch

Global Research - GCC Global Investment House
August 2008 GCC Telecom Sector 31
CA
SH F
LO
W S
TA
TE
ME
NT
Mob
ile T
elec
omm
unic
atio
ns C
ompa
ny K
SCA
mou
nt in
Kuw
aiti
Din
ar20
05 (
A)
2006
(A
)20
07 (
A)
2008
(F
)20
09 (
F)
2010
(F
)20
11 (
F)
Ope
ratin
gO
pera
ting
Act
iviti
es 2
62,1
18,0
00
570
,236
,000
6
85,5
18,0
00
734
,299
,671
8
38,4
29,2
86
955
,382
,235
1
,059
,541
,197
Net
Pro
fit b
efor
e ta
x 2
19,7
94,0
00
348
,801
,000
3
83,5
35,0
00
340
,334
,548
4
44,6
24,9
59
514
,230
,232
5
83,6
17,7
29
D
epre
ciat
ion
& A
mor
tisat
ion
63,
673,
000
167
,842
,000
2
36,0
62,0
00
285
,386
,961
3
16,6
42,8
88
347
,371
,829
3
78,7
01,0
43
In
tere
st in
com
e (
4,61
3,00
0) (
18,2
54,0
00)
(26
,289
,000
) -
-
-
-
Prop
erty
and
equ
ipm
ent d
ispo
sed
(4,
000)
1,0
62,0
00
170
,000
-
-
-
-
Prof
it on
sal
e of
sub
sidi
ary
(10
,995
,000
) (
268,
000)
-
--
--
Pr
ovis
ion
for
rece
ivab
les
-
5,2
93,1
98
(38
,106
) 5
,082
,958
1
1,82
0,95
5
Prov
isio
n fo
r co
ntin
genc
ies
(4,
541,
000)
-
--
--
-
Def
erre
d C
osts
-
(23
,338
,400
) (
26,9
66,7
20)
(12
,187
,912
) (
13,4
06,7
03)
Fi
nanc
ing
Exp
ense
s 5
0,22
4,00
0 8
8,08
4,00
0 1
23,5
86,0
00
126
,623
,364
1
04,1
66,2
65
100
,885
,128
9
8,80
8,17
3
Inco
me
from
inve
stm
ents
(
20,9
30,0
00)
(7,
810,
000)
(21
,537
,000
) -
-
-
-
Shar
e of
pro
fit o
f an
ass
ocia
te (
25,3
00,0
00)
(5,
825,
000)
3,1
35,0
00
-
-
-
-
G
ain/
loss
fro
m c
urre
ncy
reva
luat
ion
(5,
190,
000)
(3,
396,
000)
(13
,144
,000
) -
-
-
-
Wor
king
Cap
ital
21,
363,
000
231
,602
,000
(
13,2
36,0
00)
(14
0,21
8,53
4) 1
59,9
87,7
54
37,
747,
257
52,
975,
404
( I
ncre
ase)
/ Dec
reas
e in
inve
stm
ents
hel
d fo
r tr
adin
g -
-
-
(
10,5
85,8
52)
8,3
96,9
63
(5,
038,
178)
(6,
045,
813)
D
ec/(
inc.
) in
trad
e an
d ot
her
rece
ivab
les
10,
613,
000
184
,466
,000
(
67,0
24,0
00)
(10
0,32
1,62
7) (
35,3
73,0
21)
(46
,606
,949
) (
100,
069,
308)
D
ec /
(inc
) in
Inv
ento
ries
(19
7,00
0) (
5,14
5,00
0) (
7,83
5,00
0) (
8,39
7,77
8) (
9,14
8,37
2) (
10,0
62,4
62)
(11
,159
,482
)
Inc/
(dec
) in
trad
e &
oth
er p
ayab
les
25,
563,
000
85,
896,
000
90,
547,
000
(20
,913
,277
) 1
96,1
12,1
84
99,
454,
845
170
,250
,007
Inc/
(dec
) in
oth
er n
on-c
urre
nt li
abili
ties
(11
3,00
0) 2
,287
,000
1
2,31
9,00
0 -
-
-
-
Inco
me
Tax
pai
d (
10,8
33,0
00)
(31
,146
,000
) (
36,8
95,0
00)
-
-
-
-
B
oD r
emun
erat
ion
paid
(28
,000
) (
28,0
00)
(28
,000
) -
-
-
-
KFA
S pa
id (
1,23
9,00
0) (
1,85
1,00
0) -
-
-
-
-
NL
ST p
aid
(2,
403,
000)
(2,
877,
000)
(4,
320,
000)
-
-
-
-
Pr
ocee
ds f
rom
UN
CC
Tot
al O
pera
ting
283
,481
,000
8
01,8
38,0
00
672
,282
,000
5
94,0
81,1
38
998
,417
,040
9
93,1
29,4
91
1,1
12,5
16,6
01
Inve
stin
g
C
apex
(
130,
186,
000)
(44
1,76
4,00
0) (
586,
700,
000)
(73
2,80
5,07
3) (
626,
119,
193)
(51
1,54
3,39
0) (
504,
428,
388)
Inc
reas
e in
inta
ngib
le a
sset
s (
13,6
16,0
00)
(37
,292
,000
) (
166,
645,
000)
(37
,779
,667
) 4
9,00
4,76
3 4
8,79
2,66
1 4
2,88
6,53
1
I
nter
est r
ecei
ved
4,0
62,0
00
15,
879,
000
26,
269,
000
-
-
-
-
Acq
. of
Inve
stm
ent s
ecur
ities
(20
,138
,000
) (
7,68
6,00
0) (
4,67
7,00
0) -
-
-
-
Pro
ceed
s fr
om s
ale
of s
ubsi
diar
ies
15,
813,
000
268
,000
-
-
-
-
-
P
rofi
t on
sale
of
inve
stm
ents
ava
ilabl
e fo
r sa
le 6
0,87
5,00
0 4
,144
,000
1
,275
,000
-
--
-
P
roce
eds
from
dis
posa
l of
prop
erty
and
equ
ipm
ent
Inv
estm
ent i
n as
soci
ate
-
(45
0,00
0) (
269,
306,
000)
(77
,892
,000
) (
84,3
83,0
00)
(10
5,47
8,75
0) (
131,
848,
438)
Acq
uisi
tion
of s
ubsi
diar
ies
(83
9,97
2,00
0) (
529,
441,
000)
(60
,920
,000
)
D
ivid
end
rece
ived
4,6
44,0
00
5,0
33,0
00
Tot
al I
nves
ting
(92
3,16
2,00
0) (
991,
698,
000)
(1,
055,
671,
000)
(84
8,47
6,74
0) (
661,
497,
431)
(56
8,22
9,47
9) (
593,
390,
294)
Fina
ncin
g
I
ncre
ase/
(dec
reas
e) in
sha
reho
lder
s’ c
apita
l -
-
-
143
,849
,881
-
-
-
S
hare
Pre
miu
m-
- 1
,066
,306
,403
I
ncre
ase/
(dec
reas
e) in
long
term
deb
t-
-
-
(47
4,38
2,64
6) (
18,0
89,5
31)
(12
7,36
2,20
1) (
63,5
90,0
69)
Loa
n to
an
asso
ciat
e-
(17
0,87
5,00
0) (
72,0
01,0
00)
-
-
-
Pro
ceed
s fr
om s
ale
of s
hare
cap
ital
667
,218
,000
8
3,00
0 -
--
-
M
inor
ity s
hare
s in
Bah
rain
i sub
3,0
95,0
00
-
1,5
27,0
00
-
-
-
-
Due
to m
inor
ity in
tere
st h
olde
rs -
-
-
-
-
-
Fin
anci
ng e
xpen
ses
(37
,552
,000
) (
92,1
36,0
00)
(12
3,43
6,00
0) (
126,
623,
364)
(10
4,16
6,26
5) (
100,
885,
128)
(98
,808
,173
)
I
ncre
ase
in d
ues
to b
anks
228
,602
,000
5
45,4
51,0
00
603
,421
,000
7
9,65
2,24
5 (
128,
457,
409)
(11
,094
,409
) (
30,7
09,4
38)
Inc
reas
e in
oth
er n
on-c
urre
nt li
abili
ties
- -
-
2
4,43
4,44
0 7
,883
,167
8
,825
,237
9
,896
,598
P
aym
ent o
f di
vide
nd (
83,4
47,0
00)
(90
,383
,000
) (
123,
588,
000)
(16
7,43
5,00
0) (
321,
023,
005)
(32
1,02
3,00
5) (
321,
023,
005)
Div
iden
ds p
aid
to m
inor
ity s
hare
hold
ers
- (
2,93
8,00
0) (
2,87
5,00
0)
M
inor
ity I
nter
est
- -
-
2
5,83
0,59
2 3
2,69
1,35
7 3
6,95
6,90
7 -
T
otal
Fin
anci
ng 7
77,9
16,0
00
359
,994
,000
1
84,2
57,0
00
499
,631
,552
(
531,
161,
686)
(51
4,58
2,59
8) (
504,
234,
087)
Eff
ect o
f Fo
reig
n C
urre
ncy
tran
slat
ion
(37
5,00
0) 1
1,30
9,00
0 (
13,9
27,0
00)
-
-
-
-
Net
Cha
nge
in C
ash
137
,860
,000
1
70,1
34,0
00
(21
3,05
9,00
0) 2
45,2
35,9
49
(19
4,24
2,07
6) (
89,6
82,5
86)
14,
892,
219
Net
Cas
h at
beg
inni
ng 1
51,4
72,0
00
292
,879
,000
4
74,3
22,0
00
261
,263
,000
5
06,4
98,9
49
312
,256
,873
2
22,5
74,2
87
Net
Cas
h at
end
292
,879
,000
4
74,3
22,0
00
261
,263
,000
5
06,4
98,9
49
312
,256
,873
2
22,5
74,2
87
237
,466
,506
So
urce
: C
ompa
ny R
epor
ts a
nd G
loba
l Res
earc
h

Global Research - GCC Global Investment House
32 GCC Telecom Sector August 2008
FA
CT
SH
EE
T
Mob
ile T
elec
omm
unic
atio
ns C
ompa
ny K
.S.C
.
2005
(A
)20
06 (
A)
2007
(A
)20
08 (
F)
2009
(F
)20
10 (
F)
2011
(F
)
LIQ
UID
ITY
RA
TIO
s
- C
urre
nt R
atio
0.6
4 0
.66
0.5
4 0
.84
0.6
5 0
.58
0.6
1
- Q
uick
Rat
io 0
.62
0.6
5 0
.52
0.8
1 0
.62
0.5
4 0
.56
- C
ash
Flow
fro
m O
pera
tions
rat
io 0
.46
0.7
7 0
.65
0.5
5 0
.87
0.8
0 0
.81
PR
OF
ITA
BIL
ITY
AN
AL
YSI
S
- G
ross
Pro
fit M
argi
n 84
.3%
78.8
%78
.4%
78.7
%79
.1%
79.1
%79
.6%
- E
BIT
DA
to R
even
ues
55.7
%45
.8%
43.2
%40
.8%
41.6
%42
.5%
43.0
%
- N
et P
rofi
t Mar
gin
31.4
%22
.7%
19.1
%17
.4%
19.6
%20
.7%
21.4
%
- R
etur
n on
ass
ets
13.4
%10
.6%
8.2%
6.9%
8.0%
8.8%
9.4%
- R
etur
n on
Equ
ity
23.1
%23
.2%
21.8
%14
.8%
14.2
%15
.4%
16.0
%
AC
TIV
ITY
RA
TIO
s
- I
nven
tory
Tur
nove
r R
atio
12.9
218
.57
16.4
113
.68
11.9
810
.45
9.13
- D
ebto
r tu
rnov
er R
atio
9.07
9.46
9.82
8.12
8.70
8.51
7.85
- C
redi
tors
Tur
nove
r R
atio
1.54
2.69
2.54
2.86
2.70
2.86
2.70
LE
VE
RA
GE
RA
TIO
s
- I
nter
est C
over
age
(tim
es)
6.4
6.74
5.87
6.30
9.05
10.4
611
.86
- D
ebt t
o eq
uity
rat
io0.
371.
021.
250.
520.
450.
380.
32
GR
OW
TH
RA
TE
S
- R
even
ue g
row
th r
ate
79.8
%12
3.9%
29.3
%16
.5%
16.0
%9.
5%9.
7%
- N
et in
com
e gr
owth
rat
e51
.3%
62.2
%8.
6%6.
2%30
.6%
15.7
%13
.5%
- E
quity
gro
wth
rat
e20
4.5%
14.2
%16
.8%
91.6
%6.
1%7.
9%9.
7%
- T
otal
ass
ets
grow
th r
ate
216.
5%69
.8%
25.1
%24
.8%
5.1%
4.6%
7.1%
RA
TIO
S U
SED
FO
R V
AL
UA
TIO
N
- E
PS (
fils
) 4
2.5
68.
9 7
4.9
79.
5 1
03.9
1
20.1
1
36.3
- B
ook
Val
ue P
er S
hare
(fi
ls)
277
.0
316
.4
369
.6
708
.1
751
.3
810
.8
889
.3
- M
arke
t Pri
ce in
fils
1,0
01
1,0
86
1,8
75
1,7
20
1,7
20
1,7
20
1,7
20
- M
arke
t Cap
italis
atio
n (K
D m
n) 4
,285
4
,648
8
,026
7
,362
7
,362
7
,362
7
,362
- E
nter
pris
e V
alue
(E
V
QR
000
) 4
,431
5
,556
9
,750
8
,446
8
,494
8
,445
8
,336
- E
V/E
BIT
DA
(x)
13.
7 9
.4
13.
4 1
0.6
9.0
8
.0
7.1
- P
/E 2
3.6
15.
8 2
5.0
21.
6 1
6.6
14.
3 1
2.6
- P
/BV
3.6
3
.4
5.1
2
.4
2.3
2
.1
1.9
Sour
ce:
Com
pany
Rep
orts
and
Glo
bal R
esea
rch
* M
arke
t pri
ce fo
r 20
08 a
nd s
ubse
quen
t yea
rs a
re a
s pe
r cl
osin
g pr
ices
on
Kuw
ait S
tock
Exc
hang
e on
Aug
. 31,
200
8

Global Research - GCC Global Investment House
August 2008 GCC Telecom Sector 33
National Mobile Telecommunications Co.(Wataniya Telecom)
TickersNMTC.KW (Reuters)NMTC KK (Bloomberg)
Listing:Kuwait Stock Exchange
Current Price: KD1.86 (August 31, 2008)
Key Data
EPS* (fils) 193.2 Avg. daily vol. (‘000) 278.1
BVPS* (fils) 673.9 52 week High / Low (KD) 2.782/1.86
P/E (x) 9.6 Market Cap (KD mn) 937.5
P/BV (x) 2.8 Target Price (KD) 2.578
Source: Global Research
* Projected (2008)
Background• National Mobile Telecommunications Company (Wataniya) is a Kuwaiti Shareholding
Company incorporated in October 1997. Wataniya Telecom was commercially launched in 1999 as the first privately owned operator in Kuwait.
• Wataniya Telecom has grown rapidly through acquisitions in the MENA region and Asia. Apart from Kuwait, the company has operations in Maldives (100% stake), Saudi Arabia (55.61% stake), Tunisia (50% stake), Algeria (71% stake) and in 2007 it got a license to launch second mobile services in Palestine (57% stake).
• In March 2007, Qatar Telecom (Qtel) acquired 51% of Wataniya Telecom shares from Kuwait Projects Company Holding KSC (KIPCO) group for a total cash consideration of US$3.8bn.
Analysis of Country Operations
KuwaitIn 2007, Kuwait witnessed a y-o-y growth of 9.6% in total GSM subscriber base to reach 2.77mn customers, which indicates penetration rate of 82% on total population and 106% on addressable population. Zain leads the GSM segment in Kuwait with a market share of 57% whereas Wataniya accounts for the rest of the market share i.e. 43% as there are only two GSM operators in the country.
In GSM segment, the total customer addition in 2007 was 244,009. In 2007, Wataniya gained a larger slice of total market additions with a customer addition of 129,009 which helped it
BUYRecommendation

Global Research - GCC Global Investment House
34 GCC Telecom Sector August 2008
to increase its market share from 42% in 2006 to 43% in 2007. Zain increased its customer strength by 115,000 customers in 2007.
In Kuwait, out of the total subscriber base of 2.77mn as of Dec. 2007, 2.17mn customers (78.3%) were prepaid customers while 602,506 (21.7%) customers were postpaid. Zain accounted for 72.5% of the total postpaid customers and 52.5% of total prepaid subscribers while Wataniya accounted for 27.5% of total postpaid customers and 47.5% of total prepaid customers.
Chart 1: Market Segmentation
80%
60%
40%
20%
0%
73%
52%
MTC NMTC
27%
48%
Post-paid Pre-paid
Source: Company Reports and Global Research
Saudi Telecom Company (STC), the third operator is likely to start its operation in 2008. In 2007, the government of Kuwait issued a third mobile license to STC for US$907.6mn.
In 2007, Wataniya’s total customer base for its Kuwait operations increased by 12.1% to 1.2mn. Out of the total subscriber base, 13.8% were postpaid customers while 86.2% were prepaid customers. For FY2007, Kuwait operations reported revenues of KD212.2mn, contributing 18.9% to total revenues of Wataniya for the year. EBITDA was at KD107.9mn representing an EBITDA margin of 50.8%. Its net profit from Kuwait operations increased by 35.5% to reach KD87.7mn. In 2007, Average ARPU improved by 4.2% to US$14.8.
During 1H-2008, Wataniya increased its customer base to 1.28mn, a y-t-d increase of 79,263 customers. It reported revenues of KD112.2mn and EBITDA of KD58.9mn, representing an EBITDA margin of 52.5% for Kuwait operations. Net profit from Kuwait operations declined by 17% to KD40.9mn from KD49.3mn reported in 1H-2007.
IraqAfter December 31 2006, the regulatory authorities did not renew Asia-Cell’s GSM license. As a result the majority shareholders of Asia-Cell (a company incorporated in Cayman Islands) has filed for voluntary liquidation of Asia-Cell in the Grand Court of the Cayman Islands. Further to the appointment of liquidator and submission of arguments of the case, it was agreed to enter into an Asset Sale Agreement to dispose the net assets of Asia-Cell to Asia Cell LLC, a newly formed company. The sale has been completed and the liquidator has offered Wataniya US$107mn for its share of the total assets of Asia Cell amounting to US$225mn. The board of directors of Wataniya have decided to accept the offered price of US$107mn consisting of US$90mn, that will be distributed as dividend to Wataniya and the remaining US$17mn represents the settlement of a debt due to Wataniya by Asia-Cell.

Global Research - GCC Global Investment House
August 2008 GCC Telecom Sector 35
AlgeriaWataniya’s Algeria operations under Nedjma brand name increased its total customer base by 51.7% to 4.54mn in 2007 as compared to 2.99mn at the end of 2006. Out of the total subscriber base, 2.7% were postpaid customers while 97.3% were prepaid customers. Revenues for FY2007 were KD101.7mn, registered a growth of 37.7%, compared to KD73.9mn reported for FY2006. EBITDA was at KD23.2mn representing an EBITDA margin of 22.8%. It reported a net loss of KD13.6mn for FY2007 which reduced from KD16.8mn reported in FY2006. Out of the total loss of KD16.8mn, the net attributable loss to Wataniya Telecom for FY2007 was KD9.6mn, representing its 71% ownership in Nedjma. In 2007, Average ARPU declined by 10.7% to KD2.5.
In 1H-2008, Nedjma’s customer base increased to 5.0mn subscribers, a y-t-d increase of 10%. Nedjma reported revenues of KD61.2mn and a net attributable loss of KD0.1mn for 1H-2008, which declined from KD4.7mn reported in 1H-2007.
TunisiaWataniya operates under the brand name Tunisiana in Tunisia. It closed the year with 3.652mn customers, registered a growth of 19%. Out of the total subscriber base, 1.4% were postpaid customers while 98.6% were prepaid customers. For FY2007, Tunisiana reported revenues of KD80.6mn, contributing 19.8% to total revenues of Wataniya for the year. EBITDA was at KD40.2mn representing an EBITDA margin of 49.8%. In FY2007, Tunisiana witnessed a growth of 20.2% in revenues and 21.1% in EBITDA. Its net profit from Tunisia operations increased by 47.1% to KD12.9mn. Wataniya accounts for Tunisiana on the basis of 50% proportionate consolidation method. In 2007, Average ARPU declined by 4.4% to KD3.8.
In 1H-2008, Tunisiana’s customer base increased to 3.9mn subscribers, a y-t-d increase of 6.6%. Tunisiana reported revenues of KD48mn and EBITDA of KD25.4mn, representing an EBITDA margin of 52.9%. The net profit attributable loss to Wataniya was KD9.6mn, which increased from KD5.7mn reported in 1H-2007.
Saudi ArabiaWataniya operates iDEN network under the brand name Bravo in Saudi Arabia. In 2007, Bravo subscribers grew 34.7% over 2006 to reach 91,841. It reported a net loss of KD6.3mn on total revenue of KD8.5mn for FY2007. In 2007, Wataniya increased its stake in Bravo from 47% to 55.6%. In 2007 Average ARPU declined by 22.6% to KD8.
At the end of 1H-2008, Bravo has achieved an active customer base of 129,924 subscribers. Revenues were KD6.1mn and the net attributable loss to Wataniya was KD3.8mn, which increased by 35% on y-o-y basis.
MaldivesWataniya Telecom Maldives’ (100% owned by Wataniya) ended the year 2007 with a customer base of 64,730, adding 9,368 customers in a year. Out of the total subscriber base, 3.8% were postpaid customers while 96.2% were prepaid customers. For FY2007, Maldives operations reported revenues of KD4.6mn which increased from KD4.1mn in FY2006. Its EBITDA remained negative, however, it declined to KD0.2mn in FY2007 from KD0.5mn in FY2006. It reported a higher net loss of KD4.1mn in FY2007 from KD3.5mn in FY2006.
A the end of 1H-2008, total customers increased to 81,946. For 1H-2008 it reported revenues of KD2.3mn and net loss of KD1.9mn which declined by 12.4% on y-o-y basis.

Global Research - GCC Global Investment House
36 GCC Telecom Sector August 2008
PalestineWataniya Palestine Mobile Telecommunications Company (WPT), the company formed by Wataniya International and the Palestine Investment Fund (PIF), will launch Palestine’s second mobile services. It has already signed a license agreement with the Ministry of Telecommunications and Information Technology in Palestine (MTIT). Wataniya group offered JD251mn (KD101mn) for the license to build and operate mobile telecommunication services in Palestine.
Under the license conditions imposed by the Palestinian Ministry of Telecommunications and Information Technology, Wataniya Telecom International (WTI – a holding company for WPT and 100% owned by Wataniya Telecom) is required to keep at all times 40% of the shareholding in WPT, 30% shall be held by the Palestinian Investment Fund (PIF) and 30% shall be held by the Public. During 2007, the Parent Company increased its shareholding in WPT from 40% to 57% by subscribing to additional capital for KD0.8mn. Since the public offering did not take place yet, which is envisaged to take place within six months from the allocation of frequency, WTI will in the meantime own 57% of the shares and the PIF shall own 43%. Once the public offering take place the percentage of WTI’s ownership shall be diluted to 40%.
On July 29 2008, the Palestinian ministry of telecommunications and information technology announced that an agreement had been reached with Israel to allocate radio frequency spectrums to the Palestinian National Authority. Therefore, Wataniya Palestine is expected to be given its operating band within the next few months, ending a long delay after having been granted a license in late 2006.
For Palestine operation, Wataniya group has accounted a loss of KD1.2mn for 1H-2008 which was at KD0.6mn during corresponding period of the previous year.
Financial Performance In FY2007, Wataniya group reported total revenues of KD407.6mn, EBITDA of KD161.2mn and net profit of KD71.6mn (from continuing operations) as compared to our projected total revenues of KD388.2mn, EBITDA of KD164.8mn and net profit of KD69.9mn. Wataniya’s actual performance as compared to our projections for FY2007 showed variations (actual v/s projection) of 4.9% in total revenues, -2.2% in EBITDA, -2.3% in net profit (from continuing operations) and -0.9% in total assets.
Group level PerformanceIn FY2007, total active customers of Wataniya group increased to 9.54mn versus 7.25mn during FY2006, an increase of 31.6%. Algeria, Tunisia, Kuwait, Saudi Arabia and Maldives operations constituted 47.5%, 38.3%, 12.6%, 0.9% and 0.7% respectively of the total customer base at the end of 2007.
Revenues for the 12-months grew to KD407.6mn, an increase of 26% compared to revenues of KD323.5mn reported for FY2006. EBITDA grew to KD161.2mn, an increase of 25.2%, resulting in an EBITDA margin of 39.5%. Net profit attributable to shareholders of the parent company for FY2007 increased by 51.5% to KD80.7mn as compared to KD53.3mn reported for FY2006. In FY2007, the company’s net profit margin increased to 19.8% from 16.5% in FY2006.

Global Research - GCC Global Investment House
August 2008 GCC Telecom Sector 37
In FY2007, the size of consolidated balance sheet of Wataniya grew by 5.4% to KD754.8mn. Its gross fixed assets increased by 4% to KD499.5mn. The non-current portion of long term debt at group level declined to KD158.5mn from KD184.7mn which was attributable to its operations in Algeria, Tunisia and Maldives.
At the end of June 2008, Wataniya’s group customer base increased to 10.37mn, registering a YoY growth of 39.3%. During 1H-2008, Wataniya’s group revenue increased by 19.7% on y-o-y basis to reach KD230mn. Its EBITDA margin increased to 42.2% from 40.3% in 1H-2007. On the back of increase in margins, its EBITDA grew by 25.5% to KD97mn. The company reported a decline of 2.7% in consolidated net profit of KD42.6mn for the first half of 2008 compared to KD43.8mn reported for corresponding period of the previous year.
Future Trend in Consolidated Revenues & ProfitabilityGoing forward we forecast a 4 year (2007-2011) CAGR of 8.4% in consolidated revenues, 6.5% in EBIDTA and 5.4% in net profit for the period 2007-2011. The contribution of Kuwait operation to the group revenue was 52% in 2007, which we expect to decline to 49% in 2008, 45% in 2009, 41% in 2010 and 37% in 2011, due to increasing revenue contribution from other operations.
Chart 4: Trend in Consolidated Revenues & Net Profit
-
100
200
300
400
500
600
700
2008 (F) 2009 (F) 2010 (F) 2011 (F)
(in
KD
Mn)
Revenues EBITDA Net Profit
Source: Global Research
Kuwait 14.7%
Tunisia 42.3%
Algeria 41.2%
Saudi Arabia 0.9%Maldives 0.8%
Kuwait 12.6%
Tunisia 38.3%
Algeria 47.5%
Saudi Arabia 0.9% Maldives 0.7%
Chart 3: Country-wise Customer Segmentation – 2007
Chart 2: Country-wise CustomerSegmentation – 2006
Source: Company Reports
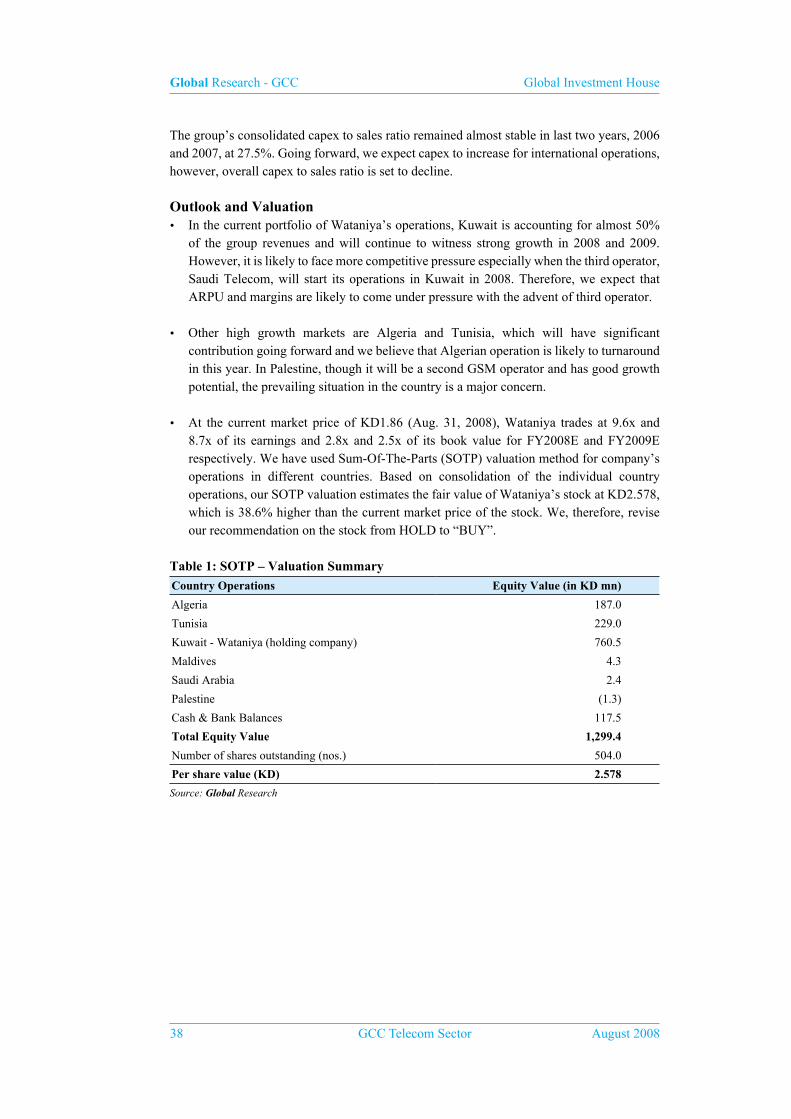
Global Research - GCC Global Investment House
38 GCC Telecom Sector August 2008
The group’s consolidated capex to sales ratio remained almost stable in last two years, 2006 and 2007, at 27.5%. Going forward, we expect capex to increase for international operations, however, overall capex to sales ratio is set to decline.
Outlook and Valuation • In the current portfolio of Wataniya’s operations, Kuwait is accounting for almost 50%
of the group revenues and will continue to witness strong growth in 2008 and 2009. However, it is likely to face more competitive pressure especially when the third operator, Saudi Telecom, will start its operations in Kuwait in 2008. Therefore, we expect that ARPU and margins are likely to come under pressure with the advent of third operator.
• Other high growth markets are Algeria and Tunisia, which will have significant contribution going forward and we believe that Algerian operation is likely to turnaround in this year. In Palestine, though it will be a second GSM operator and has good growth potential, the prevailing situation in the country is a major concern.
• At the current market price of KD1.86 (Aug. 31, 2008), Wataniya trades at 9.6x and 8.7x of its earnings and 2.8x and 2.5x of its book value for FY2008E and FY2009E respectively. We have used Sum-Of-The-Parts (SOTP) valuation method for company’s operations in different countries. Based on consolidation of the individual country operations, our SOTP valuation estimates the fair value of Wataniya’s stock at KD2.578, which is 38.6% higher than the current market price of the stock. We, therefore, revise our recommendation on the stock from HOLD to “BUY”.
Table 1: SOTP – Valuation Summary
Country Operations Equity Value (in KD mn)
Algeria 187.0
Tunisia 229.0
Kuwait - Wataniya (holding company) 760.5
Maldives 4.3
Saudi Arabia 2.4
Palestine (1.3)
Cash & Bank Balances 117.5
Total Equity Value 1,299.4
Number of shares outstanding (nos.) 504.0
Per share value (KD) 2.578
Source: Global Research
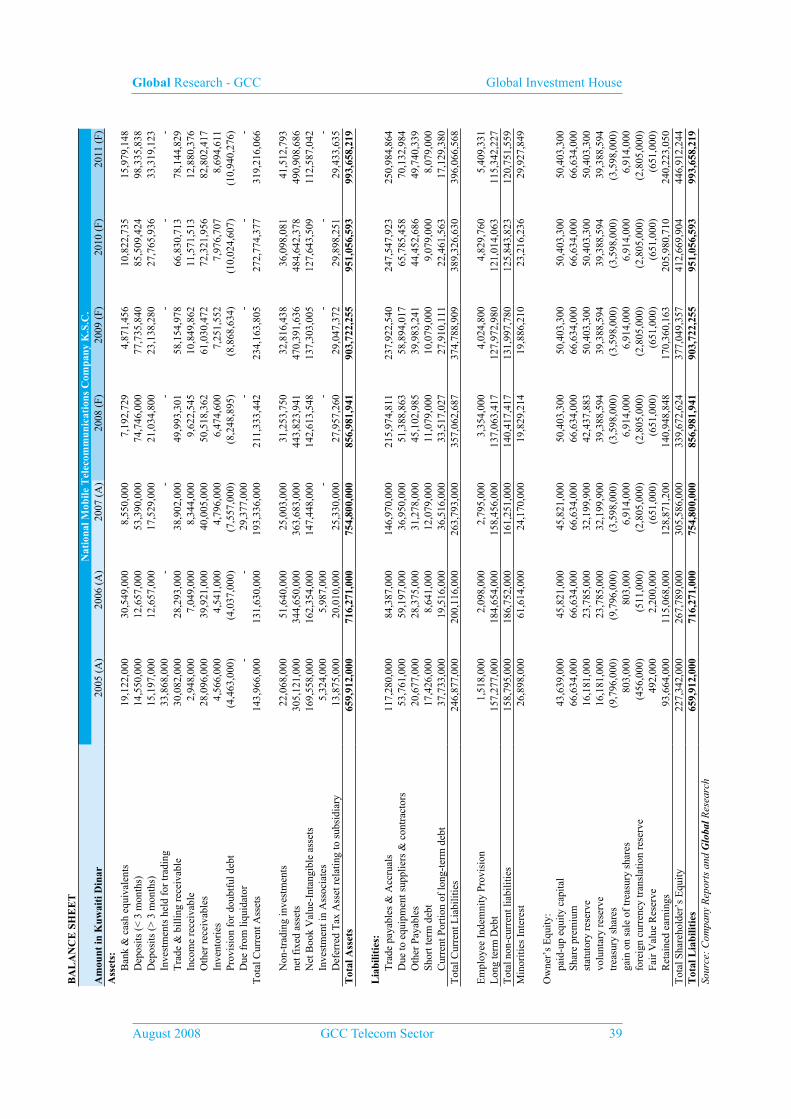
Global Research - GCC Global Investment House
August 2008 GCC Telecom Sector 39
BA
LA
NC
E S
HE
ET
Nat
iona
l Mob
ile T
elec
omm
unic
atio
ns C
ompa
ny K
.S.C
.A
mou
nt in
Kuw
aiti
Din
ar20
05 (
A)
2006
(A
)20
07 (
A)
2008
(F)
2009
(F)
2010
(F)
2011
(F)
Ass
ets:
B
ank
& c
ash
equi
vale
nts
19,
122,
000
30,
549,
000
8,5
50,0
00
7,1
92,7
29
4,8
71,4
56
10,
822,
735
15,
979,
148
D
epos
its (
< 3
mon
ths)
14,
550,
000
12,
657,
000
53,
390,
000
74,
746,
000
77,
735,
840
85,
509,
424
98,
335,
838
D
epos
its (
> 3
mon
ths)
15,
197,
000
12,
657,
000
17,
529,
000
21,
034,
800
23,
138,
280
27,
765,
936
33,
319,
123
I
nves
tmen
ts h
eld
for
trad
ing
33,
868,
000
-
-
--
--
T
rade
& b
illin
g re
ceiv
able
30,
082,
000
28,
293,
000
38,
902,
000
49,
993,
301
58,
154,
978
66,
830,
713
78,
144,
829
I
ncom
e re
ceiv
able
2,9
48,0
00
7,0
49,0
00
8,3
44,0
00
9,6
22,5
45
10,
849,
862
11,
571,
513
12,
880,
376
O
ther
rec
eiva
bles
28,
096,
000
39,
921,
000
40,
005,
000
50,
518,
362
61,
030,
472
72,
321,
956
82,
802,
417
I
nven
tori
es 4
,566
,000
4
,541
,000
4
,796
,000
6
,474
,600
7
,251
,552
7
,976
,707
8
,694
,611
Pro
visi
on f
or d
oubt
ful d
ebt
(4,
463,
000)
(4,
037,
000)
(7,
557,
000)
(8,
248,
895)
(8,
868,
634)
(10
,024
,607
) (
10,9
40,2
76)
D
ue f
rom
liqu
idat
or -
-
2
9,37
7,00
0 -
-
-
-
T
otal
Cur
rent
Ass
ets
143
,966
,000
1
31,6
30,0
00
193
,336
,000
2
11,3
33,4
42
234
,163
,805
2
72,7
74,3
77
319
,216
,066
N
on-t
radi
ng in
vest
men
ts 2
2,06
8,00
0 5
1,64
0,00
0 2
5,00
3,00
0 3
1,25
3,75
0 3
2,81
6,43
8 3
6,09
8,08
1 4
1,51
2,79
3
net
fix
ed a
sset
s 3
05,1
21,0
00
344
,650
,000
3
63,6
83,0
00
443
,823
,941
4
70,3
91,6
36
484
,642
,378
4
90,9
08,6
86
N
et B
ook
Val
ue-I
ntan
gibl
e as
sets
169
,558
,000
1
62,3
54,0
00
147
,448
,000
1
42,6
13,5
48
137
,303
,005
1
27,6
43,5
09
112
,587
,042
Inv
estm
ent i
n A
ssoc
iate
s 5
,324
,000
5
,987
,000
-
-
-
--
D
efer
red
Tax
Ass
et r
elat
ing
to s
ubsi
diar
y 1
3,87
5,00
0 2
0,01
0,00
0 2
5,33
0,00
0 2
7,95
7,26
0 2
9,04
7,37
2 2
9,89
8,25
1 2
9,43
3,63
5 T
otal
Ass
ets
659
,912
,000
7
16,2
71,0
00
754
,800
,000
8
56,9
81,9
41
903
,722
,255
9
51,0
56,5
93
993
,658
,219
Lia
bilit
ies:
T
rade
pay
able
s &
Acc
rual
s 1
17,2
80,0
00
84,
387,
000
146
,970
,000
2
15,9
74,8
11
237
,922
,540
2
47,5
47,9
23
250
,984
,864
Due
to e
quip
men
t sup
plie
rs &
con
trac
tors
53,
761,
000
59,
197,
000
36,
950,
000
51,
388,
863
58,
894,
017
65,
785,
458
70,
132,
984
O
ther
Pay
able
s 2
0,67
7,00
0 2
8,37
5,00
0 3
1,27
8,00
0 4
5,10
2,98
5 3
9,98
3,24
1 4
4,45
2,68
6 4
9,74
0,33
9
Sho
rt te
rm d
ebt
17,
426,
000
8,6
41,0
00
12,
079,
000
11,
079,
000
10,
079,
000
9,0
79,0
00
8,0
79,0
00
C
urre
nt P
ortio
n of
long
-ter
m d
ebt
37,
733,
000
19,
516,
000
36,
516,
000
33,
517,
027
27,
910,
111
22,
461,
563
17,
129,
380
Tot
al C
urre
nt L
iabi
litie
s 2
46,8
77,0
00
200
,116
,000
2
63,7
93,0
00
357
,062
,687
3
74,7
88,9
09
389
,326
,630
3
96,0
66,5
68
Em
ploy
ee I
ndem
nity
Pro
visi
on 1
,518
,000
2
,098
,000
2
,795
,000
3
,354
,000
4
,024
,800
4
,829
,760
5
,409
,331
L
ong
term
Deb
t 1
57,2
77,0
00
184
,654
,000
1
58,4
56,0
00
137
,063
,417
1
27,9
72,9
80
121
,014
,063
1
15,3
42,2
27
Tot
al n
on-c
urre
nt li
abili
ties
158
,795
,000
1
86,7
52,0
00
161
,251
,000
1
40,4
17,4
17
131
,997
,780
1
25,8
43,8
23
120
,751
,559
M
inor
ities
Int
eres
t 2
6,89
8,00
0 6
1,61
4,00
0 2
4,17
0,00
0 1
9,82
9,21
4 1
9,88
6,21
0 2
3,21
6,23
6 2
9,92
7,84
9
Ow
ner’
s E
quity
:
pai
d-up
equ
ity c
apita
l 4
3,63
9,00
0 4
5,82
1,00
0 4
5,82
1,00
0 5
0,40
3,30
0 5
0,40
3,30
0 5
0,40
3,30
0 5
0,40
3,30
0
Sha
re p
rem
ium
6
6,63
4,00
0 6
6,63
4,00
0 6
6,63
4,00
0 6
6,63
4,00
0 6
6,63
4,00
0 6
6,63
4,00
0 6
6,63
4,00
0
sta
tuto
ry r
eser
ve 1
6,18
1,00
0 2
3,78
5,00
0 3
2,19
9,90
0 4
2,43
7,88
3 5
0,40
3,30
0 5
0,40
3,30
0 5
0,40
3,30
0
vol
unta
ry r
eser
ve 1
6,18
1,00
0 2
3,78
5,00
0 3
2,19
9,90
0 3
9,38
8,59
4 3
9,38
8,59
4 3
9,38
8,59
4 3
9,38
8,59
4
tre
asur
y sh
ares
(9,
796,
000)
(9,
796,
000)
(3,
598,
000)
(3,
598,
000)
(3,
598,
000)
(3,
598,
000)
(3,
598,
000)
g
ain
on s
ale
of tr
easu
ry s
hare
s 8
03,0
00
803
,000
6
,914
,000
6
,914
,000
6
,914
,000
6
,914
,000
6
,914
,000
for
eign
cur
renc
y tr
ansl
atio
n re
serv
e (
456,
000)
(51
1,00
0) (
2,80
5,00
0) (
2,80
5,00
0) (
2,80
5,00
0) (
2,80
5,00
0) (
2,80
5,00
0)
Fai
r V
alue
Res
erve
492
,000
2
,200
,000
(
651,
000)
(65
1,00
0) (
651,
000)
(65
1,00
0) (
651,
000)
R
etai
ned
earn
ings
93,
664,
000
115
,068
,000
1
28,8
71,2
00
140
,948
,848
1
70,3
60,1
63
205
,980
,710
2
40,2
23,0
50
Tot
al S
hare
hold
er’s
Equ
ity 2
27,3
42,0
00
267
,789
,000
3
05,5
86,0
00
339
,672
,624
3
77,0
49,3
57
412
,669
,904
4
46,9
12,2
44
Tot
al L
iabi
litie
s 6
59,9
12,0
00
716
,271
,000
7
54,8
00,0
00
856
,981
,941
9
03,7
22,2
55
951
,056
,593
9
93,6
58,2
19
Sour
ce:
Com
pany
Rep
orts
and
Glo
bal R
esea
rch

Global Research - GCC Global Investment House
40 GCC Telecom Sector August 2008
OP
ER
AT
ING
ST
AT
EM
EN
T
Nat
iona
l Mob
ile T
elec
omm
unic
atio
ns C
ompa
ny K
.S.C
.
Am
ount
in K
uwai
ti D
inar
2005
(A
)20
06 (
A)
2007
(A
)20
08 (
F)
2009
(F
)20
10 (
F)
2011
(F
)
176
,218
,000
1
68,5
61,0
00
205
,649
,000
1
97,2
62,1
76
219
,709
,700
2
37,2
16,0
14
251
,474
,006
Sale
s R
even
ue 3
06,4
95,0
00
323
,482
,000
4
07,5
69,0
00
481
,127
,259
5
42,4
93,0
87
578
,575
,644
6
13,3
51,2
34
Tot
al C
ost o
f Sa
les
(11
8,42
6,00
0) (
120,
277,
000)
(15
1,85
7,00
0) (
180,
411,
940)
(21
6,12
5,62
6) (
233,
961,
507)
(24
8,70
1,69
4)
Gro
ss P
rofi
t 1
88,0
69,0
00
203
,205
,000
2
55,7
12,0
00
300
,715
,319
3
26,3
67,4
61
344
,614
,137
3
64,6
49,5
40
EB
ITD
A 1
26,8
68,0
00
128
,675
,000
1
61,1
52,0
00
192
,015
,806
2
10,8
47,4
06
221
,411
,702
2
31,7
18,2
25
Fina
ncia
l Cha
rges
(9,
131,
000)
(15
,663
,000
) (
18,1
42,0
00)
(16
,480
,342
) (
13,7
22,4
75)
(12
,224
,100
) (
11,2
12,0
43)
Dep
reci
atio
n (
57,7
92,0
00)
(48
,284
,000
) (
53,7
92,0
00)
(62
,769
,851
) (
67,2
46,7
29)
(71
,892
,265
) (
76,3
57,2
02)
Am
ortis
atio
n (
15,1
15,0
00)
(13
,445
,000
) (
14,2
54,0
00)
(14
,726
,573
) (
15,4
38,5
54)
(15
,721
,470
) (
15,4
74,9
81)
Prof
it B
efor
e M
inor
ity I
nter
ests
, KFA
S &
Tax
es 4
4,83
0,00
0 5
1,28
3,00
0 7
4,96
4,00
0 9
8,03
9,03
9 1
14,4
39,6
47
121
,573
,867
1
28,6
73,9
99
Min
ority
Int
eres
t 9
,910
,000
(
24,9
24,0
00)
9,1
85,0
00
4,3
40,7
86
(56
,996
) (
3,33
0,02
7) (
6,71
1,61
3)
Prof
it B
efor
e K
FAS
54,
740,
000
26,
359,
000
84,
149,
000
102
,379
,826
1
14,3
82,6
51
118
,243
,840
1
21,9
62,3
86
KFA
S (
493,
000)
(68
4,00
0) (
841,
000)
(1,
023,
798)
(1,
143,
827)
(1,
182,
438)
(1,
219,
624)
NL
ST (
1,21
4,00
0) (
1,88
6,00
0) (
2,10
7,00
0) (
2,53
3,90
1) (
2,83
0,97
1) (
2,92
6,53
5) (
3,01
8,56
9)
Zak
at -
-
(
52,0
00)
(93
1,77
2) (
1,46
9,49
9) (
2,12
0,65
7) (
2,78
3,06
1)
Dir
ecto
r’s
Fees
(20
0,00
0) (
300,
000)
(40
0,00
0) (
500,
000)
(60
0,00
0) (
700,
000)
(80
0,00
0)
Net
Pro
fit f
or th
e ye
ar 5
2,83
3,00
0 2
3,48
9,00
0 8
0,74
9,00
0 9
7,39
0,35
5 1
08,3
38,3
55
111
,314
,210
1
14,1
41,1
32
Attr
ibut
able
to m
inor
ity in
tere
sts
(9,
910,
000)
24,
924,
000
(9,
185,
000)
(4,
340,
786)
56,
996
3,3
30,0
27
6,7
11,6
13
Prof
it fo
r th
e ye
ar f
rom
con
tinui
ng o
pera
tions
42,
923,
000
48,
413,
000
71,
564,
000
93,
049,
569
108
,395
,351
1
14,6
44,2
37
120
,852
,745
Prof
it fr
om th
e di
scon
tinue
d op
erat
ions
-
49,
675,
000
-
-
-
-
-
Prof
it fo
r th
e ye
ar 4
2,92
3,00
0 9
8,08
8,00
0 7
1,56
4,00
0 9
3,04
9,56
9 1
08,3
95,3
51
114
,644
,237
1
20,8
52,7
45
Prof
it at
trib
utab
le to
equ
ity h
olde
rs o
f th
e pa
rent
co
. fro
m c
ontin
uing
ope
ratio
ns
-
53,
294,
000
80,
749,
000
--
--
Prof
it at
trib
utab
le to
equ
ity h
olde
rs o
f th
e pa
rent
co
. fro
m d
isco
ntin
ued
oper
atio
ns
-
19,
870,
000
-
--
--
P&L
App
ropr
iatio
n A
ccou
nt:
O
p B
alan
ce o
f R
etai
ned
Ear
ning
s 7
3,26
0,00
0 9
3,66
4,00
0 1
15,0
68,0
00
128
,871
,200
1
40,9
48,8
48
170
,360
,163
2
05,9
80,7
10
A
djus
tmen
ts
N
et P
rofi
t for
the
year
52,
833,
000
73,
164,
000
80,
749,
000
97,
390,
355
108
,338
,355
1
11,3
14,2
10
114
,141
,132
T
rfr
to S
tatu
tory
Res
erve
(5,
474,
000)
(7,
604,
000)
(8,
414,
900)
(10
,237
,983
) (
7,96
5,41
7)-
-
T
rfr
to V
olun
tary
Res
erve
(5,
474,
000)
(7,
604,
000)
(8,
414,
900)
(7,
188,
694)
-
-
-
P
ropo
sed
Div
iden
d K
D (
21,4
81,0
00)
(34
,370
,000
) (
50,1
16,0
00)
(63
,303
,731
) (
70,9
61,6
22)
(75
,693
,663
) (
79,8
98,7
93)
B
onus
Sha
res
-
(2,
182,
000)
-
(4,
582,
300)
-
-
-
C
l Bal
ance
of
Ret
aine
d E
arni
ngs
93,
664,
000
115
,068
,000
1
28,8
71,2
00
140
,948
,848
1
70,3
60,1
63
205
,980
,710
2
40,2
23,0
50
Sour
ce:
Com
pany
Rep
orts
and
Glo
bal R
esea
rch
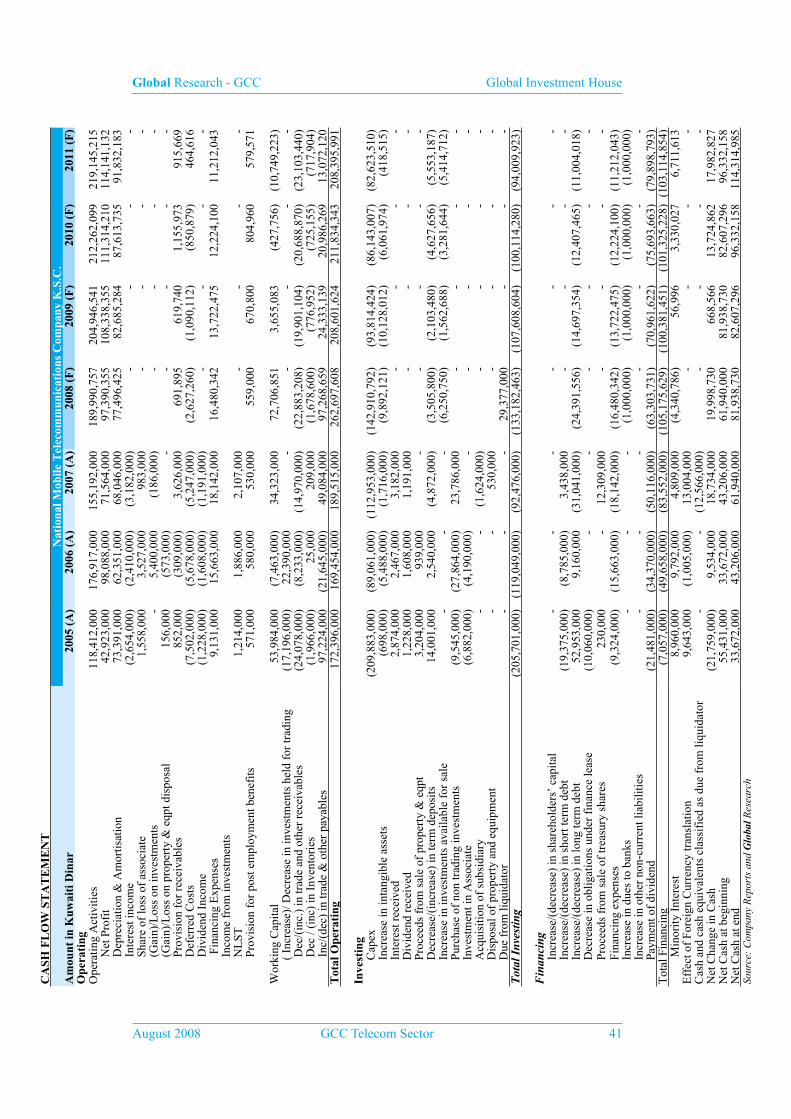
Global Research - GCC Global Investment House
August 2008 GCC Telecom Sector 41
CA
SH F
LO
W S
TA
TE
ME
NT
Nat
iona
l Mob
ile T
elec
omm
unic
atio
ns C
ompa
ny K
.S.C
.A
mou
nt in
Kuw
aiti
Din
ar20
05 (
A)
2006
(A
)20
07 (
A)
2008
(F
)20
09 (
F)
2010
(F
)20
11 (
F)
Ope
rati
ngO
pera
ting
Act
iviti
es 1
18,4
12,0
00
176
,917
,000
1
55,1
92,0
00
189
,990
,757
2
04,9
46,5
41
212
,262
,099
2
19,1
45,2
15
N
et P
rofi
t 4
2,92
3,00
0 9
8,08
8,00
0 7
1,56
4,00
0 9
7,39
0,35
5 1
08,3
38,3
55
111
,314
,210
1
14,1
41,1
32
D
epre
ciat
ion
& A
mor
tisat
ion
73,
391,
000
62,
351,
000
68,
046,
000
77,
496,
425
82,
685,
284
87,
613,
735
91,
832,
183
In
tere
st in
com
e (
2,65
4,00
0) (
2,41
0,00
0) (
3,18
2,00
0) -
-
-
-
Shar
e of
loss
of
asso
ciat
e 1
,558
,000
3
,527
,000
9
83,0
00
-
-
-
-
(G
ain)
/Los
s on
inve
stm
ents
-
5,4
00,0
00
(18
6,00
0) -
-
-
-
(Gai
n)/L
oss
on p
rope
rty
& e
qpt d
ispo
sal
156
,000
(
573,
000)
-
-
-
-
-
Pr
ovis
ion
for
rece
ivab
les
852
,000
(
309,
000)
3,6
26,0
00
691
,895
6
19,7
40
1,1
55,9
73
915
,669
Def
erre
d C
osts
(7,
502,
000)
(5,
678,
000)
(5,
247,
000)
(2,
627,
260)
(1,
090,
112)
(85
0,87
9) 4
64,6
16
D
ivid
end
Inco
me
(1,
228,
000)
(1,
608,
000)
(1,
191,
000)
-
-
-
-
F
inan
cing
Exp
ense
s 9
,131
,000
1
5,66
3,00
0 1
8,14
2,00
0 1
6,48
0,34
2 1
3,72
2,47
5 1
2,22
4,10
0 1
1,21
2,04
3
Inco
me
from
inve
stm
ents
NL
ST 1
,214
,000
1
,886
,000
2
,107
,000
-
-
-
-
Prov
isio
n fo
r po
st e
mpl
oym
ent b
enef
its 5
71,0
00
580
,000
5
30,0
00
559
,000
6
70,8
00
804
,960
5
79,5
71
Wor
king
Cap
ital
53,
984,
000
(7,
463,
000)
34,
323,
000
72,
706,
851
3,6
55,0
83
(42
7,75
6) (
10,7
49,2
23)
( I
ncre
ase)
/ Dec
reas
e in
inve
stm
ents
hel
d fo
r tr
adin
g (
17,1
96,0
00)
22,
390,
000
-
-
--
-
Dec
/(in
c.)
in tr
ade
and
othe
r re
ceiv
able
s (
24,0
78,0
00)
(8,
233,
000)
(14
,970
,000
) (
22,8
83,2
08)
(19
,901
,104
) (
20,6
88,8
70)
(23
,103
,440
)
Dec
/ (i
nc)
in I
nven
tori
es (
1,96
6,00
0) 2
5,00
0 2
09,0
00
(1,
678,
600)
(77
6,95
2) (
725,
155)
(71
7,90
4)
Inc/
(dec
) in
trad
e &
oth
er p
ayab
les
97,
224,
000
(21
,645
,000
) 4
9,08
4,00
0 9
7,26
8,65
9 2
4,33
3,13
9 2
0,98
6,26
9 1
3,07
2,12
0 T
otal
Ope
rati
ng 1
72,3
96,0
00
169
,454
,000
1
89,5
15,0
00
262
,697
,608
2
08,6
01,6
24
211
,834
,343
2
08,3
95,9
91
Inve
stin
g
C
apex
(
209,
883,
000)
(89
,061
,000
) (
112,
953,
000)
(14
2,91
0,79
2) (
93,8
14,4
24)
(86
,143
,007
) (
82,6
23,5
10)
Inc
reas
e in
inta
ngib
le a
sset
s (
698,
000)
(5,
488,
000)
(1,
716,
000)
(9,
892,
121)
(10
,128
,012
) (
6,06
1,97
4) (
418,
515)
Int
eres
t rec
eive
d 2
,874
,000
2
,467
,000
3
,182
,000
-
-
-
-
D
ivid
end
rece
ived
1,2
28,0
00
1,6
08,0
00
1,1
91,0
00
-
-
-
-
Pro
ceed
s fr
om s
ale
of p
rope
rty
& e
qpt
3,2
04,0
00
939
,000
-
-
-
-
-
D
ecre
ase/
(inc
reas
e) in
term
dep
osits
14,
001,
000
2,5
40,0
00
(4,
872,
000)
(3,
505,
800)
(2,
103,
480)
(4,
627,
656)
(5,
553,
187)
Inc
reas
e in
inve
stm
ents
ava
ilabl
e fo
r sa
le -
-
-
(
6,25
0,75
0) (
1,56
2,68
8) (
3,28
1,64
4) (
5,41
4,71
2)
P
urch
ase
of n
on tr
adin
g in
vest
men
ts (
9,54
5,00
0) (
27,8
64,0
00)
23,
786,
000
-
-
-
-
Inv
estm
ent i
n A
ssoc
iate
(6,
882,
000)
(4,
190,
000)
-
-
--
-
A
cqui
sitio
n of
sub
sidi
ary
-
-
(1,
624,
000)
-
-
-
-
Dis
posa
l of
prop
erty
and
equ
ipm
ent
-
-
530
,000
-
-
-
-
D
ue f
rom
liqu
idat
or -
-
-
2
9,37
7,00
0 -
-
-T
otal
Inv
estin
g (
205,
701,
000)
(11
9,04
9,00
0) (
92,4
76,0
00)
(13
3,18
2,46
3) (
107,
608,
604)
(10
0,11
4,28
0) (
94,0
09,9
23)
Fin
anci
ng
I
ncre
ase/
(dec
reas
e) in
sha
reho
lder
s’ c
apita
l -
-
-
--
--
Inc
reas
e/(d
ecre
ase)
in s
hort
term
deb
t (
19,3
75,0
00)
(8,
785,
000)
3,4
38,0
00
-
-
-
-
Inc
reas
e/(d
ecre
ase)
in lo
ng te
rm d
ebt
52,
953,
000
9,1
60,0
00
(31
,041
,000
) (
24,3
91,5
56)
(14
,697
,354
) (
12,4
07,4
65)
(11
,004
,018
)
D
ecre
ase
in o
blig
atio
ns u
nder
fin
ance
leas
e (
10,0
60,0
00)
-
-
-
-
-
-
Pro
ceed
s fr
om s
ale
of tr
easu
ry s
hare
s 2
30,0
00
-
12,
309,
000
-
--
-
F
inan
cing
exp
ense
s (
9,32
4,00
0) (
15,6
63,0
00)
(18
,142
,000
) (
16,4
80,3
42)
(13
,722
,475
) (
12,2
24,1
00)
(11
,212
,043
)
I
ncre
ase
in d
ues
to b
anks
- -
-
(
1,00
0,00
0) (
1,00
0,00
0) (
1,00
0,00
0) (
1,00
0,00
0)
I
ncre
ase
in o
ther
non
-cur
rent
liab
ilitie
s -
-
-
--
--
Pay
men
t of
divi
dend
(21
,481
,000
) (
34,3
70,0
00)
(50
,116
,000
) (
63,3
03,7
31)
(70
,961
,622
) (
75,6
93,6
63)
(79
,898
,793
)T
otal
Fin
anci
ng (
7,05
7,00
0) (
49,6
58,0
00)
(83
,552
,000
) (
105,
175,
629)
(10
0,38
1,45
1) (
101,
325,
228)
(10
3,11
4,85
4)
Min
ority
Int
eres
t 8
,960
,000
9
,792
,000
4
,809
,000
(
4,34
0,78
6) 5
6,99
6 3
,330
,027
6
,711
,613
E
ffec
t of
Fore
ign
Cur
renc
y tr
ansl
atio
n 9
,643
,000
(
1,00
5,00
0) 1
3,00
4,00
0 -
-
-
-
C
ash
and
cash
equ
ival
ents
cla
ssif
ied
as d
ue f
rom
liqu
idat
or -
-
(
12,5
66,0
00)
-
-
-
-
Net
Cha
nge
in C
ash
(21
,759
,000
) 9
,534
,000
1
8,73
4,00
0 1
9,99
8,73
0 6
68,5
66
13,
724,
862
17,
982,
827
Net
Cas
h at
beg
inni
ng 5
5,43
1,00
0 3
3,67
2,00
0 4
3,20
6,00
0 6
1,94
0,00
0 8
1,93
8,73
0 8
2,60
7,29
6 9
6,33
2,15
8 N
et C
ash
at e
nd 3
3,67
2,00
0 4
3,20
6,00
0 6
1,94
0,00
0 8
1,93
8,73
0 8
2,60
7,29
6 9
6,33
2,15
8 1
14,3
14,9
85
Sour
ce:
Com
pany
Rep
orts
and
Glo
bal R
esea
rch

Global Research - GCC Global Investment House
42 GCC Telecom Sector August 2008
FA
CT
SH
EE
TN
atio
nal M
obile
Tel
ecom
mun
icat
ions
Com
pany
K.S
.C.
2005
(A
)20
06 (
A)
2007
(A
)20
08 (
F)
2009
(F
)20
10 (
F)
2011
(F
)L
IQU
IDIT
Y R
AT
IO’s
- C
urre
nt R
atio
0.6
0
.7
0.7
0
.6
0.6
0
.7
0.8
-
Qui
ck R
atio
0.6
0
.6
0.7
0
.6
0.6
0
.7
0.8
-
Cas
h Fl
ow f
rom
Ope
ratio
ns r
atio
0.5
0
.9
0.6
0
.5
0.5
0
.5
0.6
PR
OF
ITA
BIL
ITY
RA
TIO
S
-
Gro
ss P
rofi
t Mar
gin
61%
63%
63%
63%
60%
60%
59%
- E
BIT
DA
to R
even
ues
41.4
%39
.8%
39.5
%40
%39
%38
%38
%
-
Net
Pro
fit M
argi
n
17
%16
.5%
19.8
%20
%20
%19
%19
%
-
Ret
urn
on A
vera
ge A
sset
s
8%
3%11
%12
%12
%12
%12
%
-
Ret
urn
on A
vera
ge E
quity
25
%10
%28
%30
%30
%28
%27
%
EF
FIC
IEN
CY
RA
TIO
S
-
Inve
ntor
y T
urno
ver
(tim
es)
32.3
26.4
32.5
32.0
31.5
30.7
29.8
-
Deb
tors
Tur
nove
r (t
imes
)5.
64.
75.
04.
94.
54.
13.
8
- C
redi
tors
Tur
nove
r (t
imes
)0.
80.
70.
80.
70.
70.
70.
7
LE
VE
RA
GE
RA
TIO
S
-
Int
eres
t Cov
erag
e (t
imes
)13
.98.
28.
911
.715
.418
.120
.7
-
Deb
t to
Equ
ity (
times
)0.
90.
80.
70.
50.
40.
40.
3
GR
OW
TH
RA
TE
S
-
Rev
enue
gro
wth
rat
e29
.3%
5.5%
26.0
%18
.1%
12.8
%6.
7%6.
0%
-
Net
inco
me
grow
th r
ate
32.0
%0.
9%51
.5%
20.6
%11
.2%
2.7%
2.5%
- E
quity
gro
wth
rat
e12
.7%
17.8
%14
.1%
11.2
%11
.0%
9.4%
8.3%
- T
otal
ass
ets
grow
th r
ate
4.3%
8.5%
5.4%
13.5
%5.
5%5.
2%4.
5%
RA
TIO
S U
SED
FO
R V
AL
UA
TIO
N
-
EPS
(fi
ls)
104.
810
5.7
160
.2
193
.2
214
.9
220
.8
226
.5
- B
ook
Val
ue P
er S
hare
(fi
ls)
451
.1
531
.3
606
.3
673
.9
748
.1
818
.7
886
.7
- P
rice
Per
Sha
re (
KD
) 2
.216
2
.291
2
.400
1
.860
1
.860
1
.860
1
.860
-
Mar
ket C
apita
lisat
ion
( K
D M
n) 1
,117
.1
1,1
54.7
1
,209
.7
937
.5
937
.5
937
.5
937
.5
- E
nter
pris
e V
alue
(E
V
KD
Mn)
1,2
80.7
1
,311
.6
1,3
37.3
1
,016
.2
997
.7
966
.0
930
.4
- E
V/E
BIT
DA
(x)
10.
1 1
0.2
8.3
5
.3
4.7
4
.4
4.0
-
P/E
(x)
21.
1 2
1.7
15.
0 9
.6
8.7
8
.4
8.2
-
P/B
V (
x) 4
.9
4.3
4
.0
2.8
2
.5
2.3
2
.1
Sour
ce:
Com
pany
Rep
orts
and
Glo
bal R
esea
rch
* M
arke
t pri
ce fo
r 20
08 a
nd s
ubse
quen
t yea
rs a
re a
s pe
r cl
osin
g pr
ices
on
Kuw
ait S
tock
Exc
hang
e on
Aug
. 31,
200
8

Global Research - GCC Global Investment House
August 2008 GCC Telecom Sector 43
Saudi Telecom - STC
Tickers7010.SE (Reuters)STC AB (Bloomberg)
Listing:Saudi Stock Exchange
Current Price: SR64.75 ( August 31, 2008)
Key Data
EPS* (SR) 7.2 Avg. daily vol. (‘000) 1,787.5
BVPS* (SR) 19.0 52 week Hi / Lo (SR) 87.75/57.25
P/E (x) 8.9 Market Cap (SR mn) 129,500
P/BV (x) 3.4 Target Price (SR) 78.75
Source: Global Research
* Projected (2008)
BUYRecommendation
Background
• Saudi Telecom (STC), was established in 1998 as a shareholding company following a Royal decree issued to separate the facilities of Post, Telegraph and Telephone (P.T.T) from the ministry. STC offers fixed, mobile, data, and internet services to personal, homes and enterprise users. The Company offers four key services: (1) Home services, which includes PSTN, broadband DSL. (2) Personal services, which includes messaging services, (post paid and pre-paid lines), business services, data services, and roaming services; (3) Enterprise, which is a data business solutions provided to companies and enterprises; (4) Wholesale services, which provides network services to other local and international operators.
• STC provides its services under four main brands, “Al Jawal” for mobile services, “Al Hatif” for fixed line services, “Saudi Data” and “Saudi Net” for data and internet services.
• STC had a full monopoly over the telecom market until 2003, when the VSAT market was liberalized. Subsequently, STC’s monopoly in the mobile market was ended when the second mobile license was granted in 2004 to Etihad Etisalat Company (Mobily). In March 2007, a consortium led by Zain of Kuwait won the third mobile license with a bid of US$6.1bn, and launched its services in 2008.
• The fixed market was liberalized when three consortia- led by Bahrain Telecommunications (Batelco), Hong Kong’s PCCW and US based Verizon Communications won three fixed line licenses in April 2007, bringing the total number of fixed line licenses in the kingdom to four and ending STC’s monopoly over fixed lines.

Global Research - GCC Global Investment House
44 GCC Telecom Sector August 2008
• STC is still playing a leading role in the internet and data markets. However, the company operates in a very competitive environment that includes more than 50 ISP providers, 8 VSAT operators, and another 2 data service providers namely Integrated Telecom company (ITC), and Bayanat Al Oula Co.
• STC was awarded a 3G license in July 2005 for SR753.7mn, and launched its 3G network in June 2006. The company selected Huawei Technologies Company, a leading provider of next generation telecommunications network solutions to deploy the first WiMAX 802.16e-based network in the Middle East, covering major cities including Riyadh, Jeddah and Dammam. Under the agreement, Huawei will design and deploy an end-to-end WiMAX 802.16e network including Base Station, Access Service Network Gateway, Network Management System, as well as an Authorization, Authentication and Accounting system.
• STC joined a consortium of nine leading international telecom firms including Bharti Airtel (India), Etisalat (UAE), France Telecom (France), OGERO (Lebanon), PTCL (Pakistan), Telecom Egypt (Egypt), Telecom Italia Sparkle (Italy) and VSNL (India) to construct a high-capacity fiber-optic submarine cable system that stretches from India to Italy and France via the Middle East. The “I-ME-WE” (India, Middle East, Western Europe) will be a three fiber pair, new generation submarine cable system covering a distance of approximately 13,000km and is expected to be completed by Q4 2009. The project will provide the bandwidth that will help support the ongoing developments in the Middle East and Asia. The supply contract for the project has been awarded to Alcatel-Lucent, France.
Analysis of operations
Saudi operations
STC’s Mobile monopoly broken in 2005…The breakup of STC’s monopoly over the mobile segment, resulted in around 41% loss of the company’s market share to the second operator “Mobily”. Following the launch of Mobily’s operations in 2005, competition resulted in the increase in subscribers’ growth, reduced prices and higher quality of services. By the end of 2007, mobile penetration reached 116% compared to 82% in 2006, with prepaid subscribers forming around 83% of all mobile subscribers in the kingdom. A third operator ( Kuwait’s Zain) launched operations in August 2008.
Chart 01: KSA Telecom penetration rates
0%
20%
40%
60%
80%
100%
120%
140%
2004 2005 2006 2007
Mobile Penetration Fixed Penetration Broadband Penetration
Source: CITC, Global Research

Global Research - GCC Global Investment House
August 2008 GCC Telecom Sector 45
Fixed, No Longer a Monopoly…Fixed line subscribers approached 4mn subscribers at the end of 2007, translating into a penetration rate of 16.3%. The country’s fixed market was controlled by the incumbent operator, STC, until April 2007, when the Communication and Information Technology Commission (CITC) liberated the market and issued three licenses to the three consortia led by Batleco, Hong Kong’s PCCW, and US-based Verizon Communications. The combined capital of the three companies is expected to reach US$533mn. MCI-Verizon, announced that it would operate on a capital of US$300mn and invest an additional US$3bn to link 21 of the Kingdom’s cities in seven years. Verizon is expected to operate wire-line connectivity while Batelco and PCCW will offer both wire-line and wireless communication solutions. The three companies are expected to go public before the end of 2008 with a stake of at least 25% that must be offered to the public-as well as a 10% offered to a state-owned pension fund.
Broadband penetration increasing rapidly… Broadband subscribers grew from 24,000 subscribers in 2004 to 623,000 subscribers in 2007, with approximately a 10 fold increase on y-o-y basis. Despite the remarkable growth, still KSA broadband penetration rate, which stood at 2.5% in 2007, is considered a very low rate when compared to both the world average of 5.25%.
International operations
As a result of increasing competition in the Saudi telecom market, the company started considering inorganic growth opportunities. STC adopted the 10 X 10 strategy which aims at generating as much as 10% of revenues from foreign operations by 2010. Accordingly, the company started expanding outside its home market beginning with the Maxis deal which gave STC foothold in Malaysia, India, and Indonesia, Later, STC won the bid for a 26% stake in Kuwait’s third mobile service operator. Finally, STC acquired a 35% stake in Oger Telecom, which gave STC presence in Turkey and South Africa.
Table 01: Foreign Acquisitions
Deal Date Stake (%) Value (US$bn)
Maxis Group Jun. 2007 25 3.04
Kuwait third Mobile Operator Nov. 2007 26 0.908
Oger Telecom Jan. 2008 35 2.56
Source: Company Announcements, Global Research
The Maxis Deal …The year 2007 marked STC’s first foreign acquisition. In June 2007, STC entered into a deal to form a strategic partnership with Binariang GSM (Binariang), the principal shareholder of Maxis Communications (Maxis), the Malaysian-based integrated telecommunications operator, and its subsidiary PT Natrindo Telepon Seluler (NTS) in Indonesia. The Maxis Group has operations in Malaysia, Indonesia and India. The deal was valued at SR11.4bn (US$3.05bn), including a SR3.4bn credit facility to be provided equally by the partners to finance the Indian expansion of Maxis Indian unit, Aircel. STC will participate in the recapitalization and restructuring of Binariang which will hold 100% of Maxis, and will invest together with the other shareholders of Binariang to fund the international operations

Global Research - GCC Global Investment House
46 GCC Telecom Sector August 2008
of Maxis in India and Indonesia. Upon conclusion of the deal, STC had a 25% effective interest in Maxis and a 51% direct stake in NTS, Maxis’ subsidiary in Indonesia.
Chart 02: Maxis Deal
Saudi Telecom Company
25%
Binariang GSM
100%
Maxis Communications
44% 74%
PT Natrindo Telepon Seluler (NTS) AirCel
Source: Company Reports, Global Research
Overview of Maxis Operations
Maxis group has operations in Malaysia, India, and Indonesia. The group offers mobile, fixed, and international gateway services. However, mobile services captures around 95% of operating revenues and almost 100% of the group’s segment results ( profit before interest and tax). The Malaysian operations contributed 90.3% to the group’s operating revenues in 2006, and 99.8% to the group’s results in 2006. India operations, contributed 9.7% to the group’s operating revenues in 2006, and contributed 6.5% to the group’s segment results, while the Indonesian operations contributed a negative 6.3% to the group’s segment results in 2006.
Table 02: Snapshot of Maxis operations (2007)
Malaysia India Indonesia
Population (000) 27,450 1,141,841 242,857
Mobile Penetration (%) 85.1 20 42.0
Company Maxis Aircel NTS
No. of Mobile Operators 5 12 10
Market Share (%) 41.5 4 -
Source: Company Announcements, Global Research
MalaysiaMalaysia mobile market is competitive, and competition is expected to intensify further with the entry of new players and the introduction of mobile number portability (MNP), expected this year. Mobile penetration increased in Malaysia from 72.3% in 2006 to 85.1% in 2007. Maxis is considered to be Malaysia’s cellular market leader with around 41.5% of the mobile market subscribers. The company had 9.72mn subscribers in Malaysia at end of 2007. The
51%

Global Research - GCC Global Investment House
August 2008 GCC Telecom Sector 47
mobile market was mainly dominated by three mobile operators including Maxis (41.5%), Celcom (31%) and DiGi (27.5%). Another two players are expected to launch operations soon namely, a new 3G license holder “U-Mobile” and “Tune Talk-MVNO” (mobile virtual network operator).
India India’s mobile industry is growing rapidly. With a penetration rate of around 20% in 2007, the potential for further growth in India’s wireless industry is immense. Aircel, Maxis’ Indian subsidiary, has operations in 9 of India’s 23 telecoms regions and has obtained licenses for the rest. Aircel had 9.43mn subscribers at end of 2007, capturing a market share of around 4%.
Indonesia Indonesia is one of the fastest growing mobile markets in South-East Asia. Mobile penetration increased to 42% at the end of 2007 compared to 28.3% in 2006. Indonesia’s cellular market is currently dominated by unlisted PT Telkomsel, which has a 50% market share. PT Indosat Tbk (ISAT.JK) is second with nearly 24% of the market while PT Exelcomindo Pratama (EXCL.JK) is third with 16%. PT Natrindo Telepon Seluler (NTS) has a license to build and operate 2G and 3G networks in Indonesia.
STC wins stake in Kuwait 3rd mobile operator… During November 2007, Saudi Telecom Co. won a 26% stake in the third telecom operator in Kuwait with the highest bid of KD248.7mn (US$907.7mn). The capital of the new company amounts to KD50mn with 50% offered for public subscription, while the government will retain a 24% stake. The new company is expected to start operations in 2008.
Kuwait Before STC won the license as the third telecom operator, Zain, and Wataniya (NMTC) were the only two mobile operators in Kuwait. The year 2007 witnessed a growth of 10% in total mobile subscribers to reach 2.77mn customers, which indicates penetration rate of 82% (based on total population) compared to a penetration rate of 79% in 2006.
Table 03: Snapshot of Kuwait mobile market (2007)Zain Wataniya
Mobile Subscribers (000) 1,576 1,198
Prepaid Customers (%) 72 86
Market Share (%) 57 43
Revenues* (KD 000) 336,588 212,200
EBITDA Margin (%) 54 51
Source: Company Announcements, Global Research * From Kuwait operations
Acquiring 35% of Oger Telecom… During January 2008, STC acquired a 35% stake in Oger Telecom from Saudi Oger, the controlling shareholder of Oger Telecom, at a net price of US$2.56bn. Oger Telecom Limited is a company incorporated in the Dubai International Financial Centre. Its parent, Saudi Oger, is a construction company controlled by the family of late Lebanese prime minister Rafik al-Hariri.

Global Research - GCC Global Investment House
48 GCC Telecom Sector August 2008
Chart 03: Oger Telecom’s Subsidiaries
Source: Oger telecom
Gaining presence in Turkey and South Africa…Oger Telecom owns 55% of fixed-line operator Turk Telekom and 75% of Cell C, South Africa’s third largest mobile operator. It also operates as an ISP providing dial-up, ADSL, leased line and VPN services in Saudi Arabia, Lebanon and Jordan through Cyberia. Turk Telekom is the leading provider of fixed-line services in Turkey. Through its 81.12% shareholding in Avea, it also provides mobile communications services in Turkey. Avea is the third largest mobile operator in Turkey with an approximate 16.2% market share in 2007. Cell C offers mobile communications services to pre-paid and post-paid customers in South Africa with approximately 11% market share as of 31 December 2007. Turkey and South Africa have the largest telecom sectors in the Middle East and Africa respectively, driven by their large and relatively wealthy populations. The Turkish fixed-line market had approximately 18.4mn subscribers and a penetration rate of 24.6% in 2007. Turkey’s mobile subscribers stood at 62mn subscribers in 2007 with a penetration rate of 83%. In addition, the Turkish market has witnessed rapid growth in broadband penetration with DSL adoption reaching over 4.5mn subscribers in 2007, up from 250,000 subscribers at the end of 2004. The mobile market in South Africa has also been exhibiting significant growth over the past years. Total mobile subscribers in South Africa stood at 42.3mn subscribers with a penetration rate of 87% in 2007.
Financial performance
Revenues grow by 6.4% in 2007 led by the growth in the wireless segment…STC reported operating revenues of SR34.5bn for 2007, increasing by 6.4% over 2006 operating revenues. STC’s operating revenues includes revenues from the wireline and wireless segments. Revenues from the wireline segment dropped by 4.8% to reach SR9.3bn, whereas revenues from the wireless segment grew by 11.2% to reach SR25.2bn in 2007. We expect further pressure in the wireline segment in STC’s home market after the liberalization of the fixed line segment and the granting of three new licenses. In addition, the mobile

Global Research - GCC Global Investment House
August 2008 GCC Telecom Sector 49
market will have a third competitor in 2008, squeezing STC’s market share. However, we expect operating revenues in both the wireline and wireless segment to improve on the back of STC’s foreign acquisitions, after factoring in the company’s recent acquisition of 35% of Oger Telecom, and the launch of Kuwait’s third mobile operator, expected in 2008.
Chart 04: Revenue Mix
-
10
20
30
40
50
60
70
2005 2006 2007 2008 F 2009 F 2010 F 2011 F
SRbn
Wireline Wireless
Source: Company Reports, Global Research
Operating expenses increasing by 10.6%...Total operating expenses stood at SR21.8bn in 2007 increasing by 10.6% over 2006. Government charges formed 22% of total expenses and stood at SR4.4bn. In Feb-07, the Saudi government decided to reduce the fees levied by the government for land and mobile phone services from 15% to 10%. Access charges formed 20.3% , employee costs (19.6%), depreciation and amortization (18.8%), administrative and marketing (11.2%) , and repairs and maintenance (8.1%). Operating expenses as a percentage of operating revenues stood at 63% in 2007, increasing from 61% in 2006.
Chart 05: Operating Expenses
-
5
10
15
20
25
2005 2006 2007
SRbn
Repairs and maintenance
Administrative and marketingexpensesDepreciation and amortization
Employee costs
Access charges
Government charges
Source: Company Reports, Global Research
Further pressure on EBITDA margins… EBITDA stood at SR16.71bn in 2007, increasing by a marginal 1.4% over 2006 EBITDA of SR16.48bn. EBITDA margin stood at 48.5% down from 51% in 2006, however still a high margin compared to industry norms. We expect further pressure on EBITDA margin in the short term considering STC’s foreign expansions and start up operations outside its domestic market.

Global Research - GCC Global Investment House
50 GCC Telecom Sector August 2008
Chart 06: EBITDA
0
5
10
15
20
25
30
2005 2006 2007 2008 F 2009 F 2010 F 2011 F
SRbn
40%
42%
44%
46%
48%
50%
52%
54%
56%
EBITDA EBITDA Margin
Source: Company Reports, Global Research
Inorganic growth supporting bottom line going forward…Net profit for 2007 stood at SR12bn, dropping by 6.1% on a y-o-y basis. Net profit margin declined from 39.5% in 2006 to 34.9% in 2007. Return on equity stood at 33.5% in 2007, while return on assets stood at 17.5% declining from 37.5%, and 27.8% in 2006 respectively. Going forward, despite the expected increase in competition in STC’s domestic market, we expect earnings to improve on the back of STC’s recent foreign acquisitions which are expected to add to the company’s bottom line.
Chart 07: Profitability
Source: Company Reports, Global Research
Total assets increase on the back of consolidation…Total assets increased by 49% to reach SR68.8bn in 2007 compared to SR46.1bn in 2006 on the back of consolidating the company’s financial statements. Starting from fiscal year 2007, STC fully consolidated its investment in Arabian Internet and Communications Services Co. “AwalNet”, and “Tejari Saudi Arabia” in which the company holds 100%, and 50% respectively. In addition, it proportionately consolidated its 25% investment in Binariang, and its 51% investment in PT Natrindo Telepon Seluler (NTS). STC’s intangible assets increased from SR731.7mn in 2006 to SR13.8bn in 2007, on the back of the goodwill arising on the consolidation and acquisition of Binariang, coupled with the goodwill arising on the acquisition of NTS.
0
2
4
6
8
10
12
14
16
18
20
2005 2006 2007 2008 F 2009 F 2010 F 2011 F
SRbn
0%
5%
10%
15%
20%
25%
30%
35%
40%
45%
Net Profit NPM
0%
5%
10%
15%
20%
25%
30%
35%
40%
45%
2005 2006 2007 2008 F 2009 F 2010 F 2011 F
ROE ROA
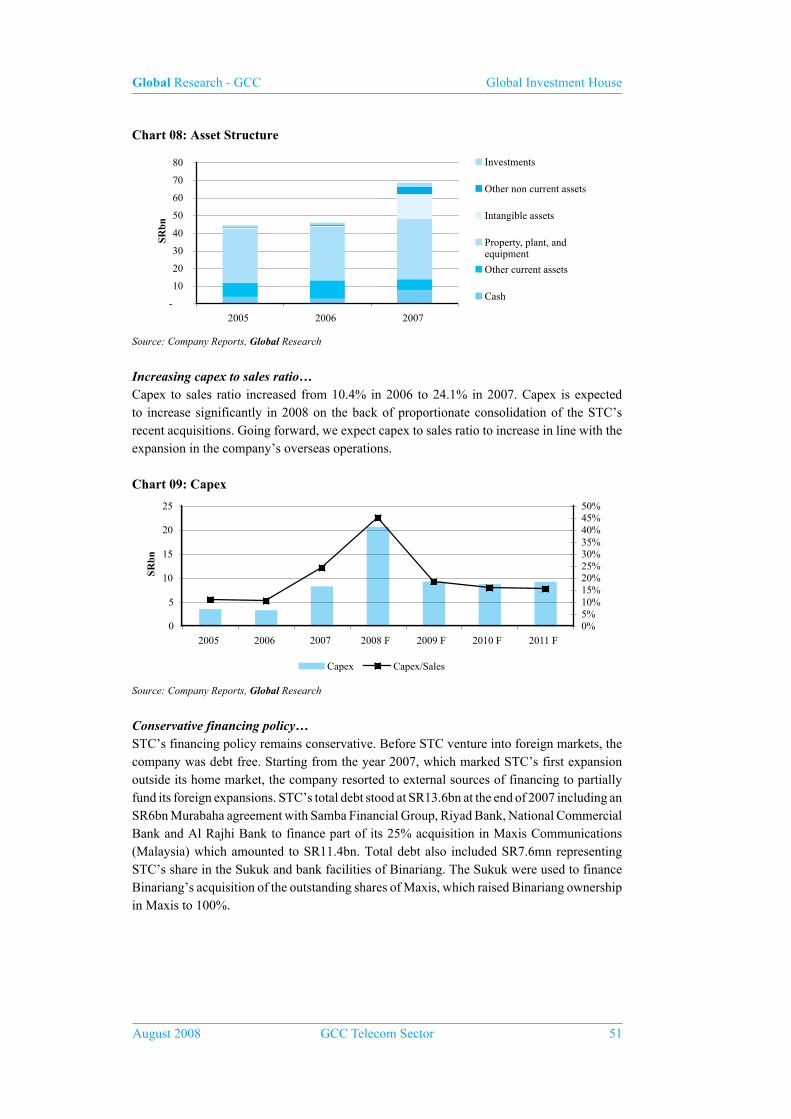
Global Research - GCC Global Investment House
August 2008 GCC Telecom Sector 51
Chart 08: Asset Structure
-
10
20
30
40
50
60
70
80
2005 2006 2007
SRbn
Investments
Other non current assets
Intangible assets
Property, plant, andequipment
Other current assets
Cash
Source: Company Reports, Global Research
Increasing capex to sales ratio…Capex to sales ratio increased from 10.4% in 2006 to 24.1% in 2007. Capex is expected to increase significantly in 2008 on the back of proportionate consolidation of the STC’s recent acquisitions. Going forward, we expect capex to sales ratio to increase in line with the expansion in the company’s overseas operations.
Chart 09: Capex
0
5
10
15
20
25
2005 2006 2007 2008 F 2009 F 2010 F 2011 F
SRbn
0%5%10%15%20%25%30%35%40%45%50%
Capex Capex/Sales
Source: Company Reports, Global Research
Conservative financing policy…STC’s financing policy remains conservative. Before STC venture into foreign markets, the company was debt free. Starting from the year 2007, which marked STC’s first expansion outside its home market, the company resorted to external sources of financing to partially fund its foreign expansions. STC’s total debt stood at SR13.6bn at the end of 2007 including an SR6bn Murabaha agreement with Samba Financial Group, Riyad Bank, National Commercial Bank and Al Rajhi Bank to finance part of its 25% acquisition in Maxis Communications (Malaysia) which amounted to SR11.4bn. Total debt also included SR7.6mn representing STC’s share in the Sukuk and bank facilities of Binariang. The Sukuk were used to finance Binariang’s acquisition of the outstanding shares of Maxis, which raised Binariang ownership in Maxis to 100%.
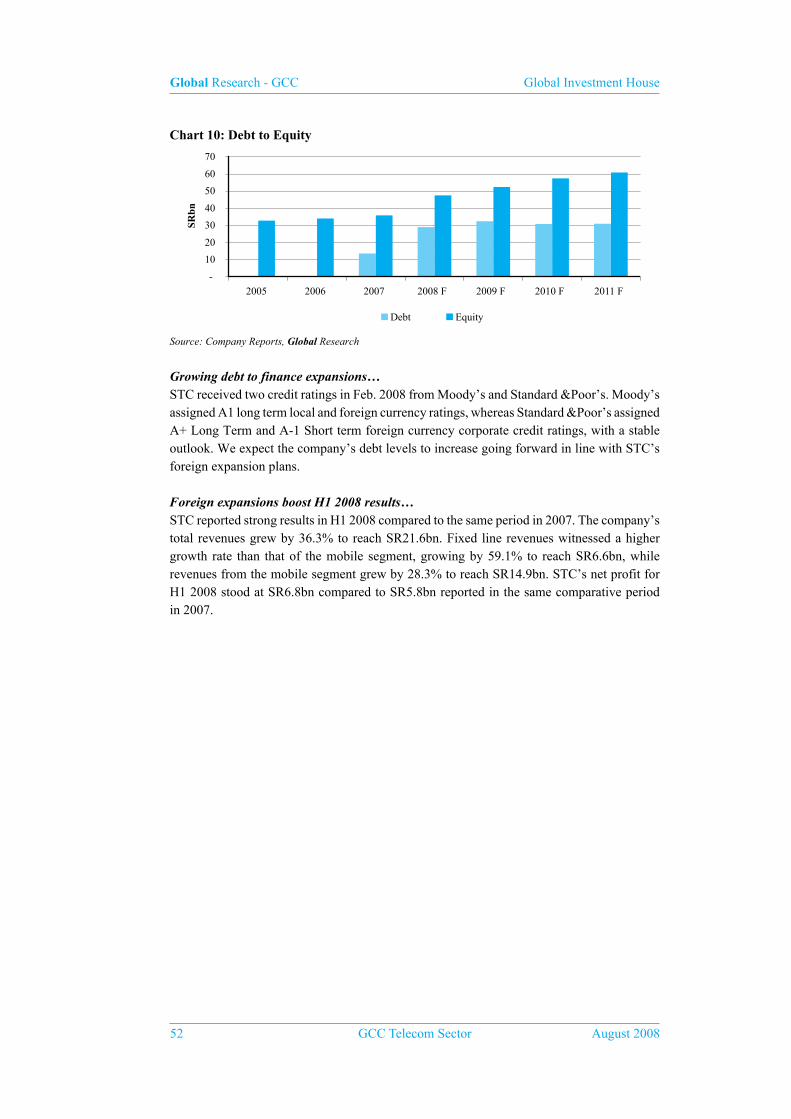
Global Research - GCC Global Investment House
52 GCC Telecom Sector August 2008
Chart 10: Debt to Equity
-
10
20
30
40
50
60
70
2005 2006 2007 2008 F 2009 F 2010 F 2011 F
SRbn
Debt Equity
Source: Company Reports, Global Research
Growing debt to finance expansions…STC received two credit ratings in Feb. 2008 from Moody’s and Standard &Poor’s. Moody’s assigned A1 long term local and foreign currency ratings, whereas Standard &Poor’s assigned A+ Long Term and A-1 Short term foreign currency corporate credit ratings, with a stable outlook. We expect the company’s debt levels to increase going forward in line with STC’s foreign expansion plans.
Foreign expansions boost H1 2008 results…STC reported strong results in H1 2008 compared to the same period in 2007. The company’s total revenues grew by 36.3% to reach SR21.6bn. Fixed line revenues witnessed a higher growth rate than that of the mobile segment, growing by 59.1% to reach SR6.6bn, while revenues from the mobile segment grew by 28.3% to reach SR14.9bn. STC’s net profit for H1 2008 stood at SR6.8bn compared to SR5.8bn reported in the same comparative period in 2007.

Global Research - GCC Global Investment House
August 2008 GCC Telecom Sector 53
Outlook and Valuation· We expect the company’s mobile market share in its home market to shrink further after
the third operator, “Zain” launched its operations in August 2008. In addition, we expect STC’s fixed line segment to be impacted when the three awarded companies Batelco-Atheeb, Hong Kong’s (PCCW), and MCI International-Verizon begin their commercial operations, expected at the end of 2008. However, despite the increase in competition in STC’s local market which is likely to put pressure on the company’s market shares and pricing strategies, we believe that the Saudi market still holds potential giving the size of the market, and favorable demographics with around 32% of the population in the age of 10 to 24, coupled with the relatively lower mobile penetration rate, and a very low penetration rates in the broadband and data segment.
· Despite the intensive competition in its home market, we expect STC’s performance to improve on the back of the company’s overseas expansions. We expect that STC’s expansion strategy to pay off starting from 2008 onwards, the company’s Oger Telecom deal is expected to boost STC’s fixed line revenue through Turkey’s fixed line operator, Turk Telecom. In addition, through its recent acquisitions, STC gained presence in the mobile segment of Malaysia, Indonesia, and India through Maxis, as well as Turkey, and South Africa through Oger Telecom. We expect STC’s revenues to grow by a CAGR of 9.2% during our forecast period (2008-2011), with an 8.5% CAGR for the fixed line segment and a 9.4% CAGR for the mobile segment.
· At the current market price (Aug.31 2008), STC trades at 8.9x and 8.2x its earnings and 3.4x and 3.2x its book value for 2008F and 2009F respectively. We have used the Discounted Cash Flow (DCF) to value STC. The DCF model is based on a 4-year (FY2008-FY2011) explicit forecast period for the Free Cash Flow to Firm (FCFF). Our DCF valuation estimates the fair value of STC’s stock at SR78.75, which is 21.6% higher than the current market price of the stock. We therefore reiterate our “Buy” recommendation for STC.

Global Research - GCC Global Investment House
54 GCC Telecom Sector August 2008
BA
LA
NC
E S
HE
ET
Saud
i Tel
ecom
- S
TC
(SR
000
’s)
2005
2006
2007
2008
F20
09 F
2010
F20
11 F
Cas
h on
han
d &
at B
ank
4,0
04,8
21
2,9
09,3
21
7,6
13,7
86
8,6
57,9
66
9,5
90,3
29
10,
325,
293
11,
127,
316
Shor
t-te
rm in
vest
men
ts 3
,695
,000
5
,599
,000
0
1
,319
1
,582
1
,820
2
,002
N
et N
otes
& A
ccou
nt R
ecei
vabl
e 3
,623
,634
3
,938
,639
4
,972
,988
1
0,27
5,96
5 1
1,83
0,52
1 1
3,11
6,11
2 1
4,18
6,33
8 In
vent
ory
153
,288
1
49,7
00
367
,675
9
82,8
47
1,0
79,2
59
1,1
86,4
46
1,2
97,0
21
Adv
ance
Pay
men
ts 4
73,4
01
765
,622
1
,018
,644
3
,931
,389
4
,317
,034
4
,745
,782
5
,188
,083
T
otal
cur
rent
ass
ets
11,9
50,1
44
13,3
62,2
82
13,9
73,0
93
23,8
49,4
87
26,8
18,7
26
29,3
75,4
52
31,8
00,7
60
Prop
erty
, pla
nt, a
nd e
quip
men
t 3
0,53
2,59
0 3
0,12
8,38
3 3
4,36
9,29
7 4
9,38
9,35
7 5
2,66
5,33
4 5
4,71
8,61
0 5
6,59
6,57
9 In
tang
ible
ass
ets
753
,750
7
31,7
66
13,
855,
574
31,
794,
742
36,
563,
953
38,
392,
151
40,
311,
759
Oth
er n
on c
urre
nt a
sset
s 5
15,3
55
759
,183
4
,202
,315
1
,147
,283
1
,366
,679
1
,496
,933
1
,626
,487
In
vest
men
ts in
ass
ocia
tes
(Equ
ity M
etho
d) 8
92,0
04
990
,126
9
88,7
64
1,0
87,6
40
1,1
96,4
04
1,3
16,0
45
1,4
47,6
49
Inve
stm
ents
and
adv
ance
s 1
00,0
33
150
,033
1
,417
,861
1
,559
,647
1
,715
,612
1
,887
,173
1
,981
,532
T
otal
Lon
g-te
rm A
sset
s 3
2,79
3,73
2 3
2,75
9,49
1 5
4,83
3,81
1 8
4,97
8,67
0 9
3,50
7,98
3 9
7,81
0,91
2 1
01,9
64,0
06
Tot
al A
sset
s 4
4,74
3,87
6 4
6,12
1,77
3 6
8,80
6,90
4 1
08,8
28,1
57
120
,326
,708
1
27,1
86,3
65
133
,764
,766
Cur
rent
por
tion
of lo
ng te
rm d
ebt
-
- 5
60,4
48
3,4
53,3
00
2,9
58,0
00
2,2
86,4
00
1,4
79,0
00
Acc
ount
s pa
yabl
e 2
,605
,975
1
,959
,937
3
,082
,080
6
,879
,931
7
,554
,810
8
,305
,119
9
,079
,146
D
ivid
end
paya
ble
207
,249
6
5,00
6 5
6,86
0 -
-
--
Oth
er p
ayab
les
-
2,3
55,2
15
6,1
60,4
43
5,5
44,3
99
6,0
98,8
39
6,7
08,7
22
7,3
79,5
95
Acc
rued
Exp
ense
s 5
,312
,230
3
,749
,277
5
,586
,722
7
,862
,778
8
,634
,069
9
,491
,564
9
,857
,358
O
ther
cre
dit b
alan
ces
1,3
29,2
77
1,3
94,0
28
1,7
73,1
07
2,7
53,4
80
3,0
09,2
02
3,2
96,0
00
3,5
81,2
55
Tot
al c
urre
nt li
abili
ties
9,4
54,7
31
9,5
23,4
63
17,
219,
660
26,
493,
887
28,
254,
920
30,
087,
805
31,
376,
354
Lon
g te
rm d
ebt
-
- 1
3,01
9,30
3 2
5,58
0,00
0 2
9,58
0,00
0 2
8,58
0,00
0 2
9,58
0,00
0 O
ther
non
-cur
rent
liab
ilitie
s 2
,433
,708
2
,443
,971
2
,680
,401
9
,178
,266
1
0,03
0,67
5 1
0,98
6,66
6 1
1,93
7,51
7 T
otal
Lon
g-te
rm L
iabi
litie
s 2
,433
,708
2
,443
,971
1
5,69
9,70
4 3
4,75
8,26
6 3
9,61
0,67
5 3
9,56
6,66
6 4
1,51
7,51
7
Paid
in C
apita
l 1
5,00
0,00
0 2
0,00
0,00
0 2
0,00
0,00
0 2
0,00
0,00
0 2
0,00
0,00
0 2
0,00
0,00
0 2
0,00
0,00
0 R
eser
ves
4,5
38,5
68
5,8
18,4
58
7,0
20,7
10
8,4
68,6
57
10,
055,
631
10,
055,
631
10,
055,
631
Unr
ealiz
ed g
ains
on
othe
r in
vest
men
ts (
3,34
2) (
3,34
2) -
-
-
-
-
Fi
nanc
ial s
tate
men
ts’t
rans
latio
n di
ffer
ence
s -
-
1
96,8
39
354
,310
4
42,8
88
531
,465
5
84,6
12
Ret
aine
d ea
rnin
gs 1
3,32
0,21
1 8
,339
,223
8
,654
,362
9
,088
,746
9
,882
,233
1
2,44
8,36
3 1
4,28
4,57
4 T
otal
Sha
reho
lder
s E
quit
y 3
2,85
5,43
7 3
4,15
4,33
9 3
5,87
1,91
1 3
7,91
1,71
3 4
0,38
0,75
1 4
3,03
5,45
9 4
4,92
4,81
6 M
inor
ity in
tere
st 1
5,62
9 9
,664
,290
1
2,08
0,36
3 1
4,49
6,43
5 1
5,94
6,07
9 T
otal
Equ
ity
32,
855,
437
34,
154,
339
35,
887,
540
47,
576,
003
52,
461,
114
57,
531,
894
60,
870,
895
Tot
al L
iabi
litie
s an
d E
quit
y 4
4,74
3,87
6 4
6,12
1,77
3 6
8,80
6,90
4 1
08,8
28,1
57
120
,326
,708
1
27,1
86,3
65
133
,764
,766
So
urce
: C
ompa
ny R
epor
ts, G
loba
l Res
earc
h

Global Research - GCC Global Investment House
August 2008 GCC Telecom Sector 55
INC
OM
E S
TA
TE
ME
NT
Saud
i Tel
ecom
- S
TC
(SR
000
’s)
2005
2006
2007
2008
F20
09 F
2010
F20
11 F
Rev
enue
s 3
2,53
9,94
3 3
2,39
3,57
1 3
4,45
7,80
7 4
5,89
1,33
1 5
0,15
3,37
3 5
4,93
3,32
9 5
9,68
7,58
4
CO
GS
(13
,200
,898
) (
13,9
77,2
22)
(15
,299
,147
) (
19,6
56,9
45)
(21
,585
,172
) (
23,7
28,9
10)
(25
,940
,417
)
S,G
&A
(1,
868,
388)
(1,
932,
412)
(2,
442,
472)
(5,
048,
046)
(5,
516,
871)
(6,
042,
666)
(6,
565,
634)
EB
ITD
A 1
7,47
0,65
7 1
6,48
3,93
7 1
6,71
6,18
8 2
1,18
6,33
9 2
3,05
1,33
0 2
5,16
1,75
2 2
7,18
1,53
3
Dep
reci
atio
n &
Am
ortiz
atio
n (
3,83
6,21
1) (
3,83
5,79
2) (
4,09
8,28
7) (
5,69
6,42
4) (
6,02
0,20
7) (
6,71
7,83
5) (
7,36
8,56
8)
Ope
rati
ng I
ncom
e (E
BIT
) 1
3,63
4,44
6 1
2,64
8,14
5 1
2,61
7,90
1 1
5,48
9,91
5 1
7,03
1,12
2 1
8,44
3,91
7 1
9,81
2,96
5
Inte
rest
inco
me
207
,274
-
-
-
-
-
-
Inve
stm
ent i
ncom
e 1
06,6
80
101
,631
3
0,56
1 1
52,2
70
161
,515
1
84,2
46
202
,671
Oth
er n
on-o
pera
ting
inco
me
356
,156
-
-
-
-
--
Prov
isio
ns (
272,
393)
-
-
-
--
-
Non
-ope
ratin
g ex
pens
e (
1,29
3,05
3) (
24,9
11)
(53
5,39
4) (
711,
316)
(75
2,30
1) (
824,
000)
(89
5,31
4)
Com
mis
sion
s -
4
16,6
13
333
,145
3
04,5
51
346
,319
3
83,6
13
413
,012
Ear
ning
s be
fore
Min
orit
y in
tere
sts,
Zak
at a
nd T
ax 1
2,73
9,11
0 1
3,14
1,47
8 1
2,44
6,21
3 1
5,23
5,42
0 1
6,78
6,65
5 1
8,18
7,77
7 1
9,53
3,33
3
Prov
isio
n fo
r Z
akat
(29
2,24
9) (
342,
576)
(38
4,63
1) (
396,
121)
(43
6,45
3) (
472,
882)
(50
7,86
7)
Prov
isio
n fo
r T
ax -
-
(
42,0
20)
(76
,177
) (
125,
900)
(18
1,87
8) (
195,
333)
Inco
me
befo
re e
xtra
item
s 1
2,44
6,86
1 1
2,79
8,90
2 1
2,01
9,56
2 1
4,76
3,12
2 1
6,22
4,30
2 1
7,53
3,01
7 1
8,83
0,13
3
Min
ority
inte
rest
-
-
2,1
71
283
,653
3
54,5
66
425
,480
4
68,0
28
Net
inco
me
12,
446,
861
12,
798,
902
12,
017,
391
14,
479,
469
15,
869,
736
17,
107,
537
18,
362,
106
P&
L A
ppro
pria
tion
acc
ount
(SR
000
’s)
2005
2006
2007
2008
F20
09 F
2010
F20
11 F
Beg
inni
ng r
etai
ned
earn
ings
12,
618,
036
13,
320,
211
8,3
39,2
23
8,6
54,3
62
9,0
88,7
46
9,8
82,2
33
12,
448,
363
Net
inco
me
12,
446,
861
12,
798,
902
12,
017,
391
14,
479,
469
15,
869,
736
17,
107,
537
18,
362,
106
Net
Dis
trib
utab
le I
ncom
e 2
5,06
4,89
7 2
6,11
9,11
3 2
0,35
6,61
4 2
3,13
3,83
1 2
4,95
8,48
2 2
6,98
9,77
0 3
0,81
0,46
9
Res
erve
s (
1,24
4,68
6) (
1,27
9,89
0) (
1,20
2,25
2) (
1,44
7,94
7) (
1,58
6,97
4) -
-
Com
mon
div
iden
ds (
10,5
00,0
00)
(11
,500
,000
) (
10,5
00,0
00)
(12
,597
,138
) (
13,4
89,2
75)
(14
,541
,407
) (
16,5
25,8
95)
End
ing
reta
ined
ear
ning
s 1
3,32
0,21
1 8
,339
,223
8
,654
,362
9
,088
,746
9
,882
,233
1
2,44
8,36
3 1
4,28
4,57
4
Sour
ce:
Com
pany
Rep
orts
, Glo
bal R
esea
rch

Global Research - GCC Global Investment House
56 GCC Telecom Sector August 2008
CA
SH F
LO
W S
TA
TE
ME
NT
Saud
i Tel
ecom
- S
TC
(SR
000
’s)
2005
2006
2007
2008
F20
09 F
2010
F20
11 F
Net
Inc
ome
Aft
er T
axes
12,
446,
861
12,
798,
902
12,
017,
391
14,
479,
469
15,
869,
736
17,
107,
537
18,
362,
106
Dep
reci
atio
n &
Am
ortiz
atio
n 3
,836
,211
3
,835
,792
4
,098
,287
5
,696
,424
6
,020
,207
6
,717
,835
7
,368
,568
D
oubt
ful d
ebts
exp
ense
-
435
,602
5
23,0
55
--
--
Inve
stm
ent i
ncom
e -
(
101,
631)
(30
,561
) -
-
-
-
G
ain/
Los
s of
dis
posa
l of
PP&
E -
(
12,6
00)
15,
868
-
-
-
-
Los
ses
on s
ale
of o
ther
inve
stm
ents
-
2,4
50
3,3
75
-
-
-
-
Prov
isio
n fo
r ca
pita
l wor
k in
pro
gres
s -
(
24,0
57)
-
-
-
-
-
Cha
nge
in W
orki
ng C
apit
al -
-
-
-
-
-
-
N
otes
& A
ccou
nt R
ecei
vabl
e (
490,
072)
(75
0,60
7) (
1,55
7,40
4) (
5,30
2,97
7) (
1,55
4,55
6) (
1,28
5,59
1) (
1,07
0,22
6)In
vent
orie
s 6
4,36
2 3
,588
(
217,
975)
(61
5,17
2) (
96,4
11)
(10
7,18
7) (
110,
575)
Adv
ance
d Pa
ymen
ts (
276,
850)
(29
2,22
1) (
253,
022)
(2,
912,
745)
(38
5,64
6) (
428,
748)
(44
2,30
1)O
ther
non
-cur
rent
ass
ets
(43
3,33
8) (
243,
828)
(3,
443,
132)
3,0
55,0
32
(21
9,39
6) (
130,
254)
(12
9,55
4)A
ccou
nts
Paya
bles
(12
2,62
6) (
646,
038)
1,1
22,1
43
3,7
97,8
51
674
,880
7
50,3
08
774
,027
O
ther
pay
able
s 0
2
19,7
19
4,1
16,0
92
(61
6,04
4) 5
54,4
40
609
,884
6
70,8
72
Acc
rued
Exp
ense
s 8
53,1
79
572
,543
1
,837
,445
2
,276
,056
7
71,2
91
857
,495
3
65,7
94
Oth
er c
redi
t bal
ance
s 5
,466
7
5,01
4 3
04,6
45
980
,373
2
55,7
23
286
,797
2
85,2
55
Tot
al C
ash
Fro
m O
pera
tion
s 1
5,88
3,19
3 1
5,87
2,62
8 1
8,53
6,20
7 2
0,83
8,26
6 2
1,89
0,26
7 2
4,37
8,07
8 2
6,07
3,96
7 C
ash
From
Inv
estm
ents
Fixe
d A
sset
s (
2,16
5,13
4) (
3,37
2,94
4) (
8,31
7,38
1) (
8,23
5,83
4) (
20,7
16,4
85)
(9,
296,
184)
(8,
771,
112)
Proj
ects
Und
er-C
onst
ruct
ion
(1,
422,
025)
-
-
(12
,480
,651
) 1
1,42
0,30
1 5
25,0
72
(47
5,42
6)Sh
ort-
term
Inv
estm
ents
(1,
960,
000)
(1,
904,
000)
5,5
99,0
00
(1,
319)
(26
4) (
237)
(18
2)N
on-c
urre
nt li
abili
ties
(21
6,30
2) -
-
6
,497
,865
8
52,4
08
955
,991
9
50,8
51
Inta
ngib
le A
sset
s (
753,
750)
-
(12
,846
,116
) (
17,9
39,1
68)
(4,
769,
211)
(1,
828,
198)
(1,
919,
608)
Inve
stm
ents
in a
ffili
ates
(89
,986
) -
-
(
98,8
76)
(10
8,76
4) (
119,
640)
(13
1,60
5)In
vest
men
ts a
nd a
dvan
ces
55,
649
(48
,941
) (
1,35
4,47
9) (
141,
786)
(15
5,96
5) (
171,
561)
(94
,359
)T
otal
Cas
h F
rom
Inv
estm
ents
(6,
551,
548)
(5,
325,
885)
(16
,918
,976
) (
32,3
99,7
69)
(13
,477
,979
) (
9,93
4,75
7) (
10,4
41,4
39)
Shor
t-te
rm d
ebt
-
- 5
60,4
48
2,8
92,8
52
(49
5,30
0) (
671,
600)
(80
7,40
0)L
ong-
term
deb
t-
- 1
3,01
9,30
3 1
2,56
0,69
7 4
,000
,000
(
1,00
0,00
0) 1
,000
,000
C
hang
e in
Equ
ity -
-
-
-
-
-
-
Div
iden
ds P
aid
(10
,340
,529
) (
11,6
42,2
43)
(10
,508
,146
) (
12,6
53,9
98)
(13
,489
,275
) (
14,5
41,4
07)
(16
,525
,895
)T
rans
latio
n D
iffe
renc
e -
-
1
57,4
71
88,
578
88,
578
53,
147
Min
ority
Int
eres
t 1
5,62
9 9
,648
,661
2
,416
,073
2
,416
,073
1
,449
,644
T
otal
Cas
h F
rom
Fin
anci
ng (
10,3
40,5
29)
(11
,642
,243
) 3
,087
,234
1
2,60
5,68
3 (
7,47
9,92
5) (
13,7
08,3
57)
(14
,830
,505
)
Cha
nge
in C
ash
& E
quiv
alen
ts (
1,00
8,88
4) (
1,09
5,50
0) 4
,704
,465
1
,044
,180
9
32,3
63
734
,964
8
02,0
23
Beg
inni
ng C
ash
Bal
ance
5,0
13,7
05
4,0
04,8
21
2,9
09,3
21
7,6
13,7
86
8,6
57,9
66
9,5
90,3
29
10,
325,
293
End
ing
Cas
h B
alan
ce 4
,004
,821
2
,909
,321
7
,613
,786
8
,657
,966
9
,590
,329
1
0,32
5,29
3 1
1,12
7,31
6 So
urce
: C
ompa
ny R
epor
ts, G
loba
l Res
earc
h
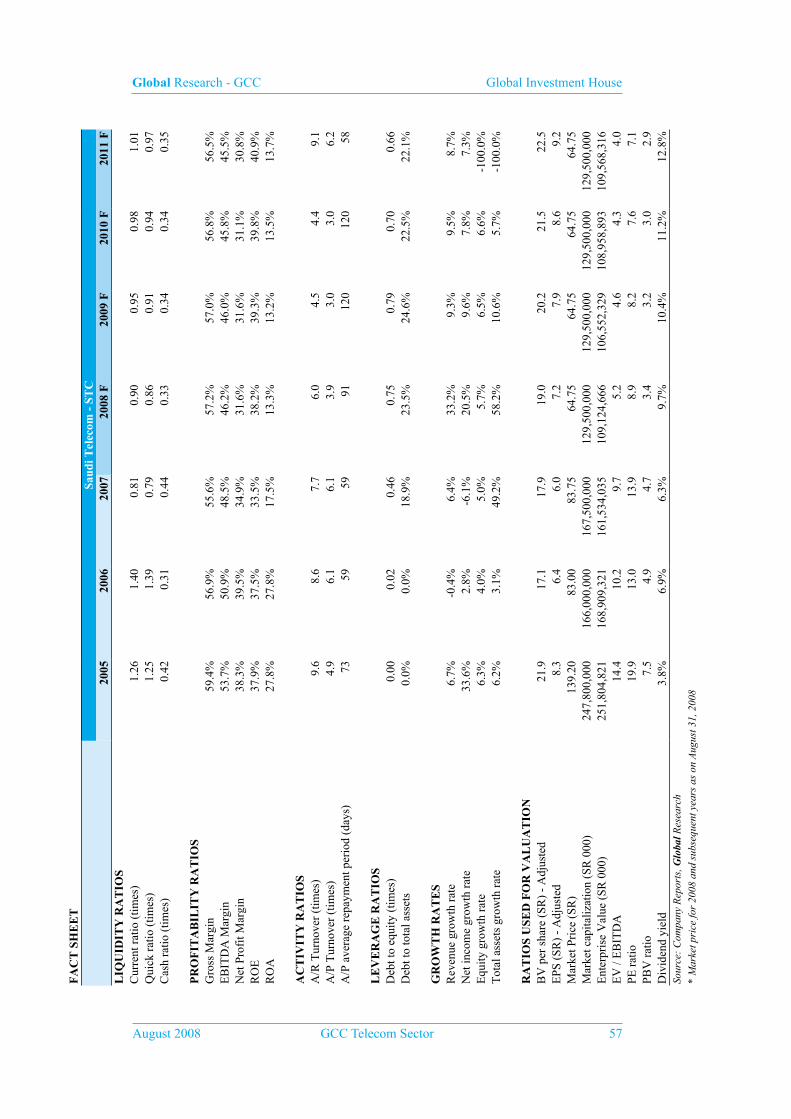
Global Research - GCC Global Investment House
August 2008 GCC Telecom Sector 57
FA
CT
SH
EE
TSa
udi T
elec
om -
ST
C20
0520
0620
0720
08 F
2009
F20
10 F
2011
FL
IQU
IDIT
Y R
AT
IOS
Cur
rent
rat
io (
times
) 1
.26
1.4
0 0
.81
0.9
0 0
.95
0.9
8 1
.01
Qui
ck r
atio
(tim
es)
1.2
5 1
.39
0.7
9 0
.86
0.9
1 0
.94
0.9
7 C
ash
ratio
(tim
es)
0.4
2 0
.31
0.4
4 0
.33
0.3
4 0
.34
0.3
5
PR
OF
ITA
BIL
ITY
RA
TIO
SG
ross
Mar
gin
59.4
%56
.9%
55.6
%57
.2%
57.0
%56
.8%
56.5
%E
BIT
DA
Mar
gin
53.7
%50
.9%
48.5
%46
.2%
46.0
%45
.8%
45.5
%N
et P
rofi
t Mar
gin
38.3
%39
.5%
34.9
%31
.6%
31.6
%31
.1%
30.8
%R
OE
37
.9%
37.5
%33
.5%
38.2
%39
.3%
39.8
%40
.9%
RO
A
27.8
%27
.8%
17.5
%13
.3%
13.2
%13
.5%
13.7
%
AC
TIV
ITY
RA
TIO
SA
/R T
urno
ver
(tim
es)
9.6
8
.6
7.7
6
.0
4.5
4
.4
9.1
A
/P T
urno
ver
(tim
es)
4.9
6
.1
6.1
3
.9
3.0
3
.0
6.2
A
/P a
vera
ge r
epay
men
t per
iod
(day
s) 7
3 5
9 5
9 9
1 1
20
120
5
8
LE
VE
RA
GE
RA
TIO
SD
ebt t
o eq
uity
(tim
es)
0.0
0 0
.02
0.4
6 0
.75
0.7
9 0
.70
0.6
6 D
ebt t
o to
tal a
sset
s 0.
0%0.
0%18
.9%
23.5
%24
.6%
22.5
%22
.1%
GR
OW
TH
RA
TE
SR
even
ue g
row
th r
ate
6.7%
-0.4
%6.
4%33
.2%
9.3%
9.5%
8.7%
Net
inco
me
grow
th r
ate
33.6
%2.
8%-6
.1%
20.5
%9.
6%7.
8%7.
3%E
quity
gro
wth
rat
e6.
3%4.
0%5.
0%5.
7%6.
5%6.
6%-1
00.0
%T
otal
ass
ets
grow
th r
ate
6.2%
3.1%
49.2
%58
.2%
10.6
%5.
7%-1
00.0
%
RA
TIO
S U
SED
FO
R V
AL
UA
TIO
NB
V p
er s
hare
(SR
) -
Adj
uste
d 21
.917
.117
.919
.020
.221
.522
.5E
PS (
SR)
- A
djus
ted
8.3
6.4
6.0
7.2
7.9
8.6
9.2
Mar
ket P
rice
(SR
)13
9.20
83
.00
83.7
5 64
.75
64.7
5 64
.75
64.7
5 M
arke
t cap
italiz
atio
n (S
R 0
00)
247,
800,
000
166,
000,
000
167,
500,
000
129,
500,
000
129,
500,
000
129,
500,
000
129,
500,
000
Ent
erpr
ise
Val
ue (
SR 0
00)
251,
804,
821
168,
909,
321
161,
534,
035
109,
124,
666
106,
552,
329
108,
958,
893
109,
568,
316
EV
/ E
BIT
DA
14.4
10
.2
9.7
5.2
4.6
4.3
4.0
PE r
atio
19.9
13
.0
13.9
8.
9 8.
2 7.
6 7.
1 PB
V r
atio
7.5
4.9
4.7
3.4
3.2
3.0
2.9
Div
iden
d yi
eld
3.8%
6.9%
6.3%
9.7%
10.4
%11
.2%
12.8
%So
urce
: C
ompa
ny R
epor
ts, G
loba
l Res
earc
h
* M
arke
t pri
ce fo
r 20
08 a
nd s
ubse
quen
t yea
rs a
s on
Aug
ust 3
1, 2
008

Global Research - GCC Global Investment House
58 GCC Telecom Sector August 2008
Etihad Etisalat Company - MobilyTickers7020.SE (Reuters)EEC AB (Bloomberg)
Listing:Saudi Stock Exchange
Current Price: SR46 ( August 31, 2008)
Key Data
EPS* (SR) 3.8 Avg. daily vol. (‘000) 763.4
BVPS* (SR) 15.6 52 week Hi / Lo (SR) 76.75/40.25
P/E (x) 12.2 Market Cap (SR mn) 23,000
P/BV (x) 3.0 Target Price (SR) 68.84
Source: Global Research * Projected (2008)
Background
• Etihad Etisalat Company (Mobily), is Saudi’s second mobile operator. The company was founded by the UAE-based, Emirates Telecommunications Corporation (Etisalat), which won the second GSM license in Saudi Arabia for a period of 25 years, thus ending Saudi Telecom Company’s monopoly in the wireless business segment. Etisalat paid US$3.45bn for the license which included a 3G license as well.
• Mobily launched its services in May 2005, and ended the year with a market share of 16% of the Saudi mobile market. Within three years of operations, the company managed to grab a market share of 41% by the end of 2007, with 11.1mn subscribers. In addition, it broke-even in 2006 with an EBITDA of SR2bn and net income of SR700.36mn.
• Mobily was the first company to introduce Blackberry services in Saudi Arabia, in cooperation with Research in Motion (RIM), and Emitac Mobile Solutions (EMS). It was also the first mobile operator in the Kingdom that introduced the value added services of MMS, locations based service (LBS), international roaming for prepaid SIM cards in addition to GPRS and GPRS EDGE roaming, as well as other services such as “kalemni” (call me), enabling disconnected mobile to send free SMS. Similarly, the company was the first Saudi mobile operator to launch in-flight calls aboard in select airlines, through an agreement with AeroMobile, a specialized aviation mobile operator, and launched the first video mail service in the Kingdom.
• The company was also the first to launch 3.5G services in the kingdom in June 2006. The infrastructure was set up by Erikson, Nokia, and Chinese Huawei. In November 2007, the company began the first phase of the second expansion of its 3.5G network across Saudi Arabia in order to keep pace with the latest 3.5G technologies and expand its network to reach new cities and provinces. Mobily has allocated SR1bn for the second expansion plan that started in collaboration with Ericson, Nokia and Huawei.
BUYRecommendation

Global Research - GCC Global Investment House
August 2008 GCC Telecom Sector 59
• Mobily is keen on enhancing its market position in the broadband internet services market. In June 2007, the company doubled the broadband mobile Internet speed on its network, with an HSDPA (high-speed downlink packet access) speed of 3.6 Mbps. Later in September 2007, the company introduced a 7.2 Mbps modems and data service SIM cards also based on HSDPA. In November 2007, Mobily launched the Mobily Connect router, which is based on Huawei’s E960 3G router, and distributes broadband Internet service using WiFi to serve up to 32 users. Mobily’s subscribers in the mobile Internet service has exceeded 100,000 by the end of 2007.
• The company underwent an IPO on the Saudi Stock Exchange in October 2004, which raised US$267mn for 20% of its shares. In April 2008, Mobily’s founders floated another 20% for public subscription in order to comply with the royal decree which stipulates floating 20% of the company’s equity in the third year after formation. Accordingly, Etisalat’s total share in the company has been reduced to 26.25% from 35%.
Chart 01: Old Structure Chart02: New Structure
Source: Company Releases, Global Research
• Mobily’s started with a paid-up capital of SR5bn with a par value of SR50 per share. In April 2006, the company effected a 1:5 stock split increasing the number of outstanding shares to 500mn with a par value of SR10 per share. During 2008, the BOD met and approved a 40% rights issue that will increase the company’s capital to SR7bn. After the rights issue, the founders will hold 60% of the company’s capital and the public will hold 40%.
Etisalat 35%
Others 45%
Public 20%Etisalat 26%
Others 34%
Public 40%

Global Research - GCC Global Investment House
60 GCC Telecom Sector August 2008
Analysis of operations
Mobily managed to grab a 41% market share by the end of 2007…The Saudi mobile market has been a monopoly since Saudi Telecom (STC) was established in 1998, however after Mobily won the second license and launched its operation in 2005, STC has been losing market share to Mobily which managed to grab a market share of 16% in the first year of operations and increased it to 41% in 2007. In March 2007, the duopoly was broken when a consortium led by Zain of Kuwait won the third license. By the end of 2007, mobile penetration in Saudi reached 116% compared to 82% in 2006.
Chart 03: KSA Mobile subscribers & penetration rates
-
5,000
10,000
15,000
20,000
25,000
30,000
2004 2005 2006 2007
In '0
00
0%
20%
40%
60%
80%
100%
120%
140%
STC Subscribers Mobily Subscribers Mobile Penetration
Source: CITC, Companies’ reports, Global Research
Broadband penetration increasing, however lower than world average… Broadband subscribers grew from 24,000 subscribers in 2004 to 623,000 subscribers in 2007, with approximately a 10 fold increase on y-o-y basis. Despite the remarkable growth, still KSA broadband penetration rate, which stood at 2.5% in 2007, is considered a very low rate when compared to both the world average of 5.25%.
Chart 04: Broadband subscribers & penetration rates
0
100
200
300
400
500
600
700
2004 2005 2006 2007
In'0
00
0 .0%
0.5%
1.0%
1.5%
2.0%
2.5%
3.0%
T o ta l Bro a d b a n d Su b s c rib ers Bro a d b a n d Pe n e t ra tio n
Source: CITC, Global Research
Strategic alliances to expand value added services…Mobily has been targeting the data and internet segment aggressively. In Sep. 2007, the company signed a memorandum of understanding (MOU) to buy a 99.9% stake of the local
Global Research - GCC Global Investment House
August 2008 GCC Telecom Sector 61
data provider Bayanat Al-Oula for SR1.5bn (US$400mn). In Mar. 2008, the acquisition was approved by the Communications and Information Technology Commission. The acquisition increases Mobily’s share in the 12,000-kilometer national fiber optic project from 33% to 66%. Bayanat had recently entered into a strategic arrangement with Samsung to roll out the largest WiMAX network in the region and start offering the service commercially in the three main cities Riyadh, Jeddah and Dammam in the first phase. The acquisition should enhance the company’s position in the wireless broadband internet segment, with the WiMAX technology along with Mobily’s current HSDPA technology. During 2007, the company also set up a fully owned subsidiary in India, Mobily InfoTech, which will provide information technology and consulting services for the parent company from India. In 2008, Mobily got the approval to acquire 96% of Zagel International Communication Network Company which is specialized in providing internet services in Saudi Arabia for SR80mn (U$21.33mn).
Speeding with fiber optics locally…Mobily has entered into landmark infrastructure projects that are expected to support the company’s ongoing plans of providing highly sophisticated and advanced services at higher speed. In February 2006, the company entered into a deal with two other companies, Integrated Telecom Company and Bayanat Al-Oula for Network Services, to build, deploy and operate the Kingdom’s largest fiber optic network with a total value of SR1bn (US$266mn). The fiber optic network is expected to cover 12,600 km long with seven rings and covering the whole of Saudi Arabia. In January 2007, Integrated Telecom Company and Bayanat Al-Oula for Network Services announced the completion of the first phase of their fiber optic network project, which covers the major three rings of central, western and eastern regions. The other four rings are expected to be completed by October 2008.
And internationally…Mobily has also signed a memorandum of understanding with U.A.E-based Etisalat and Egypt’s Etisalat Misr to set up a high-capacity fiber optics cable (E-Cable) at a total cost of SR562.5mn (US$150mn). The cable will run from Fujairah in the United Arab Emirates, across Saudi Arabia, passing through Jeddah, and through the Suez Canal and Alexandria in Egypt, by Italy in the Mediterranean and entering Europe through France. Upon completion, which is expected by the end of Q2 2009, the E-Cable will allow faster browsing speeds and more cost-effective rates for regional and international calling. The E-Cable will also allow more internet and voice traffic to transit between Asia and Europe through the Middle East.Financial performance
Revenues grew by 44.5% in 2007…Mobily reported services revenues of SR8.4bn for 2007, an increase of 44.5% over 2006 revenues. Airtime time usage was the main contributor to revenues, contributing 76% to total revenues in 2007, and increased by 46.9% on a y-o-y basis. Interconnection revenues, which formed 17% of total revenues, increased by 31.7% on y-o-y basis. Other revenues, which constitutes revenues from other value added services and formed 1.6% of revenues, surged by 180.7% in 2007. We expect the share of value added services in revenues to increase going forward considering the company’s planned infrastructure upgrades which will allow the company to expand its broadband internet services and provide higher quality services at higher speed.

Global Research - GCC Global Investment House
62 GCC Telecom Sector August 2008
Chart 05: Revenue Mix
-
1,000
2,000
3,000
4,000
5,000
6,000
7,000
8,000
9,000
2005 2006 2007
SRm
n
Others
Visitor roaming
Interconnect revenue
Usage
Rental fees
Activation fees
Source: Company Reports, Global Research
Higher ARPUs from broadband services…With increasing competition in the market, Mobily’s ARPU declined from SR80 in 2006 to SR64. We expect further pressure on ARPUs going forward with the entry of Zain, the third mobile operator, which launched its operations in August 2008. However, we do not expect a steep decline in ARPUs since we do not foresee price wars in the market, we believe that competition will be leading to higher quality value added services rather than slashing rates. In addition, Mobily is planning to increase its post-paid subscribers base, and expand its broadband internet services after the completion of its fiber optic cable by the end of 2008, and the completion of the E-cable project by the end of Q2 2009. Accordingly, giving higher ARPUs from the postpaid segment, and from broadband services, we expect a slight drop in 2008 ARPU, then we expect it to pick up from 2009 onwards.
Chart 06: Revenues & ARPUs
8064 58 63 66 69
02468
101214
2006 2007 2008F 2009F 2010F 2011F
SRbn
020406080100
SR
Revenues ARPU
Source: Company Reports, Global Research
Total costs grew by 41.5% in 2007…Total costs of services stood at SR3.8bn in 2007, increasing by 41.5% over 2006 total costs of SR2.7bn. Interconnection expenses formed 46.5% of total costs, and increased by 42% on a y-o-y basis. Government revenue share formed 25% of total costs, and increased by 113.1% on a y-o-y basis. We expect government revenue share costs to keep increasing going forward as per the revenue sharing agreement with the government which requires the company to pay fees equivalent to 5% of net revenues in the first year of operation, 10% in the second year, and 15% in the third year onward. In addition, the company pays annual license fees of 1% of net revenues.

Global Research - GCC Global Investment House
August 2008 GCC Telecom Sector 63
Chart 07: Costs Breakdown
Consumption of Inventories
Interconnection Expenses
National and International Roaming Costs
License Fees
Government Revenue Share
Frequency Charge and Rental
Transmission and International Gateway Cost
Technical Repair & Maintenance Cost
Sites Rental
Others
2007 2010 F
Source: Company Reports, Global Research
National and international roaming costs formed 3% of total costs in 2007 compared to 14% in 2006. Transmission and international gateway costs formed 7% of total costs in 2007 compared to 8% in 2006. We expect a decline in transmission and international gateway costs as Mobily completes the fiber optic and E-Cable projects which will allow for more cost-effective rates for regional and international calling. Similarly, we expect a decline in rental fees as the company develops its own fiber optic network.
Improving gross profit margin….Costs to revenues ratio stood at 44.9% in 2007, down from 45.9% in 2006. Accordingly, Gross margin improved from 54.1% in 2006 to 55.1% in 2007. Going forward, we expect the ratio to come down with the expected decline in international gateway costs and rental fees, along with achieving economies of scale as the company is still in its growth phase.
Chart 08: Operating Efficiency
54.1%55.1% 55.5%
56.5%58.0% 58.4%
38%
40%
42%
44%
46%
48%
2006 2007 2008F 2009F 2010F 2011F50%
52%
54%
56%
58%
60%
Cost to Rev. Ratio Gross Profit Margin
Source: Company Reports, Global Research
Increasing selling, marketing, and G&A expenses …Selling and marketing expenses stood at SR466.5mn in 2007, increasing by 27.8% on a y-o-y basis, while general and administrative expenses (G&A) increased by 40.7% to reach SR943mn. Staff expenses formed 59% of G&A expenses in 2007, and increased by 55% on a y-o-y basis. G&A expenses also include annual management fees of SR37.5mn (US$10mn) paid to the Emirates Telecommunication Corporation (Etisalat). Given the expected increase in competition and the expansion in the company’s services, we expect further increases in selling, marketing, and G&A expenses.

Global Research - GCC Global Investment House
64 GCC Telecom Sector August 2008
Improving EBITDA margin …EBITDA margin stood at 34.9% in 2007, improving slightly from 34.3% in 2006. Going forward, we expect EBITDA margin to improve further. The improvement will most likely result from the expected decline in operational costs as mentioned earlier after the completion of the fiber optic network and the E-Cable in 2008, and 2009 respectively. We expect EBITDA to grow at CAGR of 11.2% during our forecast period (2008-2011E).
Chart 09: EBITDA
34.9% 35.2%
36.6%
38.5%39.0%
-
1
2
3
4
5
6
2006 2007 2008F 2009F 2010F 2011F
SRbn
31.0%32.0%33.0%34.0%35.0%36.0%37.0%38.0%39.0%40.0%
EBITDA EBITDA margin
34.3%
Source: Company Reports, Global Research
Improving Profitability…The company reported net income of SR1.38bn in 2007 compared to SR700.4mn in 2006, with a net profit margin of 16.3% compared to a net profit margin of 12% in 2006. Return on Equity stood at 23.3% in 2007, while Return on Assets stood at 6.9%. Return on Equity is expected to decline in 2008, as the company increases its capital base by 40% to reach SR7bn. We expect Net profit to grow at CAGR of 14.3% during our forecast period (2008-2011E).
Chart 10: Profitability
12.0%16.3% 18.1% 19.4% 21.0% 21.8%
0.00.51.01.52.02.53.0
SRbn
0.0%
5.0%
10.0%
15.0%
20.0%
25.0%
Net Profit
2006
2007
2008
F
2009
F
2010
F
2011
F20
0620
0720
08F
2009
F
2010
F
2011
F
NPM
15.5%
23.3% 24.9% 24.5% 23.7% 22.5%
0.0%
5.0%
10.0%
15.0%
20.0%
25.0%
30.0%
0.0%
2.0%
4.0%
6.0%
8.0%
10.0%
ROE ROA
Source: Company Reports, Global Research
Total assets grew by 12.4% in 2007…Mobily’s total assets stood at SR19.8bn in 2007, and grew by 12.4% on a y-o-y basis. Net license acquisition fees constituted 56.8% of total assets. License acquisition fees are amortized over the license period of 25 years. Net property and equipment formed 27.6% of total assets. We expect Mobily’s balance sheet to grow by 17.3% in 2008 on the back of the 40% rights issue which will increase the capital base by SR2bn. We expect total assets to grow at CAGR of 7.4% during our forecast period (2008-2011E).

Global Research - GCC Global Investment House
August 2008 GCC Telecom Sector 65
Chart 11: Asset Structure
11.8 11.3 10.8 10.3 9.7 9.2
3.8 5.5 7.2 8.6 9.5 10.02.0
3.16.7
8.6 10.2 11.4
-
5.0
10.0
15.0
20.0
25.0
30.0
35.0
2006 2007 2008F 2009F 2010F 2011F
SR b
n
Net License Fees Property & Equipment Others
Source: Company Reports, Global Research
During 2007, capex stood at SR2bn, increasing by 48% from SR1.5bn in 2006. Capex to sales ratio stood at 25% in 2007. We expect a gradual decline in capex to sales ratio to reach 9% by 2011.
Chart 12: Capex
25%
13%16%
20%24%
25%
-500,000
1,000,0001,500,0002,000,0002,500,0003,000,000
2006 2007 2008F 2009F 2010F 2011F
SR'0
00
0%5%10%15%20%25%30%
Capex Capex to Sales
Source: Company Reports, Global Research
New subsidiary in India…The company reported investments of SR1.84mn on its balance sheet in 2007, representing Mobily’s investment in “Mobily InfoTech India”. In March 2008, Mobily announced that it plans to invest an additional SR66mn over the next three years to expand its operations in India.
Declining debt to equity ratio…Debt to equity ratio stood at 1.5x in 2007, declining from 2x in 2006. The company’s total debt amounted to SR8.9bn in 2007. Mobily signed a long term Islamic financing agreements for SR10.78bn. The company used the proceeds to repay its short term loans and the founding shareholders’ loan which stood at SR7.8bn and SR1.6bn in 2006 respectively. In April 2008, Mobily raised SR1.5bn one-year Islamic financing facility, from Samba Financial Group, the Saudi British Bank and National Commercial Bank to finance Bayanat Al Oula acquisition.

Global Research - GCC Global Investment House
66 GCC Telecom Sector August 2008
Chart 13: Debt to equity
9.4 8.9 9.310.4 10.0 9.03
4.55.9
7.89.8
11.913.7
-
5.0
10.0
15.0
2006 2007 2008F 2009F 2010F 2011F
SR b
n
Debt Equity
Source: Company Reports, Global Research
Revenues grew by 24% in H1 2008…Mobily reported revenues of SR4.8bn for H1 2008, increasing by 24.2% over reported revenues in the same comparative period in 2007. Net profit grew by 39.7% during the same period from SR554.5mn in H1 2007 to SR774.4mn in H1 2008.
Outlook and Valuation• Although mobile penetration rates in Saudi Arabia crossed the 100% mark in 2007, we
believe that there is still a room for growth as penetration rates are relatively lower than its GCC peers. In addition, a third mobile operator, Zain (MTC) joined the market in 2008 which will force market players to strive to offer new and innovative services at the best prices, thus attracting more demand. We expect the entry of Zain to have a greater effect on the operator with the largest market share, STC, than on Mobily. Though, we expect further reduction in mobile tariffs with increased competition, we believe that the focus on higher quality value added services will be the main differentiator between the competitors.
• Mobily has been also expanding broadband services. In 2007, it doubled the broadband mobile Internet speed and introduced a 7.2 Mbps modems and data service SIM cards based on HSDPA (high-speed downlink packet access). Going forward, we believe that key growth areas for the company would be broadband and 3.5G services, especially with a penetration of only 2.5% in Saudi Arabia which is lagging behind many developed countries. We believe that Mobily’s latest acquisition of “Bayanat Al Oula” and “Zagel” will strengthen its position in the wireless broadband internet segment. The company’s expected capital increase which will add SR2bn to Mobily’s current SR5bn capital should also support the company’s future investments and expansions.
• At the current market price (Aug.31 2008), Mobily trades at 12.2x and 10.x its earnings and 3.0x and 2.3x its book value for 2008F and 2009F respectively. We have used the Discounted Cash Flow (DCF) to value Mobily. The DCF model is based on a 4-year (FY2008-FY2011) explicit forecast period for the Free Cash Flow to Firm (FCFF). Our DCF valuation estimates the fair value of Mobily’s stock at SR68.84, which is 49.6% higher than the current market price of the stock. We therefore reiterate our “Buy” recommendation for Mobily.

Global Research - GCC Global Investment House
August 2008 GCC Telecom Sector 67
BA
LA
NC
E S
HE
ET
Eti
had
Eti
sala
t C
ompa
ny “
Mob
ily”
SR’0
0020
0520
0620
0720
08 F
2009
F20
10 F
2011
F
Cas
h an
d C
ash
Equ
ival
ents
185
,172
5
47,5
23
703
,198
1
,604
,602
2
,761
,420
3
,916
,295
4
,676
,361
Acc
ount
s R
ecei
vabl
e (N
et)
166
,822
7
34,0
66
1,4
59,7
33
2,3
48,3
07
2,6
83,0
26
2,7
73,8
44
2,8
69,8
71
Due
fro
m R
elat
ed P
artie
s -
5
,162
7
1,06
1 1
03,9
39
117
,573
1
22,8
95
128
,793
Inve
ntor
ies
32,
075
38,
048
69,
190
92,
543
102
,406
1
03,2
31
107
,156
Oth
er C
urre
nt A
sset
s 7
82,7
65
716
,688
8
10,2
95
1,0
53,3
84
1,3
69,3
99
1,7
11,7
48
2,0
54,0
98
Tot
al C
urre
nt A
sset
s 1
,166
,834
2
,041
,487
3
,113
,477
5
,202
,775
7
,033
,825
8
,628
,013
9
,836
,280
Prop
erty
& E
quip
men
t (N
et)
2,7
23,8
40
3,8
47,5
32
5,4
78,5
52
7,2
25,7
64
8,6
17,0
85
9,5
05,4
97
9,9
78,5
90
Lic
ense
Acq
uisi
tion
Fees
(N
et)
12,
313,
626
11,
800,
160
11,
286,
694
10,
773,
228
10,
259,
762
9,7
46,2
96
9,2
32,8
30
Inve
stm
ents
-
-
1,8
36
1,5
23,8
36
1,5
45,8
36
1,5
67,8
36
1,5
67,8
36
Tot
al N
on C
urre
nt A
sset
s 1
5,03
7,46
6 1
5,64
7,69
2 1
6,76
7,08
2 1
9,52
2,82
8 2
0,42
2,68
3 2
0,81
9,62
9 2
0,77
9,25
6
Tot
al A
sset
s 1
6,20
4,30
0 1
7,68
9,17
9 1
9,88
0,55
9 2
4,72
5,60
3 2
7,45
6,50
7 2
9,44
7,64
2 3
0,61
5,53
5
Shor
t-T
erm
Loa
ns 7
,348
,129
7
,839
,943
-
1
,500
,000
1
,500
,000
-
-
Cur
rent
por
tion
of L
ong
Ter
m L
oans
-
-
1,0
10,6
25
935
,455
9
35,4
55
935
,455
9
35,4
55
Cre
dito
rs 8
76,1
18
2,5
26,0
19
3,0
76,0
67
4,4
88,3
51
4,8
64,2
99
4,9
03,4
91
5,0
89,9
09
Due
to R
elat
ed P
artie
s 1
93,2
51
179
,335
1
11,4
85
115
,944
1
20,5
82
125
,406
1
30,4
22
Oth
er C
urre
nt L
iabi
litie
s 2
18,0
17
320
,294
6
23,6
87
636
,161
6
48,8
84
661
,862
6
75,0
99
Acc
rued
Exp
ense
s 2
,133
,514
6
77,5
13
1,2
07,4
63
2,3
13,5
83
1,5
36,0
94
1,8
06,5
49
1,8
75,2
30
Tot
al C
urre
nt L
iabi
litie
s 1
0,76
9,02
9 1
1,54
3,10
4 6
,029
,327
9
,989
,494
9
,605
,314
8
,432
,762
8
,706
,113
Prov
isio
n fo
r E
mpl
oyee
s’ E
nd o
f Se
rvic
e B
enef
its 2
,650
1
3,09
6 2
6,34
9 4
0,92
7 5
6,96
3 7
4,60
3 9
4,00
7
Foun
ding
Sha
reho
lder
s’ L
oan
1,6
00,0
00
1,6
00,0
00
-
-
-
-
-
Lon
g T
erm
Deb
t -
-
7
,912
,356
6
,901
,731
7
,966
,277
9
,030
,822
8
,095
,367
Tot
al N
on C
urre
nt L
iabi
litie
s 1
,602
,650
1
,613
,096
7
,938
,705
6
,942
,658
8
,023
,240
9
,105
,425
8
,189
,374
Tot
al L
iabi
litie
s 1
2,37
1,67
9 1
3,15
6,20
0 1
3,96
8,03
2 1
6,93
2,15
2 1
7,62
8,55
4 1
7,53
8,18
7 1
6,89
5,48
7
Paid
up
Cap
ital
5,0
00,0
00
5,0
00,0
00
5,0
00,0
00
5,0
00,0
00
5,0
00,0
00
5,0
00,0
00
5,0
00,0
00
Res
erve
s -
-
1
37,9
55
326
,047
5
54,4
98
812
,648
1
,093
,707
Prop
osed
Div
iden
ds -
-
-
2
50,0
00
500
,000
1
,000
,000
1
,250
,000
Ret
aine
d E
arni
ngs/
Acc
umul
ated
Los
ses
(1,
167,
379)
(46
7,02
1) 7
74,5
72
2,2
17,4
04
3,7
73,4
56
5,0
96,8
07
6,3
76,3
41
Tot
al S
hare
hold
ers’
Equ
ity
3,8
32,6
21
4,5
32,9
79
5,9
12,5
27
7,7
93,4
51
9,8
27,9
54
11,
909,
455
13,
720,
048
Tot
al L
iabi
litie
s an
d Sh
areh
olde
rs’
Equ
ity
16,
204,
300
17,
689,
179
19,
880,
559
24,
725,
603
27,
456,
507
29,
447,
642
30,
615,
535
Sour
ce:
Com
pany
Rep
orts
, Glo
bal R
esea
rch
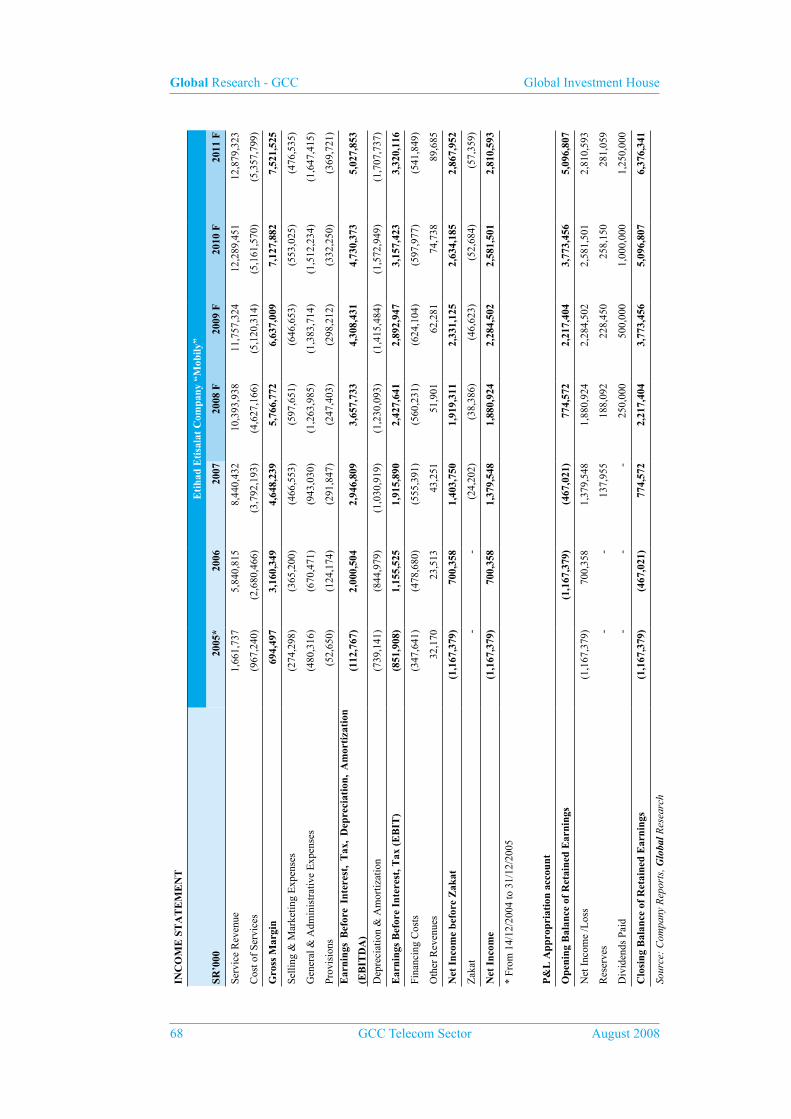
Global Research - GCC Global Investment House
68 GCC Telecom Sector August 2008
INC
OM
E S
TA
TE
ME
NT
Eti
had
Eti
sala
t C
ompa
ny “
Mob
ily”
SR’0
0020
05*
2006
2007
2008
F20
09 F
2010
F20
11 F
Serv
ice
Rev
enue
1,6
61,7
37
5,8
40,8
15
8,4
40,4
32
10,
393,
938
11,
757,
324
12,
289,
451
12,
879,
323
Cos
t of
Serv
ices
(96
7,24
0) (
2,68
0,46
6) (
3,79
2,19
3) (
4,62
7,16
6) (
5,12
0,31
4) (
5,16
1,57
0) (
5,35
7,79
9)
Gro
ss M
argi
n 6
94,4
97
3,1
60,3
49
4,6
48,2
39
5,7
66,7
72
6,6
37,0
09
7,1
27,8
82
7,5
21,5
25
Selli
ng &
Mar
ketin
g E
xpen
ses
(27
4,29
8) (
365,
200)
(46
6,55
3) (
597,
651)
(64
6,65
3) (
553,
025)
(47
6,53
5)
Gen
eral
& A
dmin
istr
ativ
e E
xpen
ses
(48
0,31
6) (
670,
471)
(94
3,03
0) (
1,26
3,98
5) (
1,38
3,71
4) (
1,51
2,23
4) (
1,64
7,41
5)
Prov
isio
ns (
52,6
50)
(12
4,17
4) (
291,
847)
(24
7,40
3) (
298,
212)
(33
2,25
0) (
369,
721)
Ear
ning
s B
efor
e In
tere
st,
Tax
, D
epre
ciat
ion,
Am
orti
zati
on
(EB
ITD
A)
(11
2,76
7) 2
,000
,504
2
,946
,809
3
,657
,733
4
,308
,431
4
,730
,373
5
,027
,853
Dep
reci
atio
n &
Am
ortiz
atio
n (
739,
141)
(84
4,97
9) (
1,03
0,91
9) (
1,23
0,09
3) (
1,41
5,48
4) (
1,57
2,94
9) (
1,70
7,73
7)
Ear
ning
s B
efor
e In
tere
st, T
ax (
EB
IT)
(85
1,90
8) 1
,155
,525
1
,915
,890
2
,427
,641
2
,892
,947
3
,157
,423
3
,320
,116
Fina
ncin
g C
osts
(34
7,64
1) (
478,
680)
(55
5,39
1) (
560,
231)
(62
4,10
4) (
597,
977)
(54
1,84
9)
Oth
er R
even
ues
32,
170
23,
513
43,
251
51,
901
62,
281
74,
738
89,
685
Net
Inc
ome
befo
re Z
akat
(1,
167,
379)
700
,358
1
,403
,750
1
,919
,311
2
,331
,125
2
,634
,185
2
,867
,952
Zak
at -
-
(
24,2
02)
(38
,386
) (
46,6
23)
(52
,684
) (
57,3
59)
Net
Inc
ome
(1,
167,
379)
700
,358
1
,379
,548
1
,880
,924
2
,284
,502
2
,581
,501
2
,810
,593
* Fr
om 1
4/12
/200
4 to
31/
12/2
005
P&
L A
ppro
pria
tion
acc
ount
Ope
ning
Bal
ance
of
Ret
aine
d E
arni
ngs
(1,
167,
379)
(46
7,02
1) 7
74,5
72
2,2
17,4
04
3,7
73,4
56
5,0
96,8
07
Net
Inc
ome
/Los
s (
1,16
7,37
9) 7
00,3
58
1,3
79,5
48
1,8
80,9
24
2,2
84,5
02
2,5
81,5
01
2,8
10,5
93
Res
erve
s -
-
1
37,9
55
188
,092
2
28,4
50
258
,150
2
81,0
59
Div
iden
ds P
aid
-
-
-
250
,000
5
00,0
00
1,0
00,0
00
1,2
50,0
00
Clo
sing
Bal
ance
of
Ret
aine
d E
arni
ngs
(1,
167,
379)
(46
7,02
1) 7
74,5
72
2,2
17,4
04
3,7
73,4
56
5,0
96,8
07
6,3
76,3
41
Sour
ce:
Com
pany
Rep
orts
, Glo
bal R
esea
rch
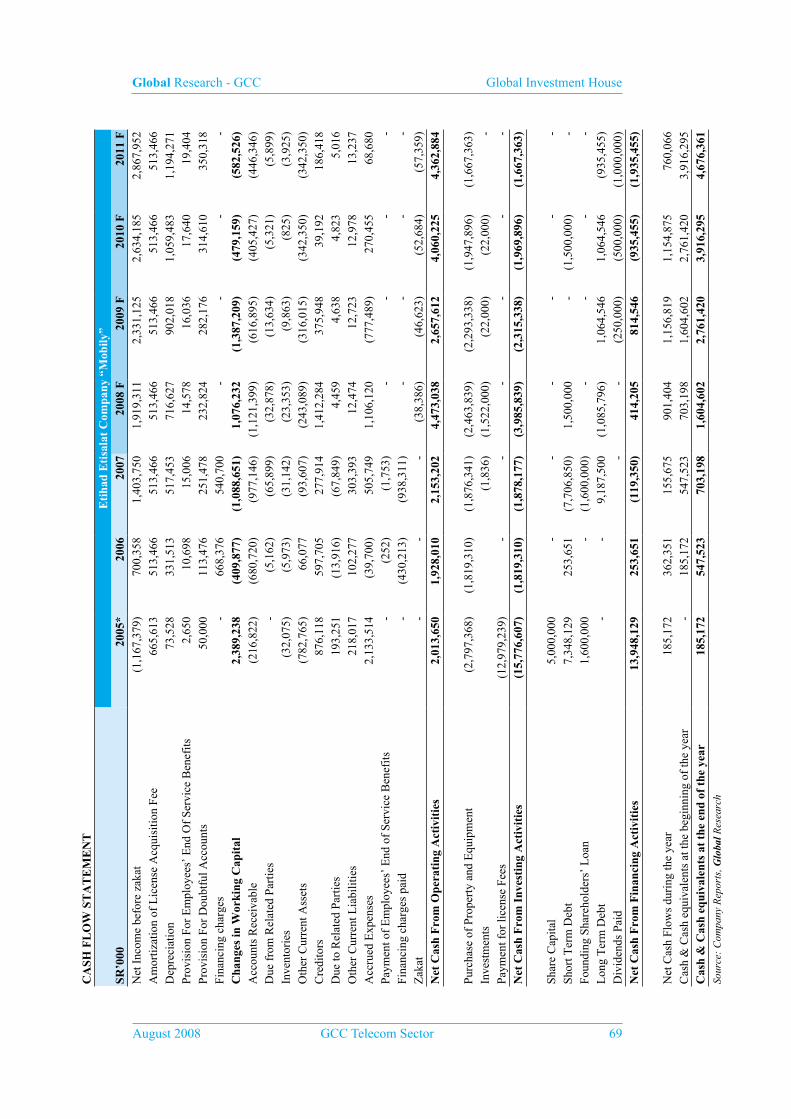
Global Research - GCC Global Investment House
August 2008 GCC Telecom Sector 69
CA
SH F
LO
W S
TA
TE
ME
NT
Eti
had
Eti
sala
t C
ompa
ny “
Mob
ily”
SR’0
0020
05*
2006
2007
2008
F20
09 F
2010
F20
11 F
Net
Inc
ome
befo
re z
akat
(1,
167,
379)
700
,358
1
,403
,750
1
,919
,311
2
,331
,125
2
,634
,185
2
,867
,952
A
mor
tizat
ion
of L
icen
se A
cqui
sitio
n Fe
e 6
65,6
13
513
,466
5
13,4
66
513
,466
5
13,4
66
513
,466
5
13,4
66
Dep
reci
atio
n 7
3,52
8 3
31,5
13
517
,453
7
16,6
27
902
,018
1
,059
,483
1
,194
,271
Pr
ovis
ion
For
Em
ploy
ees’
End
Of
Serv
ice
Ben
efits
2,6
50
10,
698
15,
006
14,
578
16,
036
17,
640
19,
404
Prov
isio
n Fo
r D
oubt
ful A
ccou
nts
50,
000
113
,476
2
51,4
78
232
,824
2
82,1
76
314
,610
3
50,3
18
Fina
ncin
g ch
arge
s -
6
68,3
76
540
,700
-
-
-
-
C
hang
es in
Wor
king
Cap
ital
2,3
89,2
38
(40
9,87
7) (
1,08
8,65
1) 1
,076
,232
(
1,38
7,20
9) (
479,
159)
(58
2,52
6)A
ccou
nts
Rec
eiva
ble
(21
6,82
2) (
680,
720)
(97
7,14
6) (
1,12
1,39
9) (
616,
895)
(40
5,42
7) (
446,
346)
Due
fro
m R
elat
ed P
artie
s -
(
5,16
2) (
65,8
99)
(32
,878
) (
13,6
34)
(5,
321)
(5,
899)
Inve
ntor
ies
(32
,075
) (
5,97
3) (
31,1
42)
(23
,353
) (
9,86
3) (
825)
(3,
925)
Oth
er C
urre
nt A
sset
s (
782,
765)
66,
077
(93
,607
) (
243,
089)
(31
6,01
5) (
342,
350)
(34
2,35
0)C
redi
tors
876
,118
5
97,7
05
277
,914
1
,412
,284
3
75,9
48
39,
192
186
,418
D
ue to
Rel
ated
Par
ties
193
,251
(
13,9
16)
(67
,849
) 4
,459
4
,638
4
,823
5
,016
O
ther
Cur
rent
Lia
bilit
ies
218
,017
1
02,2
77
303
,393
1
2,47
4 1
2,72
3 1
2,97
8 1
3,23
7 A
ccru
ed E
xpen
ses
2,1
33,5
14
(39
,700
) 5
05,7
49
1,1
06,1
20
(77
7,48
9) 2
70,4
55
68,
680
Paym
ent o
f E
mpl
oyee
s’ E
nd o
f Se
rvic
e B
enef
its -
(
252)
(1,
753)
-
-
-
-
Fina
ncin
g ch
arge
s pa
id -
(
430,
213)
(93
8,31
1) -
-
-
-
Z
akat
-
-
-
(38
,386
) (
46,6
23)
(52
,684
) (
57,3
59)
Net
Cas
h F
rom
Ope
rati
ng A
ctiv
itie
s 2
,013
,650
1
,928
,010
2
,153
,202
4
,473
,038
2
,657
,612
4
,060
,225
4
,362
,884
Purc
hase
of
Prop
erty
and
Equ
ipm
ent
(2,
797,
368)
(1,
819,
310)
(1,
876,
341)
(2,
463,
839)
(2,
293,
338)
(1,
947,
896)
(1,
667,
363)
Inve
stm
ents
(1,
836)
(1,
522,
000)
(22
,000
) (
22,0
00)
-
Paym
ent f
or li
cens
e Fe
es (
12,9
79,2
39)
-
--
--
-N
et C
ash
Fro
m I
nves
ting
Act
ivit
ies
(15
,776
,607
) (
1,81
9,31
0) (
1,87
8,17
7) (
3,98
5,83
9) (
2,31
5,33
8) (
1,96
9,89
6) (
1,66
7,36
3)
Shar
e C
apita
l 5
,000
,000
-
-
-
--
-Sh
ort T
erm
Deb
t 7
,348
,129
2
53,6
51
(7,
706,
850)
1,5
00,0
00
-
(1,
500,
000)
-Fo
undi
ng S
hare
hold
ers’
Loa
n 1
,600
,000
-
(
1,60
0,00
0) -
-
--
Lon
g T
erm
Deb
t -
-
9
,187
,500
(
1,08
5,79
6) 1
,064
,546
1
,064
,546
(
935,
455)
Div
iden
ds P
aid
-
-
(25
0,00
0) (
500,
000)
(1,
000,
000)
Net
Cas
h F
rom
Fin
anci
ng A
ctiv
itie
s 1
3,94
8,12
9 2
53,6
51
(11
9,35
0) 4
14,2
05
814
,546
(
935,
455)
(1,
935,
455)
Net
Cas
h Fl
ows
duri
ng th
e ye
ar 1
85,1
72
362
,351
1
55,6
75
901
,404
1
,156
,819
1
,154
,875
7
60,0
66
Cas
h &
Cas
h eq
uiva
lent
s at
the
begi
nnin
g of
the
year
-
185
,172
5
47,5
23
703
,198
1
,604
,602
2
,761
,420
3
,916
,295
C
ash
& C
ash
equi
vale
nts
at t
he e
nd o
f th
e ye
ar 1
85,1
72
547
,523
7
03,1
98
1,6
04,6
02
2,7
61,4
20
3,9
16,2
95
4,6
76,3
61
Sour
ce:
Com
pany
Rep
orts
, Glo
bal R
esea
rch
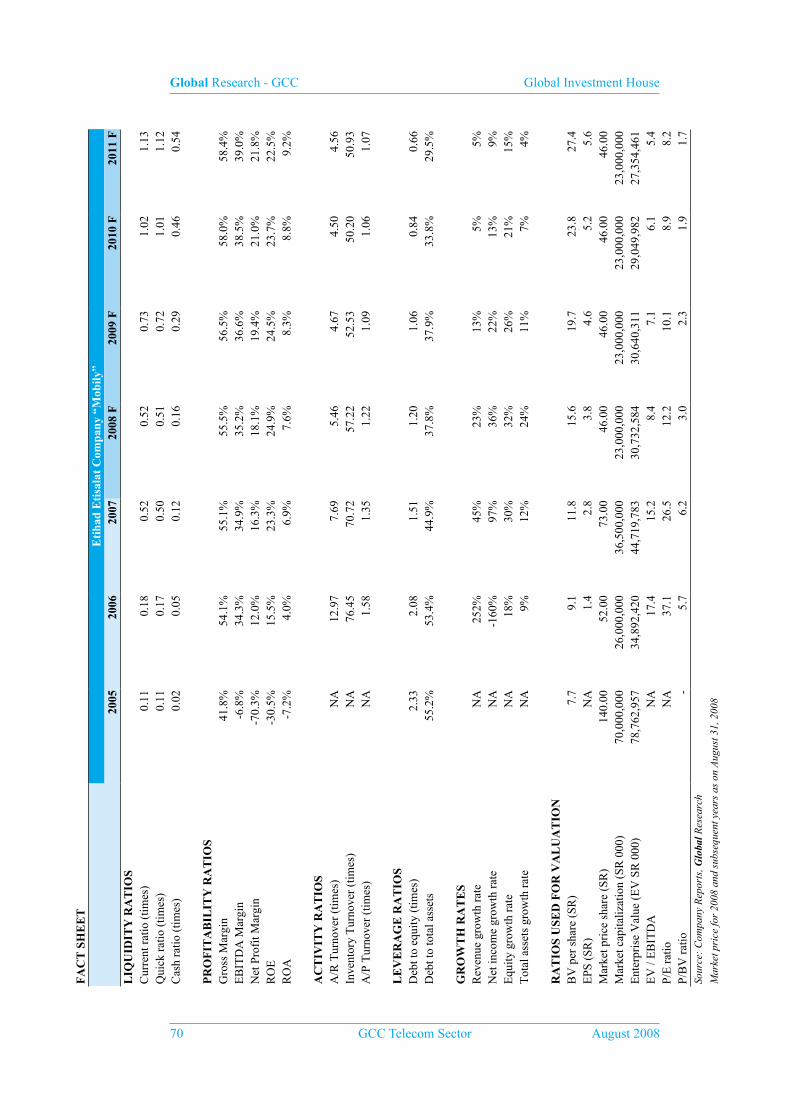
Global Research - GCC Global Investment House
70 GCC Telecom Sector August 2008
FA
CT
SH
EE
TE
tiha
d E
tisa
lat
Com
pany
“M
obily
”20
0520
0620
0720
08 F
2009
F20
10 F
2011
FL
IQU
IDIT
Y R
AT
IOS
Cur
rent
rat
io (
times
)0.
110.
180.
520.
520.
731.
021.
13Q
uick
rat
io (
times
)0.
110.
170.
500.
510.
721.
011.
12C
ash
ratio
(tim
es)
0.02
0.05
0.12
0.16
0.29
0.46
0.54
PR
OF
ITA
BIL
ITY
RA
TIO
SG
ross
Mar
gin
41.8
%54
.1%
55.1
%55
.5%
56.5
%58
.0%
58.4
%E
BIT
DA
Mar
gin
-6.8
%34
.3%
34.9
%35
.2%
36.6
%38
.5%
39.0
%N
et P
rofi
t Mar
gin
-70.
3%12
.0%
16.3
%18
.1%
19.4
%21
.0%
21.8
%R
OE
-3
0.5%
15.5
%23
.3%
24.9
%24
.5%
23.7
%22
.5%
RO
A
-7.2
%4.
0%6.
9%7.
6%8.
3%8.
8%9.
2%
AC
TIV
ITY
RA
TIO
SA
/R T
urno
ver
(tim
es)
NA
12.9
77.
695.
464.
674.
504.
56In
vent
ory
Tur
nove
r (t
imes
)N
A76
.45
70.7
257
.22
52.5
350
.20
50.9
3A
/P T
urno
ver
(tim
es)
NA
1.58
1.35
1.22
1.09
1.06
1.07
LE
VE
RA
GE
RA
TIO
SD
ebt t
o eq
uity
(tim
es)
2.33
2.08
1.51
1.20
1.06
0.84
0.66
Deb
t to
tota
l ass
ets
55.2
%53
.4%
44.9
%37
.8%
37.9
%33
.8%
29.5
%
GR
OW
TH
RA
TE
SR
even
ue g
row
th r
ate
NA
252%
45%
23%
13%
5%5%
Net
inco
me
grow
th r
ate
NA
-160
%97
%36
%22
%13
%9%
Equ
ity g
row
th r
ate
NA
18%
30%
32%
26%
21%
15%
Tot
al a
sset
s gr
owth
rat
eN
A9%
12%
24%
11%
7%4%
RA
TIO
S U
SED
FO
R V
AL
UA
TIO
NB
V p
er s
hare
(SR
) 7
.7
9.1
1
1.8
15.
6 1
9.7
23.
8 2
7.4
EPS
(SR
) N
A
1.4
2
.8
3.8
4
.6
5.2
5
.6
Mar
ket p
rice
sha
re (
SR)
140
.00
52.
00
73.
00
46.
00
46.
00
46.
00
46.
00
Mar
ket c
apita
lizat
ion
(SR
000
) 7
0,00
0,00
0 2
6,00
0,00
0 3
6,50
0,00
0 2
3,00
0,00
0 2
3,00
0,00
0 2
3,00
0,00
0 2
3,00
0,00
0 E
nter
pris
e V
alue
(E
V S
R 0
00)
78,
762,
957
34,
892,
420
44,
719,
783
30,
732,
584
30,
640,
311
29,
049,
982
27,
354,
461
EV
/ E
BIT
DA
NA
1
7.4
15.
2 8
.4
7.1
6
.1
5.4
P/
E r
atio
NA
3
7.1
26.
5 1
2.2
10.
1 8
.9
8.2
P/
BV
rat
io -
5
.7
6.2
3
.0
2.3
1
.9
1.7
So
urce
: C
ompa
ny R
epor
ts, G
loba
l Res
earc
h
Mar
ket p
rice
for
2008
and
sub
sequ
ent y
ears
as
on A
ugus
t 31,
200
8
Global Research - GCC Global Investment House
August 2008 GCC Telecom Sector 71
Emirates Telecommunications Corporation- Etisalat
TickersETEL.AD (Reuters)ETISALAT UH (Bloomberg)
Listing:Abu Dhabi Stock Market (ADSM)
Current Price: AED18.0 ( August 31, 2008)
Key DataEPS* (AED) 1.66 Avg. daily vol. (‘000) 2,051.6
BVPS* (AED) 5.30 52 week Hi / Lo (AED) 22.05/14.38
P/E (x) 10.8 Market Cap (AED mn) 107,811
P/BV (x) 3.4 Target Price (AED) 27.02
Source: Global Research * Projected (2008)
Background
• Emirates Telecommunications Corporation (Etisalat) was founded in 1976, and is one of the oldest telecom players in the region. In 1982, Etisalat was the first telecom operator in the region to introduce a mobile phone service, and introduced the GSM technology to customers in 1994. Since then it has established itself as a regional leader by introducing both 3G and MMS in 2003, and most recently, the BlackBerry service in 2006. Etisalat is 60% owned by the government of UAE, while the remaining 40% are publicly traded.
• Etisalat was the sole provider of telecommunication in the UAE until its monopoly was broken when Emirates Integrated Telecommunications Company (EITC) know as “DU” won the second license for fixed line, mobile, and internet services in 2005, and launched its services in Feb. 2007.
• Recently, Etisalat has turned its focus towards international expansions with a current focus on Asia and Africa. Etisalat began its international expansion when it won Saudi Arabia’ second GSM license for AED12.67bn (US$3.45bn) in 2004. It won the license to become Afghanistan’s fourth GSM operator in May 2006 for AED147.3mn (US$40.1mn). At the end of 2006, Etisalat acquired a stake in Pakistan Telecommunication Company (PTCL) for AED9.6bn (US$2.6bn).
• In Africa, Etisalat acquired stakes in Atlantique Telecom, Emerging Markets Telecommunications Services (EMTS) in Nigeria, Zantel in Tanzania, and led the consortium who won the license to manage the third GSM operator in Egypt, for EGP16.7bn (US$2.9bn) in July 2006. Also in Sudan, Etisalat is one of 10 founders of Canar Telecom, a fixed-line operator. In Sept. 2007, Etisalat increased its shares in Canar, from 37% to 82% for AED584.17mn (US$159mn).
BUYRecommendation

Global Research - GCC Global Investment House
72 GCC Telecom Sector August 2008
• Etisalat’s first acquisition in the Far East was in Dec. 2007 with a 15.97% stake in the Indonesia-based PT Excelcomindo Pratama, for AED1.6bn (US$438mn).
• During 2008, Etisalat received positive ratings from Moody’s (Aa2), Standard & Poor’s (A +) and Fitch Ratings (AA-), reflecting the sound financial position of the group. According to Etisalat, these positive ratings should support the group’s future expansion plans and investments as it taps debt markets for medium and big-size investments
• Etisalat has restructured its operations into three separate divisions, Etisalat UAE, Etisalat International, and Etisalat services. Etisalat UAE provides full telecommunication, internet and Cable TV services within the UAE, while Etisalat International is handling all the group’s international investments, and seeking new growth opportunities in the global telecom market. Etisalat services is responsible for the efficiency of operations, enhancing customer services, and also responsible for all the group’s non-core activities.
Chart 01: Etisalat Major Business Units
Etisalat
Etisalat UAE Etisalat International Etisalat Services
Enterprise Solutions Atlantique Telecom ( West Africa) e-Facility ManagementSmall and Medium-Sized Business Canar (Sudan) e-Real EstateConsumer EMTS ( Nigeria) Etisalat AcademyCustomer Care Etisalat Misr ( Egypt) Ebtikar Card SystemE- Vision Zantel ( Tanzania) Emirates Data ClearingNetwork & Data Etihad Etisalat ( Mobily) e-marineMobile Thuraya (UAE) Special ProjectsFixed Line Etisalat Afghanistan Directory ServicesInternet Excelcomindo Pratama (Indonesia) Etisalat Software Solutions Ltd. Pakistan Telecommunication (PTCL)
Source: Etisalat

Global Research - GCC Global Investment House
August 2008 GCC Telecom Sector 73
Analysis of operations
UAE operations
Etisalat has capitalized on the UAE’s booming economy, which is one of the fastest growing economies in the world. The attractive business environment has attracted a lot of business activity to the UAE leading to an increase in expatriate workforce, which was one of the main drivers of the growth of population and the growth in the number of the group’s subscribers in UAE.
Within the Mena and GCC regions, the UAE has the highest mobile, fixed, and internet penetrations rates. Fixed line subscribers stood at 1.38mn subscribers by the end of 2007, with residential lines forming 48% of total fixed line subscribers. Mobile subscribers stood at 7.6mn subscribers in 2007, with prepaid subscribers forming 91% of total mobile subscribers. Internet subscribers stood at 904 thousand in 2007. Broadband subscribers formed 42% of internet subscribers in 2007 compared to 35% in 2006, indicating faster growth than dial-up subscriptions.
Chart 02: UAE Telecom penetration rates
0%20%40%
60%80%
100%120%
140%160%180%
2004 2005 2006 2007
Mobile Penetration Fixed Penetration Internet Penetration*
Source: TRA, Global Research * Estimated number of users per Internet subscription = 2.5
Mobile competition intensifying, however no price wars…After a long period of monopoly by incumbent operator Etisalat, competition has been introduced into the market when du launched its services in Feb. 2007, and managed to grab a 16% market share by year end.
Chart 03: UAE mobile subscribers
0
1
2
3
4
5
6
7
8
2005 2006 2007
mn
Etisalat Susbscribers Du Subscribers
Source: TRA, Etisalat

Global Research - GCC Global Investment House
74 GCC Telecom Sector August 2008
The advent of competition has not resulted in price wars resulting in ARPUs remaining relatively stable. The UAE telecom market is regulated by the Telecommunications Regulatory Authority (TRA) which reviews the marketing offers and services prices of the two telecom operators within its Price Control Policy (PCP). ARPUs for the fixed segment have been declining since 2004, however, it witnessed a 5% increase in 2007 on the back of higher broadband subscriptions.
Chart 04: ARPUs
0306090
120150180210240
2004 2005 2006 2007
AE
D
Mobile ARPU Fixed ARPU
Source: Etisalat, Global Research
UAE Mobile Market near saturation…When du entered the market in 2007, the number of mobile subscribers in UAE shot up by 38% with a penetration rate of 166.4% in 2007 compared to a penetration rate of 127.6% in 2006. In our view, the mobile market in the UAE is near saturation, though there are still some growth opportunities in line with the economic boom in the country, and the growth in population.
Chart 05: Subscribers ( Mobile vs. Fixed)
0
1
2
3
4
5
6
7
8
2004 2005 2006 2007
mn
0%
5%
10%
15%
20%
25%
30%
35%
40%
Mobile Subscribers Fixed Subscribers Mobile Subs. Growth Fixed Subs. Growth
Source: TRA, Global Research
Fixed lines growth stabilizing…Moving with the global trend, fixed to mobile substitution has led to a stabilization of fixed line penetrations in the UAE. Mobile subscribers grew by a CAGR of 27% during the period from 2004 to 2007, while fixed line subscribers grew by a CAGR of 5% during the same period. The launch of Du’s services in 2007 has led to the jump of mobile subscribers in the UAE by 38% compared to a growth rate of 22% in 2006.

Global Research - GCC Global Investment House
August 2008 GCC Telecom Sector 75
Chart 06: Internet Subscribers ( Broad-band vs. Dial-up)
0
100
200
300
400
500
600
2004 2005 2006 2007
In
' 000
0%
20%
40%
60%
80%
100%
120%
140%
Dial-up Broad-band Dial-up Subs. Growth Broad-band Subs. Growth
Source: TRA, Global Research
Future belongs to broadband…Internet subscribers grew by a CAGR of 29% during the period from 2004 to 2007. However, broadband subscriptions are growing at a faster rate than dial-up. Broadband subscribers grew by a CAGR of 89% during the period from 2004 to 2007, while dial-up subscribers grew by 13% during the same period. Broadband use is increasing rapidly in the region, however, penetration levels are still relatively low compared to developed countries, representing high growth potential.
International operations
Etisalat’s core expansion strategy is to target populated markets with low penetration rates, and growing economies. Etisalat have been seeking growth opportunities in MENA and Asia regions. The group is present in 15 countries in Africa and Asia with majority stakes in Etisalat Afghanistan, PTCL (Pakistan), Atlantique Telecom (West Africa), Canar (Sudan), Etisalat Misr (Egypt), and Zantel (Tanzania). In addition, it has equity stakes in Mobily (Saudi), and Etisalat Nigeria. Most of the Etisalat’s subsidiaries, and associates offer mobile services except for PTCL which offers both mobile and fixed services, and Canar which offers fixed lines, voice and data services.
Chart 07: Etisalat’s International Markets
0%
20%
40%
60%
80%
100%
120%
140%
CARNige
r
Burkin
a Fas
o
Afgha
nistan
Togo
Sudan
*
Tanza
nia
Tanza
nia*
Benin
Nigeria
Nigeria
*
Ivor
y Coa
st Ept
Indo
nesia
Pakist
an
Pakist
an*
Gabon
Saudi
Arabia
0%
3%
5%
8%
10%
13%
15%
Penetration GDP Growth Rate
Source: Etisalat, ITU, UN * Fixed lines penetration
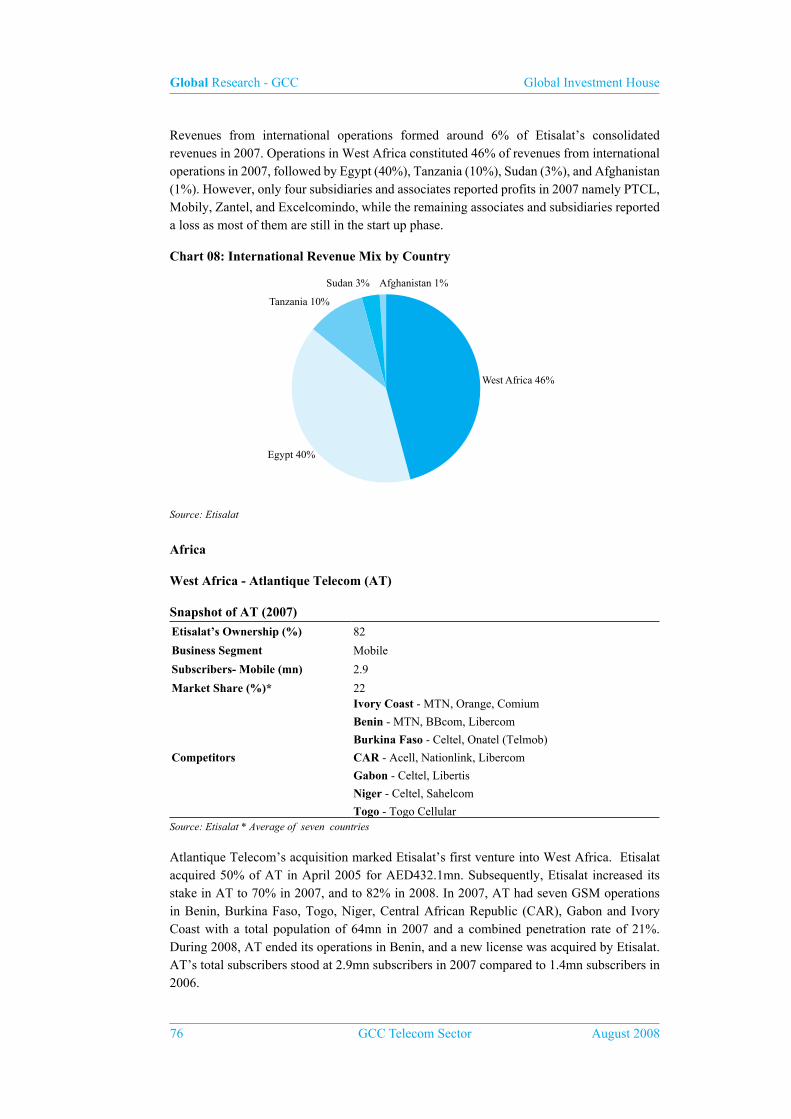
Global Research - GCC Global Investment House
76 GCC Telecom Sector August 2008
Revenues from international operations formed around 6% of Etisalat’s consolidated revenues in 2007. Operations in West Africa constituted 46% of revenues from international operations in 2007, followed by Egypt (40%), Tanzania (10%), Sudan (3%), and Afghanistan (1%). However, only four subsidiaries and associates reported profits in 2007 namely PTCL, Mobily, Zantel, and Excelcomindo, while the remaining associates and subsidiaries reported a loss as most of them are still in the start up phase.
Chart 08: International Revenue Mix by Country
Afghanistan 1%
West Africa 46%
Egypt 40%
Tanzania 10%
Sudan 3%
Source: Etisalat
Africa
West Africa - Atlantique Telecom (AT)
Snapshot of AT (2007)
Etisalat’s Ownership (%) 82
Business Segment Mobile
Subscribers- Mobile (mn) 2.9
Market Share (%)* 22
Competitors
Ivory Coast - MTN, Orange, Comium
Benin - MTN, BBcom, Libercom
Burkina Faso - Celtel, Onatel (Telmob)
CAR - Acell, Nationlink, Libercom
Gabon - Celtel, Libertis
Niger - Celtel, Sahelcom
Togo - Togo CellularSource: Etisalat * Average of seven countries
Atlantique Telecom’s acquisition marked Etisalat’s first venture into West Africa. Etisalat acquired 50% of AT in April 2005 for AED432.1mn. Subsequently, Etisalat increased its stake in AT to 70% in 2007, and to 82% in 2008. In 2007, AT had seven GSM operations in Benin, Burkina Faso, Togo, Niger, Central African Republic (CAR), Gabon and Ivory Coast with a total population of 64mn in 2007 and a combined penetration rate of 21%. During 2008, AT ended its operations in Benin, and a new license was acquired by Etisalat. AT’s total subscribers stood at 2.9mn subscribers in 2007 compared to 1.4mn subscribers in 2006.

Global Research - GCC Global Investment House
August 2008 GCC Telecom Sector 77
Chart 09: AT’s ownership of subsidiaries (2007)
Atlantique Telecom
Ivory Coast CAR Niger Burkina Faso Gabon Togo Benin
100% 97% 90% 79% 70% 63% 51%
Source: Etisalat
AT’s current strategy in West Africa focuses on network upgrading and re-branding. During 2007, AT upgraded its network with the GPRS-Edge technology, and initiated a new network rollout, which is expected to be completed in 2008, and is expected to expand network coverage by over 60%. AT also launched a new brand “Moov”, and started with rebranding its operations in Ivory Coast, then later re-branded its operations in Gabon, and Togo, and is expected to rebrand its remaining operations by 2008. Earlier AT used to operate under Telecel brand.
Chart 10: West Africa Market Shares (2007)
0%
10%
20%
30%
40%
50%
60%
70%
80%
90%
100%
Ivory
Coast
Benin Burkina
Faso
CAR Gabon Niger Togo
Moov MTN Orange Comium BBCom
Celtel Onatel Acell Nationlink Libercom
Libertis SahelCom Togo Cellular
Source: Etisalat
Sudan - Canar
Snapshot of Canar (2007)
Etisalat’s Ownership (%) 82
Business Segment Fixed, Data services
Subscribers- Fixed (mn) 0.2
Market Share (%) 54
Competitors Sudatel
Source: Etisalat
Initially, Etisalat had a 37% stake in Canar, which was later increased to 82% in 2008. Sudan is a large market with population around 40mn, and low penetration rates of 19% for the
Global Research - GCC Global Investment House
78 GCC Telecom Sector August 2008
mobile market and 0.9% for fixed market. There are three mobile operators in Sudan (Areeba, Mobitel, & Sudani), and two fixed line operators (Sudatel and Canar). Canar was awarded fixed license in November 2004, and launched operations in Jan. 2006. Competition in the market is intense, which forced operators to slash their tariffs resulting in lower ARPUs. In 2007, Canar’s subscribers grew by over 50%, increasing the company’s market share to 54%. Canar uses the Next Generation Network (NGN) and Wireless Loop (WLL) technologies. The company extended its fiber optic network 1,500km nationally and 250km locally in major cities to serve mobile operators, ISPs, and corporate and business clients. The company launched several voice and data services in 2007 including a new voice package, relaunching its wireless broadband internet service, “Canar Go” with flat-rate packages and prepaid options. With a negligible broadband penetration of only 0.01% in Sudan, we believe that there is a huge potential for Canar to expand in the broadband segment.
Nigeria - EMTS
Snapshot of EMTS (2007)
Etisalat’s Ownership (%) 40
Business Segment Mobile, Fixed, Data services
Subscribers- (mn) -
Market Share (%) -
CompetitorsMobile – MTN, Celtel (Zain), Globacom, MTEL
Fixed – NITEL, Globacom Source: Etisalat
Etisalat acquired a 40% in Emerging Markets Telecommunication Services (EMTS), which acquired a new license to provide integrated telecommunication services in Nigeria. The license is a 15-year renewable Universal Access Service License (UASL), and will make EMTS the fifth mobile operator in Nigeria, and the third in fixed service provider. This investment will enable Etisalat to form synergies with its operations in West Africa through Atlantique Telecom (AT). The Nigerian operations is expected to start in the second half of 2008. Nigeria is considered to be one of the fastest growing markets in Africa, and also one of the most populated countries with a population of nearly 150mn, and a low mobile penetration of 27%, fixed penetration of 1%, and internet and broadband penetration of less than 1%. The transformation of Nigeria’s telecommunications sector came with the licensing of three GSM networks in 2001 and a fourth one in 2002. In addition, the telecom regulator introduced a new unified licensing regime in 2006 which is expected to intensify the competition between fixed and mobile operators. Nigeria’s underdeveloped fixed-line infrastructure has been the main reason behind low fixed and internet penetration. Mobile on the other hand has been witnessing remarkable growth. Mobile subscribers grew at a CAGR of 91.5% during the period from 2002 to 2007 surpassing the growth rate of Africa which stood at 48.8% during the same period. We believe that mobile will be the main driver for growth. However, with internet and broadband penetration less than 1%, there is an enormous growth potential for this segment. We believe that as competition intensifies between fixed and mobile network operators on the back of the new unified licensing regime introduced in 2006, and as the country develops its infrastructure, new technologies will enable providers to deliver wireless broadband access which are in strong demand.

Global Research - GCC Global Investment House
August 2008 GCC Telecom Sector 79
Egypt - Etisalat Misr
Snapshot of Etisalat Misr (2007)Etisalat’s Ownership (%) 66
Business Segment Mobile
Subscribers- Mobile (mn) 3.1
Market Share (%) 10
Competitors Mobinil, Vodafone
Source: Etisalat
Etisalat Misr is Egypt’s third mobile operator following the country’s two operators (Mobinil and Vodafone Egypt). Etisalat won a 15-year license in July 2006 including 3G and 2G services for US$2.9bn in addition to 6% royalty fees of gross revenues. The company launched its operations in May 2007, and managed to attract 3.1mn subscribers by the end of 2007, representing a market share of 10%. Etisalat Misr was the first to launch 3.75G (HSDPA) services in the country. The company was also the first to acquire an international gateway license, thus ending Telecom Egypt’s monopoly in that segment, and allowing Etisalat Misr to provide international services to its subscribers bypassing Telecom Egypt’s networks and thus lowering the company’s interconnection fees. The company’s coverage extended over 75% of the population at launch and is expected to be fully completed by the end of 2008.
Although, Etisalat is the third operator in Egypt, with a 75mn population, and a mobile penetration rate of only 42%, we believe that there is still room for more growth. In addition, the introduction of Mobile Number Portability (MNP) in April 2008, might encourage dissatisfied customers from the other two operators to switch to Etisalat. We expect that competition will lead to declining ARPUs in the short term, however, on the other hand , it will lead to better service quality. Therefore, growth for mobile operators will be mainly derived through the provision of attractive packages, and advanced services. Another area of potential growth in the Egyptian market is broadband which is very low penetrated, under 1%. Numerous measures to cut the cost of broadband access and to raise PC penetration in Egypt should benefit the market going forward.
Tanzania - Zantel
Snapshot of Zantel (2007)
Etisalat’s Ownership (%) 51
Business Segment Mobile, Fixed
Subscribers- Mobile (mn) 0.7
Subscribers- Fixed (mn) 0.005
Market Share (%)Mobile – 8Fixed – 3
CompetitorsMobile – Vodacom, Celtel (Zain) , Mobitel, TTCLFixed – Tanzania Telecommunications Co. (TTCL)
Source: Etisalat
Zantel (Zanzibar Telecom Ltd.) began as a joint venture between Etisalat (34%), and the government of Zanzibar (18%), and other local investors. During 2007, Etisalat acquired an additional share of 17% in Zantel to increase its stake to 51%. Zantel won a 15 year

Global Research - GCC Global Investment House
80 GCC Telecom Sector August 2008
mobile license in 1999, and a 25 year fixed license in 1997. Tanzania is a very competitive market with five mobile operators and two fixed line operators including Zantel. Yet, market penetration rate is still very low with 20% mobile penetration, and fixed lines penetration is less than 1%.
When Zantel began operations in Zanzibar in 1999, its operational territory was limited to Dares Salam, with national service provided through roaming agreement. However, the company replaced its network in 2007 with a new network and rolled out its own infrastructure. Zantel is expected to provide coverage to over 75% of the population by the end of 2008. In addition, the company also operates an international gateway and has established a reputation as an international calls service hub for Internet Service Providers and other mobile operators. Zantel ended the year 2007 with 0.7mn mobile subscribers, and 5.4 thousand fixed line subscribers representing a market share of 8%, and 3% respectively. We believe that Tanzania is still an underpenetrated market, and with the proper infrastructure, higher penetration rates are expected. The East African Submarine Cable System (EASSy), which is set to launch by the end of 2008, would also help in improving the quality of services in Tanzania.
Asia
Saudi Arabia – Etihad Etisalat ( Mobily)
Snapshot of Mobily (2007)
Etisalat’s Ownership (%) 26.25%
Business Segment Mobile, Internet, Data Services
Subscribers- Mobile (mn) 11.1
Market Share (%) 41
Competitors Saudi Telecom Company, Zain
Source: Etisalat
Etisalat won the second GSM license in Saudi Arabia for a period of 25 years, thus ending Saudi Telecom Company’s monopoly in the wireless business segment. Etisalat paid US$3.45bn for the license which included a 3G license as well. The company underwent an IPO on the Saudi Stock Exchange in October 2004, which raised US$267mn for 20% of its shares. In April 2008, Mobily’s founders floated another 20% for public subscription in order to comply with the royal decree which stipulates floating 20% of the company’s equity in the third year after formation. Accordingly, Etisalat’s total share in the company has been reduced to 26.25% from 35%.
Saudi Arabia is one of biggest economies, and highly populated countries in the region, a favorable environment for telecom operators. Saudi Population has been growing at a CAGR of 2.7% from 2001-2006. During 2006, KSA population grew by 3.8% to reach a total population of 24mn, and is estimated to have reached 24.7mn in 2007. Expatriate population form around 30% of the total population of Saudi Arabia. The increasing young population has been one of the underlying factors of the increasing mobile phone usage in Saudi Arabia, with around 32% of the population in the age of 10 to 24. The Saudi mobile market has been a monopoly since STC was established in 1998. The monopoly was broken when Mobily won the second license and launched its operation in 2005. In March 2007, the duopoly was
Global Research - GCC Global Investment House
August 2008 GCC Telecom Sector 81
broken when a consortium led by MTC of Kuwait (now Zain) won the third license. The mobile market has been growing at fast rates with penetration rate increasing from 82% in 2006 to 116% in 2007.
Mobily launched its services in May 2005, and managed to grab a market share of 41% by the end of 2007, with 11.1mn subscribers. In February 2006, the company entered into a deal with two other companies, Integrated Telecom Company and Bayanat Al-Oula for Network Services, to build, deploy and operate the Kingdom’s largest fiber optic network with a total value of SR1bn (US$266mn). The fiber optic network is expected to cover 12,600 km long with seven rings and covering the whole of Saudi Arabia. In January 2007, Integrated Telecom Company and Bayanat Al-Oula for Network Services announced the completion of the first phase of their fiber optic network project, which covers the major three rings of central, western and eastern regions. The other four rings are expected to be completed by October 2008. Mobily’s network now covers 93.7% of the Saudi population. The company has been also targeting the data and internet segment aggressively, after acquiring majority stakes in two companies, a 99.9% stake in the local data provider “Bayanat Al-Oula” for SR1.5bn (US$400mn) and 96% in internet service provider “Zajil” for SR80mn (U$21.33mn). We expect value added services to be a major revenue driver going forward considering the company’s planned infrastructure upgrades which will allow the company to expand its broadband internet services and provide higher quality services at higher speed.
Afghanistan – Etisalat Afghanistan
Snapshot of Etisalat Afghanistan (2007)
Etisalat’s Ownership (%) 100
Business Segment Mobile
Subscribers- Mobile (mn) 0.11
Market Share (%) 4
Competitors Roshan (TDCA), Afghan Wireless Communications Company
(AWCC), AreebaSource: Etisalat
In May 2006, Etisalat signed an agreement with Afghan authorities to operate a GSM network across Afghanistan and become the fourth GSM operator in the country. Etisalat Afghanistan started operations in August 2007. The company is fully owned by Etisalat, which bought the 15-year GSM license for US$40mn. Afghanistan has a population of 30mn with mobile penetration of 17.2%. During 2007, Etisalat injected capital into the company and is planning a major network rollout in 2008. The company ended the year 2007 with 0.11mn mobile subscribers representing a market share of 4%, and reported revenues of AED6.4mn, and a net loss of AED48mn in 2007. With a mobile penetration rate of only 17%, we believe that there is huge potential for that market as there is a high demand for new technologies and services. Afghanistan Telecom Regulatory Authority announced that it is targeting a 30% mobile penetration rate by 2013. We expect Etisalat Afghanistan to break even in 2010.

Global Research - GCC Global Investment House
82 GCC Telecom Sector August 2008
Pakistan – Pakistan Telecommunications Company Limited (PTCL)
Snapshot of PTCL (2007)
Etisalat’s Ownership (%) 26
Business Segment Mobile (Ufone), Fixed (PTCL), Data Services (Paknet)
Subscribers- Mobile (mn) 16.2
Subscribers- Fixed (mn) 4.6
Subscribers- WLL (mn) 1.2
Market Share (%)Mobile – 21Fixed - 94WLL – 58
Competitors Mobile - Mobilink, Zong, Instsphone, Telenor, Warid Fixed -NTC, Brain Ltd, World Call, Union Com, Naya TelWLL – Telecard, World Call, Great Bear, Burraq, Wateen, Mytel
Source: Etisalat, Regulator
Etisalat holds a 26% stake of PTCL through Etisalat International Pakistan (EIP), in which Etisalat owns a 90% stake. PTCL offers fixed line, mobile, and data services. By the end of 2007, PTCL’s market share stood at 21%, 94%, 58% in the mobile, fixed, and WLL (Wireless Local Loop) segments respectively, making PTCL the market leader in the fixed line, and the WLL segments, and the second in the mobile segment following Orascom-owned Mobilink.
Pakistan is one of the largest markets with a population of over 162mn.The mobile segment was main driver of Pakistan’s telecommunication sector. PTCL offers mobile services under the brand name Ufone. The mobile segment is growing rapidly in Pakistan with penetration rates growing from 22.21% in 2006 to 48% in 2007. With 6 players, the market is highly competitive, and is characterized by having one of the lowest call rates in the world with a monthly ARPU of US$3.2. Major players are Mobilink with a market share of 39.8% in 2007, Ufone (21%), Telenor (19%), and Warid (17.2%). The fixed line segment in Pakistan has been facing tough competition with the increase in the number of players as well as the migration to mobile services, leading to tariff cuts in both fixed and WLL segments. Fixed line penetration decreased from 3.4% in 2006 to 3% in 2007. On the other hand, WLL penetration increased from 0.66% in 2006 to 1.08% in 2007. We believe that the mobile segment will be the main catalyst for PTCL, and although the growth for the fixed line seems limited, there is potential in the data services segment. PTCL made several investments in infrastructure development and network capacity expansions such as the introduction of the Vfone, the new CDMA-based WLL platform, which is expected to be the largest fixed wireless phone network in Pakistan. The company is the largest CDMA operator in Pakistan with 0.8mn V-fone customers. In the wireless broadband segment, the company upgraded the WLL CDMA network to provide broadband services in 17 major cities. The company also obtained an IPTV license which will enable PTCL to provide Triple Play services over a single fixed line connection.

Global Research - GCC Global Investment House
August 2008 GCC Telecom Sector 83
Indonesia – PT Excelcomindo Pratama
Snapshot of Excelcomindo (2007)
Etisalat’s Ownership (%) 16
Business Segment Mobile
Subscribers- Mobile (mn) 15.5
Market Share 16
Competitors Telkomsel, PT Indosat
Source: Etisalat
In Dec. 2007, Etisalat acquired 15.97% stake in PT Excelcomindo Pratama (XL) for a value of US$438mn, which marks Etisalat’s first venture into the southeast Asian markets. Excelcomindo is Indonesia’s third mobile operator. The company’s mobile subscribers stood at 15.5mn by the end of 2007. Though crowded with several mobile operators, Indonesia’s cellular market is dominated by three operators, PT Telkomsel, which has a 50% market share. PT Indonesia Satellite Corp. (Indosat) is second with nearly 24% of the market, while PT Exelcomindo Pratama is third with 16%. Indonesia is one of the biggest and fastest growing mobile markets in South-East Asia with population over 230mn population. It is the third largest wireless market in Asia in terms of subscribers. Mobile penetration increased to 42% at the end of 2007 compared to 28.3% in 2006. Excelcomindo revamped its pricing strategy in 2007, resulting in attracting good quality subscribers in 2007, which was reflected by slightly higher ARPU as compared to 2006 contrary to the general declining ARPU trend in the market. The company increased its population coverage to 90% in 2007, and is currently in the final stages for further expanding a terrestrial digital fiber-optics network across Java, high-capacity digital microwave networks in Kalimantan, Sumatera and Sulawesi; and digital fiber-optics submarine cables linking different islands in Indonesia and Malaysia. During 2008, the government of Indonesia decided to cut mobile interconnection tariff by 20-40%. Despite intense competition in the market, we expect more pricing pressure, however, we anticipate continued growth in revenues especially with the introduction of the new interconnection tariff which will encourage operators to increase their market share through offering attractive lower costs packages.
Thuraya Satellite Telecommunications Company (Thuraya)
Thuraya Satellite Telecommunications Company (Thuraya) was founded in the UAE in 1997 through a strategic partnership between national communications companies and major investment companies in the region. Thuraya offers satellite, cellular (GSM) service and location determination system (GPS) through handsets which offer voice, data, fax and short messaging services. The company owns and operates mobile telecom satellite system, covering more than 100 countries in Europe, Africa, the Middle East, and Asia. The company has 2 geostationary satellites in orbit, and a third one (Thuraya-3) extending coverage to the Asia-Pacific region started commercial activities in June 2008. The expanded coverage towards Asia-Pacific, including such major markets as China, Australia, Japan, Korea and Indonesia, is expected double the current market size and population covered by the Thuraya system. Etisalat currently holds 28% of Thuraya.

Global Research - GCC Global Investment House
84 GCC Telecom Sector August 2008
Financial Performance
Revenues increased by 31% despite competition in home market…Despite the entrance of a second operator in Etisalat’s home market in 2007, Etisalat reported consolidated revenues of AED21.3bn in 2007, growing by 31% on y-o-y basis. The mobile segment revenues still dominates the group’s consolidated revenues, forming 64% of the group’s consolidated revenues in 2007 compared to a share of 63% in 2006. The fixed lines segment on the other hand witnessed a declining share in consolidated revenues, forming 14% of revenues compared to a share of 17% in 2006, while the data services segment share increased from 8% in 2006 to 10% in 2007, and also witnessed the highest growth rate, growing by 50% on a y-o-y basis.
Chart 11: Revenues break-up by segment
-
5
10
15
20
25
2005 2006 2007
AE
Dbn
Mobile Fixed Lines Internet Data Services Misc
Source: Etisalat
UAE forms 94% of group revenues…Revenues from the UAE operations grew by 25%, and formed around 94% of the group’s consolidated revenues in 2007. Going forward we expect the contribution of revenues form international operations to witness an increasing trend as most of Etisalat’s overseas operations in Africa and Asia are in expansion phase. In addition, the Africa and Asia regions are still in their growth phase while the UAE market is approaching maturity.
Chart 12: Revenues break-up by geography
-5.0
10.015.020.025.030.035.040.045.0
2005 2006 2007 2008F 2009F 2010F 2011F
AE
Dbn
UAE Revenues International Revenues
Source: Etisalat, Global Research

Global Research - GCC Global Investment House
August 2008 GCC Telecom Sector 85
Start-up operations pressure EBITDA margin…EBITDA margin for the entire group declined from 77% in 2006 to 73% in 2007, while EBITDA margin for the UAE operations improved from 78.3% in 2006 to 79.4% in 2007. This is due to the fact that most of Etisalat’s operations are in the start-up phase, therefore reporting negative EBITDA margins. Going forward, we expect the Group’s EBITDA margin to continue its declining trend, however at a decreasing rate as international operations break-even. In addition, we expect improvement in EBITDA margin of the UAE operations following the rollout of the Fiber to the Home (FTTH) network, which is provided through optic fiber cable across the country, which should decrease operating costs.
Chart 13: EBITDA
0
5
10
15
20
25
30
2005 2006 2007 2008F 2009F 2010F 2011F
AE
Dbn
0%
10%
20%
30%
40%
50%
60%
70%
80%
90%
EBITDA EBITDA Margin
Source: Etisalat, Global Research
One off gain from selling a stake in Mobily in 2008…Etisalat has to pay a royalty equivalent to 50% of its annual net profit, according to government regulations. In 2007, Etisalat’s net profit after the payment of royalty grew by 25% to reach AED7.3bn compared to AED5.8bn in 2006. During Q2 2008, Etisalat, posted a profit of AED2.4bn from selling part of its stake in Saudi’s Mobily, , reducing Etisalat’s stake in Mobily to 26.35% from 35%. Accordingly, we have factored in that profit into our projections for 2008. We are expecting net profit to grow by 37% in 2008.
Chart 14: Net profit
0
2
4
6
8
10
12
2005 2006 2007 2008F 2009F 2010F 2011F
AE
Dbn
Source: Etisalat, Global Research

Global Research - GCC Global Investment House
86 GCC Telecom Sector August 2008
Capex to sales set to decline…The Group’s consolidated capex to sales ratio jumped from 8.8% in 2006 to 16.2% in 2007, on the back of increasing capex for the Group’s start-up international operations. The UAE operation’s capex to sales ratio on the other hand witnessed a decline from 7.7% in 2006 to 7.5% in 2007. Etisalat’s current coverage in the UAE extends to 97% of UAE populated area with 3G and 3.5G. Going forward, we expect capex to increase for international operations, however, overall capex to sales ratio is set to decline.
Chart 15: Capex
0.0
0.5
1.0
1.5
2.02.5
3.0
3.5
4.0
4.5
2005 2006 2007 2008F 2009F 2010F 2011F
AE
Dbn
0.0%
2.0%
4.0%
6.0%
8.0%10.0%
12.0%
14.0%
16.0%
18.0%
UAE Capex International Capex Capex to Sales
Source: Etisalat, Global Research
Strong results in H1 2008…Etisalat posted strong results for H1 2008, posting consolidated revenues of AED12.4bn, an increase of 24% over AED10bn reported in H1 2007. Net profit stood at AED5.1bn compared to AED4bn reported in the same period in 2007.
Outlook and Valuation
• With the UAE mobile market approaching saturation, we believe that the two mobile operators must rely on high quality value added services in order to grow. Etisalat has been adding extra value and diverse services to its subscribers. The migration to NGN (Next Generation Network) in UAE will enable Etisalat to further introduce more value added services. Going forward, we believe that mobile, and data services segments would still be the main revenue drivers for Etisalat UAE. However, the highest growth rates would be witnessed in data and internet services revenues.
• The group has also expanded its portfolio of regional and international investments in order to offset the impact of its shrinking market share in its home market. We expect the share of international operations of the group’s top line results to increase from 6% in 2007 to 11% in 2011. We also expect to revenues from international operations to grow by a CAGR of 25% during our forecast period (2008-2011), while a CAGR of 11% is expected for revenues from the UAE operations during the same period. We are particularly bullish on the group’s operations in West Africa, and Egypt, and we believe that they will be the main contributors to the group’s international revenues, and will also witness the highest growth rates in subscribers and revenues. In terms of associates, Mobily would still be the main contributor to revenue from associates.

Global Research - GCC Global Investment House
August 2008 GCC Telecom Sector 87
• At the current market price (Aug.31 2008), Etisalat trades at 10.8x and 10.8x its earnings and 3.4x and 2.9x its book value for 2008F and 2009F respectively. We have used Sum-Of-The Parts (SOTP) valuation method for the company’s operations in different countries. Based on the consolidation of the individual company operations, our SOTP valuation estimates the fair value of Etisalat’s stock at AED27, which is 50% higher than the current market price of the stock. We therefore initiate our coverage for Etisalat with a “Buy” recommendation.
SOTP Valuation Summary
All in AED’000 Valuation EV Stake Etisalat EV
Major operations Method
Etisalat UAE DCF 133,987,145 100% 133,987,145
Etisalat Afghanistan DCF 38,040 100% 38,040
Atlantique Telecom (West Africa) DCF 2,071,000 82% 1,698,220
Canar (Sudan) DCF 293,703 82% 240,836
Etisalat Misr (Egypt) DCF 24,352 66% 16,072
Zantel (Tanzania) DCF 946,362 51% 482,645
EMTS (Nigeria) DCF 40,334 40% 16,133
Mobily (Saudi) DCF 43,313,856 26% 11,369,887
PTCL (Pakistan) DCF 7,877,824 26% 2,048,234
Excelcomindo (Indonesia) DCF 19,572,474 16% 3,125,724
Thuraya (UAE) DCF 6,062,892 28% 1,697,610
Other operations
UT Technologies LLC Book value 50,000
Qatar Telecom QSC Book value 120,154
Sudan Telecom. Company Ltd. Book value 74,886
Dubai Global Sukuk FZCO Book value 128,590
Wings FZCO Book value 91,850
Emirates Sudan Bank Book value 9,277
New ICO Global Communications Book value -
Cash & Bank Balances 13,392,873
Debt 6,724,884
Total Equity Value 161,863,292
Number of shares outstanding (in ‘000) 5,989,500
Per share value (AED) 27.02
Source: Global Research

Global Research - GCC Global Investment House
88 GCC Telecom Sector August 2008
BA
LA
NC
E S
HE
ET
Em
irat
es T
elec
omm
unic
atio
ns C
orpo
rati
on “
Eti
sala
t”A
ED
’000
2005
2006
2007
2008
F20
09F
2010
F20
11F
Fixe
d as
sets
8,4
80,3
00
8,4
95,5
80
11,
875,
953
13,
783,
805
15,
621,
002
17,
296,
205
18,
734,
914
Inta
ngib
les
-
-
1,6
86,8
47
2,1
08,5
59
2,3
19,4
15
2,4
35,3
85
2,5
57,1
55
Lic
ense
s -
1
1,23
0,39
8 1
2,19
9,49
8 1
1,73
7,99
4 1
1,32
9,26
0 1
0,96
7,68
8 1
0,64
4,68
3 In
vest
men
ts in
join
t ven
ture
s an
d as
soci
ates
2,2
07,7
15
11,
853,
648
13,
407,
470
15,
851,
702
17,
130,
634
19,
158,
430
21,
779,
001
Oth
er in
vest
men
ts 3
65,2
10
365
,210
3
65,2
10
456
,513
4
79,3
38
485
,045
4
86,4
71
Loa
ns to
ass
ocia
ted
unde
rtak
ing
35,
472
410
,175
-
-
-
-
-
D
efer
red
tax
asse
t -
-
1
2,12
4 9
6,99
2 1
21,2
40
151
,550
1
89,4
38
Tot
al lo
ng t
erm
ass
ets
11,
088,
697
32,
355,
011
39,
547,
102
44,
035,
565
47,
000,
888
50,
494,
303
54,
391,
662
Stor
es 1
04,5
45
65,
857
175
,207
2
19,0
09
262
,811
3
02,2
32
332
,455
D
ebto
rs a
nd p
repa
ymen
ts 3
,115
,976
1
,090
,684
2
,046
,838
3
,070
,257
4
,298
,360
5
,587
,868
6
,705
,441
D
ues
from
ass
ocia
tes
-
1,7
21,4
89
210
,470
0
0
0
0
L
oans
to a
ssoc
iate
s 8
,868
5
6,27
0 -
-
-
-
-
A
mou
nts
due
from
oth
er te
leco
mm
unic
atio
n ad
min
istr
atio
ns 3
50,9
46
315
,118
1
,035
,477
1
,553
,216
2
,174
,502
2
,826
,852
3
,392
,223
B
ank
and
cash
bal
ance
s 9
,658
,510
1
0,30
4,03
3 9
,432
,564
1
3,77
9,09
3 1
3,68
3,89
2 1
3,72
0,92
9 1
2,83
9,65
2 T
otal
cur
rent
ass
ets
13,
238,
845
13,
553,
451
12,
900,
556
18,
621,
574
20,
419,
564
22,
437,
881
23,
269,
771
Tot
al a
sset
s 2
4,32
7,54
2 4
5,90
8,46
2 5
2,44
7,65
8 6
2,65
7,13
9 6
7,42
0,45
3 7
2,93
2,18
4 7
7,66
1,43
3
Cre
dito
rs a
nd a
ccru
als
6,2
27,5
44
8,5
68,4
50
13,
230,
521
16,
191,
089
16,
878,
893
17,
358,
407
17,
486,
475
Am
ount
s du
e to
oth
er te
leco
mm
unic
atio
ns a
dmin
istr
atio
ns 1
,049
,330
9
32,4
94
1,2
99,1
78
1,7
53,8
90
2,1
04,6
68
2,4
20,3
69
2,6
62,4
06
Am
ount
s pa
yabl
e on
acq
uisi
tion
of in
vest
men
ts a
nd li
cens
es -
9
78,8
83
1,0
45,7
34
1,1
71,3
43
978
,883
9
78,8
83
0
Shor
t ter
m lo
ans
from
inve
stm
ent p
artn
ers
-
1,5
37,4
26
-
-
-
-
-
Ban
k bo
rrow
ings
-
-
3
43,0
00
3,7
80,1
30
2,8
35,0
98
2,2
68,0
78
1,4
36,4
50
Prop
osed
div
iden
d 9
07,5
00
1,5
88,1
25
1,7
46,9
37
-
-
-
-
Tot
al c
urre
nt li
abili
ties
8,1
84,3
74
13,
605,
378
17,
665,
370
22,
896,
452
22,
797,
542
23,
025,
737
21,
585,
330
Ban
k bo
rrow
ings
-
6
,980
,600
3
,140
,921
1
,806
,397
1
,987
,037
2
,185
,740
2
,295
,027
A
dvan
ces
from
inve
stm
ent p
artn
ers
-
551
,059
6
08,8
63
852
,408
9
37,6
49
975
,155
9
94,6
58
Lon
g te
rm lo
ans
from
inve
stm
ent p
artn
ers
-
-
1,6
42,9
55
1,7
74,3
91
1,8
63,1
11
1,9
56,2
67
2,0
54,0
80
Am
ount
s pa
yabl
es o
n ac
quis
ition
of
inve
stm
ents
and
lice
nses
-
2,9
36,6
53
2,0
57,6
34
1,9
57,7
66
978
,883
0
0
Pr
ovis
ion
for
staf
f te
rmin
al b
enef
its 4
16,8
32
440
,295
5
33,8
08
747
,331
8
96,7
97
986
,477
1
,006
,207
D
efer
red
tax
liabi
lity
-
-
146
,895
2
05,6
53
226
,218
2
48,8
40
273
,724
N
on c
urre
nt p
ortio
n of
cre
dito
rs -
-
7
56,2
20
659
,225
8
56,9
92
942
,691
9
89,8
26
Tot
al lo
ng t
erm
liab
iliti
es 4
16,8
32
10,
908,
607
8,8
87,2
96
8,0
03,1
71
7,7
46,6
87
7,2
95,1
70
7,6
13,5
22
Tot
al li
abili
ties
8,6
01,2
06
24,
513,
985
26,
552,
666
30,
899,
623
30,
544,
230
30,
320,
907
29,
198,
851
Shar
e ca
pita
l 3
,630
,000
4
,537
,500
4
,991
,250
5
,989
,500
5
,989
,500
5
,989
,500
5
,989
,500
R
eser
ves
12,
020,
000
14,
418,
604
18,
876,
586
23,
856,
845
28,
869,
478
34,
293,
208
39,
943,
745
Gai
n on
dilu
tion
of in
tere
st in
an
asso
ciat
e -
1
63,4
25
163
,425
1
38,9
11
125
,020
1
18,7
69
112
,831
U
napp
ropr
iate
d pr
ofit
76,
306
67,
168
25,
725
523
,751
8
24,5
09
932
,984
8
19,9
73
Min
ority
inte
rest
30
2,2
07,7
80
1,8
38,0
06
1,2
48,5
09
1,0
67,7
17
1,2
76,8
17
1,5
96,5
33
Tot
al e
quit
y 1
5,72
6,33
6 2
1,39
4,47
7 2
5,89
4,99
2 3
1,75
7,51
6 3
6,87
6,22
3 4
2,61
1,27
7 4
8,46
2,58
2 T
otal
liab
iliti
es &
equ
ity
24,
327,
542
45,
908,
462
52,
447,
658
62,
657,
139
67,
420,
453
72,
932,
184
77,
661,
433
Sour
ce:
Com
pany
Rep
orts
and
Glo
bal R
esea
rch

Global Research - GCC Global Investment House
August 2008 GCC Telecom Sector 89
INC
OM
E S
TA
TE
ME
NT
Em
irat
es T
elec
omm
unic
atio
ns C
orpo
rati
on “
Eti
sala
t”
AE
D’0
0020
0520
0620
0720
08F
2009
F20
10F
2011
F
Rev
enue
s 1
2,86
5,89
4 1
6,29
0,25
7 2
1,33
9,85
2 2
7,38
7,34
5 3
2,10
9,51
5 3
5,86
7,99
3 3
8,57
8,48
3
CO
GS
(2,
942,
997)
(3,
387,
399)
(5,
134,
248)
(7,
668,
457)
(9,
472,
307)
(10
,939
,738
) (
13,1
16,6
84)
Gro
ss p
rofi
t 9
,922
,897
1
2,90
2,85
8 1
6,20
5,60
4 1
9,71
8,88
8 2
2,63
7,20
8 2
4,92
8,25
5 2
5,46
1,79
9
Reg
ulat
ory
expe
nses
(12
6,17
2) (
388,
215)
(64
4,31
6) (
784,
000)
(90
0,02
9) (
991,
119)
(1,
012,
332)
EB
ITD
A 9
,796
,725
1
2,51
4,64
3 1
5,56
1,28
8 1
8,93
4,88
8 2
1,73
7,17
9 2
3,93
7,13
7 2
4,44
9,46
7
Am
ortiz
atio
n -
(
5,72
9) (
593,
756)
(61
7,78
9) (
596,
277)
(57
7,24
7) (
560,
247)
Dep
reci
atio
n ex
pens
e (
1,37
2,87
3) (
1,39
1,34
9) (
1,36
8,18
2) (
1,69
6,63
5) (
1,92
2,19
8) (
2,15
1,82
0) (
2,38
1,00
3)
Net
ope
rati
ng p
rofi
t 8
,423
,852
1
1,11
7,56
5 1
3,59
9,35
0 1
6,62
0,46
4 1
9,21
8,70
4 2
1,20
8,07
0 2
1,50
8,21
8
Inte
rest
exp
ense
-
(26
1,69
2) (
503,
139)
(60
1,51
1) (
565,
668)
(55
1,45
8) (
508,
154)
Inte
rest
inco
me
280
,502
4
75,7
04
622
,715
5
65,9
54
826
,746
8
21,0
34
823
,256
Shar
e of
res
ults
of
asso
ciat
ed u
nder
taki
ngs
(25
1,31
2) 2
67,0
18
380
,042
6
05,5
59
646
,817
8
10,9
56
1,4
95,8
24
Oth
er in
com
e 5
9,02
0 7
1,04
9 4
0,39
8 2
,444
,438
4
8,47
8 5
8,17
3 6
3,99
0
Min
ority
inte
rest
-
49,
850
576
,218
5
89,4
97
180
,792
(
209,
100)
(31
9,71
6)
Net
pro
fit
befo
re t
axes
and
roy
alty
fee
s 8
,512
,062
1
1,71
9,49
4 1
4,71
5,58
4 2
0,22
4,40
2 2
0,35
5,86
9 2
2,13
7,67
4 2
3,06
3,41
9
Tax
es -
-
(
122,
296)
(30
3,36
6) (
305,
338)
(44
2,75
4) (
461,
268)
Net
pro
fit
befo
re r
oyal
ty f
ees
8,5
12,0
62
11,
719,
494
14,
593,
288
19,
921,
036
20,
050,
531
21,
694,
920
22,
602,
151
Roy
alte
e fe
es (
4,25
6,03
1) (
5,85
9,74
7) (
7,29
6,64
4) (
9,96
0,51
8) (
10,0
25,2
65)
(10
,847
,460
) (
11,3
01,0
75)
Net
pro
fit
4,2
56,0
31
5,8
59,7
47
7,2
96,6
44
9,9
60,5
18
10,
025,
265
10,
847,
460
11,
301,
075
P&
L A
ppro
pria
tion
acc
ount
Ret
aine
d ea
rnin
gs (
Beg
.) 3
5,27
5 7
6,30
6 6
7,16
8 2
5,72
5 5
23,7
51
824
,509
9
32,9
84
Net
pro
fit
4,2
56,0
31
5,8
59,7
47
7,2
96,6
44
9,9
60,5
18
10,
025,
265
10,
847,
460
11,
301,
075
Div
iden
ds (
1,81
5,00
0) (
2,72
2,50
0) (
2,99
4,75
0) (
4,48
2,23
3) (
4,71
1,87
5) (
5,31
5,25
6) (
5,76
3,54
8)
Res
erve
s (
2,40
0,00
0) (
3,14
6,25
0) (
4,82
7,27
3) (
4,98
0,25
9) (
5,01
2,63
3) (
5,42
3,73
0) (
5,65
0,53
8)
Tra
nsfe
r to
sta
tuto
ry r
eser
ve -
(
135)
(3,
273)
-
-
-
-
Adj
ustm
ents
487
,209
Ret
aine
d ea
rnin
gs (
End
.) 7
6,30
6 6
7,16
8 2
5,72
5 5
23,7
51
824
,509
9
32,9
84
819
,973
Sour
ce:
Com
pany
Rep
orts
and
Glo
bal R
esea
rch
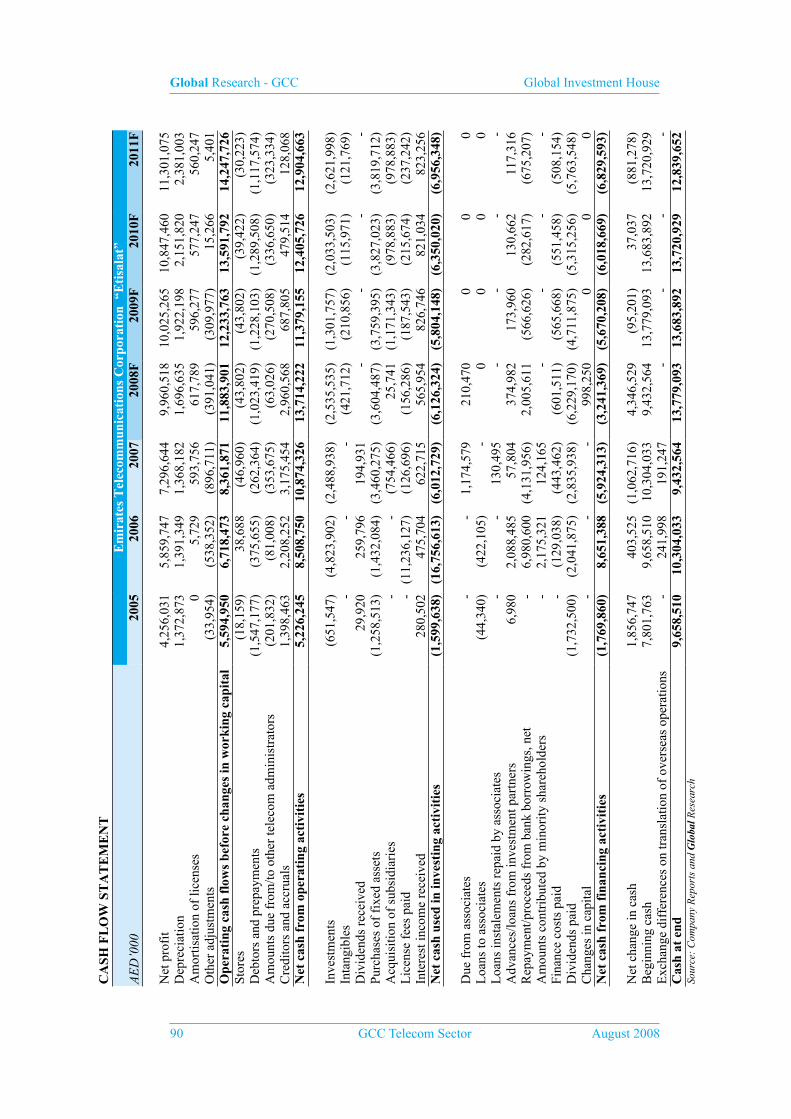
Global Research - GCC Global Investment House
90 GCC Telecom Sector August 2008
CA
SH F
LO
W S
TA
TE
ME
NT
Em
irat
es T
elec
omm
unic
atio
ns C
orpo
rati
on “
Eti
sala
t”A
ED
’000
2005
2006
2007
2008
F20
09F
2010
F20
11F
Net
pro
fit
4,2
56,0
31
5,8
59,7
47
7,2
96,6
44
9,9
60,5
18
10,
025,
265
10,
847,
460
11,
301,
075
Dep
reci
atio
n 1
,372
,873
1
,391
,349
1
,368
,182
1
,696
,635
1
,922
,198
2
,151
,820
2
,381
,003
A
mor
tisat
ion
of li
cens
es 0
5
,729
5
93,7
56
617
,789
5
96,2
77
577
,247
5
60,2
47
Oth
er a
djus
tmen
ts (
33,9
54)
(53
8,35
2) (
896,
711)
(39
1,04
1) (
309,
977)
15,
266
5,4
01
Ope
rati
ng c
ash
flow
s be
fore
cha
nges
in w
orki
ng c
apit
al 5
,594
,950
6
,718
,473
8
,361
,871
1
1,88
3,90
1 1
2,23
3,76
3 1
3,59
1,79
2 1
4,24
7,72
6 St
ores
(18
,159
) 3
8,68
8 (
46,9
60)
(43
,802
) (
43,8
02)
(39
,422
) (
30,2
23)
Deb
tors
and
pre
paym
ents
(1,
547,
177)
(37
5,65
5) (
262,
364)
(1,
023,
419)
(1,
228,
103)
(1,
289,
508)
(1,
117,
574)
Am
ount
s du
e fr
om/to
oth
er te
leco
m a
dmin
istr
ator
s (
201,
832)
(81
,008
) (
353,
675)
(63
,026
) (
270,
508)
(33
6,65
0) (
323,
334)
Cre
dito
rs a
nd a
ccru
als
1,3
98,4
63
2,2
08,2
52
3,1
75,4
54
2,9
60,5
68
687
,805
4
79,5
14
128
,068
N
et c
ash
from
ope
rati
ng a
ctiv
itie
s 5
,226
,245
8
,508
,750
1
0,87
4,32
6 1
3,71
4,22
2 1
1,37
9,15
5 1
2,40
5,72
6 1
2,90
4,66
3
Inve
stm
ents
(65
1,54
7) (
4,82
3,90
2) (
2,48
8,93
8) (
2,53
5,53
5) (
1,30
1,75
7) (
2,03
3,50
3) (
2,62
1,99
8)In
tang
ible
s -
-
-
(
421,
712)
(21
0,85
6) (
115,
971)
(12
1,76
9)D
ivid
ends
rec
eive
d 2
9,92
0 2
59,7
96
194
,931
-
-
-
-
Pu
rcha
ses
of f
ixed
ass
ets
(1,
258,
513)
(1,
432,
084)
(3,
460,
275)
(3,
604,
487)
(3,
759,
395)
(3,
827,
023)
(3,
819,
712)
Acq
uisi
tion
of s
ubsi
diar
ies
-
-
(75
4,46
6) 2
5,74
1 (
1,17
1,34
3) (
978,
883)
(97
8,88
3)L
icen
se f
ees
paid
-
(11,
236,
127)
(12
6,69
6) (
156,
286)
(18
7,54
3) (
215,
674)
(23
7,24
2)In
tere
st in
com
e re
ceiv
ed 2
80,5
02
475
,704
6
22,7
15
565
,954
8
26,7
46
821
,034
8
23,2
56
Net
cas
h us
ed in
inve
stin
g ac
tivi
ties
(1,
599,
638)
(16
,756
,613
) (
6,01
2,72
9) (
6,12
6,32
4) (
5,80
4,14
8) (
6,35
0,02
0) (
6,95
6,34
8)
Due
fro
m a
ssoc
iate
s -
-
1
,174
,579
2
10,4
70
0
0
0
Loa
ns to
ass
ocia
tes
(44
,340
) (
422,
105)
-
0
0
0
0
Loa
ns in
stal
emen
ts r
epai
d by
ass
ocia
tes
-
-
130
,495
-
-
-
-
A
dvan
ces/
loan
s fr
om in
vest
men
t par
tner
s 6
,980
2
,088
,485
5
7,80
4 3
74,9
82
173
,960
1
30,6
62
117
,316
R
epay
men
t/pro
ceed
s fr
om b
ank
borr
owin
gs, n
et -
6
,980
,600
(
4,13
1,95
6) 2
,005
,611
(
566,
626)
(28
2,61
7) (
675,
207)
Am
ount
s co
ntri
bute
d by
min
ority
sha
reho
lder
s -
2
,175
,321
1
24,1
65
-
-
-
-
Fina
nce
cost
s pa
id -
(
129,
038)
(44
3,46
2) (
601,
511)
(56
5,66
8) (
551,
458)
(50
8,15
4)D
ivid
ends
pai
d (
1,73
2,50
0) (
2,04
1,87
5) (
2,83
5,93
8) (
6,22
9,17
0) (
4,71
1,87
5) (
5,31
5,25
6) (
5,76
3,54
8)C
hang
es in
cap
ital
-
-
-
998
,250
0
0
0
N
et c
ash
from
fin
anci
ng a
ctiv
itie
s (
1,76
9,86
0) 8
,651
,388
(
5,92
4,31
3) (
3,24
1,36
9) (
5,67
0,20
8) (
6,01
8,66
9) (
6,82
9,59
3)
Net
cha
nge
in c
ash
1,8
56,7
47
403
,525
(
1,06
2,71
6) 4
,346
,529
(
95,2
01)
37,
037
(88
1,27
8)B
egin
ning
cas
h 7
,801
,763
9
,658
,510
1
0,30
4,03
3 9
,432
,564
1
3,77
9,09
3 1
3,68
3,89
2 1
3,72
0,92
9 E
xcha
nge
diff
eren
ces
on tr
ansl
atio
n of
ove
rsea
s op
erat
ions
-
241
,998
1
91,2
47
-
-
-
-
Cas
h at
end
9,6
58,5
10
10,
304,
033
9,4
32,5
64
13,
779,
093
13,
683,
892
13,
720,
929
12,
839,
652
Sour
ce:
Com
pany
Rep
orts
and
Glo
bal R
esea
rch

Global Research - GCC Global Investment House
August 2008 GCC Telecom Sector 91
FA
CT
SH
EE
TE
mir
ates
Tel
ecom
mun
icat
ions
Cor
pora
tion
“E
tisa
lat”
2005
2006
2007
2008
F20
09F
2010
F20
11F
LIQ
UID
ITY
RA
TIO
SC
urre
nt r
atio
(tim
es)
1.6
1.0
0.7
0.8
0.9
1.0
1.1
Cas
h ra
tio (
times
)1.
20.
80.
50.
60.
60.
60.
6
PR
OF
ITA
BIL
ITY
RA
TIO
SG
ross
Mar
gin
77.1
%79
.2%
75.9
%72
.0%
70.5
%69
.5%
66.0
%E
BIT
DA
Mar
gin
76.1
%76
.8%
72.9
%69
.1%
67.7
%66
.7%
63.4
%N
et P
rofi
t Mar
gin
33.1
%36
.0%
34.2
%36
.4%
31.2
%30
.2%
29.3
%R
OE
27
.1%
27.4
%28
.2%
31.4
%27
.2%
25.5
%23
.3%
RO
A
17.5
%12
.8%
13.9
%15
.9%
14.9
%14
.9%
14.6
%
AC
TIV
ITY
RA
TIO
SA
/R T
urno
ver
(tim
es)
5.49
7.74
13.6
010
.70
8.72
7.26
6.28
A/P
Tur
nove
r (t
imes
)0.
51.
63.
33.
02.
62.
22.
1
LE
VE
RA
GE
RA
TIO
SD
ebt t
o eq
uity
(tim
es)
0.0
0.4
0.2
0.3
0.2
0.2
0.1
Deb
t to
tota
l ass
ets
0.0
0.2
0.1
0.1
0.1
0.1
0.1
Div
iden
ds p
ayou
t rat
io
42.6
%46
.5%
41.0
%45
.0%
47.0
%49
.0%
51.0
%
GR
OW
TH
RA
TE
SR
even
ue g
row
th r
ate
23.3
%26
.6%
31.0
%28
.3%
17.2
%11
.7%
7.6%
Net
inco
me
grow
th r
ate
24.5
%37
.7%
24.5
%36
.5%
0.7%
8.2%
4.2%
Equ
ity g
row
th r
ate
18.4
%36
.0%
21.0
%22
.6%
16.1
%15
.6%
13.7
%T
otal
ass
ets
grow
th r
ate
19.3
%88
.7%
14.2
%19
.5%
7.6%
8.2%
6.5%
RA
TIO
S U
SED
FO
R V
AL
UA
TIO
NB
V p
er s
hare
- A
djus
ted
(AE
D)
2.63
3.57
4.32
5.30
6.16
7.11
8.09
EPS
- A
djus
ted
(AE
D)
0.71
0.98
1.22
1.66
1.67
1.81
1.89
Mar
ket p
rice
sha
re (
AE
D)
16.9
812
.88
19.2
218
.018
.018
.018
.0M
arke
t cap
italiz
atio
n (A
ED
000
) 6
1,63
7,40
0 5
8,44
3,00
0 9
5,93
1,82
5 1
07,8
11,0
00
107
,811
,000
1
07,8
11,0
00
107
,811
,000
E
nter
pris
e V
alue
(E
V A
ED
000
) 5
1,97
8,89
0 5
6,65
6,99
3 9
2,38
2,35
7 1
02,0
52,0
50
101
,669
,345
1
01,4
42,8
47
101
,746
,730
E
V /
EB
ITD
A5.
314.
535.
945.
394.
684.
244.
16P/
E r
atio
23.
9 1
3.2
15.
8 1
0.8
10.
8 9
.9
9.5
P/
BV
rat
io 6
.5
3.6
4
.4
3.4
2
.9
2.5
2
.2
Sour
ce:
Com
pany
Rep
orts
and
Glo
bal R
esea
rch
* M
arke
t pri
ce fo
r 20
08 a
nd s
ubse
quen
t yea
rs a
s on
Aug
ust 3
1, 2
008
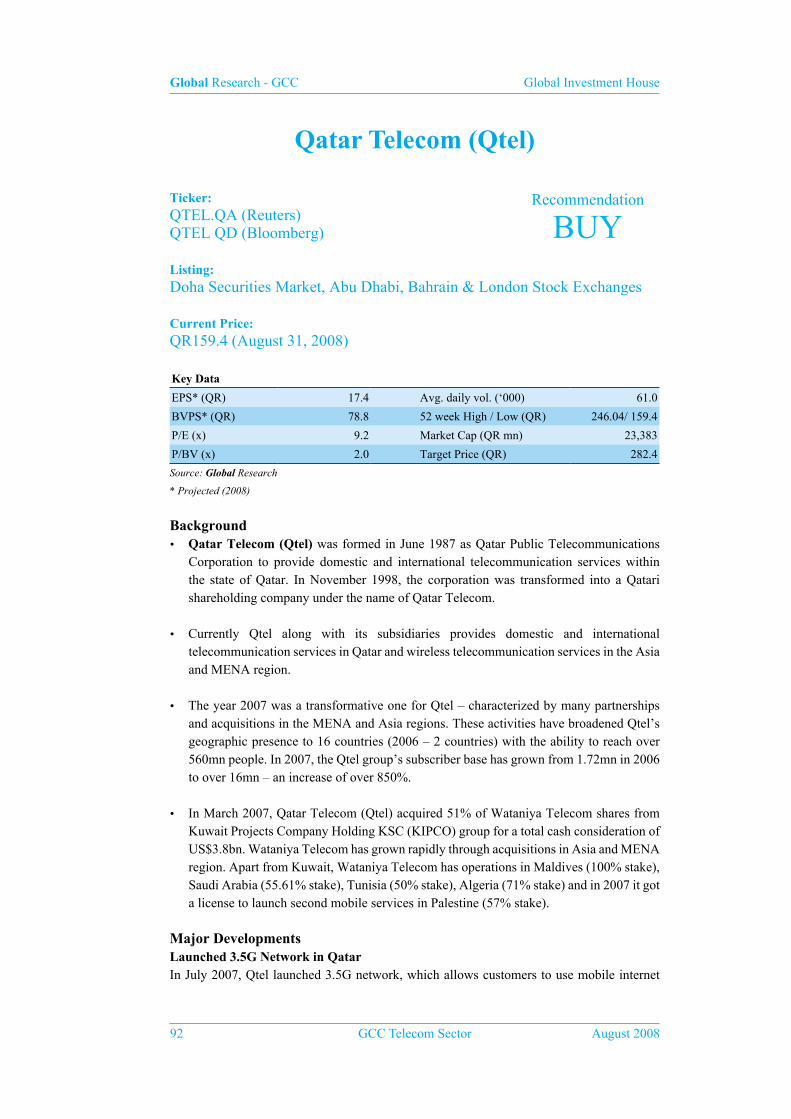
Global Research - GCC Global Investment House
92 GCC Telecom Sector August 2008
Qatar Telecom (Qtel)
Ticker:QTEL.QA (Reuters)QTEL QD (Bloomberg)
Listing:Doha Securities Market, Abu Dhabi, Bahrain & London Stock Exchanges
Current Price:QR159.4 (August 31, 2008)
Key Data
EPS* (QR) 17.4 Avg. daily vol. (‘000) 61.0
BVPS* (QR) 78.8 52 week High / Low (QR) 246.04/ 159.4
P/E (x) 9.2 Market Cap (QR mn) 23,383
P/BV (x) 2.0 Target Price (QR) 282.4
Source: Global Research
* Projected (2008)
Background• Qatar Telecom (Qtel) was formed in June 1987 as Qatar Public Telecommunications
Corporation to provide domestic and international telecommunication services within the state of Qatar. In November 1998, the corporation was transformed into a Qatari shareholding company under the name of Qatar Telecom.
• Currently Qtel along with its subsidiaries provides domestic and international telecommunication services in Qatar and wireless telecommunication services in the Asia and MENA region.
• The year 2007 was a transformative one for Qtel – characterized by many partnerships and acquisitions in the MENA and Asia regions. These activities have broadened Qtel’s geographic presence to 16 countries (2006 – 2 countries) with the ability to reach over 560mn people. In 2007, the Qtel group’s subscriber base has grown from 1.72mn in 2006 to over 16mn – an increase of over 850%.
• In March 2007, Qatar Telecom (Qtel) acquired 51% of Wataniya Telecom shares from Kuwait Projects Company Holding KSC (KIPCO) group for a total cash consideration of US$3.8bn. Wataniya Telecom has grown rapidly through acquisitions in Asia and MENA region. Apart from Kuwait, Wataniya Telecom has operations in Maldives (100% stake), Saudi Arabia (55.61% stake), Tunisia (50% stake), Algeria (71% stake) and in 2007 it got a license to launch second mobile services in Palestine (57% stake).
Major Developments Launched 3.5G Network in QatarIn July 2007, Qtel launched 3.5G network, which allows customers to use mobile internet
Recommendation
BUY

Global Research - GCC Global Investment House
August 2008 GCC Telecom Sector 93
services at up to six times the previous 3G speeds. Qtel’s 3.5G network covers most of the East Coast of Qatar including Doha, Wakrah, Rayyan, Messaieed, Khor and Ras Laffan. Qtel is continuously working on improving the coverage further within these areas and also to roll out the 3.5G network to other areas.
Acquisition of 40.8% holding in Indonesia-based PT IndosatIn June 2008, Qtel acquired a 40.8% stake in PT Indosat Tbk, Indonesia’s second-largest phone company, from its subsidiary Asia Mobile Holding Pte. Ltd. In June, Qtel and Singapore Technologies Telemedia Pte Ltd (ST Telemedia) announced that their jointly held subsidiary, Asia Mobile Holding Pte. Ltd. (AMH), will sell its 40.8% interest in PT Indosat Tbk to Qtel. As per the terms of the Agreements, Qtel has agreed to pay US$1.8bn in cash to acquire AMH’s total interest in Indosat. Qtel plans to further increase its stake in PT Indosat, however, Qtel will be restricted to buy 49% of PT Indosat as indicated by Communication Minister of Indonesia.
PT Indosat is an integrated telecom operator providing a full complement of national and international telecommunications services in Indonesia. It is the second-largest cellular operator, as measured by number of cellular subscribers, and one of the providers of international long distance services in Indonesia. It also provide MIDI services (fixed data services, which include multimedia, data communications and Internet) to Indonesian and regional corporate and retail customers. During 2007, its operating revenues totaled US$1,755.4mn (Rp16,488.5bn).
Rights IssueIn June 2008, Qtel raised its capital by 33.3% through rights issue. It offered 36.7mn shares in the ratio of 1:3. The offer price was QR160 per share, consisting of a par value of QR10 and a premium of QR150 per share.
Analysis of Company’s Operations
Telecom Sector in QatarQatar telecom market is characterized as monopolistic in nature since Qtel is the only player providing whole range of telecommunication services in the country. However, recently in June 2008 the telecom regulatory authority, ictQatar, granted the second mobile license to Vodafone Qatar. It won a US$2.12bn tender for the second GSM license in Qatar and is planning to launch its services during the first quarter of 2009. ictQatar has also opened a tender to operate the country’s second fixedline network, receiving offers from eight international firms or consortia. Therefore going forward, from 2009 onwards Qatar will have a duopoly market structure for both GSM as well as fixed line network with the advent of second operators in both the segments.
Penetration RateOver the last few years, GSM penetration rate has been rising rather steeply in Qatar, which went up from 64.9% in 2004 to 143.4% in 2007. Going forward Qatar’s GSM segment will have a duopoly market structure from 2009 onwards with the advent of a second GSM operator. Till then Qtel will keenly focus on market penetration to have a larger market share.

Global Research - GCC Global Investment House
94 GCC Telecom Sector August 2008
Chart 1: GSM Market Penetration & Growth in Subscribers
64.9%
90.0%
109.7%
143.4%
-
200,000
400,000
600,000
800,000
1,000,000
1,200,000
1,400,000
2004 2005 2006 2007
0%
20%
40%
60%
80%
100%
120%
140%
160%
Subcribers Penetration
Source: Company Reports & Global Research
Till the end of Q1-2008 the penetration rate is estimated to have crossed 150% in Qatar. Going forward, we believe that as part of Qtel’s aggressive focus on promotional campaigns and value added services there will be a faster growth in GSM penetration level.
Growth in SubscribersOver 2004-2007, Qtel’s subscriber base grew at a CAGR of 37.1%. During 2007, it added 344,433 new customers with this total subscriber base reached to 1.26mn. Qtel’s prepaid customer base has seen strong growth in 2007, a 43.5% increase over the last year brought the count of prepaid customers to 1.05mn customers. Qtel’s postpaid subscriber base grew at the rate of 13.4% in 2007 to reach 209, 307. With this the customer segmentation between prepaid and postpaid changed to 83:17 in 2007 from 80:20 in 2006. In Q1-2008, the GSM subscriber base increased further by 143,411 to 1.41mn.
During the current year we believe that Qtel will aggressively try to increase its GSM subscriber base. Going forward, with the advent of competition in 2009, Qtel’s market share is projected to fall to 92% and 85% in 2009 and 2010 respectively.
Trend in ARPUOver the last few years, Qtel has been enjoying the highest blended ARPU in the region, its blended ARPU was at QR210 (US$57.7) for 2007 which was at QR229 (US$62.9) for 2006. Going forward, we expect that ARPU is likely to come under further pressure especially from 2009 onwards due to competitive pressure.
Fixed Line Over the last few years, fixed line penetration rate has been rising marginally and hovered in the range of 25%-26%, however in 2006 and 2007 it went up to 27.2% and 28.3% respectively.
Over 2004-2007, subscriber base under this segment grew at a CAGR of 7.5% and ended the year 2007 with a subscriber base of 237,368, adding 9,041 new customers during the year. In Q1-2007 the number of subscriber base increased to 243,276 over 2007 year-end numbers.
Global Research - GCC Global Investment House
August 2008 GCC Telecom Sector 95
Internet In the last few years, internet penetration level in Qatar had grown at a faster pace. The penetration level, though stands in single digit, have increased to 9.9% in 2007 from just 4.8% at the end of 2004. The internet subscriber base grew at a CAGR of 33.5% during 2004-2007. The internet subscribers increased from 69,527 in 2006 to 86,959 at the end of 2007, witnessing a growth of 25% per annum.
During Q1-2008, the company witnessed a y-t-d growth of 8.7% in internet subscriber base which increased to 94,555, indicating a growing internet culture. Going forward, we believe that there will be a substantial expansion in the internet subscriber base in the country.
Cable VisionIn this segment, over the last few years, Qtel has been continuously losing its subscriber base and during 2007 it witnessed 28.4% decline in subscriber numbers to 8,194. In Q1-2008, the subscriber base under this segment declined further to 7,567.
Triple PlayIn 2006, Qtel launched its Triple Play, a three-in-one service that offers audio, video and data through a single line. A key feature of Triple Play is that all the three services it offers can be used simultaneously. In other words, the line will not get engaged if any of the three services is made operational. At the end of 2007, the subscriber base was at 5,446 under this segment, which declined to 5,204 at the end of Q1-2008.
Nawras Telecom - OmanNawras Telecom (Omani Qatari Telecommunications Company) had a 41% market share of Omani GSM segment at the end of 2007. The year end penetration rate for 2007 was 96.2% for Omani GSM segment. We expect that at the end of 2008 the GSM penetration in Oman will reach 115%-plus. In 2007, the country witnessed a growth of 38% in its GSM subscriber base to reach 2.5mn.
Out of the total new customer additions of 681,976 in Oman, Nawras acquired 65% of the total market additions. During 2007 Nawras added 444,950 new customers, a growth of 78%, and ended the year with 1.02mn customer base. Out of the total subscribers, 92% were prepaid and the rest were postpaid. At the end of Q1-2008, Nawras’s subscriber base increased to 1.16mn.
Financial Performance
Revenue CompositionIn FY2007, Qtel reported a y-o-y growth of 134.7% in its consolidated revenue which increased to QR10,373.4mn from QR4,420.4mn achieved in FY2006. The acquisition of Wataniya and Asia Cell aided the growth in group revenues for 2007. The revenue from its domestic operations accounted for 42.9% of Qtel’s total revenue, Wataniya accounted for 41.4%, Oman operation accounted for 8.6% and Iraq (Asia Cell) contributed 7.1%. With regard to Qtel’s domestic operations, wireless segment accounted for 70.3% of Qtel’s total domestic revenue and wireline segment accounted for the remaining 29.7%.

Global Research - GCC Global Investment House
96 GCC Telecom Sector August 2008
Chart 2: Qtel’s Revenue Compositions 2007
Qatar 42.9%
Oman - Nawras 8.6%
Wataniya 41.4%
Wi-tribe 0.1%Asia Cell Iraq 7.1%
Source: Qatar Telecom and Global Research
Wireless Segment - QatarQtel’s GSM business witnessed a growth of 22.1% in its revenues which increased to QR3,128.3mn in FY2007 from QR2,562.8mn in FY2006. The major revenue drivers for GSM segment are high ARPU levels, though declining, apart from 37.4% growth in total subscriber base.
Wireline SegmentFixed line, internet, other revenue (consisting of equipment sales and rental incomes of wireline segment) and cable TV are the three business components under wireline segment. In FY2007, Qtel’s wireline revenue declined by 5% to reach QR1,319.1mn. The fixed line business, the major revenue contributor to wireline segment, witnessed a growth of 7.8% while internet business witnessed a revenue growth of 19.6%. The company’s revenue from cable TV segment grew by 25.6% to reach QR35mn in FY2007.
Revenue, Margins & ProfitabilityIn FY2007, Qtel’s business in Qatar saw revenue growth of 12.6% which increased from QR3,950.8mn to QR4447.3mn. This growth in revenue continues to be driven predominantly by wireless segment as revenue from fixed line segment registered a decline in FY2007. Its EBITDA from Qatar operations grew by 12.9% to QR2,924.6mn. Its net profit for Qatar operations declined by 22.5% to QR1,354.7mn. Significant increase in finance cost had a dampening effect on the company’s net profit from Qatar operations as it increased to QR790.9mn from QR658,000 in FY2006.
Qtel’s total revenue stood at QR10,373.4mn at the end of FY2007, which displayed a growth of 134.7% over FY2006. Its EBITDA margin declined to 49.9% in FY2007 from 59.2% in FY2006. With a y-o-y growth of 97.5% in FY2007, its EBITDA reached to QR5,171.7mn as compared to QR2,626.6mn in FY2006.
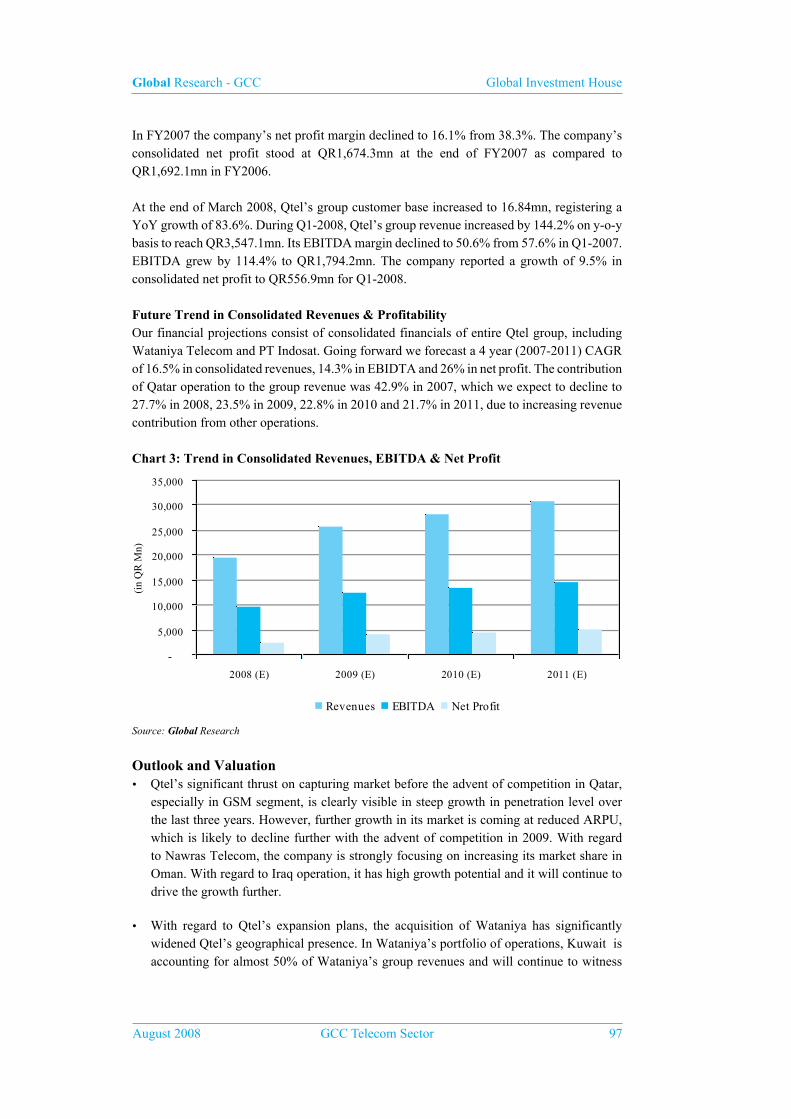
Global Research - GCC Global Investment House
August 2008 GCC Telecom Sector 97
In FY2007 the company’s net profit margin declined to 16.1% from 38.3%. The company’s consolidated net profit stood at QR1,674.3mn at the end of FY2007 as compared to QR1,692.1mn in FY2006.
At the end of March 2008, Qtel’s group customer base increased to 16.84mn, registering a YoY growth of 83.6%. During Q1-2008, Qtel’s group revenue increased by 144.2% on y-o-y basis to reach QR3,547.1mn. Its EBITDA margin declined to 50.6% from 57.6% in Q1-2007. EBITDA grew by 114.4% to QR1,794.2mn. The company reported a growth of 9.5% in consolidated net profit to QR556.9mn for Q1-2008.
Future Trend in Consolidated Revenues & ProfitabilityOur financial projections consist of consolidated financials of entire Qtel group, including Wataniya Telecom and PT Indosat. Going forward we forecast a 4 year (2007-2011) CAGR of 16.5% in consolidated revenues, 14.3% in EBIDTA and 26% in net profit. The contribution of Qatar operation to the group revenue was 42.9% in 2007, which we expect to decline to 27.7% in 2008, 23.5% in 2009, 22.8% in 2010 and 21.7% in 2011, due to increasing revenue contribution from other operations.
Chart 3: Trend in Consolidated Revenues, EBITDA & Net Profit
-
5,000
10,000
15,000
20,000
25,000
30,000
35,000
2008 (E) 2009 (E) 2010 (E) 2011 (E)
(in
QR
Mn)
Revenues EBITDA Net Profit
Source: Global Research
Outlook and Valuation• Qtel’s significant thrust on capturing market before the advent of competition in Qatar,
especially in GSM segment, is clearly visible in steep growth in penetration level over the last three years. However, further growth in its market is coming at reduced ARPU, which is likely to decline further with the advent of competition in 2009. With regard to Nawras Telecom, the company is strongly focusing on increasing its market share in Oman. With regard to Iraq operation, it has high growth potential and it will continue to drive the growth further.
• With regard to Qtel’s expansion plans, the acquisition of Wataniya has significantly widened Qtel’s geographical presence. In Wataniya’s portfolio of operations, Kuwait is accounting for almost 50% of Wataniya’s group revenues and will continue to witness
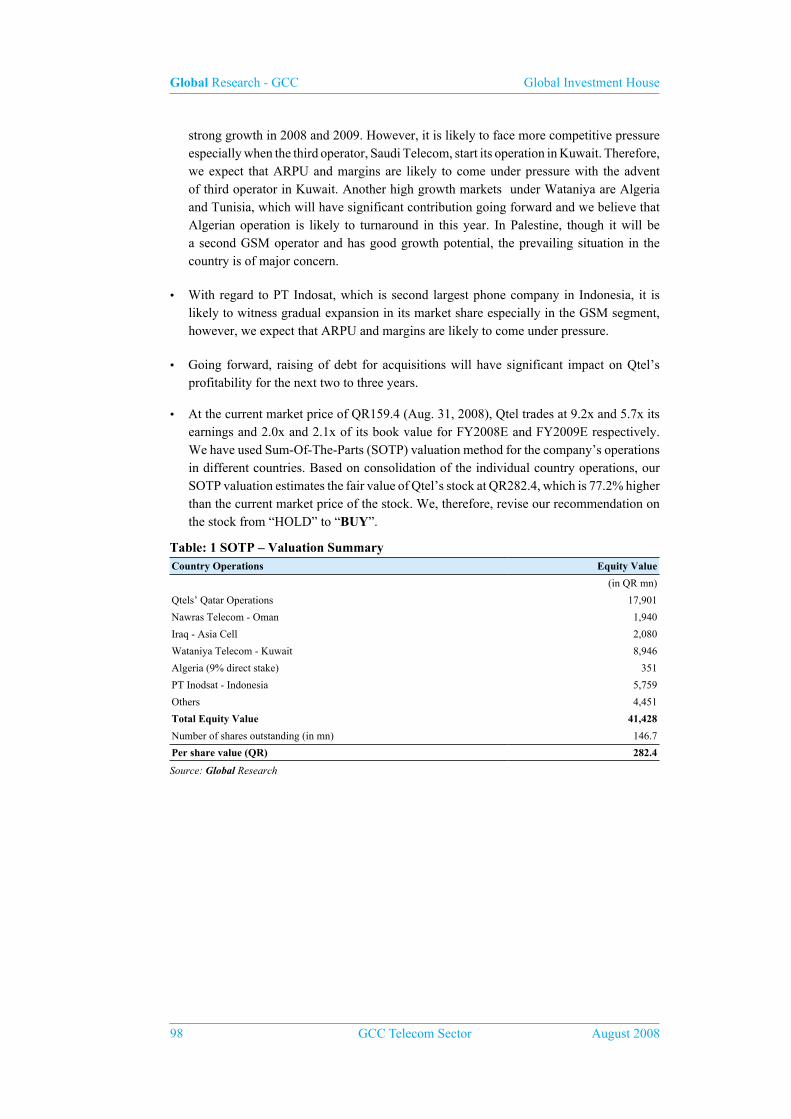
Global Research - GCC Global Investment House
98 GCC Telecom Sector August 2008
strong growth in 2008 and 2009. However, it is likely to face more competitive pressure especially when the third operator, Saudi Telecom, start its operation in Kuwait. Therefore, we expect that ARPU and margins are likely to come under pressure with the advent of third operator in Kuwait. Another high growth markets under Wataniya are Algeria and Tunisia, which will have significant contribution going forward and we believe that Algerian operation is likely to turnaround in this year. In Palestine, though it will be a second GSM operator and has good growth potential, the prevailing situation in the country is of major concern.
• With regard to PT Indosat, which is second largest phone company in Indonesia, it is likely to witness gradual expansion in its market share especially in the GSM segment, however, we expect that ARPU and margins are likely to come under pressure.
• Going forward, raising of debt for acquisitions will have significant impact on Qtel’s profitability for the next two to three years.
• At the current market price of QR159.4 (Aug. 31, 2008), Qtel trades at 9.2x and 5.7x its earnings and 2.0x and 2.1x of its book value for FY2008E and FY2009E respectively. We have used Sum-Of-The-Parts (SOTP) valuation method for the company’s operations in different countries. Based on consolidation of the individual country operations, our SOTP valuation estimates the fair value of Qtel’s stock at QR282.4, which is 77.2% higher than the current market price of the stock. We, therefore, revise our recommendation on the stock from “HOLD” to “BUY”.
Table: 1 SOTP – Valuation SummaryCountry Operations Equity Value
(in QR mn)
Qtels’ Qatar Operations 17,901
Nawras Telecom - Oman 1,940
Iraq - Asia Cell 2,080
Wataniya Telecom - Kuwait 8,946
Algeria (9% direct stake) 351
PT Inodsat - Indonesia 5,759
Others 4,451
Total Equity Value 41,428
Number of shares outstanding (in mn) 146.7
Per share value (QR) 282.4
Source: Global Research
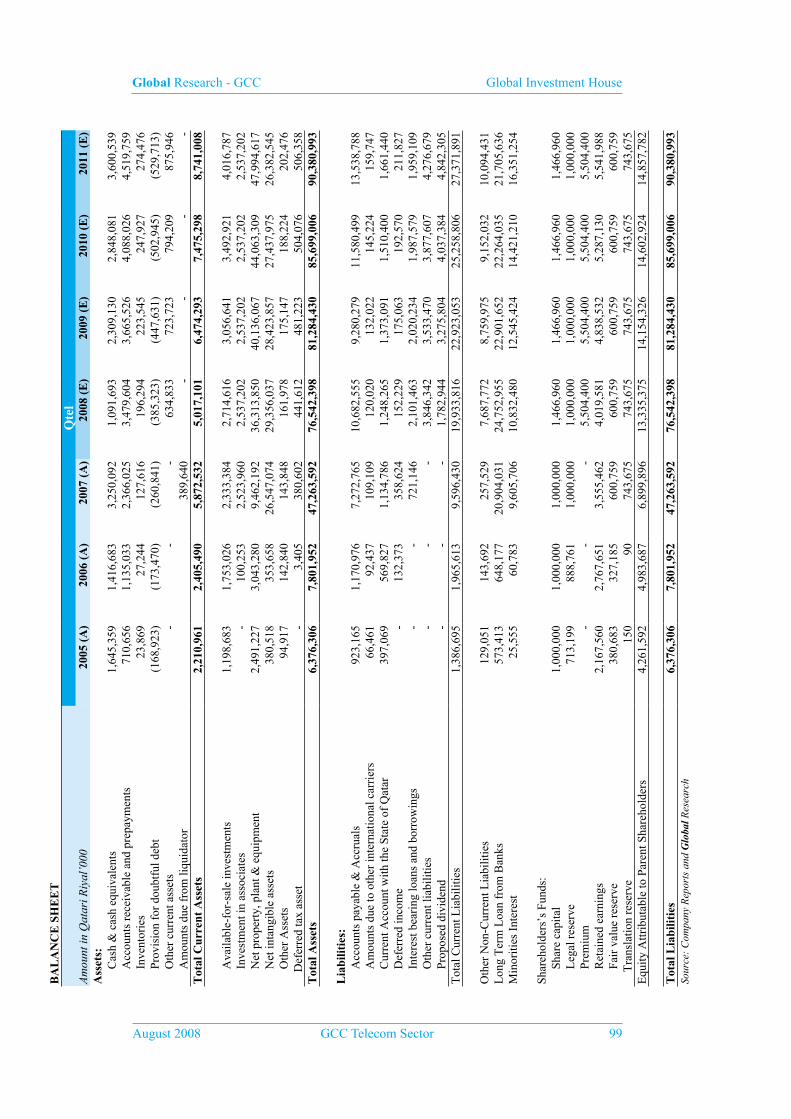
Global Research - GCC Global Investment House
August 2008 GCC Telecom Sector 99
BA
LA
NC
E S
HE
ET
Qte
lA
mou
nt in
Qat
ari R
iyal
’000
2005
(A
)20
06 (
A)
2007
(A
)20
08 (
E)
2009
(E
)20
10 (
E)
2011
(E
)A
sset
s:
Cas
h &
cas
h eq
uiva
lent
s 1
,645
,359
1
,416
,683
3
,250
,092
1
,091
,693
2
,309
,130
2
,848
,081
3
,600
,539
Acc
ount
s re
ceiv
able
and
pre
paym
ents
710
,656
1
,135
,033
2
,366
,025
3
,479
,604
3
,665
,526
4
,088
,026
4
,519
,759
Inv
ento
ries
23,
869
27,
244
127
,616
1
96,2
94
223
,545
2
47,9
27
274
,476
Pro
visi
on f
or d
oubt
ful d
ebt
(16
8,92
3) (
173,
470)
(26
0,84
1) (
385,
323)
(44
7,63
1) (
502,
945)
(52
9,71
3)
Oth
er c
urre
nt a
sset
s -
-
-
6
34,8
33
723
,723
7
94,2
09
875
,946
Am
ount
s du
e fr
om li
quid
ator
389
,640
-
-
-
-
T
otal
Cur
rent
Ass
ets
2,2
10,9
61
2,4
05,4
90
5,8
72,5
32
5,0
17,1
01
6,4
74,2
93
7,4
75,2
98
8,7
41,0
08
A
vaila
ble-
for-
sale
inve
stm
ents
1,1
98,6
83
1,7
53,0
26
2,3
33,3
84
2,7
14,6
16
3,0
56,6
41
3,4
92,9
21
4,0
16,7
87
I
nves
tmen
t in
asso
ciat
es -
1
00,2
53
2,5
23,9
60
2,5
37,2
02
2,5
37,2
02
2,5
37,2
02
2,5
37,2
02
N
et p
rope
rty,
pla
nt &
equ
ipm
ent
2,4
91,2
27
3,0
43,2
80
9,4
62,1
92
36,
313,
850
40,
136,
067
44,
063,
309
47,
994,
617
N
et in
tang
ible
ass
ets
380
,518
3
53,6
58
26,
547,
074
29,
356,
037
28,
423,
857
27,
437,
975
26,
382,
545
O
ther
Ass
ets
94,
917
142
,840
1
43,8
48
161
,978
1
75,1
47
188
,224
2
02,4
76
D
efer
red
tax
asse
t -
3
,405
3
80,6
02
441
,612
4
81,2
23
504
,076
5
06,3
58
Tot
al A
sset
s 6
,376
,306
7
,801
,952
4
7,26
3,59
2 7
6,54
2,39
8 8
1,28
4,43
0 8
5,69
9,00
6 9
0,38
0,99
3
Lia
bilit
ies:
A
ccou
nts
paya
ble
& A
ccru
als
923
,165
1
,170
,976
7
,272
,765
1
0,68
2,55
5 9
,280
,279
1
1,58
0,49
9 1
3,53
8,78
8
Am
ount
s du
e to
oth
er in
tern
atio
nal c
arri
ers
66,
461
92,
437
109
,109
1
20,0
20
132
,022
1
45,2
24
159
,747
Cur
rent
Acc
ount
with
the
Stat
e of
Qat
ar 3
97,0
69
569
,827
1
,134
,786
1
,248
,265
1
,373
,091
1
,510
,400
1
,661
,440
Def
erre
d in
com
e -
1
32,3
73
358
,624
1
52,2
29
175
,063
1
92,5
70
211
,827
Int
eres
t bea
ring
loan
s an
d bo
rrow
ings
-
-
721
,146
2
,101
,463
2
,020
,234
1
,987
,579
1
,959
,109
Oth
er c
urre
nt li
abili
ties
-
-
-
3,8
46,3
42
3,5
33,4
70
3,8
77,6
07
4,2
76,6
79
P
ropo
sed
divi
dend
-
--
1,7
82,9
44
3,2
75,8
04
4,0
37,3
84
4,8
42,3
05
Tot
al C
urre
nt L
iabi
litie
s 1
,386
,695
1
,965
,613
9
,596
,430
1
9,93
3,81
6 2
2,92
3,05
3 2
5,25
8,80
6 2
7,37
1,89
1
Oth
er N
on-C
urre
nt L
iabi
litie
s 1
29,0
51
143
,692
2
57,5
29
7,6
87,7
72
8,7
59,9
75
9,1
52,0
32
10,
094,
431
Lon
g T
erm
Loa
n fr
om B
anks
573
,413
6
48,1
77
20,
904,
031
24,
752,
955
22,
901,
652
22,
264,
035
21,
705,
636
Min
oriti
es I
nter
est
25,
555
60,
783
9,6
05,7
06
10,
832,
480
12,
545,
424
14,
421,
210
16,
351,
254
Shar
ehol
ders
’s F
unds
:
Sha
re c
apita
l 1
,000
,000
1
,000
,000
1
,000
,000
1
,466
,960
1
,466
,960
1
,466
,960
1
,466
,960
Leg
al r
eser
ve 7
13,1
99
888
,761
1
,000
,000
1
,000
,000
1
,000
,000
1
,000
,000
1
,000
,000
Pre
miu
m -
-
-
5
,504
,400
5
,504
,400
5
,504
,400
5
,504
,400
Ret
aine
d ea
rnin
gs 2
,167
,560
2
,767
,651
3
,555
,462
4
,019
,581
4
,838
,532
5
,287
,130
5
,541
,988
Fai
r va
lue
rese
rve
380
,683
3
27,1
85
600
,759
6
00,7
59
600
,759
6
00,7
59
600
,759
Tra
nsla
tion
rese
rve
150
9
0 7
43,6
75
743
,675
7
43,6
75
743
,675
7
43,6
75
Equ
ity A
ttrib
utab
le to
Par
ent S
hare
hold
ers
4,2
61,5
92
4,9
83,6
87
6,8
99,8
96
13,
335,
375
14,
154,
326
14,
602,
924
14,
857,
782
Tot
al L
iabi
litie
s 6
,376
,306
7
,801
,952
4
7,26
3,59
2 7
6,54
2,39
8 8
1,28
4,43
0 8
5,69
9,00
6 9
0,38
0,99
3 So
urce
: C
ompa
ny R
epor
ts a
nd G
loba
l Res
earc
h
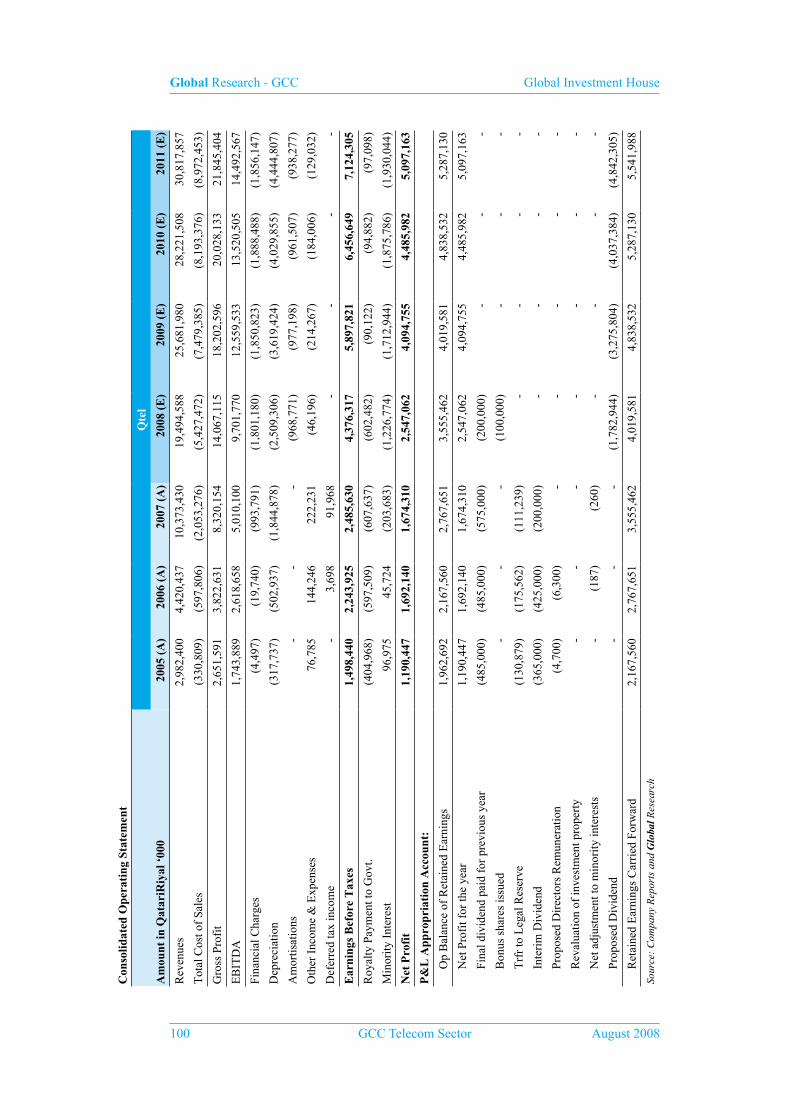
Global Research - GCC Global Investment House
100 GCC Telecom Sector August 2008
Con
solid
ated
Ope
rati
ng S
tate
men
t
Qte
l
Am
ount
in Q
atar
iRiy
al ‘
000
2005
(A
)20
06 (
A)
2007
(A
)20
08 (
E)
2009
(E
)20
10 (
E)
2011
(E
)
Rev
enue
s 2
,982
,400
4
,420
,437
1
0,37
3,43
0 1
9,49
4,58
8 2
5,68
1,98
0 2
8,22
1,50
8 3
0,81
7,85
7
Tot
al C
ost o
f Sa
les
(33
0,80
9) (
597,
806)
(2,
053,
276)
(5,
427,
472)
(7,
479,
385)
(8,
193,
376)
(8,
972,
453)
Gro
ss P
rofi
t 2
,651
,591
3
,822
,631
8
,320
,154
1
4,06
7,11
5 1
8,20
2,59
6 2
0,02
8,13
3 2
1,84
5,40
4
EB
ITD
A 1
,743
,889
2
,618
,658
5
,010
,100
9
,701
,770
1
2,55
9,53
3 1
3,52
0,50
5 1
4,49
2,56
7
Fina
ncia
l Cha
rges
(4,
497)
(19
,740
) (
993,
791)
(1,
801,
180)
(1,
850,
823)
(1,
888,
488)
(1,
856,
147)
Dep
reci
atio
n (
317,
737)
(50
2,93
7) (
1,84
4,87
8) (
2,50
9,30
6) (
3,61
9,42
4) (
4,02
9,85
5) (
4,44
4,80
7)
Am
ortis
atio
ns -
-
-
(
968,
771)
(97
7,19
8) (
961,
507)
(93
8,27
7)
Oth
er I
ncom
e &
Exp
ense
s 7
6,78
5 1
44,2
46
222
,231
(
46,1
96)
(21
4,26
7) (
184,
006)
(12
9,03
2)
Def
erre
d ta
x in
com
e-
3,6
98
91,
968
--
--
Ear
ning
s B
efor
e T
axes
1,4
98,4
40
2,2
43,9
25
2,4
85,6
30
4,3
76,3
17
5,8
97,8
21
6,4
56,6
49
7,1
24,3
05
Roy
alty
Pay
men
t to
Gov
t. (
404,
968)
(59
7,50
9) (
607,
637)
(60
2,48
2) (
90,1
22)
(94
,882
) (
97,0
98)
Min
ority
Int
eres
t 9
6,97
5 4
5,72
4 (
203,
683)
(1,
226,
774)
(1,
712,
944)
(1,
875,
786)
(1,
930,
044)
Net
Pro
fit
1,1
90,4
47
1,6
92,1
40
1,6
74,3
10
2,5
47,0
62
4,0
94,7
55
4,4
85,9
82
5,0
97,1
63
P&
L A
ppro
pria
tion
Acc
ount
:
O
p B
alan
ce o
f R
etai
ned
Ear
ning
s 1
,962
,692
2
,167
,560
2
,767
,651
3
,555
,462
4
,019
,581
4
,838
,532
5
,287
,130
N
et P
rofi
t for
the
year
1,1
90,4
47
1,6
92,1
40
1,6
74,3
10
2,5
47,0
62
4,0
94,7
55
4,4
85,9
82
5,0
97,1
63
F
inal
div
iden
d pa
id f
or p
revi
ous
year
(48
5,00
0) (
485,
000)
(57
5,00
0) (
200,
000)
-
-
-
B
onus
sha
res
issu
ed -
-
-
(
100,
000)
--
-
T
rfr
to L
egal
Res
erve
(13
0,87
9) (
175,
562)
(11
1,23
9)-
--
-
I
nter
im D
ivid
end
(36
5,00
0) (
425,
000)
(20
0,00
0)-
--
-
P
ropo
sed
Dir
ecto
rs R
emun
erat
ion
(4,
700)
(6,
300)
--
--
-
R
eval
uatio
n of
inve
stm
ent p
rope
rty
-
--
--
--
N
et a
djus
tmen
t to
min
ority
inte
rest
s -
(
187)
(26
0)-
--
-
P
ropo
sed
Div
iden
d -
-
-
(
1,78
2,94
4) (
3,27
5,80
4) (
4,03
7,38
4) (
4,84
2,30
5)
R
etai
ned
Ear
ning
s C
arri
ed F
orw
ard
2,1
67,5
60
2,7
67,6
51
3,5
55,4
62
4,0
19,5
81
4,8
38,5
32
5,2
87,1
30
5,5
41,9
88
Sour
ce:
Com
pany
Rep
orts
and
Glo
bal R
esea
rch

Global Research - GCC Global Investment House
August 2008 GCC Telecom Sector 101
CA
SH F
LO
W S
TA
TE
ME
NT
Qte
lA
mou
nt in
Qat
ari R
iyal
‘00
020
05 (
A)
2006
(A
)20
07 (
A)
2008
(E
)20
09 (
E)
2010
(E
)20
11 (
E)
Ope
rati
ngO
pera
ting
Act
iviti
es
1,3
56,8
52
2,0
85,2
36
4,3
71,6
43
8,8
78,9
66
11,
981,
222
12,
912,
710
13,
851,
359
Pr
ofit
Bef
ore
Tax
1,4
98,4
40
1,6
46,4
16
1,8
77,9
93
3,7
73,8
36
5,8
07,7
00
6,3
61,7
67
7,0
27,2
07
D
epre
ciat
ion
& A
mor
tisat
ion
317
,737
5
02,9
37
1,8
44,8
78
3,4
78,0
77
4,5
96,6
21
4,9
91,3
62
5,3
83,0
83
In
vest
men
t and
inte
rest
inco
me
(76
,709
) (
98,3
21)
(19
6,37
2) (
298,
608)
(33
6,23
1) (
384,
221)
(44
1,84
7)
Prov
isio
n fo
r do
ubtf
ul r
ecei
vabl
es -
-
-
1
24,4
82
62,
309
55,
314
26,
768
Fi
nanc
ial C
harg
es 4
,497
1
9,74
0 9
93,7
91
1,8
01,1
80
1,8
50,8
23
1,8
88,4
88
1,8
56,1
47
L
oss/
(ga
in)
on d
ispo
sal o
f pr
oper
ty, p
lant
& e
quip
men
t (
369)
(1,
184)
(5,
044)
-
-
-
-
Pr
ovis
ion
for
empl
oyee
s’ e
nd o
f se
rvic
e be
nefi
ts 2
9,48
1 2
2,09
3 4
0,99
2 -
-
-
-
E
mpl
oyee
s’ e
nd o
f se
rvic
e be
nefi
ts p
aid
(6,
850)
(4,
267)
(39
0.00
) -
-
-
-
Roy
alty
Pay
men
ts (
404,
968)
-
-
-
-
-
-
Dir
ecto
rs r
emun
erat
ion
(4,
700)
-
-
-
-
-
-
D
efer
red
taxe
s 2
93
(3,
698)
(91
,968
) -
-
--
Sh
are
of r
esul
ts o
f an
ass
ocia
te -
1
,520
(
92,2
37)
-
-
-
-
Wor
king
Cap
ital
177
,828
1
39,2
15
3,1
82,4
39
13,
176,
919
(78
5,34
5) 2
,687
,063
2
,944
,560
Dec
reas
e / (
incr
ease
) in
inve
ntor
ies
(57
9) (
3,37
5) 1
08,8
01
(68
,678
) (
27,2
52)
(24
,382
) (
26,5
49)
D
ecre
ase
/ (in
crea
se)
in a
ccou
nts
rece
ivab
le (
86,4
70)
(34
0,88
8) (
468,
858)
(1,
113,
579)
(18
5,92
1) (
422,
501)
(43
1,73
3)
(
Dec
reas
e) /
inc
reas
e in
pay
able
s to
oth
er i
nter
natio
nal
carr
iers
(ne
t)
-
10,
911
12,
002
13,
202
14,
522
(D
ecre
ase)
/ in
crea
se in
acc
ount
s pa
yabl
e (
130,
657)
483
,478
3
,527
,569
1
0,84
0,03
3 (
330,
073)
2,6
92,2
77
2,9
00,6
89
M
ovem
ent i
n cu
rren
t acc
ount
with
the
Stat
e of
Qat
ar 3
95,5
34
-
-
113
,479
1
24,8
27
137
,309
1
51,0
40
H
eld
for
trad
ing
inve
stm
ents
-
-
-
--
--
B
ank
over
draf
t -
-
1
4,92
7 -
-
-
-
Am
ount
due
fro
m li
quid
ator
-
-
-
389
,640
-
-
-
Def
erre
d in
com
e -
-
-
(
206,
395)
22,
834
17,
506
19,
257
D
ecre
ase
/ (in
crea
se)
in o
ther
cur
rent
ass
ets
-
-
-
(63
4,83
3) (
88,8
90)
(70
,486
) (
81,7
38)
D
ecre
ase
/ (in
crea
se)
in o
ther
cur
rent
liab
ilitie
s -
-
-
3
,846
,342
(
312,
872)
344
,137
3
99,0
71
Tot
al O
pera
ting
1
,534
,680
2
,224
,451
7
,554
,082
2
2,05
5,88
5 1
1,19
5,87
7 1
5,59
9,77
3 1
6,79
5,91
9 In
vest
ing
Act
ivit
ies
Pur
chas
e of
pro
pert
y, p
lant
& e
quip
men
t (
1,02
2,80
9) (
1,02
8,20
3) (
2,06
2,22
5) (
29,3
60,9
64)
(7,
441,
641)
(7,
957,
097)
(8,
376,
114)
Inv
estm
ent i
n an
ass
ocia
te -
(
101,
827)
(2,
331,
470)
(13
,242
) -
-
-
I
ncre
ase
in o
ther
ass
ets
(2,
468)
(47
,923
) 6
0 (
18,1
30)
(13
,169
) (
13,0
77)
(14
,252
)
D
efer
red
tax
asse
ts -
-
-
(
61,0
10)
(39
,610
) (
22,8
54)
(2,
282)
Net
incr
ease
in in
vest
men
ts (
284,
885)
(63
3,30
4) (
205,
767)
(38
1,23
2) (
342,
025)
(43
6,28
0) (
523,
866)
Pro
ceed
s fr
om s
ale
of p
rope
rty,
pla
nt &
equ
ipm
ent
604
1
,270
9
0,21
1 -
-
-
-
P
roce
eds
from
sal
e of
inve
stm
ents
283
,886
1
6,63
6 3
67,7
03
-
-
-
-
Inv
estm
ent a
nd in
tere
st in
com
e 6
4,59
4 1
11,1
97
145
,300
2
98,6
08
336
,231
3
84,2
21
441
,847
A
dditi
ons
to li
cens
e co
sts
(18
,028
) (
13)
(4,
603,
465)
(3,
777,
734)
(45
,017
) 2
4,37
5 1
17,1
54
Acq
uisi
tion
of s
ubsi
diar
ies,
net
of
cash
acq
uire
d -
-
(
13,4
90,9
02)
-
-
-
-
Acq
uisi
tion
of m
inor
ity in
tere
sts
-
-
(36
4,15
0) -
-
-
-
T
otal
Inv
esti
ng (
979,
106)
(1,
682,
167)
(22
,454
,705
) (
33,3
13,7
05)
(7,
545,
232)
(8,
020,
711)
(8,
357,
514)
Fin
anci
ng
I
ncre
ase/
(dec
reas
e) in
long
term
deb
t 5
73,4
13
72,
881
17,
717,
992
3,8
48,9
24
1,2
81,7
88
(1,
843,
164)
(1,
763,
946)
Rig
hts
Issu
e -
-
-
5
,871
,360
-
-
-
A
dditi
ons
to d
efer
red
fina
ncin
g co
sts
-
-
(11
9,77
9) -
-
-
-
I
ncre
ase/
(dec
reas
e) in
ove
rdra
ft -
-
-
1
,380
,317
(
81,2
29)
(32
,654
) (
28,4
70)
Fin
anci
al C
harg
es (
4,49
7) (
17,8
57)
(97
6,60
2) (
1,80
1,18
0) (
1,85
0,82
3) (
1,88
8,48
8) (
1,85
6,14
7)
D
ivid
ends
pai
d (
850,
000)
(91
0,00
0) (
775,
000)
(20
0,00
0) (
1,78
2,94
4) (
3,27
5,80
4) (
4,03
7,38
4)
M
inor
ity I
nter
est
-
84,
016
36,
455
-
-
-
-
Net
mov
emen
t in
min
ority
inte
rest
s -
-
3
3,44
9 -
-
-
-
T
otal
Fin
anci
ng (
281,
084)
(77
0,96
0) 1
5,91
6,51
5 9
,099
,421
(
2,43
3,20
8) (
7,04
0,11
1) (
7,68
5,94
7)
Net
Cha
nge
in C
ash
274
,490
(
228,
676)
1,0
15,8
92
(2,
158,
399)
1,2
17,4
37
538
,951
7
52,4
59
Net
for
eign
exc
hang
e di
ffer
ence
s 8
17,5
17
Net
Cas
h at
beg
inni
ng 1
,370
,869
1
,645
,359
1
,416
,683
3
,250
,092
1
,091
,693
2
,309
,130
2
,848
,081
N
et C
ash
at e
nd 1
,645
,359
1
,416
,683
3
,250
,092
1
,091
,693
2
,309
,130
2
,848
,081
3
,600
,539
So
urce
: C
ompa
ny R
epor
ts a
nd G
loba
l Res
earc
h

Global Research - GCC Global Investment House
102 GCC Telecom Sector August 2008
FA
CT
SH
EE
TQ
tel
2005
(A
)20
06 (
A)
2007
(A
)20
08 (
E)
2009
(E
)20
10 (
E)
2011
(E
)L
IQU
IDIT
Y R
AT
IOS
- C
urre
nt R
atio
1.59
1.22
0.61
0.25
0.28
0.30
0.32
- Q
uick
Rat
io1.
581.
210.
600.
240.
270.
290.
31
-
Cas
h Fl
ow f
rom
Ope
ratio
ns r
atio
1.11
1.13
0.79
1.11
0.49
0.62
0.61
PR
OF
ITA
BIL
ITY
AN
AL
YSI
S
-
Gro
ss P
rofi
t Mar
gin
88.9
%86
.5%
80.2
%72
.2%
70.9
%71
.0%
70.9
%
-
EB
ITD
A to
Rev
enue
s 58
.5%
59.2
%48
.3%
49.8
%48
.9%
47.9
%47
.0%
- N
et P
rofi
t Mar
gin
39.9
%38
.3%
16.1
%13
.1%
15.9
%15
.9%
16.5
%
-
Ret
urn
on A
vera
ge A
sset
s
20
.8%
23.9
%6.
1%4.
1%5.
2%5.
4%5.
8%
-
Ret
urn
on A
vera
ge E
quity
29
.9%
36.6
%28
.2%
25.2
%29
.8%
31.2
%34
.6%
AC
TIV
ITY
RA
TIO
S
-
Inv
ento
ry T
urno
ver
(tim
es)
14.0
23.4
26.5
33.5
35.6
34.8
34.4
- D
ebto
rs T
urno
ver
(tim
es)
4.5
4.8
5.9
6.7
7.2
7.3
7.2
- C
redi
tors
Tur
nove
r R
atio
0.3
0.5
0.5
0.6
0.7
0.8
0.7
LE
VE
RA
GE
RA
TIO
’s
-
Int
eres
t Cov
erag
e (t
imes
)38
7.8
132.
75.
05.
46.
87.
27.
8
-
Deb
t / E
quity
0.13
0.13
3.13
2.01
1.76
1.66
1.59
GR
OW
TH
RA
TE
S
-
Rev
enue
gro
wth
rat
e27
.1%
48.2
%13
4.7%
87.9
%31
.7%
9.9%
9.2%
- N
et in
com
e gr
owth
rat
e-1
9.5%
42.1
%-1
.1%
52.1
%60
.8%
9.6%
13.6
%
-
Equ
ity g
row
th r
ate
15.1
%16
.9%
38.4
%93
.3%
6.1%
3.2%
1.7%
- T
otal
ass
ets
grow
th r
ate
26.2
%22
.4%
505.
8%61
.9%
6.2%
5.4%
5.5%
RA
TIO
S U
SED
FO
R V
AL
UA
TIO
N
-
EPS
(Q
R)
8.12
11.5
411
.41
17.3
627
.91
30.5
834
.75
- B
ook
Val
ue P
er S
hare
(Q
R)
29.0
533
.97
47.0
478
.75
74.1
672
.02
68.2
7
-
Mar
ket P
rice
per
sha
re(Q
R)
204.
5919
3.59
194.
5315
9.40
159.
4015
9.40
159.
40
-
Mar
ket C
apita
lisat
ion
(QR
Mn)
30,
013
28,
399
28,
537
23,
383
23,
383
23,
383
23,
383
- E
nter
pris
e V
alue
(E
V
QR
Mn)
28,
941
27,
630
46,
912
49,
146
45,
996
44,
787
43,
448
- E
V/E
BIT
DA
(x)
16.
6 1
0.6
9.4
5
.1
3.7
3
.3
3.0
-
P/E
25.2
16.8
17.0
9.2
5.7
5.2
4.6
- P
/BV
7.0
5.7
4.1
2.0
2.1
2.2
2.3
Sour
ce:
Com
pany
Rep
orts
and
Glo
bal R
esea
rch
* M
arke
t pri
ce fo
r 20
08 a
nd s
ubse
quen
t yea
rs a
re a
s pe
r cl
osin
g pr
ices
on
Doh
a Se
curi
ties
Mar
ket o
n A
ug. 3
1, 2
008
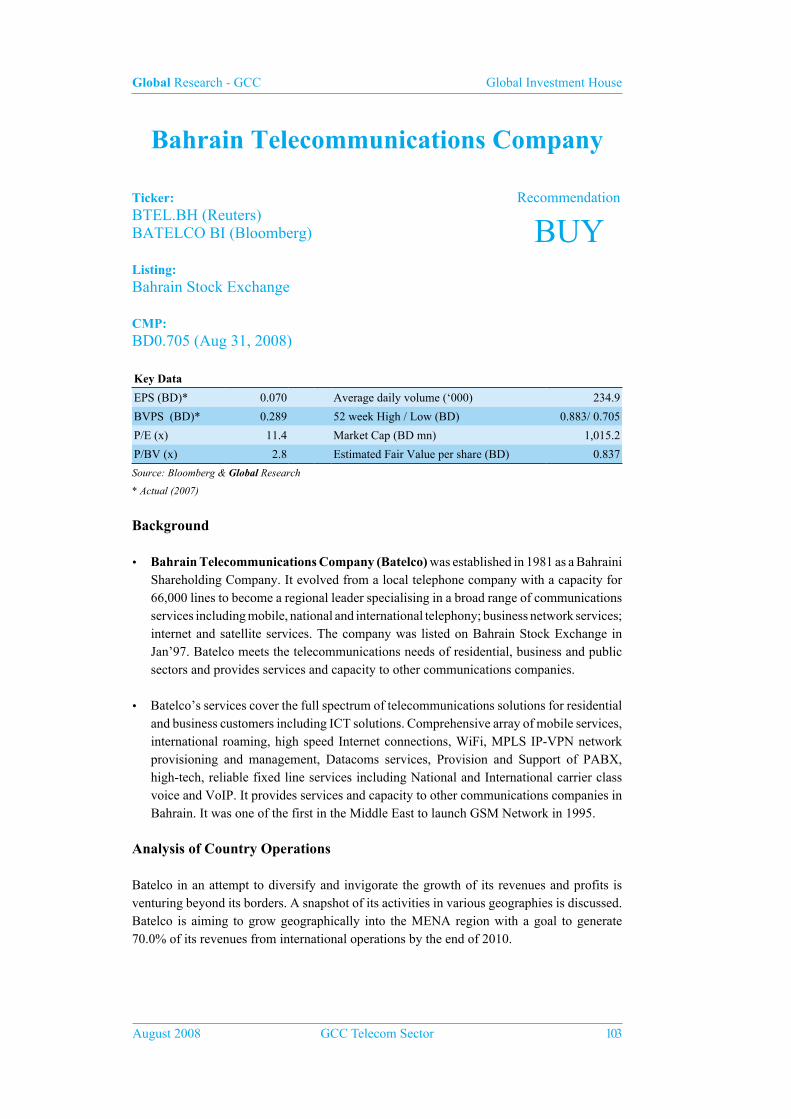
Global Research - GCC Global Investment House
August 2008 GCC Telecom Sector 103
Bahrain Telecommunications Company
Ticker: BTEL.BH (Reuters)BATELCO BI (Bloomberg)
Listing:Bahrain Stock Exchange
CMP: BD0.705 (Aug 31, 2008)
Key Data
EPS (BD)* 0.070 Average daily volume (‘000) 234.9
BVPS (BD)* 0.289 52 week High / Low (BD) 0.883/ 0.705
P/E (x) 11.4 Market Cap (BD mn) 1,015.2
P/BV (x) 2.8 Estimated Fair Value per share (BD) 0.837
Source: Bloomberg & Global Research
* Actual (2007)
Background
• Bahrain Telecommunications Company (Batelco) was established in 1981 as a Bahraini Shareholding Company. It evolved from a local telephone company with a capacity for 66,000 lines to become a regional leader specialising in a broad range of communications services including mobile, national and international telephony; business network services; internet and satellite services. The company was listed on Bahrain Stock Exchange in Jan’97. Batelco meets the telecommunications needs of residential, business and public sectors and provides services and capacity to other communications companies.
• Batelco’s services cover the full spectrum of telecommunications solutions for residential and business customers including ICT solutions. Comprehensive array of mobile services, international roaming, high speed Internet connections, WiFi, MPLS IP-VPN network provisioning and management, Datacoms services, Provision and Support of PABX, high-tech, reliable fixed line services including National and International carrier class voice and VoIP. It provides services and capacity to other communications companies in Bahrain. It was one of the first in the Middle East to launch GSM Network in 1995.
Analysis of Country Operations
Batelco in an attempt to diversify and invigorate the growth of its revenues and profits is venturing beyond its borders. A snapshot of its activities in various geographies is discussed. Batelco is aiming to grow geographically into the MENA region with a goal to generate 70.0% of its revenues from international operations by the end of 2010.
Recommendation
BUY

Global Research - GCC Global Investment House
104 GCC Telecom Sector August 2008
Table 1: Snapshot of country operationsCountry of operations Subsidiary Type of services Shareholding Since
BahrainBahrain Middle East Company
SPC
Cellular, Fixed Line and
Broadband100.0%
1981, GSM
since 1995Jordan Batelco Jordan PSC Broadband ADSL 80.0% ------
JordanUmniah Mobile
Communications
Cellular and Broadband-
Wimax96.0% Jun’06
Kuwait Qualitynet Internet 44.0% ------
Yemen Sabafon Cellular 20.0% Mar’07
Egypt Batelco, Egypt Internet 100.0% ------
Saudi Arabia Atheeb, Saudi Arabia Cellular and Broadband 15.0% 3Q08
Source: Company Reports and Global Research
Bahrain OperationsBatelco provides Cellular, Fixed Line and Broadband services in the Kingdom of Bahrain. Additionally it provides ICT (Integrated Communications Technology) solutions through ANIS. Anis is an ICT specialist provider & systems integrator (SI) offering turnkey complex mission critical systems and integrated solutions to Batelco as well as to Batelco’s corporate clients namely government, banking & finance and corporate enterprises. INFORT, Batelco’s Data Centre, is powered and run by Anis. The state-of-the-art Data Centre provides uninterrupted services round the clock to host clients’ critical data to ensure business continuity in the face of environmental or technical disaster.
Cellular ServicesBahrain is one of the GCC countries with greater than 100% of cellular penetration. The entry of second cellular player MTC (Zain) has resulted in increasing penetration and also a market share loss for Batelco. The cellular penetration in Bahrain has increased from 102.6% in 2005 to 148.8% in 2007. Batelco’s Bahrain cellular ARPUs have dropped significantly from US$28.5 in 2005 to US$24.9 in 2007. A third player is expected to enter the already saturated cellular services market by end of 2008 or early 2009.
Table 2: Batelco’s Bahrain Cellular Services Snapshot
000s 2005 2006 2007
Bahrain Cellular Subscribers 748.7 907.4 1,116.00
Bahrain Cellular Penetration 102.6% 122.6% 148.8%
Pre paid subscribers % 75.0% 75.0% 75.0%
Post paid subscribers % 25.0% 25.0% 25.0%
Blended ARPU (US$) 30.9 18.6 19.7
Batelco’s Cellular Subscribers 488.7 604.0 668.0
Market Share 65.3% 66.6% 59.9%
Source: Company Reports and Global Research
We expect the cellular ARPUs to register only a minor growth in medium term. In the long term Bahrain cellular ARPUs are set to decline as a result of increasing competition. Batelco’s Bahrain cellular revenues as a percentage of group cellular revenues have declined from

Global Research - GCC Global Investment House
August 2008 GCC Telecom Sector 105
69.5% in 2005 to 46.4% in 2007. This was as a result of increased competition in Bahrain and also emergence of Jordan as a major contributor of group cellular revenues.
Fixed Line ServicesBahraini fixed line services market is interplay of three players Batelco, Kalaam Telecom and Lightspeed Communications. Increasing competition and loss of customers to cellular segment is negatively affecting the performance in this segment.
Table 3: Batelco’s Bahrain Fixed Line Services Snapshot
2005 2006 2007
Fixed Line Subscribers 193,520 194,200 202,359
Fixed Line Penetration % 26.5% 26.2% 25.9%
ARPU (BD) 13.1 11.8 10.3
Source: Company Reports and Global Research
Fixed line ARPUs have declined considerably since the past two years. In 2007, fixed line ARPUs were down by 12.7% from BD11.8 in 2006 to BD10.3 in 2007. The competition within the three players is expected to lead to a further decline in fixed line revenues in the medium and long term.
Broadband ServicesAs evident in most of the GCC states, the broadband penetration in Bahrain is low at 8.6%. This provides ample scope for the players to expand and add to their revenue.
Table 4: Batelco’s Bahrain Broadband Services Snapshot
2005 2006 2007
Broadband Subscribers 42,832 52,683 64,800
Broadband Penetration % 5.9% 7.1% 8.6%
ARPU (BD) 8.3 7.3 5.5 Source: Company Reports and Global Research
ARPUs have declined substantially in the recent years in view of improvements in technology that has resulted in higher download speeds and lower subscription rates. We see this declining trend to continue in future.
Jordan OperationsBatelco operates in Jordan through Batelco Jordan and Umniah Mobile Communications (Umniah). It is the Kingdom’s 3rd largest mobile operator exceeded 1mn customers in 2007 doubling its customer base since Batelco’s purchase. In 2007 Umniah launched UMAX to offer high quality, and affordable internet connectivity across Jordan. Batelco Jordan operates its own core telecommunications network in Amman using fiber and microwave and has begun to expand its network reach outside Amman. Services include managed data communications based on IPVPN-MPLS with the business customer base now exceeding 500 Managed Data Communication links and 200 Internet Leased Lines.
Batelco Jordan is currently leading the competition in the internet market by exceeding 10,000 ADSL accounts to win a 17.0% market share from peers in Jordan. Umniah also launched WiMax under the trademark UMAX in 2007, becoming the first operator to offer the long awaited services that will increase the competition in Jordan.

Global Research - GCC Global Investment House
106 GCC Telecom Sector August 2008
Cellular ServicesBatelco provides cellular services in Jordan through Umniah. Though Batelco does not publish the country results except for Bahrain, we have derived revenues and market shares by comparison with other cellular operators in Jordan. A snapshot of competition in the cellular space in Jordan is discussed.
Table 5: Batelco’s Jordan Cellular Services Snapshot
2005 2006 2007
Cellular penetration in Jordan 55.0% 74.4% 80.6%
Batelco (Umniah) Cellular Subscribers 309,896 696,686 1,193,153
Total Cellular Subscribers in Jordan per ITU 3,137,700 4,343,100 4,770,600
Blended ARPU (BD) 9.4 8.0 7.8
Prepaid % 20.0% 9.0% 6.5%
Postpaid % 80.0% 91.0% 93.5%
Source: Company presentation, ITU and Global Research
Batelco through Umniah and Jordan Telecom through Orange have gained market share from MTC (Zain) in the recent years as evident from growth in their subscribers. As a result of competition, blended cellular ARPUs have declined from BD9.4 in 2005 to BD7.8 in 2007. However, a low penetration level of 80.6% still provides enough room for growth.
We estimate that Batelco’s Jordan cellular revenues should contribute to about 53.6% of Batelco group cellular revenues. Also, we expect this pie to grow larger in the medium term as Umniah is gaining share from MTC on a progressive basis.
Broadband ServicesBatelco started providing broadband services in Jordan through Umniah in 2007. The Jordanian broadband market is characterized by a very low penetration rate of 1.6%. There is only one additional player Jordan Telecom that provides through Orange Internet. The broadband subscribers were up by 89.5% from 48,600 subscribers in 2006 to 92,100 in 2007.
Table 6: Batelco’s Jordan Broadband Services Snapshot
2005 2006 2007
Broadband Subscribers 24,200 48,600 92,100
Broadband Penetration % 0.4% 0.8% 1.6%
ARPU (BD) 139.4 144.3 109.3
Source: ITU, Company Reports and Global Research
Kuwait OperationsA 44% Batelco-controlled subsidiary company, Qualitynet meets the challenges of an era of convergence by providing total ICT solutions. Qualitynet remains the clear market leader in terms of both its Internet business and data communications services and continues to be the main service provider to government and the business community in Kuwait City.
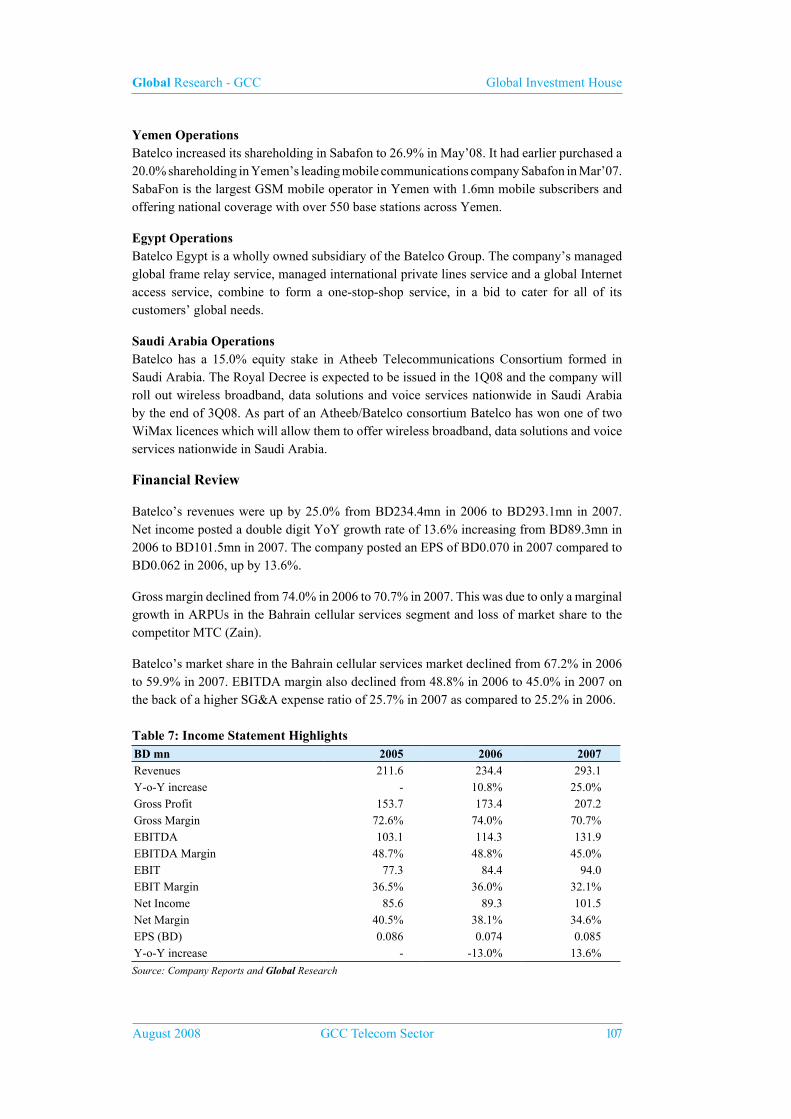
Global Research - GCC Global Investment House
August 2008 GCC Telecom Sector 107
Yemen OperationsBatelco increased its shareholding in Sabafon to 26.9% in May’08. It had earlier purchased a 20.0% shareholding in Yemen’s leading mobile communications company Sabafon in Mar’07. SabaFon is the largest GSM mobile operator in Yemen with 1.6mn mobile subscribers and offering national coverage with over 550 base stations across Yemen.
Egypt OperationsBatelco Egypt is a wholly owned subsidiary of the Batelco Group. The company’s managed global frame relay service, managed international private lines service and a global Internet access service, combine to form a one-stop-shop service, in a bid to cater for all of its customers’ global needs.
Saudi Arabia OperationsBatelco has a 15.0% equity stake in Atheeb Telecommunications Consortium formed in Saudi Arabia. The Royal Decree is expected to be issued in the 1Q08 and the company will roll out wireless broadband, data solutions and voice services nationwide in Saudi Arabia by the end of 3Q08. As part of an Atheeb/Batelco consortium Batelco has won one of two WiMax licences which will allow them to offer wireless broadband, data solutions and voice services nationwide in Saudi Arabia.
Financial Review
Batelco’s revenues were up by 25.0% from BD234.4mn in 2006 to BD293.1mn in 2007. Net income posted a double digit YoY growth rate of 13.6% increasing from BD89.3mn in 2006 to BD101.5mn in 2007. The company posted an EPS of BD0.070 in 2007 compared to BD0.062 in 2006, up by 13.6%.
Gross margin declined from 74.0% in 2006 to 70.7% in 2007. This was due to only a marginal growth in ARPUs in the Bahrain cellular services segment and loss of market share to the competitor MTC (Zain).
Batelco’s market share in the Bahrain cellular services market declined from 67.2% in 2006 to 59.9% in 2007. EBITDA margin also declined from 48.8% in 2006 to 45.0% in 2007 on the back of a higher SG&A expense ratio of 25.7% in 2007 as compared to 25.2% in 2006.
Table 7: Income Statement HighlightsBD mn 2005 2006 2007Revenues 211.6 234.4 293.1 Y-o-Y increase - 10.8% 25.0%Gross Profit 153.7 173.4 207.2 Gross Margin 72.6% 74.0% 70.7%EBITDA 103.1 114.3 131.9 EBITDA Margin 48.7% 48.8% 45.0%EBIT 77.3 84.4 94.0 EBIT Margin 36.5% 36.0% 32.1%Net Income 85.6 89.3 101.5 Net Margin 40.5% 38.1% 34.6%EPS (BD) 0.086 0.074 0.085 Y-o-Y increase - -13.0% 13.6%
Source: Company Reports and Global Research
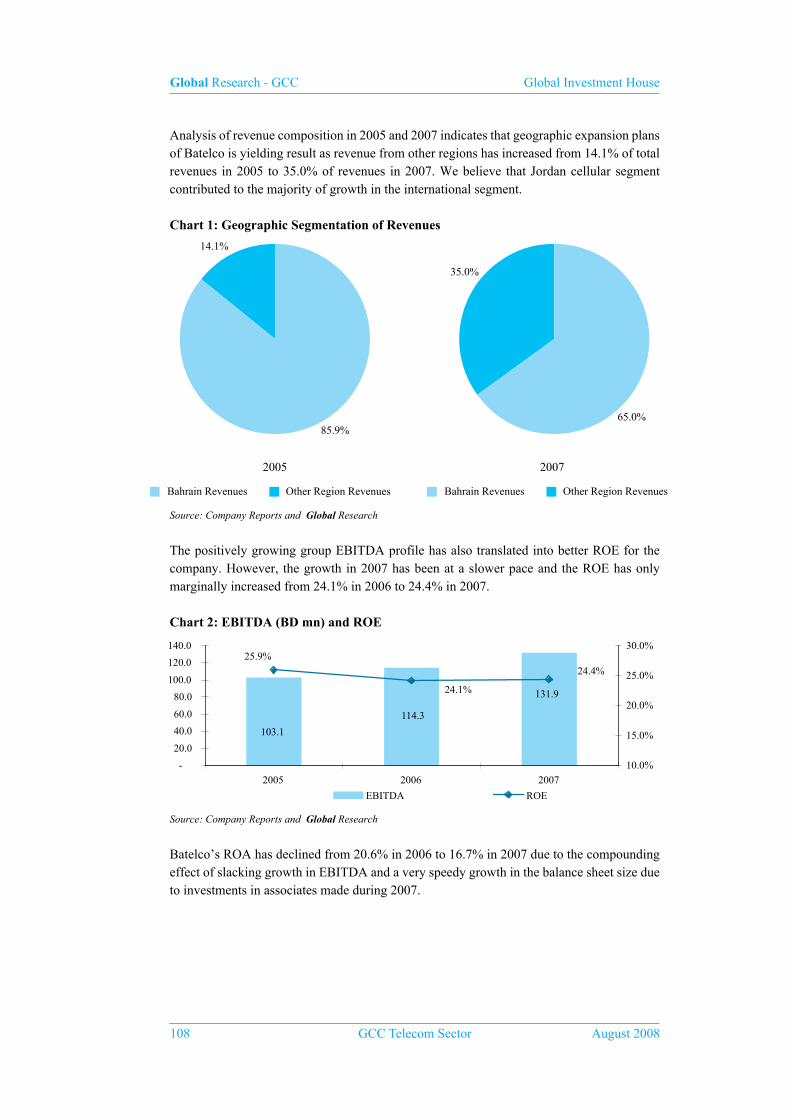
Global Research - GCC Global Investment House
108 GCC Telecom Sector August 2008
Analysis of revenue composition in 2005 and 2007 indicates that geographic expansion plans of Batelco is yielding result as revenue from other regions has increased from 14.1% of total revenues in 2005 to 35.0% of revenues in 2007. We believe that Jordan cellular segment contributed to the majority of growth in the international segment.
Chart 1: Geographic Segmentation of Revenues
14.1%
Bahrain Revenues Other Region Revenues
85.9%
2005
35.0%
Bahrain Revenues Other Region Revenues
65.0%
2007
Source: Company Reports and Global Research
The positively growing group EBITDA profile has also translated into better ROE for the company. However, the growth in 2007 has been at a slower pace and the ROE has only marginally increased from 24.1% in 2006 to 24.4% in 2007.
Chart 2: EBITDA (BD mn) and ROE
131.9
114.3
103.1
25.9%24.4%
24.1%
-
20.0
40.0
60.0
80.0
100.0
120.0
140.0
2005 2006 200710.0%
15.0%
20.0%
25.0%
30.0%
EBITDA ROE
Source: Company Reports and Global Research
Batelco’s ROA has declined from 20.6% in 2006 to 16.7% in 2007 due to the compounding effect of slacking growth in EBITDA and a very speedy growth in the balance sheet size due to investments in associates made during 2007.

Global Research - GCC Global Investment House
August 2008 GCC Telecom Sector 109
Chart 3: EBITDA (BD mn) and ROA
103.1114.3
131.920.6%
16.7%
22.8%
-
20.0
40.0
60.0
80.0
100.0
120.0
140.0
2005 2006 200710.0%
15.0%
20.0%
25.0%
30.0%
EBITDA ROA
Source: Company Reports and Global Research
Batelco’s total assets increased by 52.8%; from BD480.7mn in 2006 to BD734.5mn in 2007. The assets capitalized were lower in 2007 at BD51.1mn compared to BD113.9mn in 2006.
Batelco’s net profit declined by 2.8% at BD50.8mn in 1H08 compared to BD52.2mn in 1H07. The 1H08 results were impacted by a number of one-off adjustments which had a net negative impact of BD1.2mn. During 1H07, one-off adjustments had a net positive impact of BD4.7mn. The revenues were up by 17.7% from BD136.4mn in 1H07 to BD160.5mn in 1H08.
Growth was driven mainly by overseas operations which now represent 33.0% of Batelco’s revenues. The Group’s 96.0% owned subsidiary in Jordan, Umniah, has delivered significant YoY revenue growth of 59.0% buoyed by a 61.0% increase in the number of mobile subscribers, with a customer base now standing at 1.3mn.
Sabafon, in which the Group holds a 26.9% equity investment, has delivered a 30.0% YoY growth in revenue with the mobile subscribers base increasing by 16.0%, for a total customer base of 1.9mn.
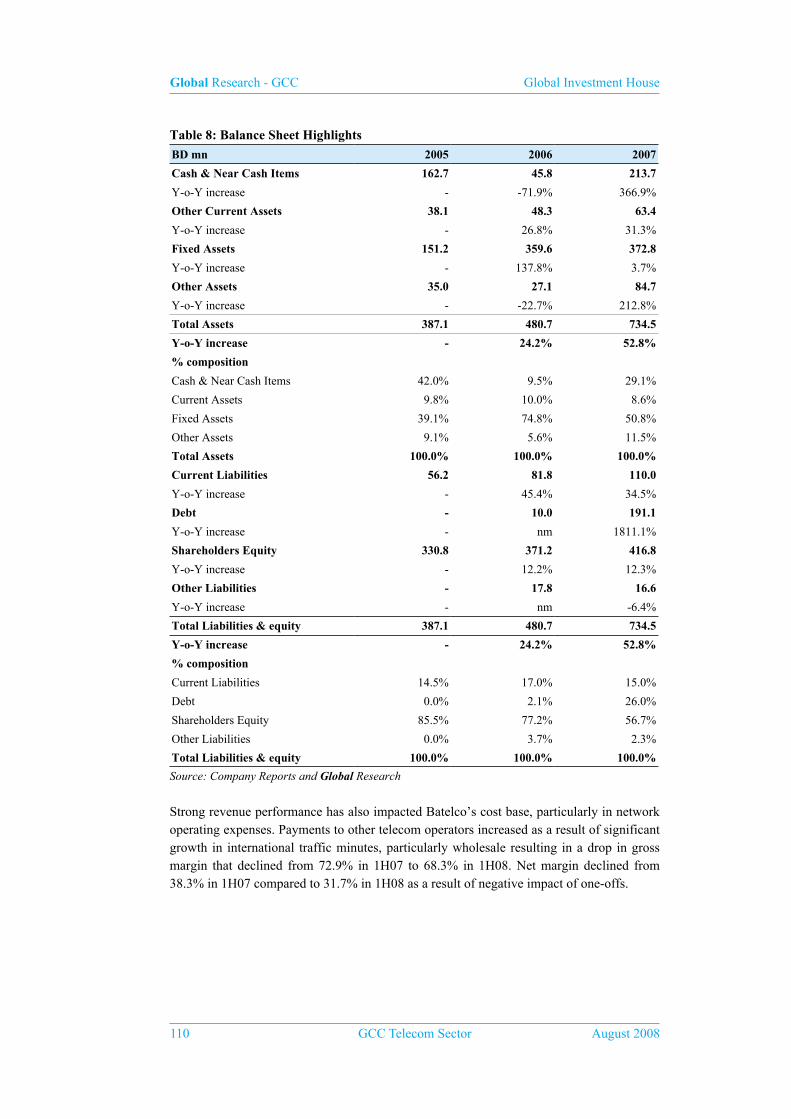
Global Research - GCC Global Investment House
110 GCC Telecom Sector August 2008
Table 8: Balance Sheet Highlights
BD mn 2005 2006 2007
Cash & Near Cash Items 162.7 45.8 213.7
Y-o-Y increase - -71.9% 366.9%
Other Current Assets 38.1 48.3 63.4
Y-o-Y increase - 26.8% 31.3%
Fixed Assets 151.2 359.6 372.8
Y-o-Y increase - 137.8% 3.7%
Other Assets 35.0 27.1 84.7
Y-o-Y increase - -22.7% 212.8%
Total Assets 387.1 480.7 734.5
Y-o-Y increase - 24.2% 52.8%
% composition
Cash & Near Cash Items 42.0% 9.5% 29.1%
Current Assets 9.8% 10.0% 8.6%
Fixed Assets 39.1% 74.8% 50.8%
Other Assets 9.1% 5.6% 11.5%
Total Assets 100.0% 100.0% 100.0%
Current Liabilities 56.2 81.8 110.0
Y-o-Y increase - 45.4% 34.5%
Debt - 10.0 191.1
Y-o-Y increase - nm 1811.1%
Shareholders Equity 330.8 371.2 416.8
Y-o-Y increase - 12.2% 12.3%
Other Liabilities - 17.8 16.6
Y-o-Y increase - nm -6.4%
Total Liabilities & equity 387.1 480.7 734.5
Y-o-Y increase - 24.2% 52.8%
% composition
Current Liabilities 14.5% 17.0% 15.0%
Debt 0.0% 2.1% 26.0%
Shareholders Equity 85.5% 77.2% 56.7%
Other Liabilities 0.0% 3.7% 2.3%
Total Liabilities & equity 100.0% 100.0% 100.0%
Source: Company Reports and Global Research
Strong revenue performance has also impacted Batelco’s cost base, particularly in network operating expenses. Payments to other telecom operators increased as a result of significant growth in international traffic minutes, particularly wholesale resulting in a drop in gross margin that declined from 72.9% in 1H07 to 68.3% in 1H08. Net margin declined from 38.3% in 1H07 compared to 31.7% in 1H08 as a result of negative impact of one-offs.

Global Research - GCC Global Investment House
August 2008 GCC Telecom Sector 111
Outlook & ValuationBatelco has adopted the right strategy of exploring and investing in low penetrated markets both in cellular and broadband space. Its aim to grow geographically into the MENA region with a goal to generate 70.0% of its revenues from international operations by the end of 2010 seems to be achievable given the success they have achieved so far in their investments.
Jordan is a positively influencing investment with increasing revenue and profit contribution to the group revenues and margins. The group’s investment in SabaFon Yemen and Atheeb consortium is also expected to yield robust results in the high growth cellular and broadband markets respectively in the long term.
In the home market in view of high level of cellular penetration and increased competition, we expect the revenue and profit contributions to diminish in long term. However, we expect that the company should do well on the back of its expansion plans.
At the current market price of BD0.705 per share (as at Aug 31, 2008), the stock trades at 9.8x and 9.2x of its earnings and 2.0x and 1.8x of its book value for FY2008E and FY2009E respectively. The estimated fair value for BATELCO works out to BD0.837 per share which offers an upside of 18.7% on the market price of BD0.705 per share (as at Aug 31, 2008). Hence, we initiate on the stock with a “BUY” recommendation.
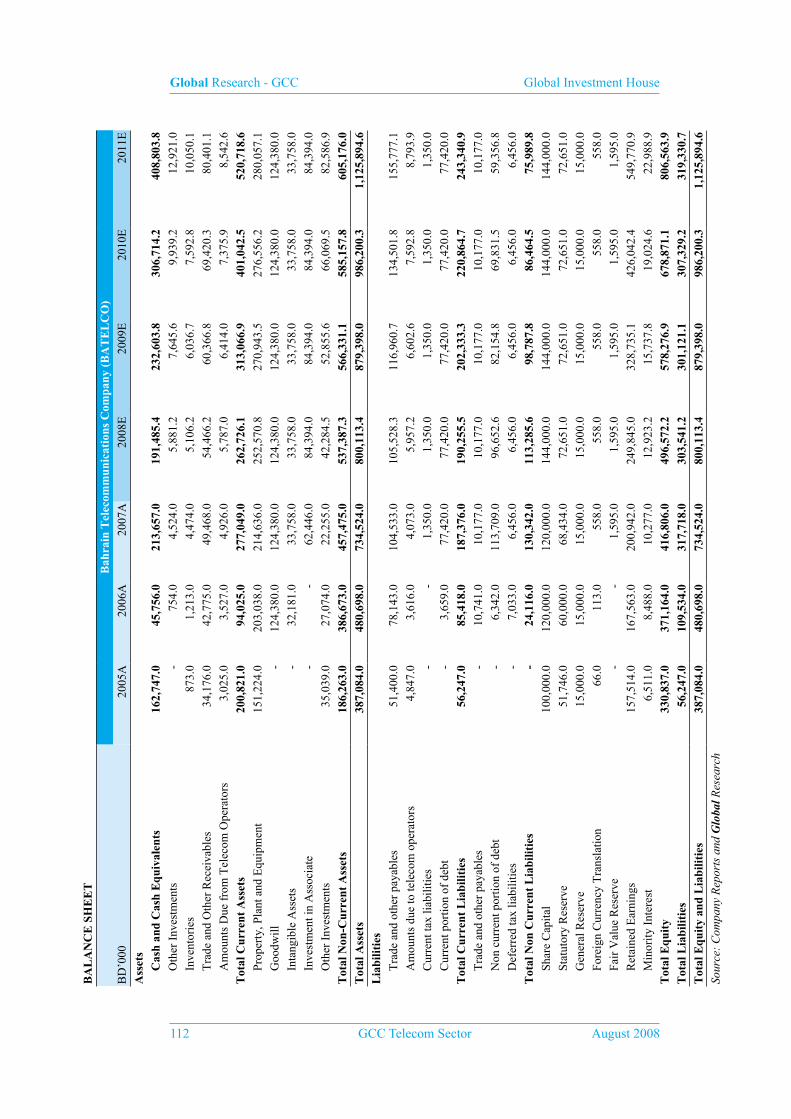
Global Research - GCC Global Investment House
112 GCC Telecom Sector August 2008
BA
LA
NC
E S
HE
ET
Bah
rain
Tel
ecom
mun
icat
ions
Com
pany
(B
AT
EL
CO
)
BD
’000
2005
A20
06A
2007
A20
08E
2009
E20
10E
2011
EA
sset
sC
ash
and
Cas
h E
quiv
alen
ts 1
62,7
47.0
4
5,75
6.0
213
,657
.0
191
,485
.4
232
,603
.8
306
,714
.2
408
,803
.8
Oth
er I
nves
tmen
ts -
7
54.0
4
,524
.0
5,8
81.2
7
,645
.6
9,9
39.2
1
2,92
1.0
Inve
ntor
ies
873
.0
1,2
13.0
4
,474
.0
5,1
06.2
6
,036
.7
7,5
92.8
1
0,05
0.1
Tra
de a
nd O
ther
Rec
eiva
bles
34,
176.
0 4
2,77
5.0
49,
468.
0 5
4,46
6.2
60,
366.
8 6
9,42
0.3
80,
401.
1
Am
ount
s D
ue f
rom
Tel
ecom
Ope
rato
rs 3
,025
.0
3,5
27.0
4
,926
.0
5,7
87.0
6
,414
.0
7,3
75.9
8
,542
.6
Tot
al C
urre
nt A
sset
s 2
00,8
21.0
9
4,02
5.0
277
,049
.0
262
,726
.1
313
,066
.9
401
,042
.5
520
,718
.6
Prop
erty
, Pla
nt a
nd E
quip
men
t 1
51,2
24.0
2
03,0
38.0
2
14,6
36.0
2
52,5
70.8
2
70,9
43.5
2
76,5
56.2
2
80,0
57.1
Goo
dwill
-
124
,380
.0
124
,380
.0
124
,380
.0
124
,380
.0
124
,380
.0
124
,380
.0
Inta
ngib
le A
sset
s -
3
2,18
1.0
33,
758.
0 3
3,75
8.0
33,
758.
0 3
3,75
8.0
33,
758.
0
Inve
stm
ent i
n A
ssoc
iate
-
-
62,
446.
0 8
4,39
4.0
84,
394.
0 8
4,39
4.0
84,
394.
0
Oth
er I
nves
tmen
ts 3
5,03
9.0
27,
074.
0 2
2,25
5.0
42,
284.
5 5
2,85
5.6
66,
069.
5 8
2,58
6.9
Tot
al N
on-C
urre
nt A
sset
s 1
86,2
63.0
3
86,6
73.0
4
57,4
75.0
5
37,3
87.3
5
66,3
31.1
5
85,1
57.8
6
05,1
76.0
T
otal
Ass
ets
387
,084
.0
480
,698
.0
734
,524
.0
800
,113
.4
879
,398
.0
986
,200
.3
1,1
25,8
94.6
L
iabi
litie
s
Tra
de a
nd o
ther
pay
able
s 5
1,40
0.0
78,
143.
0 1
04,5
33.0
1
05,5
28.3
1
16,9
60.7
1
34,5
01.8
1
55,7
77.1
Am
ount
s du
e to
tele
com
ope
rato
rs 4
,847
.0
3,6
16.0
4
,073
.0
5,9
57.2
6
,602
.6
7,5
92.8
8
,793
.9
Cur
rent
tax
liabi
litie
s -
-
1
,350
.0
1,3
50.0
1
,350
.0
1,3
50.0
1
,350
.0
Cur
rent
por
tion
of d
ebt
-
3,6
59.0
7
7,42
0.0
77,
420.
0 7
7,42
0.0
77,
420.
0 7
7,42
0.0
Tot
al C
urre
nt L
iabi
litie
s 5
6,24
7.0
85,
418.
0 1
87,3
76.0
1
90,2
55.5
2
02,3
33.3
2
20,8
64.7
2
43,3
40.9
Tra
de a
nd o
ther
pay
able
s -
1
0,74
1.0
10,
177.
0 1
0,17
7.0
10,
177.
0 1
0,17
7.0
10,
177.
0
Non
cur
rent
por
tion
of d
ebt
-
6,3
42.0
1
13,7
09.0
9
6,65
2.6
82,
154.
8 6
9,83
1.5
59,
356.
8
Def
erre
d ta
x lia
bilit
ies
-
7,0
33.0
6
,456
.0
6,4
56.0
6
,456
.0
6,4
56.0
6
,456
.0
Tot
al N
on C
urre
nt L
iabi
litie
s -
2
4,11
6.0
130
,342
.0
113
,285
.6
98,
787.
8 8
6,46
4.5
75,
989.
8
Shar
e C
apita
l 1
00,0
00.0
1
20,0
00.0
1
20,0
00.0
1
44,0
00.0
1
44,0
00.0
1
44,0
00.0
1
44,0
00.0
Stat
utor
y R
eser
ve 5
1,74
6.0
60,
000.
0 6
8,43
4.0
72,
651.
0 7
2,65
1.0
72,
651.
0 7
2,65
1.0
Gen
eral
Res
erve
15,
000.
0 1
5,00
0.0
15,
000.
0 1
5,00
0.0
15,
000.
0 1
5,00
0.0
15,
000.
0
Fore
ign
Cur
renc
y T
rans
latio
n 6
6.0
113
.0
558
.0
558
.0
558
.0
558
.0
558
.0
Fair
Val
ue R
eser
ve -
-
1
,595
.0
1,5
95.0
1
,595
.0
1,5
95.0
1
,595
.0
Ret
aine
d E
arni
ngs
157
,514
.0
167
,563
.0
200
,942
.0
249
,845
.0
328
,735
.1
426
,042
.4
549
,770
.9
Min
ority
Int
eres
t 6
,511
.0
8,4
88.0
1
0,27
7.0
12,
923.
2 1
5,73
7.8
19,
024.
6 2
2,98
8.9
Tot
al E
quit
y 3
30,8
37.0
3
71,1
64.0
4
16,8
06.0
4
96,5
72.2
5
78,2
76.9
6
78,8
71.1
8
06,5
63.9
T
otal
Lia
bilit
ies
56,
247.
0 1
09,5
34.0
3
17,7
18.0
3
03,5
41.2
3
01,1
21.1
3
07,3
29.2
3
19,3
30.7
T
otal
Equ
ity
and
Lia
bilit
ies
387
,084
.0
480
,698
.0
734
,524
.0
800
,113
.4
879
,398
.0
986
,200
.3
1,1
25,8
94.6
Sour
ce:
Com
pany
Rep
orts
and
Glo
bal R
esea
rch

Global Research - GCC Global Investment House
August 2008 GCC Telecom Sector 113
INC
OM
E S
TA
TE
ME
NT
Bah
rain
Tel
ecom
mun
icat
ions
Com
pany
(B
AT
EL
CO
)
BD
’000
2005
A20
06A
2007
A20
08E
2009
E20
10E
2011
E
Rev
enue
211
,616
.0
234
,445
.0
293
,079
.0
340
,413
.8
377
,292
.6
433
,876
.8
502
,506
.6
Net
wor
k op
erat
ing
expe
nse
(57
,916
.0)
(61
,016
.0)
(85
,904
.0)
(11
1,10
1.3)
(12
3,89
1.3)
(14
6,59
0.3)
(17
3,98
5.6)
Gro
ss p
rofi
t 1
53,7
00.0
1
73,4
29.0
2
07,1
75.0
2
29,3
12.5
2
53,4
01.3
2
87,2
86.5
3
28,5
21.0
Em
ploy
ee b
enef
its e
xpen
se (
29,8
14.0
) (
34,9
17.0
) (
45,4
39.0
) (
56,2
89.5
) (
67,2
41.9
) (
78,6
50.2
) (
89,6
21.9
)
Gen
eral
and
adm
inis
trat
ive
expe
nse
(20
,827
.0)
(24
,177
.0)
(29
,837
.0)
(31
,963
.9)
(35
,828
.6)
(39
,437
.7)
(43
,540
.8)
EB
ITD
A 1
03,0
59.0
1
14,3
35.0
1
31,8
99.0
1
41,0
59.1
1
50,3
30.8
1
69,1
98.7
1
95,3
58.3
Dep
reci
atio
n an
d am
ortiz
atio
n (
25,7
14.0
) (
29,9
22.0
) (
37,8
75.0
) (
39,2
03.7
) (
44,0
89.8
) (
48,1
57.9
) (
51,9
81.8
)
EB
IT 7
7,34
5.0
84,
413.
0 9
4,02
4.0
101
,855
.4
106
,241
.1
121
,040
.7
143
,376
.5
Fina
nce
Cos
ts
-
(44
5.0)
(6,
430.
0) (
6,54
9.6)
(6,
058.
4) (
5,14
9.7)
(4,
377.
2)
Fina
nce
Inco
me
4,1
34.0
4
,030
.0
5,0
38.0
4
,865
.2
6,0
54.4
8
,025
.7
10,
606.
5
Shar
e of
pro
fit o
f as
soci
ate
net o
f ta
x -
-
1
,911
.0
2,3
88.8
2
,985
.9
3,7
32.4
4
,665
.5
Inve
stm
ent i
ncom
e 1
,740
.0
-
-
-
-
-
-
Gai
n on
sal
e of
inve
stm
ent
1,7
64.0
-
-
-
-
-
-
Oth
er in
com
e 1
,933
.0
2,8
37.0
1
0,81
5.0
5,4
46.6
5
,659
.4
6,5
08.2
7
,537
.6
Pro
fit
befo
re t
ax 8
6,91
6.0
90,
835.
0 1
05,3
58.0
1
08,0
06.3
1
14,8
82.4
1
34,1
57.3
1
61,8
09.0
Tax
es -
-
(
1,25
9.0)
(2,
160.
1) (
2,29
7.6)
(2,
683.
1) (
3,23
6.2)
Pro
fit
for
the
year
86,
916.
0 9
0,83
5.0
104
,099
.0
105
,846
.2
112
,584
.7
131
,474
.2
158
,572
.8
Min
ority
inte
rest
1,3
15.0
1
,500
.0
2,6
06.0
2
,646
.2
2,8
14.6
3
,286
.9
3,9
64.3
Net
Pro
fit
Att
ribu
tabl
e to
Equ
ity
hold
ers
85,
601.
0 8
9,33
5.0
101
,493
.0
103
,200
.0
109
,770
.1
128
,187
.3
154
,608
.5
P&
L A
ppro
pria
tion
acc
ount
Ope
ning
Bal
ance
of
Ret
aine
d E
arni
ngs
131
,953
.0
157
,514
.0
167
,563
.0
200
,942
.0
249
,845
.0
328
,735
.1
426
,042
.4
Prof
it fo
r th
e ye
ar 8
5,60
1.0
89,
335.
0 1
01,4
93.0
1
03,2
00.0
1
09,7
70.1
1
28,1
87.3
1
54,6
08.5
Div
iden
ds p
aid
(30
,000
.0)
(25
,000
.0)
(33
,600
.0)
(24
,000
.0)
(28
,800
.0)
(28
,800
.0)
(28
,800
.0)
Bon
us S
hare
s -
(
20,0
00.0
) -
(
24,0
00.0
) -
-
-
Don
atio
ns (
1,65
3.0)
(1,
757.
0) (
1,75
0.0)
(1,
750.
0) (
1,75
0.0)
(1,
750.
0) (
1,75
0.0)
Dir
ecto
rs r
emun
erat
ion
paid
(15
9.0)
(27
5.0)
(33
0.0)
(33
0.0)
(33
0.0)
(33
0.0)
(33
0.0)
Tra
nsfe
r to
sta
tuto
ry r
eser
ve (
8,22
8.0)
(8,
254.
0) (
8,43
4.0)
(4,
217.
0) -
-
-
Inte
rim
div
iden
d (
20,0
00.0
) (
24,0
00.0
) (
24,0
00.0
) -
-
-
-
Clo
sing
Bal
ance
of
Ret
aine
d E
arni
ngs
157
,514
.0
167
,563
.0
200
,942
.0
249
,845
.0
328
,735
.1
426
,042
.4
549
,770
.9
Sour
ce:
Com
pany
Rep
orts
and
Glo
bal R
esea
rch

Global Research - GCC Global Investment House
114 GCC Telecom Sector August 2008
CA
SH F
LO
W S
TA
TE
ME
NT
Bah
rain
Tel
ecom
mun
icat
ions
Com
pany
(B
AT
EL
CO
)
BD
’000
2005
A20
06A
2007
A20
08E
2009
E20
10E
2011
E
Ope
rati
ng A
ctiv
itie
s
Net
Inc
ome
85,6
01.0
89,3
35.0
101,
493.
010
3,20
0.0
109,
770.
112
8,18
7.3
154,
608.
5
Dep
reci
atio
n25
,714
.029
,922
.037
,875
.039
,203
.744
,089
.848
,157
.951
,981
.8
Oth
er I
ncom
e-2
03.0
-6,8
67.0
-17,
764.
0-1
2,70
0.6
-14,
699.
7-1
8,26
6.2
-22,
809.
7
Inte
rest
Cos
t-
445.
06,
430.
06,
549.
66,
058.
45,
149.
74,
377.
2
Oth
er O
pera
ting
Cas
h Fl
ows
-1,7
46.0
-1,9
85.0
-40.
0-2
,080
.0-2
,080
.0-2
,080
.0-2
,080
.0
Min
ority
Int
eres
t1,
315.
01,
500.
02,
606.
02,
646.
22,
814.
63,
286.
93,
964.
3
Cha
nge
in N
et W
orki
ng C
apita
l10
,009
.023
,104
.016
,267
.0-3
,611
.94,
619.
86,
959.
87,
871.
5
Tot
al O
pera
ting
Cas
h F
low
s12
0,69
0.0
135,
454.
014
6,86
7.0
133,
207.
115
0,57
3.0
171,
395.
319
7,91
3.6
Inve
stin
g A
ctiv
itie
s
Purc
hase
of
Plan
t & P
rope
rty
-23,
661.
0-8
1,73
6.0
-49,
473.
0-7
7,13
8.5
-62,
462.
5-5
3,77
0.7
-55,
482.
7
Inta
ngib
le A
sset
s62
3.0
-32,
181.
0-1
,577
.0-
--
-
Inve
stm
ent i
n A
ssoc
iate
s-
--6
2,44
6.0
-21,
948.
0-
--
Purc
hase
of
Inve
stm
ents
-11,
218.
07,
965.
04,
819.
0-2
0,02
9.5
-10,
571.
1-1
3,21
3.9
-16,
517.
4
Oth
er I
nves
tmen
t Act
iviti
es20
3.0
-118
,267
.013
,994
.011
,343
.412
,935
.315
,972
.619
,827
.9
Tot
al I
nves
tmen
t A
ctiv
itie
s-3
4,05
3.0
-224
,219
.0-9
4,68
3.0
-107
,772
.7-6
0,09
8.2
-51,
012.
0-5
2,17
2.2
Fin
anci
ng A
ctiv
itie
s
Cur
rent
por
tion
of d
ebt
-3,
659.
073
,761
.0-
--
-
Tra
de a
nd o
ther
pay
able
s-9
,368
.010
,741
.0-5
64.0
--
--
Non
cur
rent
por
tion
of d
ebt
-6,
342.
010
7,36
7.0
-17,
056.
4-1
4,49
7.9
-12,
323.
2-1
0,47
4.7
Inte
rest
Cos
t-
-445
.0-6
,430
.0-6
,549
.6-6
,058
.4-5
,149
.7-4
,377
.2
Min
ority
Int
eres
t-8
91.0
477.
0-8
17.0
--
--
Fina
l Div
iden
d Pa
id-3
0,00
0.0
-25,
000.
0-3
3,60
0.0
-24,
000.
0-2
8,80
0.0
-28,
800.
0-2
8,80
0.0
Inte
rim
Div
iden
d Pa
id-2
0,00
0.0
-24,
000.
0-2
4,00
0.0
--
--
Tot
al F
inan
cing
Act
ivit
ies
-60,
259.
0-2
8,22
6.0
115,
717.
0-4
7,60
6.0
-49,
356.
3-4
6,27
2.9
-43,
651.
9
Ope
ning
Bal
ance
136,
369.
016
2,74
7.0
45,7
56.0
213,
657.
019
1,48
5.4
232,
603.
830
6,71
4.2
Tot
al C
hang
e in
Cas
h26
,378
.0-1
16,9
91.0
167,
901.
0-2
2,17
1.6
41,1
18.4
74,1
10.4
102,
089.
5
End
ing
Bal
ance
162,
747.
045
,756
.021
3,65
7.0
191,
485.
423
2,60
3.8
306,
714.
240
8,80
3.8
Sour
ce:
Com
pany
Rep
orts
and
Glo
bal R
esea
rch

Global Research - GCC Global Investment House
August 2008 GCC Telecom Sector 115
FA
CT
SH
EE
TB
ahra
in T
elec
omm
unic
atio
ns C
ompa
ny (
BA
TE
LC
O)
2005
A20
06A
2007
A20
08E
2009
E20
10E
2011
E
Liq
uidi
ty R
atio
sC
urre
nt r
atio
(tim
es)
3.6
1.1
1.5
1.4
1.5
1.8
2.1
Qui
ck r
atio
(tim
es)
3.6
1.1
1.5
1.4
1.5
1.8
2.1
Cas
h ra
tio (
times
)2.
90.
51.
11.
01.
11.
41.
7
Pro
fita
bilit
y R
atio
sG
ross
Mar
gin
%72
.6%
74.0
%70
.7%
67.4
%67
.2%
66.2
%65
.4%
EB
ITD
A M
argi
n %
48.7
%48
.8%
45.0
%41
.4%
39.8
%39
.0%
38.9
%E
BIT
Mar
gin
%36
.5%
36.0
%32
.1%
29.9
%28
.2%
27.9
%28
.5%
Net
Pro
fit M
argi
n40
.5%
38.1
%34
.6%
30.3
%29
.1%
29.5
%30
.8%
RO
E %
25.9
%24
.1%
24.4
%20
.8%
19.0
%18
.9%
19.2
%R
OA
%22
.1%
18.6
%13
.8%
12.9
%12
.5%
13.0
%13
.7%
Eff
icie
ncy
Rat
ios
A/R
Tur
nove
r (t
imes
)5.
76.
16.
46.
66.
66.
76.
7In
vent
ory
Tur
nove
r (t
imes
)79
.258
.530
.223
.222
.221
.519
.7A
/P T
urno
ver
(tim
es)
0.83
0.60
0.75
0.92
0.91
0.94
1.05
CO
GS/
Sale
s27
.4%
26.0
%29
.3%
32.6
%32
.8%
33.8
%34
.6%
SG&
A /S
ales
9.8%
10.3
%10
.2%
9.4%
9.5%
9.1%
8.7%
Fin
anci
ng R
atio
sD
ebt t
o eq
uity
(tim
es)
-0.
030.
460.
350.
280.
220.
17D
ebt t
o to
tal a
sset
s %
-2.
1%26
.0%
22.0
%18
.0%
15.0
%12
.0%
Div
iden
ds p
ayou
t rat
io %
-0.
0%0.
0%0%
0%0%
0%
Gro
wth
Rat
es
Rev
enue
gro
wth
rat
e-
10.8
%25
.0%
16.2
%10
.8%
15.0
%15
.8%
Net
inco
me
grow
th r
ate
-4.
4%13
.6%
1.7%
6.4%
16.8
%20
.6%
Equ
ity g
row
th r
ate
-12
.2%
12.3
%19
.1%
16.5
%17
.4%
18.8
%T
otal
ass
ets
grow
th r
ate
-24
.2%
52.8
%8.
9%9.
9%12
.1%
14.2
%Su
stai
nabl
e gr
owth
rat
e25
.9%
24.1
%24
.4%
20.8
%19
.0%
18.9
%19
.2%
Val
uati
on R
atio
s N
umbe
r of
sha
res
(in
000)
1,4
40,0
00
1,4
40,0
00
1,4
40,0
00
1,4
40,0
00
1,4
40,0
00
1,4
40,0
00
1,4
40,0
00
Par
Val
ue p
er s
hare
(B
D)
0.0
69
0.0
83
0.0
83
0.1
00
0.1
00
0.1
00
0.1
00
BV
per
sha
re (
BD
) 0
.230
0
.258
0
.289
0
.345
0
.402
0
.471
0
.560
E
PS (
BD
) 0
.059
0
.062
0
.070
0
.072
0
.076
0
.089
0
.107
M
arke
t pri
ce s
hare
(B
D)
0.7
64
0.7
92
0.8
04
0.7
05
0.7
05
0.7
05
0.7
05
Mar
ket c
apita
lizat
ion
(BD
000
) 1
,100
,160
1
,140
,480
1
,157
,760
1
,015
,200
1
,015
,200
1
,015
,200
1
,015
,200
E
nter
pris
e V
alue
(B
D 0
00)
937
,413
1
,104
,725
1
,135
,232
9
97,7
87
942
,171
8
55,7
37
743
,173
E
V /
EB
ITD
A 9
.1
9.7
8
.6
7.1
6
.3
5.1
3
.8
P/E
rat
io 1
2.9
12.
8 1
1.4
9.8
9
.2
7.9
6
.6
P/B
V r
atio
3.3
3
.1
2.8
2
.0
1.8
1
.5
1.3
So
urce
: C
ompa
ny R
epor
ts &
Glo
bal R
esea
rch
His
tori
cal P
/E &
P/B
mul
tiple
s pe
rtai
n to
res
pect
ive
year
-end
pri
ces,
whi
le th
ose
for
futu
re y
ears
are
bas
ed o
n cl
osin
g pr
ice
as
at A
ug. 3
1, 2
008.
Global Research - GCC Global Investment House
116 GCC Telecom Sector August 2008
Oman Telecommunications Company
Ticker: OTL.OM (Reuters)OTEL OM (Bloomberg)
Listing:Muscat Securities Market
CMP:RO1.983 (Aug 31, 2008)
Key Data
EPS (RO)* 0.149 Average daily volume (‘000) 680.4
BVPS (RO)* 0.456 52 week High / Low (RO) 2.442/ 1.132
P/E (x) 11.4 Market Cap (RO mn) 1,487.3
P/BV (x) 3.8 Estimated Fair Value per share (RO) 2.339Source: Bloomberg and Global Research
* Actual (2007)
Background
• Oman Telecommunications Company (OTEL) is the incumbent and the leading telecom operator in the Sultanate providing fixed line, cellular and internet services to corporate, government and individual customers. The company was established in 1980 pursuant to Law No. 43 of 1980 as the General Telecommunications Organization (GTO), and has been a monopoly provider of telecommunications services since then until Mar’05 when the mobile segment was opened up for competition.
• In view of emerging competition in the mobile market, Omantel Group established Oman Mobile in 2004, as a subsidiary company. OTEL became a publicly listed company in Jul’05, when its shares were listed in the Muscat Securities Market (MSM). The company is 70.0% owned by the Omani government, 9.0% by the Civil Service Employees Pension Fund of Oman and 21.0% by the public.
Analysis of Country Operations
• OTEL’s main operations are within the telecom market in Oman. The Omani government started implementing the sector liberalization in line with World Trade Organization (WTO) agreement in 2005. The industry witnessed competition in the mobile sector through the licensing of a 2nd mobile operator Nawras in Mar’05. Currently, two mobile operators have been licensed.
• The sector liberalization process which began in the Sultanate in year 2005 has gained further momentum in year 2007 with the signing of Free Trade Agreement with the US. Telecommunication Regulatory Authority (TRA) has already requested applications
Recommendation
BUY

Global Research - GCC Global Investment House
August 2008 GCC Telecom Sector 117
from interested parties for the resale of mobile calls offered by the country’s two mobile operators through pre-paid cards. Also, following the TRA directive, OTEL has submitted the Reference Access offer (RAO) as part of the market liberalization of Internet and Value Added services.
Oman Operations
Cellular ServicesThe opening up of the cellular services market in Oman has worked well to improve the cellular penetration that has increased considerably from 51.9% in 2005 to 96.2% in 2007. OTEL currently has 1.4mn cellular subscribers. Cellular subscribers in Oman have increased at a 5-year (2002-07) CAGR of 40.1% from 0.5mn subscribers in 2002 to 2.5mn in 2007.
Table 1: OTEL’s Oman Cellular Services Snapshot
000s 2005 2006 2007
Oman Cellular Subscribers 1,333.2 1,818.0 2,500.0
Oman Cellular Penetration 51.9% 69.7% 96.2%
Pre paid subscribers % 63.0% 65.0% 72.0%
Post paid subscribers % 37.0% 35.0% 28.0%
Sector Blended ARPU (US$) 37.1 36.4 34.0
OTEL Cellular Subscribers 947.8 1,167.7 1,364.6
Market Share 71.1% 64.2% 54.6%
Source: Company Reports, ITU and Global Research
OTEL is adopting various measures like introduction of value added services to improve the customer retention and various promotion packages to improve customer loyalty. However, the arrival of competition in 2005 in the form of Nawras Telecom (a Qatar Telecom group company) has drived down the market shares of OTEL from 71.1% in 2005 to 54.6% in 2007. To further its efforts to improve the customer access to technological advancements OTEL is planning to implement 3G services by 3Q08 that would provide high-speed internet and data transfer access through HSDPA.
Cellular services (including interconnect revenues) are the major contributor to the overall revenues of OTEL. In 2007, they contributed about 77.6% of total revenues compared to 74.4% in 2006. Though the overall cellular revenues (including interconnect revenues) registered a YoY increase of 17.7% in 2007, the cellular ARPUs increased only marginally by 0.7% from RO17.2 in 2006 to RO17.3 in 2007. ARPUs excluding interconnect revenues declined by 6.0% from RO14.0 in 2006 to RO13.1 in 2007. This was as a result of price cuts on account of competition.
Fixed Line ServicesOTEL is the only player providing fixed line services in the sultanate. The TRA is contemplating to open up the fixed line services also to competition; however the timelines have not been specified.
The fixed line subscribers declined by 0.6% from 269,700 in 2006 to 268,100 in 2007. The increasingly convenient cellular services are causing erosion in the subscriber base of fixed
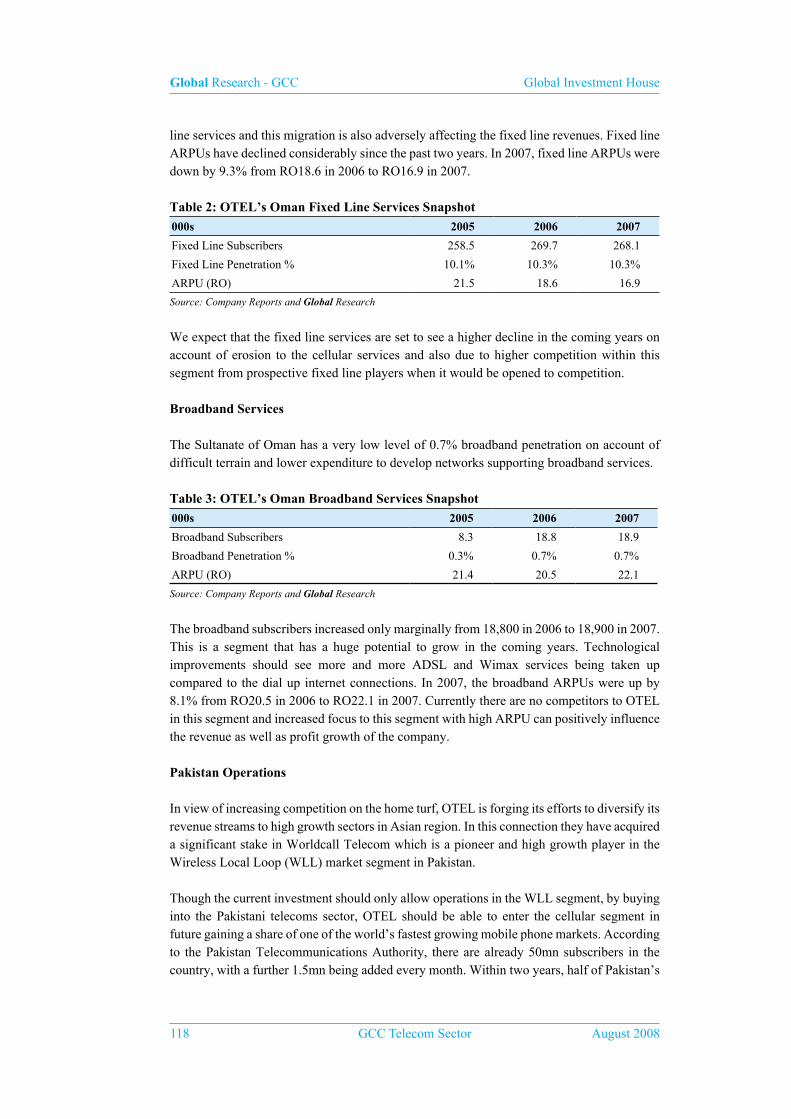
Global Research - GCC Global Investment House
118 GCC Telecom Sector August 2008
line services and this migration is also adversely affecting the fixed line revenues. Fixed line ARPUs have declined considerably since the past two years. In 2007, fixed line ARPUs were down by 9.3% from RO18.6 in 2006 to RO16.9 in 2007.
Table 2: OTEL’s Oman Fixed Line Services Snapshot
000s 2005 2006 2007
Fixed Line Subscribers 258.5 269.7 268.1
Fixed Line Penetration % 10.1% 10.3% 10.3%
ARPU (RO) 21.5 18.6 16.9
Source: Company Reports and Global Research
We expect that the fixed line services are set to see a higher decline in the coming years on account of erosion to the cellular services and also due to higher competition within this segment from prospective fixed line players when it would be opened to competition.
Broadband Services
The Sultanate of Oman has a very low level of 0.7% broadband penetration on account of difficult terrain and lower expenditure to develop networks supporting broadband services.
Table 3: OTEL’s Oman Broadband Services Snapshot
000s 2005 2006 2007
Broadband Subscribers 8.3 18.8 18.9
Broadband Penetration % 0.3% 0.7% 0.7%
ARPU (RO) 21.4 20.5 22.1
Source: Company Reports and Global Research
The broadband subscribers increased only marginally from 18,800 in 2006 to 18,900 in 2007. This is a segment that has a huge potential to grow in the coming years. Technological improvements should see more and more ADSL and Wimax services being taken up compared to the dial up internet connections. In 2007, the broadband ARPUs were up by 8.1% from RO20.5 in 2006 to RO22.1 in 2007. Currently there are no competitors to OTEL in this segment and increased focus to this segment with high ARPU can positively influence the revenue as well as profit growth of the company.
Pakistan Operations
In view of increasing competition on the home turf, OTEL is forging its efforts to diversify its revenue streams to high growth sectors in Asian region. In this connection they have acquired a significant stake in Worldcall Telecom which is a pioneer and high growth player in the Wireless Local Loop (WLL) market segment in Pakistan.
Though the current investment should only allow operations in the WLL segment, by buying into the Pakistani telecoms sector, OTEL should be able to enter the cellular segment in future gaining a share of one of the world’s fastest growing mobile phone markets. According to the Pakistan Telecommunications Authority, there are already 50mn subscribers in the country, with a further 1.5mn being added every month. Within two years, half of Pakistan’s
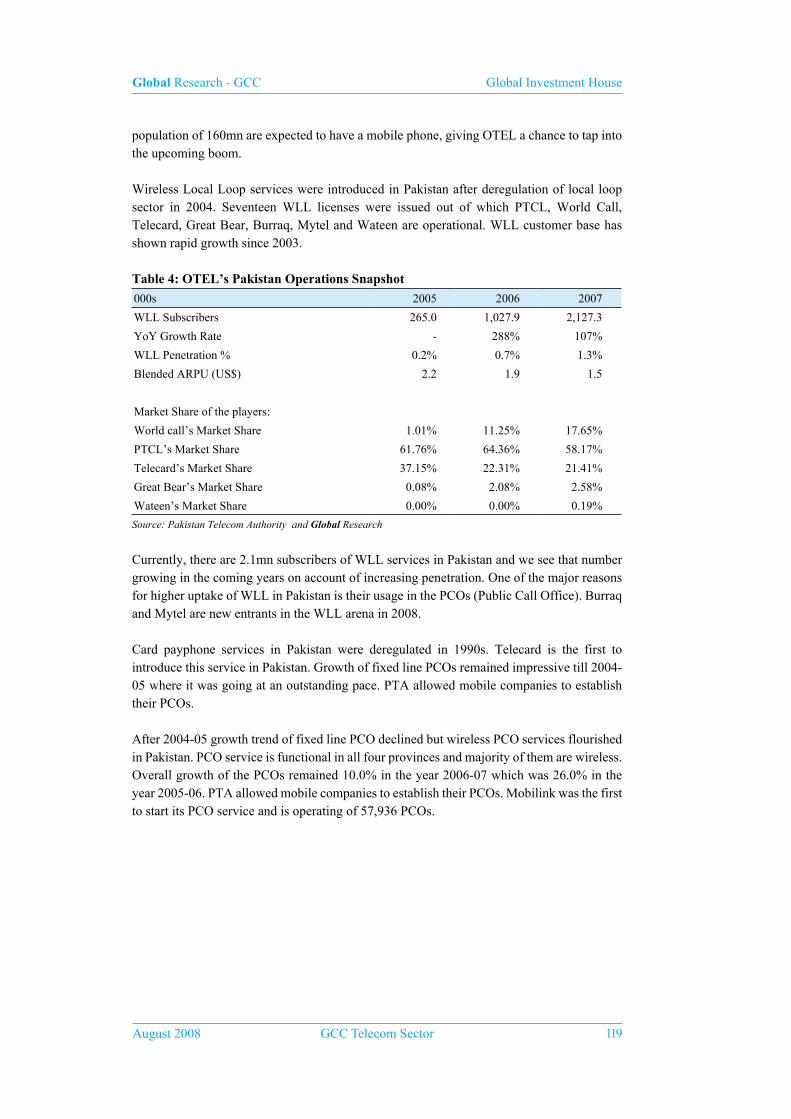
Global Research - GCC Global Investment House
August 2008 GCC Telecom Sector 119
population of 160mn are expected to have a mobile phone, giving OTEL a chance to tap into the upcoming boom.
Wireless Local Loop services were introduced in Pakistan after deregulation of local loop sector in 2004. Seventeen WLL licenses were issued out of which PTCL, World Call, Telecard, Great Bear, Burraq, Mytel and Wateen are operational. WLL customer base has shown rapid growth since 2003.
Table 4: OTEL’s Pakistan Operations Snapshot
000s 2005 2006 2007
WLL Subscribers 265.0 1,027.9 2,127.3
YoY Growth Rate - 288% 107%
WLL Penetration % 0.2% 0.7% 1.3%
Blended ARPU (US$) 2.2 1.9 1.5
Market Share of the players:
World call’s Market Share 1.01% 11.25% 17.65%
PTCL’s Market Share 61.76% 64.36% 58.17%
Telecard’s Market Share 37.15% 22.31% 21.41%
Great Bear’s Market Share 0.08% 2.08% 2.58%
Wateen’s Market Share 0.00% 0.00% 0.19%
Source: Pakistan Telecom Authority and Global Research
Currently, there are 2.1mn subscribers of WLL services in Pakistan and we see that number growing in the coming years on account of increasing penetration. One of the major reasons for higher uptake of WLL in Pakistan is their usage in the PCOs (Public Call Office). Burraq and Mytel are new entrants in the WLL arena in 2008.
Card payphone services in Pakistan were deregulated in 1990s. Telecard is the first to introduce this service in Pakistan. Growth of fixed line PCOs remained impressive till 2004-05 where it was going at an outstanding pace. PTA allowed mobile companies to establish their PCOs.
After 2004-05 growth trend of fixed line PCO declined but wireless PCO services flourished in Pakistan. PCO service is functional in all four provinces and majority of them are wireless. Overall growth of the PCOs remained 10.0% in the year 2006-07 which was 26.0% in the year 2005-06. PTA allowed mobile companies to establish their PCOs. Mobilink was the first to start its PCO service and is operating of 57,936 PCOs.
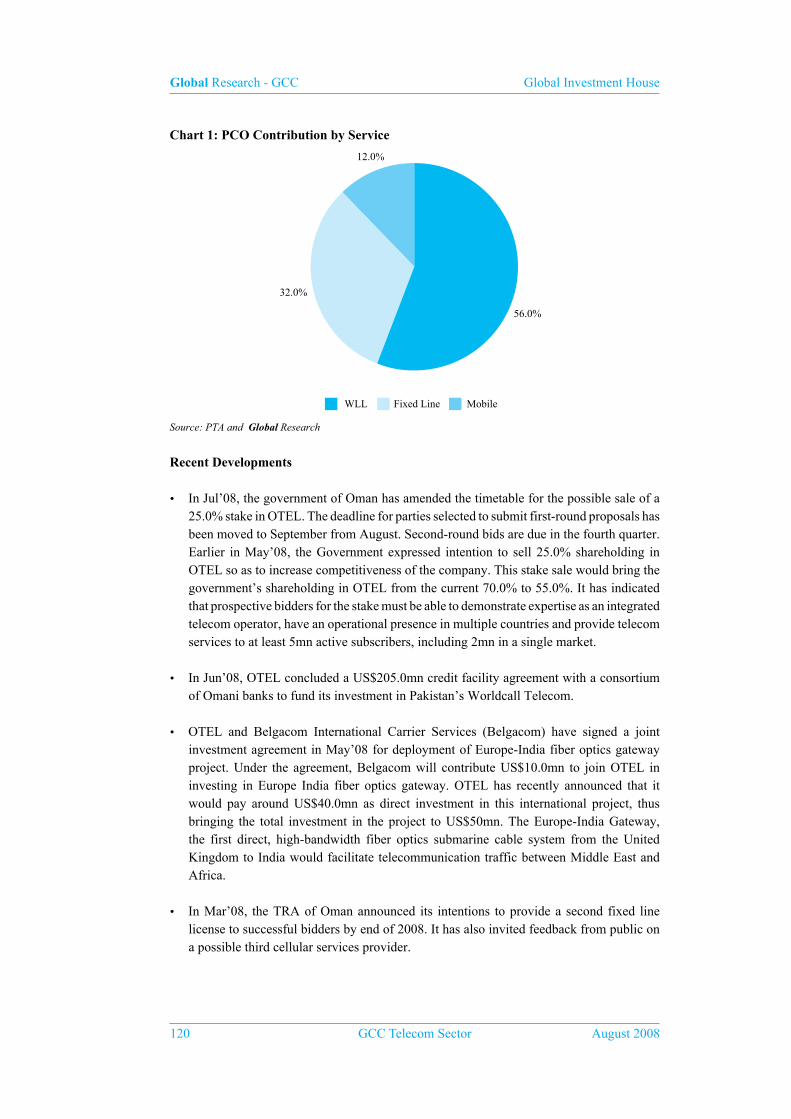
Global Research - GCC Global Investment House
120 GCC Telecom Sector August 2008
Chart 1: PCO Contribution by Service
56.0%
WLL Fixed Line Mobile
32.0%
12.0%
Source: PTA and Global Research
Recent Developments
• In Jul’08, the government of Oman has amended the timetable for the possible sale of a 25.0% stake in OTEL. The deadline for parties selected to submit first-round proposals has been moved to September from August. Second-round bids are due in the fourth quarter. Earlier in May’08, the Government expressed intention to sell 25.0% shareholding in OTEL so as to increase competitiveness of the company. This stake sale would bring the government’s shareholding in OTEL from the current 70.0% to 55.0%. It has indicated that prospective bidders for the stake must be able to demonstrate expertise as an integrated telecom operator, have an operational presence in multiple countries and provide telecom services to at least 5mn active subscribers, including 2mn in a single market.
• In Jun’08, OTEL concluded a US$205.0mn credit facility agreement with a consortium of Omani banks to fund its investment in Pakistan’s Worldcall Telecom.
• OTEL and Belgacom International Carrier Services (Belgacom) have signed a joint investment agreement in May’08 for deployment of Europe-India fiber optics gateway project. Under the agreement, Belgacom will contribute US$10.0mn to join OTEL in investing in Europe India fiber optics gateway. OTEL has recently announced that it would pay around US$40.0mn as direct investment in this international project, thus bringing the total investment in the project to US$50mn. The Europe-India Gateway, the first direct, high-bandwidth fiber optics submarine cable system from the United Kingdom to India would facilitate telecommunication traffic between Middle East and Africa.
• In Mar’08, the TRA of Oman announced its intentions to provide a second fixed line license to successful bidders by end of 2008. It has also invited feedback from public on a possible third cellular services provider.
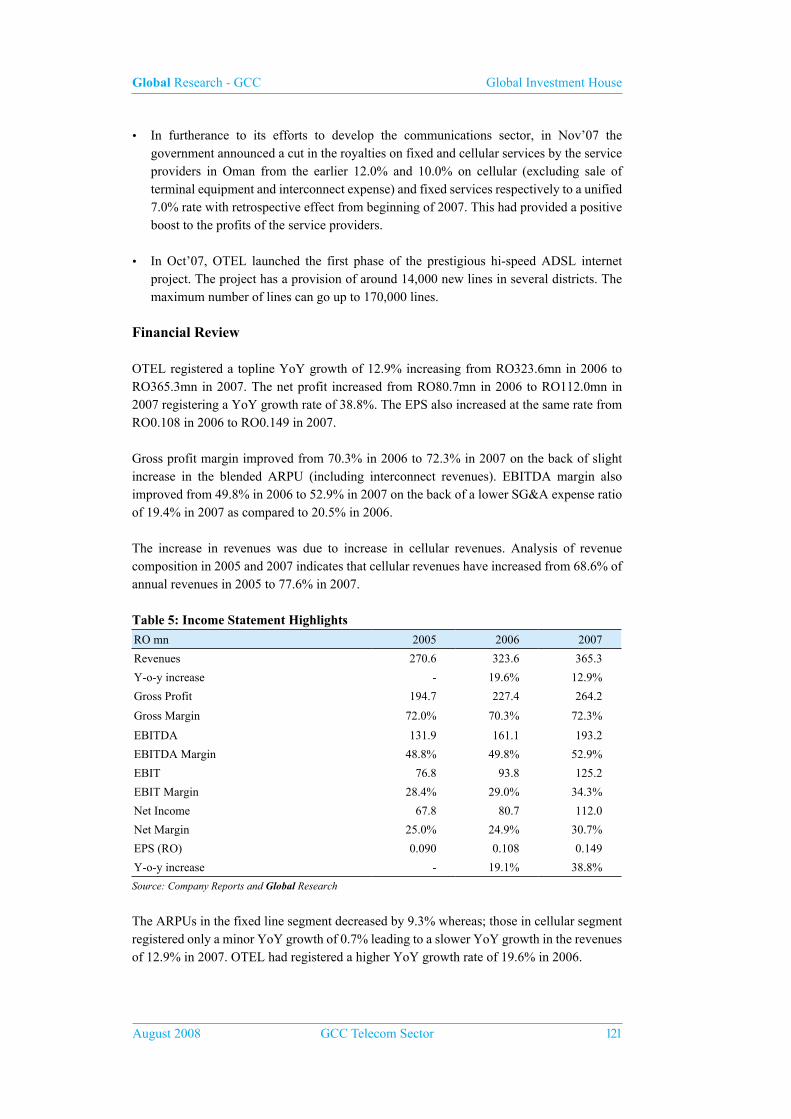
Global Research - GCC Global Investment House
August 2008 GCC Telecom Sector 121
• In furtherance to its efforts to develop the communications sector, in Nov’07 the government announced a cut in the royalties on fixed and cellular services by the service providers in Oman from the earlier 12.0% and 10.0% on cellular (excluding sale of terminal equipment and interconnect expense) and fixed services respectively to a unified 7.0% rate with retrospective effect from beginning of 2007. This had provided a positive boost to the profits of the service providers.
• In Oct’07, OTEL launched the first phase of the prestigious hi-speed ADSL internet project. The project has a provision of around 14,000 new lines in several districts. The maximum number of lines can go up to 170,000 lines.
Financial Review
OTEL registered a topline YoY growth of 12.9% increasing from RO323.6mn in 2006 to RO365.3mn in 2007. The net profit increased from RO80.7mn in 2006 to RO112.0mn in 2007 registering a YoY growth rate of 38.8%. The EPS also increased at the same rate from RO0.108 in 2006 to RO0.149 in 2007.
Gross profit margin improved from 70.3% in 2006 to 72.3% in 2007 on the back of slight increase in the blended ARPU (including interconnect revenues). EBITDA margin also improved from 49.8% in 2006 to 52.9% in 2007 on the back of a lower SG&A expense ratio of 19.4% in 2007 as compared to 20.5% in 2006.
The increase in revenues was due to increase in cellular revenues. Analysis of revenue composition in 2005 and 2007 indicates that cellular revenues have increased from 68.6% of annual revenues in 2005 to 77.6% in 2007.
Table 5: Income Statement Highlights
RO mn 2005 2006 2007
Revenues 270.6 323.6 365.3
Y-o-y increase - 19.6% 12.9%
Gross Profit 194.7 227.4 264.2
Gross Margin 72.0% 70.3% 72.3%
EBITDA 131.9 161.1 193.2
EBITDA Margin 48.8% 49.8% 52.9%
EBIT 76.8 93.8 125.2
EBIT Margin 28.4% 29.0% 34.3%
Net Income 67.8 80.7 112.0
Net Margin 25.0% 24.9% 30.7%
EPS (RO) 0.090 0.108 0.149
Y-o-y increase - 19.1% 38.8%
Source: Company Reports and Global Research
The ARPUs in the fixed line segment decreased by 9.3% whereas; those in cellular segment registered only a minor YoY growth of 0.7% leading to a slower YoY growth in the revenues of 12.9% in 2007. OTEL had registered a higher YoY growth rate of 19.6% in 2006.

Global Research - GCC Global Investment House
122 GCC Telecom Sector August 2008
Chart 2: Composition of Revenues
68.6% 77.6%
15.4%
7.0%
24.5%
6.9%
Cellular Services Fixed Line Services Broadband Services Cellular Services Fixed Line Services Broadband Services
2005 2007
Source: Company Reports and Global Research
The positively growing EBITDA profile has also translated into better ROE for the company. The ROE has increased from 26.8% in 2005 to 32.9% in 2007.
Chart 3: EBITDA (RO mn) and ROE
131.9161.1 193.2
32.9%26.8%
28.7%
-
50.0
100.0
150.0
200.0
250.0
2005 2006 200710.0%
15.0%
20.0%
25.0%
30.0%
35.0%
EBITDA ROE%
Source: Company Reports and Global Research
OTEL’s ROA also has improved from 15.0% in 2005 to 22.9% in 2007 on the back of superior EBITDA growth profile.
Chart 4: EBITDA (RO mn) and ROA
193.2161.1
131.9
22.9%
17.7%
15.0%
-
50.0
100.0
150.0
200.0
250.0
2005 2006 200710.0%
12.0%
14.0%
16.0%
18.0%
20.0%
22.0%
24.0%
EBITDA ROA%
Source: Company Reports and Global Research

Global Research - GCC Global Investment House
August 2008 GCC Telecom Sector 123
OTEL’s total assets increased by 7.7%; from RO457.3mn in 2006 to RO492.4mn in 2007. The capital expenditure was lower in 2007 at RO29.9mn compared to RO57.5mn in 2006.
In 1Q08, OTEL achieved a net profit of RO38.4mn compared to RO24.0mn in 1Q07 registering a YoY growth of 60.0% on the back of double digit revenue growth with lower spending in operating expenses compared to the previous year. The revenues for the quarter ended Mar’08 rose by 14.6% to RO98.2mn compared to RO85.7mn in 1Q07.
The operating expenses declined by 2.7% to RO56.9mn compared to RO58.5mn for the same period of last year. The major reason for decline in operating expenditure came from Royalty charges, Provision of impairment of receivables and Depreciation.
Table 6: Balance Sheet HighlightsRO mn 2005 2006 2007
Cash & Near Cash Items 47.6 54.8 106.4
Y-o-y increase - 15.2% 94.1%
Current Assets 40.6 45.9 68.9
Y-o-y increase - 13.1% 50.2%
Fixed Assets 320.2 313.1 275.3
Y-o-y increase - -2.2% -12.1%
Other Assets 46.2 43.5 41.8
Y-o-y increase - -5.8% -3.9%
Total Assets 454.5 457.3 492.4
Y-o-y increase - 0.6% 7.7%
% composition
Cash & Near Cash Items 10.5% 12.0% 21.6%
Current Assets 8.9% 10.0% 14.0%
Fixed Assets 70.4% 68.5% 55.9%
Other Assets 10.2% 9.5% 8.5%
Total Assets 100.0% 100.0% 100.0%
Current Liabilities 109.5 115.9 129.1
Y-o-y increase - 5.9% 11.3%
Debt 87.3 52.3 13.4
Y-o-y increase - -40.1% -74.4%
Shareholders Equity 253.9 282.2 341.9
Y-o-y increase - 11.1% 21.2%
Other Liabilities 3.9 6.9 8.0
Y-o-y increase - 79.1% 15.8%
Total Liabilities & equity 454.5 457.3 492.4
Y-o-y increase - 0.6% 7.7%
% composition
Current Liabilities 24.1% 25.3% 26.2%
Debt 19.2% 11.4% 2.7%
Shareholders Equity 55.9% 61.7% 69.4%
Other Liabilities 0.9% 1.5% 1.6%
Total Liabilities & equity 100% 100% 100%
Source: Company Reports and Global Research

Global Research - GCC Global Investment House
124 GCC Telecom Sector August 2008
The EPS for 1Q08 was RO0.051, which is 59.8% higher than the corresponding period of the previous year. Total subscriber base (including cellular, fixed line and broadband) increased to 1.97mn as of Mar’08 compared to 1.67mn as of Mar’07, a YoY growth of 17.8%.
Outlook & Valuation
We believe that the Omani telecom sector is to see unprecedented competition in the coming years attracting cellular players now that TRA is considering a third cellular player. Also, a prospective second fixed line player is expected to spice up the competition in this segment. Broadband is huge opportunity yet untapped to its full potential as reflected in the penetration rate. Future growth is expected to come from broadband and other international expansion. The sale of government shareholding to strategic telecom partners is expected to improve internal efficiencies and also the competitiveness of the company.
OTEL should continue to retain its market share in this competitive scenario by enhancing revenue growth in Fixed and Mobile segment, while retaining valued customers through loyalty programs. Also, the focus should be directed on enhancing internal efficiency to control operating costs, while cautious infrastructure investment to abreast new technologies that enhance the customer experience. The investment in 3G is a best bet to increase the subscriber base in the cellular space.
The international expansion strategies of OTEL are yet to show results as those investments are in a nascent stage and are gaining market share in the respective geographies gradually. With focus on profitable growth and steps to handle the competition we have a positive outlook on OTEL in the medium term.
We believe that the stock is oversold on the news of a possible third player as the TRA is inviting bids on Aug 25, 2008. Also, after factoring in the potential loss of market share and decline in future ARPUs we believe that the stock has an upside potential at current valuation level. At the current market price of RO1.983 per share (as at Aug 31, 2008), the stock trades at 10.4x and 8.9x of its earnings and 3.8x and 3.1x of its book value for FY2008E and FY2009E respectively. The estimated fair value for OTEL works out to RO2.339 per share which offers and upside of 18.0% on the market price of RO1.983 per share (as at Aug 31, 2008). Hence, we initiate on the stock with a “BUY” recommendation.

Global Research - GCC Global Investment House
August 2008 GCC Telecom Sector 125
BA
LA
NC
E S
HE
ET
Om
an T
elec
omm
unic
atio
ns C
ompa
ny (
OT
EL
OM
)
RO
’000
2005
A20
06A
2007
A20
08E
2009
E20
10E
2011
EA
sset
sC
ash
& c
ash
equi
vale
nts
47,
564.
0 5
4,80
5.0
106
,383
.0
118
,369
.5
182
,686
.7
219
,379
.6
268
,946
.6
Tra
de &
oth
er r
ecei
vabl
es 4
1,06
5.0
47,
258.
0 6
1,92
6.0
68,
937.
9 7
7,83
7.1
77,
440.
6 8
4,37
6.3
Les
s: P
rovi
sion
for
impa
irm
ent
(5,
703.
0) (
4,79
7.0)
(1,
389.
0) (
5,60
1.2)
(6,
324.
3) (
6,29
2.1)
(6,
855.
6)
Inve
ntor
ies
5,1
89.0
3
,418
.0
3,7
57.0
6
,462
.9
7,6
37.8
8
,470
.1
9,7
56.0
Inve
stm
ents
hel
d fo
r tr
adin
g -
-
4
,594
.0
5,7
42.5
7
,178
.1
8,9
72.7
1
1,21
5.8
Cur
rent
ass
ets
88,
115.
0 1
00,6
84.0
1
75,2
71.0
1
93,9
11.7
2
69,0
15.4
3
07,9
70.8
3
67,4
39.2
Inve
stm
ents
in a
ssoc
iate
d co
mpa
nies
2,2
90.0
2
,318
.0
2,4
88.0
8
1,41
3.0
81,
413.
0 8
1,41
3.0
81,
413.
0
Inve
stm
ents
at f
air
valu
e th
roug
h pr
ofit
or lo
ss 4
,336
.0
4,3
99.0
5
,320
.0
6,6
50.0
8
,312
.5
10,
390.
6 1
2,98
8.3
Lic
ense
s 3
9,60
8.0
36,
815.
0 3
4,02
2.0
31,
229.
0 2
8,43
6.0
25,
643.
0 2
2,85
0.0
Prop
erty
, pla
nt a
nd e
quip
men
t 5
44,5
95.0
6
01,9
83.0
6
23,9
74.0
6
98,8
50.9
7
79,2
18.7
8
68,8
28.9
9
68,7
44.2
Acc
umul
ated
dep
reci
atio
n(2
24,4
27.0
)(2
88,8
91.0
)(3
48,6
59.0
)(4
14,8
00.2
) (
485,
008.
6) (
563,
290.
8) (
650,
575.
5)N
et p
rope
rty
land
and
equ
ipm
ent
320
,168
.0
313
,092
.0
275
,315
.0
284
,050
.6
294
,210
.2
305
,538
.1
318
,168
.7
Tot
al a
sset
s 4
54,5
17.0
4
57,3
08.0
4
92,4
16.0
5
97,2
54.3
6
81,3
87.1
7
30,9
55.5
8
02,8
59.1
L
iabi
litie
s
Shor
t-te
rm B
orro
win
gs 3
5,75
7.0
39,
112.
0 1
3,37
9.0
-
-
-
-
Am
ount
pay
able
to th
e go
vern
men
t 2
,852
.0
853
.0
2,1
90.0
2
,518
.5
2,8
96.3
3
,330
.7
3,8
30.3
Tra
de &
oth
er p
ayab
les
60,
065.
0 6
3,48
5.0
78,
029.
0 6
4,62
9.3
72,
972.
2 7
2,60
0.5
79,
102.
8
Div
iden
d pa
yabl
e 1
22.0
-
-
-
-
-
-
Roy
altie
s pa
yabl
e 3
6,82
1.0
43,
026.
0 3
2,29
6.0
30,
160.
3 3
4,05
3.7
33,
880.
3 3
6,91
4.6
Tax
atio
n 9
,608
.0
8,5
58.0
1
6,54
8.0
16,
548.
0 1
6,54
8.0
16,
548.
0 1
6,54
8.0
Cur
rent
liab
iliti
es 1
45,2
25.0
1
55,0
34.0
1
42,4
42.0
1
13,8
56.1
1
26,4
70.2
1
26,3
59.5
1
36,3
95.8
Lon
g te
rm d
ebt
51,
527.
0 1
3,13
9.0
-
78,
925.
0 7
1,03
2.5
55,
247.
5 3
9,46
2.5
Def
erre
d ta
x 2
,129
.0
5,1
35.0
5
,976
.0
6,8
72.4
7
,903
.3
9,0
88.7
1
0,45
2.1
End
of
serv
ice
bene
fits
1,7
41.0
1
,797
.0
2,0
50.0
2
,193
.5
2,3
47.1
2
,511
.3
2,6
87.1
T
otal
liab
iliti
es 2
00,6
22.0
1
75,1
05.0
1
50,4
68.0
2
01,8
47.0
2
07,7
53.0
1
93,2
07.1
1
88,9
97.5
Shar
e ca
pita
l 7
5,00
0.0
75,
000.
0 7
5,00
0.0
75,
000.
0 7
5,00
0.0
75,
000.
0 7
5,00
0.0
Leg
al r
eser
ve 3
0,21
8.0
33,
280.
0 3
3,28
0.0
33,
280.
0 3
3,28
0.0
33,
280.
0 3
3,28
0.0
Vol
unta
ry r
eser
ve 4
2,71
8.0
47,
015.
0 4
9,87
5.0
49,
875.
0 4
9,87
5.0
49,
875.
0 4
9,87
5.0
Cap
ital c
ontr
ibut
ion
44,
181.
0 4
4,18
1.0
44,
181.
0 4
4,18
1.0
44,
181.
0 4
4,18
1.0
44,
181.
0
Ret
aine
d ea
rnin
gs 6
1,12
3.0
81,
960.
0 1
38,6
32.0
1
91,3
74.0
2
68,7
59.6
3
32,1
03.4
4
07,3
86.1
Min
ority
inte
rest
655
.0
767
.0
980
.0
1,6
97.3
2
,538
.4
3,3
09.0
4
,139
.6
Shar
ehol
ders
’ E
quit
y 2
53,8
95.0
2
82,2
03.0
3
41,9
48.0
3
95,4
07.3
4
73,6
34.0
5
37,7
48.4
6
13,8
61.7
T
otal
liab
iliti
es a
nd S
hare
hold
ers’
Equ
ity
454
,517
.0
457
,308
.0
492
,416
.0
597
,254
.3
681
,387
.1
730
,955
.5
802
,859
.1
Sour
ce:
Com
pany
Rep
orts
and
Glo
bal R
esea
rch
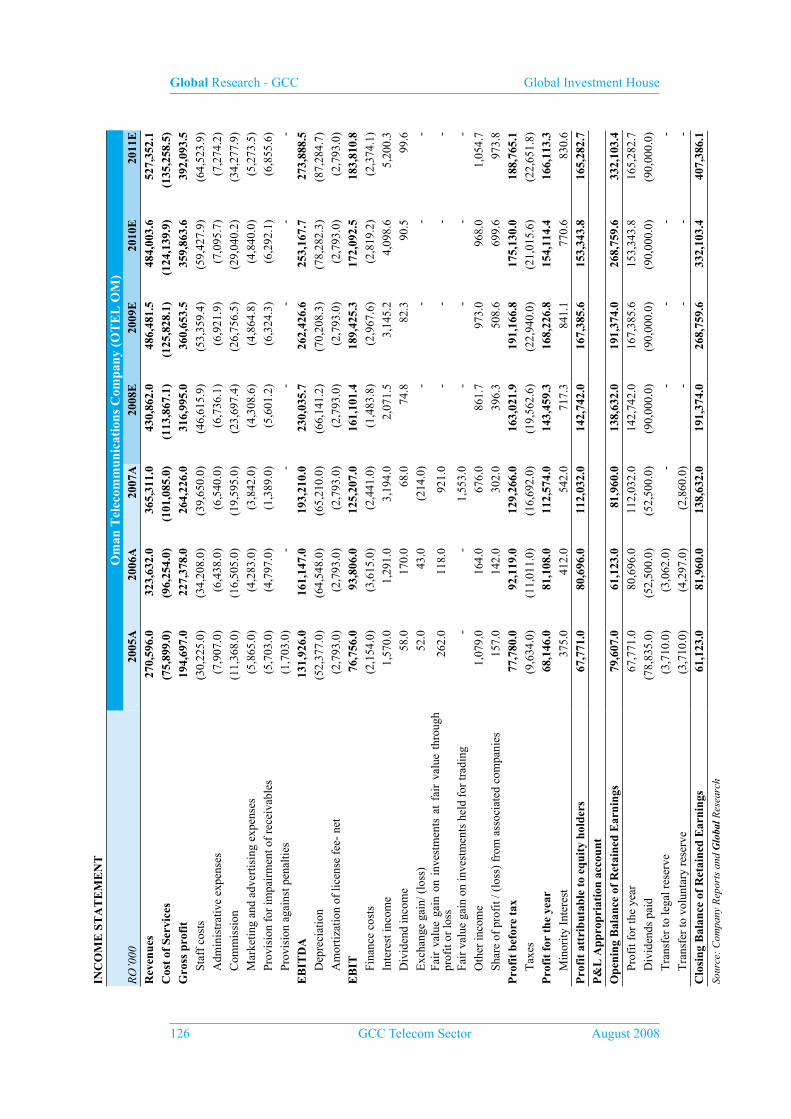
Global Research - GCC Global Investment House
126 GCC Telecom Sector August 2008
INC
OM
E S
TA
TE
ME
NT
Om
an T
elec
omm
unic
atio
ns C
ompa
ny (
OT
EL
OM
)R
O’0
0020
05A
2006
A20
07A
2008
E20
09E
2010
E20
11E
Rev
enue
s 2
70,5
96.0
3
23,6
32.0
3
65,3
11.0
4
30,8
62.0
4
86,4
81.5
4
84,0
03.6
5
27,3
52.1
C
ost
of S
ervi
ces
(75
,899
.0)
(96
,254
.0)
(10
1,08
5.0)
(11
3,86
7.1)
(12
5,82
8.1)
(12
4,13
9.9)
(13
5,25
8.5)
Gro
ss p
rofi
t 1
94,6
97.0
2
27,3
78.0
2
64,2
26.0
3
16,9
95.0
3
60,6
53.5
3
59,8
63.6
3
92,0
93.5
Staf
f co
sts
(30
,225
.0)
(34
,208
.0)
(39
,650
.0)
(46
,615
.9)
(53
,359
.4)
(59
,427
.9)
(64
,523
.9)
Adm
inis
trat
ive
expe
nses
(7,
907.
0) (
6,43
8.0)
(6,
540.
0) (
6,73
6.1)
(6,
921.
9) (
7,09
5.7)
(7,
274.
2)
Com
mis
sion
(11
,368
.0)
(16
,505
.0)
(19
,595
.0)
(23
,697
.4)
(26
,756
.5)
(29
,040
.2)
(34
,277
.9)
Mar
ketin
g an
d ad
vert
isin
g ex
pens
es (
5,86
5.0)
(4,
283.
0) (
3,84
2.0)
(4,
308.
6) (
4,86
4.8)
(4,
840.
0) (
5,27
3.5)
Prov
isio
n fo
r im
pair
men
t of
rece
ivab
les
(5,
703.
0) (
4,79
7.0)
(1,
389.
0) (
5,60
1.2)
(6,
324.
3) (
6,29
2.1)
(6,
855.
6)
Prov
isio
n ag
ains
t pen
altie
s (
1,70
3.0)
-
-
-
-
-
-
EB
ITD
A 1
31,9
26.0
1
61,1
47.0
1
93,2
10.0
2
30,0
35.7
2
62,4
26.6
2
53,1
67.7
2
73,8
88.5
Dep
reci
atio
n (
52,3
77.0
) (
64,5
48.0
) (
65,2
10.0
) (
66,1
41.2
) (
70,2
08.3
) (
78,2
82.3
) (
87,2
84.7
)
Am
ortiz
atio
n of
lice
nse
fee-
net
(2,
793.
0) (
2,79
3.0)
(2,
793.
0) (
2,79
3.0)
(2,
793.
0) (
2,79
3.0)
(2,
793.
0)E
BIT
76,
756.
0 9
3,80
6.0
125
,207
.0
161
,101
.4
189
,425
.3
172
,092
.5
183
,810
.8
Fina
nce
cost
s (
2,15
4.0)
(3,
615.
0) (
2,44
1.0)
(1,
483.
8) (
2,96
7.6)
(2,
819.
2) (
2,37
4.1)
Inte
rest
inco
me
1,5
70.0
1
,291
.0
3,1
94.0
2
,071
.5
3,1
45.2
4
,098
.6
5,2
00.3
Div
iden
d in
com
e 5
8.0
170
.0
68.
0 7
4.8
82.
3 9
0.5
99.
6
Exc
hang
e ga
in/ (
loss
) 5
2.0
43.
0 (
214.
0) -
-
-
-
Fa
ir v
alue
gai
n on
inv
estm
ents
at
fair
val
ue t
hrou
gh
prof
it or
loss
262
.0
118
.0
921
.0
-
-
-
-
Fair
val
ue g
ain
on in
vest
men
ts h
eld
for
trad
ing
-
-
1,5
53.0
-
-
-
-
Oth
er in
com
e 1
,079
.0
164
.0
676
.0
861
.7
973
.0
968
.0
1,0
54.7
Shar
e of
pro
fit /
(lo
ss)
from
ass
ocia
ted
com
pani
es 1
57.0
1
42.0
3
02.0
3
96.3
5
08.6
6
99.6
9
73.8
P
rofi
t be
fore
tax
77,
780.
0 9
2,11
9.0
129
,266
.0
163
,021
.9
191
,166
.8
175
,130
.0
188
,765
.1
Tax
es (
9,63
4.0)
(11
,011
.0)
(16
,692
.0)
(19
,562
.6)
(22
,940
.0)
(21
,015
.6)
(22
,651
.8)
Pro
fit
for
the
year
68,
146.
0 8
1,10
8.0
112
,574
.0
143
,459
.3
168
,226
.8
154
,114
.4
166
,113
.3
Min
ority
Int
eres
t 3
75.0
4
12.0
5
42.0
7
17.3
8
41.1
7
70.6
8
30.6
P
rofi
t at
trib
utab
le t
o eq
uity
hol
ders
67,
771.
0 8
0,69
6.0
112
,032
.0
142
,742
.0
167
,385
.6
153
,343
.8
165
,282
.7
P&
L A
ppro
pria
tion
acc
ount
Ope
ning
Bal
ance
of
Ret
aine
d E
arni
ngs
79,
607.
0 6
1,12
3.0
81,
960.
0 1
38,6
32.0
1
91,3
74.0
2
68,7
59.6
3
32,1
03.4
Prof
it fo
r th
e ye
ar 6
7,77
1.0
80,
696.
0 1
12,0
32.0
1
42,7
42.0
1
67,3
85.6
1
53,3
43.8
1
65,2
82.7
Div
iden
ds p
aid
(78
,835
.0)
(52
,500
.0)
(52
,500
.0)
(90
,000
.0)
(90
,000
.0)
(90
,000
.0)
(90
,000
.0)
Tra
nsfe
r to
lega
l res
erve
(3,
710.
0) (
3,06
2.0)
-
-
-
-
-
Tra
nsfe
r to
vol
unta
ry r
eser
ve (
3,71
0.0)
(4,
297.
0) (
2,86
0.0)
-
-
-
-
Clo
sing
Bal
ance
of
Ret
aine
d E
arni
ngs
61,
123.
0 8
1,96
0.0
138
,632
.0
191
,374
.0
268
,759
.6
332
,103
.4
407
,386
.1
Sour
ce:
Com
pany
Rep
orts
and
Glo
bal R
esea
rch

Global Research - GCC Global Investment House
August 2008 GCC Telecom Sector 127
CA
SH F
LO
WO
man
Tel
ecom
mun
icat
ions
Com
pany
(O
TE
L O
M)
RO
’000
2005
A20
06A
2007
A20
08E
2009
E20
10E
2011
EP
rofi
t be
fore
tax
77,
780.
0 9
2,11
9.0
129
,266
.0
163
,021
.9
191
,166
.8
175
,130
.0
188
,765
.1
Dep
reci
atio
n 5
2,37
7.0
64,
548.
0 6
5,21
0.0
66,
141.
2 7
0,20
8.3
78,
282.
3 8
7,28
4.7
Prov
isio
n fo
r im
pair
men
t of
rece
ivab
les
5,7
03.0
5
,015
.0
1,3
89.0
4
,212
.2
723
.1
(32
.2)
563
.5
Am
ortiz
atio
n of
goo
dwill
96.
0 -
-
-
-
-
-
A
mor
tizat
ion
of li
cens
es 2
,793
.0
2,7
93.0
2
,793
.0
2,7
93.0
2
,793
.0
2,7
93.0
2
,793
.0
Fair
val
ue g
ains
on
inve
stm
ents
(26
2.0)
(11
8.0)
(2,
474.
0) 0
.0
0.0
0
.0
0.0
In
tere
st in
com
e (
1,57
0.0)
(1,
291.
0) (
3,19
4.0)
(2,
071.
5) (
3,14
5.2)
(4,
098.
6) (
5,20
0.3)
Div
iden
d in
com
e (
58.0
) -
(
68.0
) (
74.8
) (
82.3
) (
90.5
) (
99.6
)Sh
are
of p
rofi
t / lo
ss f
rom
ass
ocia
ted
com
pani
es (
157.
0) (
142.
0) (
302.
0) (
396.
3) (
508.
6) (
699.
6) (
973.
8)Pr
ofit
/ los
s on
sal
e of
pro
pert
y, p
lant
and
equ
ipm
ent
(39
.0)
(11
.0)
35.
0 -
-
-
-
In
tere
st e
xpen
se 2
,154
.0
3,6
15.0
2
,441
.0
1,4
83.8
2
,967
.6
2,8
19.2
2
,374
.1
End
of
serv
ice
bene
fits
exp
ense
s 1
70.0
3
65.0
4
79.0
1
43.5
1
53.5
1
64.3
1
75.8
Pa
ymen
t of
end
of s
ervi
ce b
enef
its (
182.
0) (
309.
0) (
226.
0) -
-
-
-
W
orki
ng c
apit
al c
hang
es:
Inve
ntor
ies
570
.0
1,7
71.0
(
339.
0) (
2,70
5.9)
(1,
174.
8) (
832.
3) (
1,28
6.0)
Tra
de a
nd o
ther
rec
eiva
bles
(25
,677
.0)
(12
,114
.0)
(16
,511
.0)
(7,
011.
9) (
8,89
9.1)
396
.5
(6,
935.
8)R
oyal
ty p
ayab
le 5
,188
.0
6,2
05.0
(
10,7
30.0
) (
2,13
5.7)
3,8
93.4
(
173.
5) 3
,034
.4
Am
ount
pay
able
to th
e go
vern
men
t -
(
1,99
9.0)
1,3
37.0
3
28.5
3
77.8
4
34.4
4
99.6
T
rade
and
oth
er p
ayab
les
8,2
45.0
6
,276
.0
14,
544.
0 (
13,3
99.7
) 8
,342
.9
(37
1.7)
6,5
02.3
C
ash
gene
rate
d fr
om o
pera
tion
s 1
27,1
31.0
1
66,7
23.0
1
83,6
50.0
2
10,3
28.4
2
66,8
16.3
2
53,7
21.3
2
77,4
97.1
In
tere
st r
ecei
ved
1,5
51.0
1
,290
.0
2,1
46.0
5
87.7
1
77.7
1
,279
.4
2,8
26.2
T
ax p
aid
(10
,419
.0)
(9,
056.
0) (
7,86
4.0)
(18
,666
.2)
(21
,909
.2)
(19
,830
.1)
(21
,288
.5)
Net
cas
h ge
nera
ted
from
ope
rati
ng a
ctiv
itie
s 1
18,2
63.0
1
58,9
57.0
1
77,9
32.0
1
92,2
49.8
2
45,0
84.8
2
35,1
70.5
2
59,0
34.8
Pu
rcha
se o
f pr
oper
ty, p
lant
and
equ
ipm
ent
(82
,360
.0)
(57
,472
.0)
(29
,941
.0)
(74
,876
.9)
(80
,367
.9)
(89
,610
.2)
(99
,915
.3)
Proc
eeds
fro
m s
ale
of f
ixed
ass
ets
39.
0 1
1.0
13.
0 0
.0
0.0
0
.0
0.0
N
et a
cqui
sitio
n of
inve
stm
ents
(61
2.0)
-
(3,
041.
0) (
81,4
03.5
) (
3,09
8.1)
(3,
872.
7) (
4,84
0.8)
Proc
eeds
fro
m s
ale
of in
vest
men
ts a
t fai
r va
lue
thro
ugh
prof
it or
loss
2,7
10.0
-
-
3
96.3
5
08.6
6
99.6
9
73.8
D
ivid
end
rece
ived
172
.0
169
.0
200
.0
74.
8 8
2.3
90.
5 9
9.6
Net
cas
h us
ed in
inve
stin
g ac
tivi
ties
(80
,051
.0)
(57
,292
.0)
(32
,769
.0)
(15
5,80
9.3)
(82
,875
.1)
(92
,692
.7)
(10
3,68
2.8)
Am
ount
pai
d to
the
gove
rnm
ent
(15
,000
.0)
(41
,240
.0)
(38
,883
.0)
-
-
-
-
Ban
k bo
rrow
ings
4,5
60.0
(
4,56
0.0)
-
65,
546.
0 (
7,89
2.5)
(15
,785
.0)
(15
,785
.0)
Div
iden
ds p
aid
(49
,002
.0)
(52
,922
.0)
(52
,829
.0)
(90
,000
.0)
(90
,000
.0)
(90
,000
.0)
(90
,000
.0)
Rep
aym
ent o
f lo
an to
gov
ernm
ent
(66
4.0)
-
-
-
-
-
-
Inte
rest
pai
d (
124.
0) (
4,90
2.0)
(1,
873.
0) -
-
-
-
A
mou
nt p
aid
to c
ontr
acto
rs o
n be
half
of
the
Min
istr
y of
Fin
ance
(9,
200.
0) -
-
-
-
-
-
A
mou
nt r
ecov
ered
to c
ontr
acto
rs f
rom
the
Min
istr
y of
Fin
ance
-
9,2
00.0
-
-
-
-
-
N
et c
ash
used
in f
inan
cing
act
ivit
ies
(69
,430
.0)
(94
,424
.0)
(93
,585
.0)
(24
,454
.0)
(97
,892
.5)
(10
5,78
5.0)
(10
5,78
5.0)
Net
cha
nge
in c
ash
and
cash
equ
ival
ents
(31
,218
.0)
7,2
41.0
5
1,57
8.0
11,
986.
5 6
4,31
7.2
36,
692.
9 4
9,56
7.0
Cas
h an
d ca
sh e
quiv
alen
ts a
t the
beg
inni
ng o
f th
e ye
ar 7
8,78
2.0
47,
564.
0 5
4,80
5.0
106
,383
.0
118
,369
.5
182
,686
.7
219
,379
.6
Cas
h an
d ca
sh e
quiv
alen
ts a
t th
e en
d of
the
yea
r 4
7,56
4.0
54,
805.
0 1
06,3
83.0
1
18,3
69.5
1
82,6
86.7
2
19,3
79.6
2
68,9
46.6
So
urce
: C
ompa
ny R
epor
ts a
nd G
loba
l Res
earc
h
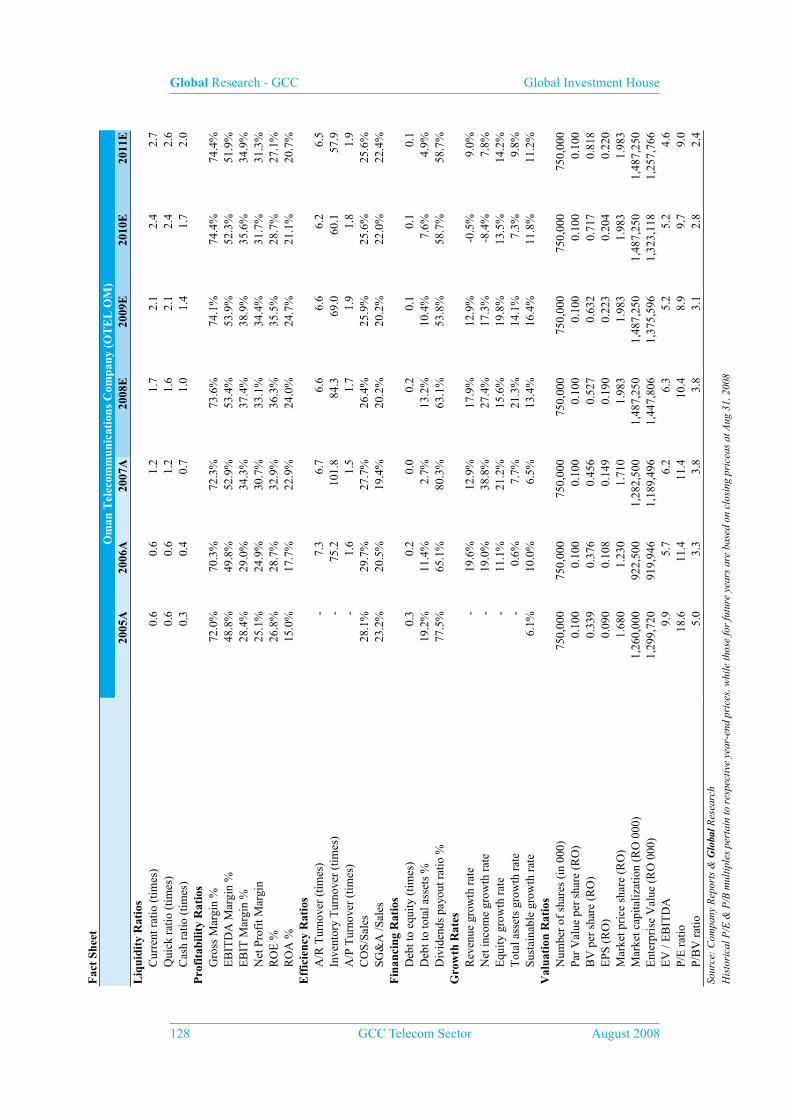
Global Research - GCC Global Investment House
128 GCC Telecom Sector August 2008
Fac
t Sh
eet
Om
an T
elec
omm
unic
atio
ns C
ompa
ny (
OT
EL
OM
)20
05A
2006
A20
07A
2008
E20
09E
2010
E20
11E
Liq
uidi
ty R
atio
sC
urre
nt r
atio
(tim
es)
0.6
0.6
1.2
1.7
2.1
2.4
2.7
Qui
ck r
atio
(tim
es)
0.6
0.6
1.2
1.6
2.1
2.4
2.6
Cas
h ra
tio (
times
)0.
30.
40.
71.
01.
41.
72.
0P
rofi
tabi
lity
Rat
ios
Gro
ss M
argi
n %
72.0
%70
.3%
72.3
%73
.6%
74.1
%74
.4%
74.4
%E
BIT
DA
Mar
gin
%48
.8%
49.8
%52
.9%
53.4
%53
.9%
52.3
%51
.9%
EB
IT M
argi
n %
28.4
%29
.0%
34.3
%37
.4%
38.9
%35
.6%
34.9
%N
et P
rofi
t Mar
gin
25.1
%24
.9%
30.7
%33
.1%
34.4
%31
.7%
31.3
%R
OE
%26
.8%
28.7
%32
.9%
36.3
%35
.5%
28.7
%27
.1%
RO
A %
15.0
%17
.7%
22.9
%24
.0%
24.7
%21
.1%
20.7
%E
ffic
ienc
y R
atio
sA
/R T
urno
ver
(tim
es)
-
7.3
6
.7
6.6
6
.6
6.2
6
.5
Inve
ntor
y T
urno
ver
(tim
es)
-
75.
2 1
01.8
8
4.3
69.
0 6
0.1
57.
9 A
/P T
urno
ver
(tim
es)
-
1.6
1
.5
1.7
1
.9
1.8
1
.9
CO
S/Sa
les
28.1
%29
.7%
27.7
%26
.4%
25.9
%25
.6%
25.6
%SG
&A
/Sal
es23
.2%
20.5
%19
.4%
20.2
%20
.2%
22.0
%22
.4%
Fin
anci
ng R
atio
sD
ebt t
o eq
uity
(tim
es)
0.3
0.2
0.0
0.2
0.1
0.1
0.1
Deb
t to
tota
l ass
ets
%19
.2%
11.4
%2.
7%13
.2%
10.4
%7.
6%4.
9%D
ivid
ends
pay
out r
atio
%77
.5%
65.1
%80
.3%
63.1
%53
.8%
58.7
%58
.7%
Gro
wth
Rat
es
Rev
enue
gro
wth
rat
e-
19.6
%12
.9%
17.9
%12
.9%
-0.5
%9.
0%N
et in
com
e gr
owth
rat
e-
19.0
%38
.8%
27.4
%17
.3%
-8.4
%7.
8%E
quity
gro
wth
rat
e-
11.1
%21
.2%
15.6
%19
.8%
13.5
%14
.2%
Tot
al a
sset
s gr
owth
rat
e-
0.6%
7.7%
21.3
%14
.1%
7.3%
9.8%
Sust
aina
ble
grow
th r
ate
6.1%
10.0
%6.
5%13
.4%
16.4
%11
.8%
11.2
%V
alua
tion
Rat
ios
Num
ber
of s
hare
s (i
n 00
0) 7
50,0
00
750
,000
7
50,0
00
750
,000
7
50,0
00
750
,000
7
50,0
00
Par
Val
ue p
er s
hare
(R
O)
0.1
00
0.1
00
0.1
00
0.1
00
0.1
00
0.1
00
0.1
00
BV
per
sha
re (
RO
) 0
.339
0
.376
0
.456
0
.527
0
.632
0
.717
0
.818
E
PS (
RO
) 0
.090
0
.108
0
.149
0
.190
0
.223
0
.204
0
.220
M
arke
t pri
ce s
hare
(R
O)
1.6
80
1.2
30
1.7
10
1.9
83
1.9
83
1.9
83
1.9
83
Mar
ket c
apita
lizat
ion
(RO
000
) 1
,260
,000
9
22,5
00
1,2
82,5
00
1,4
87,2
50
1,4
87,2
50
1,4
87,2
50
1,4
87,2
50
Ent
erpr
ise
Val
ue (
RO
000
) 1
,299
,720
9
19,9
46
1,1
89,4
96
1,4
47,8
06
1,3
75,5
96
1,3
23,1
18
1,2
57,7
66
EV
/ E
BIT
DA
9.9
5
.7
6.2
6
.3
5.2
5
.2
4.6
P/
E r
atio
18.
6 1
1.4
11.
4 1
0.4
8.9
9
.7
9.0
P/
BV
rat
io 5
.0
3.3
3
.8
3.8
3
.1
2.8
2
.4
Sour
ce:
Com
pany
Rep
orts
& G
loba
l Res
earc
h
His
tori
cal P
/E &
P/B
mul
tiple
s pe
rtai
n to
res
pect
ive
year
-end
pri
ces,
whi
le th
ose
for
futu
re y
ears
are
bas
ed o
n cl
osin
g pr
icea
s at
Aug
31,
200
8
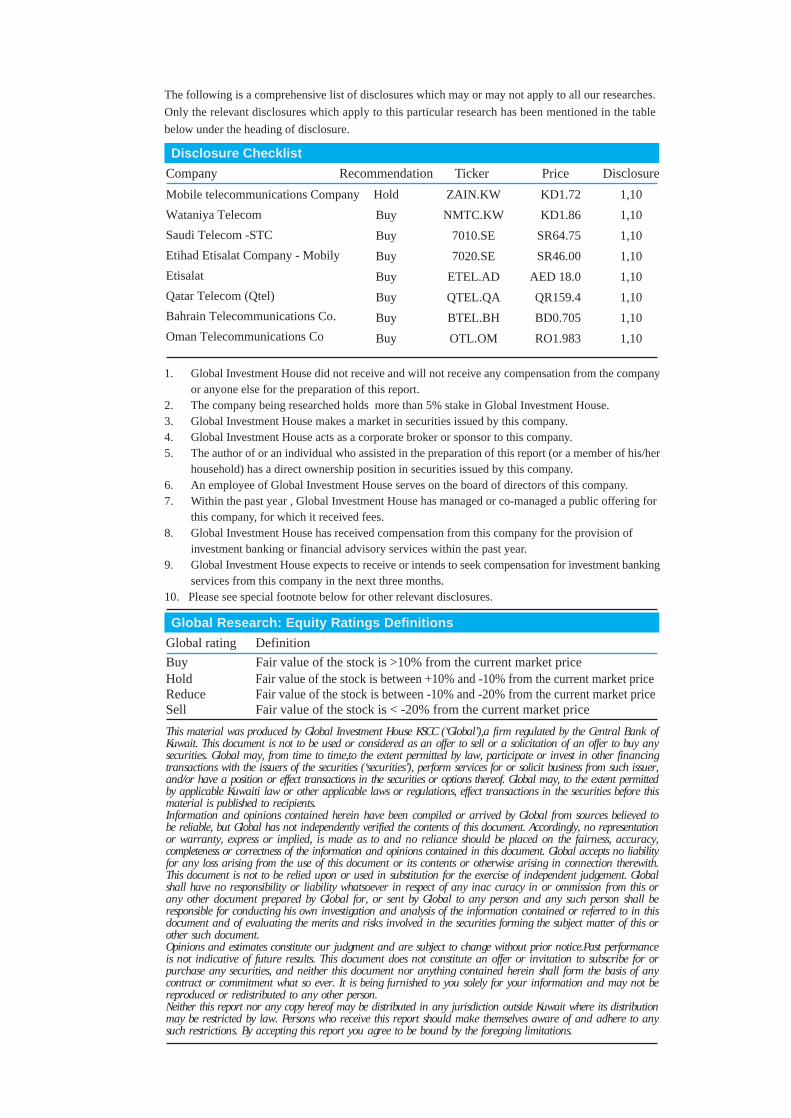
This material was produced by Global Investment House KSCC (‘Global’),a firm regulated by the Central Bank ofKuwait. This document is not to be used or considered as an offer to sell or a solicitation of an offer to buy anysecurities. Global may, from time to time,to the extent permitted by law, participate or invest in other financingtransactions with the issuers of the securities (‘securities’), perform services for or solicit business from such issuer,and/or have a position or effect transactions in the securities or options thereof. Global may, to the extent permittedby applicable Kuwaiti law or other applicable laws or regulations, effect transactions in the securities before thismaterial is published to recipients.Information and opinions contained herein have been compiled or arrived by Global from sources believed tobe reliable, but Global has not independently verified the contents of this document. Accordingly, no representationor warranty, express or implied, is made as to and no reliance should be placed on the fairness, accuracy,completeness or correctness of the information and opinions contained in this document. Global accepts no liabilityfor any loss arising from the use of this document or its contents or otherwise arising in connection therewith.This document is not to be relied upon or used in substitution for the exercise of independent judgement. Globalshall have no responsibility or liability whatsoever in respect of any inac curacy in or ommission from this orany other document prepared by Global for, or sent by Global to any person and any such person shall beresponsible for conducting his own investigation and analysis of the information contained or referred to in thisdocument and of evaluating the merits and risks involved in the securities forming the subject matter of this orother such document.Opinions and estimates constitute our judgment and are subject to change without prior notice.Past performanceis not indicative of future results. This document does not constitute an offer or invitation to subscribe for orpurchase any securities, and neither this document nor anything contained herein shall form the basis of anycontract or commitment what so ever. It is being furnished to you solely for your information and may not bereproduced or redistributed to any other person.Neither this report nor any copy hereof may be distributed in any jurisdiction outside Kuwait where its distributionmay be restricted by law. Persons who receive this report should make themselves aware of and adhere to anysuch restrictions. By accepting this report you agree to be bound by the foregoing limitations.
Company
Mobile telecommunications CompanyWataniya TelecomSaudi Telecom -STCEtihad Etisalat Company - MobilyEtisalatQatar Telecom (Qtel)Bahrain Telecommunications Co.Oman Telecommunications Co
Recommendation
Hold
Buy
Buy
Buy
Buy
Buy
Buy
Buy
Ticker
ZAIN.KW
NMTC.KW
7010.SE
7020.SE
ETEL.AD
QTEL.QA
BTEL.BH
OTL.OM
Price
KD1.72
KD1.86
SR64.75
SR46.00
AED 18.0
QR159.4
BD0.705
RO1.983
Disclosure
1,10
1,10
1,10
1,10
1,10
1,10
1,10
1,10
Disclosure Checklist
1. Global Investment House did not receive and will not receive any compensation from the companyor anyone else for the preparation of this report.
2. The company being researched holds more than 5% stake in Global Investment House.3. Global Investment House makes a market in securities issued by this company.4. Global Investment House acts as a corporate broker or sponsor to this company.5. The author of or an individual who assisted in the preparation of this report (or a member of his/her
household) has a direct ownership position in securities issued by this company.6. An employee of Global Investment House serves on the board of directors of this company.7. Within the past year , Global Investment House has managed or co-managed a public offering for
this company, for which it received fees.8. Global Investment House has received compensation from this company for the provision of
investment banking or financial advisory services within the past year.9. Global Investment House expects to receive or intends to seek compensation for investment banking
services from this company in the next three months.10. Please see special footnote below for other relevant disclosures.
The following is a comprehensive list of disclosures which may or may not apply to all our researches.
Only the relevant disclosures which apply to this particular research has been mentioned in the table
below under the heading of disclosure.
Global rating
Buy
Global Research: Equity Ratings Definitions
HoldReduceSell
Definition
Fair value of the stock is >10% from the current market priceFair value of the stock is between +10% and -10% from the current market priceFair value of the stock is between -10% and -20% from the current market priceFair value of the stock is < -20% from the current market price