Embed Size (px)
Citation preview

GCA ONLINE – SUPPORTING THE ENGINE CALIBRATION PROCESS BY FAST GAS EXCHANGE AND COMBUSTION ANALYSIS DIRECTLY AT THE TEST BED
Robert Fairbrother1, Rudolf Gande2, Johann Krammer3, Thomas Leifert4, Georg Salentinig5
AVL List GmbH1
AVL List GmbH2
[email protected], [email protected], [email protected], [email protected]
ABSTRACT
Accurate combustion analysis at the test bed is an important tool for the devel-opment engineer. It can help engine design, efficiency improvements or emissions reduction by providing instantaneous feedback on the combustion process. It can also provide detailed combustion information to help speed-up the engine calibration process. By implementing shared memory communication, multiple core capability and streamlined calculation techniques, the calculation time of AVL gas exchange and combustion analysis software GCA (Gas Exchange and Combustion Analysis) has been dramatically reduced without significantly decreasing calculation results accuracy. This allows AVL IndiCom (in combination with AVL GCA) to perform accu-rate gas exchange and combustion analysis calculations directly and promptly at the test bed. This opens the door to a number of promising new applications by erasing the bridge between measurement data acquisition and post-processing analysis.
Increase of measurement data consistency and the reduction of development time are two of the most important benefits of being able to perform “on-line” plausi-bility checks of measurement data. The strong links connecting AVL GCA calculation results to the measurement data and the redundancy between calculation and measurement for the assessment of some highly relevant engine parameters (e.g. IMEP, air mass flow) can greatly extend the “on-line” plausibility checks functions already available in AVL IndiCom or AVL test bed automation software PUMA. Some engine application examples, where valve train flexibility is used to enhance fuel economy or reduce exhaust emissions of internal combustion engines, show that the immediate availability at the test bed of gas exchange related parameters (e.g. inter-nal EGR rate, scavenged mass, mass flows through the valves) supports an intuitive optimization of the valve train parameters.
Blucher Engineering ProceedingsAgosto de 2014, Número 2, Volume 1

1. INTRODUCTION
Combustion analysis is used by engine developers to obtain additional infor-
mation on the combustion process that cannot be measured directly [1, 2, 3]. There is also sometimes the issue that feedback from available sensors is too slow or can-not be located in the required position. There is usually a compromise between a quick feedback of data at the test bed or a more complete but slower analysis later in the office after the measurements have been completed. The target of this work has been to develop a complete gas exchange and combustion analysis package that can be used directly at the test bed or on the vehicle without any compromise in ac-curacy.
The calibration of a GDI engine at low speed and high torque (i.e. low end torque) provides a high potential to increase BMEP. This is managed by scavenging when shifting the valves to a large overlap period. It ensures minimal residual gas for the following cycle and therefore a maximum amount of combustible gas in the com-bustion chamber at stoichiometric operation. Meanwhile the air fuel ratio of the ex-haust gas is controlled by a Lambda-probe installed in exhaust manifold. This pa-rameter shows good correlation in stationary operation but in transient mode or when scavenging is applied there is a mismatch between air fuel ratio in the combustion chamber and the exhaust. Due to scavenging the Lambda values measured in the exhaust are higher than the actual values in the cylinder. As rich operation always contains unburned hydrocarbons and carbon monoxide, there is a high risk of over-heating/damaging the catalyst in combination with the oxygen scavenged.
GCA-Online can quickly calculate and provide the actual air fuel ratio on a cycle by cycle basis to ensure safe transient operation. The accuracy can be assessed from the energy balance of the combustion analysis and any air flow differences be-tween measured and simulated values for the gas exchange analysis. When using only the exhaust lambda sensor, without knowing the scavenging rate, it is possible that rich operation will lead to excessive exothermal reactions in the catalyst due to the oxygen in the scavenged air.
2. THEORY
Gas exchange and Combustion Analysis (GCA) technology uses a combination of measured and simulated values to determine important additional values for en-gine development. This is a two part process that combines measured crank angle resolved pressure traces with a cycle simulation model.

Figure 1: Instrumented cylinder head for analysis
The first part, combustion analysis, uses the measured cylinder pressure to de-termine the rate of heat release of the combustion process during the high pressure phase. The second part, gas exchange analysis, uses measured intake and exhaust pressure traces (Figure 1) and the calculated rate of heat release curve (from the combustion analysis) to calculate the gas dynamics of the system. The gas ex-change and combustion analysis process is summarized in Figure 2.
Figure 2: Gas Exchange and Combustion Analysis Process
The required inputs are the engine geometry (e.g. bore, stroke), valve lift pro-files and valve flow coefficients. A database of thermodynamic properties provides the necessary data for modeling the air, fuel vapour and combustion products (sub-divided into fuel burned and air burned fractions) [4]. This process can be used to accurately calculate a number of important values including the actual fuel and air mass for each cycle, based on the measured pressure traces.

2.1 Combustion Analysis
Combustion analysis is used to calculate the rate of heat release of the com-bustion process using a measured cylinder pressure trace. The solution is based on an energy balance during the high pressure phase of the cycle. This takes into ac-count wall heat transfer, blowby, volume work and evaporation energy of the fuel.
Figure 3: Combustion Analysis Control Volume
The calculation of the thermodynamic state of the cylinder is based on the first law of thermodynamics:
( )
dt
dmfq
d
dmh
d
dQ
d
dQ
d
dVp
d
umd
evev
BBBB
wFc
c
⋅⋅−⋅−
−+⋅−=⋅∑
α
αααα
(1)
[internal energy] = - [piston work] + [fuel heat input]
- [wall heat losses] - [blowby] – [evaporation]

The calculation covers the high pressure phase of the engine cycle. That is, for a four stroke engine, between intake valve closing (IVC) and exhaust valve opening (EVO). A typical rate of heat release result and its components is shown in Figure 4.
Figure 4: Rate of heat release and its components
The wall heat transfer can be modeled using a number of different approaches. These include the models proposed by Woschni [3], Hohenberg [6] or Bargende [7]. The quality of the combustion analysis can be assessed by checking the energy bal-ance between the fuel energy input (fuel mass multiplied by lower heating value) and the calculated released energy. Fine tuning of final result by calibrating the wall heat losses or adjusting the measured signal based on a simulated measured pressure curve is also possible.
The output of the combustion analysis is a normalized rate of heat release curve. The curve is normalized because the actual air and fuel amounts are calculat-ed by the gas exchange model in the second part of the process. That is, the com-bustion analysis is used to determine the characteristics of the combustion profile but the actual magnitude of heat release is only determined when combined with the cal-culated air and fuel masses from the gas exchange modeling.
2.1 Gas Exchange Analysis

The gas exchange analysis adds the modeling of the gas dynamics of the in-take and exhaust port to the modeled rate of heat release from the combustion anal-ysis. Gas dynamics in the intake and exhaust ports are modeled by dividing the ports into a number of one dimensional cells. The method used for solving the mass, mo-mentum and energy equations of these cells for gas dynamics is the ENO finite vol-ume method [8]. The intake and exhaust boundary conditions are based on the measured traces at these locations. This close coupling with measured data gives an accurate prediction of the flows in and out of the cylinder when combined with the correct valve lift profiles and associated flow coefficients.
The variation of the mass in the cylinder can be calculated from the sum of the in-flowing and out-flowing masses:
ααααα d
dm
d
dm
d
dm
d
dm
d
dm evBBeic +−−=∑ ∑ (2)
[mass in cylinder] = [intake flow] - [exhaust flow] - [blowby] + [injected fuel]
This allows the analysis to predict the exact conditions at any point in the cycle. For example, residual gas at the start of the high pressure phase or unburned air fuel ratio at the start of combustion.
Figure 5: Gas Exchange Analysis
2.3 Transient Analysis
A transient gas exchange and combustion analysis is more complicated than a standard steady state analysis because of the lack of required measured data. The

analysis needs the fuel and air mass flow for each cycle. In a steady state analysis this is easy enough to measure and average over a number of cycles. However, a method to use the calculated mass flows based on the measured pressure curves has been developed and applied in this case [9].
2.4 METHODOLOGY
The target for online operation of gas exchange and combustion analysis is to de-
liver simulation results for a reasonably complex model with the highest frequency possible. In order to meet these requirements the computer programs involved in the tool chain of a GCA simulation were adapted and optimized in several ways:
• The solver is the custom AVL/BOOST solver executable. The potential of
speed up by tailoring all I/O to the simple and clearly arranged models of a GCA simulation proved to be enormous. The only change to the physical sim-ulation itself was to disregard the calculation of result groups irrelevant to both the simulation and the end results (e.g. acoustic results which require signifi-cant processing time due to the use of FFT routines)
• To benefit from multiple CPUs which are available in almost all modern hard-ware, a multi process approach on the solver level was introduced. That is, maintenance of a job queue and management of the result data is done by AVL IndiCom, while the simulations themselves are performed by several AVL BOOST solver processes running in parallel.
• To avoid the bottle neck resulting from the accumulation of HDD I/O operations in the multi process approach, most of the communication between the pro-cesses of the tool chain was shifted from traditional file I/O to a modern shared memory approach. By using the shared memory method, full scalabil-ity of the algorithm was observed on up to a 12 core work station.
With the implementation of these optimizations the time needed for a single calculation on a single core was reduced by a factor of approximately 5 (a simple model now needs less than a second on decent hardware). By further harnessing the multi process approach on a mid to high end workstation (e.g. 12 core Xeon) a throughput of approximately 10 simulation results per second can be achieved. 2.5 Computing Hardware Recommendations
The simulation performance can be measured by two parameters: The latency between measurement and availability of the corresponding simulation result and the throughput with the meaning of a frequency of the availability of new simulation re-sults. Tests showed that the latency, which corresponds to the calculation time of a single process simulation, has hardly any dependence on the kind of used CPU as long as it is not too antiquated (e.g. a high end Xeon X5670 proved to be only ~5% faster than a rather low cost Core 2 Duo E8500). The throughput, on the contrary, scales linearly with the number of simulation processes which can run unhindered on

a given hardware which again corresponds to the total number of calculation cores. Therefore the same hardware requirements as for AVL IndiCom, with an emphasis on multicore systems, apply: CPU: Intel Core-i or Intel Xeon with 4 or more cores at 3GHz RAM: 4 GB OS: Windows 7 (32/64bit) or Windows XP Interfaces: GigaBit Ethernet, CD-ROM, PCI-E and RS232 or ExpressCard
(at Notebooks)
Table 1: required PC specification

3 APPLICATION
In order to reduce the development time of TGDI (turbo charged gasoline direct injection) engines a high degree of test bed automation is required. To minimize the engine parameter adjustment time on the engine dynamometer or to have the possibility of running the development program unmanned, e.g. overnight, RTC’s (Real Time Controller) are used to set engine parameters like SA (spark advance) or injection. Therefore a Combustion RTC is used to adjust ignition timing for the desired MFB50% value (50% mass fraction burned), as well as a Knock Controller or a Peak Pressure Controller to retard spark advance if necessary. Along with a Lambda Controller and Engine Component Surveillance Controller to adjust injection time to the desired air/fuel ratio and enrichment of the air fuel mixture to stay within the exhaust gas temperature limits, an unmanned engine operation is possible in almost all areas of the engine speed/load map. The problem in scavenging operation is that this will cause fuel enrichment that will damage the catalyst. So instead of increasing the fuelling needs to be decreased to stay within temperature limits.
When a TGDI engine is equipped with cam phasing on one or both cam shafts, there is the potential to run the engine in scavenging operation mode. Scavenging operation gives the opportunity to increase the low end torque of the engine compared to non-scavenging operation or an engine without cam phasing. This effect is driven by an advanced IVC (intake valve closing), increased air mass flow which shifts the operation point of the compressor away from compressor surge line to areas with higher compressor efficiency and reduced residual gas content in the combustion chamber.
Figure 6: BMEP & Oxygen (O2) content of exhaust gas

Scavenging operation is characterized by valve overlap at gas exchange
TDC (top dead center) and a higher intake manifold pressure compared to the exhaust pressure (boosted operation at low engine speed, see Figure 6. This leads to a part of the fresh charge air being blown through the combustion chamber directly into the exhaust manifold without taking part in the combustion process whilst the fuel is injected after exhaust valve closing and therefore remains in the combustion chamber. As a result the oxygen sensor in the exhaust system will detect the scavenged air and shows “lean” exhaust air/fuel ratio depending on the amount of air being scavenged, whereas the air/fuel ratio of the combustion chamber can be rich or stoichiometric, see figure 7.
-60-50-40-30-20-100Intake Cam Pos. Rel. (°)
Exh
Cam
Pos
. Rel
. (°)
(0
,26)
0
10
20
30
40
50
60
1,05
1,1
1,15
1,2
1,25
1,3
Lambda SensorLAVS_41 (-)
1,0
Figure 7: Exhaust gas Lambda = f (VVT) given by an oxygen sensor
This behavior makes it impossible to control the air/fuel ratio of the combustion
with the Lambda Controller using an exhaust gas oxygen sensor. Emission components (CO & O2) measured by the CEB (combustion emission bench) can be used to evaluate the air/fuel ratio of the combustion chamber, but these signals are too slow to drive an RTC for injection timing. Scavenging operating of the engine with stoichiometric exhaust gas air/fuel ratio leads to very rich combustion chamber air/fuel ratio depending on the amount of scavenged air and might cause severe damage to the catalytic converter due to the thermal reaction of unburned fuel and scavenged air.
Figure 8 shows the BMEP potential of an engine operated at low speed with WOT (wide open throttle) and closed turbine waste gate depending on intake and exhaust cam position (valve overlap). For safe, unmanned automatic engine run the RTC for injection timing requires the air/fuel ratio of the combustion chamber.

GCA-Online (Gas exchange and Combustion Analysis) can be used as a “virtu-al” combustion chamber lambda and scavenging sensor. This procedure is applica-ble to the test bed as described in the following section.
-60-50-40-30-20-100Intake Cam Pos. Rel. (°)
Exh
Cam
Pos
. Rel
. (°)
(0
,26)
0
10
20
30
40
50
60
1600
17001800
19002000
2100
2200
Break Mean Effective PressureBMEP (kPa)
Figure 8: BMEP potential = f (VVT)
4 MEASUREMENT
The test engine is a state of the art 4 cylinder GDI gasoline engine of a series passenger car, with the main technical data described in Table 2.
Engine type: 4 cylinder gasoline, in line Configuration: GDI, VVT, 16 valves, 1 stage Turbo Charger Power: Pe = 180 kW Torque: Trq = 380 Nm Displacement: Vtotal = 2.0 l Compression ratio: � = 9.7
Table 2: General engine data An AVL Spark plug sensor (ZI31) with integrated pressure transducer element
is mounted in the cylinder head, whilst intake and exhaust manifold are equipped with absolute measuring pressure transducers (LP11D), the exhaust transducer is installed in a cooling adapter, see figure 9.
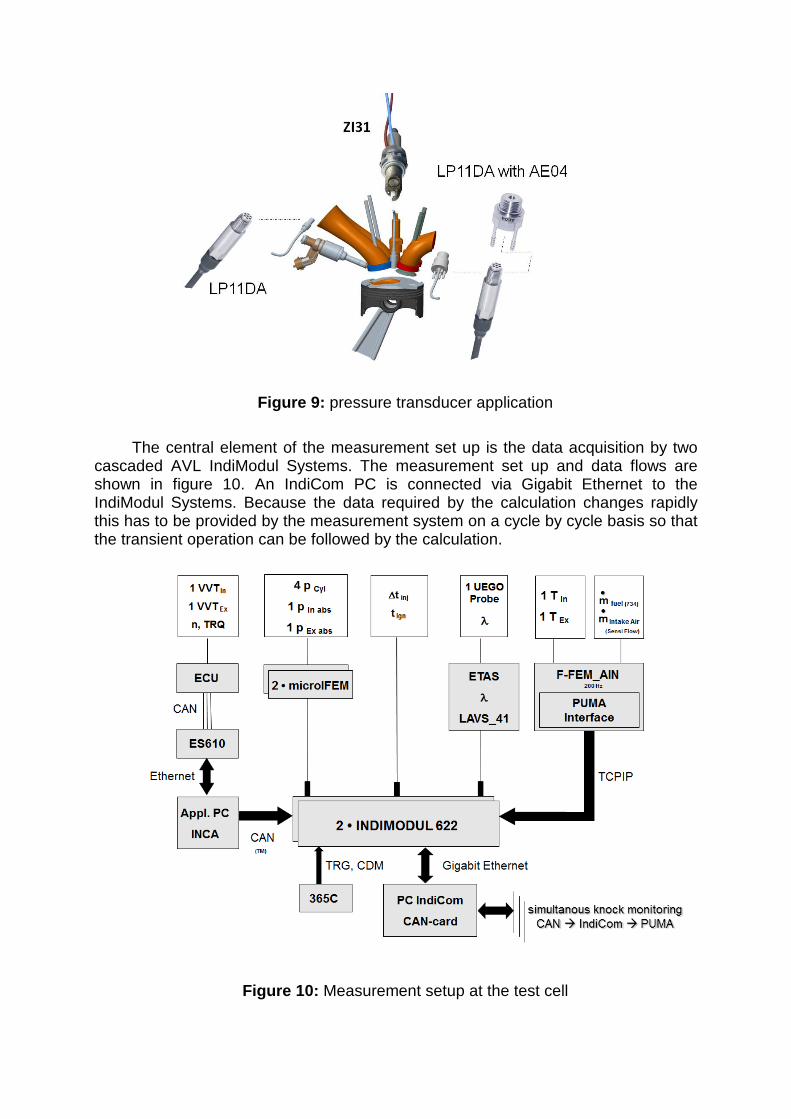
Figure 9: pressure transducer application
The central element of the measurement set up is the data acquisition by two
cascaded AVL IndiModul Systems. The measurement set up and data flows are shown in figure 10. An IndiCom PC is connected via Gigabit Ethernet to the IndiModul Systems. Because the data required by the calculation changes rapidly this has to be provided by the measurement system on a cycle by cycle basis so that the transient operation can be followed by the calculation.
Figure 10: Measurement setup at the test cell

The intake, cylinder and exhaust pressure traces are fed via microIFEM into three high speed channels. The valve lift curve (cam profile) is fixed as the phasing itself can be shifted at both intake and exhaust valves. The signal of these phase shifts are provided by INCA via CAN-connection. The change in position of this square wave signal provides the crank degree shift of the cam shaft towards their reference position. Two current clamps are installed for detection of ignition and in-jection duration. The crank shaft signals Trigger and CDM are directly fed to the indi-cating device as low voltage differential signal (LVDS) with the crank degree infor-mation.
There is a number of signals needed for the GCA calculation. This includes VVT-parameter, speed and torque which are handled by the engine control unit (ECU). Pedal position and throttle position are additionally acquired. The transfer of these parameters is managed by CAN-Bus. Lambda via ETAS and acquisition of intake and exhaust manifold temperature via a F-FEM and PUMA interface as well as mass flows of fuel and air. The air mass flow trapped is calculated by the gas ex-change analysis.
5 CALCULATIONS
From a large range of test cases and conditions a short period of transient dy-namic operation has been selected to highlight the important advantages of perform-ing gas exchange and combustion analysis. This consists of a period of 16 seconds, which means 200 cycles at an engine speed of 1500 rpm, where the IMEP increases from about 12.5 bar up to 18 bar. Engine speed stays almost constant, see figure 11.
Figure 11: Load change

The load step is initiated by shifting the intake valve phase to an earlier position compared to the reference position by -60 deg CA, see intake valve shift in figure 12. This shift leads to increased valve overlap and therefore to scavenging. The ex-haust cam shaft is not shifted.
Figure 12: Intake valve shift from reference position by -60 deg CA
All cycles have been calculated and analyzed using the gas exchange and combustion analysis described in the previous sections. The results of two selected cycles - one at the beginning of the load step and the other one at the end of the load step - are shown in figures 13 and 14. They have been selected to explain the results.
Figure 13: Pressure traces, valve lift curves, mass flows before the load step

Figure 14: Pressure traces, valve lift curves, mass flows after the load step
For the mass flows the positive flow direction is the expected direction of flow through the valves. Positive intake flow is from the intake port into the cylinder and positive exhaust flow is from the cylinder into the exhaust port. That means mass flow below zero is backflow either from exhaust to the cylinder or from cylinder to intake or even both at the same time.
Figure 13 shows the intake, cylinder and exhaust pressure traces (top) before the load step during non-scavenging period. Also included are the actual valve lift profiles (mid) and the calculated mass flows (down) through the intake and exhaust valves. The scales have been selected for direct comparison with the scavenging period. The results show minimum valve overlap.
Figure 14 shows the same set of results after the load step for an example scavenging period. There is significantly more valve overlap and the pressure pulsa-tions in the exhaust are bigger. The intake pressure is now higher. This results in scavenging flow from the intake through the cylinder and out the exhaust. This is al-so shown by the positive mass flows through the intake and exhaust around gas ex-change top dead center (~360 deg CA) and during the valve overlap period.
Figure 15 shows a comparison of the measured lambda value in the exhaust and the calculated (by the analysis) value in the cylinder. Without scavenging the

measured and the calculated lambda values match. However, during the scavenging period the measured lambda is higher reflecting the fact that the scavenged air is included in these values. The calculated lambda values for the trapped state in the cylinder indicates that there is less trapped air due to the scavenging. Therefore the analysis has provided additional important information about the state of the fuel air mixture trapped in the cylinder. During the scavenging period this is a more accurate reflection of the actual situation. These calculations can be performed by means of GCA-Online directly at the test bed.
Figure 15: air fuel ratio and scavenging during load step
There are two criteria to control the quality of GCA´s data evaluation. There are
two mass flows fed to the cylinder, one of them is measured at the test cell and the other calculated by GCA.
• Fuel: In most cases there is a fuel mass flow meter installed that is measuring
the overall mass flow in kilogram per hour. This device captures the value of the total engine´s fuel consumption. It needs some time for acquisition and therefore this parameter contains a certain number of cycles. Secondly GCA calculates the rate of heat release (RoHR) when performing combustion anal-ysis as already mentioned in chapter 2.1. This is carried out for one single cy-cle. The released energy [J/deg] divided by the lower heating value [kJ/kg] leads to the consumed fuel [kg/deg] per cycle when added up. This leads to the first criterion “energy balance” when comparing both values.
• Air: The mass flow of air can be either captured by an AVL FlowSonixTM device or a hot film anemometer or any other kind of mass flow meter. Also these de-vices provide values [kg/h] that cover the total engine´s air consumption over a number of cycles. GCA calculates the air trapped by means of the meas-

ured pressure traces knowing the valve lift curves, the flow coefficients and the temperature in the manifold. The second criterion now is the “air flow dif-ference”.
These two criteria match when the engine is operated in steady state mode and
they show how good GCA´s calculation reflects the engine operation. In most cases there is only a small difference between both in the range of one percent. In transient operation however one faces the potential for a larger difference in energy balance as well as in air flow difference. This is due to the fact that the overall values meas-ured are delayed compared to the pressure curves used as input for the GCA calcu-lation. The measurement setup (figure 10) shows the direct connection of pressure traces as they are fed to the indicating device without any delay but looking at the mass flow measurement it is obvious that some time is needed for data transfer as the acquisition is done by F-FEM and the PUMA connection is managed by TCPIP. This takes time in the range of some seconds.
This fact underlines once more the importance of calculating the combustion
chamber´s lambda by means of GCA (figure 15) as there is no alternative to GCA for exploring this value in transient operation and online at the test cell. 6 CONCLUSIONS
Gas exchange and combustion analysis is already extensively used to obtain
important useful additional information about the combustion and gas exchange pro-cess. This is achieved by combining engine cycle simulation and measurement. This process has now been enhanced by increasing the feedback to the development engineer by harnessing shared memory technology and streamlined calculation. This can be used to overcome the limitations of slow feedback from available sensors as well as providing important additional information from required locations where ap-propriate sensors cannot be located. The example presented shows that the analysis can provide a more actual reflection of the actual state in the cylinder. For example, the relative air fuel ratio in the cylinder during a period of scavenging where the ex-haust sensor includes the scavenged air in the reported value. The end result is that the development engineer at the test bed (or in the vehicle) now has direct access immediately to accurate gas exchange and combustion analysis data that cannot be measured.
7 References
[1] Leifert, Th. , Moreno-Nevado, F. , Fairbrother, R. , Erweiterte Thermo- dynamische Analyse mittels AVL-GCA zur effektiven Unterstützung der Entwicklung und Kalibrierung von Verbrennungsmotoren, Tagung Motorprozesssimulation und Aufladung II, HdT, IAV & expert verlag, 2007.
[2] Leifert, Th. , Moreno-Nevado, F. , Fairbrother, R. ,Genaue Bestimmung wichtiger Ladungswechselparameter direkt am Prüfstand auf Basis vorhandener Messwerte, Ladungswechsel im Verbrennungsmotor, MTZ-Konferenz, 2007.

[3] Leifert, Th. , Moreno-Nevado, F. , Fairbrother, R. , Prevedel, K. Optimizing the dynamic operation of a gasoline engine with high flexibility by means of AVL-GCA, Engine Process Simulation and Turbocharging, Berlin, 2011
[4] De Jaegher, Das Thermodynamische Gleichgewicht von Verbrennungsgasen unter Berücksichtigung der Russbilding, 1976
[5] Woschni, G., A Universally Applicable Equation for the Instantaneous Heat Transfer Coefficient in Internal Combustion Engines, SAE 6700931
[6] Hohenberg, G., Experimentelle Erfassung der Wandwärme von Kolbenmotoren, Habilitationsschrift TU-Graz, 1980
[7] Bargende, M., Ein Gleichungsansatz zur Berechnung der instationären Wandwaermeverluste im Hochdruckteil von Ottomotoren, Ph.D. thesis, Technical University Darmstadt, 1991
[8] Harten, A. et al., High Order Accurate Essentially Non-Oscillatory Schemes III, Journal of Computational Physics, Volume 71, Number 2, August 1987
[9] Leifert, Th., Moreno-Nevado, F. , Fairbrother, R. , Durch Messung unterstützte thermodynamische Analyse von Zylinder internen Vorgängen unter transienten Bedingungen, 8th Internationales Symposium für Verbrennungsdiagnostik, Baden-Baden, 2008.
8 Nomenclature
Q heat transfer [J]
V volume [m3]
F fraction of evaporation heat from the cylinder charge [J/kg]
h enthalpy [J/kg]
m mass [kg]
n engine speed [rpm]
u specific internal energy [J/kg]
q evaporation heat [J/kg]
α crank angle [deg]
λ relative air fuel ratio, lambda [-]
9 Subscripts BB blowby
c cylinder
e exhaust
ev evaporation
i intake

10 Acronyms AVL "Anstalt für Verbrennungskraftmaschinen", Prof. Dr. Hans List (or Institute for Internal Combustion Engines).
https://www.avl.com/home
ADC Analog-to-Digital Converter
BMEP Brake Mean Effective Pressure
CAN Controller Area Network
CEB Combustion Emission Bench
CPU Central Processing Unit
ECU Engine Control Unit
EGR Exhaust Gas Recirculation
ENO Essentially Non-Oscillatory
EVO Exhaust Valve Opening
FFT Fast Fourier Transform
GCA Gas Exchange and Combustion Analysis
https://www.avl.com/gca-gas-exchange-and-combustion-analysis-software
GDI Gasoline Direct Injection
HDD Hard Disk Drive
IMEP Indicated Mean Effective Pressure
IndiCom IndiCom is a software in the field of combustion analysis that combines the control of data acquisition with professional data evaluation for clear graphical presentation.
https://www.avl.com/indicom-indicating-software
IVO Intake Valve Opening
MFB Mass Fraction Burned
PUMA Test System Automation Software
https://www.avl.com/puma-open
RoHR Rate of Heat Release
RTC Real Time Controller
TDC Top Dead Center
TGDI Turbocharged Gasoline Direct Injection
VVT Variable Valve Train
WOT Wide Open Throttle

11 The Authors Dr. Robert Fairbrother, AVL List GmbH, Graz, Austria
DI (FH) Rudolf Gande, AVL List GmbH, Graz, Austria
Ing. Johann Krammer, AVL List GmbH, Graz, Austria
Dr.-Ing. Thomas Leifert, AVL List GmbH, Graz, Austria
Georg Salentinig, AVL List GmbH, Graz, Austria