Embed Size (px)
Citation preview
GC-MS INVESTIGATION OF METABOLIC ACTIVITY IN 4-HYDROXY-2-
OXOGLUTARATE ALDOLASE DEFICIENCY OF PRIMARY HYPEROXALURIA TYPE 3
BY
JORDAN RICHARD EVERETT
A Thesis Submitted to the Graduate Faculty of
WAKE FOREST UNIVERSITY GRADUATE SCHOOL OF ARTS AND SCIENCES
In Partial Fulfillment of the Requirements
for the Degree of
MASTER OF SCIENCE
Biomedical Science
August 2016
Winston-Salem, North Carolina
Approved By:
W. Todd Lowther, PhD, Advisor
John Parks, PhD, Chair
Thomas Hollis, PhD
ii
Contents
List of Figures and Tables……………………………………………………………….……… iv
List of Abbreviations……………………………………………………………………….…… v
Abstract…………………………………………………………………………………….……. vii
Section 1 Introduction………………………………………………………………………… 1
1.1 Hydroxyproline Metabolism in Primary Hyperoxaluria Type 3 (PH3)…..……………. 3
1.2 Statement of Purpose…………………………………………………………………... 6
Section 2 Method Development for Analysis of Relevant Metabolites in PH3………………. 7
2.1 MCF Derivatization…………………………………………………………………… 10
2.1.1 GC-MS Analysis of MCF Derivatized Compounds………...……………………. 12
2.1.2 MCF Derivatized Spectra……………………………….........…………………... 12
2.2 MOX/MCF Derivatization…………………………………………………………….. 21
2.2.1 GC-MS Analysis of MOX/MCF Derivatized Compounds…………………..…... 21
2.2.2 MOX/MCF Derivatized Spectra………………………………………………...... 22
2.3 TMS Derivatization………………………………………………………………….... 24
2.3.1 GC-MS Analysis TMS Derivatized Compounds…………………………..…...... 24
2.3.2 TMS Derivatization Spectra/Results……………………………………………… 25
2.4 Initial Liver Lysate Analysis Method…………………………………………………. 40
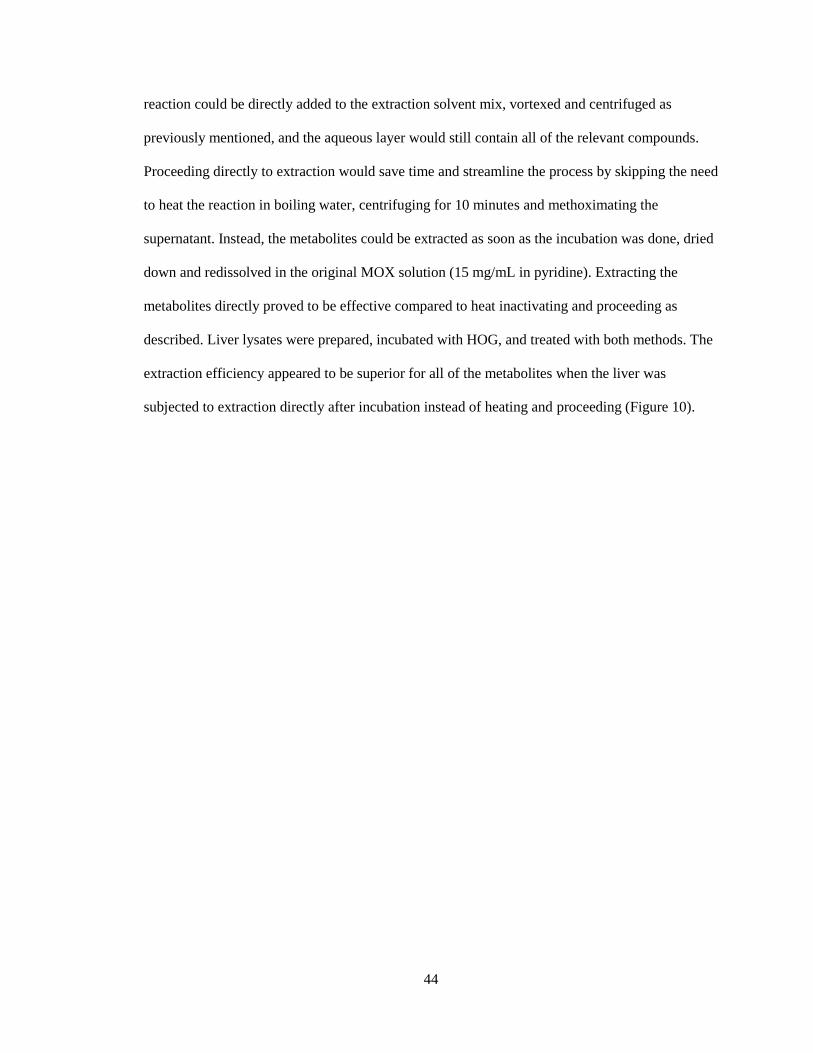
2.4.1 Optimization of Metabolite Extraction…………………………………………… 41
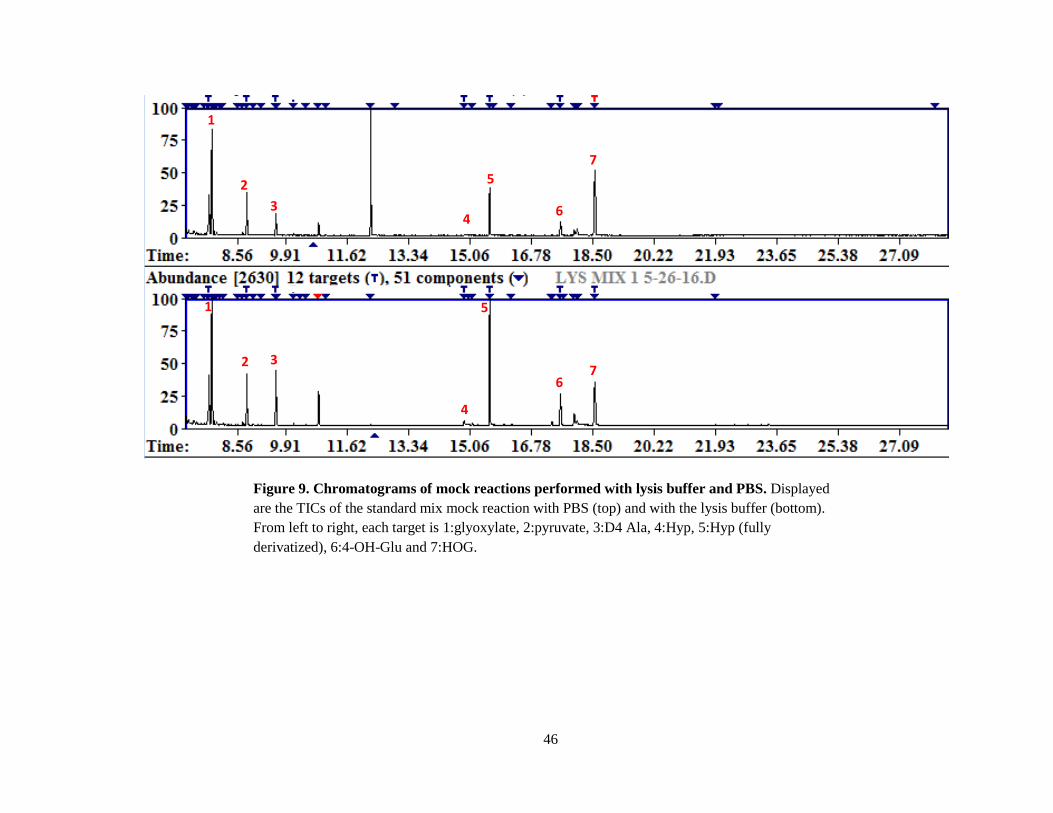
2.4.2 Optimization of Liver Lysate Preparation…………………..…………………..... 43
2.5 Urinalysis of PH3 Mouse Model Urine………………………………………………...48
2.5.1 Optimization of Urinalysis Method………………………………………………..48
Section 3 Analysis of PH3 Metabolites in Liver and Urine…………………………………... 51
3.1 Liver Lysate Analysis Final Method………………………………………………….. 51
3.2 Liver Lysate Results………………………………………………………………….. 52
3.3 Urinalysis Final Method……………………………………………………………… 60
iii
3.4 Urinalysis Results……………………………………………………………………... 60
Section 4 Discussion………………………………………………………………………….. 62
Conclusions……………………………………………………………………………………… 65
References……………………………………………………………….………………………. 66
Curriculum Vitae…………………………………………………………………………...…… 70

iv
List of Figures and Tables
Figure 1 Metabolism of 4-hydroxyproline and glyoxylate within a liver cell………………... 2
Figure 2 Mitochondrial Hyp catabolism and consequences of HOGA deficiency………….... 5
Figure 3 Reaction diagram of silylation and methylation derivatization techniques…………. 9
Table I MCF derivatized metabolites……………………………………………………….. 14
Figure 4 Representative chromatograms for MCF derivatized compounds………………. 15-20
Figure 5 Methoxyamine reaction with keto and aldehyde functional groups………………… 21
Figure 6 Representative chromatograms for MOX/MCF derivatized pyruvate……………… 23
Table II TMS derivatized metabolites……………………………………………………….. 26
Figure 7 Representative chromatograms for TMS derivatized compounds………………. 27-39
Figure 8 Representative chromatogram of a liver lysate prepared using PBS with standards...45
Figure 9 Chromatograms of mock reactions performed with lysis buffer and PBS…………. 46
Figure 10 Comparison between heat inactivation and direct extraction……………………….. 47
Figure 11 WT urine with and without urease treatment…………...…………………………... 50
Table III Metabolites detected in liver lysates………………………………………………... 55
Figure 12 WT vs HOGA KO liver lysates incubated with HOG……………………………… 56
Figure 13 WT vs HOGA KO liver lysates incubated with 4-OH-Glu………………….……… 57
Figure 14 Unknown peak at 10.28 minutes, identified as dihydrouracil ……………………… 58
Figure 15 Unknown peak at 12.29 minutes, identified as phosphate…..……………………… 59
Figure 16 HOGA KO urine post 1% Hyp diet…………………………………………………. 61
v
List of Abbreviations
AGT alanine glyoxylate aminotransferase
AMDIS Automated Mass Spectral Deconvolution and Identification System
AMU atomic mass unit
BSA bovine serum albumin
BSTFA N,O-Bis(trimethylsilyl)trifluoroacetamide
DHG 2,4-dihydroxyglutarate
EI electron ionization
GC gas chromatography
GC-MS gas chromatography mass spectrometry
GR glyoxylate reductase
HEPES 4-(2-hydroxyethyl) piperazine-1-ethanisulfonic acid
HOG 4-hydroxy-2-oxoglutarate
HOGA 4-hydorxy-2-oxoglutarate aldolase
HPLC high performance liquid chromatography
Hyp 4-hydroxyproline
ICMS ion chromatography mass spectrometry
KO knockout
LDH lactate dehydrogenase
LOD limit of detection
LOQ limit of quantification
MCF methyl chloroformate
MeOH methanol
MOX methoxyamine
MSD mass selective detector
m/z mass-to-charge ratio

vi
NIST National Institute of Standards and Technology
PBS phosphate buffered saline
PH primary hyperoxaluria
PH1 primary hyperoxaluria type 1
PH2 primary hyperoxaluria type 2
PH3 primary hyperoxaluria type 3
PLP pyroxidal phosphate
RT retention time
TIC total ion current
TMS trimethylsilyl
WT wild type
4-OH-Glu 4-hydroxyglutamate
vii
Abstract
Primary hyperoxaluria (PH) is a group of three variants of an inborn error of glyoxylate
metabolism. The hallmark of PH is the overproduction of oxalate which is formed from oxidation
of glyoxylate by lactate dehydrogenase (LDH) and which readily crystallizes as calcium oxalate
in renal tissue. PH3 is the most recently characterized of the variants of PH, and it is also the least
understood. PH3 is caused by a malfunction in the enzyme 4-hydroxy-2-oxoglutarate aldolase
(HOGA), which catalyzes the cleavage of 4-hydroxy-2-oxoglutarate (HOG) to form glyoxylate
and pyruvate. Since the enzymatic malfunction occurs before glyoxylate formation, and previous
studies have shown HOG to be elevated in the urine of PH3 patients, it is unclear how the
phenotype of PH3 manifests. If HOG can be directly excreted before glyoxylate is ever formed, it
is difficult to imagine how a disease state occurs. It has been proposed that HOG, upon exceeding
normal cellular levels, must flux out of the mitochondria where it is normally metabolized and be
acted upon by another enzyme. It is unclear whether HOG is either metabolized by another
aldolase, some other type of enzyme or metabolized after it has undergone some other chemical
modification, as indicated by the presence of the reduced product of HOG, 2,4-
dihydroxyglutarate (DHG) in the urine of PH3 patients. The goal of this thesis was to develop a
method to analyze PH3 metabolic consequences in liver tissue lysates and urine from wild type
(WT) and HOGA knockout (KO) mice in order to indicate a plausible direction for future
research into the consequences of this disease. After extensive optimization, a successful GC-MS
analytical method was established, and preliminary qualitative results were obtained from WT
and KO liver and urine. In liver several qualitative metabolic differences were detected, and
oxoadipic acid was detected in all of the samples; importantly it did not interfere with HOG
detection. DHG was identified from HOGA KO urine and incorporated into the in-house spectral
library. Two unknowns were identified in liver as dihydrouracil and phosphate, and two more
unknowns were detected but not yet identified in urine.
1
1 Introduction
The primary hyperoxalurias (PH) are a group of three autosomal recessive errors of the
metabolism of glyoxylate, a two carbon anion readily acted upon by multiple hepatic
dehydrogenases and oxidases including cytosolic lactate dehydrogenase (LDH)1, 2
. First described
in 1925, the ultimate consequence of any of the three forms of PH is the excess production of
oxalate which is deposited in body tissue as the highly insoluble salt calcium oxalate. The tissue
most affected by this progressive salt crystal deposition is renal tissue. Early symptoms are
urolithiasis (recurrent stone formation) and nephrocalcinosis (calcum-oxalate deposition in renal
parenchyma). The most severe cases of disease result in end-stage renal failure (ESRF), with a
median age of onset at 24 years. Other tissues affected by calcium oxalate deposition, known as
systemic oxalosis, include blood vessel endothelial walls, joints, the retina, skin, bone marrow,
and the heart1.
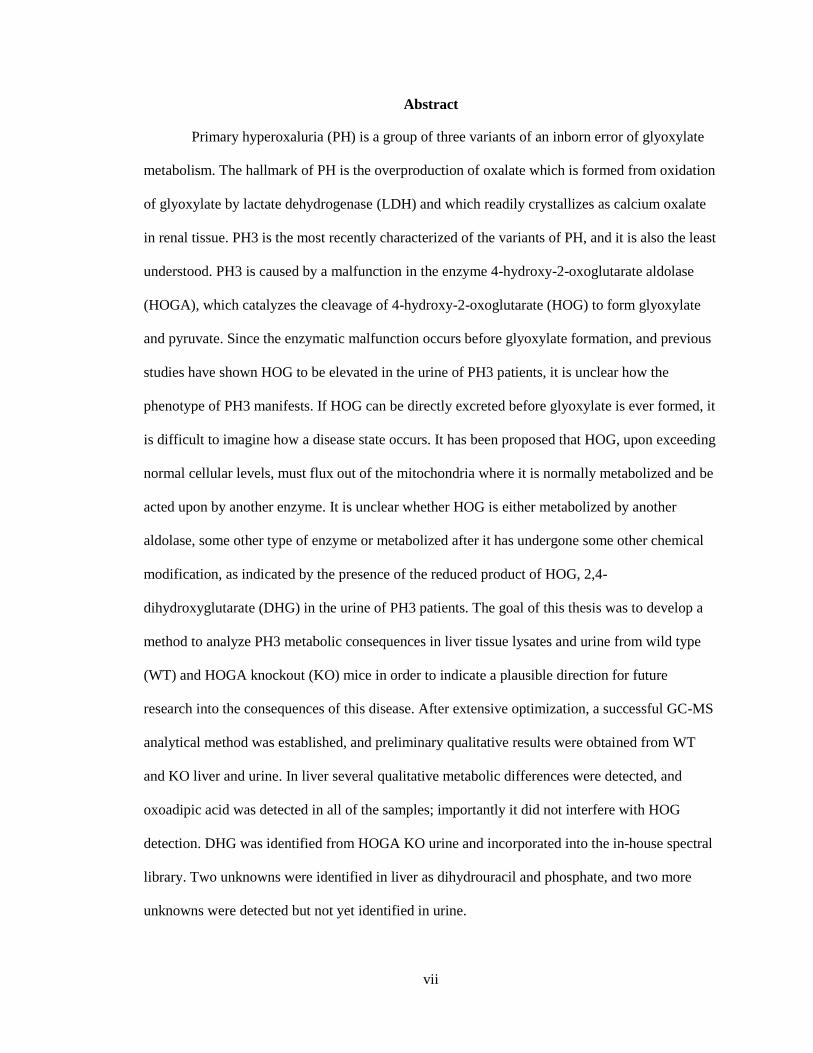
The main source of glyoxylate in this metabolic process is the catabolism of 4-
hydroxyproline (Hyp) via endogenous and dietary collagen turnover2. This pathway intersects
with glycolate and glycine metabolism (see Figure 1). For example, glycolate is found to be
elevated in urinary output in PH1 patients and is shunted to glyoxylate and subsequent oxalate
formation5. Approximately 300-450 mg of Hyp are produced just from the endogenous collagen
turnover; Hyp can also be derived from numerous dietary sources. Normal Hyp metabolism
involves four mitochondrial enzymatic steps to break down Hyp and produce glyoxylate as well
as pyruvate. The majority of the Hyp is metabolized in the liver and kidneys where the
subsequent glyoxylate is metabolized in peroxisomes and mitochondria to avoid oxalate
production by LDH3, 4
. The metabolism of Hyp in the liver and kidneys makes both liver tissue
analysis and urinalysis of metabolic output important components to study in PH.
Under normal circumstances, glyoxylate is either detoxified by conversion to glycine via
alanine:glyoxylate aminotransferase (AGT) or is reduced to highly soluble glycolate by
glyoxylate reductase (GR). PH1 and PH2 are characterized by deficiencies in AGT and GR
2
respectively. In either case, the natural clearance of glyoxylate in the organelles is deficient, and
the excessive glyoxylate is shunted to LDH in the cytoplasm where it is oxidized to oxalate4, 5
.
Oxalate cannot be metabolized in humans, so in healthy individuals it is filtered out and excreted
by the kidneys. Healthy oxalate excretion is less than 0.45 mmol per 1.73m2 of body surface area
per day whereas PH oxalate excretion can range from 0.5 mmol per 1.73m
2 per day to over 1
mmol per 1.73m2 per day
3. The excessive oxalate load leads to the early symptoms of urolithiasis
and nephrocalcinosis and can lead to chronic kidney disease. This process eventually results in
compromised glomerular filtration rate which further disables the kidneys from filtering the
oxalate, resulting in increased stone formation and often ESRF8. Through genomic studies, the
enzyme deficiency that causes PH3 was recently discovered and characterized. However, the
source of excess oxalate from this particular defect has yet to be determined6, 20
.
Figure. 1. Metabolism of 4-hydroxyproline and glyoxylate within a liver cell. Four
mitochondrial enzymes are responsible for Hyp breakdown: hydroxyproline
dehydrogenase (HYPDH), Δ1-pyrroline-5-carboxylate dehydrogenase (P5CDH),
aspartate aminotransferase (AspAT), and 4-hydroxy-2-oxoglutarate aldolase (HOGA).
A variety of enzymes, including alanine-glyoxylate aminotransferase (AGT), D-amino
acid oxidase (DAO), glyoxylate reductase (GR), and lactate dehydrogenase (LDH), can
act on glyoxylate produced from 4-hydroxy-2-oxoglutarate cleavage. AGT, GR, and
HOGA are mutated within primary hyperoxaluria patients (types 1, 2, and 3,
respectively).

3
Of the three conditions, PH1 is the most severe with almost all cases resulting in multi-
organ system failure and requiring liver-kidney transplants as the only course of treatment. PH2,
which is occasionally mis-diagnosed as PH1 if based on symptoms alone, is less severe with
about 20% of cases reaching ESRF. Approximately 1% of childhood ESRF in North America and
Europe can be attributed to PH19. Approximately one third of PH1 cases are responsive to
treatments with high doses of pyridoxal phosphate, the cofactor for AGT, while the rest of PH1
patients and most PH2 patients are currently limited to the treatment options that merely serve to
attenuate disease symptoms and hopefully delay disease progression. These treatments include
crystallization inhibitors such as alkali citrate and orthophosphate, a low oxalate containing diet
and increased hydration to improve calcium oxalate solubility.
PH3 is the least severe of the three forms of PH with few patients to date progressing to
ESRF7, 8
. Clinically, PH3 is also rare; PH3 and PH2 each comprise approximately 10% of all PH
cases23
. It has been suggested, however, that the clinical presentation of PH3 is an
underestimation of true disease prevalence. Estimates from public whole exome sequencing in the
United States indicate that PH3 could impact as many as 7 per million people, which is
considerably higher than the prevalence of PH1 reported in Europe (1 per million). The relative
lack of severity of PH3 may have caused underrepresentation in clinical diagnosis due to
clinicians not testing for a PH variant because of the lack of severe renal damage10
. Whatever the
case may be for the true prevalence of this disease, it is the unusual pathophysiology of PH3 that
is the focus of this study.
1.1 Hydroxyproline Metabolism in Primary Hyperoxaluria Type 3 (PH3)
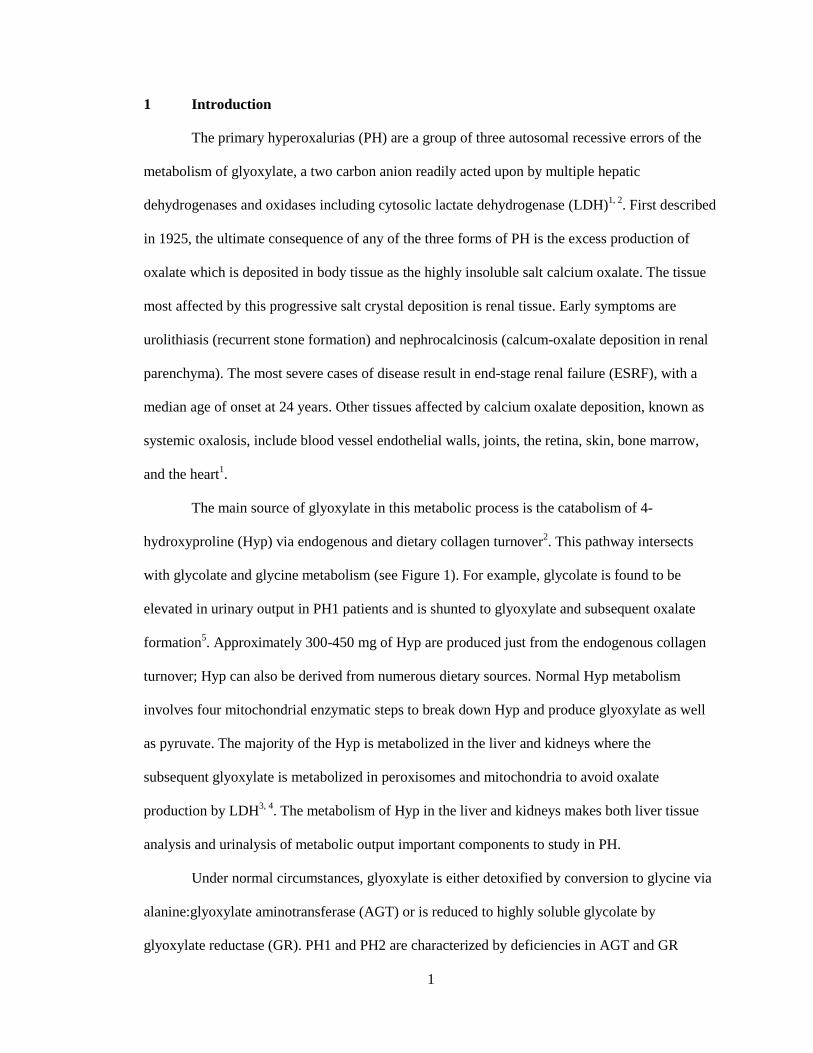
PH3 is characterized by a deficiency in the enzyme: 4-hydroxy-2-oxoglutarate aldolase
(HOGA) which cleaves 4-hydroxy-2-oxoglutarate (HOG) to pyruvate and glyoxylate in the
terminal step in Hyp metabolism (Figure 1). Since the deficiency in this enzyme does effectively
block the production of glyoxylate from Hyp, and thus the production of kidney stone forming
4
oxalate, the molecular basis for PH3 is still a mystery2, 5, 6
. Current hypotheses suggest that the
buildup of HOG in the mitochondria of PH3 patients results in its transport to the cytosol where it
is acted upon by other aldolases 3, 6, 7
.
Since PH3 patients produce elevated levels of oxalate and glyoxylate, it is reasonable to
assume that another enzyme can either catalyze the cleavage of HOG to glyoxylate and pyruvate
or perhaps to other metabolites with 2-3 carbon atoms. It is also relevant to note that HOG and
the reduced form 2,4-dihydroxyglutarate (DHG) are detected in blood and urine of PH3 patients
indicating that at least some HOG can be excreted directly which should also bypass any
symptomatic condition4. Neither direct HOG clearance nor cleavage by another enzyme explains
the disease state of PH3, since routing metabolites around HOGA would simply produce normal
levels of glyoxylate which would diffuse into peroxisomes and cytoplasm and be cleared via
normal functioning GR and AGT. Thus, it is possible that another enzyme in the cell is inhibited
or activated in order to explain the excess oxalate formation.
It has been shown that HOG is a specific inhibitor of GR in vitro, though this has not
been verified in cells4. Thus, it is possible that once HOG levels rise above the normal
physiological range via HOGA loss of function, it fluxes out of the mitochondria where HOG
inhibits GR. We hypothesize that HOG is acted upon by another aldolase (possibly PLP-
dependent) or perhaps another reductase (as evidenced by the detectable presence of DHG in
patient urine and blood) to produce the glyoxylate that is then oxidized to oxalate by LDH (Figure
2). It is also possible that HOG inhibits or modifies another enzyme leading to the buildup of
other metabolites that could contribute the glyoxylate and subsequent oxalate production. The
unknown disease mechanism and its metabolic consequences necessitate a detailed analysis of the
metabolites present in PH3 liver tissue and urine.

5
Figure 2. Mitochondrial Hyp catabolism and consequences of HOGA deficiency. The
inactivation of HOGA in PH3 results in the buildup of 4-OH-Glu, HOG and DHG (indicated in red).
These metabolites may be further converted to glyoxylate (Glx), pyruvate (Pyr) and glycine (Gly).
The wavy bonds in HOG and DHG indicate the potential for a racemic mixture.
(1) HOGA-deficient in PH3 (2) Other Type 1 aldolase? (3) Type 2 aldolase? (4) Other mechanism?
NADH/NADPH dependent?

6
1.2 Statement of Purpose
In order to more fully understand the aberrant metabolic processes that occur in PH3, I
set out to analyze the differences in metabolites present at varying timepoints following reactions
with 4-OH-Glu, HOG and Hyp in HOGA knockout (KO) vs WT mice liver lysates and urine
samples. Before this analysis could take place, a method for the analyses had to be developed. To
date, no comprehensive method has been established to analyze all Hyp and glyoxylate related
metabolites from multiple biological sample sources. The primary tool for my analytical method
is gas chromatography-mass spectrometry (GC-MS). The chemical nature and range of size of all
metabolites concerned in this study as well as the reliability of GC-MS made it the logical choice
for my analyses. The primary challenge of this project was developing the method of preparation
for liver tissue lysate samples to be suitable for GC-MS analysis as well as the optimization of the
analytical parameters.
With the optimized analytical method, future studies will monitor the flux of 13C5,
15N-
Hydroxyproline metabolites in order to specifically identify the compounds formed from Hyp
metabolism versus other endogenous compounds present in the tissue. Time course studies using
liver lysate and purified mitochondria incubations could be conducted to detect metabolic
changes in order to try to develop a coherent picture of the altered metabolism occurring in PH3.
7
2 Method Development for Analysis of Relevant Metabolites in PH3
In addition to oxalate and HOG, DHG and 4-OH-Glu are produced in excess in PH3
patients. All of the compounds we seek to analyze in this study are relatively small (ranging from
glyoxylate at 73 Da to DHG at 160 Da) and polar (either amino or non-amino organic acids). This
range of size and functional groups, combined with a need for high analytical sensitivity, led to
the decision to use GC-MS as our analytical tool. In addition to detection sensitivity, the
chromatographic separation of all relevant compounds is most readily achieved with GC-MS.
Previous work analyzing oxalate and other PH relevant compounds, such as oxoadipic acid,
glycerate and HOG, has had to employ multiple analytical systems including IC-MS and HPLC
because many of the compounds co-elute in these systems27, 28
. GC-MS offers the most complete
analysis using one sample preparation method and one instrument to separate and analyze all the
metabolites.
GC-MS has been used reliably for decades; it has a proven track record as a method of
high sensitivity and reproducibility in terms of metabolic profiling. Metabolic profiling is a non-
hypothesis based method of investigation into the biological effects and global metabolic changes
as a result of toxic exposure, pharmacological treatment or disease11
. It was our goal to follow
this line of reasoning in order to learn more about the mechanism of PH3. These investigations of
PH3 were carried out on liver tissue and urine samples from an HOGA KO mouse model of the
disease received from our collaborator Dr. Ross Holmes, University of Alabama-Birmingham.
The goal for liver tissue was to incubate WT vs HOGA KO liver lysates with compounds relevant
to PH: Hyp, HOG and 4-OH-Glu, and detect any significant metabolic changes between WT and
KO samples. In WT liver for example, we expect to find a low HOG level and an increase in
normal output of pyruvate and glyoxylate. For HOGA KO mice, we would expect to detect
higher levels of HOG and DHG, as well as some other metabolites that would indicate how the
oxalate is being formed. In urine, the goal was to establish a simple urinalysis method for
detecting all the relevant metabolites in an efficient and simple analytical process. In developing

8
the method, I would compare WT and HOGA KO urine samples from before and after a
controlled 1% Hyp total protein diet. This method would allow detection of metabolic changes
represented in urinary output.
One of the primary considerations for establishing a GC-MS analytical method for
metabolic compounds is the chemical derivatization of the compounds in question. The inherent
properties of GC-MS (e.g., high heat and operation under vacuum) require samples to be
thermally stable and volatile to vaporization into the gaseous state. In GC-MS, the ultimate goal
is to vaporize the samples into the gas phase while keeping the compounds intact as they migrate
in the carrier gas (ultra-high pure helium in our system) through the inert, hydrophobic column to
separate based on mass and hydrophobicity. The GC is interfaced with a mass selective detector
(MSD) where the separated compounds are hit with a 70eV pulse and are fragmented into ions for
analysis.
Most of the Hyp metabolites are polar and not volatile or stable, so they are not suitable
for GC-MS analysis until they are derivatized with hydrophobic chemical groups14, 15
. Broadly
speaking, there are two popular derivatization methods for organic metabolites: alkylation or
silylation (for reaction details see Figure 3). Silylation is the addition of a tri-methyl silyl (TMS)
group to amino, carboxylic acid or hydroxyl functional groups, and has been in use considerably
longer than alkylation. Alkylation is the addition of a methyl group or other small hydrocarbon
chain to amino, carboxylic acid or hydroxyl functional groups. The use of alkylation has
increased in recent years due to its methodological simplicity and the fact that the alkylation
reaction can be performed under aqueous conditions whereas silylation must occur under
anhydrous conditions12, 13
. In either method, the goal is the same: to stabilize reactive, thermally
labile functional groups in order to make the sample suitable for GC-MS analysis.
9
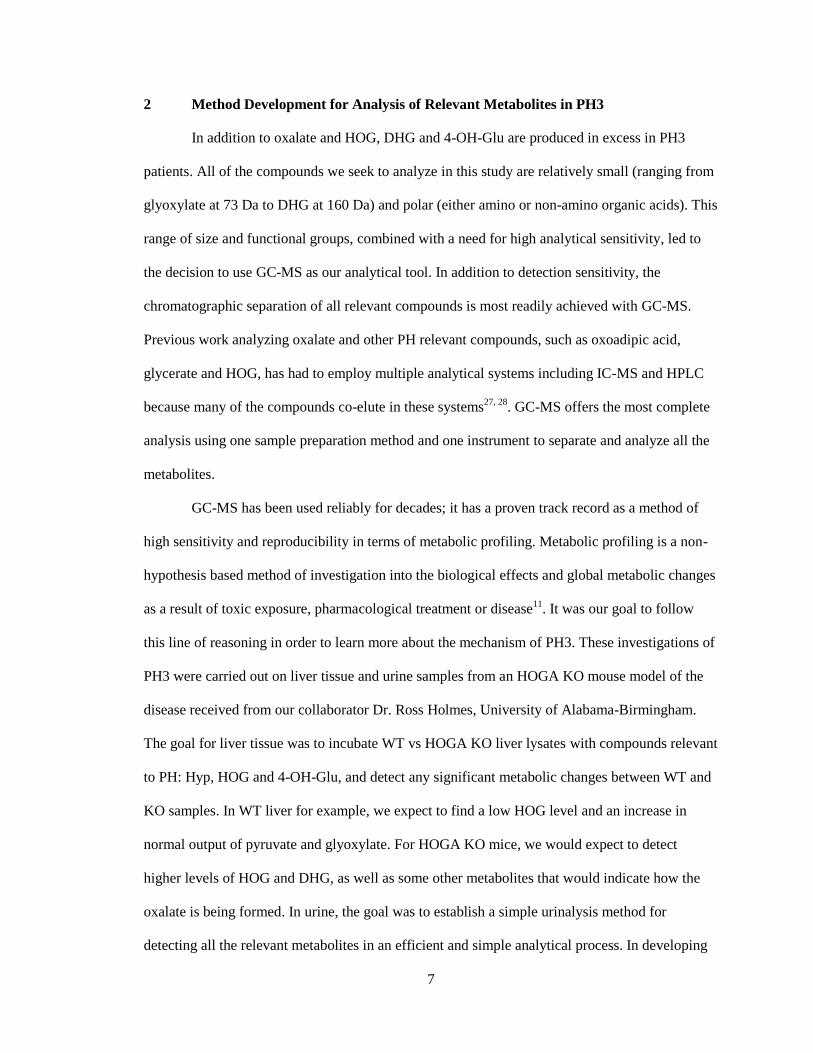
Alkylation (Figure 3A) of a sample occurs in a reaction mixture of methanol, sodium
hydroxide and pyridine. To this sample reaction mixture, methyl chloroformate (MCF) is added
where it reacts rapidly (on the order of seconds) with the previously mentioned functional groups.
Figure 3. Reaction diagram of alkylation and silylation derivatization techniques
The polar, reactive functional groups present in the metabolites concerned in this study are not
suitable for GC-MS analysis without being stabilized via derivatization. They must be non-
reactive so as to fly through the GC column which is lined with an inert, hydrophobic coating, and
they must be thermally stable to be vaporized into the gas phase without being disrupted until they
reach the mass analyser. Both of these derivatization techniques accomplish this requisite
stabilization. Figure adapted from Villas-Boas et al13
.
A
B
10
The derivatized products are extracted from the reaction mix and any un-derivatized sample via a
chloroform-sodium bicarbonate mixture. The derivatized sample, solvated in chloroform, can
then be injected into the GC-MS without further treatment or sample workup12
. In contrast,
silylation (Figure 3B) begins by completely drying the samples down, typically under a nitrogen
stream or using a rotary evaporator. The dried samples are then dissolved in a solution of
methoxyamine hydrochloride (MOX) in pyridine to carry out a methoximation reaction, which
serves to protect thermally labile keto and aldehyde groups. This reaction requires one hour to
incubate at 60o; the resulting product is then reacted with N,O-
bis(trimethylsilyl)trifluoroacetamide (BSTFA) for another 40 minutes to an hour at 60o to add a
trimethyl silyl group to the amino, carboxylic acid and hydroxyl groups13, 14
. GC-MS analysis of
DHG and HOG using TMS derivatization has been successfully performed, but an analysis with
all of the compounds of interest in one method has not been reported10
.
With the analytical goal of monitoring PH3 relevant compounds in one analysis, I set out
to develop a method using MCF derivatization. It is a faster, simpler process which seemed quite
promising in the literature.
2.1 MCF Derivatization
I decided to utilize the relatively newer, more efficient alkylation via MCF as our
derivatization technique of choice. The benefits were clear: faster sample processing, no need to
perform the reaction under anhydrous conditions and a technique that was at least equally
efficacious as the more established TMS methods29, 30, 31
. The first step in developing the
analytical method was the production of a compound spectral library generated from analyses of
chemical stocks of the metabolites in question. These established spectra in the library were then
used to identify mass spectral peaks originating from liver lysate and urine samples. In order to
build the compound fragment library and perform data analysis, I used the Automated Mass
Spectral Deconvolution and Identification System (AMDIS), which is freely available from the

11
National Institute of Standards and Technology (NIST), the use of which is detailed excellently
by Smart et al16
. The most important components of an in-house library are the compound
fragment patterns and the retention times. Fragment patterns are generally consistent between
different individual GC-MS systems as long as the type of ion source is the same15
. This makes
unknown compound identification possible by comparison to spectra captured with similar
analyses. Retention times, however, vary between each individual machine depending mostly on
the exact type and dimensions of the GC column. Thus having in-house records for one’s own
system is important when identifying peaks in biological tissue samples and comparing fragment
patterns and retention times to the standards in the library.
The MCF-derivatized spectral library within AMDIS was built with samples of pure
chemical stocks of pyruvate, glyoxylate, 4-OH-glutamate, hydroxyproline, and glycine obtained
from Sigma-Aldrich. MCF was also obtained from Sigma Aldrich. D4,15
N-Alanine (D4 Ala) was
obtained from Cambridge Isotope Laboratoires and used as the internal standard. HOG was
synthesized as originally reported in Riedel et al2. The MCF derivatization procedure was
conducted based on the protocol by Villas-Boas et al12
: a range of sample volumes from 10-100
μL from stock concentrations of 0.1 mg/mL were derivatized by adding the sample to a reaction
mixture of 200 μL 1M NaOH, 167 μL 100% MeOH, and 34 μL pyridine in 13 x 100mm
borosilicate glass disposable tubes under a fume hood. To the sample reaction mixture, 20 μL
MCF was added. The mix was vortexed for 30 seconds then another 20 μL MCF was added, and
the mix was vortexed again for 30 seconds. To separate the derivatized samples from the reaction
mix and any underivatized sample, 400 μL of chloroform were added, and the mix was vortexed
for 10 seconds. 400 μL of 50 mM sodium bicarbonate was then added, and the mix was vortexed
for another 10 seconds. The upper, aqueous layer was drawn off and discarded, and a small
portion of anhydrous sodium sulfate powder was added to the chloroform layer to ensure
complete dryness, as water can be harmful to a GC-MS system. The dry organic sample was then
transferred to a GC vial, making sure not to pick up any granules of sodium sulfate, which was
12
crimp-capped with 11 mm PTFE seal caps from Thermo Scientific and loaded into the
autosampler tray. Each metabolite was analyzed in triplicate, and the resulting spectra were
incorporated into the AMDIS library.
2.1.1 GC-MS Analysis of MCF Derivatized Compounds
Samples of pyruvate, glyoxylate, Hyp, 4-OH-Glu, glycine and D4 Ala were analysed in
order to establish the compound library for later unknown sample identification; the key
information for each compound result is listed in Table I. Samples were analyzed via an
automated injector system with an Agilent 6890N GC coupled to a 5973N single quadrupole
mass selective detector (MSD), operated with electron ionization (EI) at 70eV. The GC column
was a J&W Scientific DB-5MS: 30 m x 0.25 mm i.d. x 0.25μm film thickness. The oven was held
at an initial temperature of 45oC for 2 minutes followed by a temperature ramp of 10
oC/min up to
180oC where it was held for five minutes. The temperature was then ramped at 40
oC/min to
220oC, where it was held for five minutes. The final temperature ramp was performed at
40oC/min to 240
oC, where it was held for 7 minutes. The column carrier gas flow was a constant
0.9 mL He/min. The injection volume was 1 μL, and the inlet was operated in splitless mode at
250oC. The GC-MS interface was held at 250
oC, and the quadrupole was held at 200
oC. The MS
was operated in Scan mode (solvent delay: 5 minutes; mass range: 15-650 amu; scan rate: 2.36
scans/sec). These analytical parameters were obtained from Smart et al16
.
2.1.2 MCF Derivatized Spectra
Derivatized compounds elute from the GC into the mass analyzer based on their size and,
more importantly for small molecules, their polarity. As previously noted, polar molecules must
be derivatized to increase volatility while remaining stable enough to be analyzed. The
compounds must remain in the gas phase and flow smoothly through the column (which is lined
with inert, hydrophobic polydimethylsiloxane) as the temperature increases gradually in the GC
13
oven, yielding characteristic retention times (RT) for each separate compound. Replicate peaks
that were consistent in terms of RT and had consistent fragment patterns that corresponded to
established electron ionization (EI) fragmentation were used as the identifiers for each
compound15
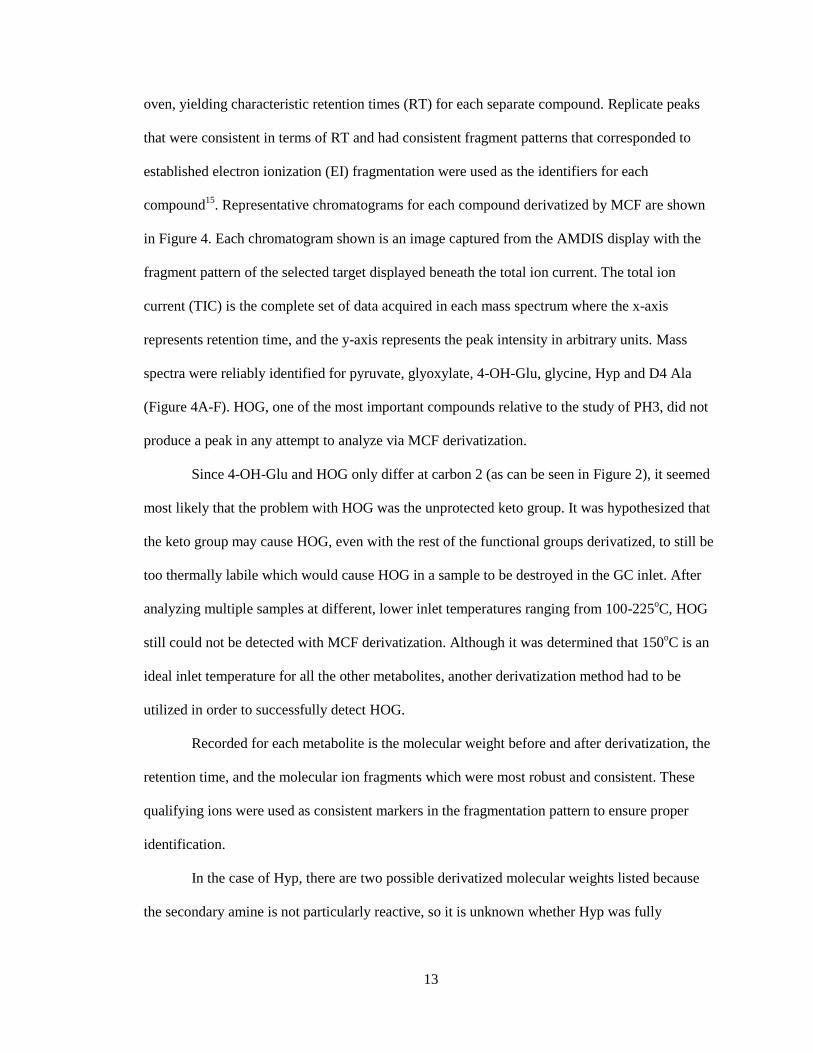
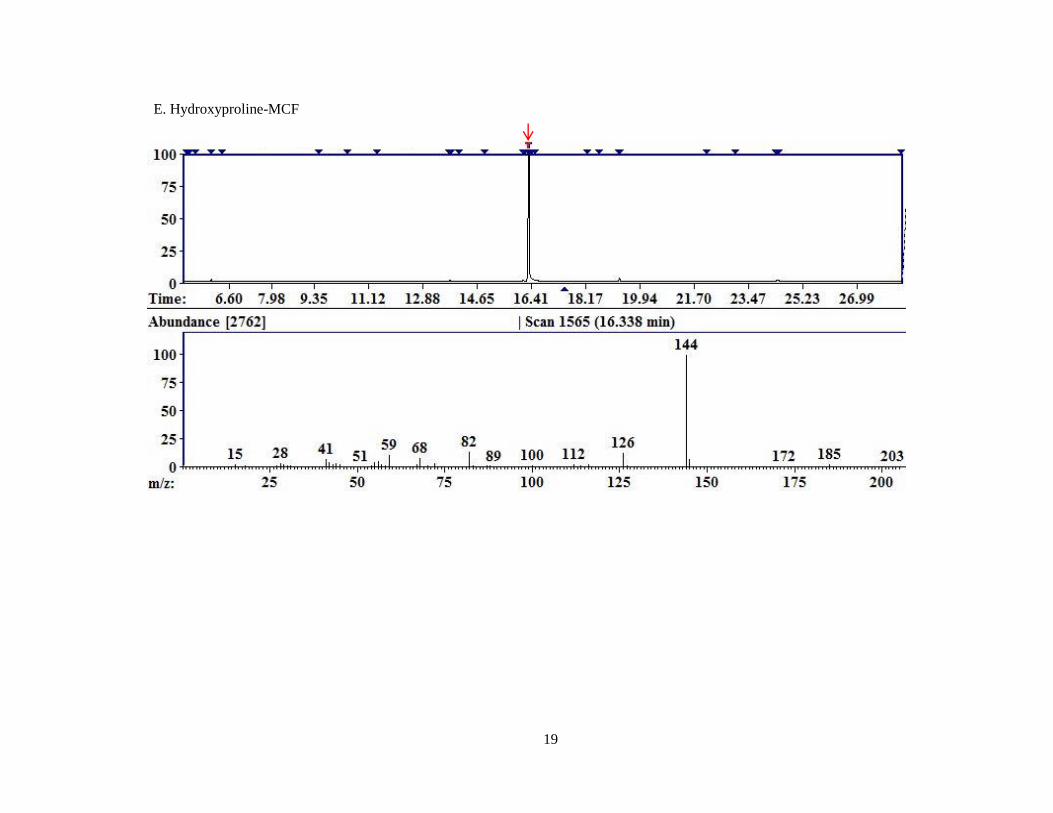
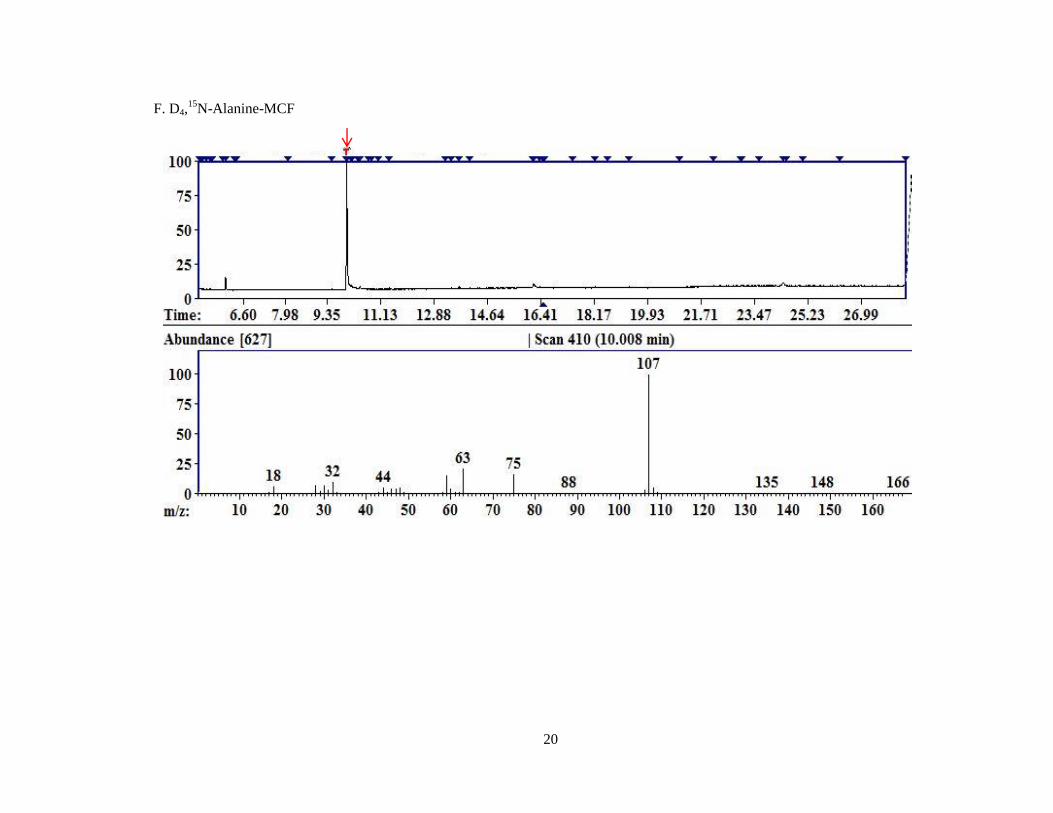
. Representative chromatograms for each compound derivatized by MCF are shown
in Figure 4. Each chromatogram shown is an image captured from the AMDIS display with the
fragment pattern of the selected target displayed beneath the total ion current. The total ion
current (TIC) is the complete set of data acquired in each mass spectrum where the x-axis
represents retention time, and the y-axis represents the peak intensity in arbitrary units. Mass
spectra were reliably identified for pyruvate, glyoxylate, 4-OH-Glu, glycine, Hyp and D4 Ala
(Figure 4A-F). HOG, one of the most important compounds relative to the study of PH3, did not
produce a peak in any attempt to analyze via MCF derivatization.
Since 4-OH-Glu and HOG only differ at carbon 2 (as can be seen in Figure 2), it seemed
most likely that the problem with HOG was the unprotected keto group. It was hypothesized that
the keto group may cause HOG, even with the rest of the functional groups derivatized, to still be
too thermally labile which would cause HOG in a sample to be destroyed in the GC inlet. After
analyzing multiple samples at different, lower inlet temperatures ranging from 100-225oC, HOG
still could not be detected with MCF derivatization. Although it was determined that 150oC is an
ideal inlet temperature for all the other metabolites, another derivatization method had to be
utilized in order to successfully detect HOG.
Recorded for each metabolite is the molecular weight before and after derivatization, the
retention time, and the molecular ion fragments which were most robust and consistent. These
qualifying ions were used as consistent markers in the fragmentation pattern to ensure proper
identification.
In the case of Hyp, there are two possible derivatized molecular weights listed because
the secondary amine is not particularly reactive, so it is unknown whether Hyp was fully

14
derivatized using MCF since the largest fragment identified was 203 which could either be a
fragment of the fully derivatized Hyp or be the molecular ion of the partially derivatized Hyp.
Table I. MCF derivatized metabolites
Compound Retention Time
(minutes)
Molecular
Weight (Da)
Derivatized
Molecular
Weight (Da)
Qualifying Ions
Pyruvate 7.05 87 161 117, 89, 43
D4 Ala 10.02 93 166 107, 63
Glycine 10.018 74 147 88, 59, 44
Glyoxylate 10.12 73 147 119, 103, 75
Hyp 16.335 130 203/261 203, 144, 126
4-OH-Glu 21.647 161 307 172, 140, 96
15
A. Pyruvate-MCF
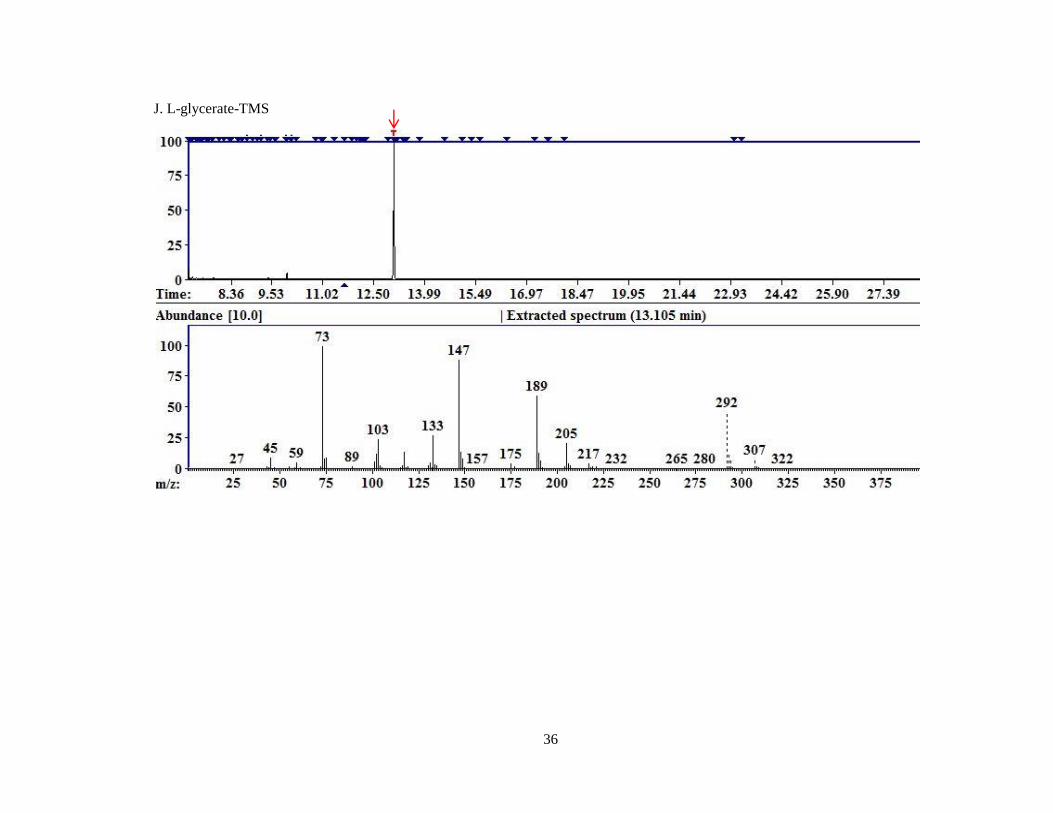
Figure 4. Representative chromatograms for MCF derivatized compounds.
A. Pyruvate; B. Glyoxylate; C. 4-OH-Glutamate; D. Glycine; E. Hydroxyproline; F. D4,15
N-Alanine.
Each image is a screen capture from the AMDIS readout of one of the replicates of MCF derivatized
compounds. The top portion of the graph is the TIC. The red arrow indicates the peak for which the
mass spectral fragment pattern is displayed in the bottom half of the image. Each subsequent image is
displayed similarly with a red arrow identifying the peak corresponding to the mass spectrum
displayed beneath.

16
B. Glyoxylate-MCF

17
C. 4-OH-Glutamate-MCF

18
D. Glycine-MCF
19
E. Hydroxyproline-MCF
20
F. D4,15
N-Alanine-MCF
21
2.2 MOX/MCF Derivatization
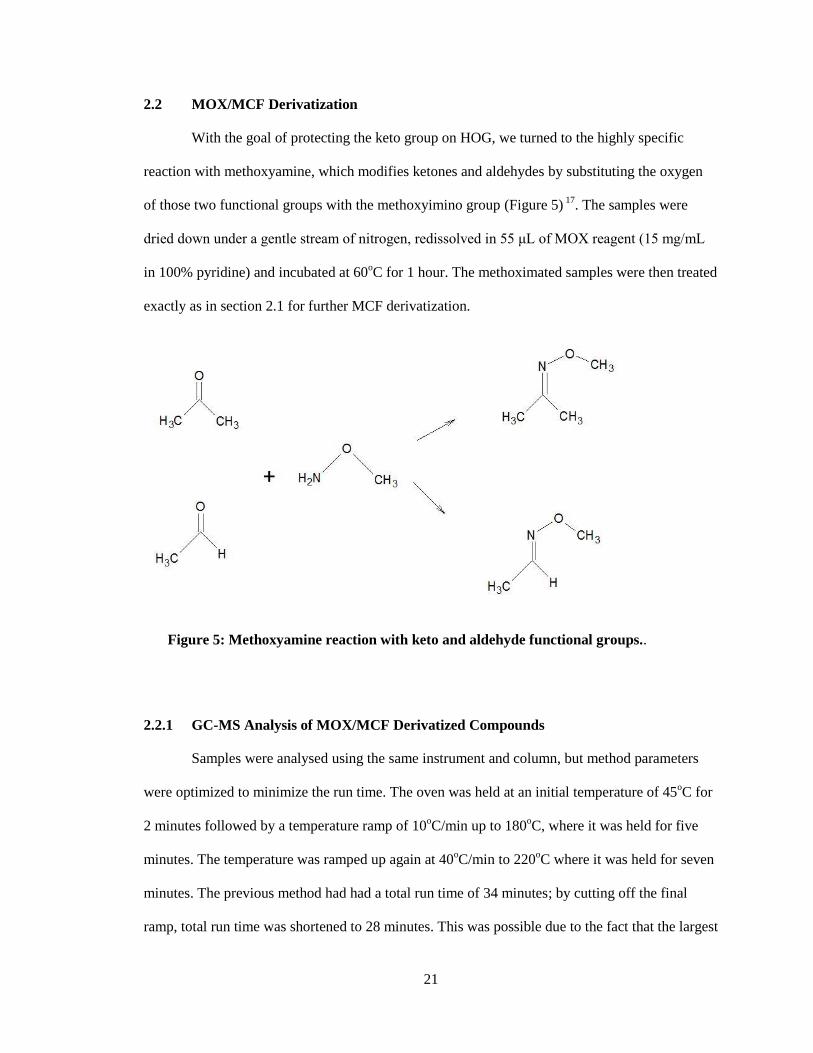
With the goal of protecting the keto group on HOG, we turned to the highly specific
reaction with methoxyamine, which modifies ketones and aldehydes by substituting the oxygen
of those two functional groups with the methoxyimino group (Figure 5) 17
. The samples were
dried down under a gentle stream of nitrogen, redissolved in 55 μL of MOX reagent (15 mg/mL
in 100% pyridine) and incubated at 60oC for 1 hour. The methoximated samples were then treated
exactly as in section 2.1 for further MCF derivatization.
2.2.1 GC-MS Analysis of MOX/MCF Derivatized Compounds
Samples were analysed using the same instrument and column, but method parameters
were optimized to minimize the run time. The oven was held at an initial temperature of 45oC for
2 minutes followed by a temperature ramp of 10oC/min up to 180
oC, where it was held for five
minutes. The temperature was ramped up again at 40oC/min to 220
oC where it was held for seven
minutes. The previous method had had a total run time of 34 minutes; by cutting off the final
ramp, total run time was shortened to 28 minutes. This was possible due to the fact that the largest
Figure 5: Methoxyamine reaction with keto and aldehyde functional groups..

22
compounds of interest in the study have RT of less than 22 minutes. The column carrier gas flow
was a constant 0.9 mL He/min. The injection volume was 1 μL, and the inlet was operated in
splitless mode at 150oC. The GC-MS interface was held at 250
oC, and the quadrupole was held at
200oC. The MS was operated in Scan/SIM co-acquisition mode (solvent delay: 5 minutes; mass
range: 15-650 amu; scan rate: 2.36 scans/sec).
2.2.2 MOX/MCF Derivatized Spectra
Only pyruvate and HOG were tested with this derivatization method. The additional
MOX treatment was not sufficient to facilitate the analysis of HOG. Representative
chromatograms of pyruvate and HOG samples are shown below. The MOX/MCF combination
was successful for pyruvate, and we hypothesize that it could be utilized for other compounds,
however it did not work for our main compound of interest, HOG, so we did not test this method
with any other compounds. The MOX/MCF derivatized pyruvate had a molecular weight of 131
Da, RT of 6.56 minutes and qualifying ions were 131, 101 and 72.

23
Pyruvate-MOX/MCF
Figure 6: Representative chromatograms for MOX/MCF derivatized pyruvate
24
2.3 TMS Derivatization
Though MCF seemed like a promising derivatization procedure, the problems
encountered prompted a return to TMS derivatization. The first step of this method is a
methoxyamine treatment carried out exactly as in the MOX/MCF derivatization with the same
goal of protecting ketone and aldehyde groups before the TMS step. Older protocols called for
extensive incubation times and more labor intensive derivatization procedures, but more recent
work has established shorter, optimized TMS protocols that place the TMS and MCF
derivatizations on relatively the same time scale18,19
. Derivatization of chemical standards for
library construction proceeded similarly as our previous methods. TMS derivatization was carried
out as follows: samples were dried down under a gentle stream of nitrogen in screw-top glass
tubes. Once dry, they were redissolved in 55 μL of 15 mg/mL MOX in pyridine and incubated at
60oC for one hour. To the methoximated samples was added 60 μL of BSTFA (obtained from
Sigma Aldrich); samples were incubated at 60oC for another hour. The derivatized samples were
then transferred to GC tubes and sealed for analysis.
2.3.1 GC-MS Analysis TMS Derivatized Compounds
Again, the samples were analyzed with the same instrument, column and the same oven
temperature settings. The only difference in data acquisition for the TMS derivatization is that the
solvent front delay was increased to 7 minutes since the smallest of our compounds were
observed to elute well after the 7 minute mark. Therefore, some of the chromatograms will have a
time x-axis starting at 5 minutes, and others will show data capture starting at 7 minutes. In
addition to the metabolites listed in in the MCF results (pyruvate, glyoxylate, D4 Ala, glycine,
Hyp, and 4-OH-Glu), oxalate, glycolate, HOG, oxobutyrate, oxoadipic acid and glycerate were
analyzed and catalogued with TMS derivatization, due to their presence in Hyp metabolism and
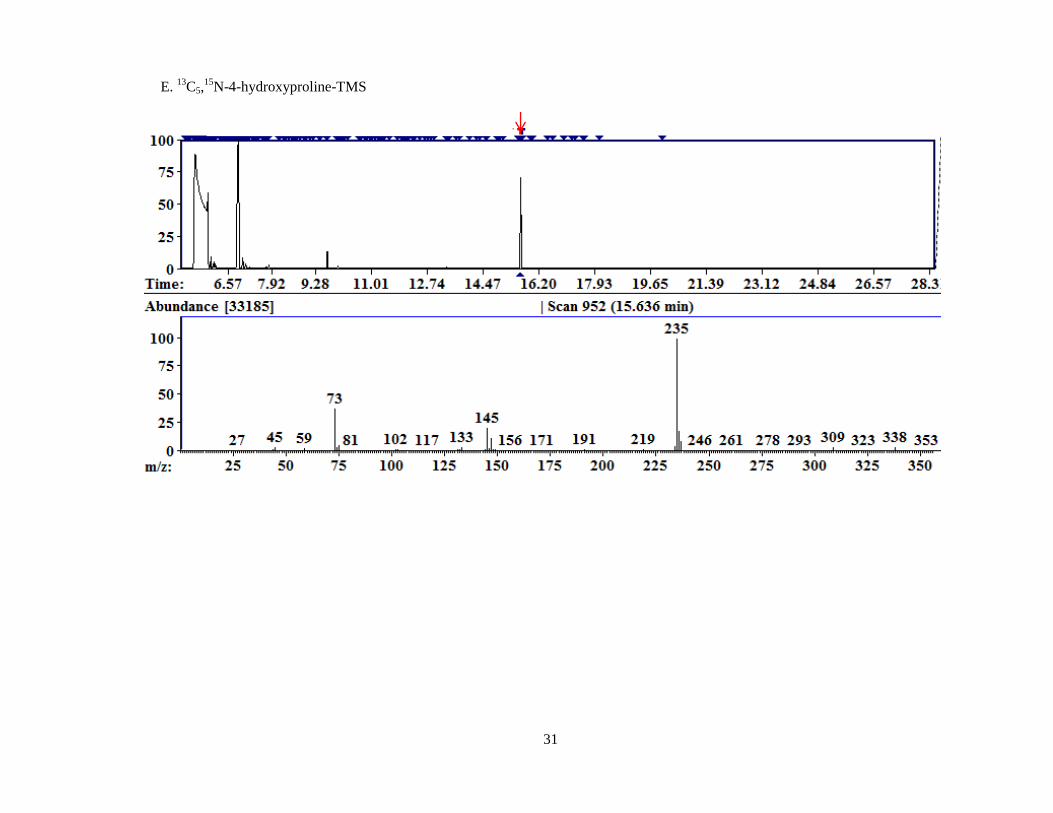
relevance in PH (Figure 1)23
. Also, 13
C5,15
N- Hydroxyproline (13
C,15
N-Hyp) was derivatized using
TMS and catalogued so that it could be used later with liver lysate analysis with the goal of
25
incubating liver lysates with 13
C,15
N-Hyp and tracking the metabolism of Hyp in a PH3 context
by analysing which compounds in the metabolic pathway (Figure 2) appeared in the analysis with
heavy isotopes of C and N.
2.3.2 TMS Derivatized Spectra
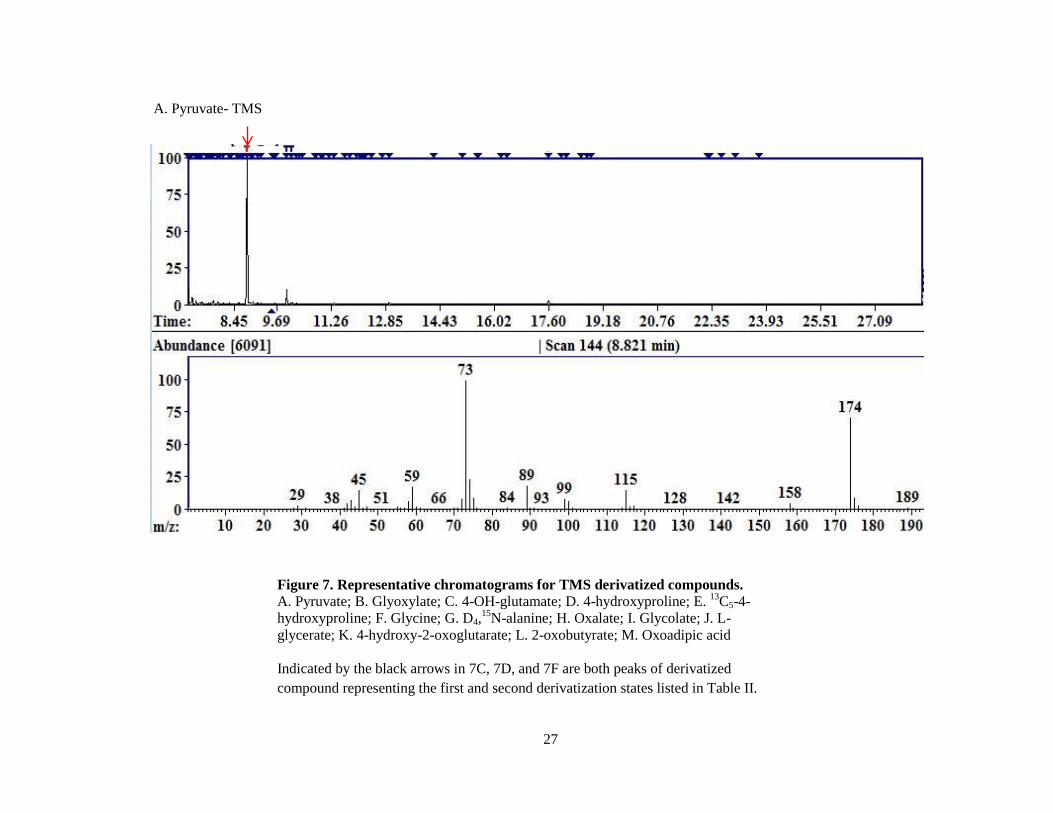
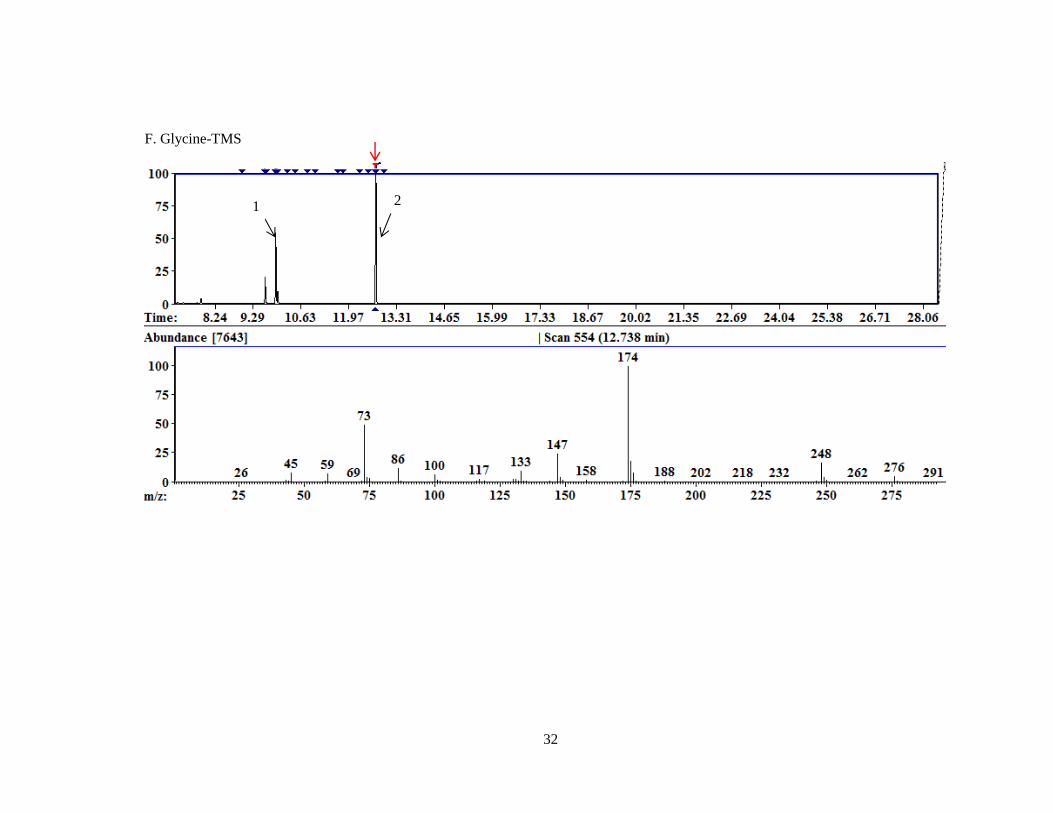
All of the compounds analyzed using TMS derivatization provided consistent peaks,
including HOG. Representative chromatograms of TMS derivatives are shown in Figure 7.
Analyses of 4-OH-Glu, Hyp and glycine yielded two distinct peaks for each compound
representing differing derivatization states, either fully or partially derivatized. In the case of 4-
OH-Glu, the vast majority is partially derivatized. We hypothesize that steric hindrance at either
the amine or the hydroxyl group (whichever functional group is derivatized first) prevents full
derivatization of most of the compound in solution. Since both groups result in the same
additional mass when derivatized, it is not possible to determine from these data which group is
being derivatized and which is being hindered.
For Hyp, we hypothesize that the less reactive secondary amine is not as readily
derivatized in solution as the hydroxyl group or the carboxylic acid. In fact the fully-derivatized
Hyp was not seen in my analyses until I began drying compound mixtures after chemical
extraction and re-dissolving directly in the BSTFA derivatizing agent as part of the method
development for liver lysates, discussed in detail in section 2.4.1. It is curious, however, that the
13C,
15N-Hyp was seen fully derivatized using the original derivatization technique. On the other
hand, the primary amine of glycine can be substituted with two TMS groups. In 1969, Bergstrom
et al. showed that TMS derivatized glycine exists in two states, Di or Tri-TMS glycine, with one
or two TMS groups at the amine and one on the carboxylic acid. The same fragment patterns they
reported were also seen in my analyses for the two derivatization states of glycine24
. In Table II
are the resulting RT, qualifying ions and molecular weight data for all of the TMS derivatized

26
compounds. With the TMS derivative library established, I could now proceed to test liver and
urine samples with the ability to identify any peak of the PH3 relevant compounds.
Table II. TMS derivatized metabolites
Compound Retention Time
(minutes)
Molecular
Weight (Da)
Derivatized
Molecular
Weight (Da)
Qualifying Ions
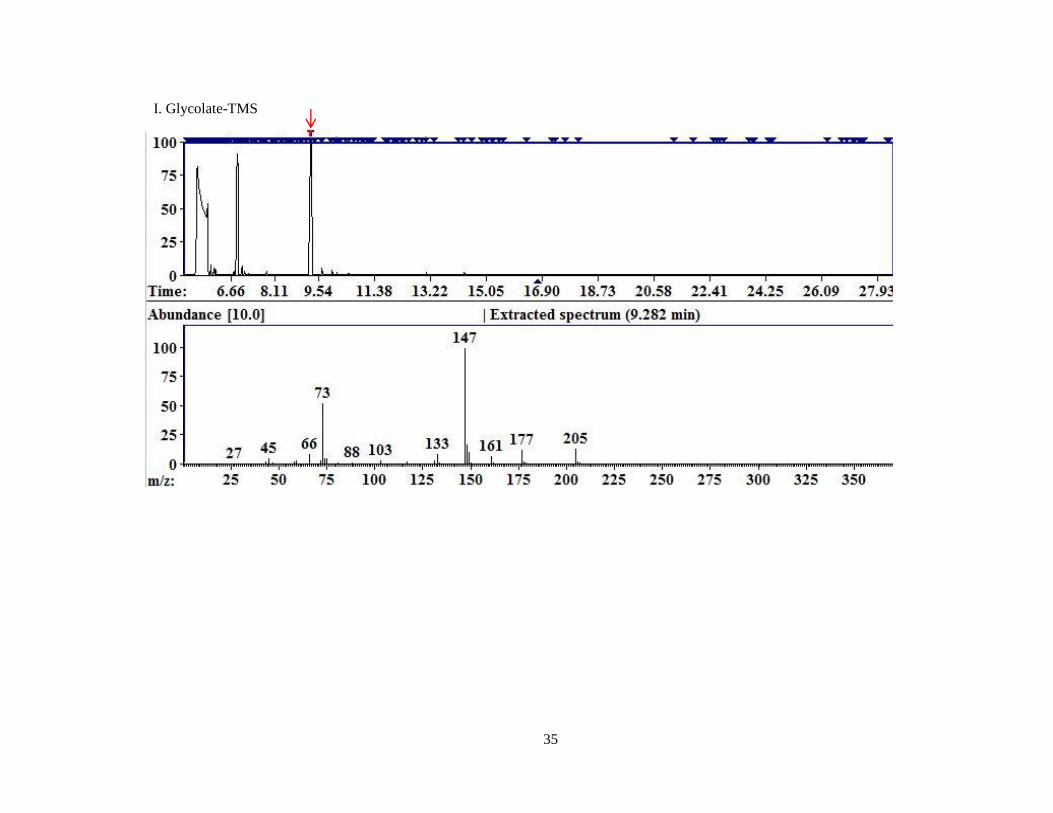
Glyoxylate 7.76 73 175 160, 89. 59
Pyruvate 8.9 87 189 174, 115, 89
Glycolate 9.29 75 220 205, 177, 161
D4 Ala 9.68 93 238 223, 195, 102
Oxobutyrate 9.68 101 203 188, 129, 89
Glycine 1: 9.94
2: 12.74
74 1: 219
2: 291
1: 204, 176, 102
2: 276, 248, 174
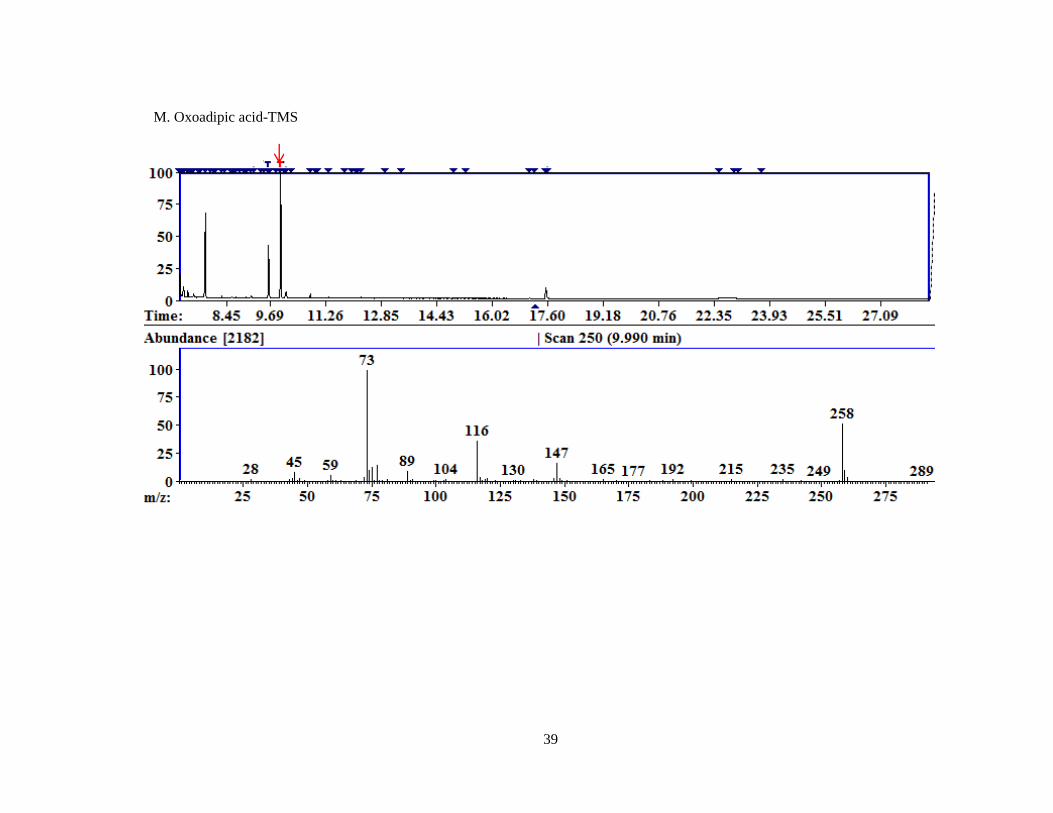
Oxoadipic acid 9.98 158 333 258, 147, 116
Oxalate 10.16 88 234 219, 190, 147
L-Glycerate 13.11 105 322 307, 292, 189
Hyp 1: 14.98
2: 15.62
130 1: 275
2: 347
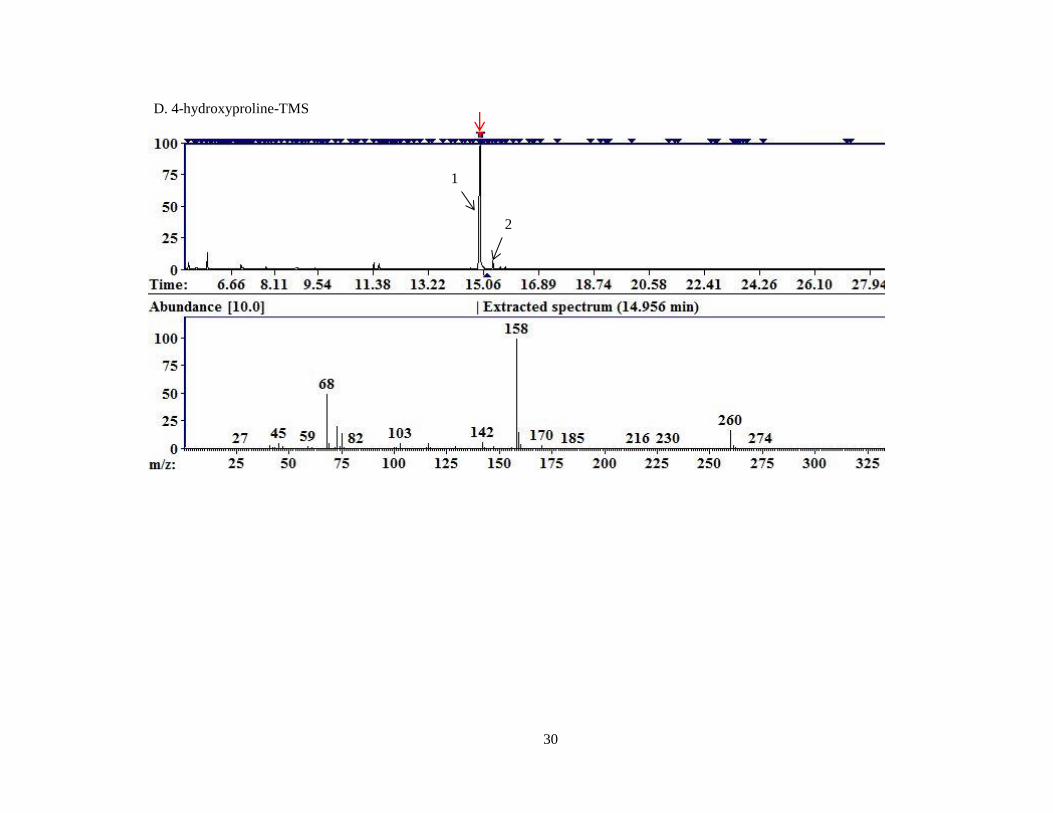
260, 158, 68
332, 230, 140
13C,
15N-Hyp 15.65 136 353 309, 235, 145
4-OH-Glu 1: 17.63
2: 21.96
161 1: 378
2: 451
1: 346, 244, 100
2: 360, 270, 244
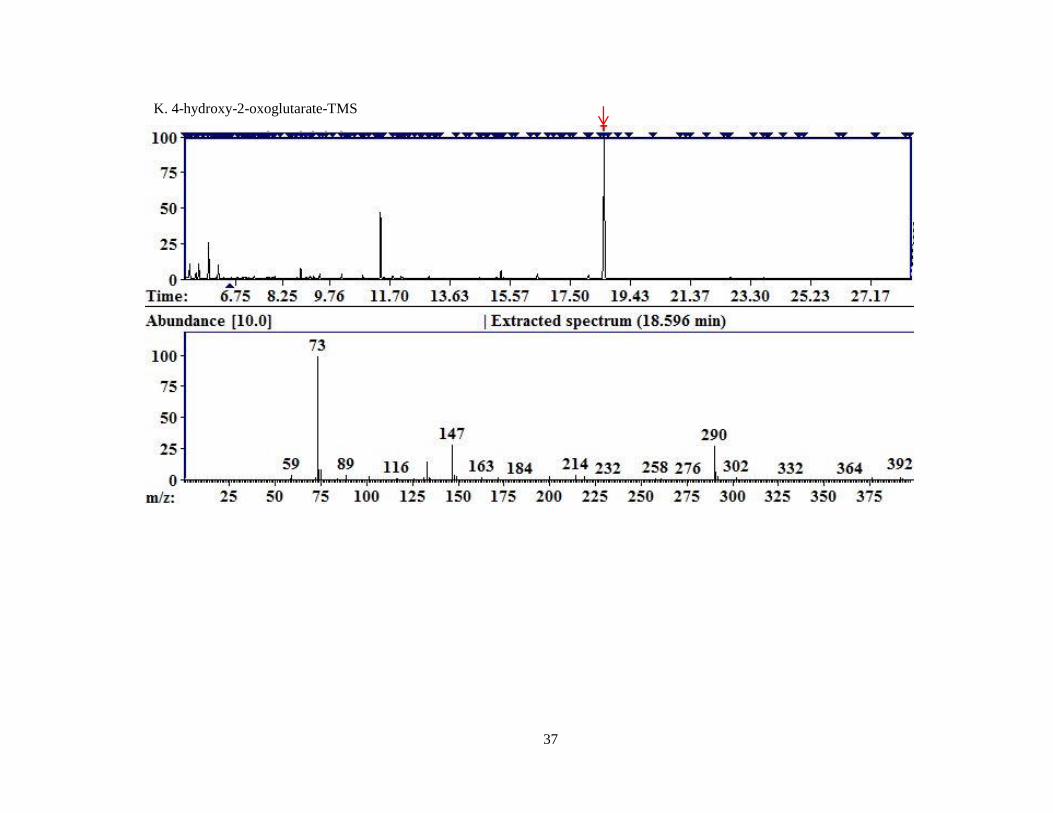
DHG 18.48 162 452 437, 319, 245
HOG 18.57 160 408 392, 290, 133
27
A. Pyruvate- TMS
Figure 7. Representative chromatograms for TMS derivatized compounds.
A. Pyruvate; B. Glyoxylate; C. 4-OH-glutamate; D. 4-hydroxyproline; E. 13
C5-4-
hydroxyproline; F. Glycine; G. D4,15
N-alanine; H. Oxalate; I. Glycolate; J. L-
glycerate; K. 4-hydroxy-2-oxoglutarate; L. 2-oxobutyrate; M. Oxoadipic acid
Indicated by the black arrows in 7C, 7D, and 7F are both peaks of derivatized
compound representing the first and second derivatization states listed in Table II.

28
B. Glyoxylate-TMS

29
C. 4-OH-glutamate –TMS
1
2
30
D. 4-hydroxyproline-TMS
1
2
31
E. 13
C5,15
N-4-hydroxyproline-TMS
32
F. Glycine-TMS
2 1

33
G. D4,15N-alanine-TMS

34
H. Oxalate-TMS
35
I. Glycolate-TMS
36
J. L-glycerate-TMS
37
K. 4-hydroxy-2-oxoglutarate-TMS

38
L. 2-Oxobutyrate-TMS
39
M. Oxoadipic acid-TMS
40
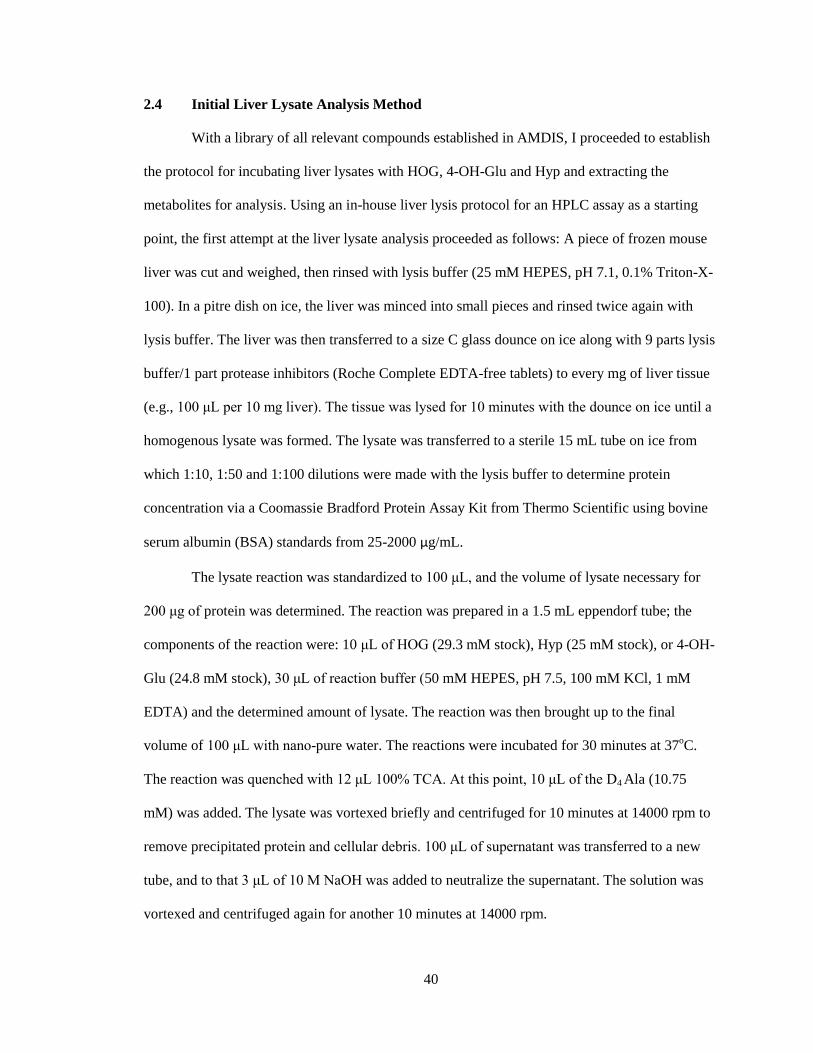
2.4 Initial Liver Lysate Analysis Method
With a library of all relevant compounds established in AMDIS, I proceeded to establish
the protocol for incubating liver lysates with HOG, 4-OH-Glu and Hyp and extracting the
metabolites for analysis. Using an in-house liver lysis protocol for an HPLC assay as a starting
point, the first attempt at the liver lysate analysis proceeded as follows: A piece of frozen mouse
liver was cut and weighed, then rinsed with lysis buffer (25 mM HEPES, pH 7.1, 0.1% Triton-X-
100). In a pitre dish on ice, the liver was minced into small pieces and rinsed twice again with
lysis buffer. The liver was then transferred to a size C glass dounce on ice along with 9 parts lysis
buffer/1 part protease inhibitors (Roche Complete EDTA-free tablets) to every mg of liver tissue
(e.g., 100 μL per 10 mg liver). The tissue was lysed for 10 minutes with the dounce on ice until a
homogenous lysate was formed. The lysate was transferred to a sterile 15 mL tube on ice from
which 1:10, 1:50 and 1:100 dilutions were made with the lysis buffer to determine protein
concentration via a Coomassie Bradford Protein Assay Kit from Thermo Scientific using bovine
serum albumin (BSA) standards from 25-2000 μg/mL.
The lysate reaction was standardized to 100 μL, and the volume of lysate necessary for
200 μg of protein was determined. The reaction was prepared in a 1.5 mL eppendorf tube; the
components of the reaction were: 10 μL of HOG (29.3 mM stock), Hyp (25 mM stock), or 4-OH-
Glu (24.8 mM stock), 30 μL of reaction buffer (50 mM HEPES, pH 7.5, 100 mM KCl, 1 mM
EDTA) and the determined amount of lysate. The reaction was then brought up to the final
volume of 100 μL with nano-pure water. The reactions were incubated for 30 minutes at 37oC.
The reaction was quenched with 12 μL 100% TCA. At this point, 10 μL of the D4 Ala (10.75
mM) was added. The lysate was vortexed briefly and centrifuged for 10 minutes at 14000 rpm to
remove precipitated protein and cellular debris. 100 μL of supernatant was transferred to a new
tube, and to that 3 μL of 10 M NaOH was added to neutralize the supernatant. The solution was
vortexed and centrifuged again for another 10 minutes at 14000 rpm.

41
After the final spin, the supernatant was derivatized as described in the TMS
derivatization procedure. The samples were dried down under nitrogen, redissolved in MOX,
incubated for one hour, and derivatized with BSTFA during a second one hour incubation. Given
the content of the samples, it is understandable that they were rather viscous, so the samples were
diluted with 100 μL of cyclohexane and analyzed by GC-MS. This initial effort was unsuccessful
however. After several repeats, there were no peak responses on the MS. Simply drying down the
lysate with the entire reaction mixture and then derivatizing was not a viable option. An
extraction procedure had to be devised that would allow us to retrieve the compounds of interest
for analysis and remove the buffers and salts from the samples, which we hypothesize were one
of the main sources of interference with the analysis.
2.4.1 Optimization of Metabolite Extraction
The work to establish a successful metabolite extraction was done in the context of liver
tissue lysates and 100μL “mock lysate reactions” that included all the chemical components and
steps of the lysate preparation so as to not to excessively use up the mice livers. The mock
reactions contained the same amount of lysis buffer, reaction buffer, and water as the actual prep.
To each mock reaction was added a mix of 6 standards representing some of the key compounds
we hoped to detect in the true analyses. The standard mix consisted of 5μL each: pyruvate (25
mM stock), glyoxylate (25 mM stock), hydroxyproline (25 mM stock), 4-OH-Glu (24.8 mM
stock), and HOG (29.3 mM stock) as well as 10μL of the D4-Ala internal standard (10.75 mM
stock).
The ultimate goal was to establish a method that would work for liver lysates and urine
samples, and with these mock reactions I tested each part of the prep to determine where the
problem with the analyses was. One of the first hypotheses was that the lysis buffer with 0.1%
Triton-X-100 may cause an issue even with the extraction. I used mock reactions to test the lysis

42
buffer vs. 1X PBS with two extraction schemes. The first extraction was a 1 mL mixture of water,
methanol and chloroform (1:2:1) to extract polar metabolites from tissue before any derivatization
steps were taken, detailed in Pan et al25
. In short, the tissue would be prepped (or the mock
reaction set up) and the extraction would take place immediately, followed by drying down the
aqueous layer, re-dissolving in MOX and following with BSTFA. The second extraction scheme
was a 1 mL mixture of ethyl acetate and 2-propanol (5:1) that was utilized after the
methoximation step, detailed in Clifford-Mobley et al10
. In this reaction scenario, the lysate prep
or mock reaction was prepared; the sample was incubated with methoxyamine; then the sample
was subjected to the extraction, after which the ethyl acetate layer is dried down and redissolved
in BSTFA and pyridine. A new MOX formulation had to be made for this procedure to reach the
appropriate concentration; instead of pyridine (which was necessary for anhydrous conditions
required by BSTFA) the new MOX, called MOX(aq) is dissolved in water and raised to pH 9
with ammonia, with a final concentration of 0.48 M.
There was no success with the water, methanol and chloroform mixture, and limited
success (only glyoxylate and pyruvate were consistently detected) with the ethyl acetate, propanol
(EAP) mix with PBS but not with the lysis buffer containing detergent, so I elected to continue
trying to optimize the EAP mix with the plan to use PBS in the lysate prep. One of the next
hypotheses was that the TCA and subsequent neutralization may also be a source of error. The
MOX reaction is only functional at pH 7-9, so I ran the reaction and found that quench and
neutralization steps from the previous assay left the pH too low for proper methoximation. After
adjusting the pH with additional 10 M NaOH after quenching, the resulting chromatograms
showed no improvement, either in the mock reactions or when I tested this new procedure on
tissue, so I sought another extraction scheme. I also chose to eliminate the TCA and subsequent
neutralization entirely, opting instead to heat inactivate the reactions in 100oC water then
centrifuge at 14000 rpm for ten minutes to precipitate protein and cellular debris.

43
The extraction mix that proved to be effective and consistent was the 1.2 mL mix of
water, chloroform and acetonitrile (1:2:1), adapted from Feng et al26
. The compounds were
extracted from mock reactions and tissue lysates after the MOX(aq) step. The reactions were
added to the reaction solvent mix in 4 mL screw top vials, vortexed for 30 seconds, centrifuged
for 5 minutes at 3000 rpm to aid phase separation, and the aqueous layer was removed to another
vial and dried down. The dried downs layer was then re-dissolved in 75 μL of BSTFA and 20 μL
of pyridine and incubated at 60oC for another 40 minutes. This extraction mixture proved to be
successful with liver tissue and with urine, fulfilling the goal of simplifying and streamlining the
analysis of PH3 metabolites in urine and liver tissue with one methodology on one analytical
system.
2.4.2 Optimization of Liver Lysate Preparation
With an extraction solvent mix that worked consistently, the whole method was almost
complete. The first liver lysate prep that was tested with the final extraction procedure was
prepared using PBS and the full standard mix to ensure they could all be recovered from actual
tissue extracts, performed in triplicate. The lysate prep using PBS was successful, and a
representative chromatogram of one of the replicates is shown in Figure 8. However, there was
still a question of the efficacy of using the lysis buffer with the final extraction. Mock reactions
using PBS and the lysis buffer were tested with the extraction, and they both showed positive
results (Figure 9) indicating that the buffer itself was probably not the problem with the other
extractions.
Since the lysis buffer worked, I decided to use it rather than PBS for the final liver lysate
experiments. Homogenizing the tissue with the dounce using PBS as the buffer was effective, but
there was more certainty that all of the cells would be lysed using lysis buffer that contained
Triton X-100. With the buffer and extraction solvent mix optimized, I decided to test whether or
not the heat inactivation and subsequent centrifugation were necessary. I hypothesized that the
44
reaction could be directly added to the extraction solvent mix, vortexed and centrifuged as
previously mentioned, and the aqueous layer would still contain all of the relevant compounds.
Proceeding directly to extraction would save time and streamline the process by skipping the need
to heat the reaction in boiling water, centrifuging for 10 minutes and methoximating the
supernatant. Instead, the metabolites could be extracted as soon as the incubation was done, dried
down and redissolved in the original MOX solution (15 mg/mL in pyridine). Extracting the
metabolites directly proved to be effective compared to heat inactivating and proceeding as
described. Liver lysates were prepared, incubated with HOG, and treated with both methods. The
extraction efficiency appeared to be superior for all of the metabolites when the liver was
subjected to extraction directly after incubation instead of heating and proceeding (Figure 10).

45
Figure 8. Representative chromatogram of a liver lysate prepared using PBS with standards.
The lysate was prepared and incubated with the full standard mix to verify the findings of the mock
reactions. Each capital “T” at the top of the display represents a target compound identification.
From left to right, the targets are 1:glyoxylate, 2:pyruvate, 3:D4 Ala, 4:oxalate (not part of the
standard mix; detected in the lysate), 5:Hyp, 6:Hyp (fully derivatized), 7:4-OH-Glu and 8:HOG. The
T over HOG is the selected target for which the fragment pattern is displayed below.
1
2
3 4
5
6
7 8
46
Figure 9. Chromatograms of mock reactions performed with lysis buffer and PBS. Displayed
are the TICs of the standard mix mock reaction with PBS (top) and with the lysis buffer (bottom).
From left to right, each target is 1:glyoxylate, 2:pyruvate, 3:D4 Ala, 4:Hyp, 5:Hyp (fully
derivatized), 6:4-OH-Glu and 7:HOG.
2
2
1
1
3
3 4
4
5
5
6
7
6 7
47
Figure 10. Comparison between heat inactivation and direct extraction. The display shows the
TICs for a lysate prep that was extracted directly after incubation (top) compared to an identically
prepared and incubated lysate that was heat inactivated, centrifuged and extracted as described
(bottom). From left to right, each target is pyruvate, D4 Ala, oxalate and HOG.

48
2.5 Urinalysis of PH3 Mouse Model Urine
Urine is one of most frequently used biological samples for studying metabolomics;
almost any disease state that alters metabolic activity or output can exhibit differences in urine
content18
. All PH variants have altered urine metabolite profiles; aside from increased oxalate
output in all 3 PH types, PH1 patients exhibit a diagnostically significant rise in urine glycolate,
and PH2 patients exhibit a significant rise in urine glycerate22
. PH3 patients also have altered
urine metabolic output, including elevated HOG and DHG10
. Since the metabolism of PH3 is still
not fully understood, I wanted to establish a method that could encompass urine and liver tissue
lysates. GC-MS has been used extensively in the analysis of urine, so method development would
not be as extensive of a process. However, there were two concerns to address. First, I had to
establish that the acetonitrile: water: chloroform extraction would work similarly to extract the
PH3 relevant metabolites from urine as it did with chemical stock mock reactions and liver
lysates. Second, there is an inconsistency in the literature about the use of urease to remove urea
content before analysis. Many sources intimate that urease is necessary while other published
urinalysis protocols make no mention of using urease pre-treatment. As part of the method
development I set out to discern whether or not a urease treatment is necessary in the context of
analyzing PH3 metabolites.
2.5.1 Optimization of Urinalysis Method
WT and HOGA KO mouse urine were collected by the Holmes lab at UAB. For the first
set of experiments, 20 μL of WT urine plus 10 μL D4 Ala was treated with 40 μL of MOX(aq)
and incubated for an hour at 60oC. The metabolites were extracted as described with the
acetonitrile: water: chloroform mix, and the aqueous layer was dried down then redissolved in 75
μL BSTFA and 20 μL pyridine and incubated for 40 minutes at 60oC. The derivatization and

49
extraction procedure was successful with the urine; metabolite peaks were successfully detected
(Figure 11).
To determine whether or not urease treatment was necessary, urease from Jack beans
(Canavalia ensiformis) was obtained from Sigma-Aldrich (15,000-50,000 U/g). According to
Shoemaker and Elliot, approximately 125 U/mL of urine is sufficient for urease treatment32
.
Enzyme powder is added directly to the urine sample and incubated. Using 20 μL samples of
urine should require approximately 2.5 U of urease which would, assuming the low end of
Sigma-Aldrich’s estimate, require less than 0.5 mg of enzyme powder. Approximately 0.5 mg of
powder was added to each urine sample plus 10 μL D4 Ala (10.75 mM stock). The urine samples
were incubated with urease at 37oC for 30 minutes then derivatized and extracted as described
above.
The urease treatment did improve peak return, and the treatment eliminated the urea and
improved the baseline clarity of the TIC (Figure 11). Since the resulting chromatograms were
cleaner, had better peak resolution and the urease treatment was not a laborious procedure, I
decided to incorporate it into the final urinalysis of PH3 urine.
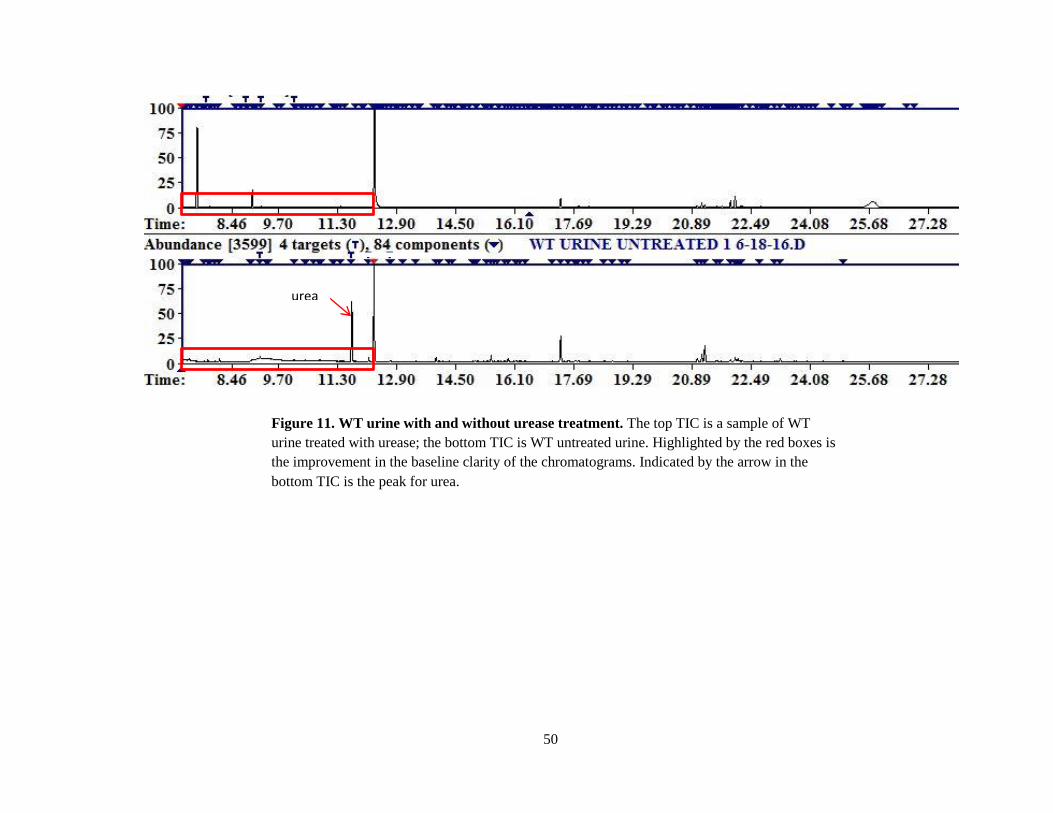
50
Figure 11. WT urine with and without urease treatment. The top TIC is a sample of WT
urine treated with urease; the bottom TIC is WT untreated urine. Highlighted by the red boxes is
the improvement in the baseline clarity of the chromatograms. Indicated by the arrow in the
bottom TIC is the peak for urea.
urea
51
3 Analysis of PH3 Metabolites in Liver and Urine
With the analytical method established, I set out to conduct a final set of experiments in
WT and HOGA KO liver and urine. These were small scale experiments intended only as a
starting point for the basis of future studies. From the Holmes lab at UAB, I received frozen liver
tissue and urine collected from WT and HOGA KO C57BL/6 mice, before and after being fed an
oxalate-free, 1% Hyp diet. The livers and urines were processed and analyzed to detect a change
in metabolism between the WT and KO mice.
3.1 Liver Lysate Analysis Final Method
The first phase of the liver lysate preparation was carried out as previously described. In a
pitre dish, a piece of frozen WT or KO mouse liver after 1% Hyp diet was cut and weighed, then
rinsed with lysis buffer, minced into small pieces and rinsed twice again with lysis buffer. The
liver was then transferred to a size C glass dounce on ice along with 9 parts lysis buffer/1 part
protease inhibitors and lysed for 10 minutes with the dounce on ice until a homogenous lysate
was formed. The lysate was transferred to a sterile 15 mL tube on ice from which 1:10, 1:50 and
1:100 dilutions were made with the lysis buffer to determine protein concentration via a
Coomassie Bradford Protein Assay using bovine serum albumin (BSA) standards from 25-2000
μg/mL.
The lysate reaction was standardized to 100 μL, and the volume of lysate necessary for
200 μg of protein was determined at the beginning of each experiment. Triplicate reactions were
prepared in 1.5 mL eppendorf tubes; the components of the reactions were: 10 μL of HOG (29.3
mM stock), 13
C5,15
N-Hyp (28.7 mM stock), or 4-OH-Glu 24.8 mM stock), 30 μL of reaction
buffer, 10 μL of oxobutyrate (3.39 mM stock) and the determined volume of lysate. The reactions
were then brough up to the final volume of 100 μL with nano-pure water. The reaction
incubations were increased from 30 minutes to 1 hour at 37oC. As a control for comparison to
lysate activity, identical reactions were prepared with active lysate and with lysate that had been

52
boiled for 30 seconds to eliminate enzyme activity. A qualitative change in lysate color from light
pink to dull beige after boiling was observed.
Following the incubations, reactions were transferred from the eppendorf tubes to 4 mL
screw top vials containing 1.2 mL of extraction solvent mix (1:2:1 water: acetonitrile:
chloroform); the samples were vortexed vigorously for 30 seconds to extract metabolites and
centrifuged at 3000 rpm for 5 minutes to aid phase separation. The aqueous layer was removed to
a separate vial and dried under a stream of nitrogen. At this point all the processing work was
moved to a fume hood because MOX and BSTFA are both toxic and volatile. The dried layer was
redissolved in 65 μL of MOX in pyridine and incubated for 1 hour at 60oC. Following the MOX
incubation, 75 μL of BSTFA were added to the samples, and they were incubated at 60oC for
another 40 minutes. The samples were then transferred to crimp top GC vials with 200 μL vial
inserts. The vials were sealed, loaded into the autosampler tray, and analyzed.
The GC-MS parameters: the oven was held at an initial temperature of 45oC for 2
minutes followed by a temperature ramp of 10oC/min up to 180
oC, where it was held for five
minutes. The temperature was ramped up again at 40oC/min to 220
oC where it was held for seven
minutes. The column carrier gas flow was a constant 0.9 mL He/min. The injection volume was 1
μL, and the inlet was operated in splitless mode at 150oC. The GC-MS interface was held at
250oC, and the quadrupole was held at 200
oC. The MS was operated in Scan/SIM co-acquisition
mode (solvent delay: 7 minutes; mass range: 25-500 amu; scan rate: 2.36 scans/sec).
3.2 Liver Lysate Results
For each lysate reaction, observed peaks were integrated and normalized to the
oxobutyrate peak area. Ratios of metabolite to oxobutyrate peak area and concentration were used
to calculate the concentration of metabolite peaks detected, for example (known oxobutyrate
concentration/oxobutyrate peak area):(unknown HOG concentration/HOG peak area). The
averages of calculations for WT and HOGA KO are shown in Table III. Many of the metabolites

53
detected in this study were quantifiable; however, some peaks fell below the limit of
quantification (LOQ) but were above the limit of detection (LOD). The limit of detection is the
smallest amount of an analyte that can be detected relative to the background noise of the
instrument; typically a signal-to-noise ratio of 3:1 is LOD. The LOQ is usually 3 times the
LOD15
.
In both WT and KO livers, oxalate was detectable only in lysates incubated with HOG.
There was not a significant difference in oxalate levels between WT and KO active lysates, nor
was there a significant difference in HOG levels between active and inactivated WT and KO. It
was hypothesized that there would be a significant difference in the concentrations of HOG and
oxalate seen in the liver. More importantly, an altered state of metabolism can be inferred by the
detection of pyruvate in WT HOG incubated livers but not in the KO HOG incubated livers
(Figure 12). This is consistent with previous metabolic findings in PH3. Normal HOGA produces
pyruvate and glyoxylate, whereas deficient HOGA causes HOG to be metabolized by some, as
yet unknown enzyme.
In the WT liver incubated with 4-OH-Glu, there were detectable peaks of pyruvate and
glycine. Conversely, in the KO liver incubated with 4-OH-Glu, glycine but not pyruvate, was
detected. Similar to the HOG incubated livers, there was not a significant difference between 4-
OH-Glu levels in WT and KO livers, nor was there an expectation that the levels would be
significantly different. Again, it is more important to note the inference of a possible altered state
of metabolism from the consistent detection of glycine contrasted with the varied detection of
pyruvate (Figure 13).
The 13
C,15
N-Hyp incubated livers showed similar oxoadipic acid levels as the other two
incubations and between WT and KO, and little else. The 13
C,15
N -Hyp was not detected, nor was
any other known metabolite. It is unclear at this time why the 13
C,15
N -Hyp was not detected.
In all 3 incubations for both WT and KO oxoadipic acid was detected, but there was no
significant difference in the levels of oxoadipic acid between WT and KO for any of the

54
incubations nor was there a significant difference between oxoadipic acid levels in between any
of the incubations in the same type of lysate. Oxoadipic acid is an intermediate in the catabolism
of lysine, and seems unlikely to have any bearing on PH3 since no experimental condition in this
study affected it in any significant way33
. However, oxoadipic has been problematic in previous
studies because it co-elutes with HOG on IC-MS, so the GC-MS method allows for precise
measurement of HOG without interference5.
There were two unknown peaks consistently detected in both WT and KO livers, with no
significant difference for either unknown between WT and KO livers with any incubation. I
queried MassBank with a peak search and tentatively identified the first unknown peak, RT =
10.28 min, as dihydrouracil (DHU). Without an in-house comparison to a standard, this cannot be
verified at this time, but the fragment patterns of the unknown peak from my analysis and the
MassBank query result are identical (Figure 14). Whether or not DHU has any relevance to PH3
is unknown. Since the samples are whole lysates, any compound in any organelle could just
happen to with the PH3 relevant compounds. The second peak, RT = 12.29 min, I also queried
against MassBank, and I have tentatively identified it as phosphate. Again, this cannot be verified
without an in-house comparison, but the fragment patterns are identical down to m/z 85. The
MassBank spectrum for phosphate was performed on a system set with a scan range of 85-500, so
the smaller fragments cannot be compared, but the rest of the fragments are a match (Figure 15).

55
Table III. Metabolites detected in liver lysates
Detection Quantitation (mM) Detection Quantitation (mM)
Oxoadipic acid + 1.04 + 1.16
Oxalate + 0.11 + 0.076
HOG + 1.34 + 0.95
Pyruvate + NQ _
Oxoadipic acid + 1.64 + 1.38
Glycine + NQ + NQ
4-OH-Glu + 0.63 + 0.71
Pyruvate + NQ _
Oxoadipic acid + 0.62 + 1.822
13C,
15N –Hyp _ _
WT HOGA KO
HOG (1.46 mM)
4-OH-Glu (1.24 mM)
13C,
15N-Hyp (1.44 mM)
This table summarizes the metabolites detected and quantified in the final liver lysate samples.
Brackets on the right indicate the incubation for which findings in both WT and HOGA KO samples
are listed, and the concentrations of HOG, Hyp and 4-OH-Glu in the reactions are listed in
parenthesis. Any metabolite that was detected is indicated with a “+” sign, and average of the
replicate quantifications is listed. Detected, but unquantifiable, peaks are listed as “+” and NQ for
“Not Quantifiable.” Compounds that are noted with a “-“ were not detected. It should be noted that
one outlier was deleted for this analysis: one oxalate quantification from HOG incubated WT lysate
was removed.

56
Figure 12. WT vs HOGA KO liver lysates incubated with HOG. In the top TIC (WT) can be
seen one extra target on the left when compared to the bottom TIC (HOGA KO); this peak, target
1, is pyruvate. The other numbered targets in both TICs are: 2:oxobutyrate, 3:oxoadipic acid,
4:oxalate, 5:DHU, 6: phosphate and 7:HOG.
1
2 4
3 5 7
2
3
4
5 7
6
6
57
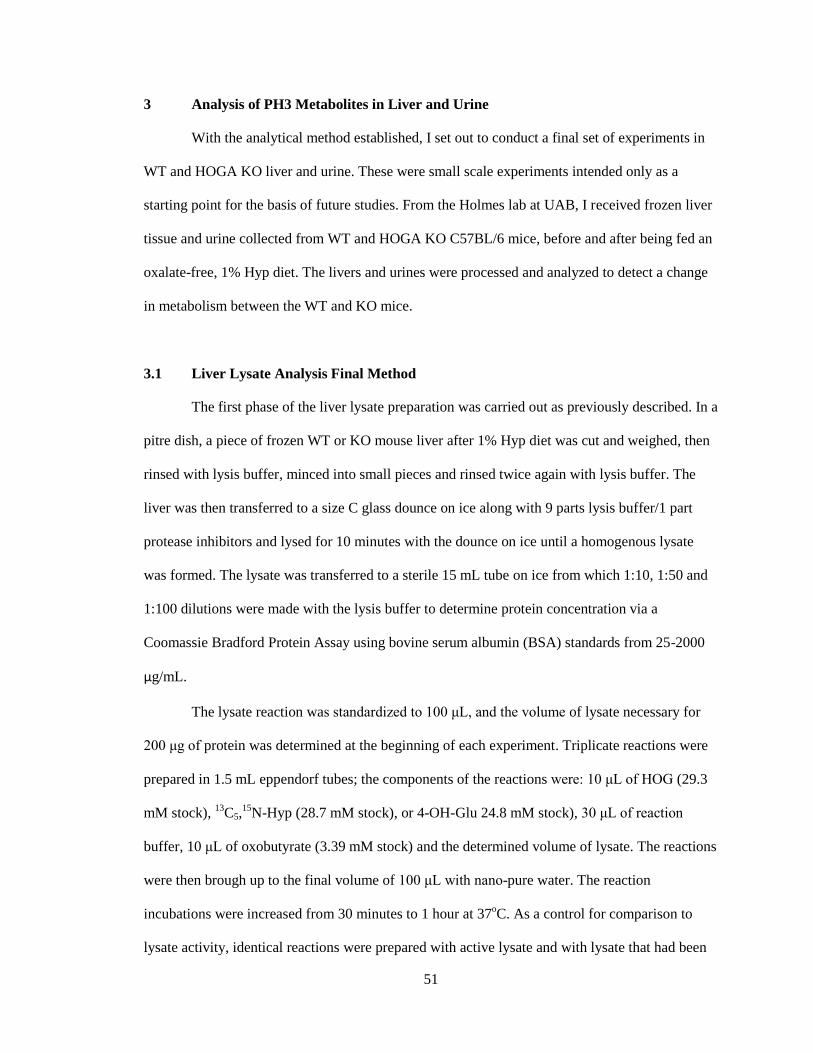
Figure 13. WT vs HOGA KO liver lysates incubated with 4-OH-Glu. In the top TIC (WT)
again is a peak indicating detectable pyruvate (target 1) that is lacking in the HOGA KO liver. The
other numbered targets are: 2:oxobutyrate, 3:oxoadipic acid, 4:DHU, 5:phosphate, 6:glycine and
7:4-OH-Glu.
2
2
1
3
3
4
4
5
5 6
6
7
7

58
73
147
190 205 220 235 174 160
100
133
Figure 14. Unknown peak at 10.28 minutes, identified as dihydrouracil. At the top of the
figure is the fragment pattern captured from the first unknown in the lysates; at the bottom is
the best matched query result from MassBank. The only noticeable difference is the relative
abundance of the 100 m/z fragment compared to the 133 and 147 in MassBank’s
chromatogram and mine.
59
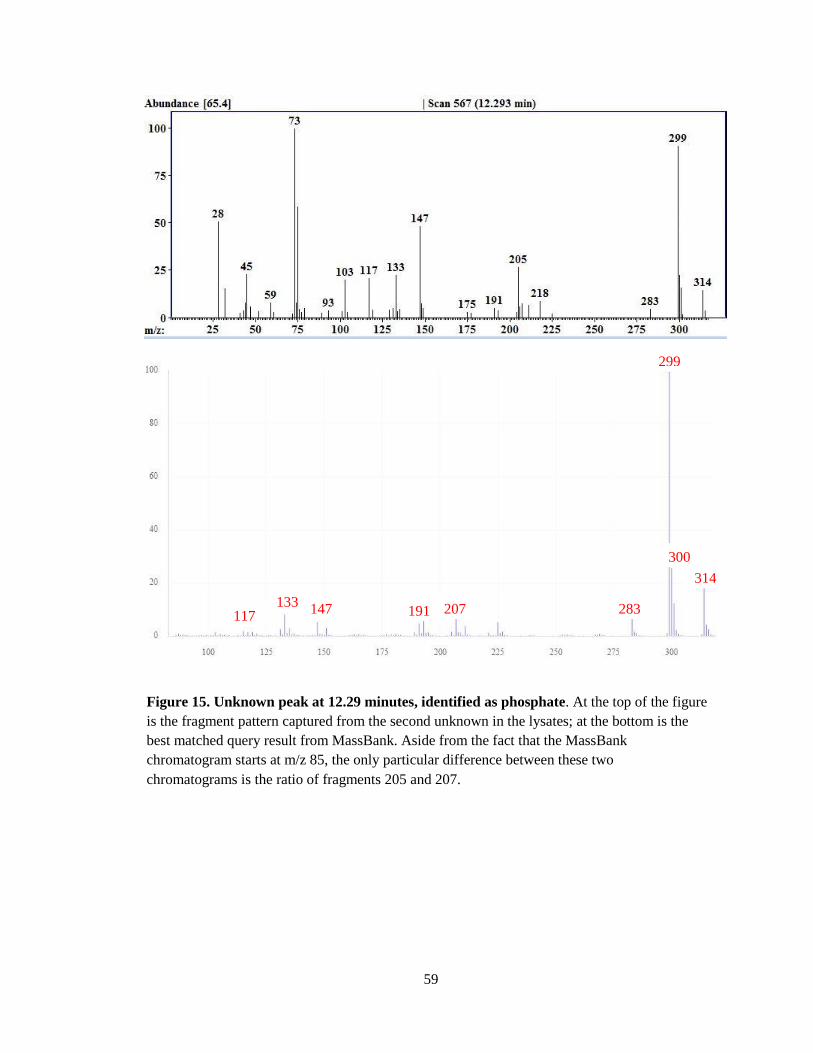
314
300
299
283 117
133 147 191 207
Figure 15. Unknown peak at 12.29 minutes, identified as phosphate. At the top of the figure
is the fragment pattern captured from the second unknown in the lysates; at the bottom is the
best matched query result from MassBank. Aside from the fact that the MassBank
chromatogram starts at m/z 85, the only particular difference between these two
chromatograms is the ratio of fragments 205 and 207.

60
3.3 Urinalysis Final Method
Duplicate 20 μL samples of WT and HOGA KO mouse urine, pre and post 1% Hyp diet
were analyzed. The samples were spiked with 10 μL of D4 Ala and then incubated for 30 minutes
at 37oC with urease. To the samples was then added 40 μL MOX(aq), and they were incubated at
60oC for one hour. The metabolites were then extracted in the same 1.2 mL water: acetonitrile:
chloroform extraction solvent mix as the liver lysates; the aqueous layer was dried under nitrogen
and redissolved in 75 μL BSTFA and 20 μL pyridine and incubated at 60oC for 40 minutes. The
derivatized samples were transferred to GC vials, capped and loaded onto the autosampler tray.
The samples were analyzed with the same GC-MS parameters listed in the liver lysate final
method.
One consistent issue with urine was the detection of D4 Ala. The peak area of D4 Ala,
when it was even detectable, was widely variable. The peak area of D4 Ala in liver was also quite
variable, but there had not an issue with detection. It was only once I started the urine
experiments that I examined the peak areas among the small batches of previous liver samples
and noticed how variable D4 Ala had really been. It has been noted that TMS derivatives of
amino acids can be relatively unstable, so I switched the internal standard from D4 Ala to sodium
2-oxobutyrate, obtained from Sigma-Aldrich24
. The small organic acid proved to be much more
reliable and consistent than D4 Ala, so for that reason, I used oxobutyrate final liver lysates as
well. Due to urine supply constraints the final urinalysis could not be repeated with oxobutyrate
as the internal standard.
An examination of D4 Ala peaks compared to oxobutyrate peaks revealed a large
discrepancy between the reliability of the two compounds used as internal standards. The average
of 22 peaks integrated for D4 Ala gave a peak area average of 4210846 arbitrary units +/- 40.4%.
Conversely, analysis of 32 peaks of oxobutyrate gave an average peak area of 702526 arbitrary
units +/- 13.7%.

61
3.4 Urinalysis Results
Since the urine was analyzed in duplicate, and with an unreliable internal standard, there
was no quantification, but there were important qualitative findings. In the WT and HOGA pre-
Hyp diet, the only metabolite detected was a small peak of glycolate. In WT post-diet, there was
also a glycolate detected. Most importantly, in the KO post diet but not the WT post diet, 4-OH-
Glu and DHG were detected. Finding DHG in KO urine is consistent with previous studies
analyzing the metabolism of PH310
` The DHG was not previously in the AMDIS library because a
standard of DHG is not sold by any chemical supply company, but it was identified based on
comparison to the DHG chromatogram shown in the supplementary material by Belostotsky et al.
(Figure 16) and corroborated by the qualification and quantification ions listed by Clifford-
Mobley et al6, 10
. Phosphate was also detected with substantially larger peaks in urine than in the
liver. In addition, two other unknown peaks were detected in the KO post-diet urine eluting near
4-OH-Glu and DHG, but these were not comparable to any hits in MassBank.

62
Figure 16. HOGA KO urine post 1% Hyp diet. At the top of
the figure is the AMDIS display of one of the samples of
HOGA KO post 1% Hyp diet with the fragment pattern of the
target identified as DHG shown in the middle and the DHG
identification reference from Belostotsky et al shown at the
bottom6. Numbered targets are 1:glycolate, 2: phosphate, 3:4-
OH-Glu, 4:DHG. Indicated by arrows are two additional
unknowns that have not been identified yet.
1
2
3 4
?
?

63
4 Discussion
GC-MS was chosen as the analytical technique for this thesis because of its exceptional
analytical sensitivity and the variety of compounds that can be analyzed with a simple chemical
derivatization. GC-MS offers the most complete analysis using one method to separate all the
metabolites and analyze them on one system. The first step was to build a spectral library of
derivatized compounds, so a derivatization method had to be worked out. MCF seemed promising
initially, but the inability to analyze HOG with MCF derivatization prompted the switch to TMS
derivatization using BSTFA. After this first part of the study was accomplished, optimization of
the sample preparation and GC-MS analysis parameters had to be done. Liver tissue from WT
and HOGA KO mice fed a 1% Hyp diet and urine from WT and HOGA KO mice before and
after being fed the 1% Hyp diet were analyzed to detect metabolic changes. The goal of this thesis
was to develop the analytical method and obtain preliminary results as method confirmation. This
method will be used in subsequent projects analyzing liver, urine and potentially blood and
plasma as well for metabolic analysis of PH3.
The results of the preliminary experiments conducted in this thesis were not conclusive,
but they were an important first step using the newly established method. Metabolites were
detected in liver and urine, including two unknowns that have been tentatively identified as well
as two other unknown peaks in post-diet HOGA KO urine that have yet to be identified. These
two compounds elute near 4-OH-Glu and DHG; it will be interesting to see what they are and to
determine if they have any relevance to PH3 which is quite possible because they, unlike the
oxoadipic acid, were clearly affected by different experimental conditions.
It is not surprising that the oxalate levels were relatively unchanged between WT and
HOGA KO livers. It was also expected that HOG and 4-OH-Glu would not be significantly
different between the WT and KO livers. Relative to the protein amount (200 μg), the incubation
standards in low mM stock range are very high. It is conceivable that the enzyme activity just did
not process enough of the HOG or 4-OH-Glu to make a significant impact on the chromatograms.
64
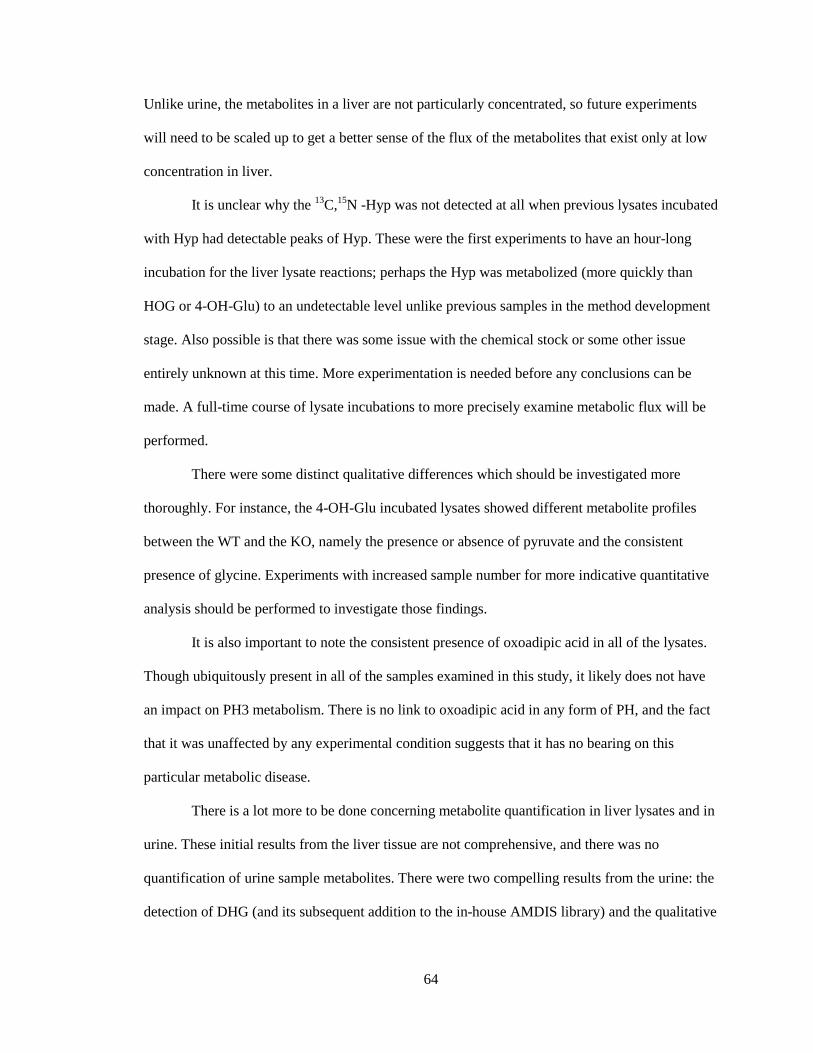
Unlike urine, the metabolites in a liver are not particularly concentrated, so future experiments
will need to be scaled up to get a better sense of the flux of the metabolites that exist only at low
concentration in liver.
It is unclear why the 13
C,15
N -Hyp was not detected at all when previous lysates incubated
with Hyp had detectable peaks of Hyp. These were the first experiments to have an hour-long
incubation for the liver lysate reactions; perhaps the Hyp was metabolized (more quickly than
HOG or 4-OH-Glu) to an undetectable level unlike previous samples in the method development
stage. Also possible is that there was some issue with the chemical stock or some other issue
entirely unknown at this time. More experimentation is needed before any conclusions can be
made. A full-time course of lysate incubations to more precisely examine metabolic flux will be
performed.
There were some distinct qualitative differences which should be investigated more
thoroughly. For instance, the 4-OH-Glu incubated lysates showed different metabolite profiles
between the WT and the KO, namely the presence or absence of pyruvate and the consistent
presence of glycine. Experiments with increased sample number for more indicative quantitative
analysis should be performed to investigate those findings.
It is also important to note the consistent presence of oxoadipic acid in all of the lysates.
Though ubiquitously present in all of the samples examined in this study, it likely does not have
an impact on PH3 metabolism. There is no link to oxoadipic acid in any form of PH, and the fact
that it was unaffected by any experimental condition suggests that it has no bearing on this
particular metabolic disease.
There is a lot more to be done concerning metabolite quantification in liver lysates and in
urine. These initial results from the liver tissue are not comprehensive, and there was no
quantification of urine sample metabolites. There were two compelling results from the urine: the
detection of DHG (and its subsequent addition to the in-house AMDIS library) and the qualitative

65
differences between WT and HOGA KO post 1% Hyp diet urine, namely the detection of
glycolate, 4-OH-Glu and DHG in KO urine and only glycolate in WT urine.
The preliminary results obtained in this study were compelling, if not comprehensive, and
more importantly, the method for extracting and analyzing these metabolites was shown to work
with urine and liver tissue. In addition to incubation time-courses, varying total protein amount in
lysate and scaling up the whole reaction, it is possible that another extraction solvent mix would
be yield a more efficient extraction. On the whole, the method has proven to be effective, and the
goal of this study was accomplished.
66
Conclusions
Primary hyperoxaluria is an inborn error of glyoxylate metabolism with three variants,
three distinct enzyme deficiencies. The hallmark of any of the three forms of PH is the
overproduction of oxalate, an excellent chelator of calcium. The organ most affected by these
conditions is the kidney where oxalate is normally excreted as it cannot be metabolized by
mammals. Most glyoxylate metabolism occurs in the liver which also suffers significant damage
as a result of PH. Of the three PH variants, PH3 is the most recently characterized and the least
understood. The goal of this thesis was to develop a method for analyzing the metabolic
consequences of PH3 in liver tissue and urine using GC-MS.
HOGA normally catalyzes the splitting of HOG to form glyoxylate and pyruvate. HOG
itself can be directly excreted, so the source of excess glyoxylate which is subsequently oxidized
to oxalate by LDH is unclear. In order to analyze the metabolic changes between WT and HOGA
KO liver and urine, a method had to be developed which could encompass analysis of both
sample sources with one method.
After extensive trial and error and method optimization, I developed an analytical method
for processing liver and urine, extracting PH3 relevant metabolites and analyzing them with GC-
MS. The development of the analytical method was accomplished; all of the relevant metabolites
can be extracted from liver and urine, chromatographically separated to elute without overlap
from the GC, and then analyzed by MS.
67
References
1. Hoppe, B., Beck, B.B., & Milliner, D.S. The primary hyperoxalurias. Kidney Int. 75, 1264-
1271 (2009)
2. Riedel, T.J. et al. Structural and biochemical studies of human 4-hydroxy-2-oxoglutarate
aldolase: implications for hydroxyproline metabolism in primary hyperoxaluria. Plos ONE 6,
e26021 (2011).
3. Salido, E. et al. Primary hyperoxalurias: disorders of glyoxylate detoxification. Biochim
Biophys Acta. 1822, 1453-1464 (2012).
4. Riedel, T.J. et al. 4-hydroxy-2-oxoglutarate aldolase inactivity in primary hyperoxaluria type
3 and glyoxylate reductase inhibition. Biochim Biophys Acta. 1822, 1544-1552 (2012).
5. Knight, J. et al. Hydroxyproline metabolism in mouse models of primary hyperoxaluria. Am J
Physiol Renal Physiol. 302, F688-F693 (2012).
6. Belostotsky, R., Pitt, J.J., & Frishberg, Y. Primary hyperoxaluria type III-a model for
studying perturbations in glyoxylate metabolism. J Mol Med. 90, 1497-1504 (2012).
7. Fargue, S., Rumsby, G., & Danpure, C.J. Multiple mechanisms of action of pyroxidine in
primary hyperoxaluria type 1. Biochim Biophys Acta. 1832, 1776-1783 (2013).
8. Cochat, P., & Rumsby, G. Primary hyperoxaluria. New Engl J Med. 369, 649-658 (2013).
9. Beck, B.B. et al. Novel findings in patients with primary hyperoxaluria type III and
implications for advanced molecular testing strategies. Eur J Hum Genet. 21, 162-172 (2013).
10. Clifford-Mobley, O., Hewitt, L., & Rumsby, G. Simultaneous analysis of urinary metabolites
for preliminary identification of primary hyperoxaluria. Ann Cli Biochem OnlineFirst. (2015).
11. Chan, E.C.Y., Pasikanti, K.K., & Nicholson, J.K. Global urinary metabolic profiling
procedures using gas chromatography-mass spectrometry. Nat Prot. 6, 1483-1499 (2011).
68
12. Villas-Boas, S.G. et al. Simultaneous analysis of amino and nonamino organic acids as
methyl chloroformate derivatives using gas chromatography-mass spectrometry. Anal
Biochem. 322, 134-138 (2003).
13. Villas-Boas, S.G. et al. Alkylation or silylation for analysis of amino and non-amino organic
acids by GC-MS?. Metab. 3, 4-20 (2011).
14. Pasikanti, K.K., Ho, P.C., & Chan, E.C.Y. Gas chromatography/mass spectrometry in
metabolic profiling of biological fluids. J Chromatogr B. 871, 202-211 (2008).
15. Greaves, J. & Roboz, J. Mass Spectrometry for the Novice. CRC Press, Taylor & Francis
Group. (2014).
16. Smart, K.F. et al. Analytical platform for metabolome analysis of microbial cells using
methyl chloroformate derivatization followed by gas chromatography-mass spectrometry. Nat
Prot. 5, 1709-1729 (2010).
17. Kokko, B. & Edmondson, S. O-Methylhydroxylamine: Encyclopedia of Reagents for Organic
Synthesis. John Wiley & Sons. (2001).
18. Zhang, Q. et al. GC/MS analysis of the rat urine for metabonomic research. J Chromatogr B.
854, 20-25 (2007).
19. Christou, C. et al. GC-MS analysis of organic acids in human urine in clinical settings: a
study of derivatization and other analytical parameters. J Chromatogr B. 964, 195-201
(2014).
20. Belostotsky, R. et al. Mutations in DHDPSL are responsible for primary hyperoxaluria type
III. Am J Hum Genet. 87, 392-399 (2010).
21. Beck, B.B. et al. Hyperoxaluria and systemic oxalosis: an update on current therapy and
future directions. Expert Opin Investig Drugs. 22, 117-129 (2013).
22. Lorenzo, V., Torres, A., & Salido, E. Primary hyperoxaluria. Nefrologia. 34, 398-412 (2014).
23. Milliner, D.S., Harris, P.C., & Lieske, J.C. Primary hyperoxaluria type 3. GeneReviews -
NCBI Bookshelf. Online posting (2015).
69
24. Bergstrom, K., Gurtler, J., & Blomstrand, R. Trimethylsilylation of amino acids. Anal
Biochem. 34, 74-87 (1970).
25. Pan, L. et al. An optimized procedure for metabonomic analysis of rat liver tissue using gas
chromatography/time-of-flight mass spectrometry. J Pharmaceut Biomed. 52, 589-596
(2010).
26. Feng, et al. Metabonomic analysis of liver tissue from BALB/c mice with d-
galactosamine/lipopolysaccharide-induced acute hepatic failure. BMC Gastero. 13, Online
publication (2013).
27. Li, X. et al. Metabolism of 13
C5-hydroxyproline in mouse models of primary hyperoxaluria
and its inhibition by RNAi therapeutics targeting liver glycolate oxidase and hydroxyproline
dehydrogenase. Biochim Biophys Acta. 1862, 233-239 (2016).
28. Petarulo, M. et al. High-performance liquid chromatographic assay for l-glyceric acid in body
fluids. Applications in primary hyperoxaluria type 2. Clin Chim Acta. 211, 143-153 (1992).
29. Kuhara, T. Diagnosis and monitoring of inborn errors of metabolism using urease-
pretreatment of urine, isotope dilution, and gas chromatography-mass spectrometry. J
Chromatogr B. 781, 497-517 (2002).
30. Qiu, Y. et al. Application of ethyl chloroformate derivatization for gas chromatography-mass
spectrometry based metabonomic profiling. Anal Chim Acta. 583, 277-283 (2007).
31. Husek, P. Chloroformates in gas chromatography as general purpose derivatizing agents. J
Chromatogr B. 717, 57-91 (1998).
32. Shoemaker, J.D., & Elliot, W.H. Automated screening of urine samples for carbohydrates,
organic and amino acids after treatment with urease. J Chromatogr. 562, 125-138 (1991).
33. Hagen, J. et al. Genetic basis of alpha-aminoadipic and alpha-ketoadipic aciduria. J Inherit
Metab Dis. 38, 873-879 (2015).
70
Curriculum Vitae
Jordan Everett
Education
Wake Forest University School of Medicine MS in Biomedical Sciences 8/14-8/16
GPA 3.73
Loyola University New Orleans 8/10-5/14
BS (Honors), magna cum laude,
Major specific GPA: 3.86, Cumulative GPA 3.7
Relevant Work Experience
Wake Forest School of Medicine, Winston Salem, NC
Graduate Student, Lab of Dr. Todd Lowther, Department of Biochemistry 8/14-8/16
Developed procedure to extract metabolites relevant to primary hyperoxaluria type 3
(PH3) from liver tissue and urine for subsequent chemical derivatization.
Standardized derivatization procedure for PH3 metabolites to produce samples suitable
for GC-MS analysis.
Established GC-MS analytical parameters for analysis of PH3 metabolites.
Conducted preliminary investigation of metabolic conditions of PH3 in liver and urine.
Loyola University New Orleans, New Orleans, LA
Biology Undergraduate Honors Thesis Research , Lab of Dr. Kimberlee Mix 1/13-5/14
Conducted independent reseach on expression kinetics of orphan nuclear receptor 4A2
(NR4A2) in two mouse models of rheumatoid arthritis.
Designed cell scoring technique for data analysis.
Taught scoring technique to volunteers and coordinated data collection.
Teaching Assistant, Cells and Heredity Lab Course 8/13-5/14
Assisted professors with instructing students in lab techniques and basic understanding of
principles being investigated.
Graded quizzes and lab notebooks.
Maintained lab equipment and safety, organized materials before each lab session and
ensured proper cleanup after each lab.
Research Assistant, Summer Collaborative Outreach and Reseach Experience 6/12-8/12
Performed in vitro experiments investigating NR4A2 expression kinetics in human
synoviocytes. Taught basic lab techniques in the context of an ongoing research project to local area
high school students in the Outreach portion of the program.

71
Writing Tutor, Writing Across the Curriculum 8/11-5/12
Specializing in scientific topics and assignments, I helped students with elements of good
writing for their coursework such as proper format, voice, sentence structure and essay
structure.
Publications and Presentations
Jordan Everett, Ellen Gravallese and Kimberlee Mix. NR4A2 Expression Patterns in Mouse
Models of Rheumatoid Arthritis. J Stud Res. 4, 136-143 (2015).
Joseph McCoy, Dana E. Walkenhorst, Keegan S. McCauley, Hiba Elasaar, Jordan Everett and
Kimberlee Mix. Orphan Nuclear Receptor NR4A2 induces transcription of the
immunomodulatory peptide hormone prolactin. J Inflamm. 12, online (2015).
Jordan Everett. NR4A2 Expression Patterns in Mouse Models of Rheumatoid Arthritis,
Undergraduate Honors Thesis. Loyola University New Orleans Biology Department (2014).
“Change of NR4A2 Expression Patterns in Mouse Models of Rheumatoid Arthritis” Honors
Thesis Research Presentation, Loyola Undergraduate Research Symposium (April 2014).
“Nuclear Receptor 4A2 Expression in Mouse Models of Rheumatoid Arthritis Indicates
Influential Role in Disease” Tulane University BEAST Research Symposium (October 2013).
“NR4A2 Protein Expression During the Progression of Arthritis” Loyola University President’s
Open House (April 2013).
“Kinetics of NR4A2 and Prolactin Gene Expression in Human Synoviocytes” Tulane University
BEAST Research Symposium (October 2012).
“Downstream Effects of NR4A2 in Arthritis” SCORE Participant Final Presentation (July 2012).
Awards and Honors
Half Tuition Scholarship, Wake Forest University Graduate School, received 5/14
Graduation Honors in Biology, Loyola University, received 5/14
St. Joseph Pignatelli Award for Outstanding Biology Major, Loyola University, received 5/14
Loyola University Dean’s List, 8 consecutive semesters, 8/10-5/14
Rev. Pierre Teilhard de Chardin Award for Best Undergraduate Essay, received 5/14
Top Presenter, Loyola University Undergraduate Research Symposium, received 4/14
Top Scorer on Loyola University Biology Department Senior Exit Exam, received 4/14
Ignatian Scholarship, Full Academic Scholarship, Loyola University, received 5/10

72
Professional and Student Memberships
Beta Beta Beta National Biological Honors Society, Loyola University
Loyola University Dean’s Student Advisory Committee, Primary Representative of the Biology
Department
Loyola University Dean’s Faculty Excellence Award Committee, Primary Representative of the
College of Natural Sciences
Loyola University Honors Program
Loyola University Health Professions Organization