Embed Size (px)
DESCRIPTION
Getting Better at Chronic Care (GBACC) in North Queensland: a cluster RCT of community health worker care co-ordination in remote FNQ settings Robyn McDermott, Barbara Schmidt, Cilla Preece , Vickie Owens, Sean Taylor, Adrian Esterman PHC RIS Conference, Canberra July 2014. - PowerPoint PPT Presentation
Citation preview
Getting Better at Chronic Care (GBACC) in North Queensland: a cluster RCT of community health worker
care co-ordination in remote FNQ settings
Robyn McDermott, Barbara Schmidt, Cilla Preece, Vickie Owens, Sean Taylor, Adrian Esterman
PHC RIS Conference, Canberra July 2014
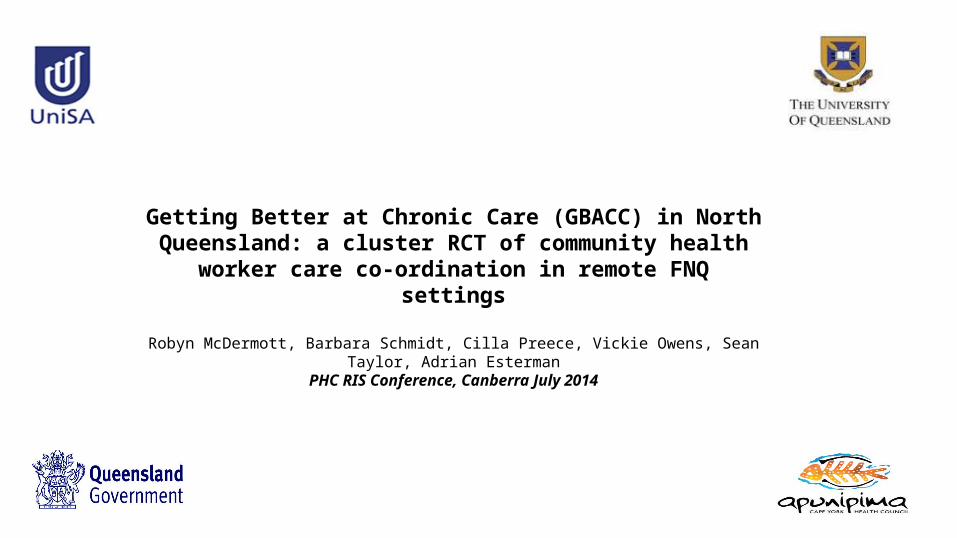
Aim: To evaluate the impact of intensive case management for adults with poorly controlled diabetes and other complex conditions, by local Health Workers
Design: Cluster RCT over 18 months and mixed methods evaluation over the subsequent 18 months, 2011-2015Setting: 12 remote FNQ communities in 3 Health Service Districts and 213 participants with poorly controlled diabetes and significant comorbiditiesInclusion criteria: Established diabetes in adults, HbA1c >= 8.5%, significant comorbiditiesResults of Phase 1 (RCT): Significant improvement in some care processes and HbA1c and LDL-C at 18 months. No change in smoking. Significant implementation failure in intervention sites.
GBACC: mixed methods evaluation in 3 phases
Phase 3 (May 2014 – June 2015)• E
conomic analysis
• Rollout of model

12 Participating Communities*Intervention sites in phase 1 (randomly allocated)
Torres and NPA HHS• Badu*• Bamaga• Injinoo*• New Mapoon• Seisia• Umagico*
Cape York HHS• Kowanyama*• Mapoon*• NapranumCairns and Hinterland HHS• Mareeba (Mulungu)• Mossman Gorge (ACYHC)*• Yarrabah (GYHS)
PHASE 1:
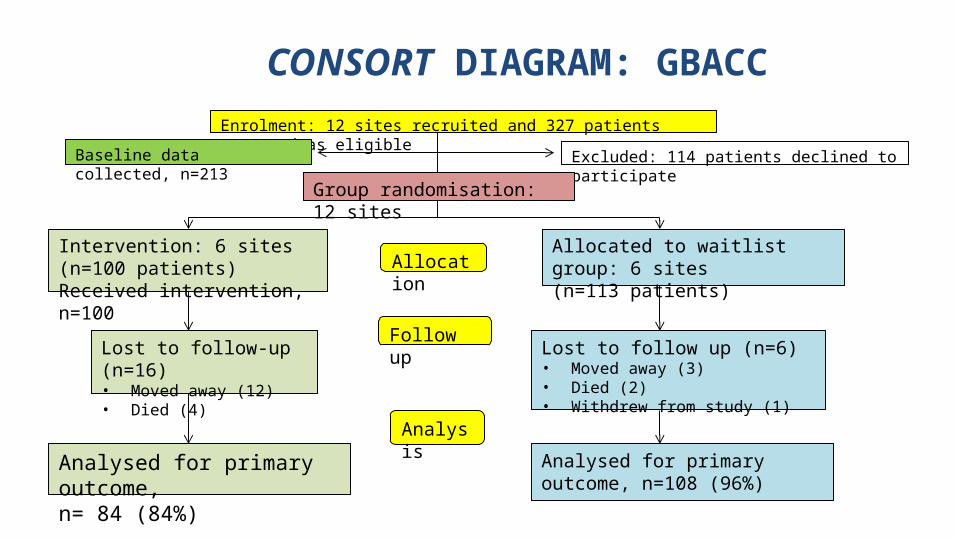
CONSCONSORT DIAGRAM: GBACC RCT)
Enrolment: 12 sites recruited and 327 patients assessed as eligible
Excluded: 114 patients declined to participate
Group randomisation: 12 sites
AllocationIntervention: 6 sites (n=100 patients)Received intervention, n=100
Allocated to waitlist group: 6 sites(n=113 patients)
Follow upLost to follow-up (n=16)• Moved away (12)• Died (4)
Lost to follow up (n=6)• Moved away (3)• Died (2)• Withdrew from study (1)
Analysis
Analysed for primary outcome, n=108 (96%)
Analysed for primary outcome, n= 84 (84%)
Baseline data collected, n=213

KEY FINDINGS AT BASELINE
Demography of participants
• Mean age of participants is 47.6 years
• 2/3 of participants are women
• After randomization there was no clinical difference between the intervention and control site participants

Baseline socio-demographic characteristics of study participants (SD or %)
Control (95% CI) Intervention (95% CI) All (95%CI) p-value
Number of participants 113 100 213 Mean age (years) 47.8 (46.2-49.5) 47.9 (45.8-50.0) 47.9 (46.6-49.2) 0.948
Number (%) women 66.4 (57.6-75.2) 58.0 (48.2-67.8) 62.4 (55.9-69.0) 0.208
Unemployed (%) 52.2 (42.9-61.5) 40.0 (30.3-49.7) 46.5 (39.7-53.2) 0.204
Did not complete 12 years education (%) 61.9 (52.9-71.0) 73.0 (64.2-81.8) 67.1 (60.8-73.5) 0.344
Median (IQR) household income 17420 (12480-33800) 20215 (13585-31200) 18200 (13000-32500) 0.598
“Not enough money for food” (%) 40.7 (31.6-49.9) 37.0 (27.4-46.6) 39.0 (32.4-45.6) 0.580
Median score (IQR) TOFLA 90.0 (81.1-94.1) 80.6 (64.9-89.0) 86.1 (71.5-92.1) <0.001
No of people per household median (IQR) 5 (3-7) 4 (3-7) 4 (3-7) 0.608
Median AQoL mental health score (IQR) max=1 0.93 (0.89-0.98) 0.93 (0.91-0.94) 0.93 (0.89-0.95) 0.688
Current smoker (%) 37.6 (28.4-46.8) 40.2 (30.3-50.1) 38.8 (32.1-45.5) 0.231
Mean BMI (kg/m2)* 33.0 (31.2-34.9) 31.9 (29.9-33.9) 32.5 (31.1-33.8) 0.434
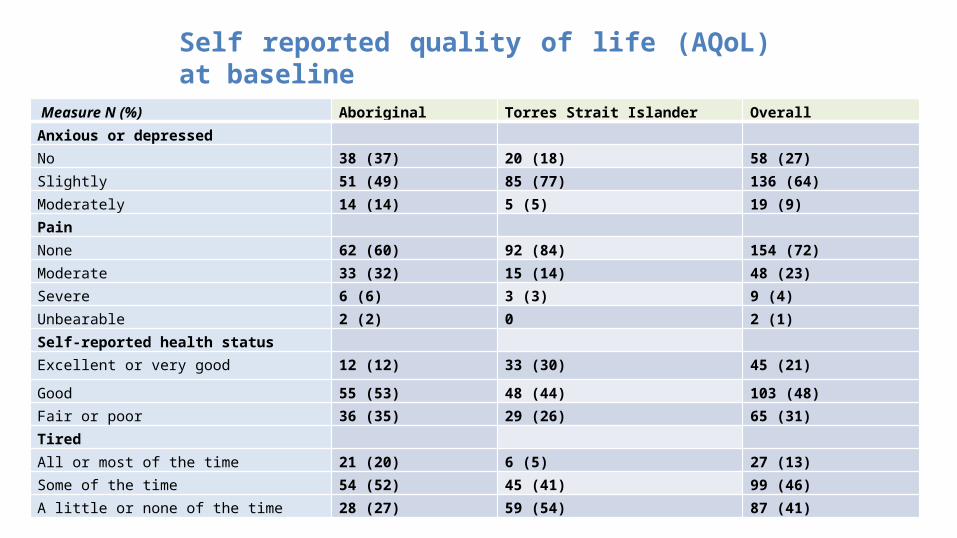
Measure N (%) Aboriginal Torres Strait Islander Overall Anxious or depressed No 38 (37) 20 (18) 58 (27)Slightly 51 (49) 85 (77) 136 (64)Moderately 14 (14) 5 (5) 19 (9)Pain None 62 (60) 92 (84) 154 (72)Moderate 33 (32) 15 (14) 48 (23)Severe 6 (6) 3 (3) 9 (4)Unbearable 2 (2) 0 2 (1)Self-reported health status Excellent or very good 12 (12) 33 (30) 45 (21)
Good 55 (53) 48 (44) 103 (48)Fair or poor 36 (35) 29 (26) 65 (31)Tired All or most of the time 21 (20) 6 (5) 27 (13)Some of the time 54 (52) 45 (41) 99 (46)A little or none of the time 28 (27) 59 (54) 87 (41)
BASELINE CHARACTERISTICSSelf reported - Quality of Life
Self reported quality of life (AQoL) at baseline f Life
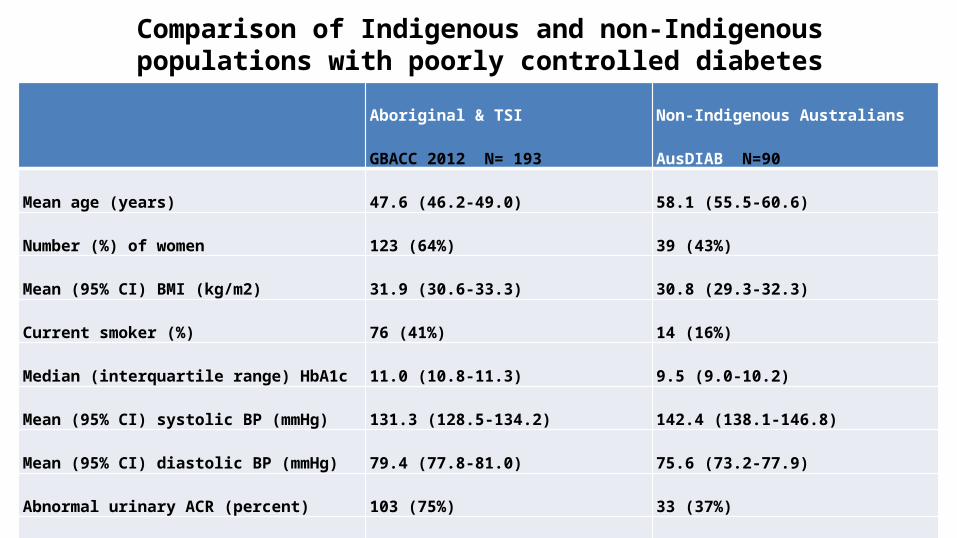
Comparison of Indigenous and non-Indigenous populations with poorly controlled diabetes
Aboriginal & TSI
GBACC 2012 N= 193
Non-Indigenous Australians AusDIAB
N=90
Mean age (years) 47.6 (46.2-49.0) 58.1 (55.5-60.6)
Number (%) of women 123 (64%) 39 (43%)
Mean (95% CI) BMI (kg/m2) 31.9 (30.6-33.3) 30.8 (29.3-32.3)
Current smoker (%) 76 (41%) 14 (16%)
Median (interquartile range) HbA1c 11.0 (10.8-11.3) 9.5 (9.0-10.2)
Mean (95% CI) systolic BP (mmHg) 131.3 (128.5-134.2) 142.4 (138.1-146.8)
Mean (95% CI) diastolic BP (mmHg) 79.4 (77.8-81.0) 75.6 (73.2-77.9)
Abnormal urinary ACR (percent) 103 (75%) 33 (37%)
Normal renal function 36 (27%) 49 (54%)

Comparison of Indigenous and non-Indigenous populations with poorly controlled diabetes: Lipid profiles
Aboriginal & TSI
N= 193
Non-Indigenous Australians
N=90
Mean (95% CI) total cholesterol (mmol/L) 4.6 (4.4-4.8) 5.6 (5.3-5.8)
Mean (95% CI) HDL-cholesterol (mmol/L) 0.98 (0.83-1.12) 1.2 (1.1-1.3)
Total cholesterol: HDL-cholesterol ratio 5.3 (5.0-5.7) 4.9 (4.6-5.2)
Median (IQR) triglyceride (mmol/L) 2.0 (1.2-3.1) 2.0 (1.2-3.0)
Dyslipidaemia (%) 144 (95) 85 (94)
Proportion of diabetics with HbA1c≥8.5% 34% 10%
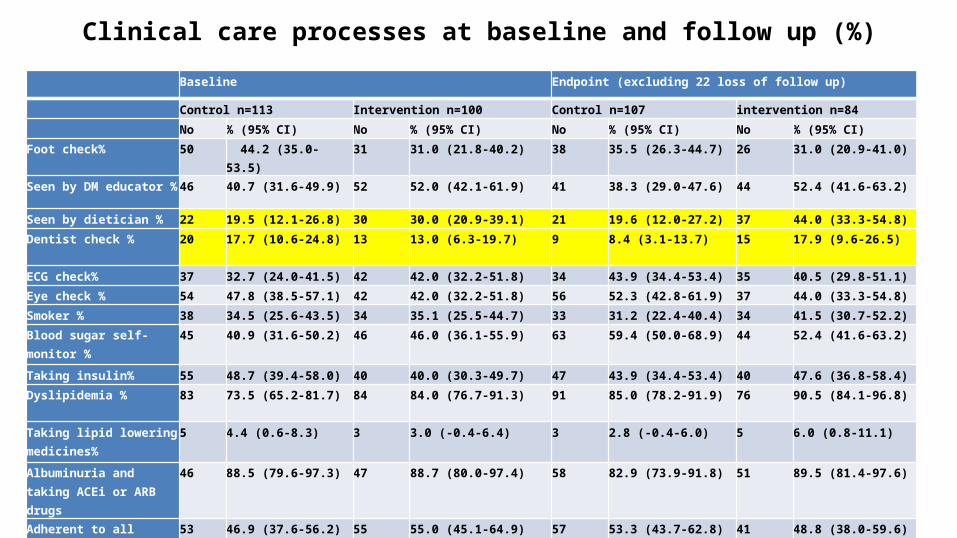
Clinical care processes at baseline and follow up (%) Baseline Endpoint (excluding 22 loss of follow up)
Control n=113 Intervention n=100 Control n=107 intervention n=84
No % (95% CI) No % (95% CI) No % (95% CI) No % (95% CI)
Foot check% 50 44.2 (35.0-53.5) 31 31.0 (21.8-40.2) 38 35.5 (26.3-44.7) 26 31.0 (20.9-41.0)
Seen by DM educator % 46 40.7 (31.6-49.9) 52 52.0 (42.1-61.9) 41 38.3 (29.0-47.6) 44 52.4 (41.6-63.2)
Seen by dietician % 22 19.5 (12.1-26.8) 30 30.0 (20.9-39.1) 21 19.6 (12.0-27.2) 37 44.0 (33.3-54.8)
Dentist check % 20 17.7 (10.6-24.8) 13 13.0 (6.3-19.7) 9 8.4 (3.1-13.7) 15 17.9 (9.6-26.5)
ECG check% 37 32.7 (24.0-41.5) 42 42.0 (32.2-51.8) 34 43.9 (34.4-53.4) 35 40.5 (29.8-51.1)
Eye check % 54 47.8 (38.5-57.1) 42 42.0 (32.2-51.8) 56 52.3 (42.8-61.9) 37 44.0 (33.3-54.8)
Smoker % 38 34.5 (25.6-43.5) 34 35.1 (25.5-44.7) 33 31.2 (22.4-40.4) 34 41.5 (30.7-52.2)
Blood sugar self-monitor % 45 40.9 (31.6-50.2) 46 46.0 (36.1-55.9) 63 59.4 (50.0-68.9) 44 52.4 (41.6-63.2)
Taking insulin% 55 48.7 (39.4-58.0) 40 40.0 (30.3-49.7) 47 43.9 (34.4-53.4) 40 47.6 (36.8-58.4)
Dyslipidemia % 83 73.5 (65.2-81.7) 84 84.0 (76.7-91.3) 91 85.0 (78.2-91.9) 76 90.5 (84.1-96.8)
Taking lipid lowering medicines%
5 4.4 (0.6-8.3) 3 3.0 (-0.4-6.4) 3 2.8 (-0.4-6.0) 5 6.0 (0.8-11.1)
Albuminuria and taking ACEi or ARB drugs
46 88.5 (79.6-97.3) 47 88.7 (80.0-97.4) 58 82.9 (73.9-91.8) 51 89.5 (81.4-97.6)
Adherent to all medicines 53 46.9 (37.6-56.2) 55 55.0 (45.1-64.9) 57 53.3 (43.7-62.8) 41 48.8 (38.0-59.6)
Had Fluvax 50 44.2 (35.0-53.5) 66 66.0 (56.6-75.4) 51 47.7 (38.1-57.2) 50 59.5 (48.9-70.2)

HbA1c measures at baseline and follow-up by group, absolute values
Baseline Endpoint9.29.49.69.810
10.210.410.610.8
11
ControlIntervention

Clinical measures: 212 Indigenous adults with poorly controlled T2DM, baseline and follow-up at 18 months
Measure Baseline Endpoint (excluding 22 lost to follow up)
Control n=113 Intervention n=100 Control n=107 intervention n=84
No. Mean SD No. Mean SD No. Mean SD No. Mean SDHbA1c
113 10.6 1.87 99 10.8 2.0 105 10.3 2.2 84 9.8 2.3
Total Cholesterol
87 4.6 1.3 81 4.5 1.3 100 4.7 1.3 79 4.4 1.4
Trig
86 2.5 1.9 81 2.1 1.4 100 2.7 1.8 79 2.5 1.8
HDL
72 1.1 0.6 79 0.9 0.2 99 0.9 0.2 78 0.9 0.2
LDL
65 2.6 1.0 76 2.7 1.1 95 2.6 1.1 71 2.4 0.9
Weight
89 91.4 19.3 87 89.7 22.6 92 87.4 18.6 81 91.0 23.1

Did it work? (care processes)
Care process done
Control group n=113 Intervention group n=100
N % (95% CI) N % (95% CI)
GPMP 39 34.8 (25.9-43.7) 40 40.4 (30.6-50.2)
TCA 39 34.8 (25.9-43.7) 36 36.4 (26.8-45.9)
Care processes (n and % with GPMP, TCA done) at T3 for intervention vs control sites in GBACC among all the participants (N=213)
Intervention sites were slightly (26%) more likely to have implemented a GPMP at T3, however this did not reach statistical significance (Odds Ratio = 1.26, 95% confidence interval 0.72-2.22):

Implementation fidelity evaluation (measuring type 3 error) during Phase 1
• Major restructure in QH from 2012• Recruitment freeze• Lack of doctor engagement in care planning• Lack of inclusion of HWs as team users of Patient Information Systems• Since project commencement in the Torres/NPA in 2011 there have been 7 different
CEO/COOs, finally resolved with an amalgamation with CYHHS and a new CEO, who is yet to commence (due August 2014)
• No pharmacists to perform HMRs• Slow transition to Community Control in Cape York sites, with GBACC HWs unable
to access Patient Information Systems• GBACC HWs frequently used for general clinical roles in the absence of regular staff

Conclusions and lessons learned
• Even though the primary outcome was achieved (1% reduction in HbA1c), significant implementation failure in the 6 intervention sites was evident
• The addition of a HW to the team despite good training and skills and cultural competence, in the absence of overarching system change resulted in less than optimum clinical outcomes and low cost-effectiveness
• Pragmatic trials of complex interventions are always subject to unpredictable major impacts of the wider policy environment eg change of government and sweeping organisational change, which can overwhelm the trial effect through unintended implementation disruption
• Highlights the need for detailed implementation fidelity monitoring as part of the evaluation plan

AcknowledgementsThe GBACC project is funded by NHMRC Partnership project grant number 570149 with the Queensland GovernmentBarbara Schmidt is supported by the APHCRI CRE in Chronic Disease Prevention and Care in Rural and Remote Populations
The research reported in this presentation is partly a project of the Australian Primary Health Care Research Institute, which is supported by a grant from the Australian Government Department of Health, under the Primary Health Care Research, Evaluation and Development Strategy. The information and opinions contained in it do not necessarily reflect the views or policy of the Australian Primary Health Care Research Institute or the Australian Government Department of Health.