Embed Size (px)
Citation preview
Gaze fixation and the neural circuitry of face processingin autism
Kim M Dalton1,2, Brendon M Nacewicz2, Tom Johnstone2, Hillary S Schaefer2, Morton Ann Gernsbacher1,3,H H Goldsmith1,3, Andrew L Alexander1,2,4 & Richard J Davidson1–4
Diminished gaze fixation is one of the core features of autism and has been proposed to be associated with abnormalities in the
neural circuitry of affect. We tested this hypothesis in two separate studies using eye tracking while measuring functional brain
activity during facial discrimination tasks in individuals with autism and in typically developing individuals. Activation in the
fusiform gyrus and amygdala was strongly and positively correlated with the time spent fixating the eyes in the autistic group in
both studies, suggesting that diminished gaze fixation may account for the fusiform hypoactivation to faces commonly reported
in autism. In addition, variation in eye fixation within autistic individuals was strongly and positively associated with amygdala
activation across both studies, suggesting a heightened emotional response associated with gaze fixation in autism.
Autism is a pervasive developmental disorder associated with a uniqueprofile of social and emotional behavior. The core symptomatology ofautism highlights these deficits and includes diminished gaze fixation,lack of social or emotional reciprocity, and failure to develop age-appropriate peer relationships1,2. Recent studies have focused onattention to faces and face processing abilities in children with autism,because of the crucial importance of faces as a medium of socialcommunication among humans3–8. These studies demonstrate thatinattention to faces is an early developmental sign of autism that isapparent as early as 1 year of age9,10. In addition, many children withautism are delayed in early, face-related social milestones, such aslooking to another person’s face to reference that person’s reactions orto share their own experience of objects and events11,12. These findingsraise the possibility that abnormalities in the perception of faces andtheir communicative signals may contribute to the social impairmentthat characterizes autism.
Studies on brain function also show atypical patterns of brainactivation in individuals with autism when processing faces. Themost consistently reported and largest effect is in the fusiform gyrus,an area that is activated strongly during face processing in typicallydeveloping individuals but much less activated during these tasks inindividuals with autism-spectrum disorders13–16. Relatively little atten-tion has been devoted to circuitry that is more highly activated inindividuals with autism than in typically developing controls whenprocessing faces. We predicted that individuals with autism wouldshow hyperactivation in brain regions responsible for processingthreatening social and emotional cues. We thus expected the autisticindividuals to show hypoactivation in the fusiform gyrus along withhyperactivation in the amygdala in response to faces. For both of these
brain regions, we also predicted that time spent fixating the eye regionof the face would predict the magnitude of activation for the indivi-duals with autism.
Notably, to date, no study has yet reported on the relation betweengaze fixation and brain activation patterns during processing ofhuman faces in individuals with autism. We hypothesized thatdiminished gaze fixation is the proximal cause of the fusiform gyrushypoactivation commonly reported for individuals with autismwhen processing faces. We thus predicted that fusiform gyrus hypo-activation would be associated with the lesser time spent in fixatingon the eye region of faces by autistic individuals as compared withtypically developing controls. Moreover, we also predicted thatvariations in time spent fixating on the eye region of the face wouldstrongly predict amygdala activation in individuals with autism. To testthese hypotheses, we conducted two separate studies, which testedemotion discrimination (Study I) and facial recognition (Study II).In each of these studies, we presented photographs of human facesto individuals with autism and typically developing controls whilethey were in a magnetic resonance imaging (MRI) scanner, usingboth standardized and naturalistic unfamiliar faces and naturalisticfamiliar faces (Fig. 1). In both studies, activation in the fusiformgyrus was strongly and positively correlated with the amount oftime spent fixating the eye region in the autistic group, suggestingthat diminished gaze fixation may account for the fusiform hypoacti-vation in response to faces commonly reported in autism. In addition,variation in gaze fixation among autistic individuals was strongly andpositively associated with amygdala activation across both studies. Thissuggests that gaze fixation is associated with a heightened emotionalresponse in autism.
Published online 6 March 2005; doi:10.1038/nn1421
1Waisman Center and 2Waisman Laboratory for Brain Imaging and Behavior, University of Wisconsin, 1500 Highland Avenue, Madison, Wisconsin 53705-2280, USA.3Psychology Department, University of Wisconsin, 1202 West Johnson Street, Madison, Wisconsin 53706-1696, USA. 4Psychiatry Department, University of Wisconsin,6001 Research Park Boulevard, Madison, Wisconsin 53719, USA. Correspondence should be addressed to K.D. ([email protected]) or R.D. ([email protected]).
NATURE NEUROSCIENCE VOLUME 8 [ NUMBER 4 [ APRIL 2005 5 1 9
A R T I C L E S©
2005
Nat
ure
Pub
lishi
ng G
roup
ht
tp://
ww
w.n
atur
e.co
m/n
atur
eneu
rosc
ienc
e
RESULTS
Task accuracy and judgment time: Study I
Three of the individuals with autism performed the emotion discrimi-nation task at below chance level and therefore were not included in anyanalyses. The control group performed the emotion discriminationtask at a near-perfect level and gave significantly more correct responses(M (mean) ¼ 39.4 out of a total possible correct of 40, s.d. ¼ 0.79) thanthe autistic group (M ¼ 34.1, s.d. ¼ 7.52; t1,10 ¼ 2.34, P ¼ 0.04). Thegroup difference in accuracy was not a function of a speed-accuracytradeoff; individuals in the autistic group were marginally slower thancontrols (F1,21 ¼ 4.27, P ¼ 0.051). The autistic group took significantlylonger than the control group to decide whether the face was emotionalor neutral when the face was emotional (control M ¼ 1,110.9 ms,s.d. ¼ 182.3; autism M ¼ 1,329.8 ms, s.d. ¼ 206.6; t1,22 ¼ 2.75,P ¼ 0.01) and when it was oriented with eyes straight ahead toward theviewer (control M ¼ 1,194.1 ms, s.d. ¼ 243.7; autism M ¼ 1,413.1 ms,s.d. ¼ 247.3; t1,22 ¼ 2.18, P ¼ 0.04). There were no group differences injudgment time for the neutral faces or for faces quarter-turned witheyes away from the viewer. These findings suggest that although the taskwas more difficult for the autistic group, they were still able to performthe task with 85% accuracy. Furthermore, the fact that groups differedin judgment time for the emotional and directed-gaze faces but not forthe neutral or averted-gaze faces suggests that these differences areassociated with deficits in processing emotional cues from faces and inprocessing socially engaging faces, rather than deficits in face processingin general.
Task accuracy and judgment time: Study II
Response time and accuracy were not recorded for one of the controlindividuals and two of the individuals with autism because of mechan-ical error, so data from these individuals were not included in thisanalysis. These individuals were retained in all other analyses. Two ofthe individuals with autism performed the facial recognition task at orbelow chance level for the photos of familiar versus unfamiliar peoplebut performed with 90% and 100% accuracy for the photos of familiarversus unfamiliar objects, suggesting that they understood the task;therefore, they were retained in this and all other analyses. Weperformed all subsequent analyses a second time with these twoindividuals removed, and the results remained statistically significantin the same direction. The autistic group performed the task with 84%accuracy for the images of people and with 95% accuracy for theimages of objects, whereas the control group performed the task at nearthe highest possible score for both images of people (95% accuracy)and objects (98% accuracy). The group difference in accuracy was smallbut significant for images of people (t1,27 ¼ 2.14, P ¼ 0.04) but not
significant for images of objects (t1,27 ¼ 1.90, P ¼ 0.06). There wereno group differences in judgment time for images of either peopleor objects.
Gaze fixation: Study I
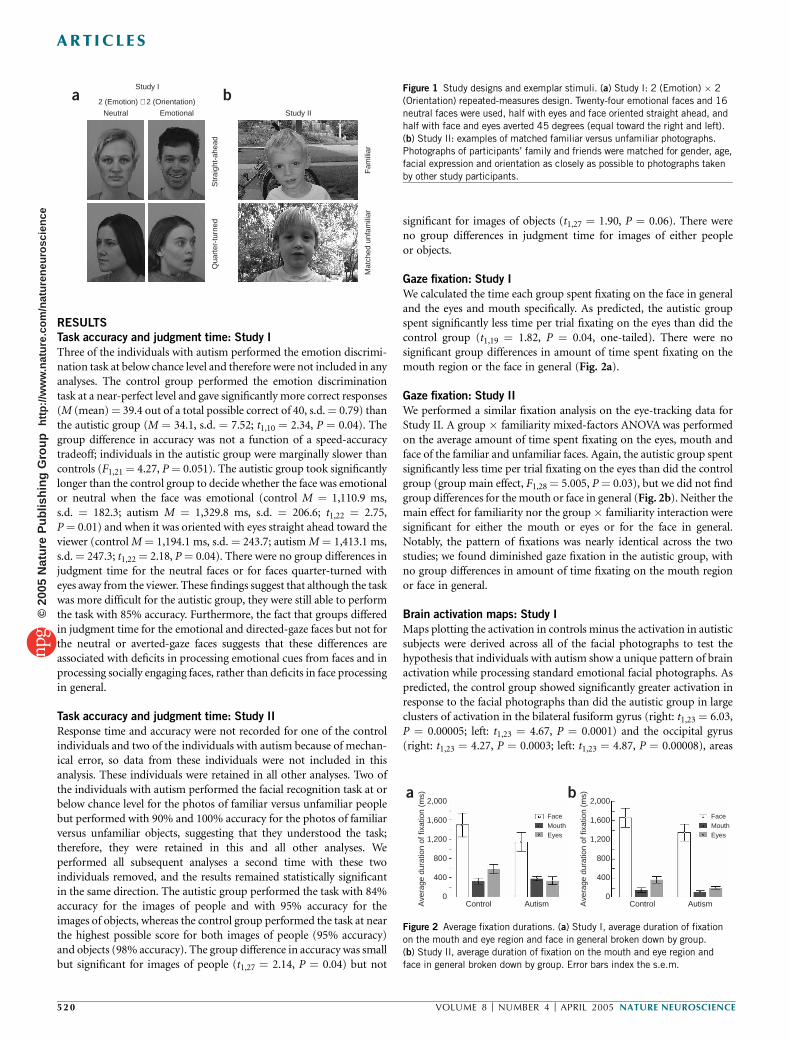
We calculated the time each group spent fixating on the face in generaland the eyes and mouth specifically. As predicted, the autistic groupspent significantly less time per trial fixating on the eyes than did thecontrol group (t1,19 ¼ 1.82, P ¼ 0.04, one-tailed). There were nosignificant group differences in amount of time spent fixating on themouth region or the face in general (Fig. 2a).
Gaze fixation: Study II
We performed a similar fixation analysis on the eye-tracking data forStudy II. A group � familiarity mixed-factors ANOVA was performedon the average amount of time spent fixating on the eyes, mouth andface of the familiar and unfamiliar faces. Again, the autistic group spentsignificantly less time per trial fixating on the eyes than did the controlgroup (group main effect, F1,28 ¼ 5.005, P ¼ 0.03), but we did not findgroup differences for the mouth or face in general (Fig. 2b). Neither themain effect for familiarity nor the group � familiarity interaction weresignificant for either the mouth or eyes or for the face in general.Notably, the pattern of fixations was nearly identical across the twostudies; we found diminished gaze fixation in the autistic group, withno group differences in amount of time fixating on the mouth regionor face in general.
Brain activation maps: Study I
Maps plotting the activation in controls minus the activation in autisticsubjects were derived across all of the facial photographs to test thehypothesis that individuals with autism show a unique pattern of brainactivation while processing standard emotional facial photographs. Aspredicted, the control group showed significantly greater activation inresponse to the facial photographs than did the autistic group in largeclusters of activation in the bilateral fusiform gyrus (right: t1,23 ¼ 6.03,P ¼ 0.00005; left: t1,23 ¼ 4.67, P ¼ 0.0001) and the occipital gyrus(right: t1,23 ¼ 4.27, P ¼ 0.0003; left: t1,23 ¼ 4.87, P ¼ 0.00008), areas
a bStudy I
Neutral Emotional
2 (Emotion) × 2 (Orientation)
Study II
Str
aigh
t-ah
ead
Qua
rter
-tur
ned
Mat
ched
unf
amili
arF
amili
ar
a2,000
1,600
1,200
800
400
0
2,000
1,600
Ave
rage
dur
atio
n of
fixa
tion
(ms)
Ave
rage
dur
atio
n of
fixa
tion
(ms)
1,200
800
400
0Control Autism Control
FaceMouthEyes
FaceMouthEyes
Autism
b
Figure 2 Average fixation durations. (a) Study I, average duration of fixation
on the mouth and eye region and face in general broken down by group.
(b) Study II, average duration of fixation on the mouth and eye region and
face in general broken down by group. Error bars index the s.e.m.
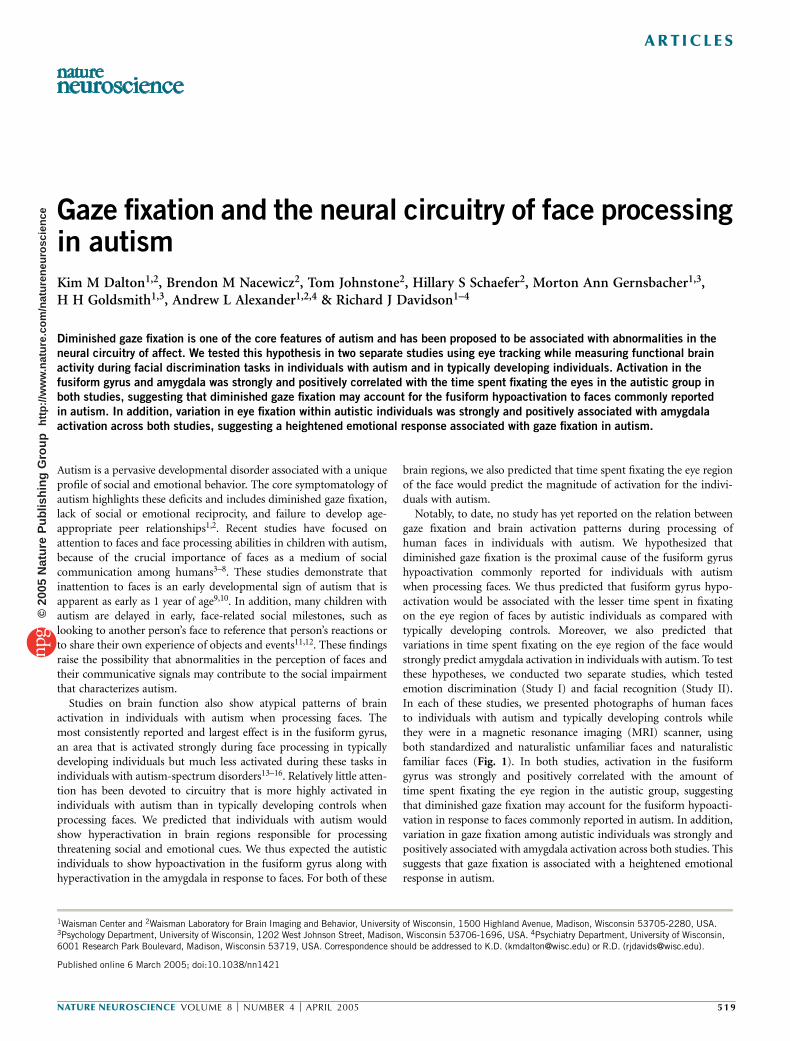
Figure 1 Study designs and exemplar stimuli. (a) Study I: 2 (Emotion) � 2
(Orientation) repeated-measures design. Twenty-four emotional faces and 16
neutral faces were used, half with eyes and face oriented straight ahead, and
half with face and eyes averted 45 degrees (equal toward the right and left).
(b) Study II: examples of matched familiar versus unfamiliar photographs.
Photographs of participants’ family and friends were matched for gender, age,
facial expression and orientation as closely as possible to photographs taken
by other study participants.
52 0 VOLUME 8 [ NUMBER 4 [ APRIL 2005 NATURE NEUROSCIENCE
A R T I C L E S©
2005
Nat
ure
Pub
lishi
ng G
roup
ht
tp://
ww
w.n
atur
e.co
m/n
atur
eneu
rosc
ienc
e
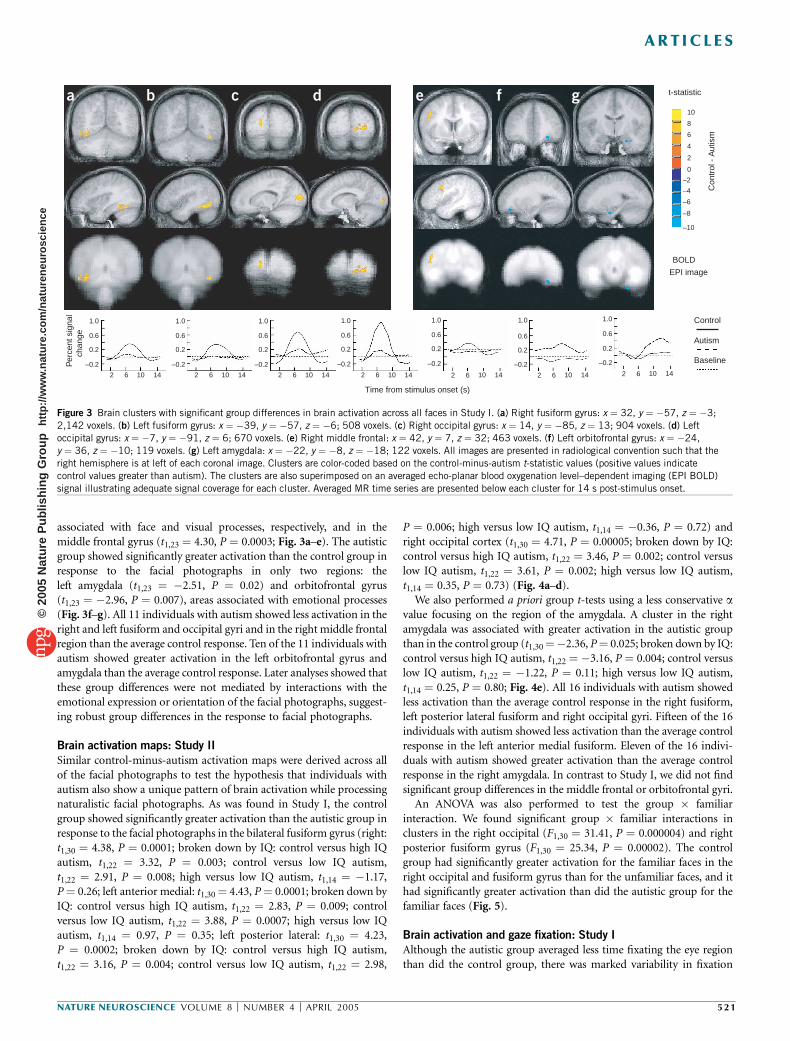
associated with face and visual processes, respectively, and in themiddle frontal gyrus (t1,23 ¼ 4.30, P ¼ 0.0003; Fig. 3a–e). The autisticgroup showed significantly greater activation than the control group inresponse to the facial photographs in only two regions: theleft amygdala (t1,23 ¼ �2.51, P ¼ 0.02) and orbitofrontal gyrus(t1,23 ¼ �2.96, P ¼ 0.007), areas associated with emotional processes(Fig. 3f–g). All 11 individuals with autism showed less activation in theright and left fusiform and occipital gyri and in the right middle frontalregion than the average control response. Ten of the 11 individuals withautism showed greater activation in the left orbitofrontal gyrus andamygdala than the average control response. Later analyses showed thatthese group differences were not mediated by interactions with theemotional expression or orientation of the facial photographs, suggest-ing robust group differences in the response to facial photographs.
Brain activation maps: Study II
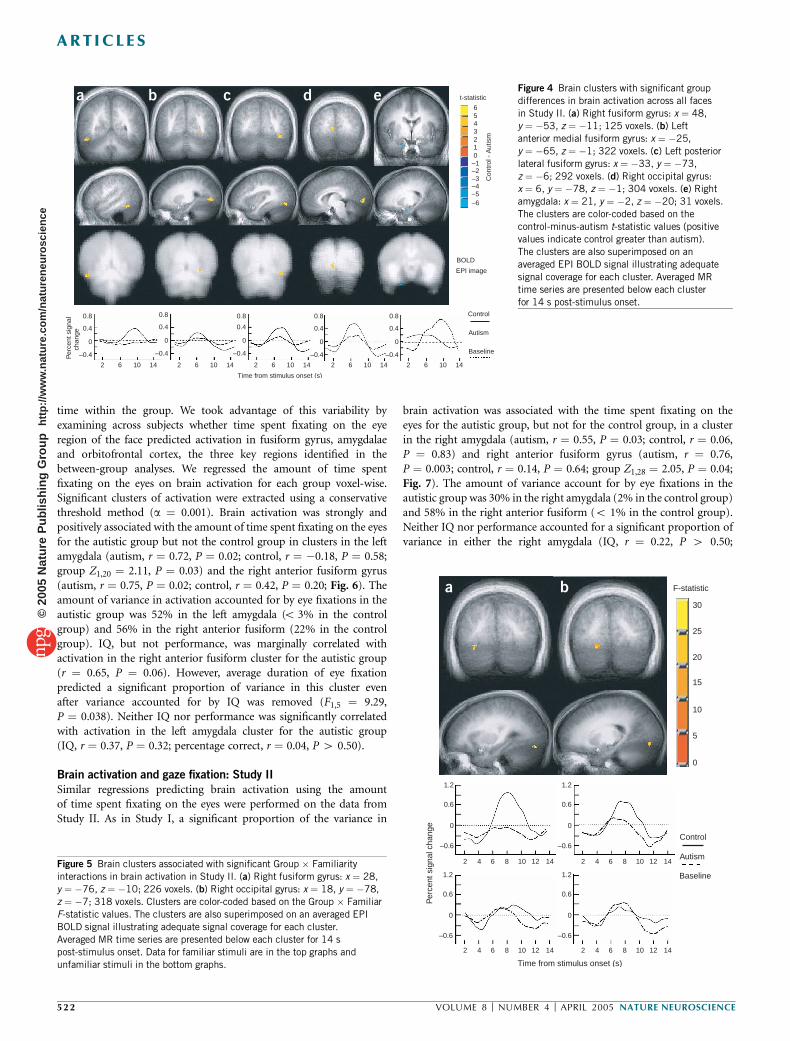
Similar control-minus-autism activation maps were derived across allof the facial photographs to test the hypothesis that individuals withautism also show a unique pattern of brain activation while processingnaturalistic facial photographs. As was found in Study I, the controlgroup showed significantly greater activation than the autistic group inresponse to the facial photographs in the bilateral fusiform gyrus (right:t1,30 ¼ 4.38, P ¼ 0.0001; broken down by IQ: control versus high IQautism, t1,22 ¼ 3.32, P ¼ 0.003; control versus low IQ autism,t1,22 ¼ 2.91, P ¼ 0.008; high versus low IQ autism, t1,14 ¼ �1.17,P ¼ 0.26; left anterior medial: t1,30 ¼ 4.43, P ¼ 0.0001; broken down byIQ: control versus high IQ autism, t1,22 ¼ 2.83, P ¼ 0.009; controlversus low IQ autism, t1,22 ¼ 3.88, P ¼ 0.0007; high versus low IQautism, t1,14 ¼ 0.97, P ¼ 0.35; left posterior lateral: t1,30 ¼ 4.23,P ¼ 0.0002; broken down by IQ: control versus high IQ autism,t1,22 ¼ 3.16, P ¼ 0.004; control versus low IQ autism, t1,22 ¼ 2.98,
P ¼ 0.006; high versus low IQ autism, t1,14 ¼ �0.36, P ¼ 0.72) andright occipital cortex (t1,30 ¼ 4.71, P ¼ 0.00005; broken down by IQ:control versus high IQ autism, t1,22 ¼ 3.46, P ¼ 0.002; control versuslow IQ autism, t1,22 ¼ 3.61, P ¼ 0.002; high versus low IQ autism,t1,14 ¼ 0.35, P ¼ 0.73) (Fig. 4a–d).
We also performed a priori group t-tests using a less conservative avalue focusing on the region of the amygdala. A cluster in the rightamygdala was associated with greater activation in the autistic groupthan in the control group (t1,30¼�2.36, P¼ 0.025; broken down by IQ:control versus high IQ autism, t1,22 ¼ �3.16, P ¼ 0.004; control versuslow IQ autism, t1,22 ¼ �1.22, P ¼ 0.11; high versus low IQ autism,t1,14 ¼ 0.25, P ¼ 0.80; Fig. 4e). All 16 individuals with autism showedless activation than the average control response in the right fusiform,left posterior lateral fusiform and right occipital gyri. Fifteen of the 16individuals with autism showed less activation than the average controlresponse in the left anterior medial fusiform. Eleven of the 16 indivi-duals with autism showed greater activation than the average controlresponse in the right amygdala. In contrast to Study I, we did not findsignificant group differences in the middle frontal or orbitofrontal gyri.
An ANOVA was also performed to test the group � familiarinteraction. We found significant group � familiar interactions inclusters in the right occipital (F1,30 ¼ 31.41, P ¼ 0.000004) and rightposterior fusiform gyrus (F1,30 ¼ 25.34, P ¼ 0.00002). The controlgroup had significantly greater activation for the familiar faces in theright occipital and fusiform gyrus than for the unfamiliar faces, and ithad significantly greater activation than did the autistic group for thefamiliar faces (Fig. 5).
Brain activation and gaze fixation: Study I
Although the autistic group averaged less time fixating the eye regionthan did the control group, there was marked variability in fixation
Control
Autism
BaselinePer
cent
sig
nal
chan
ge
141062141062141062141062141062 141062141062
–0.2
–10
0.2
0.6
1.0
–0.2
0.2
0.6
1.0
–0.2
0.2
0.6
1.0
–0.2
0.2
0.6
1.0
–0.2
0.2
0.6
1.0
–0.2
0.2
0.6
1.0
–0.2
0.2
0.6
1.0
Time from stimulus onset (s)
BOLD
EPI image
–8
–6
–4
–2
0
2
4
6
8
10
Con
trol
- A
utis
m
t-statistica b c d e f g
Figure 3 Brain clusters with significant group differences in brain activation across all faces in Study I. (a) Right fusiform gyrus: x ¼ 32, y ¼ �57, z ¼ �3;
2,142 voxels. (b) Left fusiform gyrus: x ¼ �39, y ¼ �57, z ¼ �6; 508 voxels. (c) Right occipital gyrus: x ¼ 14, y ¼ �85, z ¼ 13; 904 voxels. (d) Left
occipital gyrus: x ¼ �7, y ¼ �91, z ¼ 6; 670 voxels. (e) Right middle frontal: x ¼ 42, y ¼ 7, z ¼ 32; 463 voxels. (f) Left orbitofrontal gyrus: x ¼ �24,
y ¼ 36, z ¼ �10; 119 voxels. (g) Left amygdala: x ¼ �22, y ¼ �8, z ¼ �18; 122 voxels. All images are presented in radiological convention such that the
right hemisphere is at left of each coronal image. Clusters are color-coded based on the control-minus-autism t-statistic values (positive values indicate
control values greater than autism). The clusters are also superimposed on an averaged echo-planar blood oxygenation level–dependent imaging (EPI BOLD)
signal illustrating adequate signal coverage for each cluster. Averaged MR time series are presented below each cluster for 14 s post-stimulus onset.
NATURE NEUROSCIENCE VOLUME 8 [ NUMBER 4 [ APRIL 2005 5 2 1
A R T I C L E S©
2005
Nat
ure
Pub
lishi
ng G
roup
ht
tp://
ww
w.n
atur
e.co
m/n
atur
eneu
rosc
ienc
e
time within the group. We took advantage of this variability byexamining across subjects whether time spent fixating on the eyeregion of the face predicted activation in fusiform gyrus, amygdalaeand orbitofrontal cortex, the three key regions identified in thebetween-group analyses. We regressed the amount of time spentfixating on the eyes on brain activation for each group voxel-wise.Significant clusters of activation were extracted using a conservativethreshold method (a ¼ 0.001). Brain activation was strongly andpositively associated with the amount of time spent fixating on the eyesfor the autistic group but not the control group in clusters in the leftamygdala (autism, r ¼ 0.72, P ¼ 0.02; control, r ¼ �0.18, P ¼ 0.58;group Z1,20 ¼ 2.11, P ¼ 0.03) and the right anterior fusiform gyrus(autism, r ¼ 0.75, P ¼ 0.02; control, r ¼ 0.42, P ¼ 0.20; Fig. 6). Theamount of variance in activation accounted for by eye fixations in theautistic group was 52% in the left amygdala (o 3% in the controlgroup) and 56% in the right anterior fusiform (22% in the controlgroup). IQ, but not performance, was marginally correlated withactivation in the right anterior fusiform cluster for the autistic group(r ¼ 0.65, P ¼ 0.06). However, average duration of eye fixationpredicted a significant proportion of variance in this cluster evenafter variance accounted for by IQ was removed (F1,5 ¼ 9.29,P ¼ 0.038). Neither IQ nor performance was significantly correlatedwith activation in the left amygdala cluster for the autistic group(IQ, r ¼ 0.37, P ¼ 0.32; percentage correct, r ¼ 0.04, P 4 0.50).
Brain activation and gaze fixation: Study II
Similar regressions predicting brain activation using the amountof time spent fixating on the eyes were performed on the data fromStudy II. As in Study I, a significant proportion of the variance in
brain activation was associated with the time spent fixating on theeyes for the autistic group, but not for the control group, in a clusterin the right amygdala (autism, r ¼ 0.55, P ¼ 0.03; control, r ¼ 0.06,P ¼ 0.83) and right anterior fusiform gyrus (autism, r ¼ 0.76,P ¼ 0.003; control, r ¼ 0.14, P ¼ 0.64; group Z1,28 ¼ 2.05, P ¼ 0.04;Fig. 7). The amount of variance account for by eye fixations in theautistic group was 30% in the right amygdala (2% in the control group)and 58% in the right anterior fusiform (o 1% in the control group).Neither IQ nor performance accounted for a significant proportion ofvariance in either the right amygdala (IQ, r ¼ 0.22, P 4 0.50;
Control
Autism
Baseline
Per
cent
sig
nal
chan
ge
141062141062141062141062141062
Time from stimulus onset (s)
BOLD
EPI image
–0.4
0
0.4
0.8
–0.4
0
0.4
0.8
–0.4
0
0.4
0.8
–0.4
0
0.4
0.8
–0.4
0
0.4
0.8
–6–5–4–3–2–10123456
Con
trol
- A
utis
m
t-statistica b c d e
14121086421412108642
14121086421412108642
Time from stimulus onset (s)
–0.6
0
0.6
1.2
–0.6
0
0.6
1.2
–0.6
0
0.6
1.2
–0.6
0
0.6
1.2
Baseline
Autism
Control
Per
cent
sig
nal c
hang
e
0
5
10
15
20
25
30
F-statistica b
Figure 5 Brain clusters associated with significant Group � Familiarity
interactions in brain activation in Study II. (a) Right fusiform gyrus: x ¼ 28,
y ¼ �76, z ¼ �10; 226 voxels. (b) Right occipital gyrus: x ¼ 18, y ¼ �78,
z ¼ �7; 318 voxels. Clusters are color-coded based on the Group � Familiar
F-statistic values. The clusters are also superimposed on an averaged EPI
BOLD signal illustrating adequate signal coverage for each cluster.
Averaged MR time series are presented below each cluster for 14 s
post-stimulus onset. Data for familiar stimuli are in the top graphs and
unfamiliar stimuli in the bottom graphs.
Figure 4 Brain clusters with significant group
differences in brain activation across all faces
in Study II. (a) Right fusiform gyrus: x ¼ 48,
y ¼ �53, z ¼ �11; 125 voxels. (b) Left
anterior medial fusiform gyrus: x ¼ �25,
y ¼ �65, z ¼ �1; 322 voxels. (c) Left posterior
lateral fusiform gyrus: x ¼ �33, y ¼ �73,
z ¼ �6; 292 voxels. (d) Right occipital gyrus:x ¼ 6, y ¼ �78, z ¼ �1; 304 voxels. (e) Right
amygdala: x ¼ 21, y ¼ �2, z ¼ �20; 31 voxels.
The clusters are color-coded based on the
control-minus-autism t-statistic values (positive
values indicate control greater than autism).
The clusters are also superimposed on an
averaged EPI BOLD signal illustrating adequate
signal coverage for each cluster. Averaged MR
time series are presented below each cluster
for 14 s post-stimulus onset.
52 2 VOLUME 8 [ NUMBER 4 [ APRIL 2005 NATURE NEUROSCIENCE
A R T I C L E S©
2005
Nat
ure
Pub
lishi
ng G
roup
ht
tp://
ww
w.n
atur
e.co
m/n
atur
eneu
rosc
ienc
e

percentage correct, r ¼ 0.26, P 4 0.50) or the right anterior fusiform(IQ, r ¼ 0.17, P 4 0.50; percentage correct, r ¼ 0.18, P 4 0.50) for theautistic group.
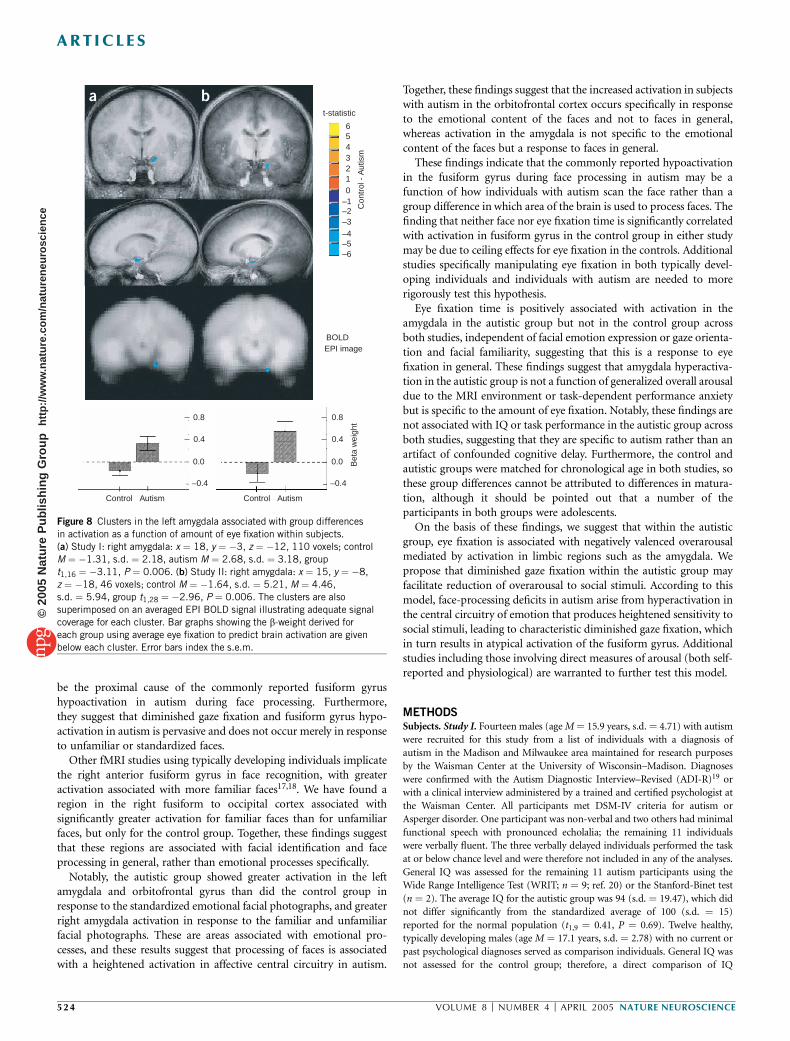
Amygdala activation as a function of gaze fixation
We performed post hoc analyses within subjects, testing whether theamount of gaze fixation within a given trial predicted amygdalaactivation during that trial by extracting brain function using astick function of relative eye fixation time per trial for eachindividual. Group t-tests were then performed focusing on theregion of the amygdala, using clustering techniques similar to thosedescribed above but with a less conservative a priori a of0.05. Amygdala activation was strongly and positively predictedby amount of eye fixation among the autistic individuals for both
Study I (M ¼ 2.68, s.d. ¼ 3.18; single-sample t1,10 ¼ 3.00, P ¼ 0.008)and Study II (M ¼ 4.46, s.d. ¼ 5.94; single-sample t1,14 ¼ 2.53,P ¼ 0.03), but not among the control individuals in either Study I(M ¼ �1.31, s.d. ¼ 2.18; single-sample t1,11 ¼ �1.17, P ¼ 0.26) orStudy II (M ¼ �1.64, s.d. ¼ 5.21; single-sample t1,14 ¼ �1.80,P ¼ 0.10). The group difference in eye fixation related to amygdalaactivation was significant for both Study I (t1,20 ¼ 3.10, P ¼ 0.006;Fig. 8a) and Study II (t1,28 ¼ 2.96, P ¼ 0.006; Fig. 8b). We did not findgroup differences in any other regions using a more conservativewhole-brain a of 0.001.
DISCUSSION
These findings show clear differences in how individuals with autismscan and process facial images and suggest that these differences may
2.42.01.20.600.90.60.40.20
Percentage signal change
0
200
400
600
800
1,200
0
200
400
600
800
1,200
0.90.60.40.201.61.20.80.400
125
250
375
500
625
0
125
250
375
500
625
Ave
rage
eye
-fix
atio
n du
ratio
n (m
s)BOLDEPI Image
0
5
10
15
20
25
30
F-statistica b
Figure 6 Brain activation clusters associated with average eye fixation time
for the autistic and control groups, Study I. (a) Left amygdala: x ¼ �19,
y ¼ �6, z ¼ �13; 106 voxels. (b) Right anterior fusiform gyrus: x ¼ 28,
y ¼ �50, z ¼ �11; 76 voxels. The clusters are also superimposed on an
averaged EPI BOLD signal illustrating adequate signal coverage for each
cluster. Scatter plots showing the relationship between brain activation
and average eye fixation are given for each group (autistics, top graphs;
controls, bottom graphs) below each cluster. The regression line and 90%
confidence bands are superimposed on each scatter plot.
2.42.01.20.600.90.60.40.20Percentage signal change
Ave
rage
eye
-fix
atio
n du
ratio
n (m
s)
1,200
800
600
400
200
0
1,200
800
600
400
200
0
0.90.60.40.201.61.20.80.40
375
300
225
150
75
0
375
300
225
150
75
0
BOLDEPI Image
0
5
10
15
20
25
30
F-statistic
a b
Figure 7 Brain activation clusters associated with average eye fixation timefor the autistic and control groups, Study II. (a) Right amygdala: x ¼ 11,
y ¼ �7, z ¼ �20; 63 voxels. (b) Right anterior fusiform gyrus: x ¼ 27,
y ¼ �57, z ¼ �6; 113 voxels. The clusters are also superimposed on an
averaged EPI BOLD signal illustrating adequate signal coverage for each
cluster. Scatter plots showing the relationship between brain activation and
average eye fixation are given for each group (autistics, top graphs; controls,
bottom graphs) below each cluster. The regression line and 90% confidence
bands are superimposed on each scatter plot.
NATURE NEUROSCIENCE VOLUME 8 [ NUMBER 4 [ APRIL 2005 5 2 3
A R T I C L E S©
2005
Nat
ure
Pub
lishi
ng G
roup
ht
tp://
ww
w.n
atur
e.co
m/n
atur
eneu
rosc
ienc
e
be the proximal cause of the commonly reported fusiform gyrushypoactivation in autism during face processing. Furthermore,they suggest that diminished gaze fixation and fusiform gyrus hypo-activation in autism is pervasive and does not occur merely in responseto unfamiliar or standardized faces.
Other fMRI studies using typically developing individuals implicatethe right anterior fusiform gyrus in face recognition, with greateractivation associated with more familiar faces17,18. We have found aregion in the right fusiform to occipital cortex associated withsignificantly greater activation for familiar faces than for unfamiliarfaces, but only for the control group. Together, these findings suggestthat these regions are associated with facial identification and faceprocessing in general, rather than emotional processes specifically.
Notably, the autistic group showed greater activation in the leftamygdala and orbitofrontal gyrus than did the control group inresponse to the standardized emotional facial photographs, and greaterright amygdala activation in response to the familiar and unfamiliarfacial photographs. These are areas associated with emotional pro-cesses, and these results suggest that processing of faces is associatedwith a heightened activation in affective central circuitry in autism.
Together, these findings suggest that the increased activation in subjectswith autism in the orbitofrontal cortex occurs specifically in responseto the emotional content of the faces and not to faces in general,whereas activation in the amygdala is not specific to the emotionalcontent of the faces but a response to faces in general.
These findings indicate that the commonly reported hypoactivationin the fusiform gyrus during face processing in autism may be afunction of how individuals with autism scan the face rather than agroup difference in which area of the brain is used to process faces. Thefinding that neither face nor eye fixation time is significantly correlatedwith activation in fusiform gyrus in the control group in either studymay be due to ceiling effects for eye fixation in the controls. Additionalstudies specifically manipulating eye fixation in both typically devel-oping individuals and individuals with autism are needed to morerigorously test this hypothesis.
Eye fixation time is positively associated with activation in theamygdala in the autistic group but not in the control group acrossboth studies, independent of facial emotion expression or gaze orienta-tion and facial familiarity, suggesting that this is a response to eyefixation in general. These findings suggest that amygdala hyperactiva-tion in the autistic group is not a function of generalized overall arousaldue to the MRI environment or task-dependent performance anxietybut is specific to the amount of eye fixation. Notably, these findings arenot associated with IQ or task performance in the autistic group acrossboth studies, suggesting that they are specific to autism rather than anartifact of confounded cognitive delay. Furthermore, the control andautistic groups were matched for chronological age in both studies, sothese group differences cannot be attributed to differences in matura-tion, although it should be pointed out that a number of theparticipants in both groups were adolescents.
On the basis of these findings, we suggest that within the autisticgroup, eye fixation is associated with negatively valenced overarousalmediated by activation in limbic regions such as the amygdala. Wepropose that diminished gaze fixation within the autistic group mayfacilitate reduction of overarousal to social stimuli. According to thismodel, face-processing deficits in autism arise from hyperactivation inthe central circuitry of emotion that produces heightened sensitivity tosocial stimuli, leading to characteristic diminished gaze fixation, whichin turn results in atypical activation of the fusiform gyrus. Additionalstudies including those involving direct measures of arousal (both self-reported and physiological) are warranted to further test this model.
METHODSSubjects. Study I. Fourteen males (age M ¼ 15.9 years, s.d. ¼ 4.71) with autism
were recruited for this study from a list of individuals with a diagnosis of
autism in the Madison and Milwaukee area maintained for research purposes
by the Waisman Center at the University of Wisconsin–Madison. Diagnoses
were confirmed with the Autism Diagnostic Interview–Revised (ADI-R)19 or
with a clinical interview administered by a trained and certified psychologist at
the Waisman Center. All participants met DSM-IV criteria for autism or
Asperger disorder. One participant was non-verbal and two others had minimal
functional speech with pronounced echolalia; the remaining 11 individuals
were verbally fluent. The three verbally delayed individuals performed the task
at or below chance level and were therefore not included in any of the analyses.
General IQ was assessed for the remaining 11 autism participants using the
Wide Range Intelligence Test (WRIT; n ¼ 9; ref. 20) or the Stanford-Binet test
(n ¼ 2). The average IQ for the autistic group was 94 (s.d. ¼ 19.47), which did
not differ significantly from the standardized average of 100 (s.d. ¼ 15)
reported for the normal population (t1,9 ¼ 0.41, P ¼ 0.69). Twelve healthy,
typically developing males (age M ¼ 17.1 years, s.d. ¼ 2.78) with no current or
past psychological diagnoses served as comparison individuals. General IQ was
not assessed for the control group; therefore, a direct comparison of IQ
Control Autism Control Autism
–0.4
0.0
0.4
0.8
–0.4
0.0
0.4
0.8
Bet
a w
eigh
t
BOLDEPI image
–6–5–4–3–2–10123456
Con
trol
- A
utis
m
t-statistic
a b
Figure 8 Clusters in the left amygdala associated with group differences
in activation as a function of amount of eye fixation within subjects.
(a) Study I: right amygdala: x ¼ 18, y ¼ �3, z ¼ �12, 110 voxels; control
M ¼ �1.31, s.d. ¼ 2.18, autism M ¼ 2.68, s.d. ¼ 3.18, group
t1,16 ¼ �3.11, P ¼ 0.006. (b) Study II: right amygdala: x ¼ 15, y ¼ �8,
z ¼ �18, 46 voxels; control M ¼ �1.64, s.d. ¼ 5.21, M ¼ 4.46,
s.d. ¼ 5.94, group t1,28 ¼ �2.96, P ¼ 0.006. The clusters are also
superimposed on an averaged EPI BOLD signal illustrating adequate signal
coverage for each cluster. Bar graphs showing the b-weight derived for
each group using average eye fixation to predict brain activation are given
below each cluster. Error bars index the s.e.m.
52 4 VOLUME 8 [ NUMBER 4 [ APRIL 2005 NATURE NEUROSCIENCE
A R T I C L E S©
2005
Nat
ure
Pub
lishi
ng G
roup
ht
tp://
ww
w.n
atur
e.co
m/n
atur
eneu
rosc
ienc
e
between the autism and control groups was not possible. The groups were
matched for chronological age. Study II. Sixteen males (age M ¼ 14.5 years,
s.d. ¼ 4.60) with autism were recruited for this study through a newsletter
distributed by the Autism Society of Wisconsin. Diagnoses were confirmed with
the ADI-R or by a clinical interview administered by a trained and certified
psychologist at the Waisman Center. All participants met DSM-IV criteria for
autism or Asperger disorder. Two of the individuals with autism had minimal
functional speech with pronounced echolalia; the remaining 14 individuals
were verbally fluent. General IQ was assessed using the WRIT with an autistic
group average of 92.1 (s.d. ¼ 27.7). Sixteen healthy, typically developing males
(age M ¼ 14.5 years, s.d. ¼ 4.56) with no current or past psychological
diagnoses served as comparison individuals. General IQ for the control group
was 123.1 (s.d. ¼ 12.74). All group analyses were performed two ways: (i) by
comparing the two groups without matching on IQ, as reported here, and (ii)
by breaking the autistic group into two subgroups based on IQ: high IQ (n ¼ 8)
and low IQ (n ¼ 8). The high-IQ group did not differ from the control group
in age or IQ. A similar pattern of results was found under both analyses
comparing the control group to both the high and low IQ autistic groups. No
differences in brain activation were found between the high and low IQ autistic
subgroups for any analyses. The groups were matched for chronological age.
Procedure. Participants first read and signed a consent form that covered all
aspects of the study and MRI procedures. Consent was obtained from parents
or legal guardians of all participants younger than 18 years. Additional
adolescent consent was obtained from participants 13–18 years of age, and a
separate child assent was obtained from participants under 12 years of age. All
participants and parents were prescreened for MRI compatibility before any
exposure to the actual scanner. All sessions began with a simulation session
during which participants and parents were acclimated to the MRI environ-
ment using a mock-up of an MRI scanner. During the simulation session
participants were also given instructions for the facial emotion discrimination
task (Study I) or the facial recognition task (Study II) and were shown
examples of the appropriate stimuli. All participants and parents were allowed
as much time as needed to become comfortable with the mock scanner and
were encouraged to ask questions. Once it was clear that the participants were
comfortable with the fake scanner and they had indicated that they understood
the instructions for the appropriate task, they were escorted to the real scanner
for the actual scans. All scans started with approximately 20 min of anatomical
scans followed by the 7-min functional scan during which the participants
performed either the facial emotion discrimination task or the facial recogni-
tion task. The total time in the scanner was approximately 30–35 min and the
total time for the full session was approximately 1.5 h. All participants received
$20 for the simulation session and $30 for the actual scans, for a total of $50.
Study I: facial emotion discrimination task. Participants were asked to
perform a facial emotion discrimination task while functional brain images
were acquired. For the task the participants were asked to decide whether a
picture of a human face was either emotional (showing any emotion, such as
happiness, fear or anger) or neutral (no obvious show of emotion) by pressing
one of two buttons. The faces were black-and-white photographs of emotional
and neutral faces, taken from the Karolinska Directed Emotional Faces set
(KDEF)21. All faces were 400 � 543 pixel arrays centered on an 800 � 600 black
screen. All of the faces were of college-age students (equal number of male and
female faces) trained to produce neutral and exaggerated emotional expres-
sions. Half of the faces were looking straight ahead with eyes on the viewer, the
other half were quarter-turned to the right or left with eyes averted from the
viewer. Sixteen of the faces had a neutral expression, and 24 had an exaggerated
emotional expression (eight each of happiness, fear and anger). Each face was
presented for 3 s with 5–7 s between faces. Participants were asked to press the
appropriate button as soon as they had decided whether the face was neutral or
was showing any emotion, but to reduce performance anxiety they were not
explicitly instructed to respond as quickly as possible. The faces were presented
using E-Prime software (version 1.1, Psychology Software Tools), which allowed
for the acquisition of both accuracy and response time (ms) for each trial.
Study II: facial recognition task. Participants were asked to perform a
recognition task while functional brain images were acquired. For the task,
the participants were asked to decide whether a photograph was familiar to
them by pressing a button. Ten of the photographs were of the participants’
family members or friends, and had been taken by the participant before the
session (familiar faces). For the unfamiliar condition, ten photographs of other
participants’ family members and friends were presented, matched as closely as
possible to the participant’s photographs for gender, age, facial expression and
orientation. Participants were also asked to decide whether an additional 20
photographs of objects were familiar (ten familiar, ten unfamiliar), but results
from these conditions are not discussed here. All photographs were isoluminant
gray scale 800 � 600 pixel arrays centered on an 800 � 600 screen. The
photographs were presented using E-Prime software (version 1.1, Psycho-
logy Software Tools), which allowed the acquisition of both accuracy and
response time (ms) for each trial.
Eye movements. Eye movements, fixations and pupil diameter were acquired
for both studies using an iView system with a remote eye-tracking device
(SensoMotoric Instruments, 2001). The acquired eye data was analyzed using
the iView software. This system allows us to show eye movement as the gaze
position of the pupil over a certain length of time (gaze path) along with the
amount of time spent on any given fixation point (gaze fixation). Eye fixations
were defined as the amount of continuous time (minimum 50 ms) spent
looking within a 20-pixel-diameter region. The total amount of time spent
fixating on the face in general, each eye and the mouth region was calculated as
the sum of fixations within each of those four predefined regions for each face.
Imaging. Brain MRI images were acquired with a GE Signa 3-T scanner
equipped with high-speed gradients and a whole-head transmit-receive quad-
rature birdcage headcoil (GE Medical Systems). Structural brain images were
acquired for anatomical localization of functional activity. For Study I, a three-
dimensional T1 SPGR volume was acquired (TE ¼ 8 ms, TR ¼ 35 ms, FOV ¼240 � 240 mm, flip angle ¼ 301, NEX ¼ 1; 256 � 192 matrix, 124 axial slices,
slice thickness ¼ 1.1–1.2 mm). For Study II, a three-dimensional T1 inversion
recovery volume was acquired (TE ¼ 8.0 ms, TR ¼ 21.0 ms, FOV ¼ 240 � 240
mm, flip angle ¼ 301, NEX ¼ 1; 256 � 256 matrix, 124 axial slices, slice
thickness ¼ 1.1–1.2 mm). After the anatomical images were collected, func-
tional data were collected, using whole-brain echo-planar imaging (EPI).
Sagittal acquisition was used to acquire 30 slices per functional volume, with
an image thickness of 4 mm and gap of 1 mm. Four hundred and nine
functional images were acquired (TE ¼ 30 ms, TR ¼ 2 s, FOV ¼ 240 �240mm, 64 � 64 matrix). The resulting voxel size was 3.75 � 3.65 � 5 mm.
Images of the faces were presented in three different timing conditions, such
that some images were presented synchronously with the TR and others were
asynchronous with the TR (that is, jittered). These different timing conditions
provided an effective time resolution of 1 s.
Image analyses. Differential brain activation maps were generated by compar-
ing activation in the autistic and the control groups voxel-wise using National
Institutes of Health Analysis of Functional Neural Images (AFNI) software,
version 2.31 (ref. 22). Data processing steps included image reconstruction in
conjunction with smoothing in Fourier space with a Hanning window (full
width at half maximum ¼ 1 voxel), six-parameter rigid-body motion correc-
tion, removal of skull and ghost artifacts, and application of a high-pass
temporal Fourier filter that removed frequencies slower than 0.016 Hz. The
time series was modeled with a least-squares general linear model (GLM) fit to
an ideal hemodynamic response function (g variate), and the resultant
b-weights were converted to percentage signal change. During the GLM fit,
the time-to-onset of response was allowed to vary independently for each voxel
from 0 to 4 s; the same lag was used for each of the four emotion � orientation
conditions in Study I and both the familiar and unfamiliar face conditions in
Study II. This variable onset allows for sensitivity to the varying blood
perfusion rates across the brain, and fixing the time lag as the same for all
conditions ensures that the responses are properly separated and estimated. The
resultant percentage signal change maps from the GLM were transformed into
the standardized Talairach space through identification of anatomical land-
marks on the high-resolution anatomical image23.
For the within-subject analyses of the effect of eye fixation on brain
activation, a stick function was created for each subject with the relative eye
NATURE NEUROSCIENCE VOLUME 8 [ NUMBER 4 [ APRIL 2005 5 2 5
A R T I C L E S©
2005
Nat
ure
Pub
lishi
ng G
roup
ht
tp://
ww
w.n
atur
e.co
m/n
atur
eneu
rosc
ienc
e
fixation time per trial (amount of time spent fixating on the eye region for a
given trial, minus the average eye-fixation time across all trials, divided by 100),
as the predictor. The resultant time series was then modeled and extracted
using similar techniques, as outlined above.
To identify the group differences in brain regions associated with processing
faces, a t-test was performed between the groups across all the face conditions
in both studies. Additional whole-brain group � emotion (emotion, neutral) �orientation (straight, side) mixed-measures ANOVA was performed for Study I,
and group � familiarity (familiar, unfamiliar) mixed-measures ANOVA was
performed for Study II. An individual P-value threshold ¼ 0.001 and a
minimum cluster size of 50 contiguous voxels was used to control for multiple
comparisons. For clusters meeting the individual P-value and cluster-size
threshold combination for the interaction and main effects of interest, the
average percentage signal change value was extracted for each condition and
participant, and the values entered into simple effects analyses to determine the
source of the significant effect.
ACKNOWLEDGMENTSWe thank all the individuals and families who participated in this research,M. Anderle and R. Fisher for technical assistance in data acquisition, and facultyand staff at the Waisman Center and Waisman Laboratory for Brain Imaging andBehavior for administrative and technical support. This work was supported bya US National Institute of Mental Health (NIMH) Studies to Advance AutismResearch and Treatment (STAART) grant U54MH066398 Project IV (R.J.D.),a National Alliance for Research on Schizophrenia and Affective Disorders(NARSAD) Distinguished Investigator Award to R.J.D., a National Institutesof Health core grant P30 HD03352 (M.M. Seltzer) and a National Institutesof Child Health and Human Development training grant T32 HD07489(L. Abbeduto).
COMPETING INTERESTS STATEMENTThe authors declare that they have no competing financial interests.
Received 16 December 2004; accepted 16 February 2005
Published online at http://www.nature.com/natureneuroscience/
1. Diagnostic and Statistical Manual of Mental Disorders 4th edn. (American PsychiatricAssociation, Washington DC, 1994).
2. Lord, C., Cook, E.H., Leventhal, B. & Amaral, D.G. Autism spectrum disorders. Neuron28, 355–363 (2000).
3. Klin, A., Jones, W., Schultz, R.T., Volkmar, F.R. & Cohen, D.J. Visual fixation patternsduring viewing of naturalistic social situations as predictors of social competence inindividuals with autism. Arch. Gen. Psychiatry 59, 809–816 (2002).
4. Ellis, H.D. & Young, A.W. Faces in their social and biological context. in Face and Mind(ed. Young, A.W.) 67–95 (Oxford Univ. Press, London, 1998).
5. Farah, M.J., Wilson, K.D., Drain, M. & Tanaka, J.N. What is ‘special’ about faceperception? Psychol. Rev. 105, 482 (1998).
6. Schultz, R.T. et al. Abnormal ventral temporal cortical activity during face discriminationamong individuals with autism and Asperger syndrome. Arch. Gen. Psychiatry 57,331–340 (2000).
7. Adolphs, R., Sears, L. & Piven, J. Abnormal processing of social information from facesin autism. J. Cogn. Neurosci. 13, 232–240 (2001).
8. Joseph, R.M. & Tanaka, J.N. Holistic and part-based face recognition in children withautism. J. Child Psychol. Psychiatry 44, 529–542 (2003).
9. Osterling, J. & Dawson, G. Early recognition of children with autism: a study of firstbirthday home videotapes. J. Autism Dev. Disord. 24, 247–257 (1994).
10. Osterling, J.A., Dawson, G. & Munson, J.A. Early recognition of 1-year-old infants withautism spectrum disorder versus mental retardation. Dev. Psychopathol. 14, 239–251(2002).
11. Mundy, P., Sigman, M. & Kasari, C. Theory of mind and joint-attention deficits in autism.in Understanding Other Minds: Perspectives from Autism (eds. Baron-Cohen, S., Tager-Flusberg, H. & Cohen, D.) 181–203 (Oxford Univ. Press, London, 1994).
12. Joseph, R.M. & Tager-Flusberg, H. An investigation of attention and affect in childrenwith autism and Down syndrome. J. Autism Dev. Disord. 27, 385–395 (1997).
13. Critchley, H.D. et al. The functional neuroanatomy of social behaviour. Changesin cerebral blood flow when people with autistic disorder process facial expressions.Brain 123, 2203–2212 (2000).
14. Pierce, K., Muller, R.A., Ambrose, J., Allen, G. & Courchesne, E. Face processing occursoutside the fusiform ‘face area’ in autism: evidence from functional MRI. Brain 124,2059–2073 (2001).
15. Puce, A., Allison, T., Gore, J.C. & McCarthy, G. Face-sensitive regions in humanextrastriate cortex studied by functional MRI. J. Neurophysiol. 74, 1192–1199(1995).
16. Ogai, M. et al. fMRI study of recognition of facial expressions in high-functioning autisticpatients. Neuroreport 14, 559–563 (2003).
17. George, N. et al. Contrast polarity and face recognition in the human fusiform gyrus.Nat. Neurosci. 2, 547–580 (1999).
18. Lehmann, C. et al. Dissociation between overt and unconscious face processing infusiform face area. Neuroimage 21, 75–83 (2004).
19. Lord, C., Rutter, M. & LeCouteur, A. Autism diagnostic interview—revised: a revisedversion of a diagnostic interview for caregivers of individuals with possible pervasivedevelopmental disorders. J. Autism Dev. Disord. 24, 659–685 (1994).
20. Glutting, J., Adams, W. & Sheslow, D. Wide Range Intelligence Test (Wide Range,Wilmington, Delaware, USA, 2000).
21. Lundqvist, D., Flykt, A. & Ohman, A. Karolinska Directed Emotional Faces (Departmentof Neurosciences, Karolinska Hospital, Stockholm, Sweden, 1998).
22. Cox, R.W. Analyses of functional neuroimages software for analysis and visualizationof functional magnetic resonance neuroimages. Comput. Biomed. Res. 29, 162–173(1996).
23. Talairach, J. & Tournoux, P. Co-planar Stereotaxic Atlas of the Human Brain:3-dimensional Proportional System: An Approach to Cerebral Imaging (ThiemeMedical, New York, 1988).
52 6 VOLUME 8 [ NUMBER 4 [ APRIL 2005 NATURE NEUROSCIENCE
A R T I C L E S©
2005
Nat
ure
Pub
lishi
ng G
roup
ht
tp://
ww
w.n
atur
e.co
m/n
atur
eneu
rosc
ienc
e