Embed Size (px)
Citation preview

GATX CORPORATIONRailcar Leasing:A Historical Perspective

2
Forward Looking Statement
Forward-looking statements in this presentation that are not historical facts are “forward-looking statements” within the meaning of the Private
Securities Litigation Reform Act of 1995. These include statements that reflect our current views with respect to, among other things, future
events, financial performance and market conditions. In some cases, forward-looking statements can be identified by the use of words such as
“may,” “could,” “expect,” “intend,” “plan,” “seek,” “anticipate,” “believe,” “estimate,” “predict,” “potential,” “continue,” “likely,” “will,” “would,”
and variations of these terms and similar expressions, or the negative of these terms or similar expressions. Specific risks and uncertainties
include, but are not limited to, (1) inability to maintain our assets on lease at satisfactory rates; (2) weak economic conditions, financial market
volatility, and other factors that may decrease demand for our assets and services; (3) decreased demand for portions of our railcar fleet due to
adverse changes in commodity prices, including, but not limited to, sustained low crude oil prices; (4) events having an adverse impact on assets,
customers, or regions where we have a large investment; (5) operational disruption and increased costs associated with increased railcar
assignments following non-renewal of leases, compliance maintenance programs, and other maintenance initiatives; (6) financial and operational
risks associated with long-term railcar purchase commitments; (7) reduced opportunities to generate asset remarketing income; (8) changes in
railroad efficiency that could decrease demand for railcars; (9) operational and financial risks related to our affiliate investments, including the
RRPF affiliates; (10) fluctuations in foreign exchange rates; (11) failure to successfully negotiate collective bargaining agreements with the unions
representing a substantial portion of our employees; (12) the impact of new regulatory requirements for tank cars carrying crude, ethanol, and
other flammable liquids; (13) deterioration of conditions in the capital markets, reductions in our credit ratings, or increases in our financing
costs; (14) asset impairment charges we may be required to recognize; (15) competitive factors in our primary markets; (16) risks related to
international operations and expansion into new geographic markets; (17) exposure to damages, fines, and civil and criminal penalties arising
from a negative outcome in our pending or threatened litigation; (18) changes in or failure to comply with laws, rules, and regulations; (19)
inability to obtain cost-effective insurance; (20) environmental remediation costs; (21) inadequate allowances to cover credit losses in our
portfolio, and (22) other risks discussed in our filings with the US Securities and Exchange Commission (SEC), including our Form 10-K for the year
ended December 31, 2015, and our subsequently filed Form 10-Q reports, all of which are available on the SEC’s website (www.sec.gov).
Investors should not place undue reliance on forward-looking statements, which speak only as of the date they are made, and are not guarantees
of future performance. The Company undertakes no obligation to publicly update or revise these forward-looking statements.
Investor, corporate, financial, historical financial, photographic and news release information may be found at www.gatx.com.

3
Introduction: The Railcar Market Today
Why do railcars exist?
Why do railcar operating lessors exist?
–Capital
–Services
–Risk
4
Lessors Provide Capital & Value-add Services
Capital Intensive
Repair CapacityCompliance Program
Purchasing PowerDesign Specifications
Market KnowledgeDisposition Timing
Auditing, Tax Preparation,Recordkeeping Expertise
INVESTMENT PROCUREMENT MAINTENANCE ADMINISTRATION REMARKETING

5
Lessors Assume Operating Risks & Associated Costs
ADMINISTRATIONMaintenance management, car taxes, insurance, engineering, recordkeeping costs
MAINTENANCEExpense incurred to maintain asset – bad order, compliance, other cleaning and repair needs
LEASE OR PURCHASEFinancing or leasing expense
EXPECTED COSTS
NEW COMPLIANCEREQUIREMENTSCost of makingmodificationsto remain compliant
CHANGINGBUSINESS NEEDSImbalanced demandand supply resulting in surplus equipment
OBSOLESCENCEObsolete cardesign resultingin distressed fleet
ADDITIONAL UNEXPECTED COSTS

6
Increasing Regulatory and Maintenance Risks
NUMBER OF REGULATORY AND MAINTENANCE PROGRAMS PER YEAR (BY EFFECTIVE DATE)
SOUTHERN WHEELS
MEXICAN BOLSTERS
TANK CAR QUALIFICATIONS
REFLECTORIZATION FLAMMABLE LIQUIDS
SLACK ADJUSTERS
MCKENZIE VALVES
COMPLIANCE / MAINTENANCE PROGRAM EXAMPLES
Source: DOT, AAR, FRA

WHAT ROLE DO OPERATING LESSORS PLAY IN TODAY’S MARKET?

8
Lessors Own More Than Half the North American Fleet
Source: UMLERApproximately 1.6 million railcars as of 2016
Lessor51%
Railroad21%
Shipper19%
TTX9%
FLEET BY OWNERSHIP
40%
45%
50%
55%
60%
2008 2009 2010 2011 2012 2013 2014 2015 2016
% o
f To
tal F
leet
OWNERSHIP OVER TIME
Lessor Other
9
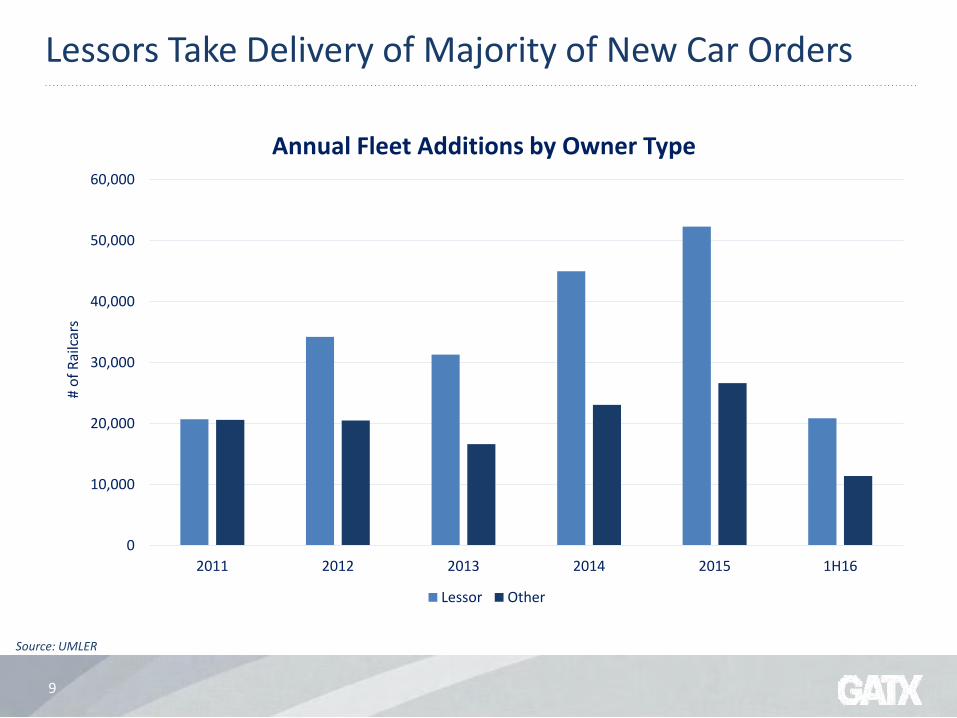
Lessors Take Delivery of Majority of New Car Orders
0
10,000
20,000
30,000
40,000
50,000
60,000
2011 2012 2013 2014 2015 1H16
# o
f R
ailc
ars
Annual Fleet Additions by Owner Type
Lessor Other
Source: UMLER

10
Is today’s railcar market healthy?
Excess new car capacity
Excess existing car supply
Increased railroad velocity
Lower rail freight demand

11
North American New Car Backlog Shows Cyclicality
Source: Railway Supply Institute
-
20,000
40,000
60,000
80,000
100,000
120,000
140,000
160,000
# o
f R
ailc
ars
‘99 ‘00 ‘01 ‘02 ‘03 ‘04 ‘05 ‘06 ‘07 ‘08 ‘09 ‘10 ‘11 ‘12 ‘13 ‘14 ‘15 ‘16
Tank Car Backlog Freight Car Backlog

12
Recent Upturn Featured Speculation and Lack of Diversity
Small Cube
CH20%
Tank41%
All Other39%
New Car Deliveries 2011-2015
Approx. 309K Railcars
0%
10%
20%
30%
40%
50%
60%
70%
80%
90%
100%
2011 2012 2013 2014 2015 3Q16YTD
% o
f To
tal N
ew C
ars
Del
iver
ed
New Car Deliveries 2011-2015
Tank Cars Small Cube CH Other
Source: Railway Supply Institute

CAN A HISTORICAL PERSPECTIVE HELP US UNDERSTAND HOW WE GOT HERE?

14
The world before 1887
As historians have observed, railroads were to the 19th century as internet companies were to the late 20th
– Capital virtually unlimited
– Volatility high
– Era of the “robber barons”
– Essentially no economic regulation
Railroads buy virtually all of their own rolling stock
– Fledgling “private car companies” focus on specialty cars

15
Regulation and Growth: 1887-1945
ICC imposes economic regulation
–Railroad dominance remains
due to lack of alternatives
–Capital availability robust
Subsidized competition emerges
WWII the last heyday of railroad dominance
Railroads continue to own rolling stock
–Private car companies remain roughly the same

16
Decline and the Emergence of Modern Leasing: 1945-1980
Rise of trucking
Regulation limits competitive response
Railroads consolidate and/or encounter financial difficulty
Network shrinks
Railroad capital availability constrained
Alternatives for rolling stock began to emerge
– 1960s: Utility coal trains and leveraged leasing
– 1970s: “Incentive per diem” boxcars and expansion of leasing market

17
1980-2000: Deregulation and Rationalization
Staggers act of 1980
Uncertainty wipes out many carbuilders
– Decade-and-a-half railcar slump
“Railroad renaissance” begins in 1990s
– Railroads begin to focus capital on fixed plant
– Rise of new generation of operating lessors
– Re-casting of traditional private car companies
– New 286K standard drives fleet replacement
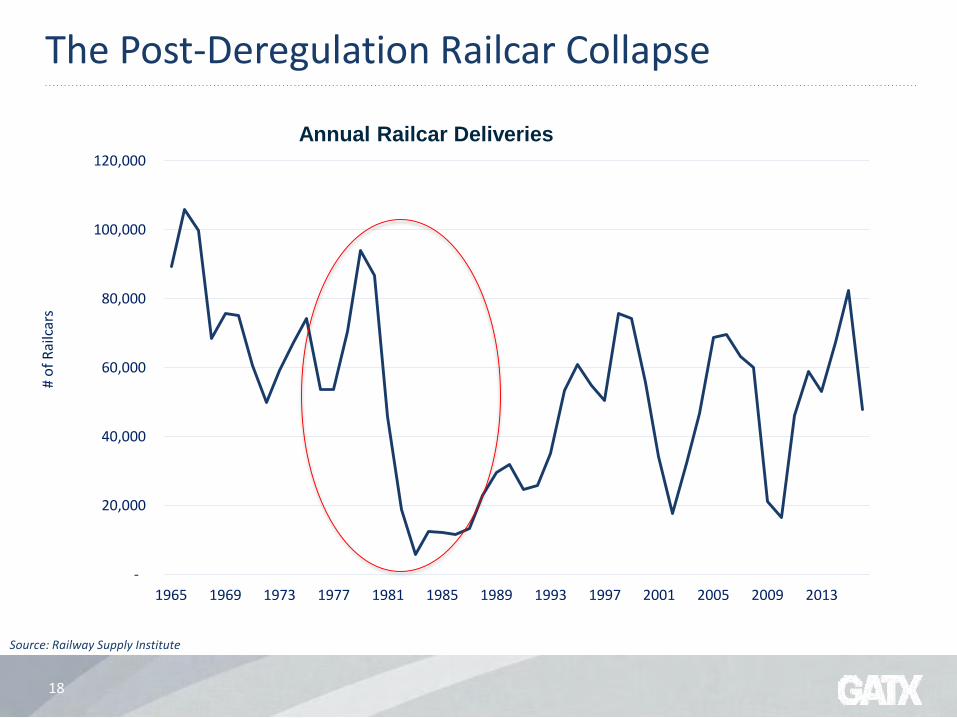
18
The Post-Deregulation Railcar Collapse
-
20,000
40,000
60,000
80,000
100,000
120,000
1965 1969 1973 1977 1981 1985 1989 1993 1997 2001 2005 2009 2013
# o
f R
ailc
ars
Annual Railcar Deliveries
Source: Railway Supply Institute

19
2000-Present: Railroad Renaissance, Railcar Boom and Bust
Railroads capture pricing power and drive returns
– Fixed plant reinvestment in full swing
New (and newer) rail commodities drive huge lessor investment
– PRB coal, ethanol, frac sand, crude oil, NGLs
Railcar cycle becomes exaggerated and volatility reigns
– Rise and fall of PRB coal and CBR
– Severe recessions
– Cheap money
– Aggressive new entrants
– Accidents and regulatory responses

20
The Railroad Renaissance in Graphical Form
$60
$70
$80
$90
$100
$110
$120
$130
$140
$150
$160
$ R
eve
nu
e /
Ton
-Mile
Class I RR Avg. Revenue Per Ton-mile(1990=100)
Source: US DOT Bureau of Transportation Statistics; ABH Consulting
Class I RR Capital Expenditure (billions)

21
The Exaggerated Cyclicality of the Modern Market
-
20,000
40,000
60,000
80,000
100,000
120,000
1965 1969 1973 1977 1981 1985 1989 1993 1997 2001 2005 2009 2013
# o
f R
ailc
ars
Annual Railcar Deliveries
Source: Railway Supply Institute

22
The Extremes of Rail-Hauled Energy Products
0
200,000
400,000
600,000
800,000
1,000,000
1,200,000
1,400,000
0
1,000,000
2,000,000
3,000,000
4,000,000
5,000,000
6,000,000
7,000,000
8,000,000
9,000,000
Petr
ole
um
Pro
du
ct C
arlo
ads
Co
al C
arlo
ads
Boom and Bust in Rail Commodity Carloads
Coal (right axis) Petroleum Products
Source: AAR
23
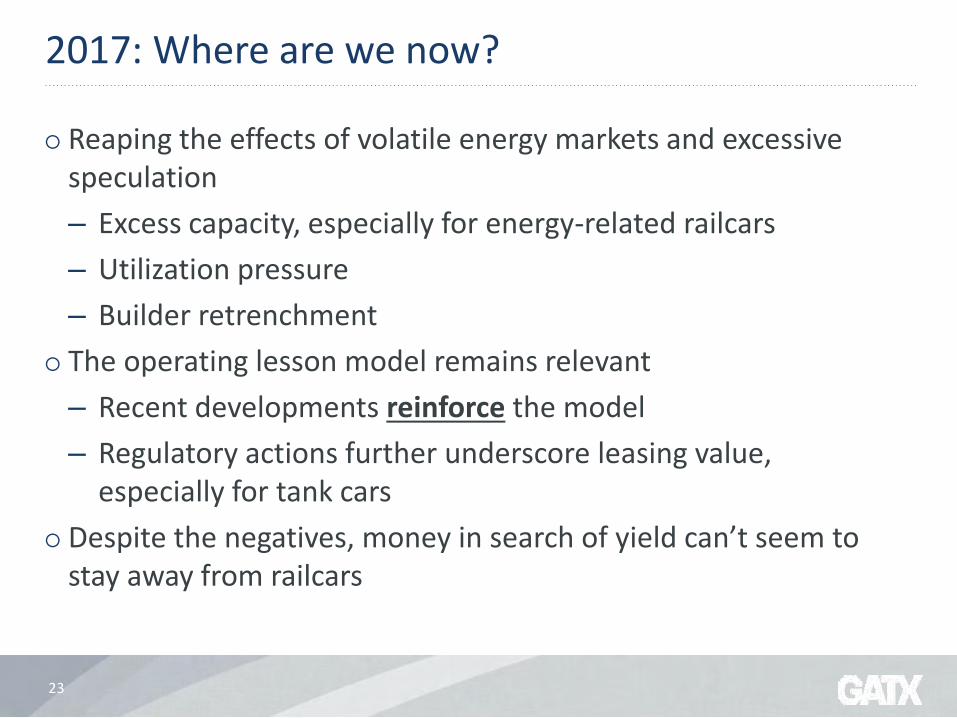
2017: Where are we now?
Reaping the effects of volatile energy markets and excessive speculation
– Excess capacity, especially for energy-related railcars
– Utilization pressure
– Builder retrenchment
The operating lesson model remains relevant
– Recent developments reinforce the model
– Regulatory actions further underscore leasing value, especially for tank cars
Despite the negatives, money in search of yield can’t seem to stay away from railcars

24
Idle assets are moderating, but still high
0%
5%
10%
15%
20%
25%
30%
35%
5/1/2009 6/1/2010 7/1/2011 8/1/2012 9/1/2013 10/1/2014 11/1/2015 12/1/2016
% Id
le
North American Idle Fleet
Source: AAR

25
Whither goes the future?
The current market has not finished wreaking havoc
–Poorly positioned fleets
–Regulatory complexity
GATX continues to believe that disciplined, diversified, large-scale, full-service operating lessors are well-positioned to withstand the downturn and thrive long-term

QUESTIONS?