Embed Size (px)
Citation preview

GLOBAL ADULT TOBACCO SURVEY: INDONESIA REPORT 2011GATS| INDONESIA
GLOBAL ADULT TOBACCO SURVEY: INDONESIA REPORT 2011 GLOBAL ADULT TOBACCO SURVE Y: INDONESIA REPORT 2011
BH
A
K T I H U SAD
A
Regional Office for South-East Asia
Collaborating organizations
Ministry of Health Badan Pusat Statistik (BPS-Statistics Indonesia) National Institute of Health Research and Development World Health Organization Centers for Disease Control and Prevention CDC Foundation John Hopkins Bloomberg School of Public Health RTI International
Global Adult Tobacco Survey: Indonesia Report 2011 summarizes the findings of Global Adult Tobacco Survey on tobacco control indicators and thus fulfils its obligation under MPOWER policy package to monitoring tobacco control in Indonesia GATS| inDonEsia
fullIndonesia_cover8_9_12.indd 1 8/30/2012 9:21:48 AM

Global Adult Tobacco Survey:
Indonesia Report 2011

ii
WHO Library Cataloguing-in-Publication Data
World Health Organization, Regional Office for South East Asia.
Global Adult Tobacco Survey: Indonesia Report 2011.
1. Tobacco use disorder – economics. 2. Tobacco use cessation. 3. Data collection.
4. Tobacco industry – economics – legislation. 5. Smoking – prevention and control - statistics
and numerical data. 6. Economics. 7. Knowledge, Attitudes, Practice. 8. Indonesia
ISBN 978-92-9022-424-2 (NLM classification: WM 290)
The publication may be obtained from:
National Institute of Health Research and Development Ministry of Health Jl. Percetakan Negara 23-A, Jakarta 10560, Indonesia Tel. + 21-4261088 Fax. + 21-4243933 – 4211845
World Health Organization Regional Office for South-East Asia World Health House, I.P. Estate Mahatma Gandhi Marg New Delhi – 110002, India Tel. 91-11-23370804, 23370809-11 Fax. 91-11-23370197, 23379395
© World Health Organization 2012
All rights reserved.
Requests for publications, or for permission to reproduce or translate WHO publications
– whether for sale or for noncommercial distribution – can be obtained from Publishing and Sales, World Health
Organization, Regional Office for South-East Asia, Indraprastha Estate, Mahatma Gandhi Marg, New Delhi 110
002, India (fax: +91 11 23370197; e-mail: [email protected]).
The designations employed and the presentation of the material in this publication do not imply the expression
of any opinion whatsoever on the part of the World Health Organization concerning the legal status of any
country, territory, city or area or of its authorities, or concerning the delimitation of its frontiers or boundaries.
Dotted lines on maps represent approximate border lines for which there may not yet be full agreement.
The mention of specific companies or of certain manufacturers’ products does not imply that they are endorsed
or recommended by the World Health Organization in preference to others of a similar nature that are not
mentioned. Errors and omissions excepted, the names of proprietary products are distinguished by initial capital
letters.
All reasonable precautions have been taken by the World Health Organization to verify the information
contained in this publication. However, the published material is being distributed without warranty of any kind,
either expressed or implied. The responsibility for the interpretation and use of the material lies with the reader.
In no event shall the World Health Organization be liable for damages arising from its use.
This publication does not necessarily represent the decisions or policies of the World Health Organization.
Printed in Indonesia

iii

v
MINISTER OF HEALTH
REPUBLIC OF INDONESIA
FOREWORD
Tobacco consumption in Indonesia has increased significantly in the last two decades due to several factors, such as the growth of the population, the relatively cheap price of cigarettes, and aggressive marketing of tobacco industries. Community Based Surveys such as National Socioeconomic Survey, Baseline Health Research and Global Adult Tobacco Survey show significant increase of active male cigarette smokers in Indonesia, that is from 53.9 % in 1995 to 67.0 % in 2011.
This alarming situation prompted us to improve public policy, to plan a comprehensive tobacco control program and to propose more strict laws and regulations. Several efforts have been implemented in Indonesia in the last 15 years, including: periodic increase of tobacco tax, expansion of smoke free areas and working places, public transport facilities; requirement to put the health warning on cigarette packaging and restriction on broadcasting time of electronic advertisement. The Global Adult Tobacco Survey complements efforts of the National Institute of Health Research and Development Minister of Health in monitoring the tobacco problem periodically and provides comprehensive evidence and information for tobacco control planning, appropriate intervention and evaluation as well as to establish the national tobacco surveillance system. The results should also lead to identification of more appropriate interventions, improve implementation of existing programs and establish improved laws and regulations on tobacco control. The survey has been a collaborative activity of national institutions, namely: Statistics Indonesia/BPS and National Institute of Health Research & Development, MoH; international organizations that include: CDC Foundation and U.S. Centers for Disease Control and Prevention, Bloomberg Philanthropies, Tobacco Free Initiative WHO HQ, WHO SEARO and WHO Indonesia; to all of whom I’d like to express my gratitude and high appreciation. Hopefully, these nationally representative findings will significantly contribute to our efforts in prevention of health hazards due to tobacco use in Indonesia.
Nafsiah Mboi, M.D. (Ped.), M.P.H.
Minister of Health of the Republic of Indonesia

vii
BPS-Statistics Indonesia
Foreword
The Indonesian Law Act number 16, year 1997 about Statistics the BPS-Statistics Indonesia (BPS) shall collect, process, analyze, and disseminate information relating to basic to basic Statistics. However, the required information assembled by the World Health Organization (WHO) for tobacco use in Indonesia was collected by BPS whit collaborating whit the National Institute for Health Research and Development of Ministry of Health (NIHRD-MOH) Indonesia, and the centers for Disease Control and Prevention (CDC) Atlanta USA through the 2011 Indonesia Global Adult Tobacco Surey (IGATS)
The results of the 2011 IGATS have been analyzed and published in this report. BPS is grateful to all who have involved to conduct the survey and to prepare this publication, especially staffs of BPS, NIHRD-MOH, CDC, abd WHO’S experts who have introduced the data collecttion system by using hand held devices in the survey. Hopefully, this publication will be be used strongly for health policies and other purposes.
Jakarta, Agustus 2012
BPS-Statistics Indonesia
DR. Suryamin Chief Statistic

ix
Preface
Evidence based policy development on tobacco control at national and local levels is needed at various administrative levels. Indonesia is currently one of the countries with the highest level of smoking prevalence. This condition will lead to increase incidence of non-communicable diseases and will threaten the community health and economic security of lower and middle income countries like Indonesia as well as causes negative impact to health systems, households and individuals. The challenge is Indonesia will face higher levels of Non Communicable Diseases at earlier stages of economic development compared with developed countries and having less time to respond effectively. This report presents results of the 2011 Indonesian Global Adult Tobacco Survey Thailand and provides opportunities for national and international tobacco control partners to use in improving the tobacco control strategies and activities. The Report is presented in ten Chapters as follows: Chapter 1: Introduction—provides an overview of Burden of Tobacco in Indonesia, Current Tobacco Control Policies and Survey Objectives Chapter 2: Methodology—describes the survey methods and provides information on the study population, sampling design, questionnaires, data collection and statistical analysis. Chapter 3: Sample and Population Characteristics—describes the Indonesian population aged 15 years and above. The following six chapters address key survey findings by topic area found in the survey that include: Chapter 4: Tobacco Use; Chapter 5: Cessation; Chapter 6: Secondhand Smoke; Chapter 7: Economics; Chapter 8: Media and Chapter 9: Knowledge, Attitudes and Perceptions. Chapter 10: Conclusion; summarizes the conclusion of the 2011 Indonesian GATS. Hopefully this effort will contribute to the sustainable tobacco control programs in Indonesia and in designing more effective interventions.
Soewarta Kosen EDITOR

xi
Acknowledgements
The 2011–2012 Global Adult Tobacco Survey (GATS) in Indonesia was successfully completed due to the efforts and involvement of numerous organizations and individuals at different stages of the survey. We would like to thank everyone who helped to make the survey a success. First of all, we are grateful to the Ministry of Health in Indonesia for its leadership, vision and support. We would like to express our thanks to the Ministry of Health, Indonesia, for nominating the Badan Pusat Statistik (BPS)/Statistics Indonesia and the National Institute of Health Research and Development (NIHRD) as the implementing agencies for GATS in Indonesia, and for providing guidance and support throughout the process. At the BPS/Statistics Indonesia, we gratefully acknowledge Dr. Happy Hardjo, former Director for Population & Labour Statistics, for effective supervision and coordination of the project tasks related to GATS implementation that were carried out, Mr. Kadarmanto, for providing technical oversight and inputs during the sample design, selection and implementation of the survey and for expertise during sample weighting and country report writing; Mr. Guntjang Amanulla, for ongoing management of these tasks, especially for his dedicated work in preparing the country-specific version of the GATS questionnaire, data collection, implementation and quality assurance during the fieldwork. We would also like to thank Mr. Dwino Daries, Ms. Nila Nurmala, and Mr. Indra Cahyono, for IT administration, support and management throughout implementation of the survey. At the NIHRD, we express our gratitude to Dr. Soewarta Kosen, Senior Researcher and Ms. Ingan Tarigan, for their leadership in coordinating all the tasks related to GATS pretest implementation, data analysis and report writing. We would like to express our thanks to the World Health Organization (WHO), the US Centers for Disease Control and Prevention (CDC) and the CDC Foundation for their technical support and collaboration. We acknowledge the help and cooperation from the members of the GATS Questionnaire Review Committee, Sample Review Committee (SRC) and Analysis Review Committee for their technical reviews to ensure that the country report is internationally acceptable and comparable to other countries implementing GATS. We are grateful for the support we received from WHO Headquarters and Regional and Country Offices, especially from Dr. Dhirendra N. Sinha, Regional Advisor, Surveillance (Tobacco control), WHO SEARO, and Dr. Widyastuti Wibisana WR Indonesia Office, who were responsible for coordinating this survey. Their efforts and support enabled the smooth collaboration of all implementing agencies at all crucial stages of study realization. We would like to acknowledge the contributions of Mr Sameer Pujari from WHO Geneva, who provided technical support and coordination, especially questionnaire programming, staff training and data aggregation. We sincerely acknowledge the collaborative exchange and technical support from CDC. We acknowledge the outstanding partnership and support extended to all by Dr Samira Asma, Chief of the Global Tobacco Control Branch. We are also pleased to express our special thanks to Dr Krishna Mohan

xii
Palipudi, CDC focal point for Indonesia, for his continuous technical guidance and valuable support throughout all stages of the survey. Thanks are also due to Dr Linda Andes and Ms Glenda Blutcher-Nelson for their technical and statistical support during analysis and reporting of data. We also appreciate the coordination and support provided by Ms Sophia Song throughout the project. Thanks are due to Mr Edward Rainey and Mr Brian Taitt for their editorial and graphic support for the analytical tables, factsheets and reports.
I am also sincerely grateful to the Bloomberg Philanthropies for their collaboration and financial assistance in successfully conducting GATS in Indonesia. Many thanks are due to CDC Foundation, which provided the most modern electronic equipment for carrying out data collection. Special mention is due to Mr William Parra for his coordination and involvement in the project and Mr Brandon Talley for his guidance with respect to administrative and budget issues.
This acknowledgement would not be complete without expressing appreciation for the hard work put in by the interviewers, supervisors and IT personnel involved in collecting data for GATS in Indonesia. We also gratefully acknowledge the administrative, accounts and other staff of the BPS and NIHRD for their continuous cooperation during the entire project period. And last but not least, credit goes to all of the men and women who took the time to respond to the lengthy questionnaire with tremendous patience and without any expectation from GATS. Trihono, M.D., Ph.D. Director General, National Institute of Health Research & Development Ministry of Health Republic of Indonesia

xiii
CONTRIBUTORS
Soewarta Kosen
Happy Hardjo
Kadarmanto
Dhirendra N. Sinha
Krishna M. Palipudi
Widyastuti Wibisana
Ingan Tarigan

xv
TECHNICAL REVIEWERS
Trihono, Director General, National Institute of Health Research & Development, Indonesia Happy Hardjo, Badan Pusat Statistik/Statistics Indonesia Kadarmanto, Badan Pusat Statistik/Statistics Indonesia
Dhirendra N Sinha, Regional Advisor (Surveillance), Tobacco Free Initiative, WHO-SEARO Krishna Mohan Palipudi, Senior Survey Statistician, Global Tobacco Control Branch, CDC, Atlanta
Samira Asma, Chief, Global Tobacco Control Branch, CDC, Atlanta
Edited by
Soewarta Kosen, Center for Community Empowerment, Health Policy and Humanities,
National Institute of Health Research & Development, Ministry of Health Republic of Indonesia
Editorial Assistants
Edward O. Rainey, Global Tobacco Control Branch, CDC, Atlanta Brian Taitt, Global Tobacco Control Branch, CDC, Atlanta
xvii
Contents
CONTENTS PAGE NO.
FOREWORD ........................................................................................................................................................................ III
PREFACE ............................................................................................................................................................................. IX
ACKNOWLEDGEMENTS ....................................................................................................................................................... XI
CONTENTS ...................................................................................................................................................................... XVII
LIST OF TABLES .................................................................................................................................................................XIX
LIST OF FIGURES ..............................................................................................................................................................XXII
EXECUTIVE SUMMARY ....................................................................................................................................................XXIII
1. INTRODUCTION ........................................................................................................................................................... 1
1.1. BURDEN OF TOBACCO USE IN INDONESIA................................................................................................................. 1
1.2. HEALTH AND ECONOMIC IMPACT OF TOBACCO USE ................................................................................................ 3
1.3. TOBACCO CONTROL POLICIES .................................................................................................................................... 3
1.4. SURVEY OBJECTIVES ................................................................................................................................................... 4
2. METHODOLOGY .......................................................................................................................................................... 5
2.1. STUDY POPULATION .................................................................................................................................................. 5
2.2. SAMPLING DESIGN ..................................................................................................................................................... 5
2.3. SURVEY QUESTIONNAIRE ........................................................................................................................................... 5
2.4. QUESTIONNAIRE PROGRAMMING AND PREPARATION FOR ELECTRONIC DATA COLLECTION ................................. 6
2.5. RECRUITMENT, TRAINING AND FIELDWORK ............................................................................................................. 7
2.6. DATA PROCESSING AND AGGREGATION ................................................................................................................... 8
2.7. STATISTICAL ANALYSIS ............................................................................................................................................... 9
3. SAMPLE AND POPULATION CHARACTERISTICS .......................................................................................................... 10
3.1. COVERAGE OF THE SAMPLE ..................................................................................................................................... 10
3.2. CHARACTERISTICS OF SURVEY RESPONDENTS ........................................................................................................ 10
4. TOBACCO USE ........................................................................................................................................................... 14
4.1. PREVALENCE OF TOBACCO USE ............................................................................................................................... 14
4.2. NUMBER OF TOBACCO USERS ................................................................................................................................. 15
4.3. PREVALENCE OF CURRENT SMOKERS BY SMOKED TOBACCO PRODUCTS .............................................................. 16
4.4. NUMBER OF CURRENT SMOKERS BY SMOKED TOBACCO PRODUCTS ..................................................................... 20
4.5. FREQUENCY OF TOBACCO USE ................................................................................................................................ 24
4.6. AVERAGE NUMBER OF ANY CIGARETTE SMOKED PER DAY ..................................................................................... 35
4.7. AGE AT SMOKING INITIATION .................................................................................................................................. 42
4.8. FORMER DAILY SMOKING PREVALENCE AND QUIT RATIO ...................................................................................... 44
4.9. TIME SINCE QUITTING SMOKING ............................................................................................................................. 45
4.10. TYPE OF CURRENT TOBACCO USE ............................................................................................................................ 46
4.11. TIME TO FIRST CIGARETTE OF THE DAY ................................................................................................................... 48
4.12. USE OF ELECTRONIC CIGARETTES ............................................................................................................................ 49
5. CESSATION ................................................................................................................................................................ 51
5.1. SMOKING CESSATION AND HEALTH-CARE SEEKING BEHAVIOURS .......................................................................... 51

xviii
5.2. CESSATION METHODS .............................................................................................................................................. 54
5.3. INTEREST IN QUITTING SMOKING AND SMOKELESS TOBACCO ............................................................................... 55
6. SECOND-HAND SMOKE ............................................................................................................................................. 57
6.1. SHS EXPOSURE IN INDOOR WORKPLACES ............................................................................................................... 57
6.2. SHS EXPOSURE AT HOME ......................................................................................................................................... 60
6.3. EXPOSURE TO SHS IN PUBLIC PLACES ...................................................................................................................... 61
7. ECONOMICS .............................................................................................................................................................. 67
7.1. LAST BRAND OF KRETEK CIGARETTES PURCHASED ................................................................................................. 67
7.2. SOURCE OF LAST PURCHASE OF KRETEK CIGARETTES ............................................................................................. 69
7.3. EXPENDITURE ON CIGARETTES ................................................................................................................................ 69
8. MEDIA ....................................................................................................................................................................... 71
8.1. PERCENTAGE OF ADULTS 15 YEARS AND ABOVE WHO NOTICED ANTI-SMOKING INFORMATION DURING THE
PAST 30 DAYS IN VARIOUS PLACES....................................................................................................................................... 72
8.2. NOTICED HEALTH WARNING LABELS ON CIGARETTE PACKAGES AND THOUGHT ABOUT QUITTING ..................... 74
8.3. MARKETING ............................................................................................................................................................. 76
9. KNOWLEDGE, ATTITUDES AND PERCEPTIONS ........................................................................................................... 80
9.1. BELIEFS ABOUT THE ILL EFFECTS OF TOBACCO USE ................................................................................................ 80
9.2. BELIEFS ABOUT HEALTH EFFECTS OF SECOND-HAND SMOKE ................................................................................. 81
10. CONCLUSION AND RECOMMENDATIONS .............................................................................................................. 91
10.1. CONCLUSION ............................................................................................................................................................ 91
10.2. RECOMMENDATIONS .............................................................................................................................................. 91
BIBLIOGRAPHY .................................................................................................................................................................. 94
APPENDIX A: ESTIMATES OF SAMPLING ERRORS ............................................................................................................... 96
APPENDIX B: SAMPLE DESIGN ......................................................................................................................................... 104
APPENDIX C: GLOSSARY AND ABBREVIATIONS ................................................................................................................ 111
APPENDIX D: TECHNICAL AND SURVEY STAFF .................................................................................................................. 113
APPENDIX E: QUESTIONNAIRES ....................................................................................................................................... 120
APPENDIX F: MPOWER SUMMARY INDICATORS .............................................................................................................. 162

xix
List of Tables
Table No. Table Name Page No.
Sample and Population Characteristics
Table 3.1 Number and percentage of households and persons interviewed and response rates by
residence (unweighted)– GATS Indonesia, 2011……………………………………………………………………………
12
Table 3.2 Distribution of adults 15 years and above by gender and selected demographic characteristics –
GATS Indonesia, 2011……………………………………………………………………………………………………………………
13
Tobacco Use
Table 4.1 Percentage of adults 15 years and above, by detailed smoking status, gender and residence –
GATS Indonesia, 2011……………………………………………………………………………………………………………………
15
Table 4.1A Percentage of adults 15 years and above, by detailed smokeless tobacco use status, gender and
residence – GATS Indonesia, 2011…………………………………………………………………………………………………
15
Table 4.2 Number of adults 15 years and above, by detailed smoking status, gender and residence – GATS
Indonesia, 2011……………………………………………………………………………………………………………………………..
16
Table 4.2A Number of adults 15 years and above, by detailed smokeless tobacco use status, gender and
residence – GATS Indonesia, 2011…………………………………………………………………………………………………
16
Table 4.3 Percentage of adults 15 years and above who are current smokers of various smoked tobacco
products, by gender and selected demographic characteristics – GATS Indonesia, 2011……………….
18
Table 4.4 Number of adults 15 years and above who are current smokers of various smoked tobacco
products, by gender and selected demographic characteristics – GATS Indonesia, 2011……………….
21
Table 4.5 Percentage distribution of adults 15 years and above, by tobacco smoking frequency, gender and
selected demographic characteristics – GATS Indonesia, 2011………………………………………………………
25
Table 4.5A Percentage distribution of adults 15 yearsand above, by white cigarette smoking frequency,
gender and selected demographic characteristics – GATS Indonesia, 2011……………………………………
28
Table 4.5B Percentage distribution of adults 15 years and above, by hand-rolled cigarette smoking
frequency, gender and selected demographic characteristics – GATS Indonesia, 2011………………….
31
Table 4.5C Percentage distribution of adults 15 years and above, by kretek cigarette smoking frequency,
gender and selected demographic characteristics – GATS Indonesia, 2011……………………………………
34
Table 4.6 Average number and percentage distribution of any cigarette smoked per day among daily
cigarette smokers 15 years and above, by gender and selected demographic characteristics –
GATS Indonesia, 2011……………………………………………………………………………………………………………………
38
Table 4.6A Average number and percentage distribution of white cigarettes smoked per day among daily
white cigarette smokers 15 years and above, by gender and selected demographic
characteristics – GATS Indonesia, 2011………………………………………………………………………………………….
39
Table 4.6B Average number and percentage distribution of hand-rolled cigarettes smoked per day among
daily hand-rolled cigarette smokers 15 years and above by gender and selected demographic
characteristics – GATS Indonesia, 2011…………………………………………………………………………………………
40
Table 4.6C Average number and percentage distribution of kretek cigarettes smoked per day among daily
kretek smokers 15 years and above by gender and selected demographic characteristics – GATS
Indonesia, 2011……………………………………………………………………………………………………………………………..
41

xx
Table 4.7 Percentage distribution of ever daily smokers 20–34 years old by age at daily smoking initiation,
gender and residence – GATS Indonesia, 2011………………………………………………………………………………
43
Table 4.8 Percentage of all adults and ever daily smokers 15 years and above who are former daily
smokers, by selected demographic characteristics – GATS Indonesia, 2011…………………………………..
45
Table 4.9 Percentage distribution of former daily smokers 15 years and above, by time since quitting
smoking and selected demographic characteristics – GATS Indonesia, 2011…………………………………
46
Table 4.10 Percentage distribution of current tobacco users 15 years and above, by tobacco use pattern and
selected demographic characteristics – GATS Indonesia, 2011……………………………………………………...
47
Table 4.11 Percentage distribution of daily tobacco smokers 15 years and above, by time to first smoke
upon waking and selected demographic characteristics – GATS Indonesia, 2011…………………………
49
Table 4.12 Percentage of adults 15 years and above, who have heard of and currently use electronic
cigarettes, GATS Indonesia, 2011…………………………………………………………………………………………………..
50
Cessation
Table 5.1 Percentage of current and former smokers 15 years and above who made a quit attempt and
received health-care provider advice in the past 12 months, by selected demographic
characteristics – GATS Indonesia, 2011………………………………………………………………………………………….
52
Table 5.2 Percentage of current smokers 15 years and above who attempted to quit smoking in the past
12 months, by cessation methods used and selected demographic characteristics – GATS
Indonesia, 2011……………………………………………………………………………………………………………………………..
54
Table 5.3 Percentage distribution of current smokers 15 years and above by interest in quitting smoking
and selected demographic characteristics – GATS Indonesia, 2011……………………………………………….
56
Second-hand Smoke
Table 6.1 Percentage and number of adults 15 years and above who work indoors and are exposed to
tobacco smoke at work, by smoking status and selected demographic characteristics – GATS
Indonesia, 2011……………………………………………………………………………………………………………………………..
58
Table 6.2 Percentage and number of adults 15 years and above who are exposed to tobacco smoke at
home, by smoking status and selected demographic characteristics – GATS Indonesia, 2011……….
61
Table 6.3 Percentage of overall adults 15 years and above who visited various public places in the past 30
days and were exposed to tobacco smoke, by smoking status and selected demographic
characteristics – GATS Indonesia, 2011………………………………………………………………………………………….
63
Table 6.3A Percentage of overall adults 15 years and above who visited various public places in the past 30
days and were exposed to tobacco smoke, by smoking status and selected demographic
characteristics – GATS Indonesia, 2011………………………………………………………………………………………….
65
Economic Aspects of Tobacco Use
Table 7.1 Percentage of current kretek cigarette smokers 15 years and above, by last brand purchased and
selected demographic characteristics – GATS Indonesia, 2011……………………………………………………...
68
Table 7.2 Percentage distribution of kretek cigarette smokers 15 years and above, by the source of last
purchase of kretek cigarettes and selected demographic characteristics – GATS Indonesia, 2011…
69
Table 7.3 Average price paid and expenditure on kretek cigarettes among users of these products aged
15 years and above, by selected demographic characteristics – GATS Indonesia, 2011………………...
70

xxi
Media
Table 8.1 Percentage of adults 15 years and above who noticed anti-smoking information during the past
30 days in various places, by smoking status and selected demographic characteristics – GATS
Indonesia, 2011……………………………………………………………………………………………………………………………..
73
Table 8.2 Percentage of current smokers 15 years and above who noticed health warnings on cigarette
packages and considered quitting because of the warning labels during the past 30 days, by
selected demographic characteristics – GATS Indonesia, 2011………………………………………………………
75
Table 8.3 Percentage of adults 15 years and above who noticed cigarette marketing during the past 30
days in various places, by selected demographic characteristics – GATS Indonesia, 2011……………..
77
Table 8.3A Percentage of adults 15 years and above who noticed white cigarette marketing during the past
30 days in various places, by selected demographic characteristics – GATS Indonesia, 2011…………
78
Table 8.3B Percentage of adults 15 years and above who noticed kretek cigarette marketing during the past
30 days in various places, by selected demographic characteristics – GATS Indonesia, 2011…………
79
Knowledge, Attitudes and Perceptions
Table 9.1 Percentage of adults 15 years and older who believe that smoking causes serious illness, stroke,
heart attack or lung cancer, by selected demographic characteristics – GATS Indonesia, 2011……..
83
Table 9.1A Percentage of adults 15 years and above who believe that smoking causes serious illness, stroke,
heart attack or lung cancer, by smoking status and selected demographic characteristics – GATS
Indonesia, 2011……………………………………………………………………………………………………………………………..
86
Table 9.1B Percentage of adults 15 years and above who believe that using smokeless tobacco causes
serious illness by the status of smokeless tobacco use and selected demographic characteristics
– GATS Indonesia, 2011…………………………………………………………………………………………………………………
89
Table 9.2 Percentage of adults 15 years and above who believe that breathing other people's smoke
causes serious illness in non-smokers, by smoking status and selected demographic
characteristics – GATS Indonesia, 2011………………………………………………………………………………………….
90
Appendices
Table A.1 List of indicators for sampling errors, GATS 2011………………………………………………………………………….. 98
Table A.2 Sampling errors – overall, GATS Indonesia, 2011………………………………………………………………………….. 99
Table A.3 Sampling errors – men, GATS Indonesia, 2011……………………………………………………………………………... 100
Table A.4 Sampling errors – women, GATS Indonesia, 2011…………………………………………………………………………. 101
Table A.5 Sampling errors – urban, GATS Indonesia, 2011……………………………………………………………………………. 102
Table A.6 Sampling errors – rural, GATS Indonesia, 2011……………………………………………………………………………… 103
Table B.1 Total number of PSUs by classification areas, GATS Indonesia, 2011…………………………………………….. 105
Table B.2 Total number of sample PSUs by place of residence and region, GATS Indonesia, 2011……………….. 106
Table F.1 MPOWER summary indicators, GATS Indonesia, 2011………………………………………………………………….. 162

xxii
List of Figures
Figure No. Figure Name Page No.
Figure 2.1 Data transmission process – GATS Indonesia, 2011………………………………………………………………………. 9
Figure 4.1 Types of products smoked among current cigarette smokers – GATS Indonesia, 2011…………………. 17
Figure 4.2 Prevalence of current tobacco use by type of product used and gender – GATS Indonesia, 2011 48
Figure 5.1 Percentage of quit attempts and advice by health-care providers to quit smoking by gender –
GATS Indonesia, 2011……………………………………………………………………………………………………………………
55
Figure 6.1 Exposure to second-hand smoke at the workplace, home and various public places, by gender –
GATS Indonesia, 2011……………………………………………………………………………………………………………………
58
Figure 8.1 Noticing anti- and pro-cigarette smoking information, by gender – GATS Indonesia, 2011…………… 72
Figure 9.1 Beliefs about the health effects of smoking and second-hand smoke, by gender and age group –
GATS Indonesia, 2011……………………………………………………………………………………………………………………
82
Figure B.1 Distribution of districts where PSUs were selected – GATS Indonesia, 2011…………………………………. 107

xxiii
Executive Summary
The Global Adult Tobacco Survey (GATS), 2011 in Indonesia is a nationally representative household survey of all non-
institutionalized men and women aged 15 years and above. It is designed to produce internationally comparable data on
tobacco use and tobacco control measures using a standardized questionnaire, sample design, data collection and
management procedures.
The survey used a four-stage stratified cluster sampling and was designed to produce key indicators for the country as a
whole, and was also stratified by men and women as well as urban and rural areas. In the first stage, 50 urban primary
sampling units (PSUs) and 50 rural PSUs were selected, from which a total of 8994 households were selected, of which 8581
completed interviews. One individual was then randomly chosen from among the eligible persons in each of these
households using a handheld electronic data collection device. Of them, 8305 completed individual interviews with an
overall response rate of 94.3%. Data collected from these individuals provided information on tobacco use, cessation,
second-hand smoke, economics, media, and knowledge, attitudes and perceptions.
The GATS was conducted by BPS-Statistics Indonesia, in collaboration with the National Institute of Health Research and
Development (NIHRD), Ministry of Health (MOH). Technical assistance was provided by WHO and the United States Centers
for Disease Control and Prevention (CDC). Financial support for the survey was provided by the Bloomberg Philanthropies.
Tobacco use: In Indonesia, 67.4% of men and 4.5% of women comprising 36.1% of the population (61.4 million) currently
use tobacco in smoked or smokeless form. Tobacco use is more prevalent in rural areas (39.1%) as compared to urban areas
(33.0%). In Indonesia, smoking is the main form of tobacco use and 34.8% (59.9 million) of the adult population currently
smoke tobacco. The prevalence of smoking is 67.0% (57.6 million) among men and 2.7% (2.3 million) among women.
Among the adult population, 56.7% of adult men (57.6 million), 1.8% of adult women (1.6 million) and 29.2% overall (50.3
million) are daily smokers. Currently, smoking is more prevalent in rural areas (37.7%) as compared to urban areas
(31.9%).
Among those who are currently tobacco users, the majority (34.6%) consume cigarettes of any kind (kretek, white cigarette
or hand-rolled), while only 0.3% consume other smoked tobacco products such as pipe, cigar, shisha, etc. Among the types
of cigarettes, kretek is the most popular (31.5%), followed by hand-rolled (4.7%) and white cigarette (2.2%). Kretek
smoking is more common among men (60.9%) as compared to women (2.3%) and more in rural areas (34.5%) as compared
to urban areas (28.6%).
Kretek smoking increased by age ; from 25.2% in age group 15–24 years to 34.6% and 35.2% in age group 25–44 and 45–
64 years respectively, however it showed a decline in much older group ( 65 years and above ,21.5%). The prevalence of
hand-rolled cigarette smoking increases with age, and is highest among those aged 65+ years (13.2%) while white cigarette
smoking did not show the increasing pattern by age. The prevalence of kretek smoking among college and university-
educated people was lowest (25.6%) compared with those who had completed primary school (33.9%).
The overall average numbers of cigarettes smoked per day is 12 sticks (13 sticks for men and eight sticks for women). The
average age at initiation of daily smoking is 17 years; this is the same for urban and rural areas. Overall, 29.2% are daily
smokers and 5.6% are occasional smokers. The prevalence of daily smoking is highest in the 45–64 years age group (33.5%)
and among those who are self-employed (43.4%). Daily smoking is higher in rural than in urban areas (26.3% and 32.2%,
respectively), while occasional smoking is the same in both areas. Occasional smoking is highest among those in the 15–24
years age group, and those who were unemployed (7%) and self-employed (6.9%).

xxiv
The average age overall at initiation of daily smoking is 17.6 years. There is no difference in age at initiation of smoking
among urban and rural areas (17.7 and 17.5 years, respectively), and those who are college or university educated had a
slightly higher age at initiation (19.5 years).
Cessation: Nearly 50% of current smokers plan or are thinking about quitting; however, only 10% plan to quit within 12
months. More than a quarter of smokers (30.4%) made an attempt to quit in the past 12 months. Among those who visited
a health-care facility, 40.5% were asked about their history of tobacco smoking and 34.6% were advised to quit smoking. Of
those who attempted to quit during the past 12 months, 7.0% had counseling and 70.7% quit without assistance.
Second-hand smoke: Among all adults, 51.3% (14.6 million) were exposed to tobacco smoke at the workplace. Men (58.0%)
were exposed more often than women (41.4%). At home, 78.4% of adults (133.3 million) were exposed to tobacco smoke.
Among people who visited restaurants, 85.4% were exposed to tobacco smoke, while among those who used public
transportation, 70% were exposed.
Economics: Among kretek cigarette smokers, 79.8% bought their last cigarette in a kiosk. Average cigarette expenditure per
month among kretek cigarette smokers was IDR 369 948. The average price per 20 sticks paid by kretek cigarette smokers
was IDR 12 719. The price paid was higher in urban areas (IDR 14 095) as compared to only IDR 11 615 in rural areas.
Gudang garam was the most popular brand purchased by current kretek cigarette smokers (21.8%). The second most
popular brand was Djarum (18.8%). Sampoerna, Dji Sam Soe, and Tali Jagad with 15.4%, 6% and 5.3%, respectively were
the third, fourth and fifth most popular brands.
Media: Nearly one quarter of the adult population (23.1%) noticed anti-white cigarette smoking information, mostly on
television or radio. The number was much higher for anti-kretek cigarette smoking on the same media (40.3%). Cigarette
marketing in stores where cigarettes are sold was noticed by nearly half of the adult population (47.6%).Nearly four in five
people (82.5%) noticed any cigarette advertisement and promotion (other than in stores or sporting events sponsorships).
Among current smokers, 72.2% noticed health warnings on cigarette packages; 27.1% of them thought about quitting
smoking because of those warnings.
Knowledge, attitude and perceptions: Overall, four in five people (86.0%) believe that smoking causes serious illness such
as heart attack (81.5%) and lung cancer (84.7%). However, fewer people know that smoking causes other specific illnesses
– premature birth (49.5%), stroke (45.5%) and chronic obstructive pulmonary disease (36%). Overall, 23.9% of adults
believe that smokeless tobacco use causes serious illness, whereas 73.7% believe that exposure to second-hand smoke
causes serious illness in non-smokers.
Policy implications: GATS provides critical information on key indicators of tobacco control by sociodemographic
characteristics and creates an opportunity for policy-makers and the tobacco control community at different levels to make
or modify targeted interventions in different areas of tobacco control. Overall, findings from GATS indicate that there is a
positive environment for tobacco control. Based on the findings and the MPOWER framework, the specific
recommendations are:
• Tobacco control awareness programs be designed to cover all types of tobacco products and in such a way that all
subpopulations have equal access to the interventions and information.
• Periodic monitoring of tobacco use be continued to implement the MPOWER policy package.
• Build capacity among health-care providers and create cessation facilities in health care settings as well as in local
communities.
• Implement 100% smoke-free policies that cover all public places and workplaces to fully protect nonsmokers from
exposure to secondhand smoke.
• Utilize effective anti-smoking media messages and pictorial health warnings on all tobacco products.
• Implement advertising restrictions with effective enforcement which are shown to have a significant impact on
reducing tobacco use.
• Raise the price of tobacco products to make it unaffordable to buy tobacco products for the people at large.

1 Introduction
1. Introduction
Indonesia is a huge archipelagic country extending 5120 km from east to west and 1760 km from north to south. It
encompasses 13 667 islands, only 6000 of which are inhabited. Indonesia's total land area is 1 919 317 sq. km. Included in
Indonesia's total territory is another 93 000 sq. km of inland seas (straits, bays and other water bodies). The population of
Indonesia was 237.6 million in 2010. The growth rate is high, at 1.9%. Fifty-eight per cent of the population lives on the
island of Java, the world's most populous island.
In August 2006, the World Health Organization (WHO) and the US Centers for Disease Control and Prevention (CDC)
convened an expert consultation to discuss adult tobacco surveillance and make recommendations for the development of
a standard survey protocol. The expert consultation also recognized the challenges of limited funding and methodological
complexities when conducting systematic adult tobacco surveys, and identified a lack of comparability in ongoing national
surveys.
The Bloomberg Initiative to Reduce Tobacco Use offers resources to fill the data gap for measuring adult tobacco use
globally and to optimize the reach and results of the ongoing Global Tobacco Surveillance System (GTSS), which comprises
three school-based surveys for youth and selected adult populations – the Global Youth Tobacco Survey (GYTS), the Global
School Personnel Survey (GSPS) and the Global Health Professions Students Survey (GHPSS), and a household-based survey,
the Global Adult Tobacco Survey (GATS). Results from the GATS will assist countries in the formulation, tracking and
implementation of effective tobacco control interventions, and enable them to compare results of their survey with results
from other countries where GATS has been conducted.
In the first phase, GATS was completed in 14 countries of the world between 2008 and 2010, covering over 50% of the
world’s population. By the completion of second phase, the survey will cover 58% of the world’s population, including
Indonesia.
1.1. Burden of tobacco use in Indonesia
Indonesia is the fifth-largest producer of tobacco leaf. It is among the five topmost producers and exporters of cigarettes.
Indonesia is the fourth-largest cigarette consuming country. It ranks third in the number of men smokers and 17th for
women smokers. In 2008, cigarette consumption in Indonesia was 225 000 000 billion sticks. The country is the third-largest
cigarette consumer in the world.
The National Baseline Health Research in 2010 showed that the average consumption of cigarettes per person (aged 15
years or above) was 12 sticks/day, ranging from nine sticks in Bali to 19 sticks in Aceh. It was also found that those who had
a higher education level were less likely to use tobacco. The prevalence of smoking among university graduates was 20.6%
compared to 26.3% among those without schooling. The prevalence of smoking among those aged 15 years or above in
different years was obtained from the National Socioeconomic Survey (SUSENAS) and basic health surveys (one of the
subset samples of SUSENAS . The questionnaire was mainly based on tobacco smoking. Questions on chewing tobacco
products were not included. In the questions on smoking, changes were made between surveys, with some questions being
deleted and some added. SUSENAS includes samples of people in the age group of 10+ years .
The percentages of smokers aged 15 years and above by sex in Indonesia from 1995 to 2010 were as follows:
Year Men Women Total 1995 53.9 1.7 27.2 2001 62.9 1.4 31.8 2004 63.0 5.0 35.0 2007 65.3 5.6 35.4 2010 65.9 4.2 34.7

2 Introduction
SUSENAS also collects information on exposure to second-hand smoke in homes. In 2010, about 35% of people were
exposed to second-hand smoke at home. The questionnaire on exposure to second-hand smoke was changed between
1995 and 2001.
Several retrospective studies in Indonesia showed a relationship between smoking behaviour and the risk of developing
cardiovascular diseases (including stroke), respiratory diseases and cancer.The Baseline Health Research 2007 revealed that
stroke is the leading cause of death (15.4% of total deaths), followed by neoplasm (5.7%) and coronary heart disease
(5.1%). The prevalence of smoking among Indonesians aged 15 years and above is 34.7% (28.2% daily smokers and 6.5%
occasional smokers). About 30.8% of the rural population and 25.9% of the urban population smoke every day. The
average number of sticks consumed per person per day is 12. The ageat initiation of smoking and percentages for each age
group are: 5–9 years (1.7%); 10–14 years (17.5%); 15–19 years (43.3%); and 20–24 years (14.6%). The prevalence of
smoking at home is 76.1%, of whom the largest proportion is in the Central Sulawesi Province (90.3%) and Jambi Province
(90.0%). About 35.0% of smokers belong to the lowest socioeconomic group (first quintile).
1.1.1. Smoking products in Indonesia
Kreteks (pronounced “cree-techs”) are clove cigarettes. Kreteks are popular in Indonesia, and typically contain a mixture
consisting of tobacco, cloves and other additives. Broadly speaking, there are two types of manufactured cigarettes in
Indonesia–kreteks and white cigarettes. There is also a major market for non-factory made cigarettes, which are clove
cigarettes that may be either filtered or unfiltered. The kretek (clove-blended) cigarette dominates the market in both the
machine-made and hand-rolled categories. The name kretek is derived from the crackling sound that results from burning
of the tobacco–clove mixture. The total sales of machine-made cigarettes (kreteks and white cigarettes) was some 180
billion sticks in 2010, up 4.5% from 2009 (Euromonitor 2011). White cigarettes accounted for some 12% of the total
(machine-made) market volume in 2010, the remaining being kreteks. White cigarettes are mainly imported (global) brands
and are hampered by the restriction on television advertisements for foreign brands. All global brands except for Marlboro
Mix 9 are white cigarettes. Global brands excluding Marlboro Mix 9 are sold in packs of 20 sticks, while local brand clove
cigarettes are sold in packs of 12 and 16 sticks. Indonesia is a unique cigarette market because of kreteks and the strength
of the “cottage” sector that produces hand-rolled cigarettes. Hand-rolled kreteks are strongly associated with 12-stick
packaging. Country local brands of white cigarettes are sold in 20-stick packs.
Indonesian kreteks, both machine-manufactured and hand-rolled, have a higher tar level than white cigarettes (more than
10 mg tar). The most common tar level for “mild” kreteks is 14 mg tar and 1 mg nicotine. Indonesia is one of the world's
most attractive cigarette markets and international companies have been keen to establish themselves. The major cigarette
manufacturers are Gudang Garam, HM Sampoerna (PMI), Djarum, Bentoel (BAT) and Nojorono. In 2010, the top three
cigarette manufacturers accounted for some two thirds of the total machine-made cigarette volume sales, with Gudang
Garam being the market leader. (However, if hand-rolled cigarettes were included, total volume sales of Sampoerna would
exceed those of Gudang Garam.) Standardized machine-smoking analyses indicate that kreteks deliver more nicotine,
carbon monoxide and tar than conventional cigarettes. Kretek smoking is associated with an increased risk of acute lung
injury, especially among susceptible individuals with asthma or respiratory infections. Research shows that regular kretek
smokers have 13–20 times the risk of abnormal lung function compared with non-smokers.
1.1.2. Tobacco use among specific populations
The GYTS 2009 in Java and Sumatra showed a smoking prevalence among junior high school students(13–15 years) of
20.3%. About 72.4% of students reported exposure to second-hand smoke at home and 78.1% at public places. The GSPS
2009 showed that tobacco use prevalence among junior high school teachers was 18.9% and among administrative
personnel it was 31.3% . The GHPSS among third-year men medical and dental students revealed that the prevalence of
cigarette smoking was 19.8% and 39.8%, respectively and use of tobacco products other than cigarette smoking was 2.2%
and 4.7%, respectively.

3 Introduction
1.2. Health and economic impact of tobacco use
Based on the Baseline Health Research 2010, an average of 12 cigarettes sticks is consumed per person per day at an
average price of IDR 600.00 per stick; the expenditure for tobacco per person per day is thus IDR 7200.00 or IDR 216 000.00
per person per month. This expenditure is larger than the Conditional Cash Transfer (CCT) programme for poor families of
IDR 100 000.00 per family per month.
The total medical expenditure on selected major diseases (629 017 hospitalized cases) attributed to tobacco use in 2010
was IDR 1.85 trillion; these included chronic obstructive pulmonary disease, coronary heart disease, selected
neoplasms/cancers and perinatal disorders. It is estimated that there were 1 258 034 ambulatory cases of tobacco-related
diseases. With the average expenditure per patient per visit (without subsidy) of IDR 208.337, the total expenditure for
ambulatory services in 2010 was IDR 0.26 trillion. It is estimated that in 2010, 190 260 Indonesians (100 680 men and 89
580 women) died due to tobacco-related diseases, accounting for 12.7% of the total deaths in 2010, which was 1 539
288.The total disability-adjusted life years (DALYs) lost due to premature mortality and disabilities in 2010 was 3 533 000
DALYs .
The World Bank and WHO study in 2005 found that low-income households spent 7.2% of their income on tobacco.
Affordability of cigarettes has increased in the past decade in Indonesia. Households with smokers spent an average of
11.5% on tobacco products, compared with 11.0% on fish, meat, eggs and milk combined, 2.3% on health and 3.2% on
education. Tobacco in Indonesia became 50% more affordable between 1980 and 1998. Cigarette taxes and prices in
Indonesia are low relative to other low-income countries and regional averages.Overall, real cigarette prices have remained
remarkably stable between 1970 and 2005.
1.3. Tobacco control policies
Indonesia is the only country in the South-East Asia Region that has not signed the Framework Convention on Tobacco
Control (FCTC); however , Indonesia is committed to implementing the MPOWER policy package (61st Regional Committee
resolution). Government Regulation No 81/1999 on Tobacco Control was issued as an implementation document for
tobacco control measures stated in the 1992 Health Law. The articles include regulations on advertisements, health
warning labels, restrictions on tar and nicotine levels, public disclosure of cigarette content, penalties and enforcement,
regulatory authority, public participation and provisions for a smoke-free environment. This regulation, however, did not
address issues on economics, liability, sale to minors and sponsorships.
The Government Regulation No 38/2000 on Tobacco Control basically revised the Regulation No 81/1999 on tobacco
advertisements (permitting advertisements in the electronic media, in addition to printed and outdoor media) and
prolonging the deadline for industries to comply with new regulations to five to seven years, depending on the type of
industry. In 2003, the government issued Regulation No 19/2003 which replaced Regulation No 38/2000 and included
aspects related to the size and types of messages in health warning labels, time restrictions for advertising in the electronic
media and testing of tar and nicotine levels.
The Indonesian Health Law (Law No 36/2009 on Health) states that tobacco and tobacco products are considered as
addictive substances and will be regulated to protect the health of the individual, family, community as well as the
environment. Based on this law, a government regulation on tobacco control has been prepared; the proposed regulation is
still being debated. Besides, in the past seven years, more than 20 local governments (province, district and city) have
enacted local laws on smoke-free environments.
The Indonesian Ministry of Health has also appointed a Tobacco Control Focal Point at the Directorate General of Disease
Control and Environmental Health to coordinate technical activities and prepare regulations on tobacco control. There are
many nongovernment organizations (NGOs) working on tobacco control activities. The Bloomberg Initiative to Reduce
Tobacco Use of Bloomberg Philanthropies has supported tobacco control initiatives at the national and subnational levels.

4 Introduction
Indonesia implemented GATS in 2011.GATS enhances the country’s capacity to design, implement and evaluate tobacco
control programmes and provides key indicators for monitoring the MPOWER policy package. An efficient and systematic
surveillance mechanism to monitor the epidemic is one of the essential components of a comprehensive tobacco control
programme.
1.4. Survey objectives
The objectives of the GATS are as follows:
To systematically monitor adult tobacco use (smoking and smokeless) and track key tobacco control indicators in a
nationally representative sample (of the country)
To track implementation of FCTC-recommended policies outlined in the MPOWER package.
More specifically, the objectives of the survey are to provide up-to-date information on adult tobacco use for both smoked
and smokeless tobacco products and key tobacco control measures. The survey also provides an opportunity to compare
population estimates of tobacco users at the national level as well as stratified by urban/rural areas and gender.

5 Methodology
2. Methodology
The GATS is the global standard for systematically monitoring adult tobacco use (smoked and smokeless) and tracking key
tobacco control indicators. The GATS is a nationally representative survey, using a consistent and standard protocol across
countries, including Indonesia. The data will assist countries to track technical components of the WHO MPOWER package.
2.1. Study population
The target population for this survey includes all adult men and women in Indonesia aged 15 years and above. This target
population includes all people who consider Indonesia to be their usual place of residence, covering 98.4% of the total
population in Indonesia. This definition includes those individuals residing in Indonesia even though they may not be
considered a citizen of the country. The only adults who were excluded from the study were those individuals visiting
Indonesia, e.g. tourists, those who indicated that their primary place of residence was a military base or group quarters, e.g.
a dormitory, and those who were institutionalized—including people residing in hospitals, prisons, nursing homes and other
such institutions. In addition, eligible respondents could withdraw from the study at any time. They also had a right to
refuse to answer any question without providing a reason for their decision.
2.2. Sampling design
The sampling frame used for the GATS Indonesia sample design (see Appendix B for details) was a census block (CB),
obtained from the Population Census of Indonesia conducted by BPS-Statistics Indonesia in 2010. The survey applied a four-
stage stratified cluster sampling. In the first stage, 100 primary sampling units (PSUs) (50 in urban areas and 50 in rural
areas) were selected using the probability proportional to size (PPS) sampling technique. The PSU consisted of a group of
CBs in a subdistrict within the same type of area (urban/rural). The next stage was to select three secondary sampling units
(SSUs), i.e. CBs per selected PSU, also using PPS. After updating the list of population census households in selected CBs, in
the third stage, 30 households were selected systematically from the list of updated households. In the final stage, one
respondent is randomly selected to participate in the survey.
The explicit stratification used at the first stage of selection was based on urban and rural designations of BPS-Statistics
Indonesia, as well as on four regions (Sumatra, Java–Bali, Kalimantan–Nusa Tenggara, and the eastern part of Indonesia).
SSUs were based on CBs created for the 2010 Population Census of Indonesia, which generally comprised 80–120
households.
Following the standard protocol of GATS, the initial target was a representative sample of 8000 non-institutionalized
households subject to the applicable non-response and eligibility rates (a target sample of 2000 households each in urban,
rural, men and women subgroups). After accounting for possible non-response and eligibility rates, it was decided to have
an average of 30 households in most of the selected SSUs/CBs, resulting in a total sample size of 8994 non-institutionalized
households. As per the design, one respondent was randomly selected for the interview from each selected eligible
household to participate in the survey. The Indonesian sample design provides cross-sectional estimates for the country as
a whole as well as by urban/rural areas and gender.
2.3. Survey questionnaire
GATS Indonesia collected information on a variety of indicators that will assist in monitoring the prevalence of tobacco use.
Two types of questionnaires were used – the household questionnaire and the individual questionnaire for all adults aged
15 years and above. The household and individual questionnaires were based on the GATS core questionnaire and optional
questions, which were designed for use in countries implementing GATS. These questionnaires were adapted and modified
to reflect the relevant issues applicable for the country situation in consultation with the NIHRD, BPS-Statistics Indonesia,
WHO Country Office and Technical Committee under the MOH (see Appendix D). The adaptations took place during the
GATS Technical Workshop conducted in February 2011 in Atlanta, USA in consultation with CDC and WHO Regional Office

6 Methodology
for South-East Asia (WHO SEARO). The adapted questionnaires were approved by a questionnaire review committee (QRC).
The questionnaires were developed in English and later translated into Indonesian. The questionnaires were also back-
translated to English to check the quality of translation before being used for field implementation. The questionnaires
were pretested during the pilot conducted in Bogor City and Bogor District in May 2011 and finalized in July after
incorporating the changes suggested from the pretest experience.
2.3.1. Household questionnaire
The household questionnaire collected information on all the usual residents in the sampled household to identify eligible
persons from the household and capture their basic information so that a random eligible respondent could be selected for
the individual questionnaire. For all listed household members, basic information on age and gender was collected. The
information on age was used to identify an eligible random respondent for the individual questionnaire. The questionnaire
also collected information on the current use of smoked and smokeless tobacco.
2.3.2. Individual questionnaire
The individual questionnaire collected information from eligible selected individuals aged 15 years and above. The
individual questionnaire consisted of the following 10 sections:
Background characteristics: Questions on gender, age, education, occupation and possession of household items
Tobacco smoking: Questions covering patterns of use (daily consumption, less than daily consumption, not at all), former/past tobacco consumption, age at initiation of daily smoking, consumption of different tobacco products, (cigarettes, kretek cigarettes, pipes, cigars), nicotine dependence and frequency of quit attempts
Smokeless tobacco: Questions covering patterns of use (daily consumption, less than daily consumption, not at all), and former/past use of smokeless tobacco
Electronic cigarettes: Questions covering patterns of use (daily consumption, less than daily consumption, not at all) of electronic cigarettes
Cessation: Questions on advice to quit smoking by a health-care provider, method used to try to stop smoking and thinking about quitting smoking
Second-hand smoke: Questions on smoking allowed in the home, exposure to second-hand smoke at home, indoor smoking policy at the workplace, exposure in the past 30 days at the workplace, government buildings/offices, universities/educational facilities, religious facilities, health-care facilities, restaurants/bars/night clubs and public transportation
Economics—manufactured white cigarettes: Questions covering the type of manufactured white cigarette product and quantity bought, cost of manufactured white cigarette product(s), brand, type of product purchased and source of manufactured white cigarette product(s)
Economics—kretek cigarettes: Questions covering the type of kretek cigarette product and quantity bought, cost of kretek cigarette product(s), brand and type of product purchased and source of kretek cigarette product(s)
Media: Questions on exposure to advertisement – television, radio, billboards, posters, newspapers/magazines, cinema, internet, public transportation, public walls and others; exposure to sporting events connected with tobacco; exposure to music, theatre, art or fashion events connected with tobacco; exposure to tobacco promotion activities; reaction to health warning labels on cigarette packages and exposure to anti-tobacco advertising and information. These questions were asked for both white manufactured cigarettes and kretek cigarettes. The reference period for the questions in this section was 30 days.
Knowledge, attitudes and perceptions: Questions regarding knowledge about the health effects of using both smoked and smokeless tobacco.
2.4. Questionnaire programming and preparation for electronic data collection
The GATS was the first survey ever conducted in Indonesia which used electronic means of data collection to collect the
information on both household and individual questionnaires. For this purpose, the General Survey System (GSS) was used,
which is a suite of software tools developed to facilitate the administration, collection and management of survey data on
handheld computers, specifically a Microsoft Windows-based platform running Windows Mobile 5.0 or Mobile 6.0, often
called pocket PC systems. The software system is designed to support field data collection activities, where field

7 Methodology
interviewers collect data using handheld computers. The systems were developed and tested using the Hewlett Packard
(HP) iPAQ Pocket PC (Model: iPAQ 210) and were used for data collection. (Please refer to the manuals on GSS and Data
Management and Implementation Guidelines for more details.) Electronic data collection was useful for facilitating the
complex skip pattern used in the GATS Indonesia questionnaire as well some inbuilt validity checks on questions during the
data collection.
The programming of the questionnaire using GSS was carried out in collaboration with in-country information technology
(IT) personnel, WHO and CDC. Repeated quality-control mechanisms were used to test the quality of questionnaire
programming. The main steps involved in quality control checks were version checking for household and individual
questionnaires, checking date and time, and skipping patterns. The entire process, including the questionnaire, data
collection using handheld machines and data aggregation to prepare raw data for analysis, was pretested.
Handheld programming was finalized and the final questionnaire for data collection was uploaded onto the handheld
devices in August 2011 by in-country IT personnel, with WHO and CDC providing oversight to maintain quality assurance.
The case file containing the electronic information used for identifying the selected household addresses was also uploaded
to the handhelds in September 2011, immediately after household activities and selection of households had been updated
and completed. (Please refer to the GATS Quality Assurance Manual for more details on case file and a complete listing of
quality control measures adopted in GATS.)
2.5. Recruitment, training and fieldwork
2.5.1. Implementing agencies
BPS-Statistics Indonesia and NIHRD were the implementing agencies for GATS in Indonesia. The MoH designated the BPS as
the main implementing agency responsible for sampling, updating of households, and conducting training and data
collection for GATS implementation, while NIHRD was responsible for writing the country report, preparing the fact sheet
and disseminating the results nationally.
WHO provided regional and in-country coordination and CDC provided technical assistance for implementation of the
survey. Financial assistance was provided by Bloomberg Philanthropies under the Bloomberg Global Initiative to Reduce
Tobacco Use.
The MoH had also established an in-country technical committee. This committee consisted of experts and senior
representatives from the MoH (NIHRD) and BPS-Statistics Indonesia. Refer to Appendix D for details on the technical
committee and personnel involved in survey implementation.
2.5.2. Pretest
BPS-Statistics Indonesia conducted a pretest to test the questionnaire, especially in terms of wording and
comprehensibility, inconsistencies in skip patterns, sequencing of questions, completeness of response categories, work
load, interview time, availability, call backs and any other issues. Another important objective of the pretest was to test the
programmed questionnaire for handheld data collection and assess problems in the process of data transfer and
aggregation. Pretest training took place during 9–11 May 2011. Seven people were trained during the training programme,
of whom two were selected to perform the tasks of a supervisor and five to conduct the interviews and do the actual field
work during the pretest. Training was conducted based on standard GATS manuals and procedures, including class
presentation, mock interviews, field practices and tests. Pretest fieldwork was carried out during 12–20 May 2011.
Fieldwork was conducted for a purposive sample of 210 households, with 120 households in Bogor Regency and the
remaining 90 in Bogor City, distributed by gender, urban/rural and smoking status. An attempt was made to obtain a good
representation of individuals from different age groups.
2.5.3. Training

8 Methodology
In order to maintain uniform survey procedures and follow standard protocols established in GATS, four manuals were
developed. The field interviewer manual consists of instructions for interviewers regarding interviewing techniques, field
procedures, method of asking questions and, most importantly, the use of handheld devices for data collection. The field
supervisor manual contains a detailed description on the role and responsibilities of the supervisor. It also contains
information on data aggregation and transfer procedures for supervisors. The question-by-question specifications manual
provides question-by-question instructions to the field interviewers on administering the GATS household and individual
questionnaires using the handheld computer. It also contains information on range checks, response options, and purpose
and instructions on each question included in the survey. All the manuals were first developed in English and then
translated into Indonesian for the training. A total of 100 interviewers and 81 supervisors were trained in 12 regional
training centres for a period of three days (for a few participants) or four days (for more participants) in the beginning of
October 2011. This training was facilitated by two facilitators (one for the questionnaire and one for IT) who had been
trained separately by a GATS team member in Jakarta prior to this training. The facilitator training was conducted at the
end of September 2011. Training included lectures on understanding the contents of the questionnaires, how to complete
the questionnaires using handheld devices, mock interviews between participants and field practice interviews.
2.5.4. Updating of the household list
Updating of the household list was the first GATS activity in the field after the pretest implementation. BPS-Statistics
Indonesia Headquarters prepared the list of households from the 2010 Population Census of Indonesia for each selected CB
and sent the list to the BPS-Regional Office. In each selected CB, the list of households was updated in order to obtain the
up-to-date household conditions within the CB. In carrying out the updating, the field enumerator utilized a map of the
selected SSU CB used during the 2010 Population Census. Personnel of the BPS-Regional Office worked at the field level to
update the relevant information of the household as per the current situation. The updating operation was conducted in
September 2011. After all households in the selected CB had been updated, the up-to-date lists of households were then
sent back to the BPS-Statistics Indonesia Headquarters as an up-to-date frame for household sample selection. The selected
households were then prepared as a case file to be put into the handheld devices.
2.5.5. Fieldwork
The GATS data was collected in 19 provinces, 77 districts and 100 PSUs by 100 field interviewers and 81 field supervisors
(FSs). All field interviewers and FSs were personnel of the BPS regional offices. Both field interviewers and FSs came from
the same BPS regional office at district level in order to maintain good coordination and ensure speedy data collection. Field
operations took place over a period of four weeks from 15 October 2011 to 24 November 2011.
Field interviewers were responsible for collecting information on questionnaires using handheld devices. FSs were
responsible for the overall operation of the field enumeration. In addition, the FSs conducted spot checks to verify
information collected by interviewers and also to ensure the accuracy of household identification in the field. In order to
ensure that the standard quality-control procedures has been implemented correctly by the field interviewers, key
members of the GATS team visited the field to monitor data collection. FSs were also responsible for aggregating the
interviewer-level data to the secure digital (SD) card provided to make a back-up; and using a card reader through internet
connection available in the BPS-Regional Office, the FSs then sent the data to the data centre at the BPS-Statistics Indonesia
Headquarters.
2.6. Data processing and aggregation
All the data containing interviews conducted on each day were aggregated by FSs on a weekly basis for GATS fieldwork data
collection. Each supervisor exported the data from the field interviewer’s handheld device into his/her SD card using a card
reader and then e-mailed the exported data from the BPS-Regional Office to the National Data Centre at the BPS-Statistics
Indonesia Headquarters. This data transmission process followed a partial network or Model B of the GATS standard data
collection mechanism, as shown in Figure 2.1. In-country IT personnel aggregated the data that they had received from all
supervisors every three/four days (Figure 2.1). On the final aggregation day, IT personnel with guidance from WHO IT

9 Methodology
experts merged and aggregated all the files to a single standard data file (SDF). The aggregated final file was then ready for
the weighting process. After the weighting process had been approved by the Survey Review Committee (SRC), the data
were transposed to an analysable raw data format that could be read in any statistical software available for further
analysis and reporting.
Figure 2.1: Data transmission process-GATS Indonesia, 2011
2.7. Statistical analysis
Complex survey data analysis was performed to obtain population estimates and their 95% confidence intervals. Sample
weights were developed for each respondent following the standard procedures established in the GATS sample design and
sample weights manuals for GATS data. The details on sample weighting process are described in Appendix B. The final
weights were used in all analyses to produce estimates of population parameters and their confidence intervals. All
weighting computations were carried out using SPSS and cross-verified using SAS for additional quality assurance and all
computations of estimates and their confidence intervals were performed using the SPSS 18 complex samples module.
Survey DataField level aggregation
Reports
Supervisor
Send data via email
Interviewer
Handheld
Reports
Case file
National Data Center
Aggregation & convertionSurvey Info

10 Sample and population characteristics
3. Sample and population characteristics
This chapter presents information on sample coverage and characteristics of the population. The population estimates are
based on the 2010 Population Census, which was projected to September 2011 in order to represent the population
characteristics at the time of the survey.
3.1. Coverage of the sample
Table 3.1 shows the unweighted number and percentage of households and persons interviewed, and response rates by
place of residence. Of the 8994 households selected for the survey, 8581 (95.4%) completed the household interview; and
8305 (96.8%) selected eligible persons successfully completed the individual interview. The total response rate of the
survey was 94.3%. The total response rate in rural areas was found to be higher than that in urban areas (95.0% and 93.6%,
respectively). The household response rate was 97.4%. With respect to urban and rural household response rates, the latter
had a higher rate than the former (98.2% for rural and 96.6% for urban areas). However, 2.4% households were found
unoccupied in urban areas, while only 1.5% were unoccupied in rural areas. Nobody was at home in 1.2% cases in both
urban and rural areas. The number of eligible persons in urban areas (4238) was slightly lower than that in rural areas
(4343). The person-level response rate was found to be 96.8% and there were no differences with respect to urban and
rural person-level response rates. The principal reasons for person-level non-response were—not at home (1.8%),
incapacitated (1.0%) and refused (0.3%). The proportion of not-at-home persons was higher in urban areas (1.9%)
compared to rural areas (1.6%). On the other hand, the proportion of incapacitated persons was higher in rural areas than
in urban areas, 1.2% and 0.8%, respectively.
3.2. Characteristics of survey respondents
Table 3.2 presents the unweighted sample size and population estimates by gender and selected demographic
socioeconomic characteristics of the household population, including age, place of residence, level of education and
occupation/work status.
The unweighted sample count (complete responses) was 8305. The estimated total Indonesian population aged 15 years
and above was 172.1 million in 2011. In classifying sample distribution by gender, the survey enumerated a total of 3948
men and 4357 women. These sample counts yielded a de facto population estimate of 85.9 million men and 86.2 million
women. The number of unweighted samples in urban areas was smaller than that in the rural areas (4102 and 4203
samples, respectively). However, the weighted population in urban areas was slightly higher than in rural areas (86.4 million
in urban and 85.8 million in rural areas). A large proportion of adults were between 25 and 44 years of age (45.1%), 24.1%
were in the 15–24 years age group, followed by 23.7% in the 45–64 years age group and 7.1% in the age group of 65 years
and above.A similar proportion was observed not only among adult men but also among adult women. For example, 24.3%
of adult men were in the 15–24 years age group, 24% in the 45–64 years age group and only 6.3% in the last age group of
65 years and above. The majority of adult men were in the 25–44 years age group amounting to 45.4% of total adult men.
Similarly, the largest proportion of adult women was also in the 25–44 years age group. The proportion of persons in the
other age groups were 24.0%, 23.4%, and 7.8% in the 15–24, 45–66, and 65 years and above age groups, respectively.
For all eligible respondents aged 15 years and above, data were collected on the highest level of education completed. For
the purpose of this report, the educational level was grouped into five different categories – less than primary school
completed, primary school completed, secondary school completed, high school completed and college/university and
above. A large proportion of the sample was primary school completed (27.2%) followed by high school completed (23.0%).
On the other hand, college and university graduates constituted only 6.8%. Distribution of adult men and women across
educational levels showed that the majority of both adult men and women had also only completed primary school
certificate (26.4% and 28.1%, respectively). Adult men were more educated than adult women. As shown in the table, the
proportion of adult men who had completed secondary school was more than that of adult women. The proportion of adult

11 Sample and population characteristics
men who were college/university graduates was 7.3%, whereas it was 6.4% for their women counterparts. The proportion
of secondary school completed and high school completed was 21.3% for men and 20.6% for women, and 26.1% for men
and 19.9% for women, respectively. On the other hand, the proportion of adult women with less than primary school
completed was much higher than that of adult men, 25.1% for women and 18.8% for men.
The 2011 GATS individual questionnaire asked all respondents their main work status in the 12 months preceding the
survey. The various categories were merged to form five exclusive occupation categories – employed, self-employed,
student, home maker and unemployed. This categorization was used throughout the report for depicting differentials in
various indicators. Table 3.2 presents the data on occupation. Overall, 28.5% of all adults were employed, 34.3% were self-
employed and 21.3% reported to be home makers. The proportion of adults who were students was 8.1%. Only 7.8% of the
total population was unemployed. When this proportion was broken down by gender, more than 40% of adult women were
home makers, which was the largest proportion among occupation levels; whereas for adult men, the majority were self-
employed (44.3%). The second-largest occupation group for adult men was employed at 37.8%, while self-employed
(24.3%) was the second-largest occupation group for adult women. The third-largest group was students (9.2%) for men,
and employed (19.2%) for women. The unemployed category was more prominent among adult men (8.5%) than among
adult women (7.2%) as the fourth-largest group. The smallest proportion was home-makers (0.1%) for adult men, and
students (7%) for adult women.

12 Sample and population characteristics
N % N % N %
Completed, person selected for interview 4238 94.2 4343 96.6 8581 95.4
Completed, no one el igible for interview 2 0.0 2 0.0 4 0.0
Incomplete 3 0.1 0 0.0 3 0.0
No screening respondent 48 1.1 16 0.4 64 0.7
Nobody at home 55 1.2 54 1.2 109 1.2
Refused 27 0.6 8 0.2 35 0.4
Unoccupied 108 2.4 68 1.5 176 2.0
Address not a dwel l ing 4 0.1 1 0.0 5 0.1
Other 14 0.3 3 0.1 17 0.2
Tota l households selected 4499 100 4495 100 8994 100
Household response rate1
Completed 4102 96.8 4203 96.8 8305 96.8
Incomplete 1 0.0 4 0.1 5 0.0
Not el igible 2 0.0 2 0.0 4 0.0
Not at home 81 1.9 70 1.6 151 1.8
Refused 18 0.4 10 0.2 28 0.3
Incapaci tated 32 0.8 53 1.2 85 1.0
Other 2 0.0 1 0.0 3 0.0
Tota l el igible persons 4238 100 4343 100 8581 100
Person-level response rate 2
Total response rate
Table 3.1. Number and percentage of households and persons interviewed and response rates
by res idence (unweighted) – GATS Indones ia , 2011
ResidenceTotal
Urban RuralDemographic
characteristics
100 * [HC]
[HC] + [HINC] + [HNS] + [NHH] + [HR] + [HO]
2. Ca lculate Person-Level Response Rate (IRR) by:
Selected households
96.6% 98.2% 97.4%
Selected persons
96.8% 96.8% 96.8%
93.6% 95.0% 94.3%
1. Ca lculate Household Response Rate (HRR) by:
100 * [PC]
[PC] + [PINC] + [PNAH] + [PR] + [PI] + [PO]
3. Ca lculate Tota l Response Rate (TRR) by: (HRR * IRR) / 100
Notes : 1) Notice that Household questionnaire incomplete [HINC] was not included in the
numerator of the household response rate. Therefore, a household screening questionnaire
that i s incomplete (i .e., the roster could not be finished) was cons idered a nonrespondent to
the GATS. 2) Completed individual interview [PC] includes respondents who have completed
at least question E1 and who provide va l id answers to questions B1/B2/B3 and C1/C2/C3
(when appl icable). Therefore, the respondents who did not meet this cri teria were
cons idered as an el igible nonrespondent to GATS and thus , incompletes [PINC] were not
included in the numerator of the individual response rate.
where (Selected households): HC = "Completed, person selected for interview"; HINC = "Incomplete";
HNS = "No screening respondent"; NHH = "Nobody home"; HR = "Refused"; HO = "Other"
where (Selected persons): PC = "Completed"; PINC = "Incomplete"; PNAH = "Not at home"; PR =
"Refused"; PI = "Incapacitated"; PO = "Other"
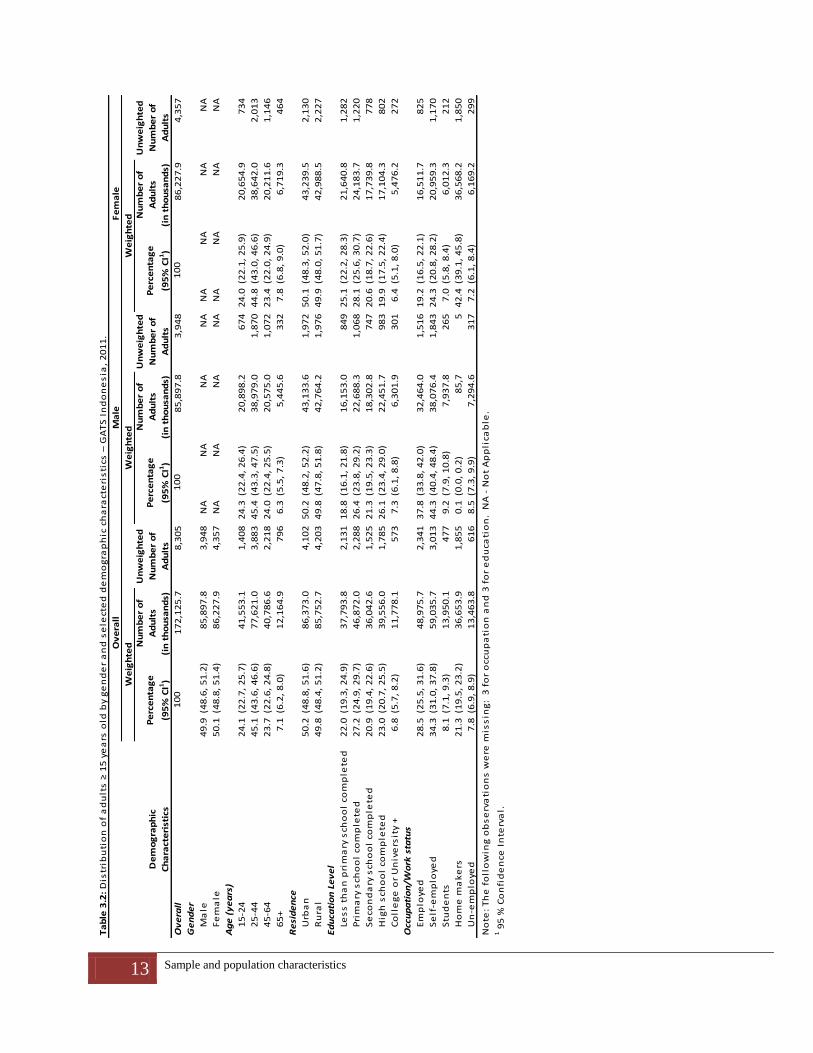
13 Sample and population characteristics
Ov
era
ll1
72
,12
5.7
8,3
05
85
,89
7.8
3,9
48
86
,22
7.9
4,3
57
Ma
le4
9.9
(48
.6,
51
.2)
85
,89
7.8
3,9
48
NA
NA
NA
NA
NA
NA
NA
NA
Fe
ma
le5
0.1
(48
.8,
51
.4)
86
,22
7.9
4,3
57
NA
NA
NA
NA
NA
NA
NA
NA
15
-24
24
.1(2
2.7
, 2
5.7
)4
1,5
53
.11
,40
82
4.3
(22
.4,
26
.4)
20
,89
8.2
67
42
4.0
(22
.1,
25
.9)
20
,65
4.9
73
4
25
-44
45
.1(4
3.6
, 4
6.6
)7
7,6
21
.03
,88
34
5.4
(43
.3,
47
.5)
38
,97
9.0
1,8
70
44
.8(4
3.0
, 4
6.6
)3
8,6
42
.02
,01
3
45
-64
23
.7(2
2.6
, 2
4.8
)4
0,7
86
.62
,21
82
4.0
(22
.4,
25
.5)
20
,57
5.0
1,0
72
23
.4(2
2.0
, 2
4.9
)2
0,2
11
.61
,14
6
65
+7
.1(6
.2,
8.0
)1
2,1
64
.97
96
6.3
(5.5
, 7
.3)
5,4
45
.63
32
7.8
(6.8
, 9
.0)
6,7
19
.34
64
Urb
an
50
.2(4
8.8
, 5
1.6
)8
6,3
73
.04
,10
25
0.2
(48
.2,
52
.2)
43
,13
3.6
1,9
72
50
.1(4
8.3
, 5
2.0
)4
3,2
39
.52
,13
0
Ru
ral
49
.8(4
8.4
, 5
1.2
)8
5,7
52
.74
,20
34
9.8
(47
.8,
51
.8)
42
,76
4.2
1,9
76
49
.9(4
8.0
, 5
1.7
)4
2,9
88
.52
,22
7
Les
s t
ha
n p
rim
ary
sch
oo
l co
mp
lete
d2
2.0
(19
.3,
24
.9)
37
,79
3.8
2,1
31
18
.8(1
6.1
, 2
1.8
)1
6,1
53
.08
49
25
.1(2
2.2
, 2
8.3
)2
1,6
40
.81
,28
2
Pri
ma
ry s
cho
ol
com
ple
ted
27
.2(2
4.9
, 2
9.7
)4
6,8
72
.02
,28
82
6.4
(23
.8,
29
.2)
22
,68
8.3
1,0
68
28
.1(2
5.6
, 3
0.7
)2
4,1
83
.71
,22
0
Se
con
da
ry s
cho
ol
com
ple
ted
20
.9(1
9.4
, 2
2.6
)3
6,0
42
.61
,52
52
1.3
(19
.5,
23
.3)
18
,30
2.8
74
72
0.6
(18
.7,
22
.6)
17
,73
9.8
77
8
Hig
h s
cho
ol
com
ple
ted
23
.0(2
0.7
, 2
5.5
)3
9,5
56
.01
,78
52
6.1
(23
.4,
29
.0)
22
,45
1.7
98
31
9.9
(17
.5,
22
.4)
17
,10
4.3
80
2
Co
lle
ge
or
Un
ive
rsit
y +
6.8
(5.7
, 8
.2)
11
,77
8.1
57
37
.3(6
.1,
8.8
)6
,30
1.9
30
16
.4(5
.1,
8.0
)5
,47
6.2
27
2
Em
plo
yed
28
.5(2
5.5
, 3
1.6
)4
8,9
75
.72
,34
13
7.8
(33
.8,
42
.0)
32
,46
4.0
1,5
16
19
.2(1
6.5
, 2
2.1
)1
6,5
11
.78
25
Se
lf-e
mp
loye
d3
4.3
(31
.0,
37
.8)
59
,03
5.7
3,0
13
44
.3(4
0.4
, 4
8.4
)3
8,0
76
.41
,84
32
4.3
(20
.8,
28
.2)
20
,95
9.3
1,1
70
Stu
de
nts
8.1
(7.1
, 9
.3)
13
,95
0.1
47
79
.2(7
.9,
10
.8)
7,9
37
.82
65
7.0
(5.8
, 8
.4)
6,0
12
.32
12
Ho
me
ma
ke
rs2
1.3
(19
.5,
23
.2)
36
,65
3.9
1,8
55
0.1
(0.0
, 0
.2)
85
,75
42
.4(3
9.1
, 4
5.8
)3
6,5
68
.21
,85
0
Un
-em
plo
yed
7.8
(6.9
, 8
.9)
13
,46
3.8
61
68
.5(7
.3,
9.9
)7
,29
4.6
31
77
.2(6
.1,
8.4
)6
,16
9.2
29
9
Occ
up
ati
on
/Wo
rk s
tatu
s
Ag
e (
ye
ars
)
Ed
uca
tio
n L
ev
el
Ge
nd
er
Re
sid
en
ce
Ma
leF
em
ale
Ta
ble
3.2
: D
istr
ibu
tio
n o
f a
du
lts
≥ 1
5 y
ea
rs o
ld b
y g
en
de
r a
nd
se
lect
ed
de
mo
gra
ph
ic c
ha
ract
eri
sti
cs –
GA
TS
In
do
ne
sia
, 2
01
1.
No
te:
Th
e f
oll
ow
ing
ob
se
rva
tio
ns
we
re m
iss
ing
: 3
fo
r o
ccu
pa
tio
n a
nd
3 f
or
ed
uca
tio
n.
NA
- N
ot
Ap
pli
cab
le.
1 9
5 %
Co
nfi
de
nce
In
terv
al.
We
igh
ted
Un
we
igh
ted
Nu
mb
er
of
Ad
ult
s
Pe
rce
nta
ge
(95
% C
I1)
Nu
mb
er
of
Ad
ult
s
(in
th
ou
san
ds)
10
0
We
igh
ted
Un
we
igh
ted
Nu
mb
er
of
Ad
ult
s
Pe
rce
nta
ge
(95
% C
I1)
Nu
mb
er
of
Ad
ult
s
(in
th
ou
san
ds)
10
0
We
igh
ted
Un
we
igh
ted
Nu
mb
er
of
Ad
ult
s
De
mo
gra
ph
ic
Ch
ara
cte
rist
ics
10
0
Pe
rce
nta
ge
(95
% C
I1)
Nu
mb
er
of
Ad
ult
s
(in
th
ou
san
ds)
Ov
era
ll

14 Tobacco Use
4. Tobacco Use
This chapter presents data on tobacco use and includes information on two commonly used tobacco products in
Indonesia, i.e. smoked tobacco products and smokeless tobacco products. Smoked tobacco products include
manufactured, hand-rolled and kretek cigarettes, and other smoked tobacco products. Different sections in this
chapter present a detailed overview of smoking status, the number of smoked tobacco products used on a daily
and non-daily basis, age at initiation of smoking, time since quitting smoking and time after waking up to first
smoke of the day.
Key findings
o 59.8 million adults (34.8% –67.0% men and 2.7% women) currently smoke tobacco and 2.9 million adults
(1.7%) currently use smokeless tobacco products.
o Kretek cigarettes (31.5%) are the most popular tobacco product used in Indonesia.
o On an average, 12.8 cigarette sticks are smoked per day.
o Average age at daily smoking initiation is 17.6 years; 12.3% started smoking before 15 years of age.
o Of those who have ever smoked on a daily basis, 9.5% have quit smoking.
o Among daily smokers, 38.3% have the first cigarette of the day within 5–30 minutes of waking up.
4.1. Prevalence of tobacco use
4.1.1. Prevalence of smoking
Table 4.1 gives the prevalence of smoking tobacco by “current tobacco smokers” and “non-smokers”. Current
tobacco smokers include “daily smokers” and “occasional smokers”. Non-smokers include “former daily smokers”
and “never daily smokers”. The overall prevalence rate of current smokers is 34.8%. It is particularly high among
men (67.0%), who have 30 times the prevalence rate of women (2.7%).

15 Tobacco Use
Non-smokers account for 65.2% of the overall adult population. Among them, only 3.3% are former daily smokers
and 61.9% are never daily smokers. The proportion of never smokers among women is 95.3% while that among
men is 22.0%.
4.1.2. Prevalence of smokeless tobacco use
Table 4.1A gives the use of smokeless tobacco by gender. Current smokeless tobacco use is low, with an overall
prevalence rate of only 1.7%. Among current smokeless tobacco users, 1.2% are daily users and 0.5% are
occasional users. Women (1.3%) use smokeless tobacco more than men (1.1%) on a daily basis. Overall, 98.3% are
non-users of smokeless tobacco, of whom only 0.5% are former daily users and 1.0% are former occasional users.
4.2. Number of tobacco users
4.2.1. Number of smoked tobacco users
Table 4.2 presents the estimated number of adult smokers corresponding to the prevalence estimates presented
on smoking status in Table 4.1 by gender. The estimated number of adult smokers in Indonesia is 59.9 million (57.6
million men and 2.3 million women). The number of daily smokers is 50.3 million and the number of occasional
smokers is 9.6 million). The estimated number of non-smokers is 112.2 million, of whom 5.7 million are former
daily smokers and 106.6 million are never daily smokers.
Smoking Status
Current tobacco smoker 34.8 (33.2, 36.4) 67.0 (64.4, 69.5) 2.7 (2.0, 3.5)
Dai ly smoker 29.2 (27.6, 30.9) 56.7 (53.8, 59.6) 1.8 (1.4, 2.4)
Occas ional smoker 5.6 (4.8, 6.4) 10.3 (9.0, 11.8) 0.8 (0.5, 1.3)
Occas ional smoker, formerly dai ly 2.1 (1.6, 2.6) 4.0 (3.1, 5.0) 0.2 (0.1, 0.3)
Occas ional smoker, never dai ly 3.5 (3.0, 4.1) 6.4 (5.4, 7.5) 0.7 (0.4, 1.1)
Non-smoker 65.2 (63.6, 66.8) 33.0 (30.5, 35.6) 97.3 (96.5, 98.0)
Former dai ly smoker 3.3 (2.8, 3.9) 6.0 (5.0, 7.2) 0.6 (0.4, 1.0)
Never dai ly smoker 61.9 (60.3, 63.5) 27.0 (24.6, 29.5) 96.7 (95.8, 97.5)
Former occas ional smoker 3.2 (2.6, 3.9) 4.9 (4.0, 6.1) 1.5 (1.0, 2.0)
Never smoker 58.7 (57.0, 60.5) 22.0 (19.6, 24.6) 95.3 (94.0, 96.3)
Note: Current use includes both dai ly and occas ional (less than dai ly) use.
Table 4.1: Percentage of adults ≥15 years old, by detai led smoking status and gender – GATS Indones ia , 2011.Overall Male Female
Percentage (95% CI)
Smokeless tobacco use status
Current smokeless tobacco users 1.7 (1.4, 2.2) 1.5 (1.1, 2.2) 2.0 (1.4, 2.7)
Dai ly users 1.2 (0.9, 1.5) 1.1 (0.8, 1.6) 1.3 (0.9, 1.8)
Occas ional users 0.5 (0.3, 0.9) 0.4 (0.2, 0.9) 0.7 (0.4, 1.2)
Occas ional users , formerly da i ly0.1 (0.0, 0.2) 0.1 (0.0, 0.5) 0.1 (0.0, 0.2)
Occas ional users , never dai ly 0.4 (0.3, 0.7) 0.3 (0.2, 0.6) 0.6 (0.3, 1.1)
Non-users of smokeless tobacco 98.3 (97.8, 98.6) 98.5 (97.8, 98.9) 98.0 (97.3, 98.6)
Former dai ly users 0.5 (0.3, 0.8) 0.3 (0.1, 0.8) 0.7 (0.4, 1.0)
Never dai ly users 97.8 (97.2, 98.2) 98.2 (97.3, 98.8) 97.4 (96.5, 98.0)
Former occas ional users 1.0 (0.6, 1.6) 0.7 (0.3, 1.3) 1.4 (0.8, 2.4)
Never users 96.8 (95.9, 97.5) 97.5 (96.3, 98.4) 96.0 (94.6, 97.0)
Note : Current use includes both dai ly and occas ional (less than dai ly) use.
Table 4.1A. Percentage of adults 15 years and above, by detai led smokeless tobacco
use s tatus , gender and res idence – GATS Indones ia , 2011
Overall Male Female
Percentage (95% CI)

16 Tobacco Use
4.2.2. Number of smokeless tobacco users
Table 4.2A presents the total population corresponding to the prevalence estimates presented on smokeless
tobacco users’ status in Table 4.1A by gender. The estimated number of current users of smokeless tobacco is 2.9
million (1.3 million men and 1.6 million women). The number of daily smokeless tobacco users is 2.0 million; 0.9
million are men and 1.1 million are women. The number of occasional smokeless tobacco users is 0.9 million. Out
of 166.2 million non-users of smokeless tobacco, only 0.8 million adults are reported to be former daily users
whereas 165.4 million are never daily users. Among never daily users, 163.7 million reported that they have never
used any smokeless tobacco in their lifetime.
4.3. Prevalence of current smokers by smoked tobacco products
Table 4.3 presents data on smoked tobacco products overall and separately by demographic characteristics. In
Indonesia, these products include cigarettes, kreteks, and other smoked tobacco products such as pipes, cigars,
shisha and others. Cigarettes are of two categories – white cigarettes and hand-rolled cigarettes. The overall
prevalence rate of smokers of any smoked tobacco profuct is 34.8%. The prevalence of current kretek smoking is
reported as 31.5%, followed by hand-rolled cigarette smoking (4.7%), white cigarette smoking (2.2%) and the least
Smoking Status Overall Male Female
Current tobacco smoker 59,884.5 57,586.8 2,297.7
Dai ly smoker 50,302.1 48,736.1 1,565.9
Occas ional smoker 9,582.4 8,850.6 731.7
Occas ional smoker, formerly da i ly 3,539.1 3,393.7 145.4
Occas ional smoker, never dai ly 6,043.3 5,457.0 586.3
Non-smoker 112,241.2 28,311.0 83,930.2
Former dai ly smoker 5,665.3 5,148.1 517.2
Never dai ly smoker 106,575.9 23,162.8 83,413.1
Former occas ional smoker 5,501.5 4,246.0 1,255.5
Never smoker 101,074.4 18,916.9 82,157.5
Table 4.2: Number of adults ≥15 years old, by detai led smoking s tatus and gender –
GATS Indones ia , 2011.
Note: Current use includes both dai ly and occas ional (less than dai ly) use.
Number in thousands
Smokeless Tobacco Use Status Overall Male Female
Current smokeless tobacco user 2,932.7 1,277.3 1,655.3
Dai ly user 2,007.1 928.4 1,078.8
Occas ional user 925.5 348.9 576.6
Occas ional user, formerly da i ly 166.1 90.4 75.7
Occas ional user, never dai ly 759.5 258.6 500.9
Non-user of smokeless tobacco 166,217.6 83,063.3 83,154.3
Former dai ly user 811.1 239.3 571.8
Never dai ly user 165,406.5 82,824.0 82,582.5
Former occas ional user 1,733.8 557.0 1,176.8
Never user 163,672.7 82,267.0 81,405.7
Note: Current use includes both dai ly and occas ional (less than dai ly) use.
Table 4.2A: Number of adults ≥15 years old, by detai led smokeless tobacco use s tatus and
gender – GATS Indones ia , 2011.
Number in thousands

17 Tobacco Use
for other smoked products (0.3%). Figure 4.1 presents a detailed distribution of the prevalence of various smoking
products.
Figure 4.1. Type of products smoked among current cigarette smokers – GATS Indonesia, 2011
Note: All figures are in percentages.
Current smoking is more prevalent in the age group of 25 – 44 and 45 - 64 years as compared to the younger (15–
24 years) and older age groups (65+ years). Kretek smoking is more prevalent in the age group of 25–64 years as
compared to the younger (15–24 years) and older age groups (65+ years), while hand-rolled cigarette smoking
showed a definite increasing trend with age. White cigarette smoking did not differ by age.
Smoking is more prevalent in rural areas as compared to urban areas. Kretek and hand-rolled cigarette smoking is
more prevalent in rural areas as compared to urban areas. White cigarette smoking is more prevalent in urban
areas. Other smoking products did not differ by residence.
The prevalence rate of any smoked tobacco product is highest among those with less than primary school
education (38.0%) and lowest among those with college or university education(27.6%). Kretek smoking did not
show any difference by educational category, while hand-rolled cigarette smoking was higher among the less
educated (less than primary, and primary) as compared to those who were more educated (high school and
college/university educated). White cigarette smoking is higher more in college/university educated people as
compared to less educated people (primary or less than primary).
Current smoking is higher among employed and self-employed categories as compared to the unemployed
category. Kretek smoking was higher among the employed and self-employed categories as compared to the
unemployed category; however, this pattern was not seen in hand-rolled and white cigarette smoking.
Table 4.3 (continued) also presents data on smoked tobacco products overall and by demographic characteristics
separately for men and for women.
Only white cigarette smokers
3.7%
Only hand-rolled cigarette smokers
5.6%
Only kretek cigarette smokers80.4%
Both white cigarette and kretek smokers
0.0%
Both white and hand-rolled cigarette
smokers2.3%
Both kretek and hand-rolledcigarette
smokers7.7%
All together (white hand-rolled and kretek cigarette
smokers )0.3%

18 Tobacco Use
Ma
le6
7.0
(64
.4,
69
.5)
67
.0(6
4.4
, 6
9.5
)4
.3(3
.2,
5.8
)9
.0(6
.7,
12
.0)
60
.9(5
7.9
, 6
3.8
)0
.5(0
.3,
1.1
)
15
-24
51
.7(4
7.1
, 5
6.3
)5
1.7
(47
.1,
56
.3)
3.7
(2.4
, 5
.7)
2.2
(1.1
, 4
.4)
50
.0(4
5.2
, 5
4.7
)0
.8(0
.3,
2.4
)
25
-44
73
.3(7
0.2
, 7
6.1
)7
3.3
(70
.2,
76
.1)
5.8
(4.2
, 8
.0)
7.1
(4.6
, 1
0.7
)6
7.4
(64
.0,
70
.6)
0.4
(0.2
, 1
.0)
45
-64
72
.4(6
8.1
, 7
6.3
)7
2.4
(68
.1,
76
.3)
2.2
(1.2
, 4
.1)
14
.7(1
1.2
, 1
9.0
)6
4.6
(60
.1,
68
.8)
0.3
(0.1
, 1
.0)
65
+6
1.2
(54
.9,
67
.1)
61
.0(5
4.8
, 6
7.0
)3
.3(1
.6,
6.4
)2
7.2
(20
.8,
34
.7)
42
.5(3
6.1
, 4
9.1
)0
.9(0
.2,
4.1
)
Urb
an
61
.6(5
8.2
, 6
5.0
)6
1.6
(58
.2,
65
.0)
5.5
(3.6
, 8
.2)
4.6
(2.8
, 7
.5)
55
.3(5
1.1
, 5
9.3
)0
.6(0
.2,
1.7
)
Ru
ral
72
.5(6
8.7
, 7
6.0
)7
2.5
(68
.6,
76
.0)
3.1
(2.0
, 4
.6)
13
.5(9
.4,
18
.9)
66
.6(6
2.4
, 7
0.5
)0
.5(0
.2,
1.0
)
Les
s t
ha
n p
rim
ary
sch
oo
l co
mp
lete
d8
1.0
(76
.5,
84
.9)
81
.0(7
6.5
, 8
4.9
)1
.9(1
.1,
3.3
)2
3.2
(17
.3,
30
.4)
69
.9(6
4.0
, 7
5.1
)0
.4(0
.1,
1.5
)
Pri
ma
ry s
cho
ol
com
ple
ted
74
.0(7
0.3
, 7
7.4
)7
4.0
(70
.2,
77
.4)
2.7
(1.6
, 4
.5)
12
.1(8
.7,
16
.6)
67
.3(6
2.6
, 7
1.8
)0
.1(0
.0,
0.7
)
Se
con
da
ry s
cho
ol
com
ple
ted
62
.3(5
8.0
, 6
6.4
)6
2.3
(58
.0,
66
.4)
4.1
(2.6
, 6
.6)
3.1
(1.8
, 5
.3)
58
.9(5
4.4
, 6
3.3
)0
.3(0
.1,
1.1
)
Hig
h s
cho
ol
com
ple
ted
58
.7(5
5.2
, 6
2.0
)5
8.7
(55
.2,
62
.0)
6.6
(4.8
, 9
.0)
2.4
(1.4
, 4
.2)
53
.6(4
9.8
, 5
7.4
)0
.8(0
.3,
1.9
)
Co
lle
ge
or
Un
ive
rsit
y +
49
.8(4
3.2
, 5
6.4
)4
9.8
(43
.2,
56
.4)
8.4
(4.8
, 1
4.3
)2
.0(0
.7,
5.5
)4
6.3
(39
.7,
53
.1)
1.9
(0.5
, 7
.0)
Em
plo
yed
69
.8(6
6.3
, 7
3.1
)6
9.8
(66
.2,
73
.1)
4.5
(3.1
, 6
.6)
8.2
(5.4
, 1
2.4
)6
4.1
(60
.2,
67
.8)
0.5
(0.2
, 1
.3)
Se
lf-e
mp
loye
d7
5.7
(72
.3,
78
.8)
75
.7(7
2.3
, 7
8.8
)4
.4(3
.1,
6.2
)1
1.8
(8.8
, 1
5.8
)6
8.0
(64
.0,
71
.8)
0.5
(0.2
, 0
.9)
Stu
de
nts
25
.1(1
9.6
, 3
1.4
)2
5.1
(19
.6,
31
.4)
2.6
(1.2
, 5
.2)
0.5
(0.1
, 3
.4)
24
.1(1
8.7
, 3
0.5
)0
.5(0
.1,
3.6
)
Ho
me
ma
ke
rs--
--
--
--
--
--
Un
-em
plo
yed
55
.4(4
8.5
, 6
2.1
)5
5.4
(48
.5,
62
.1)
4.6
(2.5
, 8
.2)
6.8
(4.0
, 1
1.2
)4
9.4
(42
.5,
56
.4)
0.9
(0.2
, 3
.8)
No
te:
Cu
rre
nt
us
e i
ncl
ud
es
bo
th d
ail
y a
nd
occ
as
ion
al(
les
s t
ha
n d
ail
y) u
se
.
Occ
up
ati
on
/Wo
rk s
tatu
s
Ed
uca
tio
n L
ev
el
Re
sid
en
ce
Ag
e (
ye
ars
)
1 In
clu
de
s w
hit
e c
iga
rete
, h
an
d r
oll
ed
an
d k
rete
k c
iga
rett
es
.2
Incl
ud
es
(p
ipe
s f
ull
of
tob
acc
o,
cig
ars
, s
his
ha
se
ss
ion
s,
an
d a
ny
oth
ers
).
-- I
nd
ica
tor
es
tim
ate
ba
se
d o
n l
es
s t
ha
n 2
5 u
n-w
eig
hte
d c
as
es
an
d h
as
be
en
su
pp
res
se
d.
† W
hit
e c
iga
rett
es
re
pre
se
nts
ma
nu
fact
ure
d c
iga
rett
es
.
Ta
ble
4.3
(co
nt)
: P
erc
en
tag
e o
f a
du
lts
≥1
5 y
ea
rs o
ld w
ho
are
cu
rre
nt
sm
ok
ers
of
vari
ou
s s
mo
ke
d t
ob
acc
o p
rod
uct
s,
by
ge
nd
er
an
d s
ele
cte
d d
em
og
rap
hic
cha
ract
eri
sti
cs –
GA
TS
In
do
ne
sia
, 2
01
1.
Ty
pe
of
Cig
are
tte
Oth
er
smo
ke
d
tob
acc
o2
Pe
rce
nta
ge
(95
% C
I)
Kre
tek
An
y s
mo
ke
d t
ob
acc
o
pro
du
ctA
ny
cig
are
tte
1W
hit
e†
Ha
nd
-ro
lle
dD
em
og
rap
hic
Ch
ara
cte
rist
ic

19 Tobacco Use
Fe
ma
le2
.7(2
.0,
3.5
)2
.7(2
.0,
3.5
)0
.1(0
.0,
0.4
)0
.5(0
.3,
0.8
)2
.3(1
.7,
3.1
)0
.1(0
.0,
0.3
)
15
-24
0.1
(0.0
, 0
.7)
0.1
(0.0
, 0
.7)
0.0
0
.0
0.1
(0.0
, 0
.7)
0.0
25
-44
1.7
(1.1
, 2
.6)
1.7
(1.1
, 2
.6)
0.1
(0.0
, 0
.5)
0.3
(0.1
, 1
.0)
1.6
(1.0
, 2
.4)
0.1
(0.0
, 0
.6)
45
-64
5.8
(4.1
, 8
.1)
5.8
(4.1
, 8
.1)
0.1
(0.0
, 0
.5)
0.9
(0.5
, 1
.8)
5.2
(3.7
, 7
.5)
0.0
65
+6
.7(4
.1,
11
.0)
6.7
(4.1
, 1
1.0
)0
.8(0
.1,
5.5
)1
.8(0
.7,
4.3
)4
.5(2
.4,
8.2
)0
.5(0
.1,
3.2
)
Urb
an
2.3
(1.4
, 3
.7)
2.3
(1.4
, 3
.7)
0.2
(0.0
, 0
.8)
0.2
(0.0
, 0
.6)
2.0
(1.2
, 3
.4)
0.1
(0.0
, 0
.5)
Ru
ral
3.0
(2.2
, 4
.2)
3.0
(2.2
, 4
.2)
0.1
(0.0
, 0
.2)
0.8
(0.4
, 1
.5)
2.6
(1.8
, 3
.6)
0.1
(0.0
, 0
.5)
Les
s t
ha
n p
rim
ary
sch
oo
l co
mp
lete
d5
.8(4
.2,
8.1
)5
.8(4
.2,
8.1
)0
.2(0
.0,
1.7
)1
.5(0
.8,
2.9
)4
.6(3
.2,
6.6
)0
.1(0
.0,
1.0
)
Pri
ma
ry s
cho
ol
com
ple
ted
2.7
(1.7
, 4
.2)
2.7
(1.7
, 4
.2)
0.1
(0.0
, 0
.4)
0.3
(0.1
, 0
.8)
2.6
(1.6
, 4
.2)
0.1
(0.0
, 1
.0)
Se
con
da
ry s
cho
ol
com
ple
ted
0.6
(0.2
, 1
.5)
0.6
(0.2
, 1
.5)
0.0
0
.0
0.6
(0.2
, 1
.5)
0.0
Hig
h s
cho
ol
com
ple
ted
1.0
(0.5
, 1
.9)
1.0
(0.5
, 1
.9)
0.0
0
.0
1.0
(0.5
, 1
.9)
0.0
Co
lle
ge
or
Un
ive
rsit
y +
2.2
(0.9
, 5
.4)
2.2
(0.9
, 5
.4)
0.5
(0.1
, 3
.5)
0.5
(0.1
, 3
.5)
1.7
(0.6
, 4
.8)
0.0
Em
plo
yed
1.5
(0.8
, 2
.7)
1.5
(0.8
, 2
.7)
0.1
(0.0
, 0
.6)
0.4
(0.2
, 1
.1)
1.4
(0.7
, 2
.5)
0.0
Se
lf-e
mp
loye
d4
.2(2
.9,
6.1
)4
.2(2
.9,
6.1
)0
.2(0
.0,
0.8
)0
.7(0
.3,
1.6
)3
.7(2
.5,
5.5
)0
.1(0
.0,
1.0
)
Stu
de
nts
0.0
0
.0
0.0
0
.0
0.0
0
.0
Ho
me
ma
ke
rs2
.6(1
.7,
4.0
)2
.6(1
.7,
4.0
)0
.1(0
.0,
1.0
)0
.4(0
.2,
1.0
)2
.3(1
.4,
3.6
)0
.1(0
.0,
0.6
)
Un
-em
plo
yed
3.4
(1.8
, 6
.1)
3.4
(1.8
, 6
.1)
0.0
0
.8(0
.2,
2.8
)2
.6(1
.3,
5.1
)0
.0
Ta
ble
4.3
(co
nt)
: P
erc
en
tag
e o
f a
du
lts
≥1
5 y
ea
rs o
ld w
ho
are
cu
rre
nt
sm
ok
ers
of
vari
ou
s s
mo
ke
d t
ob
acc
o p
rod
uct
s,
by
ge
nd
er
an
d s
ele
cte
d d
em
og
rap
hic
ch
ara
cte
ris
tics
– G
AT
S
Ind
on
es
ia,
20
11
.
An
y s
mo
ke
d t
ob
acc
o
pro
du
ctA
ny
cig
are
tte
1
Ty
pe
of
Cig
are
tte
Oth
er
smo
ke
d
to
ba
cco
2W
hit
e†
Ha
nd
-ro
lle
dK
rete
kD
em
og
rap
hic
Ch
ara
cte
rist
ic
Pe
rce
nta
ge
(95
% C
I)
1In
clu
de
s w
hit
e c
iga
rett
e,
ha
nd
ro
lle
d a
nd
kre
tek
cig
are
tte
s.
2In
clu
de
s (
pip
es
fu
ll o
f to
ba
cco
, ci
ga
rs,
sh
ish
a s
es
sio
ns
, a
nd
an
y o
the
rs )
.
† W
hit
e c
iga
rett
es
re
pre
se
nts
ma
nu
fact
ure
d c
iga
rett
es
.
-- I
nd
ica
tor
es
tim
ate
ba
se
d o
n l
es
s t
ha
n 2
5 u
n-w
eig
hte
d c
as
es
an
d h
as
be
en
su
pp
res
se
d.
No
te:
Cu
rre
nt
us
e i
ncl
ud
es
bo
th d
ail
y a
nd
occ
as
ion
al(
les
s t
ha
n d
ail
y) u
se
.
Occ
up
ati
on
/Wo
rk s
tatu
s
Ed
uca
tio
n L
ev
el
Re
sid
en
ce
Ag
e (
ye
ars
)
20 Tobacco Use
4.4. Number of current smokers by smoked tobacco products
Table 4.4 (based on Table 4.3) presents the estimated number of overall current smokers, and separately for men
and women current smokers. The overall estimated number of current smokers who smoke various tobacco
products is 59.9 million persons. This indicates a very high national burden of tobacco use in Indonesia. The
number of hand-rolled cigarette users (8.1 million) is higher than the number of white cigarette users (3.8 million).
About 54.3 million persons smoke kreteks and nearly half a million smoke other products such as pipes, cigars,
shisha and others.
By gender, the number of men smokers who use any smoked tobacco product is 57.6 million. The number of men
smokers who use hand-rolled cigarettes (7.7 million) is higher than the number of those who use white cigarettes
(3.7 million). About 53.3 million men smoke kreteks. The number of women current smokers (2.3 million) is far less
(about 25 times less) than men current smokers. The number of women smokers who use hand-rolled cigarettes
(0.4 million) is higher than the number of those who use white cigarettes (0.1 million). Almost 2 million women
smoke kreteks.
The 25–44 years age group has the highest number of smokers among those who use any smoked tobacco product
(29.2 million), white cigarettes (2.3 million) and kreteks (26.9 million). Hand-rolled cigarette users, however, show
a higher prevalence in the 45–64 years age group.
The overall number of smokers living in rural areas (32.3 million) is higher than those who live in urban areas (27.6
million). Hand-rolled cigarettes and kretek smoking are more common in rural areas (6.1 million and 29.6 million,
respectively) than urban areas (2.1 million and 24.7 million, respectively). However, the number of white cigarete
users in urban areas (2.4 million) is higher than those in rural areas (1.3 million).
The lesser educated category (less than primary, primary and secondary) accounts for 43.3 million smokers, which
is much more than those from the higher educated category (high school, college or university educated; 16.6
million). Among kretek smokers also, 39.1 million smokers belong to the less educated category (less than
primary, primary and secondary) while 15.2 million belong to the more educated category (high school, college or
university educated). The same pattern obtains for hand-rolled cigarette smoking; however, it is the reverse for
white cigarette smokers.

21 Tobacco Use
Wh
ite
†H
an
d-r
oll
ed
Kre
tek
Ov
era
ll5
9,8
84
.55
9,8
74
.03
,77
9.7
8,1
47
.35
4,2
95
.25
06
.2
15
-24
10
,82
8.0
10
,82
8.0
77
2.7
46
5.2
10
,46
4.2
16
9.2
25
-44
29
,21
0.0
29
,21
0.0
2,2
92
.72
,87
9.2
26
,87
3.9
19
7.3
45
-64
16
,06
0.1
16
,06
0.1
48
4.9
3,2
02
.31
4,3
45
.16
2.9
65
+3
,78
6.4
3,7
75
.92
29
.41
,60
0.6
2,6
12
.07
6.8
Urb
an
27
,59
3.9
27
,59
3.9
2,4
47
.02
,05
4.7
24
,71
1.3
28
3.2
Ru
ral
32
,29
0.5
32
,28
0.0
1,3
32
.76
,09
2.6
29
,58
3.8
22
3.0
Les
s t
ha
n p
rim
ary
sch
oo
l co
mp
lete
d1
4,3
49
.61
4,3
49
.63
59
.64
,07
2.0
12
,27
9.4
10
0.8
Pri
ma
ry s
cho
ol
com
ple
ted
17
,43
3.4
17
,42
2.9
62
8.7
2,8
08
.11
5,9
07
.06
4.8
Se
con
da
ry s
cho
ol
com
ple
ted
11
,49
8.3
11
,49
8.3
75
8.1
57
2.7
10
,88
4.2
47
.8
Hig
h s
cho
ol
com
ple
ted
13
,34
7.9
13
,34
7.9
1,4
78
.05
41
.41
2,2
14
.81
71
.4
Co
lle
ge
or
Un
ive
rsit
y +
3,2
55
.23
,25
5.2
55
5.3
15
3.2
3,0
09
.71
21
.5
Em
plo
yed
22
,90
0.3
22
,88
9.8
1,4
81
.42
,74
6.1
21
,03
3.5
16
1.7
Se
lf-e
mp
loye
d2
9,7
10
.62
9,7
10
.61
,70
6.9
4,6
63
.32
6,6
82
.32
05
.1
Stu
de
nts
1,9
90
.21
,99
0.2
20
3.4
37
.51
,91
3.3
40
.2
Ho
me
ma
ke
rs9
95
.09
95
.05
2.4
15
9.3
86
4.8
31
.5
Un
-em
plo
yed
4,2
49
.04
,24
9.0
33
5.6
54
1.1
3,7
61
.86
7.7
Ta
ble
4.4
: N
um
be
r o
f a
du
lts
≥1
5 y
ea
rs o
ld w
ho
are
cu
rre
nt
sm
ok
ers
of
vari
ou
s s
mo
ke
d t
ob
acc
o p
rod
uct
s,
by
ge
nd
er
an
d s
ele
cte
d
de
mo
gra
ph
ic c
ha
ract
eri
sti
cs –
GA
TS
In
do
ne
sia
, 2
01
1.
An
y s
mo
ke
d
tob
acc
o p
rod
uct
An
y
cig
are
tte
1
Ty
pe
of
Cig
are
tte
-- I
nd
ica
tor
es
tim
ate
ba
se
d o
n l
es
s t
ha
n 2
5 u
n-w
eig
hte
d c
as
es
an
d h
as
be
en
su
pp
res
se
d.
1 In
clu
de
s w
hit
e c
iga
rett
e,
ha
nd
ro
lle
d a
nd
kre
tek
cig
are
tte
s.
No
te:
Cu
rre
nt
us
e i
ncl
ud
es
bo
th d
ail
y a
nd
occ
as
ion
al(
les
s t
ha
n d
ail
y) u
se
.
† W
hit
e c
iga
rett
es
re
pre
se
nts
ma
nu
fact
ure
d c
iga
rett
es
.
2 In
clu
de
s (
pip
es
fu
ll o
f to
ba
cco
, ci
ga
rs,
sh
ish
a s
es
sio
ns
, a
nd
an
y o
the
rs )
.
Nu
mb
er
in t
ho
usa
nd
s
De
mo
gra
ph
ic C
ha
ract
eri
stic
Occ
up
ati
on
/Wo
rk s
tatu
s
Ed
uca
tio
n L
ev
el
Re
sid
en
ce
Ag
e (
ye
ars
)
Oth
er
smo
ke
d
tob
acc
o2
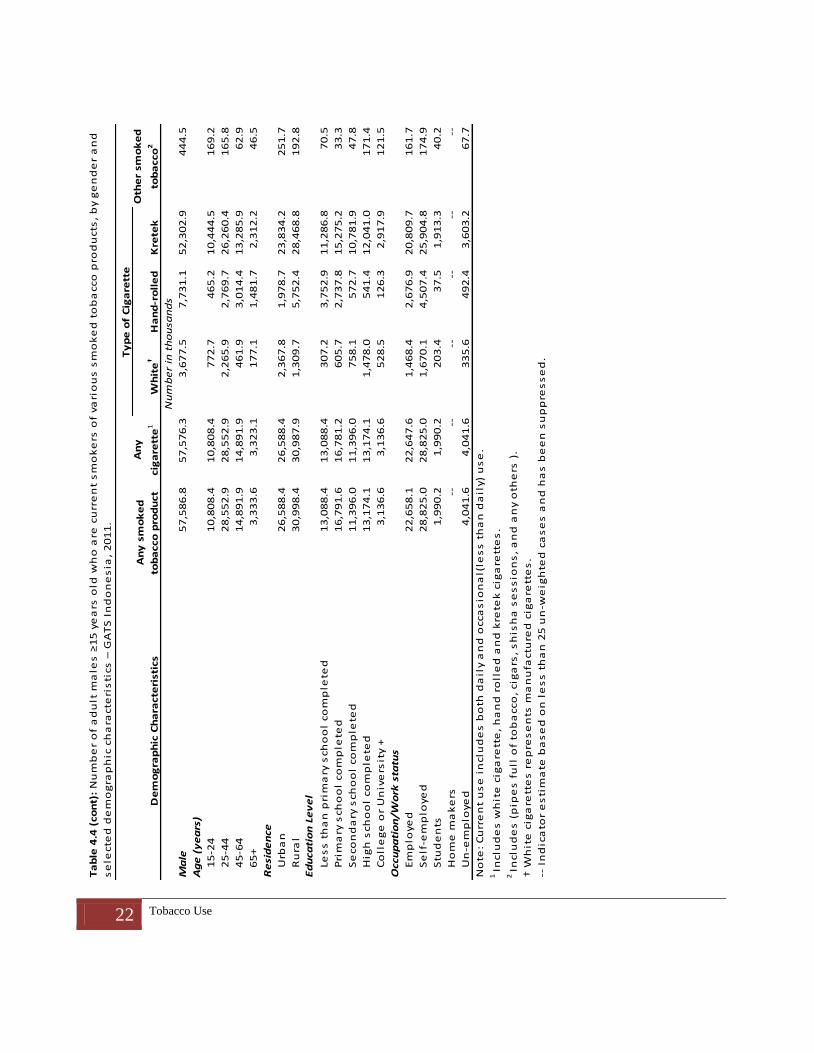
22 Tobacco Use
Wh
ite
†H
an
d-r
oll
ed
Kre
tek
Ma
le5
7,5
86
.85
7,5
76
.33
,67
7.5
7,7
31
.15
2,3
02
.94
44
.5
15
-24
10
,80
8.4
10
,80
8.4
77
2.7
46
5.2
10
,44
4.5
16
9.2
25
-44
28
,55
2.9
28
,55
2.9
2,2
65
.92
,76
9.7
26
,26
0.4
16
5.8
45
-64
14
,89
1.9
14
,89
1.9
46
1.9
3,0
14
.41
3,2
85
.96
2.9
65
+3
,33
3.6
3,3
23
.11
77
.11
,48
1.7
2,3
12
.24
6.5
Urb
an
26
,58
8.4
26
,58
8.4
2,3
67
.81
,97
8.7
23
,83
4.2
25
1.7
Ru
ral
30
,99
8.4
30
,98
7.9
1,3
09
.75
,75
2.4
28
,46
8.8
19
2.8
Le
ss
th
an
pri
ma
ry s
ch
oo
l co
mp
lete
d1
3,0
88
.41
3,0
88
.43
07
.23
,75
2.9
11
,28
6.8
70
.5
Pri
ma
ry s
ch
oo
l co
mp
lete
d1
6,7
91
.61
6,7
81
.26
05
.72
,73
7.8
15
,27
5.2
33
.3
Se
co
nd
ary
sch
oo
l co
mp
lete
d1
1,3
96
.01
1,3
96
.07
58
.15
72
.71
0,7
81
.94
7.8
Hig
h s
ch
oo
l co
mp
lete
d1
3,1
74
.11
3,1
74
.11
,47
8.0
54
1.4
12
,04
1.0
17
1.4
Co
lle
ge
or
Un
ive
rsit
y +
3,1
36
.63
,13
6.6
52
8.5
12
6.3
2,9
17
.91
21
.5
Em
plo
ye
d2
2,6
58
.12
2,6
47
.61
,46
8.4
2,6
76
.92
0,8
09
.71
61
.7
Se
lf-e
mp
loye
d2
8,8
25
.02
8,8
25
.01
,67
0.1
4,5
07
.42
5,9
04
.81
74
.9
Stu
de
nts
1,9
90
.21
,99
0.2
20
3.4
37
.51
,91
3.3
40
.2
Ho
me
ma
ke
rs--
----
----
--
Un
-em
plo
ye
d4
,04
1.6
4,0
41
.63
35
.64
92
.43
,60
3.2
67
.7
Ta
ble
4.4
(co
nt)
: N
um
be
r o
f a
du
lt m
ale
s ≥
15
ye
ars
old
wh
o a
re c
urr
en
t s
mo
ke
rs o
f va
rio
us
sm
ok
ed
to
ba
cco
pro
du
cts
, b
y g
en
de
r a
nd
se
lecte
d d
em
og
rap
hic
ch
ara
cte
ris
tics
– G
AT
S I
nd
on
es
ia,
20
11
.
An
y s
mo
ke
d
tob
acco
pro
du
ct
An
y
cig
are
tte
1
Ty
pe
of
Cig
are
tte
Oth
er
sm
ok
ed
tob
acco
2D
em
og
rap
hic
Ch
ara
cte
risti
cs
No
te:
Cu
rre
nt
us
e i
nclu
de
s b
oth
da
ily a
nd
occa
sio
na
l(le
ss
th
an
da
ily)
us
e.
1 In
clu
de
s w
hit
e c
iga
rett
e,
ha
nd
ro
lle
d a
nd
kre
tek
cig
are
tte
s.
2 In
clu
de
s (
pip
es
fu
ll o
f to
ba
cco
, cig
ars
, s
his
ha
se
ss
ion
s,
an
d a
ny o
the
rs )
.
Nu
mb
er
in t
ho
usa
nd
s
-- I
nd
ica
tor
es
tim
ate
ba
se
d o
n l
es
s t
ha
n 2
5 u
n-w
eig
hte
d c
as
es
an
d h
as
be
en
su
pp
res
se
d.
Occu
pa
tio
n/W
ork
sta
tus
Ed
uca
tio
n L
ev
el
Re
sid
en
ce
Ag
e (
ye
ars
)
† W
hit
e c
iga
rett
es
re
pre
se
nts
ma
nu
factu
red
cig
are
tte
s.

23 Tobacco Use
Wh
ite
†H
an
d-r
oll
ed
Kre
tek
Fe
ma
le2
,29
7.7
2,2
97
.71
02
.24
16
.21
,99
2.2
61
.7
15
-24
19
.71
9.7
0.0
0.0
19
.70
.0
25
-44
65
7.1
65
7.1
26
.91
09
.46
13
.63
1.5
45
-64
1,1
68
.21
,16
8.2
23
.01
87
.91
,05
9.2
0.0
65
+4
52
.74
52
.75
2.4
11
8.9
29
9.8
30
.3
Urb
an
1,0
05
.61
,00
5.6
79
.27
6.0
87
7.2
31
.5
Ru
ral
1,2
92
.11
,29
2.1
23
.03
40
.21
,11
5.1
30
.3
Les
s t
ha
n p
rim
ary
sch
oo
l co
mp
lete
d1
,26
1.2
1,2
61
.25
2.4
31
9.1
99
2.7
30
.3
Pri
ma
ry s
cho
ol
com
ple
ted
64
1.8
64
1.8
23
.07
0.3
63
1.7
31
.5
Se
con
da
ry s
cho
ol
com
ple
ted
10
2.3
10
2.3
0.0
0.0
10
2.3
0.0
Hig
h s
cho
ol
com
ple
ted
17
3.8
17
3.8
0.0
0.0
17
3.8
0.0
Co
lle
ge
or
Un
ive
rsit
y +
11
8.6
11
8.6
26
.92
6.9
91
.80
.0
Em
plo
yed
24
2.3
24
2.3
13
.06
9.2
22
3.8
0.0
Se
lf-e
mp
loye
d8
85
.68
85
.63
6.9
15
6.0
77
7.5
30
.3
Stu
de
nts
0.0
0.0
0.0
0.0
0.0
0.0
Ho
me
ma
ke
rs9
62
.59
62
.55
2.4
14
2.4
83
2.3
31
.5
Un
-em
plo
yed
20
7.3
20
7.3
0.0
48
.71
58
.60
.0
-- I
nd
ica
tor
es
tim
ate
ba
se
d o
n l
es
s t
ha
n 2
5 u
n-w
eig
hte
d c
as
es
an
d h
as
be
en
su
pp
res
se
d.
No
te:
Cu
rre
nt
us
e i
ncl
ud
es
bo
th d
ail
y a
nd
occ
as
ion
al(
les
s t
ha
n d
ail
y) u
se
.1
Incl
ud
es
wh
ite
cig
are
tte
, h
an
d r
oll
ed
an
d k
rete
k c
iga
rett
es
.2
Incl
ud
es
(p
ipe
s f
ull
of
tob
acc
o,
cig
ars
, s
his
ha
se
ss
ion
s,
an
d a
ny
oth
ers
).
Nu
mb
er
in t
ho
usa
nd
s
Ta
ble
4.4
(co
nt)
: N
um
be
r o
f a
du
lt f
em
ale
s ≥
15
ye
ars
old
wh
o a
re c
urr
en
t s
mo
ke
rs o
f va
rio
us
sm
ok
ed
to
ba
cco
pro
du
cts
, b
y g
en
de
r
an
d s
ele
cte
d d
em
og
rap
hic
ch
ara
cte
ris
tics
– G
AT
S I
nd
on
es
ia,
20
11
.
An
y s
mo
ke
d
tob
acc
o p
rod
uct
An
y
cig
are
tte
1
Ty
pe
of
Cig
are
tte
Oth
er
smo
ke
d
tob
acc
o2
De
mo
gra
ph
ic C
ha
ract
eri
stic
Ag
e (
ye
ars
)
Re
sid
en
ce
Ed
uca
tio
n L
ev
el
Occ
up
ati
on
/Wo
rk s
tatu
s
† W
hit
e c
iga
rett
es
re
pre
se
nts
ma
nu
fact
ure
d c
iga
rett
es
.
24 Tobacco Use
4.5. Frequency of tobacco use
4.5.1. Frequency of cigarette smoking
Table 4.5 presents the frequency of cigarette smoking as three standard categories – “daily cigarette smokers”,
“occasional cigarette smokers” and “non-smokers”. The percentages of adults aged 15 years and over who are daily
smokers, occasional smokers, and non-smokers are 29.2%, 5.6%, and 65.2%, respectively. The percentage of men
and women daily smokers is 56.7% and 1.8%, respectively. The percentage of men occasional smokers (10.3%) is
almost 13 times that of women occasional smokers (0.8%). The percentage of women non-smokers (97.3%) is almost
thrice that of men non-smokers (33.0%). Daily smoking is higher in all the age groups of 25 years and above as
compared to the 15–24 years age group; however, occasional smoking shows no change for different age groups.
Among men, by age group, the highest percentage of daily smokers can be found in the 25–44 years and 45–64 years
age groups (63.8% and 62.8%, respectively). The 15–24 years age group has the highest percentage of occasional
smokers (12.9%) while the remaining three age groups have similar percentages of occasional smokers (about 9%).
Among men, by residence, the percentage of daily smokers in rural areas (62.3%) is higher than that in urban areas
(51.2%). The distribution of occasional smokers is similar (10.4% urban, 10.2% rural). The percentage of men non-
smokers living in urban areas (38.4%) is higher than among those living in rural areas (27.5%).
Among men, the percentage of daily smokers is high for those with less than primary school (71.1%) and primary
school (62.8%) education. There is no specific distribution pattern for occasional smokers based on educational level.
The group with university education has the highest percentage of non-smokers (50.2%) followed by high school
(41.3%), secondary school (37.7%), primary school education (26.0%) and less than primary school education
(19.0%).
By occupation, self-employed men have the highest prevalence of daily smoking (65.5%), followed by those who
were employed (60.1%).

25 Tobacco Use
Overall 29.2 (27.6, 30.9) 5.6 (4.8, 6.4) 65.2 (63.6, 66.8) 100
15-24 19.6 (17.1, 22.3) 6.5 (5.0, 8.3) 73.9 (71.1, 76.6) 100
25-44 32.6 (30.6, 34.8) 5.0 (4.2, 6.0) 62.4 (60.3, 64.4) 100
45-64 33.5 (30.5, 36.6) 5.9 (4.8, 7.2) 60.6 (57.6, 63.6) 100
65+ 26.1 (22.7, 29.9) 5.0 (3.5, 7.2) 68.9 (65.0, 72.5) 100
Urban 26.3 (24.3, 28.4) 5.7 (4.8, 6.8) 68.1 (65.9, 70.2) 100
Rural 32.2 (29.7, 34.8) 5.5 (4.4, 6.8) 62.3 (59.9, 64.7) 100
Less than primary school completed 32.7 (29.5, 36.0) 5.3 (4.1, 6.8) 62.0 (58.9, 65.1)
Primary school completed 31.3 (29.0, 33.7) 5.9 (4.8, 7.1) 62.8 (60.4, 65.1) 100
Secondary school completed 26.3 (23.8, 29.0) 5.6 (4.2, 7.3) 68.1 (65.4, 70.7) 100
High school completed 28.3 (26.0, 30.7) 5.4 (4.4, 6.7) 66.3 (63.7, 68.7) 100
Col lege or Univers i ty + 21.9 (18.9, 25.4) 5.7 (3.8, 8.4) 72.4 (68.1, 76.2) 100
Employed 40.1 (37.1, 43.3) 6.6 (5.4, 8.1) 53.2 (50.3, 56.2) 100
Sel f-employed 43.4 (40.2, 46.7) 6.9 (5.7, 8.4) 49.7 (46.2, 53.1) 100
Students 7.5 (4.9, 11.2) 6.8 (4.5, 10.1) 85.7 (81.6, 89.1) 100
Home makers 1.7 (1.1, 2.7) 1.0 (0.5, 1.9) 97.3 (95.9, 98.2) 100
Un-employed 24.5 (20.5, 29.1) 7.0 (5.0, 9.8) 68.4 (63.8, 72.7) 100
Table 4.5: Percentage dis tribution of adults ≥15 years old, by tobacco smoking frequency, gender and
selected demographic characteris tics – GATS Indones ia , 2011.
1 Occas ional refers to less than dai ly use.
-- Indicator estimate based on less than 25 un-weighted cases and has been suppressed.
Smoking FrequencyTotal
Daily Occasional1 Non-smoker
Percentage (95% CI)
Demographic Characteristics
Occupation/Work status
Education Level
Residence
Age (years)

26 Tobacco Use
Male 56.7 (53.8, 59.6) 10.3 (9.0, 11.8) 33.0 (30.5, 35.6) 100
15-24 38.9 (34.3, 43.6) 12.9 (10.0, 16.4) 48.3 (43.7, 52.9) 100
25-44 63.8 (60.4, 67.0) 9.5 (7.9, 11.4) 26.7 (23.9, 29.8) 100
45-64 62.8 (58.1, 67.2) 9.6 (7.7, 12.0) 27.6 (23.7, 31.9) 100
65+ 52.2 (45.8, 58.7) 9.0 (6.0, 13.2) 38.8 (32.9, 45.1) 100
Urban 51.2 (47.5, 55.0) 10.4 (8.7, 12.3) 38.4 (35.0, 41.8) 100
Rural 62.3 (57.8, 66.6) 10.2 (8.2, 12.7) 27.5 (24.0, 31.3) 100
Less than primary school completed 71.1 (65.7, 75.9) 10.0 (7.3, 13.4) 19.0 (15.1, 23.5) 100
Primary school completed 62.8 (58.9, 66.5) 11.3 (9.3, 13.6) 26.0 (22.6, 29.7) 100
Secondary school completed 51.4 (46.8, 55.9) 10.9 (8.3, 14.2) 37.7 (33.6, 42.0) 100
High school completed 49.5 (45.9, 53.2) 9.1 (7.3, 11.4) 41.3 (38.0, 44.8) 100
Col lege or Univers i ty + 39.6 (34.6, 44.8) 10.2 (6.8, 15.0) 50.2 (43.6, 56.8) 100
Employed 60.1 (55.8, 64.2) 9.7 (8.0, 11.8) 30.2 (26.9, 33.7) 100
Sel f-employed 65.5 (61.9, 69.0) 10.2 (8.4, 12.2) 24.3 (21.2, 27.7) 100
Students 13.2 (8.9, 19.1) 11.9 (7.9, 17.5) 74.9 (68.6, 80.4) 100
Home makers -- -- -- --
Un-employed 43.4 (36.9, 50.1) 12.0 (8.3, 17.0) 44.6 (37.9, 51.5) 100
Table 4.5 (cont): Percentage dis tribution of adults ≥15 years old, by tobacco smoking frequency, gender
and selected demographic characteris tics – GATS Indones ia , 2011.
1 Occas ional refers to less than dai ly use.
Smoking FrequencyTotal
Daily Occasional1 Non-smoker
Percentage (95% CI)
-- Indicator estimate based on less than 25 un-weighted cases and has been suppressed.
Demographic Characteristics
Age (years)
Residence
Education Level
Occupation/Work status

27 Tobacco Use
Female 1.8 (1.4, 2.4) 0.8 (0.5, 1.3) 97.3 (96.5, 98.0) 100
15-24 0.1 (0.0, 0.7) 0.0 99.9 (99.3, 100.0) 100
25-44 1.2 (0.8, 1.9) 0.5 (0.2, 1.0) 98.3 (97.4, 98.9) 100
45-64 3.7 (2.4, 5.5) 2.1 (1.3, 3.5) 94.2 (91.9, 95.9) 100
65+ 5.0 (2.9, 8.4) 1.8 (0.8, 3.7) 93.3 (89.0, 95.9) 100
Urban 1.4 (0.8, 2.2) 1.0 (0.5, 1.9) 97.7 (96.3, 98.6) 100
Rural 2.3 (1.6, 3.2) 0.7 (0.5, 1.2) 97.0 (95.8, 97.8) 100
Less than primary school completed 4.1 (2.7, 6.0) 1.8 (1.1, 2.7) 94.2 (91.9, 95.8) 100
Primary school completed 1.8 (1.1, 3.0) 0.8 (0.4, 1.9) 97.3 (95.8, 98.3) 100
Secondary school completed 0.5 (0.2, 1.3) 0.1 (0.0, 0.8) 99.4 (98.5, 99.8) 100
High school completed 0.4 (0.2, 1.2) 0.6 (0.3, 1.4) 99.0 (98.1, 99.5) 100
Col lege or Univers i ty + 1.6 (0.6, 4.5) 0.6 (0.1, 4.0) 97.8 (94.6, 99.1) 100
Employed 0.9 (0.5, 1.9) 0.5 (0.2, 1.3) 98.5 (97.3, 99.2) 100
Sel f-employed 3.2 (2.1, 4.8) 1.0 (0.6, 1.9) 95.8 (93.9, 97.1) 100
Students 0.0 0.0 100.0 100
Home makers 1.7 (1.1, 2.6) 1.0 (0.5, 1.9) 97.4 (96.0, 98.3) 100
Un-employed 2.2 (1.1, 4.4) 1.2 (0.4, 3.4) 96.6 (93.9, 98.2) 100
Percentage (95% CI)
1 Occas ional refers to less than dai ly use.
-- Indicator estimate based on less than 25 un-weighted cases and has been suppressed.
Table 4.5 (cont): Percentage dis tribution of adults ≥15 years old, by cigarette smoking frequency, gender
and selected demographic characteris tics – GATS Indones ia , 2011.
Smoking FrequencyTotal
Daily Occasional1 Non-smokerDemographic Characteristics
Occupation/Work status
Education Level
Residence
Age (years)

28 Tobacco Use
4.5.2. Frequency of white cigarette smoking
Table 4.5A presents the frequency of white cigarette smoking in three standard categories – “daily smokers”,
“occasional smokers” and “non-smokers”. The percentage of adults aged 15 years and above who are daily white
cigarette smokers, occasional white cigarette smokers and non-smokers of white cigarettes are 1.6%, 0.6% and
97.8%, respectively. The percentage of daily white cigarette smokers is 3.1% among men and 0.1% among women.
The percentage of occasional white cigarette smokers is 1.2% among men; 95.7% of men are non-smokers of white
cigarettes. Among women, 98.9% are non-smokers of white cigarettes.
Among men, the prevalence of daily and occasional smoking does not differ by age or residence; however, daily
smoking is more prevalent among the higher education group.
Among women, the numbers are small and hence comparision is difficult.
Overall 1.6 (1.2, 2.2) 0.6 (0.4, 0.9) 97.8 (97.0, 98.4) 100
15-24 1.2 (0.7, 2.1) 0.6 (0.3, 1.2) 98.1 (97.1, 98.8) 100
25-44 2.3 (1.6, 3.2) 0.7 (0.4, 1.1) 97.0 (95.9, 97.9) 100
45-64 0.7 (0.3, 1.4) 0.5 (0.3, 1.1) 98.8 (97.8, 99.3) 100
65+ 1.4 (0.6, 3.3) 0.5 (0.1, 1.6) 98.1 (96.2, 99.1) 100
Urban 2.1 (1.4, 3.1) 0.7 (0.4, 1.3) 97.2 (95.7, 98.1) 100
Rural 1.1 (0.7, 1.7) 0.5 (0.3, 0.8) 98.4 (97.7, 99.0) 100
Less than primary school completed 0.6 (0.3, 1.3) 0.3 (0.1, 0.7) 99.0 (98.3, 99.5)
Primary school completed 0.9 (0.5, 1.7) 0.4 (0.2, 0.8) 98.7 (97.8, 99.2) 100
Secondary school completed 1.7 (1.1, 2.8) 0.4 (0.2, 0.9) 97.9 (96.7, 98.7) 100
High school completed 2.8 (2.1, 3.9) 0.9 (0.5, 1.7) 96.3 (94.9, 97.3) 100
Col lege or Univers i ty + 2.7 (1.4, 5.0) 2.1 (0.9, 4.5) 95.3 (91.9, 97.3) 100
Employed 2.2 (1.4, 3.3) 0.9 (0.5, 1.5) 97.0 (95.6, 97.9) 100
Sel f-employed 2.1 (1.4, 3.1) 0.8 (0.5, 1.3) 97.1 (95.9, 98.0) 100
Students 0.8 (0.3, 2.1) 0.6 (0.2, 2.0) 98.5 (97.0, 99.3) 100
Home makers 0.1 (0.0, 1.0) 0.0 99.9 (99.0, 100.0) 100
Un-employed 1.8 (0.9, 3.6) 0.7 (0.2, 2.2) 97.5 (95.5, 98.6) 100
Percentage (95% CI)
1 Occas ional refers to less than dai ly use.
-- Indicator estimate based on less than 25 un-weighted cases and has been suppressed.
Table 4.5A: Percentage dis tribution of adults ≥15 years old, by white cigarette smoking frequency, gender and selected
demographic characteris tics – GATS Indones ia , 2011.
White Cigarette Smoking Frequency
TotalDaily Occasional1 Non-smokerDemographic Characteristics
Age (years)
Residence
Education Level
Occupation/Work status

29 Tobacco Use
Male 3.1 (2.2, 4.2) 1.2 (0.8, 1.8) 95.7 (94.2, 96.8) 100
15-24 2.5 (1.5, 4.1) 1.2 (0.6, 2.4) 96.3 (94.3, 97.6) 100
25-44 4.4 (3.2, 6.2) 1.4 (0.8, 2.3) 94.2 (92.0, 95.8) 100
45-64 1.3 (0.6, 2.8) 0.9 (0.4, 2.0) 97.8 (95.9, 98.8) 100
65+ 2.2 (0.9, 5.2) 1.0 (0.3, 3.5) 96.7 (93.6, 98.4) 100
Urban 4.0 (2.7, 6.0) 1.5 (0.8, 2.6) 94.5 (91.8, 96.4) 100
Rural 2.1 (1.3, 3.4) 0.9 (0.5, 1.5) 96.9 (95.4, 98.0) 100
Less than primary school completed 1.2 (0.6, 2.3) 0.7 (0.3, 1.7) 98.1 (96.7, 98.9)
Primary school completed 1.9 (1.0, 3.6) 0.8 (0.4, 1.7) 97.3 (95.5, 98.4) 100
Secondary school completed 3.4 (2.1, 5.6) 0.7 (0.3, 1.8) 95.9 (93.4, 97.4) 100
High school completed 5.0 (3.6, 6.8) 1.6 (0.9, 3.0) 93.4 (91.0, 95.2) 100
Col lege or Univers i ty + 4.5 (2.3, 8.7) 3.9 (1.8, 8.1) 91.6 (85.7, 95.2) 100
Employed 3.3 (2.2, 4.9) 1.3 (0.7, 2.3) 95.5 (93.4, 96.9) 100
Sel f-employed 3.2 (2.2, 4.7) 1.2 (0.7, 2.0) 95.6 (93.8, 96.9) 100
Students 1.4 (0.6, 3.6) 1.1 (0.4, 3.5) 97.4 (94.8, 98.8) 100
Home makers -- -- -- --
Un-employed 3.4 (1.7, 6.5) 1.2 (0.4, 4.0) 95.4 (91.8, 97.5) 100
Percentage (95% CI)
1 Occas ional refers to less than dai ly use.
Table 4.5A (cont): Percentage dis tribution of adults ≥15 years old, by white cigarette smoking frequency, gender and
selected demographic characteris tics – GATS Indones ia , 2011.
White Cigarette Smoking Frequency
TotalDaily Occasional1 Non-smokerDemographic Characteristics
Occupation/Work status
Education Level
Residence
Age (years)
-- Indicator estimate based on less than 25 un-weighted cases and has been suppressed.

30 Tobacco Use
Female 0.1 (0.0, 0.4) 0.0 (0.0, 0.1) 99.9 (99.6, 100.0) 100
15-24 0.0 0.0 100.0 100
25-44 0.1 (0.0, 0.5) 0.0 99.9 (99.5, 100.0) 100
45-64 0.0 0.1 (0.0, 0.5) 99.9 (99.5, 100.0) 100
65+ 0.8 (0.1, 5.5) 0.0 99.2 (94.5, 99.9) 100
Urban 0.2 (0.0, 0.8) 0.0 99.8 (99.2, 100.0) 100
Rural 0.0 0.1 (0.0, 0.2) 99.9 (99.8, 100.0) 100
Less than primary school completed 0.2 (0.0, 1.7) 0.0 99.8 (98.3, 100.0)
Primary school completed 0.0 0.1 (0.0, 0.4) 99.9 (99.6, 100.0) 100
Secondary school completed 0.0 0.0 100.0 100
High school completed 0.0 0.0 100.0 100
Col lege or Univers i ty + 0.5 (0.1, 3.5) 0.0 99.5 (96.5, 99.9) 100
Employed 0.0 0.1 (0.0, 0.6) 99.9 (99.4, 100.0) 100
Sel f-employed 0.1 (0.0, 0.9) 0.0 (0.0, 0.4) 99.8 (99.2, 100.0) 100
Students 0.0 0.0 100.0 100
Home makers 0.1 (0.0, 1.0) 0.0 99.9 (99.0, 100.0) 100
Un-employed 0.0 0.0 100.0 100
Percentage (95% CI)
1 Occas ional refers to less than dai ly use.
-- Indicator estimate based on less than 25 un-weighted cases and has been suppressed.
Table 4.5A (cont): Percentage dis tribution of adults ≥15 years old, by white cigarette smoking frequency, gender and
selected demographic characteris tics – GATS Indones ia , 2011.
White Cigarette Smoking Frequency
TotalDaily Occasional1 Non-smokerDemographic Characteristics
Occupation/Work status
Education Level
Residence
Age (years)

31 Tobacco Use
4.5.3. Frequency of hand-rolled cigarette smoking
Table 4.5B presents the frequency of hand-rolled cigarette smoking by three standard categories – “daily smokers”,
“occasional smokers” and “non-smokers”. The percentage of adults aged 15 years and above who are daily hand-
rolled cigarette smokers, occasional hand-rolled cigarette smokers and non-smokers of hand-rolled cigarettes is
3.8%, 1.0% and 95.3%, respectively. The percentage of daily hand-rolled cigarette smokers among men is 7.2% and
among women it is 0.4%. The percentage of occasional hand-rolled cigarette smokers among men is 1.8%; 91.0% of
men are non-smokers of hand-rolled cigarettes. Among women, 0.1% identified themselves as occasional hand-
rolled cigarette smokers and 99.5% are non-smokers.
Among men, the prevalence of daily hand-rolled cigarette smoking increases with age; it is higher in rural (10.7%)
areas as compared to urban areas (3.7%). Daily hand-rolled cigarette smoking among men is higher among less
educated people (less than primary, primary) as compared to more educated people(high school, college or
university). Occasional hand-rolled cigarette smoking among men does not differ by age, residence or education.
Among women, the numbers are small and hence a comparision is difficult.
Overall 3.8 (2.8, 5.0) 1.0 (0.7, 1.4) 95.3 (93.7, 96.4) 100
15-24 0.8 (0.4, 1.7) 0.3 (0.1, 1.1) 98.9 (97.8, 99.4) 100
25-44 2.8 (1.8, 4.2) 0.9 (0.5, 1.8) 96.3 (94.4, 97.6) 100
45-64 6.6 (4.9, 8.8) 1.3 (0.9, 2.0) 92.1 (89.7, 94.0) 100
65+ 10.8 (8.0, 14.5) 2.3 (1.4, 3.9) 86.8 (83.1, 89.8) 100
Urban 1.9 (1.1, 3.2) 0.5 (0.3, 1.0) 97.6 (96.1, 98.5) 100
Rural 5.7 (4.0, 8.0) 1.4 (0.9, 2.3) 92.9 (90.0, 95.0) 100
Less than primary school completed 9.3 (6.9, 12.4) 1.5 (1.0, 2.3) 89.2 (85.9, 91.8)
Primary school completed 4.7 (3.3, 6.7) 1.3 (0.8, 2.1) 94.0 (91.7, 95.7) 100
Secondary school completed 1.0 (0.6, 1.9) 0.6 (0.2, 1.5) 98.4 (97.3, 99.1) 100
High school completed 1.0 (0.6, 1.7) 0.4 (0.1, 1.4) 98.6 (97.6, 99.2) 100
Col lege or Univers i ty + 0.1 (0.0, 1.0) 1.2 (0.4, 3.0) 98.7 (96.7, 99.5) 100
Employed 4.6 (2.9, 7.2) 1.0 (0.6, 1.8) 94.4 (91.5, 96.3) 100
Sel f-employed 6.3 (4.6, 8.5) 1.6 (1.1, 2.4) 92.1 (89.5, 94.1) 100
Students 0.1 (0.0, 1.0) 0.1 (0.0, 1.0) 99.7 (98.0, 100.0) 100
Home makers 0.3 (0.1, 1.0) 0.1 (0.0, 0.4) 99.6 (99.0, 99.8) 100
Un-employed 2.8 (1.8, 4.5) 1.2 (0.4, 3.3) 96.0 (93.6, 97.5) 100
Percentage (95% CI)
1 Occas ional refers to less than dai ly use.
-- Indicator estimate based on less than 25 un-weighted cases and has been suppressed.
Table 4.5B: Percentage dis tribution of adults ≥15 years old, by hand-rol led cigarette smoking frequency, gender and
selected demographic characteris tics – GATS Indones ia , 2011.
Hand-rolled Cigarette Smoking Frequency
TotalDaily Occasional1
Non-smokerDemographic Characteristics
Age (years)
Residence
Education Level
Occupation/Work status

32 Tobacco Use
Male 7.2 (5.3, 9.6) 1.8 (1.2, 2.7) 91.0 (88.0, 93.3) 100
15-24 1.6 (0.7, 3.3) 0.7 (0.2, 2.1) 97.8 (95.6, 98.9) 100
25-44 5.3 (3.5, 8.0) 1.8 (0.9, 3.5) 92.9 (89.3, 95.4) 100
45-64 12.2 (9.1, 16.3) 2.4 (1.6, 3.7) 85.3 (81.0, 88.8) 100
65+ 22.9 (16.8, 30.4) 4.3 (2.3, 7.9) 72.8 (65.3, 79.2) 100
Urban 3.7 (2.1, 6.3) 0.9 (0.5, 1.9) 95.4 (92.5, 97.2) 100
Rural 10.7 (7.5, 15.2) 2.7 (1.6, 4.4) 86.5 (81.1, 90.6) 100
Less than primary school completed 20.0 (14.5, 26.9) 3.2 (2.0, 5.1) 76.8 (69.6, 82.7)
Primary school completed 9.5 (6.6, 13.4) 2.6 (1.6, 4.2) 87.9 (83.4, 91.3) 100
Secondary school completed 2.0 (1.1, 3.7) 1.1 (0.4, 2.9) 96.9 (94.7, 98.2) 100
High school completed 1.8 (1.0, 3.0) 0.7 (0.2, 2.4) 97.6 (95.8, 98.6) 100
Col lege or Univers i ty + 0.3 (0.0, 1.9) 1.7 (0.6, 5.0) 98.0 (94.5, 99.3) 100
Employed 6.8 (4.3, 10.7) 1.4 (0.8, 2.6) 91.8 (87.6, 94.6) 100
Sel f-employed 9.4 (6.9, 12.7) 2.4 (1.6, 3.6) 88.2 (84.2, 91.2) 100
Students 0.2 (0.0, 1.7) 0.2 (0.0, 1.7) 99.5 (96.6, 99.9) 100
Home makers -- -- -- --
Un-employed 4.6 (2.7, 7.8) 2.1 (0.7, 6.1) 93.2 (88.8, 96.0) 100
Percentage (95% CI)
1 Occas ional refers to less than dai ly use.
-- Indicator estimate based on less than 25 un-weighted cases and has been suppressed.
Table 4.5B (cont): Percentage dis tribution of adults ≥15 years old, by hand-rol led cigarette smoking frequency, gender and
selected demographic characteris tics – GATS Indones ia , 2011.
Hand-rolled Cigarette Smoking Frequency
TotalDaily Occasional1
Non-smokerDemographic Characteristics
Occupation/Work status
Education Level
Age (years)
Residence

33 Tobacco Use
4.5.4. Frequency of kretek smoking
Table 4.5C presents the frequency of kretek smoking by three standard categories – “daily smokers”, “occasional
smokers” and “non-smokers”. The percentage of adults aged 15 years and above who are daily kretek smokers,
occasional kretek smokers and non-smokers of kretek is 25.9%, 5.7% and 68.5%, respectively. The percentage of
daily kretek smokers among men is 50.3% and among women it is 1.5%. The percentage of occasional kretek
smokers among men is 10.6% and 39.1% of men are non-smokers of kretek. Among women, 0.8% identified
themselves as occasional kretek smokers and 97.7% are non-smokers of kretek.
Among men, the 25–44 years age group has the highest percentage of daily kretek smokers (57.9%), followed by the
45–64 years age group (53.9%). Among men, the percentage of daily kretek smokers in rural areas (55.0%) is higher
than that in urban areas (45.6%). Daily kretek smoking is more prevalent among less educated people (less than
primary, primary) as compared to people with higher educational levels (high school and college or university
educated). Among men, occasional kretek smoking does not differ by age, residence or education.
Among women, the numbers are small and therefore a comparision is difficult.
Female 0.4 (0.2, 0.7) 0.1 (0.1, 0.3) 99.5 (99.2, 99.7) 100
15-24 0.0 0.0 100.0 100
25-44 0.2 (0.0, 0.9) 0.1 (0.0, 0.5) 99.7 (99.0, 99.9) 100
45-64 0.8 (0.4, 1.6) 0.2 (0.0, 0.5) 99.1 (98.2, 99.5) 100
65+ 1.1 (0.4, 2.8) 0.7 (0.2, 2.1) 98.2 (95.7, 99.3) 100
Urban 0.1 (0.0, 0.4) 0.1 (0.0, 0.4) 99.8 (99.4, 100.0) 100
Rural 0.6 (0.3, 1.3) 0.1 (0.1, 0.4) 99.2 (98.5, 99.6) 100
Less than primary school completed 1.3 (0.6, 2.5) 0.2 (0.1, 0.6) 98.5 (97.1, 99.2) 100
Primary school completed 0.2 (0.0, 0.7) 0.1 (0.0, 0.5) 99.7 (99.2, 99.9) 100
Secondary school completed 0.0 0.0 100.0 100
High school completed 0.0 0.0 100.0 100
Col lege or Univers i ty + 0.0 0.5 (0.1, 3.5) 99.5 (96.5, 99.9) 100
Employed 0.2 (0.1, 1.0) 0.2 (0.1, 0.6) 99.6 (98.9, 99.8) 100
Sel f-employed 0.6 (0.3, 1.4) 0.1 (0.0, 0.9) 99.3 (98.4, 99.7) 100
Students 0.0 0.0 100.0 100
Home makers 0.3 (0.1, 0.9) 0.1 (0.0, 0.4) 99.6 (99.0, 99.8) 100
Un-employed 0.7 (0.2, 2.9) 0.1 (0.0, 0.7) 99.2 (97.2, 99.8) 100
Percentage (95% CI)
1 Occas ional refers to less than dai ly use.
-- Indicator estimate based on less than 25 un-weighted cases and has been suppressed.
Table 4.5B (cont): Percentage dis tribution of adults ≥15 years old, by hand-rol led cigarette smoking frequency, gender and
selected demographic characteris tics – GATS Indones ia , 2011.
Hand-rolled Cigarette Smoking Frequency
TotalDaily Occasional1 Non-smokerDemographic Characteristics
Occupation/Work status
Education Level
Residence
Age (years)

34 Tobacco Use
Overall 25.9 (24.2, 27.6) 5.7 (4.9, 6.6) 68.5 (66.7, 70.2) 100
15-24 18.9 (16.5, 21.5) 6.3 (4.9, 8.1) 74.8 (72.0, 77.5) 100
25-44 29.6 (27.7, 31.7) 5.0 (4.1, 6.0) 65.4 (63.3, 67.4) 100
45-64 28.8 (25.9, 31.9) 6.4 (5.2, 7.8) 64.8 (61.8, 67.8) 100
65+ 15.8 (12.8, 19.3) 5.7 (4.1, 7.8) 78.5 (74.7, 81.9) 100
Urban 23.3 (21.3, 25.5) 5.3 (4.3, 6.5) 71.4 (68.9, 73.8) 100
Rural 28.4 (25.8, 31.2) 6.1 (4.9, 7.5) 65.5 (63.0, 67.9) 100
Less than primary school completed 26.2 (22.7, 30.1) 6.3 (4.9, 7.9) 67.5 (63.8, 71.0)
Primary school completed 28.1 (25.5, 30.8) 5.9 (4.8, 7.2) 66.1 (63.3, 68.7) 100
Secondary school completed 24.8 (22.2, 27.5) 5.4 (4.1, 7.2) 69.8 (66.9, 72.5) 100
High school completed 25.6 (23.3, 28.1) 5.2 (4.2, 6.5) 69.1 (66.4, 71.7) 100
Col lege or Univers i ty + 20.2 (17.2, 23.6) 5.4 (3.6, 7.8) 74.4 (70.2, 78.2) 100
Employed 36.4 (33.4, 39.5) 6.5 (5.3, 8.0) 57.1 (54.1, 60.0) 100
Sel f-employed 37.7 (34.5, 41.1) 7.5 (6.1, 9.1) 54.8 (51.3, 58.3) 100
Students 7.0 (4.6, 10.6) 6.7 (4.5, 10.0) 86.3 (82.0, 89.6) 100
Home makers 1.4 (0.9, 2.2) 0.9 (0.4, 1.8) 97.6 (96.3, 98.5) 100
Un-employed 21.3 (17.4, 25.9) 6.6 (4.6, 9.4) 72.1 (67.4, 76.3) 100
Table 4.5C: Percentage dis tribution of adults ≥15 years old, by kretek cigarette smoking frequency, gender and selected
demographic characteris tics – GATS Indones ia , 2011.
Kretek Smoking Frequency
TotalDaily Occasional1
Non-smoker
-- Indicator estimate based on less than 25 un-weighted cases and has been suppressed.
Demographic Characteristics
Percentage (95% CI)
1 Occas ional refers to less than dai ly use.
Occupation/Work status
Education Level
Residence
Age (years)
Male 50.3 (47.2, 53.4) 10.6 (9.1, 12.2) 39.1 (36.2, 42.1) 100
15-24 37.4 (33.0, 42.1) 12.5 (9.8, 15.9) 50.0 (45.3, 54.8) 100
25-44 57.9 (54.4, 61.4) 9.4 (7.8, 11.4) 32.6 (29.4, 36.0) 100
45-64 53.9 (49.0, 58.7) 10.7 (8.6, 13.3) 35.4 (31.2, 39.9) 100
65+ 31.5 (25.6, 38.0) 11.0 (7.8, 15.3) 57.5 (50.9, 63.9) 100
Urban 45.6 (41.7, 49.6) 9.6 (7.9, 11.7) 44.7 (40.7, 48.9) 100
Rural 55.0 (50.2, 59.7) 11.6 (9.3, 14.3) 33.4 (29.5, 37.6) 100
Less than primary school completed 57.3 (50.8, 63.5) 12.6 (9.6, 16.3) 30.1 (24.9, 36.0) 100
Primary school completed 56.1 (51.3, 60.7) 11.3 (9.1, 13.8) 32.7 (28.2, 37.4) 100
Secondary school completed 48.3 (43.8, 52.8) 10.6 (8.0, 13.9) 41.1 (36.7, 45.6) 100
High school completed 44.9 (41.1, 48.7) 8.8 (7.0, 10.9) 46.4 (42.6, 50.2) 100
Col lege or Univers i ty + 36.8 (31.8, 42.0) 9.5 (6.4, 14.0) 53.7 (46.9, 60.3) 100
Employed 54.5 (50.0, 58.8) 9.6 (7.9, 11.7) 35.9 (32.2, 39.8) 100
Sel f-employed 57.0 (53.0, 60.9) 11.0 (9.1, 13.4) 32.0 (28.2, 36.0) 100
Students 12.3 (8.2, 18.0) 11.8 (7.9, 17.2) 75.9 (69.5, 81.3) 100
Home makers -- -- -- --
Un-employed 38.1 (31.6, 45.0) 11.3 (7.7, 16.4) 50.6 (43.6, 57.5) 100
Demographic Characteristics
-- Indicator estimate based on less than 25 un-weighted cases and has been suppressed.
1 Occas ional refers to less than dai ly use.
Table 4.5C (cont): Percentage dis tribution of adults ≥15 years old, by kretek cigarette smoking frequency, gender and
selected demographic characteris tics – GATS Indones ia , 2011.
Smoking Frequency
TotalDaily Occasional1
Non-smoker
Percentage (95% CI)
Age (years)
Residence
Education Level
Occupation/Work status

35 Tobacco Use
4.6. Average number of any cigarette smoked per day
Table 4.6 gives the average number and percentage distribution of any type of cigarette smoked per day among daily
smokers. The overall figure is 12.8 sticks per day. About 34% of daily smokers smoke 10–14 sticks per day, and only
6.3% smoke 25 or more sticks per day.
For men, the overall average is 13.0 sticks per day and for women it is 8.1. Among men smokers, the highest
proportion smoke 10–14 sticks (34.7%), while among women smokers it is 5–9 sticks (36.6%). There are no women
smokers who smoke 25 or more sticks per day, as against 6.5% among men smokers.
The overall average numbers of cigarettes smoked per day is similar for all age groups, ranging between 11.4 and
13.2 sticks. In the adolescent age group (15–24 years), the highest proportion of average cigarettes smoked per day
(26.8%) is 15–24 sticks per day.
The average number of cigarettes smoked per day in rural areas is 13.3 as against 12.3 sticks in urban areas. The
highest prevalence (34.7%) in both urban and rural areas is 10–14 sticks per day and the lowest (4.4%) is 25 or more
sticks per day.
Based on the educational level, those with college or university-level education smoke the most every day (13.7
sticks). Among them, 46.2% smoke 15–24 sticks per day. The highest average number of cigarettes smoked daily for
all other educational levels is 10–14 sticks.
By occupation, the highest average number of cigarettes smoked per day is among those who are self-employed
(13.5 sticks) and the lowest average number is smoked by home-makers (7.6 sticks). More than half of the smokers
in the home-maker group (58.7%) smoke 5–9 cigarettes per day and none smoke 25 or more per day. The self-
employed group has the highest percentage of smokers who smoke 25 or more cigarettes daily (8.2%).
Female 1.5 (1.1, 2.1) 0.8 (0.5, 1.3) 97.7 (96.9, 98.3) 100
15-24 0.1 (0.0, 0.7) 0.0 99.9 (99.3, 100.0) 100
25-44 1.1 (0.7, 1.7) 0.5 (0.2, 1.0) 98.4 (97.6, 99.0) 100
45-64 3.3 (2.2, 5.0) 2.0 (1.1, 3.3) 94.8 (92.5, 96.3) 100
65+ 3.1 (1.6, 5.9) 1.4 (0.6, 3.3) 95.5 (91.8, 97.6) 100
Urban 1.1 (0.6, 1.9) 0.9 (0.4, 1.9) 98.0 (96.6, 98.8) 100
Rural 1.9 (1.3, 2.8) 0.6 (0.4, 1.1) 97.4 (96.4, 98.2) 100
Less than primary school completed 3.0 (2.0, 4.7) 1.5 (0.9, 2.5) 95.4 (93.4, 96.8) 100
Primary school completed 1.8 (1.1, 3.0) 0.8 (0.3, 1.8) 97.4 (95.8, 98.4) 100
Secondary school completed 0.5 (0.2, 1.3) 0.1 (0.0, 0.8) 99.4 (98.5, 99.8) 100
High school completed 0.4 (0.2, 1.2) 0.6 (0.3, 1.4) 99.0 (98.1, 99.5) 100
Col lege or Univers i ty + 1.1 (0.3, 3.9) 0.6 (0.1, 4.0) 98.3 (95.2, 99.4) 100
Employed 0.9 (0.5, 1.9) 0.4 (0.1, 1.3) 98.6 (97.5, 99.3) 100
Sel f-employed 2.7 (1.7, 4.2) 1.0 (0.5, 1.8) 96.3 (94.5, 97.5) 100
Students 0.0 0.0 100.0 100
Home makers 1.4 (0.9, 2.2) 0.9 (0.4, 1.9) 97.7 (96.4, 98.6) 100
Un-employed 1.5 (0.7, 3.4) 1.1 (0.3, 3.4) 97.4 (94.9, 98.7) 100
Table 4.5C (cont): Percentage dis tribution of adults ≥15 years old, by kretek cigarette smoking frequency, gender and
selected demographic characteris tics – GATS Indones ia , 2011.
Smoking Frequency
TotalDaily Occasional1
Non-smoker
-- Indicator estimate based on less than 25 un-weighted cases and has been suppressed.
Demographic Characteristics
Percentage (95% CI)
1 Occas ional refers to less than dai ly use.
Age (years)
Residence
Education Level
Occupation/Work status

36 Tobacco Use
4.6.1. Average number and distribution of white cigarettes smoked per day
Table 4.6A shows the daily average number and proportion of white cigarettes smoked by daily white cigarette
smokers by gender and selected demographic characteristics. Overall, on average, white cigarette smokers smoke
14.7 sticks per day, of whom 50.1% smoke 15–24 sticks per day and 5.2% smoke 25 or more sticks per day. Men
white cigarette smokers smoke 15.0 sticks per day; about half of them (51.6%) smoke 15–24 sticks per day and 5.1%
smoke less than 5 sticks per day. A larger proportion smoke white cigarettes daily in urban areas (15 sticks) than in
rural areas (14.1 sticks). Both urban and rural white cigarette smokers comprise the largest proportion in the group
of daily smokers; an average of 15–24 sticks per day. The least proportion of average number of cigarettes smoked
among the urban population is less than 5 sticks per day and among the rural population it is more than 25 sticks per
day.
4.6.2. Average number and distribution of hand-rolled cigarettes smoked per day
Table 4.6B gives the daily average number and proportion of hand-rolled cigarettes smoked by gender and selected
demograpghic characteristics. Overall, hand-rolled cigarettes smokers smoke 11.8 sticks per day; 18.4% smoke less
than 5 sticks per day,27.5% smoke 5–9 sticks per day, 27.2% smoke 10–14 sticks per day, 17.1% smoke 15–24 sticks
per day and 9.8% smoke 25 or more sticks per day. Men hand-rolled cigarette smokers smoke 12.1 sticks per day,
with a similar distribution pattern as the overall figures. Overall, more hand-rolled cigarettes are smoked in rural
areas (12 sticks per day) than in urban areas (11.4 sticks per day). The largest proportion of average number of hand-
rolled cigarettes smoked among the urban population is 10–14 sticks per day and that among the rural population is
5–9 sticks per day.
4.6.3. Average number and distribution of kretek cigarettes smoked per day
Table 4.6C gives the average number and distribution of kretek cigarettes smoked by daily smokers by gender and
selected demographic characteristics. The overall number of kretek cigarettes smoked per day among daily smokers
is 11.8 sticks. Overall, 36.2% of daily smokers of kretek cigarettes smoke 10–14 cigarettes per day; 16.1% smoke less
than 5 cigarettes per day, 19.3% smoke 5–9 cigarettes per day, 24.8% smoke 15–24 cigarettes per day and 3.6%
smoke 25 or more cigarettes per day.
The number of kretek cigarettes smoked is 11.9 per day for men and 7.7 per day for women. The pattern of
distribution of kretek cigarettes smoked per day among men kretek smokers is similar to that in the overall
population. However, among women kretek smokers, 36.5% smoke less than 5 sticks per day, 32.9% smoke 5–9
sticks per day, 18.8% smoke 10–14 sticks per day, 11.8% smoke 15–24 sticks per day and none smoke 25 or more
cigarettes per day.
Overall, those in the age group of 25–44 years smoke the most average number of kretek cigarettes per day (12.1
sticks), followed by the 45–64 years age group (11.8 sticks), 15–24 years age group (10.9 sticks) and the 65+ years
age group (10.4 sticks).
Overall, kretek smokers in rural areas smoke more (12 sticks per day) than those in urban areas (11.5 sticks per day).
The distribution of kretek cigarettes smoked by both urban and rural groups is the maximum in the 10–14 sticks per
day category and the minimum is in the 25 or more sticks per day category.
Based on the educational level, the most kretek cigarettes smoked is by the college or university+ group (12.6 sticks
per day). The second highest is by the high school graduate group (12 sticks per day), followed by primary school
graduates (11.8 sticks per day), secondary school graduates (11.5 sticks per day) and less than primary school

37 Tobacco Use
completed (11.5 sticks per day). While the largest number of kretek cigarettes smoked in the college or university+
group is 15–24 sticks per day (39.2%), that in the all other groups is 10–14 sticks per day. The smallest proportion of
kretek cigarette smokers in all educational groups smoked 25 or more sticks per day.
Based on occupation, the most kretek cigarettes smoked overall is among the self-employed (12.2 sticks) followed by
the employed group (11.7 sticks per day), students (10.6 sticks per day), unemployed (10.3 sticks per day) and home-
makers (7.3 sticks per day). Among all groups, the smallest proportion smoke 25 or more sticks per day. While 4.4%
of self-employed kretek smokers, 3.1% of employed and 2.6% of unemployed smokers smoke 25 or more sticks per
day, there are no students and home-makers in this group.

38 Tobacco Use
To
tal
Ov
era
ll1
2.8
(12
.2,
13
.5)
13
.2(1
0.5
, 1
6.5
)1
9.6
(17
.0,
22
.3)
34
.2(3
0.6
, 3
8.0
)2
6.8
(23
.6,
30
.2)
6.3
(4.9
, 8
.0)
10
0
Ge
nd
er
Ma
le1
3.0
(12
.3,
13
.6)
12
.6(9
.9,
15
.9)
19
.0(1
6.5
, 2
1.8
)3
4.7
(31
.0,
38
.5)
27
.2(2
4.0
, 3
0.8
)6
.5(5
.1,
8.2
)1
00
Fe
ma
le8
.1(6
.5,
9.6
)3
1.1
(20
.7,
43
.7)
36
.6(2
5.5
, 4
9.3
)2
0.0
(11
.3,
32
.9)
12
.3(6
.2,
23
.1)
0.0
1
00
Ag
e (
ye
ars
)
15
-24
12
.0(1
0.3
, 1
3.6
)1
9.6
(14
.2,
26
.5)
24
.9(1
9.0
, 3
1.8
)2
3.3
(17
.6,
30
.0)
26
.8(2
1.3
, 3
3.1
)5
.4(2
.8,
10
.3)
10
0
25
-44
13
.2(1
2.5
, 1
4.0
)1
0.5
(8.0
, 1
3.8
)1
8.0
(14
.9,
21
.5)
36
.3(3
1.5
, 4
1.3
)2
8.8
(24
.9,
33
.2)
6.4
(4.6
, 8
.7)
10
0
45
-64
12
.9(1
1.9
, 1
3.9
)1
3.0
(9.7
, 1
7.4
)1
8.9
(15
.5,
22
.8)
36
.9(3
2.2
, 4
1.8
)2
4.3
(19
.9,
29
.3)
6.9
(4.7
, 1
0.0
)1
00
65
+1
1.4
(10
.0,
12
.8)
18
.4(1
2.4
, 2
6.4
)2
1.4
(15
.8,
28
.3)
34
.5(2
7.7
, 4
2.1
)2
0.9
(14
.3,
29
.6)
4.8
(2.3
, 9
.7)
10
0
Re
sid
en
ce
Urb
an
12
.3(1
1.5
, 1
3.0
)1
4.0
(10
.3,
18
.9)
21
.0(1
7.5
, 2
5.0
)3
4.7
(30
.2,
39
.4)
25
.8(2
2.0
, 3
0.1
)4
.4(3
.0,
6.6
)1
00
Ru
ral
13
.3(1
2.3
, 1
4.3
)1
2.5
(8.9
, 1
7.2
)1
8.3
(14
.9,
22
.4)
33
.9(2
8.5
, 3
9.6
)2
7.5
(22
.8,
32
.8)
7.8
(5.8
, 1
0.4
)1
00
Ed
uca
tio
n L
ev
el
Les
s t
ha
n p
rim
ary
sch
oo
l co
mp
lete
d1
2.9
(11
.9,
13
.9)
14
.8(1
1.3
, 1
9.3
)1
8.3
(14
.9,
22
.3)
33
.2(2
8.7
, 3
7.9
)2
6.8
(22
.0,
32
.2)
6.8
(4.4
, 1
0.4
)1
00
Pri
ma
ry s
cho
ol
com
ple
ted
13
.0(1
1.9
, 1
4.2
)1
3.4
(9.2
, 1
9.1
)1
9.2
(15
.0,
24
.4)
38
.1(3
2.3
, 4
4.3
)2
1.9
(17
.8,
26
.8)
7.3
(5.1
, 1
0.4
)1
00
Se
con
da
ry s
cho
ol
com
ple
ted
12
.2(1
1.2
, 1
3.2
)1
2.9
(8.9
, 1
8.3
)2
3.6
(18
.8,
29
.2)
32
.0(2
6.4
, 3
8.1
)2
5.9
(21
.1,
31
.4)
5.6
(3.5
, 8
.7)
10
0
Hig
h s
cho
ol
com
ple
ted
12
.9(1
2.0
, 1
3.7
)1
3.3
(9.7
, 1
8.0
)1
8.2
(14
.2,
23
.2)
33
.5(2
8.2
, 3
9.2
)2
9.3
(24
.0,
35
.2)
5.7
(3.8
, 8
.5)
10
0
Co
lle
ge
or
Un
ive
rsit
y +
13
.7(1
2.6
, 1
4.7
)4
.7(1
.8,
11
.5)
17
.8(1
1.9
, 2
5.7
)2
8.8
(21
.3,
37
.7)
46
.2(3
6.7
, 5
5.9
)2
.5(0
.6,
9.2
)1
00
Occ
up
ati
on
/Wo
rk s
tatu
s
Em
plo
yed
12
.6(1
1.8
, 1
3.3
)1
1.3
(8.1
, 1
5.4
)2
1.4
(17
.6,
25
.7)
34
.9(3
0.8
, 3
9.3
)2
7.8
(24
.2,
31
.7)
4.6
(3.4
, 6
.4)
10
0
Se
lf-e
mp
loye
d1
3.5
(12
.5,
14
.4)
13
.3(9
.7,
18
.0)
15
.9(1
3.0
, 1
9.2
)3
5.5
(30
.4,
41
.1)
27
.1(2
2.7
, 3
2.1
)8
.2(6
.1,
10
.8)
10
0
Stu
de
nts
11
.3(9
.3,
13
.2)
14
.8(6
.1,
31
.6)
25
.1(1
3.0
, 4
2.9
)2
9.6
(12
.6,
55
.1)
27
.2(1
4.0
, 4
6.2
)3
.4(0
.5,
19
.5)
10
0
Ho
me
ma
ke
rs7
.6(6
.2,
9.0
)1
8.1
(9.3
, 3
2.2
)5
8.7
(42
.5,
73
.2)
17
.7(8
.7,
32
.7)
5.5
(1.4
, 1
9.7
)0
.0
10
0
Un
-em
plo
yed
11
.0(9
.1,
13
.0)
21
.7(1
5.1
, 3
0.1
)2
8.2
(20
.3,
37
.7)
24
.4(1
7.0
, 3
3.8
)2
2.3
(14
.3,
33
.1)
3.4
(1.3
, 8
.8)
10
0
Ta
ble
4.6
: A
vera
ge
nu
mb
er
an
d p
erc
en
tag
e d
istr
ibu
tio
n o
f ci
ga
rett
es
sm
ok
ed
pe
r d
ay
am
on
g d
ail
y ci
ga
rett
e s
mo
ke
rs ≥
15
ye
ars
old
, b
y g
en
de
r a
nd
se
lect
ed
de
mo
gra
ph
ic c
ha
ract
eri
sti
cs –
GA
TS
In
do
ne
sia
, 2
01
1.
Dis
trib
uti
on
of
nu
mb
er
of
cig
are
tte
s sm
ok
ed
on
av
era
ge
pe
r d
ay
1
<5
5-9
10
-14
15
-24
≥2
5
Av
era
ge
nu
mb
er
of
cig
are
tte
s sm
ok
ed
pe
r d
ay
1D
em
og
rap
hic
Ch
ara
cte
rist
ics
Me
an
(9
5%
CI)
Pe
rce
nta
ge
(95
% C
I)
1 A
mo
ng
da
ily
cig
are
tte
sm
ok
ers
. C
iga
rett
es
in
clu
de
wh
ite
cig
are
tte
, h
an
d-r
oll
ed
an
d k
rete
k c
iga
rett
es
.

39 Tobacco Use
To
tal
Ov
era
ll1
4.7
(12
.9,
16
.5)
6.0
(3.1
, 1
1.2
)2
3.7
(16
.1,
33
.4)
15
.1(9
.1,
24
.0)
50
.1(3
9.3
, 6
0.8
)5
.2(2
.0,
12
.7)
10
0
Ge
nd
er
Ma
le1
5.0
(13
.1,
16
.8)
5.1
(2.6
, 9
.9)
22
.4(1
4.8
, 3
2.5
)1
5.5
(9.4
, 2
4.6
)5
1.6
(40
.8,
62
.3)
5.4
(2.1
, 1
3.3
)1
00
Fe
ma
le--
--
--
--
--
--
--
Ag
e (
ye
ars
)
15
-24
--
--
--
--
--
--
--
25
-44
15
.1(1
2.7
, 1
7.5
)7
.1(3
.1,
15
.3)
22
.5(1
4.0
, 3
4.1
)1
2.5
(5.8
, 2
5.1
)5
1.3
(38
.7,
63
.7)
6.6
(2.4
, 1
6.7
)1
00
45
-64
--
--
--
--
--
--
--
65
+--
--
--
--
--
--
--
Re
sid
en
ce
Urb
an
15
.0(1
2.7
, 1
7.3
)6
.0(2
.9,
11
.7)
24
.1(1
6.2
, 3
4.2
)1
8.4
(10
.3,
30
.5)
44
.7(3
4.3
, 5
5.6
)6
.9(2
.5,
17
.5)
10
0
Ru
ral
14
.1(1
1.5
, 1
6.7
)6
.0(1
.5,
20
.9)
22
.9(9
.3,
46
.2)
8.6
(2.8
, 2
3.2
)6
0.7
(37
.4,
79
.9)
1.9
(0.3
, 1
2.8
)1
00
Ed
uca
tio
n L
ev
el
Les
s t
ha
n p
rim
ary
sch
oo
l co
mp
lete
d--
--
--
--
--
----
Pri
ma
ry s
cho
ol
com
ple
ted
--
--
--
--
----
--
Se
con
da
ry s
cho
ol
com
ple
ted
--
--
--
--
--
--
--
Hig
h s
cho
ol
com
ple
ted
16
.4(1
3.0
, 1
9.8
)6
.9(2
.6,
17
.1)
23
.4(1
3.0
, 3
8.4
)6
.7(2
.3,
18
.2)
54
.2(4
0.2
, 6
7.5
)8
.9(2
.8,
24
.8)
10
0
Co
lle
ge
or
Un
ive
rsit
y +
--
--
--
--
--
--
--
Occ
up
ati
on
/Wo
rk s
tatu
s
Em
plo
yed
13
.4(1
1.1
, 1
5.8
)7
.2(2
.5,
19
.2)
26
.5(1
6.1
, 4
0.5
)2
3.9
(13
.2,
39
.3)
36
.0(2
4.2
, 4
9.8
)6
.3(1
.5,
22
.9)
10
0
Se
lf-e
mp
loye
d1
7.1
(14
.2,
20
.0)
5.0
(1.5
, 1
5.8
)1
6.2
(7.7
, 3
0.9
)5
.0(1
.2,
18
.1)
67
.9(5
1.0
, 8
1.1
)6
.0(2
.0,
16
.5)
10
0
Stu
de
nts
----
--
--
--
--
--
Ho
me
ma
ke
rs--
----
----
----
Un
-em
plo
yed
----
----
----
--
Me
an
(9
5%
CI)
Pe
rce
nta
ge
(95
% C
I)
1 A
mo
ng
da
ily
wh
ite
cig
are
tte
sm
ok
ers
.
-- I
nd
ica
tor
es
tim
ate
ba
se
d o
n l
es
s t
ha
n 2
5 u
n-w
eig
hte
d c
as
es
an
d h
as
be
en
su
pp
res
se
d.
Ta
ble
4.6
A:
Ave
rag
e n
um
be
r a
nd
pe
rce
nta
ge
dis
trib
uti
on
of
wh
ite
cig
are
tte
s s
mo
ke
d p
er
da
y a
mo
ng
da
ily
wh
ite
cig
are
tte
sm
ok
ers
≥1
5 y
ea
rs o
ld,
by
ge
nd
er
an
d s
ele
cte
d
de
mo
gra
ph
ic c
ha
ract
eri
sti
cs –
GA
TS
In
do
ne
sia
, 2
01
1.
Av
era
ge
nu
mb
er
of
wh
ite
cig
are
tte
s
smo
ke
d p
er
da
y1
Dis
trib
uti
on
of
nu
mb
er
of
wh
ite
cig
are
tte
s sm
ok
ed
on
av
era
ge
pe
r d
ay
1
<5
5-9
10
-14
15
-24
≥2
5D
em
og
rap
hic
Ch
ara
cte
rist
ics

40 Tobacco Use
To
tal
Ov
era
ll1
1.8
(9.6
, 1
4.0
)1
8.4
(12
.9,
25
.5)
27
.5(2
0.7
, 3
5.6
)2
7.2
(22
.4,
32
.5)
17
.1(1
2.4
, 2
3.1
)9
.8(5
.2,
17
.8)
10
0
Ma
le1
2.1
(9.8
, 1
4.4
)1
6.8
(11
.3,
24
.2)
28
.1(2
0.9
, 3
6.6
)2
7.5
(22
.4,
33
.2)
17
.4(1
2.6
, 2
3.6
)1
0.3
(5.4
, 1
8.7
)1
00
Fe
ma
le--
--
--
--
--
--
--
15
-24
--
--
--
--
--
--
--
25
-44
12
.6(9
.2,
16
.0)
14
.9(8
.0,
25
.9)
31
.7(2
0.0
, 4
6.2
)2
5.8
(18
.2,
35
.4)
15
.9(8
.9,
27
.0)
11
.7(5
.2,
24
.4)
10
0
45
-64
11
.9(9
.5,
14
.2)
19
.6(1
2.4
, 2
9.5
)2
3.5
(15
.3,
34
.4)
27
.9(2
1.6
, 3
5.3
)1
6.8
(11
.4,
24
.2)
12
.2(6
.2,
22
.6)
10
0
65
+1
0.0
(8.0
, 1
2.0
)1
9.1
(10
.6,
31
.8)
25
.7(1
7.5
, 3
6.0
)3
2.9
(24
.0,
43
.2)
20
.7(1
1.9
, 3
3.6
)1
.6(0
.4,
6.1
)1
00
Urb
an
11
.4(7
.5,
15
.3)
16
.6(8
.1,
31
.2)
25
.5(1
3.0
, 4
3.7
)3
2.8
(24
.9,
41
.8)
20
.0(1
3.1
, 2
9.4
)5
.1(0
.7,
28
.3)
10
0
Ru
ral
12
.0(9
.3,
14
.6)
19
.0(1
2.7
, 2
7.4
)2
8.2
(20
.5,
37
.5)
25
.3(1
9.7
, 3
1.8
)1
6.2
(10
.7,
23
.8)
11
.3(5
.7,
21
.2)
10
0
Les
s t
ha
n p
rim
ary
sch
oo
l co
mp
lete
d1
1.4
(9.6
, 1
3.1
)1
7.0
(11
.4,
24
.4)
24
.9(1
7.8
, 3
3.7
)2
9.9
(24
.0,
36
.5)
20
.3(1
4.5
, 2
7.7
)8
.0(3
.2,
18
.6)
10
0
Pri
ma
ry s
cho
ol
com
ple
ted
13
.6(9
.6,
17
.7)
16
.9(1
0.1
, 2
7.1
)2
8.8
(16
.1,
46
.1)
25
.8(1
7.6
, 3
6.1
)1
3.2
(7.6
, 2
2.0
)1
5.3
(7.8
, 2
7.7
)1
00
Se
con
da
ry s
cho
ol
com
ple
ted
--
--
--
--
--
--
--
Hig
h s
cho
ol
com
ple
ted
--
--
--
--
--
--
--
Co
lle
ge
or
Un
ive
rsit
y +
--
--
--
--
--
--
--
Em
plo
yed
10
.5(8
.6,
12
.4)
13
.7(6
.6,
26
.0)
37
.2(2
5.1
, 5
1.0
)3
1.2
(21
.2,
43
.4)
13
.1(7
.8,
21
.4)
4.8
(2.0
, 1
1.0
)1
00
Se
lf-e
mp
loye
d1
3.0
(9.8
, 1
6.2
)2
0.1
(14
.0,
28
.0)
22
.0(1
5.5
, 3
0.3
)2
4.4
(19
.0,
30
.8)
19
.4(1
2.9
, 2
8.0
)1
4.2
(7.2
, 2
5.9
)1
00
Stu
de
nts
--
--
--
--
--
--
--
Ho
me
ma
ke
rs--
--
--
--
--
--
--
Un
-em
plo
yed
--
--
--
--
--
--
--
Pe
rce
nta
ge
(95
% C
I)
1 A
mo
ng
da
ily
ha
nd
-ro
lle
d c
iga
rett
e s
mo
ke
rs.
-- I
nd
ica
tor
es
tim
ate
ba
se
d o
n l
es
s t
ha
n 2
5 u
n-w
eig
hte
d c
as
es
an
d h
as
be
en
su
pp
res
se
d.
Ta
ble
4.6
B:
Ave
rag
e n
um
be
r a
nd
pe
rce
nta
ge
dis
trib
uti
on
of
ha
nd
-ro
lle
d c
iga
rett
es
sm
ok
ed
pe
r d
ay
am
on
g d
ail
y h
an
d-r
oll
ed
cig
are
tte
sm
ok
ers
≥1
5 y
ea
rs o
ld,
by
ge
nd
er
an
d s
ele
cte
d d
em
og
rap
hic
ch
ara
cte
ris
tics
– G
AT
S I
nd
on
es
ia,
20
11
.
Av
era
ge
nu
mb
er
of
ha
nd
-ro
lle
d
Dis
trib
uti
on
of
nu
mb
er
of
ha
nd
-ro
lle
d c
iga
rett
es
smo
ke
d o
n a
ve
rag
e p
er
da
y1
<5
5-9
10
-14
15
-24
≥2
5D
em
og
rap
hic
Ch
ara
cte
rist
ics
Occ
up
ati
on
/Wo
rk s
tatu
s
Ed
uca
tio
n L
ev
el
Re
sid
en
ce
Ag
e (
ye
ars
)
Ge
nd
er
Me
an
(9
5%
CI)

41 Tobacco Use
To
tal
Ov
era
ll1
1.8
(11
.1,
12
.5)
16
.1(1
2.9
, 1
9.8
)1
9.3
(16
.8,
22
.0)
36
.2(3
2.4
, 4
0.3
)2
4.8
(21
.4,
28
.6)
3.6
(2.6
, 5
.0)
10
0
Ma
le1
1.9
(11
.2,
12
.6)
15
.4(1
2.3
, 1
9.2
)1
8.9
(16
.4,
21
.6)
36
.8(3
2.8
, 4
0.9
)2
5.2
(21
.8,
29
.1)
3.7
(2.6
, 5
.1)
10
0
Fe
ma
le7
.7(5
.8,
9.5
)3
6.5
(24
.6,
50
.4)
32
.9(2
2.7
, 4
4.9
)1
8.8
(9.5
, 3
3.7
)1
1.8
(5.4
, 2
4.1
)0
.0
10
0
15
-24
10
.9(9
.6,
12
.3)
21
.2(1
5.3
, 2
8.5
)2
5.3
(19
.3,
32
.4)
24
.7(1
9.1
, 3
1.4
)2
6.0
(20
.0,
33
.2)
2.8
(1.3
, 5
.8)
10
0
25
-44
12
.1(1
1.4
, 1
2.9
)1
3.4
(10
.3,
17
.2)
18
.1(1
5.1
, 2
1.6
)3
8.4
(33
.5,
43
.6)
26
.2(2
2.2
, 3
0.5
)3
.9(2
.5,
6.0
)1
00
45
-64
11
.8(1
0.8
, 1
2.8
)1
6.1
(12
.0,
21
.3)
18
.4(1
4.8
, 2
2.7
)3
9.3
(34
.0,
45
.0)
22
.3(1
7.4
, 2
8.0
)3
.8(2
.3,
6.2
)1
00
65
+1
0.4
(8.9
, 1
2.0
)2
6.4
(17
.9,
37
.2)
14
.0(8
.1,
23
.0)
37
.5(2
8.1
, 4
8.0
)2
0.0
(11
.6,
32
.3)
2.1
(0.5
, 8
.2)
10
0
Urb
an
11
.5(1
0.7
, 1
2.4
)1
5.3
(11
.4,
20
.1)
22
.2(1
8.7
, 2
6.2
)3
6.5
(31
.9,
41
.4)
22
.7(1
8.7
, 2
7.3
)3
.2(2
.0,
5.3
)1
00
Ru
ral
12
.0(1
1.0
, 1
3.0
)1
6.7
(12
.1,
22
.6)
16
.9(1
3.7
, 2
0.6
)3
6.0
(30
.1,
42
.3)
26
.6(2
1.5
, 3
2.4
)3
.9(2
.5,
5.9
)1
00
Les
s t
ha
n p
rim
ary
sch
oo
l co
mp
lete
d1
1.5
(10
.4,
12
.6)
21
.6(1
6.6
, 2
7.7
)1
6.7
(13
.4,
20
.8)
34
.6(2
9.3
, 4
0.2
)2
3.5
(18
.3,
29
.6)
3.6
(2.0
, 6
.1)
10
0
Pri
ma
ry s
cho
ol
com
ple
ted
11
.8(1
0.7
, 1
2.9
)1
6.2
(11
.3,
22
.6)
18
.3(1
4.3
, 2
3.0
)4
0.5
(34
.4,
46
.9)
21
.2(1
6.6
, 2
6.8
)3
.8(2
.3,
6.2
)1
00
Se
con
da
ry s
cho
ol
com
ple
ted
11
.5(1
0.6
, 1
2.5
)1
4.1
(9.8
, 1
9.9
)2
4.0
(19
.1,
29
.7)
33
.4(2
7.6
, 3
9.7
)2
4.6
(19
.7,
30
.3)
3.9
(2.3
, 6
.6)
10
0
Hig
h s
cho
ol
com
ple
ted
12
.0(1
1.2
, 1
2.9
)1
3.9
(10
.2,
18
.6)
18
.8(1
4.7
, 2
3.7
)3
6.5
(30
.9,
42
.5)
27
.7(2
2.2
, 3
3.9
)3
.2(1
.9,
5.4
)1
00
Co
lle
ge
or
Un
ive
rsit
y +
12
.6(1
1.4
, 1
3.9
)8
.9(4
.0,
18
.6)
20
.1(1
3.4
, 2
9.0
)2
9.0
(20
.7,
39
.0)
39
.2(2
9.7
, 4
9.6
)2
.7(0
.7,
9.9
)1
00
Em
plo
yed
11
.7(1
0.8
, 1
2.5
)1
5.6
(11
.8,
20
.4)
20
.4(1
7.1
, 2
4.3
)3
6.4
(31
.9,
41
.2)
24
.5(2
0.7
, 2
8.6
)3
.1(2
.0,
4.7
)1
00
Se
lf-e
mp
loye
d1
2.2
(11
.3,
13
.1)
14
.9(1
0.8
, 2
0.1
)1
6.3
(13
.3,
19
.9)
38
.2(3
2.8
, 4
4.0
)2
6.2
(21
.3,
31
.8)
4.4
(3.0
, 6
.2)
10
0
Stu
de
nts
10
.6(8
.7,
12
.5)
15
.4(6
.2,
33
.1)
25
.3(1
2.7
, 4
4.0
)3
0.6
(12
.3,
57
.9)
28
.8(1
4.6
, 4
8.8
)0
.0
10
0
Ho
me
ma
ke
rs7
.3(5
.6,
8.9
)2
4.2
(11
.3,
44
.5)
54
.2(3
5.5
, 7
1.8
)1
8.2
(8.2
, 3
5.6
)3
.4(0
.5,
21
.7)
0.0
1
00
Un
-em
plo
yed
10
.3(8
.2,
12
.4)
26
.5(1
8.9
, 3
5.8
)2
7.0
(18
.7,
37
.4)
24
.3(1
7.1
, 3
3.4
)1
9.6
(11
.9,
30
.5)
2.6
(0.8
, 8
.2)
10
0
Ta
ble
4.6
C:
Ave
rag
e n
um
be
r a
nd
pe
rce
nta
ge
dis
trib
uti
on
of
kre
tek
cig
are
tte
s s
mo
ke
d p
er
da
y a
mo
ng
da
ily
kre
tek
sm
ok
ers
≥1
5 y
ea
rs o
ld,
by
ge
nd
er
an
d
se
lect
ed
de
mo
gra
ph
ic c
ha
ract
eri
sti
cs –
GA
TS
In
do
ne
sia
, 2
01
1.
Dis
trib
uti
on
of
nu
mb
er
of
kre
tek
cig
are
tte
s sm
ok
ed
on
av
era
ge
pe
r d
ay
1
<5
5-9
10
-14
15
-24
≥2
5
Av
era
ge
nu
mb
er
of
kre
tek
cig
are
tte
s
smo
ke
d p
er
da
y1
De
mo
gra
ph
ic C
ha
ract
eri
stic
s
Me
an
(9
5%
CI)
Pe
rce
nta
ge
(95
% C
I)
1 A
mo
ng
da
ily
kre
tek
cig
are
tte
sm
ok
ers
.
Occ
up
ati
on
/Wo
rk s
tatu
s
Ed
uca
tio
n L
ev
el
Re
sid
en
ce
Ag
e (
ye
ars
)
Ge
nd
er

42 Tobacco Use
4.7. Age at smoking initiation
Table 4.7 shows the distribution of ever daily smokers by the age at initiation of daily smoking among ever daily
smokers in the 20–34 years age group based on gender, place of residence, educational level and occupation status.
Overall, and among men, the average age at daily smoking initiation is 17.6 years. There are 39.9% smokers who
start smoking daily at the age of 17–19 years, 24.6% at the age of 20+ years, 23.0% at the age of 15–16 years and
12.5% among those less than 15 years old. Thus, about 75% smokers start smoking before the age of 20 years.
There is no significant difference in the average age at daily smoking initiation in the urban and rural population (17.7
and 17.5 years, respectively). Average age at daily smoking initiation is higher in people with college and university
education as compared to all other educational categories. The average age at initiation of daily smoking does not
differ significantly among the employed, self-employed and unemployed categories.
There are no significant differences in age at daily smoking initiation by residence or by occupation in any of the age
groups— <15, 15–16, 17–19 and 20+ years. However, in the age groups <15 and 17–19 years, there are significant
differences between the lowest and highest levels of education. In the age groups of 15–16 and 20+ years, no
difference is noted by educational category (Table 4.7).
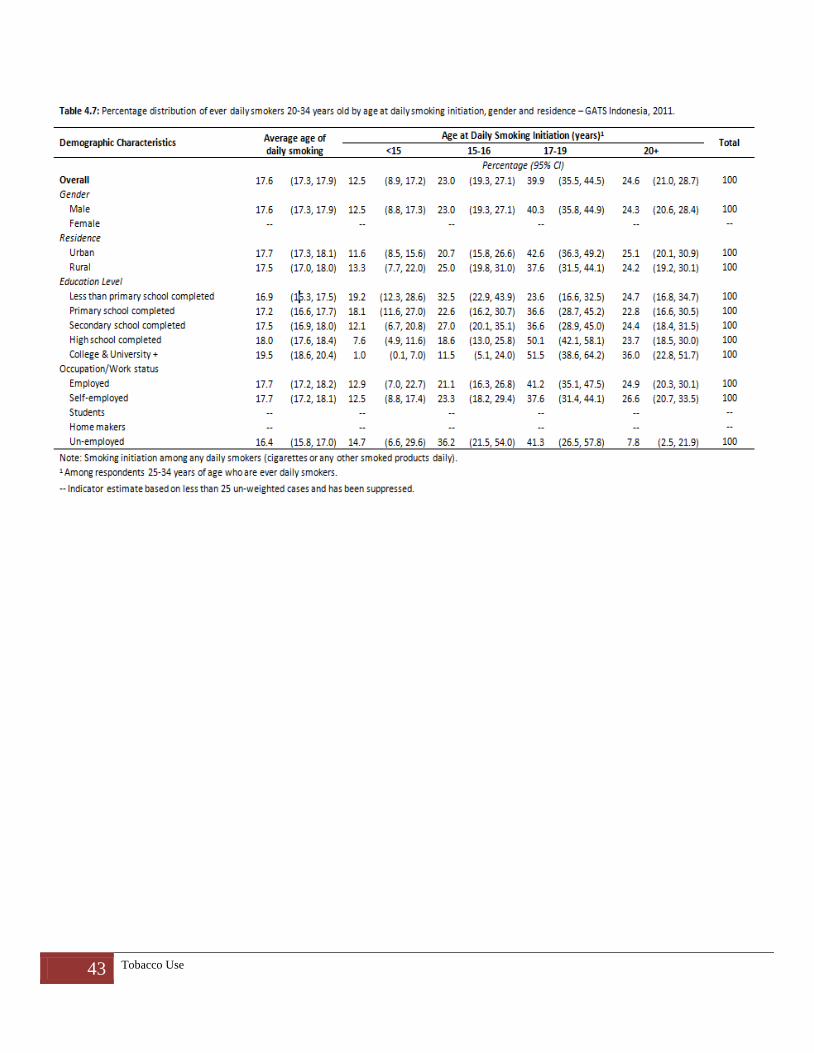
43 Tobacco Use

44 Tobacco Use
4.8. Former daily smoking prevalence and quit ratio
Table 4.8 shows the proportion of former daily smokers among all adults, and former daily smokers among ever daily
smokers (known as the quit ratio) by selected demographic characteristics. There are 3.3% current non-smokers
among all adults and 9.5% smoking quitters among ever daily smokers. There are 6.0% current non-smokers among
men and 0.6% among women. However, the quit ratio in men is 9% while it is 23.2% in women.
The percentage of current non-smokers and the quit ratio rises as the age increases. The percentage of former daily
smokers is 0.4% in the 15–24 years age group, 2.6% in the 25–44 years age group, 5.6% in the 45–64 years age group
and 9.8% in the 65+ years age group. In addition, the quit ratio is 2% in the age group of 15–24 years, 6.9% in those
25–44 years, 13.4% in those 45–64 years, and 25.1% in those 65+ years. There are more current non-smokers in
urban areas than that in rural areas (3.7% and 2.9%, respectively). The quit ratio is also higher in urban areas than
that in rural areas (11.4% and 7.9%, respectively).
The largest proportion of current non-smokers and quit ratio is among those in the college and university groups
(5.3% and 18.2%, respectively). The smallest proportion of current non-smokers and quit ratio is among those in the
secondary school completed group (1.5% and 5%, respectively). The proportion of current non-smokers and quit
ratio tends to decrease as the education level rises to the group of secondary school completed, and then increases
and peaks at the highest education level.
The largest proportion of current non-smokers is in the unemployed group (6.6%), followed by the self-employed
(4.5%), employed (3.8%), home-makers (0.7%) and students groups (0.1%). The quit ratio for daily smoking is 28.5%
among home-makers, 19.2% among the unemployed, 8.9% among the self-employed, 8% among the employed and
only 0.8% among students.

45 Tobacco Use
4.9. Time since quitting smoking
Table 4.9 reports on the time since former daily smokers (current non-smokers) have quit smoking, in four groups
(<1 year, 1–5 years, 5–10 years and 10 years or more). Overall, 46.8% of current non-smokers quit smoking more
than 10 years ago, 17.6% for 5–10 years, 25.5% for 1–5 years and 10% for less than a year. A similar pattern is seen in
men and women current non-smokers; however, only 4.4% of women current non-smokers have quit less than a
year ago as compared to 10.6% of men.
The percentage of current non-smokers who quit more than 10 years ago is 57.5% in the age group of 45–64 years ,
48.5% in the age group of 65+ years and 37.8% in the age group of 25–44 years . By residence, 47.0% quit smoking
for over 10 years in urban areas and 46.6% in rural areas. By educational level, the largest percentage of those who
had quit smoking for more than 10 years ago is at the college and university level (53.5%); the percentage in the high
school completed group is 47.6%, secondary school completed is 46.8%, primary school completed is 47.7% and less
than primary school completed is 42.4%. There are 47.8% current non-smokers who have quit smoking for more than
10 years among the self-employed, 47.2% among the employed and 47.3% among the unemployed groups.
Overall 3.3 (2.8, 3.9) 9.5 (8.0, 11.3)
Male 6.0 (5.0, 7.2) 9.0 (7.5, 10.7)
Female 0.6 (0.4, 1.0) 23.2 (14.6, 34.7)
15-24 0.4 (0.1, 1.3) 2.0 (0.7, 6.0)
25-44 2.6 (2.0, 3.3) 6.9 (5.4, 8.9)
45-64 5.6 (4.4, 7.1) 13.4 (10.5, 17.0)
65+ 9.8 (7.6, 12.6) 25.1 (20.1, 30.8)
Urban 3.7 (2.9, 4.6) 11.4 (8.9, 14.3)
Rura l 2.9 (2.3, 3.7) 7.9 (6.1, 10.2)
Less than primary school completed 4.1 (3.1, 5.4) 10.6 (8.0, 13.9)
Primary school completed 3.2 (2.3, 4.3) 8.8 (6.5, 11.8)
Secondary school completed 1.5 (0.9, 2.3) 5.0 (3.2, 7.6)
High school completed 3.7 (2.9, 4.8) 10.7 (8.2, 13.7)
Col lege or Univers i ty + 5.3 (3.6, 7.8) 18.2 (12.6, 25.6)
Employed 3.8 (2.8, 5.0) 8.0 (6.0, 10.7)
Sel f-employed 4.5 (3.6, 5.6) 8.9 (7.1, 11.1)
Students 0.1 (0.0, 0.5) 0.8 (0.1, 5.6)
Home makers 0.7 (0.3, 1.5) 28.5 (14.2, 49.1)
Un-employed 6.6 (4.7, 9.3) 19.2 (13.8, 26.1)
Table 4.8: Percentage of a l l adults and ever dai ly smokers ≥15 years old who are former dai ly
smokers , by selected demographic characteris tics – GATS Indones ia , 2011.
Note: Smoking ini tiation among any dai ly smokers (cigarettes , kreteks or any other smoked
products da i ly).
Former Daily Smokers1
(Among All Adults)
Percentage (95% CI )
1 Current non-smokers .
2 Also known as the quit ratio for da i ly smoking.
Demographic Characteristics
Former Daily Smokers1
(Among Ever Daily Smokers)2
Occupation/Work status
Education Level
Residence
Age (years)
Gender

46 Tobacco Use
4.10. Type of current tobacco use
Table 4.10 gives the type of tobacco used by current tobacco users (which includes both daily and occasional tobacco
users), by selected demographic characteristics. Overall, the percentage of current tobacco users is 36.1%. Among
these, 95.1% use smoked tobacco only, 2.6% use smokeless tobacco only and 2.3% use both smoked and smokeless
tobacco. While there are 67.4% tobacco users among men, there are only 4.5% tobacco users among women. The
majority of men tobacco users use smoked tobacco only (97.7%), the percentage among women is 56.1%. Among
men tobacco users, the proportion of smokeless tobacco users is only 0.1% while that among women tobacco users
is 40.2%. The proportion of those who used both smoked and smokeless tobacco among men tobacco users is 2.2%
and among women tobacco users it is 3.7% (Figure 4.3).
The proportion of current tobacco users in the 15–24 years age group is 26.6%. This increases to 38.3% in the 25–44
years age group and to 40.7% in the 45–64 years age group. It reduces slightly to 38.2% in the 65+ years age group.
The proportion of smoked-only tobacco users tends to decline as the age increases (97.1% in the 15–24 years age
group, 96.6% in the 25–44 years age group, 95.4% in the 45–64 years age group and 79.5% in the 65+ years age
group). In contrast, there is an increasing trend as the age increases in smokeless-only tobacco use (0.7% in the 15–
24 years age group, 0.9% in the 25–44 years age group, 2.7% in the 45-64 years age group and 17.4% in the 65+ years
age group).
There are more current tobacco users in rural areas (39.1%) than in urban areas (33%). There are 96.2% smoked-only
tobacco users in urban areas and 94.3% in rural areas. The percentage of smokeless-only tobacco users in rural areas
is 3.1% while in urban areas it is 2%.
Overall 10.0 (6.6, 14.9) 25.5 (20.4, 31.4) 17.6 (12.9, 23.7) 46.8 (40.1, 53.6) 100
Male 10.6 (6.9, 16.0) 24.5 (19.2, 30.6) 17.6 (12.5, 24.2) 47.3 (40.6, 54.1) 100
Female 4.4 (0.6, 25.4) 35.9 (17.1, 60.3) 17.7 (8.1, 34.2) 42.0 (22.9, 63.8) 100
15-24 -- -- -- -- --
25-44 6.0 (2.7, 12.9) 35.0 (25.1, 46.4) 21.2 (14.1, 30.5) 37.8 (28.2, 48.4) 100
45-64 11.2 (6.1, 19.7) 17.3 (11.2, 25.8) 14.0 (8.4, 22.2) 57.5 (48.3, 66.3) 100
65+ 11.2 (4.6, 24.9) 18.6 (10.7, 30.4) 21.7 (12.1, 35.8) 48.5 (34.6, 62.6) 100
Urban 13.3 (8.1, 20.9) 20.8 (15.3, 27.7) 18.9 (13.0, 26.6) 47.0 (38.4, 55.9) 100
Rural 6.1 (3.1, 11.7) 31.3 (22.6, 41.5) 16.1 (9.1, 26.8) 46.6 (36.3, 57.1) 100
Less than primary school completed 9.4 (4.6, 18.5) 30.1 (18.1, 45.6) 18.1 (11.6, 27.1) 42.4 (30.3, 55.4) 100
Primary school completed 12.1 (5.2, 25.5) 24.5 (15.3, 36.8) 15.8 (7.9, 29.2) 47.7 (34.1, 61.6) 100
Secondary school completed 2.8 (0.4, 18.5) 37.3 (20.9, 57.2) 13.1 (5.3, 29.1) 46.8 (29.8, 64.5) 100
High school completed 9.5 (3.5, 23.0) 22.2 (13.4, 34.5) 20.8 (11.9, 33.7) 47.6 (34.7, 60.8) 100
Col lege or Univers i ty + 14.1 (5.4, 32.3) 15.1 (6.8, 30.3) 17.2 (6.9, 37.0) 53.5 (31.8, 74.0) 100
Employed 10.5 (5.5, 19.1) 21.5 (13.2, 33.0) 20.7 (12.2, 33.0) 47.2 (34.2, 60.6) 100
Sel f-employed 10.7 (5.3, 20.4) 25.5 (17.2, 36.1) 15.9 (10.7, 23.1) 47.8 (38.2, 57.7) 100
Students -- -- -- -- --
Home makers -- -- -- -- --
Un-employed 10.2 (3.7, 25.3) 22.7 (11.9, 39.0) 19.8 (9.5, 36.8) 47.3 (32.5, 62.5) 100
Percentage (95% CI )
Demographic Characteristics
Time since quitting smoking (years)1
Total<1 1 to <5 5 to <10 ≥10
Occupation/Work status
Education Level
Residence
Age (years)
Gender
Table 4.9: Percentage dis tribution of former dai ly smokers ≥15 years old, by time s ince quitting smoking and selected
demographic characteris tics – GATS Indones ia , 2011.
1 Among former dai ly smokers (current non-smokers ).
-- Indicator estimate based on less than 25 un-weighted cases and has been suppressed.

47 Tobacco Use
The proportion of current tobacco users decreases with higher educational levels. It is 41.2% among less than
primary school completed, 37.8% among primary school graduates, 33% among secondary school graduates, 34.3%
among high school completed and reaches the lowest proportion of 28.0% among college and university graduates.
By occupation, the largest proportion of current tobacco users is among the self-employed group (51.4%), followed
by the employed group (47.6%), unemployed group (34.5%), students (14.6%) and home-makers (4.3%). Even
though the home-makers group had the smallest percentage of smoked-only tobacco users (62.4%), it has the largest
percentage of smokeless-only tobacco users (36.9%).
Total
Overall 36.1 (34.4, 37.8) 95.1 (93.9, 96.1) 2.6 (1.9, 3.5) 2.3 (1.6, 3.2) 100
Male 67.4 (64.8, 69.9) 97.7 (96.7, 98.4) 0.1 (0.0, 0.3) 2.2 (1.5, 3.2) 100
Female 4.5 (3.6, 5.6) 56.1 (45.3, 66.3) 40.2 (30.7, 50.5) 3.7 (1.7, 7.6) 100
15-24 26.6 (23.9, 29.6) 97.1 (94.6, 98.5) 0.7 (0.2, 2.5) 2.1 (0.9, 4.8) 100
25-44 38.3 (36.2, 40.4) 96.6 (95.0, 97.8) 0.9 (0.4, 1.9) 2.5 (1.6, 3.7) 100
45-64 40.7 (37.5, 44.0) 95.4 (93.4, 96.9) 2.7 (1.7, 4.3) 1.8 (1.0, 3.2) 100
65+ 38.2 (34.1, 42.4) 79.5 (74.0, 84.1) 17.4 (13.1, 22.8) 3.1 (1.5, 6.0) 100
Urban 33.0 (30.9, 35.3) 96.2 (94.5, 97.3) 2.0 (1.3, 3.1) 1.9 (1.1, 3.1) 100
Rural 39.1 (36.5, 41.7) 94.3 (92.5, 95.7) 3.1 (2.1, 4.7) 2.6 (1.7, 4.1) 100
Less than primary school completed 41.2 (38.1, 44.3) 90.0 (87.1, 92.4) 7.2 (5.2, 9.8) 2.8 (1.8, 4.5) 100
Primary school completed 37.8 (35.5, 40.2) 97.5 (96.1, 98.4) 0.7 (0.3, 1.6) 1.7 (0.9, 3.2) 100
Secondary school completed 33.0 (30.1, 36.0) 95.4 (92.7, 97.1) 2.0 (0.9, 4.1) 2.7 (1.4, 5.0) 100
High school completed 34.3 (31.9, 36.8) 97.1 (94.6, 98.5) 0.6 (0.1, 2.2) 2.3 (1.3, 4.3) 100
Col lege or Univers i ty + 28.0 (24.0, 32.3) 98.0 (93.8, 99.4) 0.7 (0.1, 4.9) 1.3 (0.3, 5.3) 100
Employed 47.6 (44.8, 50.5) 96.9 (95.5, 97.9) 0.7 (0.4, 1.3) 2.4 (1.5, 3.9) 100
Sel f-employed 51.4 (47.8, 54.9) 96.0 (94.4, 97.1) 1.6 (0.9, 2.8) 2.4 (1.6, 3.6) 100
Students 14.6 (11.2, 19.0) 97.4 (88.2, 99.5) 0.6 (0.1, 4.6) 1.9 (0.3, 13.1) 100
Home makers 4.3 (3.1, 5.9) 62.4 (47.2, 75.5) 36.9 (23.9, 52.1) 0.7 (0.1, 5.2) 100
Un-employed 34.5 (30.0, 39.2) 90.7 (85.4, 94.2) 7.9 (4.7, 13.0) 1.4 (0.4, 4.9) 100
Percentage (95% CI )
1 Includes dai ly and occas ional (less than dai ly) smokers or smokeless users .
Table 4.10: Percentage dis tribution of current tobacco users ≥15 years old, by tobacco use pattern and selected
demographic characteris tics – GATS Indones ia , 2011.
Type of Current Tobacco Use
Smoked only Smokeless onlyBoth smoked and
smokelessDemographic Characteristics
Current Tobacco
Users1
Occupation/Work status
Education Level
Residence
Age (years)
Gender
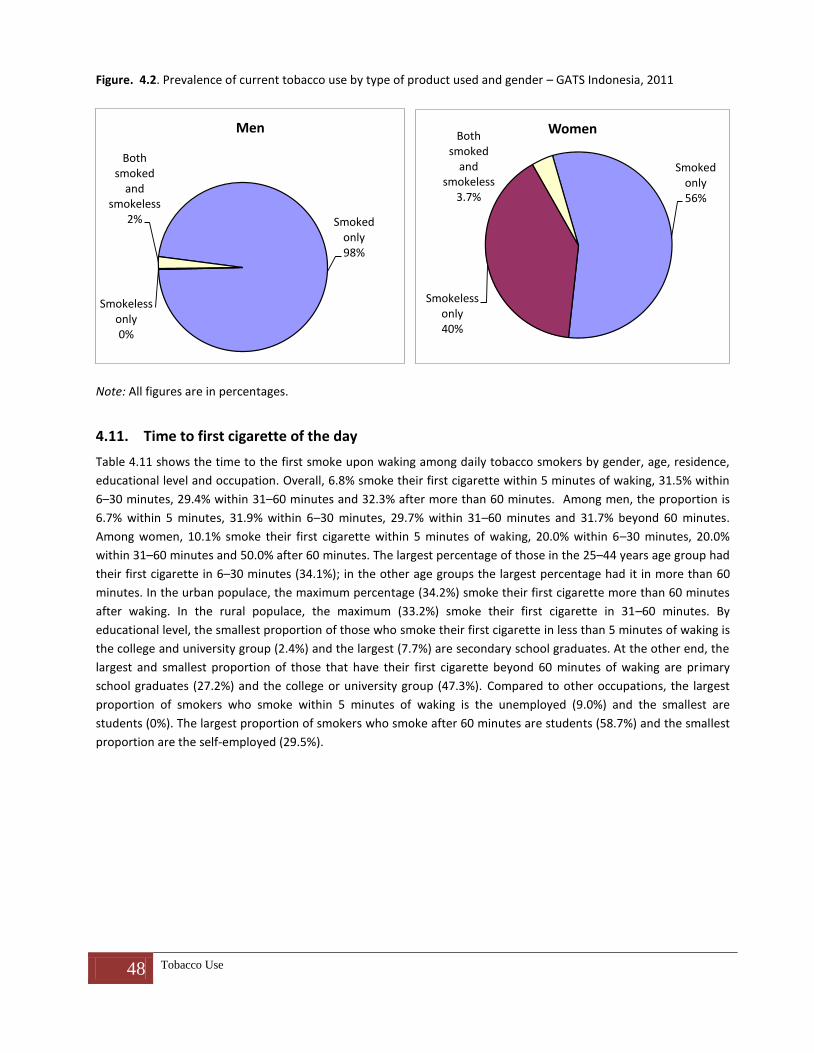
48 Tobacco Use
Figure. 4.2. Prevalence of current tobacco use by type of product used and gender – GATS Indonesia, 2011
Note: All figures are in percentages.
4.11. Time to first cigarette of the day
Table 4.11 shows the time to the first smoke upon waking among daily tobacco smokers by gender, age, residence,
educational level and occupation. Overall, 6.8% smoke their first cigarette within 5 minutes of waking, 31.5% within
6–30 minutes, 29.4% within 31–60 minutes and 32.3% after more than 60 minutes. Among men, the proportion is
6.7% within 5 minutes, 31.9% within 6–30 minutes, 29.7% within 31–60 minutes and 31.7% beyond 60 minutes.
Among women, 10.1% smoke their first cigarette within 5 minutes of waking, 20.0% within 6–30 minutes, 20.0%
within 31–60 minutes and 50.0% after 60 minutes. The largest percentage of those in the 25–44 years age group had
their first cigarette in 6–30 minutes (34.1%); in the other age groups the largest percentage had it in more than 60
minutes. In the urban populace, the maximum percentage (34.2%) smoke their first cigarette more than 60 minutes
after waking. In the rural populace, the maximum (33.2%) smoke their first cigarette in 31–60 minutes. By
educational level, the smallest proportion of those who smoke their first cigarette in less than 5 minutes of waking is
the college and university group (2.4%) and the largest (7.7%) are secondary school graduates. At the other end, the
largest and smallest proportion of those that have their first cigarette beyond 60 minutes of waking are primary
school graduates (27.2%) and the college or university group (47.3%). Compared to other occupations, the largest
proportion of smokers who smoke within 5 minutes of waking is the unemployed (9.0%) and the smallest are
students (0%). The largest proportion of smokers who smoke after 60 minutes are students (58.7%) and the smallest
proportion are the self-employed (29.5%).
Smoked only98%
Smokeless only0%
Both smoked
and smokeless
2%
Men
Smoked only56%
Smokeless only40%
Both smoked
and smokeless
3.7%
Women

49 Tobacco Use
4.12. Use of electronic cigarettes
Table 4.12 shows proportion of adults who have heard of, and use, electronic cigarettes. Overall, 10.9% adults have
heard about electronic cigarettes, but only 0.3% use it.
More men than women had heard about electronic cigarettes (16.8% and 5.1%, respectively), as well as those in the
15–24 and 25–44 years age group (14.4% and 12.4%, respectively), those living in urban areas (15.3%), people with
higher levels of education (secondary, high school, and college and university), those who are employed and
students.
Use of electronic cigarettes is limited to men only (0.5%). It does not differ substantially by age, residence,
educational level or occupation. In all cases, the use is very limited (0.5% or less).
Overall 6.8 (5.0, 9.1) 31.5 (27.1, 36.3) 29.4 (25.1, 34.1) 32.3 (27.9, 37.0) 100
Male 6.7 (4.9, 9.0) 31.9 (27.5, 36.7) 29.7 (25.4, 34.4) 31.7 (27.3, 36.5) 100
Female 10.1 (4.7, 20.3) 20.0 (11.4, 32.6) 20.0 (12.7, 30.0) 50.0 (38.2, 61.8) 100
15-24 6.8 (2.9, 15.5) 28.8 (22.3, 36.4) 25.7 (19.0, 33.6) 38.7 (31.0, 47.0) 100
25-44 6.6 (4.7, 9.2) 31.1 (26.5, 36.2) 30.3 (25.5, 35.7) 32.0 (27.3, 37.1) 100
45-64 7.0 (4.7, 10.3) 34.1 (28.2, 40.5) 30.3 (25.6, 35.5) 28.6 (23.5, 34.3) 100
65+ 7.0 (3.5, 13.7) 31.0 (22.5, 41.0) 27.7 (20.3, 36.5) 34.3 (25.1, 44.8) 100
Urban 7.0 (4.6, 10.5) 34.0 (27.2, 41.5) 24.8 (19.7, 30.7) 34.2 (27.7, 41.4) 100
Rural 6.6 (4.2, 10.1) 29.5 (24.1, 35.7) 33.2 (26.8, 40.2) 30.7 (24.9, 37.2) 100
Less than primary school completed 7.4 (4.9, 11.1) 30.9 (24.3, 38.4) 31.3 (26.0, 37.2) 30.3 (24.3, 37.1) 100
Primary school completed 7.6 (5.0, 11.4) 36.7 (30.3, 43.6) 28.5 (21.9, 36.2) 27.2 (21.5, 33.9) 100
Secondary school completed 7.7 (5.0, 11.6) 28.8 (22.7, 35.7) 27.9 (21.7, 35.2) 35.6 (28.3, 43.7) 100
High school completed 5.1 (2.7, 9.5) 29.1 (23.2, 35.9) 30.9 (25.5, 36.9) 34.8 (29.1, 40.9) 100
Col lege or Univers i ty + 2.4 (0.8, 7.1) 25.9 (15.8, 39.5) 24.3 (16.0, 35.1) 47.3 (36.8, 58.1) 100
Employed 5.7 (3.9, 8.2) 32.0 (26.3, 38.3) 29.1 (22.9, 36.2) 33.2 (27.4, 39.5) 100
Sel f-employed 7.5 (5.1, 11.0) 32.2 (26.6, 38.3) 30.8 (25.3, 36.8) 29.5 (24.2, 35.5) 100
Students 0.0 15.0 (6.6, 30.4) 26.3 (12.1, 48.0) 58.7 (39.9, 75.3) 100
Home makers 8.6 (2.0, 30.6) 21.6 (9.5, 42.0) 17.4 (7.9, 34.0) 52.3 (34.3, 69.8) 100
Un-employed 9.0 (4.6, 16.8) 31.0 (22.4, 41.1) 24.2 (17.3, 32.7) 35.9 (27.3, 45.6) 100
Percentage (95% CI)
Table 4.11: Percentage dis tribution of da i ly tobacco smokers ≥15 years old, by time to fi rs t smoke upon waking and
selected demographic characteris tics – GATS Indones ia , 2011.
Demographic Characteristics
Time to first smoke
Total≤5 minutes 6-30 minutes 31-60 minutes >60 minutes
Occupation/Work status
Education Level
Residence
Age (years)
Gender

50 Tobacco Use
Overall 10.9 (9.3, 12.9) 0.3 (0.2, 0.5)
Male 16.8 (14.2, 19.8) 0.5 (0.3, 1.0)
Female 5.1 (4.0, 6.5) 0.0
15-24 14.4 (11.7, 17.5) 0.2 (0.1, 0.5)
25-44 12.4 (10.3, 14.9) 0.3 (0.2, 0.7)
45-64 7.4 (5.7, 9.6) 0.3 (0.1, 1.2)
65+ 1.6 (0.6, 4.1) 0.0
Urban 15.3 (12.5, 18.7) 0.4 (0.2, 0.8)
Rura l 6.5 (4.9, 8.7) 0.1 (0.1, 0.3)
Less than primary school completed 1.4 (0.9, 2.1) 0.0
Primary school completed 5.7 (4.0, 8.2) 0.2 (0.1, 0.7)
Secondary school completed 11.5 (9.2, 14.3) 0.3 (0.1, 0.9)
High school completed 20.3 (17.0, 24.0) 0.4 (0.2, 0.8)
Col lege or Univers i ty + 29.4 (24.0, 35.5) 0.8 (0.4, 1.9)
Employed 16.3 (13.4, 19.6) 0.3 (0.2, 0.7)
Sel f-employed 8.8 (7.1, 10.8) 0.4 (0.2, 0.8)
Students 19.1 (14.3, 25.0) 0.3 (0.1, 1.4)
Home makers 4.8 (3.5, 6.6) 0.0
Un-employed 9.5 (6.9, 12.9) 0.3 (0.1, 1.3)
Percentage (95% CI)
Heard of electronic
cigarettes
Current use of electronic
cigarettes
Table 4.12: Percentage of adults > 15 years old, who have heard of and currently use
electronic cigarettes , GATS Indones ia , 2011.
Demographic Characteristics
Occupation/Work status
Education Level
Residence
Age (years)
Gender

51 Cessation
5. Cessation
Indonesia has a tobacco control policy in place to set up and support smoking cessation clinics in various health
service settings and to provide counselling through national quit-lines all over the country. The Global Health
Professions Students Survey (GHPSS) conducted among third-year medical and dental students in Indonesia shows
that most tobacco users want to quit their tobacco habit. Most of the students wanted formal cessation training but
less than one sixth of students got it. However, there are no data on cessation attitudes and cessation practices
among any subnational or national sample in Indonesia.
The tobacco cessation questionnaire in the GATS conducted in Indonesia included different approaches such as
counselling by any health-care provider (HCP), prescription medication, quitting without assistance and others (such
as traditional medicines, switching to smokeless tobacco or any other method). Pharmacotherapeutic agents used
for tobacco cessation are not available in Indonesia, hence it was not included. This chapter presents the findings on
tobacco cessation practices and health-care seeking behaviour, cessation methods and the degree of interest in
quitting.
Key findings
o Roughly three in ten current smokers have made quit attempts.
o Roughly 4 in 10 current smokers were asked if they smoked tobacco by a doctor or a health-care
provider in the past 12 months.
o Nearly one third of current smokers received advice to quit smoking by a doctor or a health-care
provider in the past 12 months.
o Quitting without assistance was the most common cessation method reported by current smokers who
have made an attempt to quit in the past 12 months.
5.1. Smoking cessation and health-care seeking behaviours
A “quit attempt” is defined as being abstinent for less than 12 months by current and former tobacco smokers. Table
5.1 gives the proportion of adult smokers and former smokers who made a quit attempt, visited an HCP, were asked
about smoking and received advice from an HCP on quitting smoking.
5.1.1. Made quit attempt
Among current and former tobacco smokers, approximately one third (30.4%) made an attempt to quit in the past 12
months. More women made quit attempts than men (44.6% and 29.8%, respectively) (Figure 5.1). Smokers who live
in urban areas have a higher rate of quit attempts than those in rural areas (35.9% and 25.6%, respectively). By age
group, quit attempt rates range from 25.7% (65+ years) to 36.5% (15–24 years). By educational level, smokers with
college and university education have the highest percentage of quit attempts (39.4%). The rate is lowest among
smokers with less than primary school education (23.7%).
5.1.2. Visited health-care providers

52 Cessation
The percentage of smokers (including current and former tobacco smokers) who visited an HCP during the past 12
months is 30.2%. Smokers aged 65 years and above have the highest rate of HCP visits (43.9%). Smokers who live in
rural areas have a slightly higher rate of HCP visits than those in urban areas (31.6% and 28.7%, respectively). By
educational level, smokers with college and university education have the highest rate of HCP visits (38.6%), followed
by smokers with less than primary education (37.7%). Secondary school graduates have the lowest rate of HCP visits
(24.6%). By occupation, home-makers and students have the highest and lowest rates of visits to HCPs (34.2% and
19.8%, respectively) (Table 5.1).
5.1.3. Asked about smoking tobacco by an HCP
Among smokers who have visited an HCP during the previous 12 months, 40.5% were asked about their history of
tobacco smoking. The proportion asked about tobacco smoking by the HCP among men smokers (41.6%) is higher
than that among women smokers (17.9%). By age group, the 65+ years group has the highest proportion of those
who were asked by an HCP about smoking (49.1%). There is no substantial difference in this regard between the
urban and rural populace (Table 5.1).
5.1.4. Advised to quit by an HCP
Approximately one third of all smokers (34.6%) ever received advice to quit smoking by an HCP. The rate of getting
advice from an HCP is higher among men smokers (35.7%) than among women smokers (13.0%) (Table 5.1 and
Figure 5.1).

53 Cessation
Overall 30.4 (26.8, 34.2) 30.2 (26.5, 34.2) 40.5 (34.6, 46.6) 34.6 (29.2, 40.5)
Male 29.8 (26.2, 33.7) 30.0 (26.2, 34.0) 41.6 (35.7, 47.8) 35.7 (30.3, 41.6)
Female 44.6 (35.9, 53.7) 36.6 (27.9, 46.2) 17.9 (9.0, 32.4) 13.0 (5.6, 27.2)
15-24 36.5 (30.3, 43.3) 21.4 (16.3, 27.7) 31.6 (21.6, 43.5) 27.2 (17.3, 39.8)
25-44 28.8 (25.0, 33.0) 29.2 (25.0, 33.7) 38.8 (30.9, 47.4) 32.3 (25.6, 39.7)
45-64 30.1 (25.3, 35.3) 34.9 (29.9, 40.3) 44.2 (37.1, 51.4) 38.5 (31.5, 46.1)
65+ 25.7 (18.9, 34.0) 43.9 (35.4, 52.9) 49.1 (38.3, 59.9) 43.8 (32.4, 55.9)
Urban 35.9 (30.0, 42.2) 28.7 (23.9, 34.0) 42.1 (34.4, 50.2) 35.6 (29.2, 42.6)
Rura l 25.6 (21.3, 30.4) 31.6 (26.2, 37.6) 39.2 (30.9, 48.1) 33.9 (25.9, 42.9)
Less than primary school completed 23.7 (19.8, 28.1) 37.7 (32.7, 43.0) 42.3 (34.2, 51.0) 34.7 (27.3, 42.9)
Primary school completed 27.8 (23.2, 33.0) 28.2 (23.0, 34.1) 35.4 (25.0, 47.3) 29.8 (20.5, 41.2)
Secondary school completed 32.7 (27.2, 38.7) 24.6 (19.3, 30.7) 32.8 (22.7, 44.9) 30.1 (20.3, 42.2)
High school completed 36.7 (31.2, 42.5) 27.7 (22.4, 33.7) 47.7 (39.8, 55.6) 43.0 (35.2, 51.2)
Col lege or Univers i ty + 39.4 (29.8, 50.0) 38.6 (28.9, 49.3) 48.6 (36.2, 61.2) 38.3 (26.0, 52.4)
Employed 34.4 (29.4, 39.8) 28.8 (23.9, 34.2) 37.2 (31.0, 43.9) 32.6 (26.6, 39.4)
Sel f-employed 26.4 (22.6, 30.6) 31.7 (27.1, 36.7) 43.5 (35.0, 52.5) 36.1 (28.2, 44.9)
Students 39.7 (28.3, 52.2) 19.8 (10.8, 33.5) -- --
Home makers 46.8 (32.7, 61.4) 34.2 (22.3, 48.5) -- --
Un-employed 27.2 (19.7, 36.2) 31.6 (24.6, 39.5) 48.6 (33.1, 64.4) 45.0 (29.6, 61.4)
Occupation/Work status
Gender
Age (years)
Residence
Education Level
Percentage(95% CI)
Table 5.1: Percentage of current smokers ≥15 years old who made a quit attempt and received health care provider
advice in the past 12 months , by selected demographic characteris tics – GATS Indones ia , 2011.
Smoking cessation and health care seeking behavior
Made quit
attempt1
Visited a HCP1,2
Asked by HCP if a
smoker2,3
Advised to quit by
HCP2,3
Demographic Characteristics
1 Among current smokers and former smokers who have been abstinent for less than 12 months .
2 HCP = Health Care Provider.
3 Among current smokers and former smokers who have been abstinent for less than 12 months , and who vis i ted
a HCP during the past 12 months .
-- Indicator estimate based on less than 25 un-weighted cases and has been suppressed.

54 Cessation
5.2. Cessation methods
The cessation methods used by smokers (current tobacco smokers and recent quitters for <12 months) covered in
the GATS Indonesia are – counselling/advice, other prescription medications, quitting without assistance and other
methods including traditional methods (herbal/medicinal plants), switching to smokeless tobacco, etc.
Table 5.2 shows that a higher proportion of smokers reported quitting on their own/quitting without assistance
(70.7%); most of them had used some methods to quit smoking on their own in the past 12 months. This is followed
by other methods (13.6%) and counselling (7.0%). The cessation method that was least used was prescription
medication (0.4%). More urban than rural residents tried other quit methods (16.9% and 9.7%, respectively). No
significant difference was noticed in the proportion of any of the cessation methods used by any other demographic
characteristic, except among the college or university group, who made the maximum use of counselling/advice
(17.9% as against the next highest proportion of 8.4% among high school graduates).
Overall 7.0 (4.1, 11.6) 0.4 (0.1, 2.2) 70.7 (63.9, 76.7) 13.6 (9.4, 19.3)
Male 6.6 (4.0, 10.8) 0.4 (0.1, 2.4) 70.7 (63.9, 76.8) 14.1 (9.7, 20.1)
Female 13.1 (4.9, 30.6) 0.0 71.1 (54.0, 83.8) 6.6 (2.6, 15.8)
15-24 6.4 (2.8, 14.0) 0.0 74.7 (65.0, 82.4) 11.9 (6.1, 21.7)
25-44 6.6 (3.6, 11.8) 0.6 (0.1, 4.1) 70.8 (63.2, 77.4) 15.4 (10.5, 22.0)
45-64 7.8 (4.2, 14.1) 0.6 (0.1, 2.3) 65.9 (56.6, 74.2) 9.8 (5.6, 16.8)
65+ 9.1 (3.5, 21.5) 0.0 78.2 (65.1, 87.3) 24.6 (13.2, 41.2)
Urban 8.5 (4.4, 15.9) 0.8 (0.1, 4.0) 65.6 (55.7, 74.3) 16.9 (10.5, 25.9)
Rura l 5.2 (2.2, 11.7) 0.0 77.0 (67.8, 84.1) 9.7 (5.6, 16.5)
Less than primary school completed 6.9 (3.5, 13.3) 0.0 70.3 (61.1, 78.1) 10.5 (5.5, 19.3)
Primary school completed 3.8 (1.5, 9.4) 0.3 (0.0, 1.9) 70.7 (61.1, 78.8) 11.5 (6.9, 18.5)
Secondary school completed 5.9 (2.5, 13.1) 0.4 (0.1, 2.9) 67.8 (56.6, 77.3) 16.3 (9.8, 26.0)
High school completed 8.4 (4.3, 15.6) 1.0 (0.1, 6.9) 73.4 (64.8, 80.6) 15.0 (8.9, 24.1)
Col lege or Univers i ty + 17.0 (8.0, 32.8) 0.0 70.4 (56.5, 81.4) 17.2 (7.9, 33.5)
Employed 6.9 (3.5, 13.1) 0.4 (0.1, 3.0) 70.8 (62.0, 78.3) 12.3 (7.7, 19.3)
Sel f-employed 7.8 (4.6, 12.9) 0.6 (0.1, 2.4) 67.4 (58.9, 74.9) 13.9 (8.9, 21.1)
Students 3.2 (0.4, 20.6) 0.0 75.2 (50.9, 89.9) 14.4 (5.5, 32.5)
Home makers -- -- -- --
Un-employed 6.4 (2.3, 16.5) 0.0 85.1 (72.9, 92.4) 22.7 (10.6, 42.1)
Table 5.2: Percentage of current smokers ≥15 years old who attempted to quit smoking in the past 12 months , by cessation
methods used and selected demographic characteris tics – GATS Indones ia , 2011.
Smoking cessation and health care seeking behavior1
3 Among current smokers and former smokers who have been abstinent for less than 12 months , and who vis i ted a HCP during the
past 12 months .
2 HCP = health care provider.
1 Among current smokers and former smokers who have been abstinent for less than 12 months .
Counseling / Advice
Other Prescription
Medication
Quit without
assistance
-- Indicator estimate based on less than 25 un-weighted cases and has been suppressed.
Other†Demographic Characteristics
Note: Nicotine Replacement Therapy, such as patch or gum is not included due to trans lation issues of the question on NRT.
Occupation/Work status
Education Level
Residence
Age (years)
Gender
† Others include: Traditional medicines (example herbal/medicina l plants), switching to smokeless tobacco or anything else.

55 Cessation
5.3. Interest in quitting smoking and smokeless tobacco
“Interest in quitting smoking” in GATS is defined as current tobacco smokers who are planning to quit or thinking
about quitting smoking. In GATS Indonesia, the information was collected under five major categories of interest in
quitting smoking – planning to quit within the next month, thinking about quitting within the next 12 months, will
quit some day but not in the next 12 months, not interested in quitting, and do not know. Table 5.3 presents data on
these five categories of interest in quitting smoking by various demographic characteristics.
Among all smokers, only 5.1% of current smokers reported planning to quit within the next month, and 5.4%
reported planning to quit within the next 12 months. Nearly one third of smokers reported that they planned to
quit, but not within the next 12 months (38.3%) or were not interested in quitting (31.3%). Nearly one fifth (19.9%)
of smokers were in the “do not know” category. Within the category of planning to quit in the next month and
planning to quit within the next 12 months, there is not much difference among different sociodemographic
characteristics (Table 5.3). The proportion of smokers who want to quit (either quit within within the next month, or
within the next year, or quit some day but not within the next one year) is almost similar for both men and women
(Table 5.3 and Figure 5.1).
Among current smokers who are planning to quit within the next month, there are no significant differences by
gender, age, residence and occupation. However, current smokers with a college/university level of education are
more likely to quit in the next one month than all other educational levels. Among current smokers who are
planning to quit within the next 12 months, there are no significant differences by various demographic
characteristics. However, students showed the least inclination to quit smoking in the next 12 months. People in the
65+ group, and those with less than prmary level of education, showed the least inclination to quit smoking at all
(Table 5.3).
Figure. 5.1. Percentage of quit attempts and advice by health-care providers to quit smoking, by gender - GATS
Indonesia, 2011
Note: All figures are in percentages.

56 Cessation
Overall 5.1 (3.7, 7.0) 5.4 (4.1, 7.1) 38.3 (33.1, 43.8) 31.3 (26.3, 36.7) 19.9 (14.9, 26.0) 100
Male 5.1 (3.7, 7.0) 5.4 (4.1, 7.2) 38.4 (33.2, 43.9) 31.5 (26.4, 37.0) 19.6 (14.7, 25.7) 100
Female 4.3 (1.9, 9.5) 5.3 (2.4, 11.6) 36.1 (24.1, 50.3) 26.7 (18.5, 36.8) 27.6 (16.5, 42.3) 100
15-24 7.4 (4.7, 11.4) 4.4 (2.4, 7.7) 39.7 (32.9, 47.1) 25.2 (19.0, 32.6) 23.3 (16.5, 31.9) 100
25-44 4.4 (3.0, 6.4) 5.0 (3.7, 6.9) 41.1 (35.2, 47.2) 31.0 (25.3, 37.2) 18.6 (13.6, 24.7) 100
45-64 4.7 (2.6, 8.3) 6.7 (4.5, 10.0) 36.2 (30.0, 43.0) 32.1 (26.5, 38.2) 20.3 (14.8, 27.2) 100
65+ 5.1 (2.7, 9.5) 5.8 (3.0, 11.0) 21.9 (16.3, 28.8) 47.9 (39.2, 56.7) 19.2 (12.8, 27.7) 100
Urban 4.7 (3.0, 7.2) 5.8 (4.3, 7.8) 40.1 (32.6, 48.2) 23.8 (17.2, 31.9) 25.6 (17.4, 35.9) 100
Rural 5.4 (3.4, 8.4) 5.1 (3.2, 8.0) 36.8 (29.8, 44.4) 37.7 (30.6, 45.3) 15.1 (9.6, 22.9) 100
Less than primary school completed 3.5 (1.9, 6.4) 5.2 (3.5, 7.6) 27.5 (22.1, 33.6) 44.1 (37.0, 51.5) 19.7 (13.5, 28.0) 100
Primary school completed 5.3 (3.4, 8.0) 5.0 (2.9, 8.2) 34.4 (28.1, 41.4) 35.5 (28.6, 43.0) 19.9 (14.1, 27.2) 100
Secondary school completed 6.2 (3.9, 9.7) 5.2 (2.9, 8.9) 40.1 (33.2, 47.4) 26.2 (19.8, 33.7) 22.4 (16.3, 30.1) 100
High school completed 4.0 (2.3, 6.7) 6.6 (4.7, 9.2) 50.8 (42.7, 58.7) 20.3 (14.9, 27.2) 18.4 (11.9, 27.2) 100
Col lege or Univers i ty + 11.1 (6.6, 18.1) 5.1 (2.5, 10.1) 50.2 (37.8, 62.6) 14.9 (9.3, 23.1) 18.6 (11.0, 29.7) 100
Employed 5.4 (3.5, 8.1) 5.6 (4.0, 7.7) 39.7 (33.1, 46.6) 25.4 (20.1, 31.6) 23.9 (16.5, 33.3) 100
Sel f-employed 4.3 (2.8, 6.5) 5.7 (4.0, 8.2) 37.6 (31.4, 44.3) 35.9 (29.6, 42.8) 16.4 (12.1, 21.9) 100
Students 14.8 (7.9, 25.9) 2.2 (0.6, 7.8) 43.0 (29.5, 57.6) 19.9 (10.4, 34.9) 20.0 (10.9, 33.9) 100
Home makers 2.8 (0.4, 17.9) 6.5 (2.1, 18.5) 31.8 (18.3, 49.3) 32.9 (19.6, 49.5) 26.0 (13.5, 44.1) 100
Un-employed 4.3 (2.3, 7.9) 3.5 (1.5, 8.2) 35.3 (27.3, 44.2) 35.5 (27.2, 44.8) 21.4 (14.5, 30.5) 100
Residence
Age (years)
Gender
Table 5.3: Percentage dis tribution of current smokers ≥15 years old by interest in quitting smoking and selected demographic
characteris tics – GATS Indones ia , 2011.
1 Among current dai ly or less than dai ly smokers .
Percentage(95% CI )
Interest in Quitting Smoking1
TotalPlanning to Quit
Within Next
Month
Thinking About
Quitting Within
Next 12 Months
Will Quit
Someday, But
Not in the Next
Not Interested in
QuittingDon’t Know
Demographic Characteristics
Occupation/Work status
Education Level

57 Second-hand smoke
6. Second-hand smoke
In Indonesia, educational and health-care facilities are smoke-free by law. There is also prohibition in some provinces and cities in
other public places, such as restaurants and public transport. The Global Youth Tobacco Survey (GYTS) shows that more than 70%
students were exposed to second-hand smoke (SHS) in public places and the Global Health Professions Students Survey (GHPSS)
results show that more than 70% of third-year medical and dental students were similarly exposed. However, there were no data on
SHS exposure in Indonesia among the adult population in public places, including workplaces, before this survey.
This chapter measures exposure to SHS in indoor workplaces, homes and in certain public places such as government buildings,
health-care facilities, restaurants and public transport.
Key findings
o Among those who work indoors, over half were exposed to SHS at indoor workplaces in the 30 days preceding the
survey.
o Nearly four in five respondents were exposed to SHS at home.
o Nearly four in five of all people were exposed to SHS in restaurants.
6.1. SHS exposure in indoor workplaces
Table 6.1 gives the prevalence and the estimated number (in thousands) of adults exposed to SHS in indoor workplaces over the
preceding 30 days.
6.1.1. Prevalence of SHS exposure in indoor workplaces
Exposure to SHS in indoor workplaces was measured among adults aged 15 years and above who usually work indoors, outside of
their homes. Table 6.1 shows that overall, 51.3% of workers are exposed to SHS at indoor workplaces. This figure reduces to 45.6%
among non-smokers. Exposure to SHS varies across different demographic characteristics of workers, as given in Table 6.1. More
men workers are exposed to SHS than women workers, both among the overall population and among non-smokers. Workers in
rural areas have a higher proportion of exposure than urban workers. By educational level, secondary school graduates have the
highest proportion of exposure to SHS, both overall and among non-smokers.

58 Second-hand smoke
Figure. 6.1. Exposure to second-hand smoke at workplace, home and various public places by gender – GATS Indonesia, 2011
Note: All figures are in percentages.
51,3
78,4
63,4
17,9
85,4
70
58
81,4
69,4
20,1
90,8
79
41,4
75,4
55,4
16,5
76,1
62,4
0
10
20
30
40
50
60
70
80
90
100
Workplace Home Governmentbuildings
Health-carefacilities
Restaurants Publictransportation
Overall
Men
Women

59 Second-hand smoke
6.1.2. Number of workers exposed to SHS in indoor workplaces
Table 6.1 shows that, overall, 14.6 million workers are exposed to SHS in the indoor areas of their workplaces. The
estimated number of men workers exposed to SHS in indoor workplaces (9.9 million) is nearly twice that of women workers
(4.7 million). Classified by age group, the maximum number of adult workers exposed to SHS in indoor workplaces (8.6
million) belongs to the 25–44 years age group. The estimated number of workers living in urban areas who are exposed to
SHS in indoor workplaces (10.3 million) is more than twice that of those living in rural areas (4.2 million). Classified by
educational level, high school graduates are the most exposed to SHS in indoor workplaces (5.6 million). By occupational
category, exposure varies from 3.4 million (self-employed) to 10.9 million (employed).
Among non-smoking workers, the estimated number exposed to SHS at indoor workplaces is 8.3 million. The number of
non-smoking women workers who are exposed to SHS in indoor workplaces (4.6 million) is more than that of non-smoking
men workers (3.7 million) similarly exposed. The largest number of non-smoking workers who are exposed to SHS in indoor
workplaces are in the age group of 25–44 years (4.9 million).
The estimated number of urban non-smoking workers who are exposed to SHS in indoor workplaces (6.1 million) is much
more than that of the corresponding category in rural areas (2.2 million). By occupational category, the estimated number
of employed non-smokers who are exposed to SHS in indoor workplaces (6.6 million) is much higher than the number of
self-employed non-smokers (1.5 million).
Number in
thousands
Number in
thousands
Overall 51.3 (45.8, 56.8) 14,557.9 45.6 (39.7, 51.7) 8,314.5
Male 58.0 (51.6, 64.2) 9,851.4 52.8 (43.6, 61.8) 3,683.3
Female 41.4 (35.4, 47.5) 4,706.5 41.2 (35.3, 47.4) 4,631.2
15-24 45.9 (37.3, 54.7) 2,510.7 42.8 (32.8, 53.4) 1,680.6
25-44 50.8 (45.0, 56.6) 8,560.7 45.7 (39.7, 51.9) 4,883.2
45-64 57.5 (49.5, 65.2) 3,327.2 49.0 (38.8, 59.3) 1,691.3
65+ -- -- -- --
Urban 47.8 (41.2, 54.5) 10,313.2 44.0 (36.8, 51.5) 6,125.7
Rural 62.4 (55.7, 68.7) 4,244.7 51.0 (43.2, 58.7) 2,188.8
Less than primary school completed 63.4 (50.0, 74.9) 1,013.7 47.7 (32.8, 62.9) 468.2
Primary school completed 55.8 (44.1, 66.9) 1,655.7 45.3 (32.3, 59.1) 770.3
Secondary school completed 62.7 (54.0, 70.6) 2,838.1 60.5 (49.2, 70.7) 1,499.8
High school completed 47.9 (41.4, 54.5) 5,585.1 42.8 (34.7, 51.3) 3,176.8
Col lege or Univers i ty + 45.6 (37.9, 53.5) 3,465.3 42.8 (34.5, 51.5) 2,399.4
Employed 48.3 (42.7, 53.9) 10,924.7 43.7 (37.6, 50.1) 6,606.9
Sel f-employed 66.4 (57.6, 74.2) 3,415.4 58.4 (48.3, 67.9) 1,521.5
Students NA NA NA NA
Home makers NA NA NA NA
Un-employed NA NA NA NA
-- Indicator estimate based on less than 25 un-weighted cases and has been suppressed.
NA = not appl icable.
Table 6.1: Percentage and number of adults ≥15 years old who work indoors and are exposed to tobacco
smoke at work, by smoking s tatus and selected demographic characteris tics – GATS Indones ia , 2011.
Adults Exposed to Tobacco Smoke at Work1
Overall Non-smokers
Percentage (95% CI) Percentage (95% CI)
1 In the past 30 days . Among those respondents who work outs ide of the home who usual ly work indoors
or both indoors and outdoors .
Demographic Characteristics
Occupation/Work status
Education Level
Residence
Age (years)
Gender
60 Second-hand smoke
6.2. SHS exposure at home
This section provides the prevalence and number (in thousands) of SHS exposure at home in the past 30 days by smoking status and selected demographic categories.
6.2.1. Prevalence of SHS exposure at home
Overall, 78.4% of adults aged 15 years and above were exposed to SHS at homes. Exposure at home does not differ substantially by gender or age group. People living in rural areas have a higher prevalence of exposure to SHS at home (88.2%) than those who live in urban areas (68.5%). Adults with a lower educational level (less than primary school, primary school) have the highest prevalence of exposure to SHS at home (84.5%) and those with college and university level of education have the lowest (57.2%). By occupation, self-employed persons have the highest prevalence of exposure at home (85.3%) of all the occupational categories.
The overall prevalence of exposure to SHS in homes among non-smokers is 71.7%. The prevalence of SHS exposure at home for non-smokers is more among women non-smokers (75.0%) as compared to men (62.0%). Non-smokers living in rural areas are more exposed to SHS at home (83.5%) than those living in urban areas (60.8%). Adult non-smokers with the highest educational level (college and university level) have the lowest exposure to SHS at home (49.2%) as compared to the peple with less than primary level (78.1%) and primary level of education (79.4%).
6.2.2. Number of adults exposed to SHS at home
Overall, 133.3 million adults aged 15 years and over are exposed to SHS at home. Considered by gender, the estimated
number of men exposed to SHS at home (69.1 million) is higher than the number of women (64.1 million). Classified by age
groups, adults aged 25–44 have the highest number of persons who are exposed to SHS at home (59.4 million). Age groups
15–24 years and 45–64 years have simliar numbers of exposure of about 32 million. The estimated number of adults living
in rural areas who are exposed to SHS at home (75.3 million) is higher than among those living in urban areas (58.0 million).
Classified by educational level, the estimated number of adults who are exposed to SHS at home is highest among those
with a primary level of education (39.1 million) and is lowest among those with college and university-level education (6.7
million). By occupational category, unemployed adults have the smallest number of persons who are exposed to SHS at
home (about 9.9 million).

61 Second-hand smoke
Among non-smokers, the estimated number exposed to SHS at home is 79.3 million. The number of non-smoker women
who are exposed to SHS at home (62.0 million) is much higher than the men counterparts (17.3 million). The pattern of
exposure to SHS at home among non-smokers follows a similar pattern as observed for the overall adult population. By age
groups, non-smokers aged 25–44 have the highest number of persons exposed to SHS at home (33.1 million). The
estimated number of adults living in rural areas who are exposed to SHS at home (44.4 million) is higher than those living in
urban areas (34.9 million). Classified by educational levels, the estimated number of adults who are exposed to SHS at
home is highest among those with primary level of education (23.0 million) and lowest among those at college and
university level (4.2 million). By occupational category, the lowest number of persons who are exposed to SHS at home are
unemployed adults (about 6.3 million).
6.3. Exposure to SHS in public places
Common sites of exposure to SHS in public places are government buildings, health-care facilities, restaurants and public
transport. Table 6.3 presents the prevalence of SHS exposure for the overall populace and non-smokers among adults 15
years and above in these public places in the 30 days preceding the survey.
6.3.1. Prevalence of exposure to SHS in government buildings
Overall prevalence of exposure to SHS in government buildings for adults 15 years and above is 63.4%. The prevalence of
exposure to SHS among men (69.4%) is higher than that among women (55.4%). The age groups 25–44 years and 45–64
Number in
thousands
Number in
thousands
Overall 78.4 (75.1, 81.4) 133,292.1 71.7 (67.7, 75.4) 79,254.3
Male 81.4 (78.1, 84.3) 69,155.7 62.0 (56.7, 67.0) 17,250.8
Female 75.4 (71.7, 78.9) 64,136.4 75.0 (71.1, 78.4) 62,003.5
15-24 80.0 (76.1, 83.3) 32,901.1 76.5 (71.9, 80.6) 23,229.0
25-44 77.5 (73.7, 80.9) 59,445.5 69.4 (64.6, 73.8) 33,127.1
45-64 79.7 (75.7, 83.2) 32,074.8 71.7 (66.8, 76.1) 17,440.1
65+ 74.4 (68.9, 79.2) 8,870.7 67.1 (60.3, 73.2) 5,458.1
Urban 68.5 (62.8, 73.7) 57,971.5 60.8 (54.5, 66.7) 34,886.5
Rural 88.2 (84.4, 91.2) 75,320.6 83.5 (78.3, 87.6) 44,367.8
Less than primary school completed 84.5 (80.4, 87.8) 31,529.2 78.1 (73.5, 82.1) 17,963.1
Primary school completed 84.5 (81.3, 87.2) 39,182.1 79.4 (75.3, 83.0) 23,072.0
Secondary school completed 79.0 (75.3, 82.3) 28,024.0 73.5 (68.9, 77.6) 17,689.4
High school completed 71.3 (66.1, 76.1) 27,864.1 63.1 (57.1, 68.8) 16,351.7
Col lege or Univers i ty + 57.2 (49.4, 64.6) 6,673.3 49.2 (40.4, 58.0) 4,158.7
Employed 74.0 (68.6, 78.7) 35,768.8 62.2 (55.8, 68.3) 15,980.9
Sel f-employed 85.3 (82.3, 87.9) 49,938.0 75.5 (70.5, 79.8) 21,891.8
Students 72.5 (66.8, 77.6) 10,001.3 70.9 (64.5, 76.6) 8,370.3
Home makers 76.3 (71.8, 80.2) 27,617.9 75.9 (71.4, 79.9) 26,738.3
Un-employed 76.2 (70.7, 81.0) 9,926.8 71.0 (63.9, 77.2) 6,273.1
Table 6.2: Percentage and number of adults ≥15 years old who are exposed to tobacco smoke at home,
by smoking s tatus and selected demographic characteris tics – GATS Indones ia , 2011.
Adults exposed to tobacco smoke at home at least monthly
Overall Non-smokers
Percentage (95% CI) Percentage (95% CI)
Demographic Characteristics
Occupation/Work status
Education Level
Residence
Age (years)
Gender

62 Second-hand smoke
years have similar prevalences of exposure, of about 66%. Adults living in rural areas have a higher prevalence of exposure
(71.2%) than those living in urban areas (58.6%). The prevalence rate is similar across all educational categories. By
occupational category, the student group has the lowest exposure (41.5%).
Among non-smokers, overall, 57.9% are exposed to SHS in government buildings. Men non-smokers are exposed to SHS
more often than women (62.6% and 55.7%, respectively). By age group, non-smokers aged 25–44 years have the highest
prevalence of exposure (61.7%). Non-smokers living in rural areas have a higher prevalence of exposure to SHS than those
who live in urban areas. The prevalence rate for non-smokers is similar across all educational categories. By occupation,
students have the least prevalence of exposure (46.5%).
6.3.2. Prevalence of exposure to SHS at health-care facilities
Table 6.3 reveals that 17.9% of overall adults are exposed to SHS at health-care facilities. By gender, men have a higher
prevalence of exposure to SHS (20.1%) than women (16.5%). The age groups 15–24 years and 45–64 years have a similar
prevalence of exposure of about 19.0%, which is higher than that for the other two age groups. Adults living in urban areas
have a higher prevalence of exposure (20.0%) than those who live in rural areas (15.1%).
Among non-smokers, the overall prevalence rate of SHS exposure at health-care facilities is 16.8%. By gender, men and
women non-smokers have a similar prevalence of exposure of about 17.0%. The 45–64 years age group has the highest
prevalence of exposure at health-care facilities (20.0%). Urban dwellers have a higher prevalence (19.0%) than rural
dwellers (13.8%).
6.3.3. Prevalence of exposure to SHS in restaurants
Overall exposure to SHS at restaurants for adults aged 15 years and above is 85.4%. The prevalence rate reported for men
(90.8%) is higher than that for women (76.1%). By age group, non-smokers aged 15–24 years and 25–44 years have the
highest prevalence of exposure to SHS at restaurants (about 86%). Adults living in urban areas have a higher prevalence of
exposure (87.4%) than those who live in rural areas (81.7%).
The prevalence of SHS exposure at restaurants for non-smokers is 80.5%. Men non-smokers have a higher prevalence of
exposure than women (87.9% and 76.0%, respectively). Prevalence of exposure to SHS at restaurants is higher among non-
smokers aged 15–24 years and 25–44 years (above 80%) than other age groups. Non-smokers living in urban areas have a
higher prevalence of exposure (83.5%) than those who live in rural areas (73.7%).
6.3.4. Prevalence of exposure to SHS in public transport
Table 6.3 shows that overall, 70.0% of adults are exposed to SHS in public transport. By gender, men have a higher
prevalence of exposure to SHS in public transport (79.0%) than women (62.4%). The 15–24 years age group has the highest
prevalence of exposure (77.8%) among all age groups. Adults living in rural and urban areas have similar prevalence levels
of exposure of about 70%. By occupation, the student group has the highest prevalence of exposure to SHS in public
transport (81.0%).
The overall prevalence rate of exposure to SHS in public transport for non-smokers is 65.8%. Men non-smokers have a
higher prevalence of exposure to SHS in public transport (78.4%) than women non-smokers (62.0%). The prevalence of
exposure is higher among non-smokers aged 15–24 years (76.0%) than other age groups. Non-smokers living in rural areas
and urban areas have similar levels of exposure of about 65%.

63 Second-hand smoke
Overall 63.4 (58.5, 68.1) 17.9 (15.0, 21.1) 85.4 (80.9, 88.9) 70.0 (65.6, 74.0)
Gender
Men 69.4 (63.0, 75.1) 20.1 (16.2, 24.7) 90.8 (87.3, 93.5) 79.0 (74.7, 82.8)
Women 55.4 (49.7, 61.0) 16.5 (13.7, 19.8) 76.1 (69.5, 81.7) 62.4 (56.6, 67.8)
Age (years)
15–24 52.5 (43.5, 61.3) 14.8 (11.1, 19.6) 85.7 (81.7, 88.9) 77.8 (72.0, 82.7)
25–44 66.7 (61.7, 71.3) 19.5 (16.3, 23.0) 86.5 (81.2, 90.5) 70.6 (65.7, 75.1)
45–64 66.3 (59.2, 72.7) 19.2 (14.4, 25.0) 83.7 (76.8, 88.8) 62.2 (56.7, 67.4)
65+ 47.6 (30.1, 65.6) 10.3 (6.0, 17.3) 68.2 (53.2, 80.2) 52.8 (41.8, 63.5)
Residence
Urban 58.6 (52.3, 64.6) 20.0 (15.8, 24.9) 87.4 (83.8, 90.2) 70.2 (64.5, 75.3)
Rura l 71.2 (63.3, 78.0) 15.1 (11.7, 19.3) 81.7 (70.3, 89.4) 69.6 (62.6, 75.7)
Educational level
Less than primary school completed64.2 (54.4, 72.9) 15.2 (11.3, 20.2) 75.5 (65.6, 83.3) 60.8 (54.3, 66.9)
Primary school completed 63.0 (53.2, 71.8) 17.5 (13.3, 22.7) 89.5 (83.7, 93.4) 65.7 (58.6, 72.2)
Secondary school completed 61.9 (52.7, 70.4) 18.2 (13.7, 23.8) 85.4 (79.4, 89.9) 74.4 (68.9, 79.3)
High school completed 61.8 (55.9, 67.3) 17.4 (13.9, 21.5) 84.1 (79.0, 88.2) 75.1 (68.9, 80.5)
Col lege & univers i ty + 68.1 (60.3, 75.0) 24.4 (17.2, 33.5) 88.4 (81.0, 93.2) 69.9 (61.4, 77.1)
Occupation/work status
Employed 66.7 (60.1, 72.6) 18.8 (15.1, 23.2) 88.0 (83.5, 91.4) 72.7 (67.4, 77.5)
Sel f-employed 68.8 (60.9, 75.8) 18.5 (13.9, 24.3) 87.6 (83.1, 91.1) 71.5 (66.7, 75.9)
Students 41.5 (29.2, 54.9) 17.5 (11.5, 25.5) 84.1 (77.2, 89.2) 81.0 (73.2, 87.0)
Home-makers 56.4 (48.2, 64.3) 17.4 (14.0, 21.5) 71.2 (61.0, 79.6) 61.1 (54.0, 67.8)
Unemployed 48.5 (33.9, 63.2) 13.0 (8.3, 19.7) 88.0 (79.1, 93.4) 60.5 (51.1, 69.2)
Percentage (95% CI )
1 Among a l l adults in the past 30 days
Table 6.3. Percentage of overa l l adults 15 years and above who vis i ted various publ ic places in the past
30 days and were exposed to tobacco smoke, by smoking s tatus and selected demographic
characteris tics – GATS Indones ia , 2011
Exposure to tobacco smoke1 in…
Government
buildings
Health-care
facilitiesRestaurants
Public
transportationDemographic characteristics

64 Second-hand smoke
Non-smokers 57.9 (53.0, 62.7) 16.8 (14.1, 19.8) 80.5 (75.3, 84.8) 65.8 (60.7, 70.6)
Gender
Men 62.6 (54.7, 69.9) 17.5 (13.0, 23.3) 87.9 (84.1, 90.9) 78.4 (72.7, 83.2)
Women 55.7 (49.9, 61.3) 16.5 (13.7, 19.9) 76.0 (69.2, 81.7) 62.0 (56.1, 67.6)
Age (years)
15–24 52.0 (43.3, 60.7) 14.3 (10.5, 19.1) 82.4 (77.6, 86.4) 76.0 (69.4, 81.6)
25–44 61.7 (56.4, 66.8) 17.3 (14.6, 20.4) 81.3 (75.0, 86.4) 65.9 (60.1, 71.3)
45–64 56.9 (48.1, 65.2) 20.0 (14.9, 26.3) 76.9 (67.6, 84.1) 53.9 (47.1, 60.5)
65+ 43.2 (24.9, 63.6) 12.0 (6.7, 20.6) 62.2 (43.9, 77.7) 47.0 (34.9, 59.5)
Residence
Urban 53.5 (47.7, 59.2) 19.0 (15.2, 23.4) 83.5 (78.9, 87.2) 66.5 (59.6, 72.7)
Rura l 65.7 (56.7, 73.7) 13.8 (10.5, 17.9) 73.7 (60.8, 83.6) 64.7 (57.0, 71.8)
Educational level
Less than primary school completed50.5 (38.8, 62.1) 15.1 (11.0, 20.4) 60.2 (47.2, 71.9) 50.6 (43.1, 58.1)
Primary school completed 55.9 (45.0, 66.3) 16.9 (12.7, 22.2) 85.6 (75.9, 91.8) 59.9 (52.4, 66.9)
Secondary school completed 57.4 (46.3, 67.8) 17.2 (13.1, 22.3) 80.0 (73.4, 85.3) 70.8 (64.1, 76.8)
High school completed 56.6 (49.9, 63.1) 15.8 (12.2, 20.2) 79.1 (73.1, 84.1) 73.0 (65.6, 79.3)
Col lege & univers i ty + 65.7 (58.1, 72.7) 20.9 (14.9, 28.4) 85.4 (77.1, 91.1) 67.8 (58.1, 76.2)
Occupation/work status
Employed 64.2 (57.6, 70.2) 15.1 (11.6, 19.3) 84.7 (78.7, 89.3) 69.4 (62.8, 75.3)
Sel f-employed 55.2 (44.3, 65.6) 17.4 (12.9, 23.1) 79.8 (75.2, 83.8) 60.8 (54.5, 66.7)
Students 46.5 (32.1, 61.5) 18.1 (11.9, 26.5) 81.4 (73.6, 87.2) 81.1 (72.5, 87.4)
Home-makers 56.4 (48.2, 64.2) 17.7 (14.2, 21.8) 71.2 (60.8, 79.7) 60.7 (53.3, 67.7)
Unemployed 45.9 (29.2, 63.7) 13.9 (8.3, 22.3) 86.2 (74.1, 93.2) 57.0 (45.6, 67.7)
Percentage (95% CI )
1 Among a l l adults in the past 30 days
Table 6.3 (cont.). Percentage of non-smoker adults 15 years and above who vis i ted various publ ic places
in the past 30 days and were exposed to tobacco smoke, by smoking s tatus and selected demographic
characteris tics – GATS Indones ia , 2011
Exposure to tobacco smoke1 in…
Government
buildings
Health-care
facilitiesRestaurants
Public
transportationDemographic characteristics

65 Second-hand smoke
Overall 54.3 (46.6, 61.8) 38.4 (33.7, 43.5) 17.6 (13.9, 22.0) 91.8 (75.1, 97.6)
Gender
Men 57.2 (46.9, 67.0) 45.9 (39.8, 52.1) 21.2 (16.6, 26.6) 91.3 (73.7, 97.5)
Women 49.4 (41.0, 57.7) 31.9 (26.9, 37.3) 12.8 (9.8, 16.5) -
Age (years)
15–24 58.0 (45.7, 69.5) 50.3 (42.8, 57.7) 16.7 (12.6, 21.8) -
25–44 51.8 (42.1, 61.4) 31.9 (27.2, 37.0) 18.1 (14.2, 22.8) -
45–64 41.2 (25.1, 59.4) 35.3 (28.1, 43.3) 18.2 (14.2, 23.0) -
65+ 0.0 17.0 (7.1, 35.5) 15.3 (10.5, 21.6) 0.0
Residence
Urban 52.5 (43.7, 61.1) 36.2 (30.0, 43.0) 14.0 (9.6, 19.8) 91.3 (67.4, 98.2)
Rura l 59.2 (43.5, 73.3) 41.5 (34.3, 49.0) 21.4 (15.8, 28.4) -
Educational level
Less than primary school completed0.0 26.0 (19.0, 34.5) 18.1 (13.0, 24.7) -
Primary school completed - 38.2 (31.8, 45.0) 21.3 (15.7, 28.3) -
Secondary school completed - 44.3 (37.3, 51.5) 17.1 (13.3, 21.7) -
High school completed 60.2 (50.8, 69.0) 33.6 (27.7, 40.2) 14.5 (11.2, 18.7) -
Col lege & univers i ty + 45.9 (34.8, 57.5) 42.7 (33.9, 52.0) 14.7 (10.4, 20.4) -
Occupation/work status
Employed 55.1 (44.5, 65.1) 41.6 (34.6, 49.0) 17.6 (13.4, 22.7) -
Sel f-employed 43.6 (27.1, 61.5) 34.1 (28.2, 40.5) 21.1 (15.9, 27.5) -
Students 58.8 (46.8, 69.9) 53.9 (44.7, 62.8) 14.7 (10.1, 20.8) -
Home-makers - 20.6 (15.6, 26.6) 13.2 (9.5, 18.2) -
Unemployed 59.3 (35.8, 79.3) 31.6 (20.3, 45.7) 14.0 (9.3, 20.5) -
- Indicator estimate based on less than 25 unweighted cases and has been suppressed.
1 Among a l l adults in the past 30 days
Table 6.3A. Percentage of overa l l adults 15 years and above who vis i ted various publ ic places in the
past 30 days and were exposed to tobacco smoke, by smoking s tatus and selected demographic
characteris tics – GATS Indones ia , 2011
Exposure to tobacco smoke1 in…
UniversitiesSchools and
educational
facilities
Religious
facilitiesBars/night clubs
Percentage (95% CI )
Demographic characteristics

66 Second-hand smoke
Non-smokers 55.4 (47.1, 63.4) 36.5 (31.4, 41.9) 13.9 (10.9, 17.5) -
Gender
Men 62.8 (49.9, 74.1) 47.3 (39.7, 55.0) 16.3 (12.6, 20.7) -
Women 49.0 (40.7, 57.4) 31.9 (26.9, 37.4) 12.7 (9.7, 16.5) -
Age (years)
15–24 62.7 (51.9, 72.4) 47.9 (40.1, 55.8) 14.9 (11.3, 19.3) -
25–44 42.8 (31.4, 55.1) 29.7 (24.8, 35.1) 13.6 (10.4, 17.6) -
45–64 41.1 (20.2, 65.8) 30.3 (22.8, 39.0) 14.1 (10.6, 18.6) -
65+ 0.0 - 10.6 (6.7, 16.3)
Residence
Urban 52.3 (42.8, 61.6) 34.2 (27.6, 41.5) 11.0 (7.5, 15.9) -
Rura l 63.3 (46.4, 77.6) 39.7 (32.1, 47.8) 17.2 (12.7, 22.9) -
Educational level
Less than primary school completed - 21.5 (13.8, 31.9) 13.4 (9.0, 19.4) -
Primary school completed - 36.3 (29.2, 44.0) 16.1 (11.8, 21.6) -
Secondary school completed - 43.0 (35.4, 50.9) 15.0 (11.3, 19.5) -
High school completed 63.3 (53.6, 72.1) 30.7 (24.6, 37.5) 11.4 (8.4, 15.4) -
Col lege & univers i ty + 37.3 (25.2, 51.3) 40.3 (31.9, 49.3) 12.7 (8.8, 18.1) -
Occupation/work status
Employed 52.3 (39.7, 64.7) 41.3 (33.6, 49.4) 13.4 (10.5, 17.1) -
Sel f-employed - 28.8 (22.7, 35.8) 14.9 (10.7, 20.5) -
Students 63.2 (51.9, 73.2) 52.8 (43.4, 62.1) 14.0 (9.3, 20.5) -
Home-makers - 20.5 (15.5, 26.6) 13.3 (9.5, 18.4) -
Unemployed - 24.3 (12.7, 41.5) 13.1 (8.2, 20.4) -
- Indicator estimate based on less than 25 unweighted cases and has been suppressed.
Exposure to tobacco smoke1 in…
Demographic characteristics
Table 6.3A (cont.). Percentage of non-smoker adults 15 years and above who vis i ted various publ ic
places in the past 30 days and were exposed to tobacco smoke, by smoking s tatus and selected
demographic characteris tics – GATS Indones ia , 2011
1 Among a l l adults in the past 30 days
Percentage (95% CI )
Bars/night clubsReligious
facilities
Schools and
educational
facilities
Universities

67 Economics
7. Economics
Indonesia is the fifth-largest tobacco-producing country in the world. The total production of cigarettes in 2011 was 258 billion sticks. Studies in 2010 estimated that 190 260 Indonesians (100 680 men and 89 580 women) died Over a period of one year due to consumption of tobacco, which is about 12.4% of total deaths (1 539 288) from all causes. The total loss of productivity due to premature mortality and disabilities due to consumption of tobacco was 3 533 000 disability-adjusted life years (DALYs). The macroeconomic loss, which is estimated by applying the 2010 GDP per capita, i.e. IDR26 895 061.00 (US$ 3091.00) to the total loss of productivity (3 533 000 DALYs) is US$ 10.92 billion or IDR 105.92 trillion This chapter focuses on different brands of kretek cigarettes purchased by current smokers during their last purchase, the source of the last purchase and expenditure on kretek cigarettes.
Key findings
o The most preferred cigarettes are kretek cigarettes.
o The preferred kretek brands are Gudang Garam, Djarum, Sampoerna, Dji Sam Soe and Tali Jagad.
o About 79.8% of kretek cigarette smokers purchase cigarettes from kiosks.
o On an average, a kretek cigarette smoker spends IDR 198 761.00 per month on purchasing kretek cigarettes.
o The average price of a pack (20 sticks) of kretek cigarettes is IDR 12 699.00.
o Of the average income in terms of GDP per capita, 4.71% was spent on the purchase of 100 packs of kretek
cigarettes in the year 2011.
7.1. Last brand of kretek cigarettes purchased
During the survey, respondents were asked to report on the brand names of the last cigarettes purchased by them. The
survey demonstrated that in Indonesia, the top five brands currently being used by adults are Gudang Garam (21.8%),
Djarum (18.8%), Sampoerna (15.4%), Dji Sam Soe (6.0%) and Tali Jagad (5.3%) (Table 7.1).

68 Economics
Overall 21.8 (18.4, 25.5) 18.8 (14.6, 23.9) 15.4 (13.0, 18.0) 6.0 (4.6, 7.7) 5.3 (2.5, 11.0) 32.8 (27.7, 38.3)
Gender
Men 21.9 (18.5, 25.7) 18.3 (14.2, 23.2) 15.7 (13.3, 18.4) 6.2 (4.8, 8.0) 5.4 (2.5, 11.1) 32.6 (27.5, 38.1)
Women 17.9 (10.1, 29.7) 33.4 (21.3, 48.2) 5.4 (2.4, 11.7) 0.0 3.9 (1.0, 13.2) 39.4 (26.8, 53.5)
Age (years)
15–24 12.1 (8.7, 16.5) 20.7 (14.7, 28.3) 24.0 (18.6, 30.3) 2.8 (1.4, 5.5) 4.1 (1.8, 9.2) 36.3 (28.9, 44.5)
25–44 23.0 (19.0, 27.7) 18.0 (13.7, 23.3) 15.4 (12.8, 18.4) 6.9 (5.2, 9.1) 5.6 (2.6, 11.8) 31.1 (25.6, 37.1)
45–64 26.2 (21.1, 31.9) 19.4 (14.9, 24.9) 11.2 (8.2, 15.1) 6.8 (4.8, 9.6) 5.7 (2.5, 12.4) 30.7 (25.1, 37.0)
65+ 22.7 (15.3, 32.4) 16.0 (9.7, 25.2) 3.0 (1.0, 8.7) 4.3 (2.0, 9.3) 5.4 (2.0, 13.5) 48.5 (38.2, 58.9)
Residence
Urban 24.1 (19.5, 29.3) 20.5 (15.4, 26.8) 23.3 (19.1, 28.1) 9.6 (7.1, 12.9) 2.8 (0.8, 9.8) 19.7 (14.8, 25.8)
Rura l 19.8 (15.2, 25.4) 17.4 (11.4, 25.6) 8.8 (6.6, 11.5) 2.9 (1.8, 4.7) 7.4 (3.0, 17.3) 43.6 (35.3, 52.3)
Educational level
Less than primary school completed 18.5 (13.3, 25.2) 15.8 (10.6, 22.7) 7.4 (4.4, 12.2) 2.7 (1.6, 4.8) 4.7 (2.0, 10.5) 50.9 (42.4, 59.3)
Primary school completed 21.6 (17.2, 26.8) 21.2 (15.5, 28.3) 10.1 (7.7, 13.2) 3.3 (2.0, 5.3) 9.5 (4.3, 19.8) 34.3 (27.1, 42.3)
Secondary school completed 21.7 (17.2, 26.9) 23.9 (17.6, 31.5) 19.6 (15.4, 24.6) 7.5 (4.7, 11.6) 3.6 (1.3, 9.1) 23.8 (18.2, 30.6)
High school completed 23.4 (18.9, 28.7) 16.5 (12.2, 21.8) 22.1 (18.1, 26.6) 9.1 (6.8, 12.3) 2.7 (1.1, 6.6) 26.1 (20.0, 33.4)
Col lege & univers i ty + 29.2 (21.1, 39.0) 9.4 (4.8, 17.4) 33.1 (23.3, 44.6) 15.1 (9.9, 22.3) 2.4 (0.5, 10.2) 10.8 (6.7, 17.0)
Occupation/work status
Employed 20.1 (16.2, 24.6) 20.7 (15.3, 27.3) 19.5 (15.7, 24.0) 8.2 (5.8, 11.5) 5.3 (2.2, 12.2) 26.3 (20.8, 32.7)
Sel f-employed 22.9 (18.7, 27.8) 15.6 (11.6, 20.7) 12.3 (9.8, 15.2) 4.3 (3.1, 5.9) 6.1 (2.4, 14.8) 38.7 (32.0, 45.8)
Students 23.6 (14.1, 36.8) 15.3 (7.2, 29.4) 29.5 (18.7, 43.2) 1.6 (0.4, 7.1) 0.0 29.9 (16.6, 47.8)
Home-makers 12.6 (4.5, 30.7) 45.6 (26.5, 66.0) 7.4 (2.3, 21.6) 0.0 0.0 34.4 (18.1, 55.6)
Unemployed 24.1 (15.4, 35.7) 26.4 (16.8, 38.7) 9.1 (4.8, 16.3) 8.4 (4.6, 15.0) 3.5 (1.2, 9.9) 28.5 (20.2, 38.6)
Percentage(95% CI )
Note: Current kretek cigarette smokers include dai ly and occas ional (less than dai ly) use. The top five reported brands last purchased
among a l l manufactured cigarette smokers are shown here.
Table 7.1. Percentage of current kretek cigarette smokers 15 years and above, by last brand purchased and selected demographic
characteris tics – GATS Indones ia , 2011
Demographic characteristics Other
Last kretek cigarette brand purchased
Gudang Garam Dji Sam Soe Tali JagadDjarum Sampoerna

69 Economics
7.2. Source of last purchase of kretek cigarettes
Table 7.2 shows that overall, kretek cigarettes were most commonly purchased at kiosks (79.8%) and at stores (17.6%). The largest proportion that purchased the cigarettes at kiosks was men (79.9%), those in the age group of 15–24 years (81.1%), and rural dwellers (80.6%).
The other sources of purchase (2.6%) included street vendors, duty-free shops, outside the country and from another person.
7.3. Expenditure on cigarettes
Information was collected on expenditure incurred on kretek cigarettes. The average price paid by smokers aged 15 years and above by selected demographic characteristics was calculated and is presented in Table 7.3.
On an average, a current kretek cigarette smoker spends IDR 198 761.00 per month on kretek cigarettes.
The highest spending is incurred by smokers aged 25–44 years, at IDR 215 598.00 per month. Urban cigarette smokers spend IDR 214 607.00 per month, which is IDR 29 118.00 higher than the average amount spent by rural smokers (IDR 185 489.00).
Expenditure on kretek cigarettes shows an increase by education level, with college or university graduates spending the highest amount, i.e. IDR 238 855.00 per month.
Among the occupational categories, employed workers spend the highest amount (IDR 211845.00 per month).
Store 17.6 (12.1, 24.7) 17.4 (12.1, 24.4) 21.8 (11.5, 37.6) 16.1 (9.3, 26.6) 17.9 (12.6, 24.9) 19.4 (12.2, 29.5) 16.0 (8.9, 27.1)
Kiosk 79.8 (72.4, 85.6) 79.9 (72.6, 85.6) 77.8 (62.1, 88.3) 81.1 (70.5, 88.5) 79.5 (72.3, 85.2) 78.8 (68.8, 86.2) 80.6 (69.1, 88.6)
Other 2.6 (1.0, 6.7) 2.7 (1.0, 7.0) 0.4 (0.0, 2.6) 2.7 (0.8, 9.5) 2.6 (1.1, 6.3) 1.7 (1.0, 3.1) 3.4 (0.9, 12.3)
Total
Note: Other includes: s treet vendor, duty-free shop, outs ide the country, from another person or other
Table 7.2. Percentage dis tribution of kretek cigarette smokers 15 years and above, by the source of last purchase of kretek
cigarettes and selected demographic characteris tics – GATS Indones ia , 2011
Source Overall
Gender Age (years) Residence
Men Women 15–24 ≥ 25 Urban Rural
Percentage (95% CI)
100 100 100 100 100 100 100

70 Economics
Price per
20 sticks
(median)
Overall 12500 12718.91 (12121.60,13316.22) 369947.68 (296455.85,443439.50)
Gender
Men 12500 12753.22 (12150.36,13356.08) 373809.40 (299004.38,448614.42)
Women 8750 11019.85 (9045.20,12994.51) 178263.37 (135876.46,220650.29)
Age (years)
15–24 13750 13437.61 (12639.80,14235.41) 401364.73 (222612.85,580116.60)
25–44 12500 12984.11 (12079.82,13888.40) 332876.16 (286318.63,379433.68)
45–64 11667 12072.31 (11499.31,12645.30) 338832.99 (272645.54,405020.44)
65+ 10000 10309.31 (8864.95,11753.67) 963778.99 (-517412.23,2444970.21)
Residence
Urban 14375 14095.10 (13210.85,14979.35) 351424.38 (291845.69,411003.07)
Rural 11250 11614.66 (10817.86,12411.45) 384751.32 (261295.39,508207.25)
Educational level
Less than primary school completed 10000 10288.98 (9499.03,11078.93) 392751.23 (123521.18,661981.28)
Primary school completed 11667 12163.07 (11046.83,13279.30) 329359.14 (252041.45,406676.83)
Secondary school completed 13750 14183.70 (12621.33,15746.06) 332147.11 (283287.01,381007.20)
High school completed 14375 13968.14 (13181.94,14754.34) 439713.21 (300402.96,579023.46)
Col lege & univers i ty + 15000 14659.87 (13910.99,15408.75) 337284.24 (303400.39,371168.09)
Occupation/work status
Employed 13333 13388.80 (12519.93,14257.68) 368053.70 (287209.73,448897.68)
Sel f-employed 11667 12048.70 (11279.26,12818.14) 317280.57 (276394.38,358166.75)
Students 15000 14299.21 (12747.43,15850.99) 257367.55 (206986.12,307748.98)
Home makers 8750 11981.58 (9137.81,14825.34) 150243.30 (114498.36,185988.24)
Unemployed 13750 13629.40 (12362.53,14896.28) 922414.85 (-83351.89,1928181.59)
Demographic characteristics Price per 20 sticks
Table 7.3. Average price paid and expenditure on kretek cigarettes among users of these products aged 15 years
and above, by selected demographic characteris tics – GATS Indones ia , 2011
Kretek (Rupiah)
Expenditure per month

71 Media
8. Media
The Tobacco Control Act in Indonesia has banned advertisement of tobacco products in a very limited way. Advertisement at
the point of sale is not banned. Tobacco industries are using various marketing tactics to attract young people. Some subnational
governments have banned advertisements, but this does not have the desired effect as electronic transmission is not under
their control. Various nongovernmental organizations have been campaigning for tobacco control for the past two decades by
raising awareness, both in the general populace and among policy-makers, for enforcement of the ban. The government has
taken steps to remove visible signbords and billboards advertising tobacco products. The Act has made it compulsory for
industries to provide a specific textual health warning on every advertisement and on packets of all smoked tobacco products;
however, it has been implemented on cigarettes packets only. Smokeless tobacco products are not covered by the law.
Key findings
o Nearly half the population noticed anti-smoking information in any location.
o Nearly three in five people in urban areas noticed anti-smoking information while two in five noticed it in
rural areas.
o Nearly four in five people noticed cigarette advertisements and marketing in any location.
o Nearly nine in ten people noticed cigarette advertisements and marketing in urban areas, while eight in ten
noticed these in urban areas.
o Nearly seven in 10 current smokers noticed a health warning on cigarette packages, and about three in 10
current cigarette smokers thought about quitting because of the health warning.
The GATS in Indonesia provides an opportunity to track tobacco control interventions and focus on media awareness among
both smokers and non-smokers. The data presented in this chapter provide information on the perceptions of adults as a result
of anti-smoking information in the various mass media and public places, health warnings on different tobacco products and all
forms of cigarette advertising. In general, adults (both men and women) reported noticing significantly more pro-cigarette
advertisements than the anti-cigarette smoking messages (Figure 8.1).

72 Media
Figure. 8.1. Noticing anti- and pro-cigarette smoking information, by gender – GATS Indonesia, 2011
Note: All figures are in percentages.
8.1. Percentage of adults 15 years and above who noticed anti-smoking information during the past 30 days in various places
This section covers the degree of awareness of anti-smoking information in the media and displayed in public places. This
includes newspapers or magazines, television, radio, billboards and somewhere else. Table 8.1 shows that overall, 52.7% of
people aged 15 years and above noticed anti-smoking information at any location. The largest overall percentage noticed the
information while watching television or listening to radio programmes (40.9%), followed by billboards (30.4%), newspapers or
magazines (10.6%) and somewhere else (8.4%). Anti-smoking information at any location was noticed more by men (57.1%),
people in the younger age group of 15–24 years (63.0%) and people living in urban areas (64.3%) as compared to their
counterparts. Men are more likely to notice anti-smoking information in newspapers, magazines and billboards. Young people
were more likely to notice anti-smoking information on radio, television and billboards. People living in urban areas were more
likely to notice anti-smoking information in almost all places, with the exception of radio (Table 8.1).
There is no substantial difference in the percentage of people who noticed anti-smoking information between the overall
population (52.7%), current smokers (53.1%) and non-smokers (52.2%) at various locations and in any location (Table 8.1). In the
categories of current smokers and non-smokers, men and people living in urban areas were more likely to notice anti-smoking
information.
52,5 63,7
48,7
84,6 91,1
78,2
0
20
40
60
80
100
Overall Men Women
Anti-cigarette smoking information
Advertisement and sponsorship promoting cigarette smoking

73 Media
In n
ew
sp
ap
ers
or
in m
ag
azi
ne
s1
0.6
(8.9
, 1
2.5
)1
2.6
(10
.5,
14
.9)
8.6
(7.1
, 1
0.4
)1
3.2
(10
.4,
16
.5)
9.8
(8.2
, 1
1.7
)1
5.1
(12
.1,
18
.7)
6.1
(4.8
, 7
.7)
On
te
levi
sio
n o
r th
e r
ad
io4
0.9
(37
.0,
45
.0)
43
.5(3
9.1
, 4
8.0
)3
8.4
(34
.4,
42
.5)
49
.2(4
3.8
, 5
4.5
)3
8.3
(34
.5,
42
.3)
51
.1(4
5.0
, 5
7.2
)3
0.7
(25
.9,
36
.0)
On
te
levi
sio
n3
9.7
(35
.8,
43
.7)
42
.3(3
8.0
, 4
6.8
)3
7.0
(33
.1,
41
.1)
48
.1(4
2.8
, 5
3.5
)3
7.0
(33
.2,
40
.9)
49
.8(4
3.6
, 5
5.9
)2
9.5
(24
.8,
34
.6)
On
th
e r
ad
io5
.0(4
.1,
6.1
)5
.4(4
.3,
6.7
)4
.6(3
.7,
5.8
)5
.4(4
.0,
7.5
)4
.9(3
.9,
6.0
)6
.3(4
.9,
8.2
)3
.7(2
.6,
5.1
)
On
bil
lbo
ard
s3
0.4
(26
.9,
34
.2)
35
.2(3
1.1
, 3
9.6
)2
5.6
(22
.3,
29
.2)
38
.7(3
3.3
, 4
4.4
)2
7.8
(24
.5,
31
.3)
41
.6(3
5.6
, 4
7.8
)1
9.2
(15
.3,
23
.8)
So
me
wh
ere
els
e8
.4(6
.7,
10
.4)
9.2
(7.4
, 1
1.5
)7
.5(5
.8,
9.7
)9
.9(7
.7,
12
.7)
7.9
(6.2
, 9
.9)
11
.0(8
.3,
14
.4)
5.8
(4.0
, 8
.2)
An
y Lo
cati
on
52
.7(4
8.6
, 5
6.8
)5
7.1
(52
.6,
61
.4)
48
.3(4
4.1
, 5
2.6
)6
3.0
(57
.6,
68
.0)
49
.4(4
5.3
, 5
3.6
)6
4.3
(57
.9,
70
.2)
41
.0(3
5.7
, 4
6.6
)
In n
ew
sp
ap
ers
or
in m
ag
azi
ne
s9
.4(7
.8,
11
.2)
9.6
(8.0
, 1
1.5
)3
.8(1
.4,
10
.0)
7.3
(4.8
, 1
1.0
)9
.8(8
.1,
11
.9)
14
.0(1
0.9
, 1
7.8
)5
.4(4
.2,
6.9
)
On
te
levi
sio
n o
r th
e r
ad
io4
0.3
(36
.0,
44
.7)
40
.8(3
6.4
, 4
5.4
)2
6.1
(17
.5,
37
.1)
47
.9(4
0.4
, 5
5.5
)3
8.6
(34
.5,
42
.9)
51
.7(4
4.7
, 5
8.7
)3
0.5
(25
.5,
35
.9)
On
te
levi
sio
n3
8.8
(34
.6,
43
.2)
39
.4(3
5.1
, 4
3.9
)2
2.8
(15
.5,
32
.3)
45
.9(3
8.4
, 5
3.6
)3
7.2
(33
.2,
41
.4)
50
.1(4
3.1
, 5
7.1
)2
9.1
(24
.3,
34
.4)
On
th
e r
ad
io5
.5(4
.3,
7.0
)5
.6(4
.3,
7.1
)4
.5(1
.8,
10
.9)
6.7
(4.3
, 1
0.3
)5
.3(3
.9,
7.0
)6
.9(4
.9,
9.6
)4
.4(3
.1,
6.1
)
On
bil
lbo
ard
s3
2.1
(28
.2,
36
.3)
32
.8(2
8.8
, 3
7.1
)1
4.3
(8.2
, 2
3.8
)3
7.0
(29
.7,
44
.9)
31
.0(2
7.2
, 3
5.0
)4
5.4
(39
.0,
52
.1)
20
.7(1
6.2
, 2
6.1
)
So
me
wh
ere
els
e8
.4(6
.5,
10
.7)
8.5
(6.6
, 1
0.9
)5
.5(2
.4,
12
.1)
8.3
(5.4
, 1
2.7
)8
.4(6
.5,
10
.8)
11
.5(8
.4,
15
.5)
5.7
(3.7
, 8
.7)
An
y Lo
cati
on
53
.1(4
8.5
, 5
7.7
)5
3.8
(49
.1,
58
.5)
34
.1(2
4.3
, 4
5.6
)5
9.8
(52
.1,
67
.0)
51
.6(4
7.1
, 5
6.1
)6
6.1
(58
.8,
72
.7)
42
.0(3
6.1
, 4
8.0
)
In n
ew
sp
ap
ers
or
in m
ag
azi
ne
s1
1.3
(9.4
, 1
3.5
)1
8.6
(15
.1,
22
.8)
8.8
(7.2
, 1
0.6
)1
5.2
(12
.0,
19
.2)
9.8
(7.9
, 1
2.0
)1
5.6
(12
.3,
19
.5)
6.5
(4.9
, 8
.6)
On
te
levi
sio
n o
r th
e r
ad
io4
1.3
(37
.1,
45
.6)
49
.0(4
3.4
, 5
4.7
)3
8.7
(34
.7,
42
.9)
49
.6(4
4.0
, 5
5.2
)3
8.2
(34
.1,
42
.4)
50
.8(4
4.6
, 5
7.0
)3
0.9
(25
.7,
36
.7)
On
te
levi
sio
n4
0.1
(36
.0,
44
.4)
48
.3(4
2.7
, 5
3.9
)3
7.4
(33
.4,
41
.6)
48
.9(4
3.4
, 5
4.4
)3
6.8
(32
.8,
41
.0)
49
.6(4
3.4
, 5
5.8
)2
9.7
(24
.6,
35
.3)
On
th
e r
ad
io4
.7(3
.8,
5.9
)5
.0(3
.6,
6.9
)4
.6(3
.6,
5.9
)5
.0(3
.4,
7.3
)4
.6(3
.7,
5.8
)6
.1(4
.6,
8.0
)3
.2(2
.2,
4.8
)
On
bil
lbo
ard
s2
9.5
(25
.8,
33
.6)
40
.2(3
4.6
, 4
6.1
)2
5.9
(22
.5,
29
.6)
39
.3(3
3.5
, 4
5.4
)2
5.8
(22
.3,
29
.6)
39
.7(3
3.6
, 4
6.3
)1
8.3
(14
.3,
23
.0)
So
me
wh
ere
els
e8
.4(6
.6,
10
.6)
10
.8(8
.1,
14
.1)
7.6
(5.8
, 9
.8)
10
.5(7
.9,
13
.9)
7.6
(5.9
, 9
.7)
10
.7(7
.9,
14
.4)
5.8
(3.9
, 8
.6)
An
y Lo
cati
on
52
.5(4
8.1
, 5
6.8
)6
3.7
(58
.0,
69
.0)
48
.7(4
4.4
, 5
3.1
)6
4.1
(58
.5,
69
.3)
48
.1(4
3.7
, 5
2.6
)6
3.5
(56
.9,
69
.5)
40
.5(3
4.8
, 4
6.5
)
Ta
ble
8.1
: P
erc
en
tag
e o
f a
du
lts
≥1
5 y
ea
rs o
ld w
ho
no
tice
d a
nti
-cig
are
tte
sm
ok
ing
in
form
ati
on
du
rin
g t
he
la
st
30
da
ys i
n v
ari
ou
s p
lace
s,
by
sm
ok
ing
sta
tus
an
d s
ele
cte
d d
em
og
rap
hic
ch
ara
cte
ris
tics
– G
AT
S I
nd
on
es
ia,
20
11
.
Pla
ces
Ov
era
ll
Ge
nd
er
Ag
e(y
ea
rs)
Re
sid
en
ceM
ale
Fe
ma
le1
5-2
4≥
25
Urb
an
Ru
ral
No
te:
Incl
ud
es
bo
th w
hit
e c
iga
rett
es
an
d k
rete
k c
iga
rett
es
.
Pe
rce
nta
ge
(9
5%
CI)
1 In
clu
de
s d
ail
y a
nd
occ
as
ion
al(
les
s t
ha
n d
ail
y) s
mo
ke
rs.
2 I
ncl
ud
es
fo
rme
r a
nd
ne
ver
sm
ok
ers
.
No
n-s
mo
ke
rs2
Cu
rre
nt
smo
ke
rs1
Ov
era
ll
74 Media
8.2. Noticed health warning labels on cigarette packages and thought about quitting
Table 8.2 shows that 72.2% of current smokers noticed health warnings on cigarette packages. A higher
percentage of men noticed these compared to women (73.3% and 45.4%, respectively). More smokers in the
younger age groups (84.3% in the 15–24 years and 79.3% in the 25–44 years age group) noticed health
warnings as compared to those in the older age groups (45–64 years and 65+ years). By residence, an almost
equal proportion of current tobacco smokers in urban and rural areas noticed warnings on cigarette packages
(73.1% for urban and 71.5% for rural). More than 70% of current smokers who had at least primary school
education noticed warnings on cigarette packages. However, only 46.7% of current smokers who had less than
primary education noticed such warnings. By occupation, home-makers noticed health warnings on cigarette
packages least (49.5%).
Among current smokers (including daily and occasional smokers), 27.1% thought about quitting smoking
because of the health warnings. Approximately this same percentage of current smokers across all age groups
thought about quitting smoking because of the health warnings, except current smokers aged 65+ years
among whom only 7.8% thought about it. Thinking about quitting smoking due to such warnings was the same
for urban and rural areas (27.9% for urban and 26.3% for rural areas). Smokers in the lowest educational group
(less than primary) thought less about quitting as compared to the other educational groups.

75 Media
Ov
era
ll7
2.2
(67
.4,
76
.6)
27
.1(2
3.5
, 3
0.9
)2
9.8
(24
.5,
35
.7)
67
.5(6
1.4
, 7
3.0
)2
.7(1
.6,
4.7
)
Ma
le7
3.3
(68
.3,
77
.7)
27
.5(2
3.8
, 3
1.5
)2
9.7
(24
.4,
35
.7)
67
.7(6
1.6
, 7
3.3
)2
.5(1
.4,
4.5
)
Fe
ma
le4
5.4
(32
.7,
58
.7)
17
.0(1
0.0
, 2
7.2
)--
--
--
15
-24
84
.3(7
8.1
, 8
8.9
)2
8.8
(22
.9,
35
.4)
28
.6(1
7.3
, 4
3.5
)7
0.4
(55
.9,
81
.8)
1.0
(0.1
, 6
.5)
25
-44
79
.3(7
3.4
, 8
4.1
)3
0.8
(26
.3,
35
.7)
27
.2(2
2.1
, 3
3.1
)7
0.2
(64
.0,
75
.6)
2.6
(1.2
, 5
.6)
45
-64
59
.9(5
4.0
, 6
5.5
)2
3.7
(19
.7,
28
.2)
34
.1(2
6.9
, 4
2.0
)6
1.6
(53
.3,
69
.2)
4.4
(2.0
, 9
.1)
65
+3
5.6
(27
.2,
44
.9)
7.8
(4.7
, 1
2.6
)--
--
--
Urb
an
73
.1(6
5.4
, 7
9.5
)2
7.9
(22
.9,
33
.5)
34
.7(2
7.9
, 4
2.2
)6
1.4
(53
.4,
68
.8)
3.9
(1.9
, 7
.6)
Ru
ral
71
.5(6
5.0
, 7
7.1
)2
6.3
(21
.5,
31
.8)
25
.4(1
7.7
, 3
5.0
)7
3.0
(63
.4,
80
.8)
1.7
(0.7
, 4
.1)
Les
s t
ha
n p
rim
ary
sch
oo
l co
mp
lete
d4
6.7
(40
.1,
53
.5)
13
.7(1
0.8
, 1
7.3
)2
9.7
(21
.3,
39
.6)
66
.1(5
6.5
, 7
4.5
)4
.2(1
.6,
10
.7)
Pri
ma
ry s
cho
ol
com
ple
ted
74
.1(6
7.8
, 7
9.5
)2
7.3
(22
.5,
32
.7)
29
.2(2
2.0
, 3
7.7
)6
6.7
(58
.4,
74
.1)
4.0
(2.0
, 8
.0)
Se
con
da
ry s
cho
ol
com
ple
ted
81
.2(7
5.5
, 8
5.9
)3
0.7
(25
.4,
36
.6)
27
.8(2
0.3
, 3
6.8
)7
1.4
(62
.1,
79
.1)
0.8
(0.2
, 3
.9)
Hig
h s
cho
ol
com
ple
ted
85
.4(7
8.4
, 9
0.4
)3
6.2
(29
.3,
43
.6)
32
.6(2
3.2
, 4
3.7
)6
5.6
(54
.3,
75
.4)
1.8
(0.5
, 5
.8)
Co
lle
ge
or
Un
ive
rsit
y +
88
.7(8
0.2
, 9
3.8
)3
4.5
(26
.0,
44
.1)
26
.4(1
6.0
, 4
0.2
)6
9.0
(52
.9,
81
.6)
4.6
(1.1
, 1
7.6
)
Em
plo
yed
76
.0(6
8.5
, 8
2.1
)2
9.1
(24
.6,
34
.0)
26
.2(2
0.3
, 3
3.1
)7
1.6
(64
.8,
77
.6)
2.2
(1.1
, 4
.4)
Se
lf-e
mp
loye
d7
0.1
(64
.2,
75
.4)
26
.0(2
1.5
, 3
1.0
)3
1.5
(24
.1,
39
.8)
66
.2(5
7.9
, 7
3.7
)2
.3(1
.1,
4.9
)
Stu
de
nts
83
.7(7
1.3
, 9
1.3
)3
1.0
(19
.4,
45
.8)
--
--
--
Ho
me
ma
ke
rs4
9.5
(31
.4,
67
.7)
19
.0(9
.1,
35
.3)
--
--
--
Un
-em
plo
yed
66
.9(5
7.8
, 7
4.9
)2
3.4
(16
.3,
32
.5)
33
.0(1
7.3
, 5
3.8
)5
7.7
(38
.3,
75
.0)
9.3
(2.7
, 2
7.7
)
Ta
ble
8.2
: P
erc
en
tag
e o
f cu
rre
nt
sm
ok
ers
≥1
5 y
ea
rs o
ld w
ho
no
tice
d h
ea
lth
wa
rnin
gs
on
cig
are
tte
pa
cka
ge
s a
nd
co
ns
ide
red
qu
itti
ng
be
cau
se
of
the
wa
rnin
g l
ab
els
du
rin
g t
he
la
st
30
da
ys,
by
se
lect
ed
de
mo
gra
ph
ic c
ha
ract
eri
sti
cs –
GA
TS
In
do
ne
sia
, 2
01
1. W
arn
ing
la
be
ls l
ed
to
th
ink
ab
ou
t q
uit
tin
g3
A l
ot
Th
ou
gh
t a
bo
ut
qu
itti
ng
be
cau
se o
f w
arn
ing
lab
el2
No
tice
d h
ea
lth
wa
rnin
gs
on
cig
are
tte
pa
cka
ge
2D
on
't K
no
wA
lit
tle
-- I
nd
ica
tor
es
tim
ate
ba
se
d o
n l
es
s t
ha
n 2
5 u
n-w
eig
hte
d c
as
es
an
d h
as
be
en
su
pp
res
se
d.
3 In
clu
de
s r
es
pn
de
nts
wh
o t
ho
ug
ht
ab
ou
t q
utt
ing
be
cas
e o
f w
arn
ing
la
be
l
2 D
uri
ng
th
e l
as
t 3
0 d
ays
.
1 I
ncl
ud
es
da
ily
an
d o
cca
sio
na
l(le
ss
th
an
da
ily)
sm
ok
ers
.
Cu
rre
nt
smo
ke
rs1 w
ho
…
Pe
rce
nta
ge
(95
% C
I)
De
mo
gra
ph
ic C
ha
ract
eri
stic
s
Occ
up
ati
on
/Wo
rk s
tatu
s
Re
sid
en
ce
Ed
uca
tio
n L
ev
el
Ag
e (
ye
ars
)
Ge
nd
er

76 Media
8.3. Marketing
8.3.1. Noticed cigarette marketing in various public places
Table 8.3 presents the distribution of adults aged 15 years and above who noticed cigarette marketing in the
past 30 days in public places and the media, such as in stores where cigarettes are sold, on television, radio,
billboards, posters, newspapers or magazines, internet, cinemas, public transport/stations, public walls and
banners; and cigarette promotion through free samples, sales, coupons, free gifts, etc. The percentage of
people who noticed any cigarette advertisement, sponsorship or promotion was 84.6%. Men, people in the
younger age group (15–24 years) and people living in urban areas were more likely to notice cigarette
marketing as compared to their counterparts.
The commonest site for noticing cigarette advertisements was on television (66.3%), followed by banners
(47.7%), stores (45.6%), posters (42.3%), billboards (39.6%), public walls (16.1%), public transport
vehicles/stations (13.5%), and newspapers or magazines (10.1%). The percentage of adults who noticed sports
sponsorships was 32.1%. The most common type of promotion noticed was clothing and other items with the
brand name or logo (29.5%). Other promotional activities noticed were free samples (5.6%), mail promoting
cigarettes (5.0%) and sale prices (4.6%).
8.3.2. Noticed white cigarette marketing in various public places
Table 8.3A presents the distribution of adults aged 15 years and above who noticed white cigarette marketing
in the past 30 days in several locations as described in the table. The percentage of people who noticed any
white cigarette advertisement, sponsorship or promotion was 40.9%. It did not differ substantially by gender
or age; however, people in urban areas noticed white cigarette advertisements and marketing more than
people in urban areas.
The most common site of noticing white cigarette advertisements was on television (27.5%), followed by
stores (16.6%), banners (16.0%), posters (15.9%), billboards (15.7%), newspapers or magazines (5.2%), public
transport vehicles/stations (5.0%) and public walls (4.5%). The percentage of adults who noticed sports
sponsorships was 8.5%. The most common type of promotion noticed was clothing and other items with the
brand name or logo (7.8%). Other promotional activities noticed were mail promoting cigarettes (2.5%), free
samples (1.8%) and sale prices (1.2%).
8.3.3. Noticed kretek cigarette marketing in various public places
Table 8.3B presents the distribution of adults aged 15 years and above who noticed kretek cigarette marketing
in the past 30 days in different locations, as indicated in the table. The percentage of adults who noticed any
kretek cigarette advertisement, sponsorship or promotion was 84.2%. Men, people in the younger age group
(15–24 years) and people living in urban areas were more likely to notice kretek cigarette marketing as
compared to their counterparts.
The most common site of noticing kretek cigarette advertisements was on television (65.9%). Other sites were
banners (47.0%), stores (44.9%), posters (41.8%), billboards (38.8%), public walls (15.8%), public
transport/vehicles (13.1%), and newspapers or magazines (9.7%). The percentage of adults who noticed sports
sponsorships was 31.4%. The most common type of promotion noticed was clothing and other items with the
brand name or logo (28.9%). Other promotional activities noticed were free samples (5.0%), mail promoting
cigarettes (4.7%), sale prices (4.3%) and free gifts/discounts on other products (2.2%).

77 Media
In s
tore
s4
5.6
(40
.7,
50
.6)
53
.4(4
7.8
, 5
9.1
)3
7.8
(33
.4,
42
.4)
52
.8(4
6.9
, 5
8.7
)4
3.3
(38
.4,
48
.3)
51
.4(4
4.4
, 5
8.5
)3
9.7
(33
.0,
46
.8)
On
te
levi
sio
n6
6.3
(62
.5,
69
.9)
72
.3(6
8.4
, 7
5.9
)6
0.3
(56
.3,
64
.2)
77
.1(7
2.4
, 8
1.2
)6
2.9
(58
.9,
66
.6)
73
.9(6
8.8
, 7
8.5
)5
8.6
(52
.9,
64
.1)
On
th
e r
ad
io4
.6(3
.7,
5.8
)5
.5(4
.3,
7.1
)3
.7(2
.9,
4.7
)5
.5(3
.8,
7.9
)4
.3(3
.5,
5.3
)5
.6(4
.2,
7.4
)3
.6(2
.4,
5.2
)
On
bil
lbo
ard
s3
9.6
(35
.4,
44
.0)
48
.7(4
3.8
, 5
3.6
)3
0.6
(26
.8,
34
.7)
49
.5(4
3.2
, 5
5.8
)3
6.5
(32
.6,
40
.6)
50
.6(4
3.8
, 5
7.4
)2
8.6
(23
.6,
34
.2)
On
po
ste
rs4
2.3
(38
.2,
46
.5)
49
.6(4
5.0
, 5
4.2
)3
5.0
(31
.1,
39
.1)
52
.7(4
7.2
, 5
8.1
)3
9.0
(35
.1,
43
.0)
46
.3(3
9.9
, 5
2.9
)3
8.3
(33
.3,
43
.5)
In n
ew
sp
ap
ers
or
ma
ga
zin
es
10
.1(8
.2,
12
.2)
12
.3(9
.8,
15
.3)
7.8
(6.4
, 9
.6)
12
.6(9
.8,
16
.2)
9.2
(7.6
, 1
1.2
)1
4.3
(11
.0,
18
.3)
5.8
(4.4
, 7
.7)
In c
ine
ma
s0
.6(0
.3,
1.0
)0
.6(0
.3,
1.3
)0
.5(0
.3,
0.9
)1
.3(0
.6,
2.7
)0
.4(0
.2,
0.7
)1
.0(0
.5,
1.8
)0
.2(0
.1,
0.5
)
On
th
e i
nte
rne
t1
.9(1
.4,
2.5
)2
.4(1
.8,
3.2
)1
.4(0
.9,
2.1
)4
.2(3
.2,
5.6
)1
.1(0
.7,
1.8
)2
.9(2
.0,
4.0
)0
.9(0
.5,
1.4
)
On
pu
bli
c tr
an
sp
ort
ati
on
ve
hic
les
/sta
tio
ns
13
.5(1
0.9
, 1
6.6
)1
6.8
(13
.4,
20
.8)
10
.3(8
.1,
13
.0)
17
.7(1
3.5
, 2
2.8
)1
2.2
(9.9
, 1
4.9
)1
9.7
(15
.0,
25
.3)
7.4
(5.4
, 1
0.1
)
On
pu
bli
c w
all
s1
6.1
(12
.6,
20
.2)
20
.5(1
6.1
, 2
5.7
)1
1.7
(8.9
, 1
5.0
)2
1.5
(16
.8,
27
.2)
14
.3(1
1.2
, 1
8.2
)2
1.7
(16
.1,
28
.6)
10
.4(6
.9,
15
.3)
On
ba
nn
ers
47
.7(4
3.4
, 5
2.2
)5
6.5
(51
.3,
61
.5)
39
.1(3
5.0
, 4
3.3
)5
4.9
(49
.0,
60
.6)
45
.5(4
1.2
, 4
9.8
)5
4.2
(47
.8,
60
.5)
41
.2(3
5.2
, 4
7.5
)
So
me
wh
ere
els
e7
.9(5
.9,
10
.6)
9.5
(7.0
, 1
2.7
)6
.4(4
.7,
8.7
)1
0.6
(7.7
, 1
4.6
)7
.1(5
.2,
9.6
)9
.2(6
.4,
13
.0)
6.7
(4.0
, 1
0.9
)
No
tice
d s
po
rts
sp
on
so
rsh
ip3
2.1
(28
.3,
36
.2)
44
.5(3
9.6
, 4
9.4
)1
9.8
(16
.5,
23
.6)
40
.0(3
4.5
, 4
5.7
)2
9.6
(26
.0,
33
.5)
39
.4(3
3.3
, 4
5.9
)2
4.8
(20
.4,
29
.7)
Mu
sic
/Fa
sh
ion
20
.2(1
7.3
, 2
3.4
)2
5.4
(21
.8,
29
.4)
15
.0(1
2.6
, 1
7.8
)3
1.6
(26
.6,
37
.1)
16
.5(1
4.1
, 1
9.4
)2
8.8
(24
.1,
34
.0)
11
.5(8
.4,
15
.6)
Fre
e s
am
ple
s5
.6(4
.7,
6.8
)7
.8(6
.4,
9.4
)3
.5(2
.7,
4.6
)6
.4(4
.6,
8.9
)5
.4(4
.5,
6.5
)7
.5(6
.0,
9.2
)3
.8(2
.7,
5.4
)
Sa
le p
rice
s4
.6(3
.8,
5.7
)5
.8(4
.7,
7.2
)3
.5(2
.6,
4.6
)5
.8(4
.5,
7.4
)4
.3(3
.4,
5.4
)6
.5(5
.1,
8.3
)2
.7(1
.8,
4.1
)
Co
up
on
s1
.1(0
.8,
1.7
)1
.5(1
.0,
2.3
)0
.8(0
.5,
1.2
)1
.5(0
.9,
2.7
)1
.0(0
.7,
1.6
)1
.6(1
.0,
2.6
)0
.7(0
.3,
1.3
)
Fre
e g
ifts
/dis
cou
nts
on
oth
er
pro
du
cts
2.5
(1.9
, 3
.3)
2.9
(2.2
, 3
.8)
2.1
(1.4
, 3
.1)
2.5
(1.6
, 3
.7)
2.5
(1.8
, 3
.4)
2.5
(1.7
, 3
.8)
2.4
(1.6
, 3
.6)
Clo
thin
g/i
tem
wit
h b
ran
d n
am
e o
r lo
go
29
.6(2
5.9
, 3
3.5
)3
5.5
(31
.0,
40
.2)
23
.7(2
0.5
, 2
7.2
)3
6.9
(31
.9,
42
.1)
27
.2(2
3.7
, 3
1.1
)3
4.9
(29
.3,
40
.9)
24
.2(1
9.6
, 2
9.5
)
Ma
il p
rom
oti
ng
cig
are
tte
s5
.0(3
.3,
7.4
)6
.4(4
.2,
9.6
)3
.6(2
.4,
5.4
)7
.5(4
.9,
11
.5)
4.2
(2.8
, 6
.2)
7.2
(4.3
, 1
2.0
)2
.7(1
.7,
4.3
)
No
tice
d a
ny
ad
ve
rtis
em
en
t, s
po
nso
rsh
ip o
r p
rom
oti
on
84
.6(8
2.1
, 8
6.8
)9
1.1
(88
.8,
92
.9)
78
.2(7
5.1
, 8
0.9
)9
3.6
(90
.9,
95
.6)
81
.7(7
9.1
, 8
4.1
)8
9.7
(87
.0,
91
.9)
79
.5(7
5.2
, 8
3.1
)N
ote
: In
clu
de
s b
oth
wh
ite
an
d k
rete
k c
iga
rett
es
.
Ta
ble
8.3
: P
erc
en
tag
e o
f a
du
lts
≥1
5 y
ea
rs o
ld w
ho
no
tice
d c
iga
rett
e m
ark
eti
ng
du
rin
g t
he
la
st
30
da
ys i
n v
ari
ou
s p
lace
s,
by
se
lect
ed
de
mo
gra
ph
ic c
ha
ract
eri
sti
cs –
GA
TS
Ind
on
es
ia,
20
11
.
Ru
ral
Pe
rce
nta
ge
(9
5%
CI)
Pla
ces
Ov
era
ll
Ge
nd
er
Ag
e(y
ea
rs)
Re
sid
en
ceM
ale
Fe
ma
le1
5-2
4≥
25
Urb
an
No
tice
d c
iga
rett
e p
rom
oti
on
s
No
tice
d a
dv
ert
ise
me
nts

78 Media
In s
tore
s1
6.6
(12
.8,
21
.3)
20
.0(1
5.4
, 2
5.5
)1
3.2
(10
.0,
17
.3)
20
.2(1
5.0
, 2
6.5
)1
5.5
(11
.8,
19
.9)
21
.7(1
5.6
, 2
9.3
)1
1.5
(7.4
, 1
7.4
)
On
te
levi
sio
n2
7.5
(22
.1,
33
.6)
29
.9(2
4.2
, 3
6.3
)2
5.0
(19
.7,
31
.3)
31
.7(2
5.0
, 3
9.3
)2
6.1
(20
.9,
32
.1)
36
.8(2
7.8
, 4
6.8
)1
8.0
(12
.8,
24
.9)
On
th
e r
ad
io1
.8(1
.2,
2.5
)2
.1(1
.4,
3.2
)1
.4(1
.0,
2.1
)2
.0(1
.1,
3.3
)1
.7(1
.2,
2.5
)2
.9(1
.9,
4.3
)0
.7(0
.3,
1.3
)
On
bil
lbo
ard
s1
5.7
(12
.3,
19
.9)
19
.3(1
5.3
, 2
4.1
)1
2.2
(9.2
, 1
5.9
)2
0.0
(15
.0,
26
.3)
14
.4(1
1.3
, 1
8.2
)2
4.6
(18
.2,
32
.3)
6.8
(4.9
, 9
.5)
On
po
ste
rs1
5.9
(12
.3,
20
.5)
19
.0(1
4.7
, 2
4.1
)1
2.9
(9.6
, 1
7.1
)2
0.5
(15
.1,
27
.3)
14
.5(1
1.1
, 1
8.6
)2
1.3
(15
.3,
28
.8)
10
.5(6
.8,
16
.1)
In n
ew
sp
ap
ers
or
ma
ga
zin
es
5.2
(3.8
, 7
.2)
6.3
(4.5
, 8
.9)
4.1
(2.9
, 5
.7)
5.6
(3.4
, 9
.1)
5.1
(3.8
, 6
.9)
8.4
(5.7
, 1
2.1
)2
.1(1
.2,
3.4
)
In c
ine
ma
s0
.3(0
.1,
0.7
)0
.3(0
.1,
0.8
)0
.3(0
.1,
0.6
)0
.7(0
.2,
2.1
)0
.2(0
.0,
0.5
)0
.5(0
.2,
1.3
)0
.0(0
.0,
0.2
)
On
th
e i
nte
rne
t1
.3(0
.9,
1.9
)1
.6(1
.1,
2.3
)1
.0(0
.6,
1.7
)2
.5(1
.7,
3.7
)0
.9(0
.6,
1.5
)2
.1(1
.3,
3.2
)0
.5(0
.3,
1.0
)
On
pu
bli
c tr
an
sp
ort
ati
on
ve
hic
les
/sta
tio
ns
5.0
(3.1
, 7
.9)
6.4
(4.0
, 1
0.3
)3
.6(2
.3,
5.7
)6
.3(3
.4,
11
.5)
4.6
(3.0
, 7
.1)
8.5
(5.0
, 1
4.2
)1
.5(0
.8,
2.7
)
On
pu
bli
c w
all
s4
.5(3
.0,
6.7
)5
.7(3
.8,
8.6
)3
.3(2
.1,
5.2
)6
.1(3
.9,
9.4
)4
.0(2
.6,
6.1
)6
.5(4
.0,
10
.3)
2.5
(1.2
, 5
.4)
On
ba
nn
ers
16
.0(1
2.2
, 2
0.6
)1
8.3
(13
.9,
23
.8)
13
.6(1
0.2
, 1
7.8
)1
8.5
(13
.4,
25
.0)
15
.1(1
1.6
, 1
9.5
)2
2.6
(16
.3,
30
.4)
9.3
(5.8
, 1
4.5
)
So
me
wh
ere
els
e2
.1(1
.3,
3.4
)2
.3(1
.4,
3.9
)1
.8(1
.1,
3.0
)2
.5(1
.5,
4.2
)1
.9(1
.1,
3.2
)2
.8(1
.8,
4.6
)1
.3(0
.4,
4.1
)
No
tice
d s
po
rts
sp
on
so
rsh
ip8
.5(6
.2,
11
.4)
10
.9(8
.1,
14
.5)
6.1
(4.1
, 8
.9)
10
.5(7
.2,
15
.2)
7.8
(5.8
, 1
0.6
)1
3.0
(9.0
, 1
8.4
)3
.9(2
.5,
6.2
)
Mu
sic
/Fa
sh
ion
6.1
(4.3
, 8
.6)
7.4
(5.2
, 1
0.5
)4
.7(3
.3,
6.8
)9
.6(6
.6,
13
.8)
5.0
(3.4
, 7
.2)
9.4
(6.5
, 1
3.5
)2
.7(1
.1,
6.4
)
Fre
e s
am
ple
s1
.8(1
.2,
2.7
)2
.4(1
.6,
3.6
)1
.1(0
.7,
1.8
)1
.1(0
.6,
2.1
)2
.0(1
.3,
3.0
)2
.6(1
.7,
4.1
)0
.9(0
.3,
2.3
)
Sa
le p
rice
s1
.2(0
.8,
1.9
)1
.6(1
.0,
2.5
)0
.8(0
.5,
1.4
)1
.0(0
.6,
1.8
)1
.3(0
.8,
2.0
)1
.7(1
.2,
2.6
)0
.7(0
.2,
2.1
)
Co
up
on
s0
.2(0
.1,
0.4
)0
.2(0
.1,
0.5
)0
.2(0
.1,
0.5
)0
.3(0
.1,
0.8
)0
.2(0
.1,
0.4
)0
.3(0
.1,
0.5
)0
.2(0
.0,
0.6
)
Fre
e g
ifts
/dis
cou
nts
on
oth
er
pro
du
cts
0.7
(0.4
, 1
.1)
0.9
(0.6
, 1
.6)
0.4
(0.2
, 0
.9)
0.6
(0.2
, 1
.5)
0.7
(0.4
, 1
.2)
0.8
(0.5
, 1
.4)
0.6
(0.2
, 1
.4)
Clo
thin
g/i
tem
wit
h b
ran
d n
am
e o
r lo
go
7.8
(5.4
, 1
1.1
)9
.9(6
.8,
14
.2)
5.7
(3.9
, 8
.2)
9.9
(6.3
, 1
5.1
)7
.2(5
.0,
10
.2)
10
.5(6
.5,
16
.5)
5.1
(3.1
, 8
.4)
Ma
il p
rom
oti
ng
cig
are
tte
s2
.5(1
.3,
4.9
)3
.2(1
.6,
6.3
)1
.9(1
.0,
3.8
)3
.6(1
.7,
7.5
)2
.2(1
.1,
4.2
)4
.5(2
.1,
9.3
)0
.5(0
.3,
1.1
)
No
tice
d a
ny
ad
ve
rtis
em
en
t, s
po
nso
rsh
ip o
r p
rom
oti
on
40
.9(3
4.9
, 4
7.2
)4
5.9
(39
.4,
52
.5)
36
.0(3
0.1
, 4
2.4
)4
6.7
(39
.5,
54
.1)
39
.1(3
3.2
, 4
5.3
)5
1.1
(41
.6,
60
.6)
30
.7(2
3.7
, 3
8.6
)
Urb
an
Ru
ral
Pe
rce
nta
ge
(9
5%
CI)
Ta
ble
8.3
A:
Pe
rce
nta
ge
of
ad
ult
s ≥
15
ye
ars
old
wh
o n
oti
ced
wh
ite
cig
are
tte
ma
rke
tin
g d
uri
ng
th
e l
as
t 3
0 d
ays
in
va
rio
us
pla
ces
, b
y s
ele
cte
d d
em
og
rap
hic
ch
ara
cte
ris
tics
–
GA
TS
In
do
ne
sia
, 2
01
1.
Pla
ces
Ov
era
ll
Ge
nd
er
Ag
e(y
ea
rs)
Re
sid
en
ceM
ale
Fe
ma
le1
5-2
4≥
25
No
tice
d c
iga
rett
e p
rom
oti
on
s
No
tice
d a
dv
ert
ise
me
nts
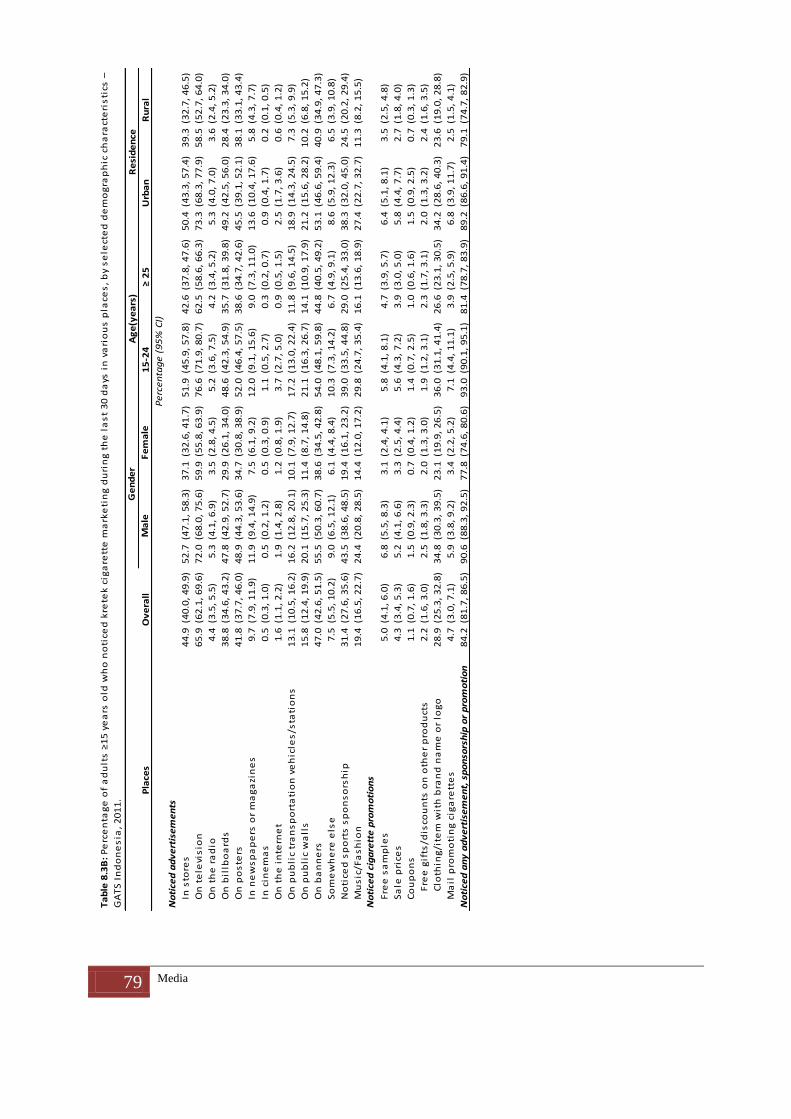
79 Media
In s
tore
s4
4.9
(40
.0,
49
.9)
52
.7(4
7.1
, 5
8.3
)3
7.1
(32
.6,
41
.7)
51
.9(4
5.9
, 5
7.8
)4
2.6
(37
.8,
47
.6)
50
.4(4
3.3
, 5
7.4
)3
9.3
(32
.7,
46
.5)
On
te
levi
sio
n6
5.9
(62
.1,
69
.6)
72
.0(6
8.0
, 7
5.6
)5
9.9
(55
.8,
63
.9)
76
.6(7
1.9
, 8
0.7
)6
2.5
(58
.6,
66
.3)
73
.3(6
8.3
, 7
7.9
)5
8.5
(52
.7,
64
.0)
On
th
e r
ad
io4
.4(3
.5,
5.5
)5
.3(4
.1,
6.9
)3
.5(2
.8,
4.5
)5
.2(3
.6,
7.5
)4
.2(3
.4,
5.2
)5
.3(4
.0,
7.0
)3
.6(2
.4,
5.2
)
On
bil
lbo
ard
s3
8.8
(34
.6,
43
.2)
47
.8(4
2.9
, 5
2.7
)2
9.9
(26
.1,
34
.0)
48
.6(4
2.3
, 5
4.9
)3
5.7
(31
.8,
39
.8)
49
.2(4
2.5
, 5
6.0
)2
8.4
(23
.3,
34
.0)
On
po
ste
rs4
1.8
(37
.7,
46
.0)
48
.9(4
4.3
, 5
3.6
)3
4.7
(30
.8,
38
.9)
52
.0(4
6.4
, 5
7.5
)3
8.6
(34
.7,
42
.6)
45
.5(3
9.1
, 5
2.1
)3
8.1
(33
.1,
43
.4)
In n
ew
sp
ap
ers
or
ma
ga
zin
es
9.7
(7.9
, 1
1.9
)1
1.9
(9.4
, 1
4.9
)7
.5(6
.1,
9.2
)1
2.0
(9.1
, 1
5.6
)9
.0(7
.3,
11
.0)
13
.6(1
0.4
, 1
7.6
)5
.8(4
.3,
7.7
)
In c
ine
ma
s0
.5(0
.3,
1.0
)0
.5(0
.2,
1.2
)0
.5(0
.3,
0.9
)1
.1(0
.5,
2.7
)0
.3(0
.2,
0.7
)0
.9(0
.4,
1.7
)0
.2(0
.1,
0.5
)
On
th
e i
nte
rne
t1
.6(1
.1,
2.2
)1
.9(1
.4,
2.8
)1
.2(0
.8,
1.9
)3
.7(2
.7,
5.0
)0
.9(0
.5,
1.5
)2
.5(1
.7,
3.6
)0
.6(0
.4,
1.2
)
On
pu
bli
c tr
an
sp
ort
ati
on
ve
hic
les
/sta
tio
ns
13
.1(1
0.5
, 1
6.2
)1
6.2
(12
.8,
20
.1)
10
.1(7
.9,
12
.7)
17
.2(1
3.0
, 2
2.4
)1
1.8
(9.6
, 1
4.5
)1
8.9
(14
.3,
24
.5)
7.3
(5.3
, 9
.9)
On
pu
bli
c w
all
s1
5.8
(12
.4,
19
.9)
20
.1(1
5.7
, 2
5.3
)1
1.4
(8.7
, 1
4.8
)2
1.1
(16
.3,
26
.7)
14
.1(1
0.9
, 1
7.9
)2
1.2
(15
.6,
28
.2)
10
.2(6
.8,
15
.2)
On
ba
nn
ers
47
.0(4
2.6
, 5
1.5
)5
5.5
(50
.3,
60
.7)
38
.6(3
4.5
, 4
2.8
)5
4.0
(48
.1,
59
.8)
44
.8(4
0.5
, 4
9.2
)5
3.1
(46
.6,
59
.4)
40
.9(3
4.9
, 4
7.3
)
So
me
wh
ere
els
e7
.5(5
.5,
10
.2)
9.0
(6.5
, 1
2.1
)6
.1(4
.4,
8.4
)1
0.3
(7.3
, 1
4.2
)6
.7(4
.9,
9.1
)8
.6(5
.9,
12
.3)
6.5
(3.9
, 1
0.8
)
No
tice
d s
po
rts
sp
on
so
rsh
ip3
1.4
(27
.6,
35
.6)
43
.5(3
8.6
, 4
8.5
)1
9.4
(16
.1,
23
.2)
39
.0(3
3.5
, 4
4.8
)2
9.0
(25
.4,
33
.0)
38
.3(3
2.0
, 4
5.0
)2
4.5
(20
.2,
29
.4)
Mu
sic
/Fa
sh
ion
19
.4(1
6.5
, 2
2.7
)2
4.4
(20
.8,
28
.5)
14
.4(1
2.0
, 1
7.2
)2
9.8
(24
.7,
35
.4)
16
.1(1
3.6
, 1
8.9
)2
7.4
(22
.7,
32
.7)
11
.3(8
.2,
15
.5)
Fre
e s
am
ple
s5
.0(4
.1,
6.0
)6
.8(5
.5,
8.3
)3
.1(2
.4,
4.1
)5
.8(4
.1,
8.1
)4
.7(3
.9,
5.7
)6
.4(5
.1,
8.1
)3
.5(2
.5,
4.8
)
Sa
le p
rice
s4
.3(3
.4,
5.3
)5
.2(4
.1,
6.6
)3
.3(2
.5,
4.4
)5
.6(4
.3,
7.2
)3
.9(3
.0,
5.0
)5
.8(4
.4,
7.7
)2
.7(1
.8,
4.0
)
Co
up
on
s1
.1(0
.7,
1.6
)1
.5(0
.9,
2.3
)0
.7(0
.4,
1.2
)1
.4(0
.7,
2.5
)1
.0(0
.6,
1.6
)1
.5(0
.9,
2.5
)0
.7(0
.3,
1.3
)
Fre
e g
ifts
/dis
cou
nts
on
oth
er
pro
du
cts
2.2
(1.6
, 3
.0)
2.5
(1.8
, 3
.3)
2.0
(1.3
, 3
.0)
1.9
(1.2
, 3
.1)
2.3
(1.7
, 3
.1)
2.0
(1.3
, 3
.2)
2.4
(1.6
, 3
.5)
Clo
thin
g/i
tem
wit
h b
ran
d n
am
e o
r lo
go
28
.9(2
5.3
, 3
2.8
)3
4.8
(30
.3,
39
.5)
23
.1(1
9.9
, 2
6.5
)3
6.0
(31
.1,
41
.4)
26
.6(2
3.1
, 3
0.5
)3
4.2
(28
.6,
40
.3)
23
.6(1
9.0
, 2
8.8
)
Ma
il p
rom
oti
ng
cig
are
tte
s4
.7(3
.0,
7.1
)5
.9(3
.8,
9.2
)3
.4(2
.2,
5.2
)7
.1(4
.4,
11
.1)
3.9
(2.5
, 5
.9)
6.8
(3.9
, 1
1.7
)2
.5(1
.5,
4.1
)
No
tice
d a
ny
ad
ve
rtis
em
en
t, s
po
nso
rsh
ip o
r p
rom
oti
on
84
.2(8
1.7
, 8
6.5
)9
0.6
(88
.3,
92
.5)
77
.8(7
4.6
, 8
0.6
)9
3.0
(90
.1,
95
.1)
81
.4(7
8.7
, 8
3.9
)8
9.2
(86
.6,
91
.4)
79
.1(7
4.7
, 8
2.9
)
Urb
an
Ru
ral
Pe
rce
nta
ge
(9
5%
CI)
Ta
ble
8.3
B:
Pe
rce
nta
ge
of
ad
ult
s ≥
15
ye
ars
old
wh
o n
oti
ced
kre
tek
cig
are
tte
ma
rke
tin
g d
uri
ng
th
e l
as
t 3
0 d
ays
in
va
rio
us
pla
ces
, b
y s
ele
cte
d d
em
og
rap
hic
ch
ara
cte
ris
tics
–
GA
TS
In
do
ne
sia
, 2
01
1.
Pla
ces
Ov
era
ll
Ge
nd
er
Ag
e(y
ea
rs)
Re
sid
en
ceM
ale
Fe
ma
le1
5-2
4≥
25
No
tice
d c
iga
rett
e p
rom
oti
on
s
No
tice
d a
dv
ert
ise
me
nts

80 Knowledge, Attitudes and Perceptions
9. Knowledge, Attitudes and Perceptions
Despite conclusive evidence on the dangers of tobacco use, relatively few tobacco users understand that
smoking harms nearly every organ of the body and causes many diseases. In addition, smoking affects the
health of both smokers and non-smokers. This chapter presents the perceptions and views of the overall
population aged 15 years and above about the hazards of smoking and its various dimensions, such as beliefs
about serious illnesses caused by smoking and using smokeless tobacco, and the adverse health effects caused
by exposure to second-hand smoke (SHS).
Key findings
o Over four in five people believe that smoking causes serious illness (86.0%) and lung cancer (84.7%).
o Less than half of the people believe that smoking causes premature birth (49.5%) and stroke (45.5%).
o Less than two in five people believe that smoking causes chronic obstructive pulmonary disease
(COPD, 36.0%).
o Less than three in ten people believe that smoking causes bladder cancer (27.7%), bone loss (20.4%)
and stomach cancer (18.5%).
o As many as 73.7% of adults believe that exposure to other people’s smoke causes serious illnesses in
non-smokers.
o Less than one fourth of people (23.9%) believe that smokeless tobacco use causes serious illnesses.
9.1. Beliefs about the ill effects of tobacco use
9.1.1. Beliefs about the ill effects of smoked tobacco use
The GATS collected information on general beliefs regarding the health effects of tobacco smoking as well as on causing various diseases among the population aged 15 years and above. Table 9.1 presents the percentage of adults who believe that smoking causes serious illness, stroke, heart attack or lung cancer by current smoking status and selected demographic characteristics. Table 9.1A presents the percentage of adults who believe that smoking causes other specific diseases such as chronic obstructive pulmonary disease (COPD), bladder cancer, stomach cancer, premature birth or bone loss.
Table 9.1 shows that a majority of the overall population believes that smoking causes serious illness, heart attack and lung cancer (86.0%, 81.5% and 84.7%, respectively). However, fewer people feel that smoking can cause stroke (45.5%). These fIgures are similar when considered by various demographic characteristics. There is no difference in perceptions between men and women. However, the 65+ years age group, and people with less than primary school level of education have lesser awareness of the ill effects of smoking as compared to others. By occupation, students are the most aware that smoking causes serious illness (97.0%), heart attack (95.5%) and lung cancer (95.7), and 61.5% of them are also aware that smoking causes stroke.
Among current smokers, the overall belief that smoking causes serious illness, stroke and heart attack (81.3%, 78.3% and 81.0%, respectively) shows the same trend and similar percentages as for the overall population. The least awareness is about stroke (40.0%). Men are more aware than women of the harmful effects of smoking on all these illnesses, and urban people are more aware than rural dwellers. Among other demographic groups, the 65+ year age group shows the least awareness, as do smokers with less than primary levels of education and the unemployed.

81 Knowledge, Attitudes and Perceptions
Non-smokers have a greater belief than smokers about the ill effects of smoking. Percentagesof those who believed that smoking causes serious illness, heart attack and lung cancer are 88.5%, 83.1% and 86.7%, respectively. Percentages for the younger age group (15–24 years), college or university graduates and those employed are highest among their respective demographic groups.
Table 9.1A gives the details of those who believe than smoking causes COPD, bladder cancer, stomach cancer, premature birth or bone loss, separately for the overall population, smokers and non-smokers. The awareness levels regarding these diseases is much less than the ones described earlier, with overall percentage figures being COPD – 36.0%, bladder cancer – 27.7%, stomach cancer – 18.5%, premature birth – 49.5% and bone loss – 20.4%. Awareness levels by demographic characteristics follow a similar pattern as that for the earlier diseases. Men are more aware of the ill effects of smoking than women. The 15–24 years age group, urban populace, college or university graduates and the employed are the most aware among their respective demographic categories. The pattern and percentages are similar for smokers and for non-smokers.
9.1.2. Beliefs about the ill effects of smokeless tobacco use
Table 9.1B presents the percentage of adults aged 15 years and above who believe that using smokeless tobacco causes serious illness by the status of smokeless tobacco use. Overall, only 23.9% of adults believe that using smokeless tobacco causes serious illness. There is no significant difference in belief by gender and residence. The 65+ year’s age group has the least belief (14.4%) among all age groups. People with college and university level of education have the maximum belief (36.5%) and those with less than primary level education have the least (17.6%). The unemployed occupational group has the least awareness among all occupational groups (18.9%).
Among current users of smokeless tobacco, the percentage of men who believe that smokeless tobacco is harmful for health is 39.0% as against only 13.3% for women. By age group, the highest percentage with this belief is among those in the 25–44 years age group (30.5%) and the lowest in the 65+ year’s age group (3.4%). Urban and rural users of smokeless tobacco both have approximately 25% awareness levels. Those with less than primary levels of education and the unemployed have much lower levels of awareness than other demographic groups (11.5% and 1.5%, respectively). Among non-users of smokeless tobacco, the disparities are not wide. The overall awareness level is 23.9%, which is similar for men and women. Awareness level in the 65+ year age group is 15.4%, and for the 25–44 years age group it is 26.2%. Among those with less than primary level of education 17.9% have this belief while among those with college or university level education it is 36.6%. Here again, the unemployed have the least belief that use of smokeless tobacco is harmful (19.4%).
9.2. Beliefs about health effects of second-hand smoke
Table 9.2 presents the percentage of adults who believe that breathing other people’s smoke causes serious illness in non-smokers. Overall, 73.7% of people aged 15 years and above believe that breathing other people’s smoke can cause serious illness in non-smokers. An equal percentage of men and women believe this; however, more people in urban areas believe this than people in rural areas (79.5% and 67.8%, respectively). A larger percentage of people in the younger age groups (15–24 years and 25–44 years) believe this (approximately 80.0%) than those in the older age groups (45–64 years and 65+ years (64.4% and 43.9%, respectively). People with a higher level of education (high school, college and university levels) believe this more than people with less education (less than primary and primary levels).
Among current smokers and non-smokers, a higher percentage of non-smokers than current smokers across all demographic groups believe that breathing other people’s smoke causes serious illness in non-smokers. In both these categories, the younger age groups have greater levels of awareness than the older age groups, and urban people are more aware than rural people. By educational level, in both these groups, those with less than primary education have less than 50.0% awareness, whereas college and university graduates average around 90%.

82 Knowledge, Attitudes and Perceptions
Figure. 9.1. Beliefs about health effects of smoking and second-hand smoke, by gender and age group – GATS
Indonesia, 2011
Note: All figures are in percentages.
86 85,7 86,3 93 89,2
80
61,4
73,7 74,1 73,3 82,8
78,3
64,4
43,9
0
20
40
60
80
100
Overall Men Women 15–24 25–44 45–64 65+
Smoking causes serious illness
Breathing other peoples smoke causes serious illness
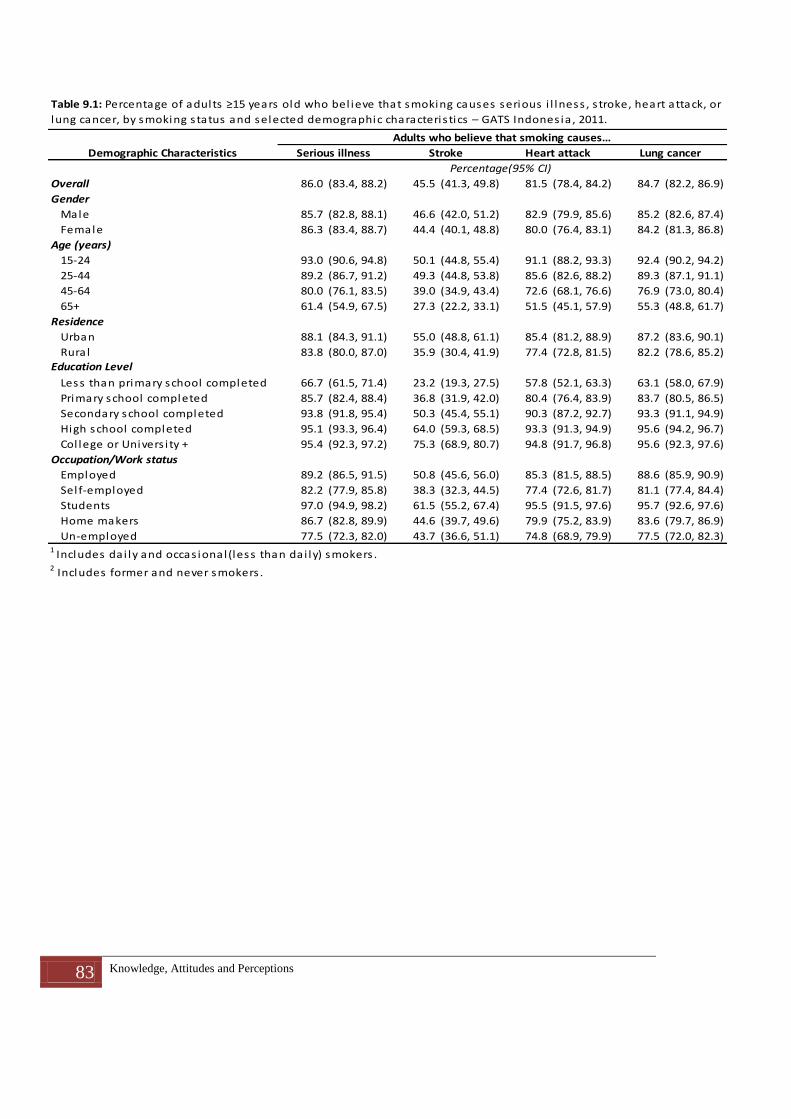
83 Knowledge, Attitudes and Perceptions
Overall 86.0 (83.4, 88.2) 45.5 (41.3, 49.8) 81.5 (78.4, 84.2) 84.7 (82.2, 86.9)
Male 85.7 (82.8, 88.1) 46.6 (42.0, 51.2) 82.9 (79.9, 85.6) 85.2 (82.6, 87.4)
Female 86.3 (83.4, 88.7) 44.4 (40.1, 48.8) 80.0 (76.4, 83.1) 84.2 (81.3, 86.8)
15-24 93.0 (90.6, 94.8) 50.1 (44.8, 55.4) 91.1 (88.2, 93.3) 92.4 (90.2, 94.2)
25-44 89.2 (86.7, 91.2) 49.3 (44.8, 53.8) 85.6 (82.6, 88.2) 89.3 (87.1, 91.1)
45-64 80.0 (76.1, 83.5) 39.0 (34.9, 43.4) 72.6 (68.1, 76.6) 76.9 (73.0, 80.4)
65+ 61.4 (54.9, 67.5) 27.3 (22.2, 33.1) 51.5 (45.1, 57.9) 55.3 (48.8, 61.7)
Urban 88.1 (84.3, 91.1) 55.0 (48.8, 61.1) 85.4 (81.2, 88.9) 87.2 (83.6, 90.1)
Rura l 83.8 (80.0, 87.0) 35.9 (30.4, 41.9) 77.4 (72.8, 81.5) 82.2 (78.6, 85.2)
Less than primary school completed 66.7 (61.5, 71.4) 23.2 (19.3, 27.5) 57.8 (52.1, 63.3) 63.1 (58.0, 67.9)
Primary school completed 85.7 (82.4, 88.4) 36.8 (31.9, 42.0) 80.4 (76.4, 83.9) 83.7 (80.5, 86.5)
Secondary school completed 93.8 (91.8, 95.4) 50.3 (45.4, 55.1) 90.3 (87.2, 92.7) 93.3 (91.1, 94.9)
High school completed 95.1 (93.3, 96.4) 64.0 (59.3, 68.5) 93.3 (91.3, 94.9) 95.6 (94.2, 96.7)
Col lege or Univers i ty + 95.4 (92.3, 97.2) 75.3 (68.9, 80.7) 94.8 (91.7, 96.8) 95.6 (92.3, 97.6)
Employed 89.2 (86.5, 91.5) 50.8 (45.6, 56.0) 85.3 (81.5, 88.5) 88.6 (85.9, 90.9)
Sel f-employed 82.2 (77.9, 85.8) 38.3 (32.3, 44.5) 77.4 (72.6, 81.7) 81.1 (77.4, 84.4)
Students 97.0 (94.9, 98.2) 61.5 (55.2, 67.4) 95.5 (91.5, 97.6) 95.7 (92.6, 97.6)
Home makers 86.7 (82.8, 89.9) 44.6 (39.7, 49.6) 79.9 (75.2, 83.9) 83.6 (79.7, 86.9)
Un-employed 77.5 (72.3, 82.0) 43.7 (36.6, 51.1) 74.8 (68.9, 79.9) 77.5 (72.0, 82.3)
Percentage(95% CI)
Table 9.1: Percentage of adults ≥15 years old who bel ieve that smoking causes serious i l lness , s troke, heart attack, or
lung cancer, by smoking s tatus and selected demographic characteris tics – GATS Indones ia , 2011.
Adults who believe that smoking causes…
Serious illness Stroke Heart attack Lung cancerDemographic Characteristics
Age (years)
Gender
1 Includes dai ly and occas ional (less than dai ly) smokers .2 Includes former and never smokers .
Occupation/Work status
Education Level
Residence

84 Knowledge, Attitudes and Perceptions
Current smokers 1 81.3 (77.8, 84.5) 40.0 (35.3, 45.0) 78.3 (74.5, 81.6) 81.0 (77.8, 83.9)
Male 81.7 (78.1, 84.8) 40.4 (35.6, 45.4) 78.7 (74.9, 82.1) 81.4 (78.2, 84.3)
Female 73.2 (64.1, 80.8) 29.7 (20.3, 41.1) 67.9 (55.8, 77.9) 70.8 (60.1, 79.7)
15-24 87.3 (82.5, 90.9) 37.3 (30.6, 44.7) 86.3 (81.5, 90.0) 88.1 (83.5, 91.6)
25-44 85.5 (82.0, 88.5) 44.5 (39.3, 50.0) 83.4 (79.5, 86.7) 86.3 (83.2, 89.0)
45-64 74.8 (69.6, 79.4) 36.8 (31.4, 42.5) 70.1 (64.7, 75.0) 72.8 (68.2, 77.0)
65+ 59.6 (51.0, 67.7) 26.3 (19.1, 35.1) 50.6 (42.6, 58.5) 54.5 (45.7, 63.1)
Urban 83.6 (78.9, 87.5) 48.7 (41.9, 55.5) 82.5 (77.7, 86.5) 84.3 (80.0, 87.8)
Rura l 79.4 (74.0, 83.9) 32.6 (26.1, 39.9) 74.7 (68.9, 79.7) 78.3 (73.4, 82.4)
Less than primary school completed 64.4 (58.0, 70.4) 22.0 (17.3, 27.4) 57.6 (50.4, 64.4) 62.5 (56.1, 68.4)
Primary school completed 81.2 (75.8, 85.6) 33.7 (28.1, 39.9) 78.6 (72.9, 83.4) 79.2 (73.8, 83.6)
Secondary school completed 88.8 (84.7, 91.8) 43.4 (36.9, 50.1) 85.5 (80.6, 89.3) 90.3 (86.5, 93.1)
High school completed 91.7 (88.7, 93.9) 57.7 (51.5, 63.8) 90.5 (87.2, 93.1) 92.5 (89.7, 94.7)
Col lege or Univers i ty + 88.3 (79.5, 93.6) 68.9 (58.5, 77.7) 92.3 (86.9, 95.6) 93.1 (87.1, 96.4)
Employed 85.6 (81.6, 88.9) 45.1 (39.0, 51.4) 82.1 (77.1, 86.3) 85.9 (81.8, 89.1)
Sel f-employed 78.8 (73.7, 83.2) 35.6 (29.7, 42.0) 75.7 (70.4, 80.3) 77.6 (72.8, 81.7)
Students 92.0 (82.6, 96.6) 46.9 (33.6, 60.8) 93.3 (83.1, 97.5) 96.5 (87.8, 99.1)
Home makers 83.3 (73.0, 90.1) 39.6 (25.2, 56.2) 77.3 (62.1, 87.5) 75.4 (61.5, 85.5)
Un-employed 70.7 (62.5, 77.7) 40.3 (30.5, 50.8) 68.9 (59.1, 77.3) 73.5 (64.5, 80.9)
2 Includes former and never smokers .
1 Includes dai ly and occas ional (less than dai ly) smokers .
Percentage(95% CI)
Table 9.1 (cont): Percentage of adults ≥15 years old who bel ieve that smoking causes serious i l lness , s troke, heart
attack, or lung cancer, by smoking s tatus and selected demographic characteris tics – GATS Indones ia , 2011.
Adults who believe that smoking causes…
Serious illness Stroke Heart attack Lung cancerDemographic Characteristics
Occupation/Work status
Education Level
Residence
Age (years)
Gender

85 Knowledge, Attitudes and Perceptions
Non-smokers 2 88.5 (86.0, 90.5) 48.4 (44.1, 52.8) 83.1 (80.0, 85.8) 86.7 (84.1, 88.8)
Male 93.9 (91.9, 95.4) 59.2 (54.1, 64.1) 91.6 (89.1, 93.5) 92.8 (90.7, 94.4)
Female 86.6 (83.7, 89.1) 44.8 (40.5, 49.2) 80.3 (76.7, 83.5) 84.6 (81.6, 87.2)
15-24 95.0 (92.9, 96.5) 54.6 (48.9, 60.2) 92.8 (89.8, 94.9) 93.9 (91.6, 95.7)
25-44 91.4 (88.9, 93.4) 52.1 (47.4, 56.8) 87.0 (83.8, 89.7) 91.0 (88.8, 92.8)
45-64 83.4 (79.7, 86.6) 40.5 (36.3, 44.8) 74.2 (69.4, 78.5) 79.6 (75.3, 83.3)
65+ 62.2 (54.7, 69.1) 27.8 (21.8, 34.7) 51.9 (44.3, 59.5) 55.7 (47.9, 63.1)
Urban 90.3 (86.4, 93.1) 58.0 (51.6, 64.1) 86.8 (82.3, 90.3) 88.6 (84.9, 91.5)
Rura l 86.5 (83.2, 89.2) 37.9 (32.3, 43.9) 79.1 (74.6, 83.0) 84.5 (81.0, 87.5)
Less than primary school completed 68.0 (62.5, 73.1) 23.9 (19.5, 29.0) 57.9 (51.8, 63.8) 63.5 (57.8, 68.8)
Primary school completed 88.3 (85.5, 90.7) 38.6 (33.3, 44.2) 81.5 (77.5, 85.0) 86.4 (83.4, 88.9)
Secondary school completed 96.2 (94.4, 97.5) 53.5 (48.1, 58.8) 92.5 (89.4, 94.8) 94.7 (92.2, 96.4)
High school completed 96.8 (95.0, 97.9) 67.2 (62.3, 71.8) 94.8 (92.6, 96.4) 97.2 (95.6, 98.2)
Col lege or Univers i ty + 98.1 (96.0, 99.1) 77.7 (70.9, 83.3) 95.8 (92.3, 97.7) 96.6 (92.8, 98.4)
Employed 92.4 (90.0, 94.3) 55.9 (49.9, 61.6) 88.1 (84.4, 91.0) 91.1 (88.3, 93.3)
Sel f-employed 85.6 (81.2, 89.1) 40.9 (34.2, 48.0) 79.2 (74.0, 83.6) 84.7 (80.9, 88.0)
Students 97.8 (95.7, 98.9) 63.9 (57.5, 69.9) 95.8 (91.9, 97.9) 95.6 (91.9, 97.7)
Home makers 86.8 (82.8, 90.0) 44.7 (39.7, 49.8) 79.9 (75.1, 84.0) 83.9 (79.8, 87.2)
Un-employed 80.7 (74.9, 85.4) 45.3 (37.6, 53.3) 77.6 (70.9, 83.1) 79.4 (72.5, 85.0)
2 Includes former and never smokers .
1 Includes dai ly and occas ional (less than dai ly) smokers .
Percentage(95% CI)
Table 9.1 (cont): Percentage of adults ≥15 years old who bel ieve that smoking causes serious i l lness , s troke, heart
attack, or lung cancer, by smoking s tatus and selected demographic characteris tics – GATS Indones ia , 2011.
Adults who believe that smoking causes…
Serious illness Stroke Heart attack Lung cancerDemographic Characteristics
Occupation/Work status
Education Level
Residence
Age (years)
Gender
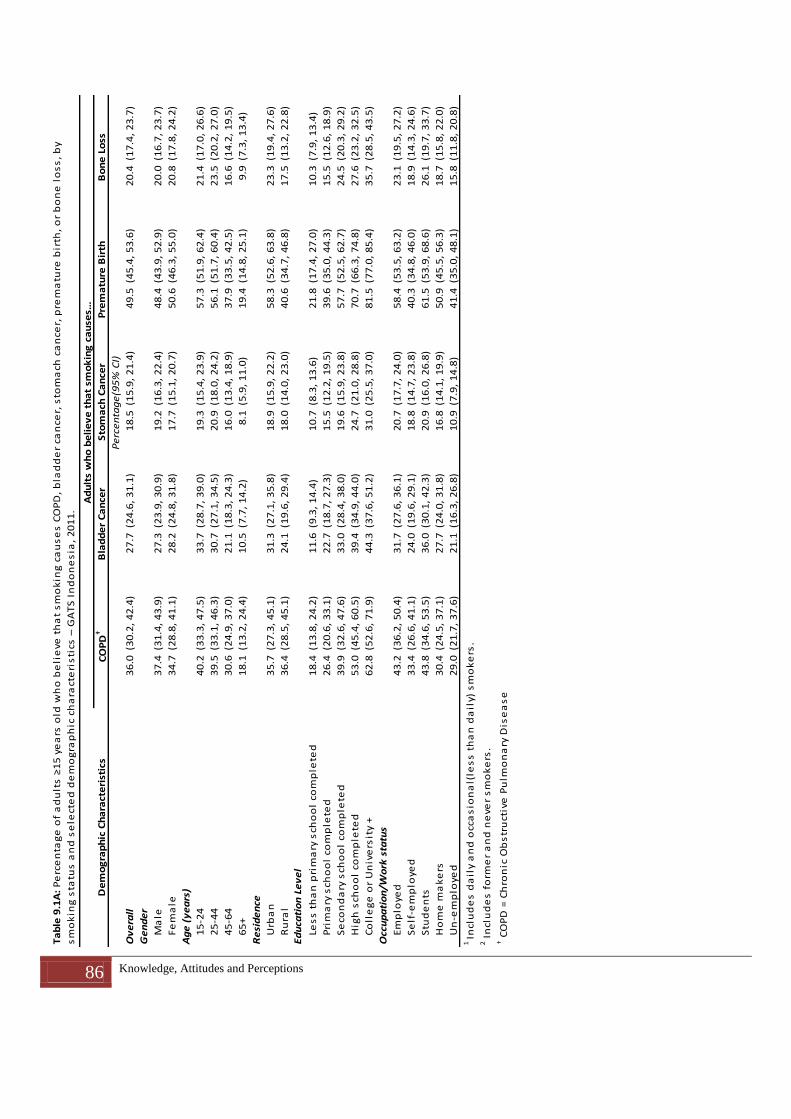
86 Knowledge, Attitudes and Perceptions
Ov
era
ll3
6.0
(30
.2,
42
.4)
27
.7(2
4.6
, 3
1.1
)1
8.5
(15
.9,
21
.4)
49
.5(4
5.4
, 5
3.6
)2
0.4
(17
.4,
23
.7)
Ma
le3
7.4
(31
.4,
43
.9)
27
.3(2
3.9
, 3
0.9
)1
9.2
(16
.3,
22
.4)
48
.4(4
3.9
, 5
2.9
)2
0.0
(16
.7,
23
.7)
Fe
ma
le3
4.7
(28
.8,
41
.1)
28
.2(2
4.8
, 3
1.8
)1
7.7
(15
.1,
20
.7)
50
.6(4
6.3
, 5
5.0
)2
0.8
(17
.8,
24
.2)
15
-24
40
.2(3
3.3
, 4
7.5
)3
3.7
(28
.7,
39
.0)
19
.3(1
5.4
, 2
3.9
)5
7.3
(51
.9,
62
.4)
21
.4(1
7.0
, 2
6.6
)
25
-44
39
.5(3
3.1
, 4
6.3
)3
0.7
(27
.1,
34
.5)
20
.9(1
8.0
, 2
4.2
)5
6.1
(51
.7,
60
.4)
23
.5(2
0.2
, 2
7.0
)
45
-64
30
.6(2
4.9
, 3
7.0
)2
1.1
(18
.3,
24
.3)
16
.0(1
3.4
, 1
8.9
)3
7.9
(33
.5,
42
.5)
16
.6(1
4.2
, 1
9.5
)
65
+1
8.1
(13
.2,
24
.4)
10
.5(7
.7,
14
.2)
8.1
(5.9
, 1
1.0
)1
9.4
(14
.8,
25
.1)
9.9
(7.3
, 1
3.4
)
Urb
an
35
.7(2
7.3
, 4
5.1
)3
1.3
(27
.1,
35
.8)
18
.9(1
5.9
, 2
2.2
)5
8.3
(52
.6,
63
.8)
23
.3(1
9.4
, 2
7.6
)
Ru
ral
36
.4(2
8.5
, 4
5.1
)2
4.1
(19
.6,
29
.4)
18
.0(1
4.0
, 2
3.0
)4
0.6
(34
.7,
46
.8)
17
.5(1
3.2
, 2
2.8
)
Les
s t
ha
n p
rim
ary
sch
oo
l co
mp
lete
d1
8.4
(13
.8,
24
.2)
11
.6(9
.3,
14
.4)
10
.7(8
.3,
13
.6)
21
.8(1
7.4
, 2
7.0
)1
0.3
(7.9
, 1
3.4
)
Pri
ma
ry s
cho
ol
com
ple
ted
26
.4(2
0.6
, 3
3.1
)2
2.7
(18
.7,
27
.3)
15
.5(1
2.2
, 1
9.5
)3
9.6
(35
.0,
44
.3)
15
.5(1
2.6
, 1
8.9
)
Se
con
da
ry s
cho
ol
com
ple
ted
39
.9(3
2.6
, 4
7.6
)3
3.0
(28
.4,
38
.0)
19
.6(1
5.9
, 2
3.8
)5
7.7
(52
.5,
62
.7)
24
.5(2
0.3
, 2
9.2
)
Hig
h s
cho
ol
com
ple
ted
53
.0(4
5.4
, 6
0.5
)3
9.4
(34
.9,
44
.0)
24
.7(2
1.0
, 2
8.8
)7
0.7
(66
.3,
74
.8)
27
.6(2
3.2
, 3
2.5
)
Co
lle
ge
or
Un
ive
rsit
y +
62
.8(5
2.6
, 7
1.9
)4
4.3
(37
.6,
51
.2)
31
.0(2
5.5
, 3
7.0
)8
1.5
(77
.0,
85
.4)
35
.7(2
8.5
, 4
3.5
)
Em
plo
yed
43
.2(3
6.2
, 5
0.4
)3
1.7
(27
.6,
36
.1)
20
.7(1
7.7
, 2
4.0
)5
8.4
(53
.5,
63
.2)
23
.1(1
9.5
, 2
7.2
)
Se
lf-e
mp
loye
d3
3.4
(26
.6,
41
.1)
24
.0(1
9.6
, 2
9.1
)1
8.8
(14
.7,
23
.8)
40
.3(3
4.8
, 4
6.0
)1
8.9
(14
.3,
24
.6)
Stu
de
nts
43
.8(3
4.6
, 5
3.5
)3
6.0
(30
.1,
42
.3)
20
.9(1
6.0
, 2
6.8
)6
1.5
(53
.9,
68
.6)
26
.1(1
9.7
, 3
3.7
)
Ho
me
ma
ke
rs3
0.4
(24
.5,
37
.1)
27
.7(2
4.0
, 3
1.8
)1
6.8
(14
.1,
19
.9)
50
.9(4
5.5
, 5
6.3
)1
8.7
(15
.8,
22
.0)
Un
-em
plo
yed
29
.0(2
1.7
, 3
7.6
)2
1.1
(16
.3,
26
.8)
10
.9(7
.9,
14
.8)
41
.4(3
5.0
, 4
8.1
)1
5.8
(11
.8,
20
.8)
Bo
ne
Lo
ss
Ad
ult
s w
ho
be
lie
ve
th
at
smo
kin
g c
au
ses…
Ta
ble
9.1
A:
Pe
rce
nta
ge
of
ad
ult
s ≥
15
ye
ars
old
wh
o b
eli
eve
th
at
sm
ok
ing
ca
us
es
CO
PD
, b
lad
de
r ca
nce
r, s
tom
ach
ca
nce
r, p
rem
atu
re b
irth
, o
r b
on
e l
os
s,
by
sm
ok
ing
sta
tus
an
d s
ele
cte
d d
em
og
rap
hic
ch
ara
cte
ris
tics
– G
AT
S I
nd
on
es
ia,
20
11
.
Pe
rce
nta
ge
(95
% C
I)C
OP
D†
Bla
dd
er
Ca
nce
rS
tom
ach
Ca
nce
rP
rem
atu
re B
irth
De
mo
gra
ph
ic C
ha
ract
eri
stic
s
† C
OP
D =
Ch
ron
ic O
bs
tru
ctiv
e P
ulm
on
ary
Dis
ea
se
Ag
e (
ye
ars
)
Ge
nd
er
1 In
clu
de
s d
ail
y a
nd
occ
as
ion
al(
les
s t
ha
n d
ail
y) s
mo
ke
rs.
2 I
ncl
ud
es
fo
rme
r a
nd
ne
ver
sm
ok
ers
.
Occ
up
ati
on
/Wo
rk s
tatu
s
Ed
uca
tio
n L
ev
el
Re
sid
en
ce

87 Knowledge, Attitudes and Perceptions
Cu
rre
nt
smo
ke
rs1
32
.7(2
7.0
, 3
8.9
)2
2.8
(19
.6,
26
.4)
16
.2(1
3.5
, 1
9.2
)4
2.1
(37
.5,
46
.8)
16
.8(1
3.8
, 2
0.2
)
Ma
le3
3.0
(27
.3,
39
.3)
23
.1(1
9.9
, 2
6.8
)1
6.4
(13
.8,
19
.5)
42
.6(3
8.0
, 4
7.4
)1
6.7
(13
.8,
20
.2)
Fe
ma
le2
3.9
(13
.8,
38
.2)
15
.2(8
.5,
25
.6)
9.6
(5.4
, 1
6.4
)2
8.9
(19
.5,
40
.6)
17
.4(9
.3,
30
.3)
15
-24
38
.5(3
0.4
, 4
7.2
)2
6.8
(20
.4,
34
.3)
17
.4(1
1.9
, 2
4.7
)4
5.0
(36
.6,
53
.7)
14
.4(9
.8,
20
.8)
25
-44
35
.7(2
9.6
, 4
2.3
)2
4.8
(21
.0,
29
.0)
17
.0(1
4.0
, 2
0.4
)4
9.2
(44
.4,
54
.0)
19
.0(1
5.7
, 2
2.9
)
45
-64
26
.7(2
0.9
, 3
3.5
)2
0.0
(16
.4,
24
.2)
16
.0(1
3.2
, 1
9.2
)3
4.2
(29
.2,
39
.6)
15
.7(1
2.6
, 1
9.5
)
65
+1
8.0
(12
.2,
25
.7)
8.4
(4.5
, 1
5.3
)7
.4(4
.3,
12
.4)
12
.7(7
.8,
20
.0)
10
.6(6
.2,
17
.5)
Urb
an
32
.0(2
3.6
, 4
1.8
)2
5.2
(20
.6,
30
.4)
15
.0(1
2.0
, 1
8.7
)4
9.7
(43
.3,
56
.2)
20
.3(1
6.6
, 2
4.7
)
Ru
ral
33
.3(2
6.0
, 4
1.4
)2
0.8
(16
.4,
26
.1)
17
.2(1
3.2
, 2
2.0
)3
5.6
(29
.3,
42
.5)
13
.7(9
.6,
19
.3)
Les
s t
ha
n p
rim
ary
sch
oo
l co
mp
lete
d1
8.3
(13
.3,
24
.8)
10
.2(7
.4,
14
.0)
10
.7(8
.0,
14
.2)
18
.9(1
3.9
, 2
5.1
)9
.9(6
.9,
14
.0)
Pri
ma
ry s
cho
ol
com
ple
ted
25
.4(1
9.5
, 3
2.4
)2
1.2
(16
.3,
27
.1)
15
.0(1
1.4
, 1
9.4
)3
4.1
(28
.7,
39
.9)
11
.7(8
.8,
15
.3)
Se
con
da
ry s
cho
ol
com
ple
ted
36
.7(2
9.3
, 4
4.8
)2
4.5
(19
.8,
30
.0)
16
.7(1
2.6
, 2
1.9
)5
1.1
(44
.5,
57
.7)
19
.2(1
4.6
, 2
4.7
)
Hig
h s
cho
ol
com
ple
ted
49
.7(4
0.9
, 5
8.4
)3
3.4
(28
.0,
39
.2)
21
.5(1
6.5
, 2
7.6
)6
2.9
(56
.1,
69
.2)
25
.0(1
9.3
, 3
1.7
)
Co
lle
ge
or
Un
ive
rsit
y +
51
.3(3
8.7
, 6
3.7
)3
7.7
(27
.9,
48
.7)
23
.1(1
4.7
, 3
4.4
)7
0.8
(61
.1,
78
.9)
32
.1(2
2.3
, 4
3.9
)
Em
plo
yed
37
.9(3
0.9
, 4
5.4
)2
5.9
(21
.7,
30
.7)
17
.8(1
4.6
, 2
1.6
)5
0.8
(45
.1,
56
.5)
20
.0(1
6.0
, 2
4.7
)
Se
lf-e
mp
loye
d2
9.6
(23
.5,
36
.5)
21
.2(1
7.4
, 2
5.6
)1
6.3
(12
.8,
20
.5)
36
.6(3
1.2
, 4
2.4
)1
5.2
(11
.6,
19
.6)
Stu
de
nts
44
.3(2
8.6
, 6
1.3
)2
4.4
(14
.3,
38
.5)
17
.3(9
.0,
30
.7)
50
.6(3
4.2
, 6
6.9
)1
4.9
(7.8
, 2
6.8
)
Ho
me
ma
ke
rs1
7.9
(8.1
, 3
5.0
)1
5.9
(5.8
, 3
6.6
)1
1.9
(4.5
, 2
8.0
)3
7.8
(22
.9,
55
.3)
17
.4(8
.2,
33
.4)
Un
-em
plo
yed
24
.9(1
6.2
, 3
6.2
)1
8.5
(12
.4,
26
.6)
7.1
(3.4
, 1
4.1
)3
1.2
(22
.7,
41
.2)
10
.7(5
.8,
18
.9)
Ge
nd
er
† C
OP
D =
Ch
ron
ic O
bs
tru
ctiv
e P
ulm
on
ary
Dis
ea
se
2 I
ncl
ud
es
fo
rme
r a
nd
ne
ver
sm
ok
ers
.
1 In
clu
de
s d
ail
y a
nd
occ
as
ion
al(
les
s t
ha
n d
ail
y) s
mo
ke
rs.
Pe
rce
nta
ge
(95
% C
I)
Ta
ble
9.1
A (
con
t):
Pe
rce
nta
ge
of
ad
ult
s ≥
15
ye
ars
old
wh
o b
eli
eve
th
at
sm
ok
ing
ca
us
es
CO
PD
, b
lad
de
r ca
nce
r, s
tom
ach
ca
nce
r, p
rem
atu
re b
irth
, o
r b
on
e l
os
s,
by
sm
ok
ing
sta
tus
an
d s
ele
cte
d d
em
og
rap
hic
ch
ara
cte
ris
tics
– G
AT
S I
nd
on
es
ia,
20
11
.
Ad
ult
s w
ho
be
lie
ve
th
at
smo
kin
g c
au
ses…
CO
PD
†B
lad
de
r C
an
cer
Sto
ma
ch C
an
cer
Pre
ma
ture
Bir
thB
on
e L
oss
De
mo
gra
ph
ic C
ha
ract
eri
stic
s
Occ
up
ati
on
/Wo
rk s
tatu
s
Ed
uca
tio
n L
ev
el
Re
sid
en
ce
Ag
e (
ye
ars
)

88 Knowledge, Attitudes and Perceptions
No
n-s
mo
ke
rs2
37
.8(3
1.7
, 4
4.4
)3
0.3
(27
.0,
33
.9)
19
.7(1
6.9
, 2
2.8
)5
3.4
(49
.1,
57
.7)
22
.3(1
9.0
, 2
6.0
)
Ma
le4
6.4
(39
.1,
53
.8)
35
.7(3
1.1
, 4
0.5
)2
4.7
(20
.7,
29
.1)
60
.0(5
5.0
, 6
4.8
)2
6.5
(21
.5,
32
.2)
Fe
ma
le3
5.0
(29
.0,
41
.4)
28
.5(2
5.1
, 3
2.2
)1
8.0
(15
.3,
21
.0)
51
.2(4
6.8
, 5
5.6
)2
0.9
(17
.8,
24
.4)
15
-24
40
.8(3
3.7
, 4
8.3
)3
6.1
(31
.0,
41
.5)
20
.0(1
6.1
, 2
4.5
)6
1.6
(56
.3,
66
.6)
23
.9(1
9.1
, 2
9.4
)
25
-44
41
.8(3
4.9
, 4
9.1
)3
4.3
(30
.3,
38
.4)
23
.3(2
0.0
, 2
7.0
)6
0.3
(55
.5,
64
.9)
26
.1(2
2.6
, 3
0.1
)
45
-64
33
.1(2
6.9
, 3
9.9
)2
1.9
(18
.7,
25
.4)
16
.0(1
2.8
, 1
9.8
)4
0.3
(35
.4,
45
.5)
17
.2(1
4.3
, 2
0.7
)
65
+1
8.2
(12
.8,
25
.1)
11
.4(8
.1,
15
.9)
8.4
(6.0
, 1
1.6
)2
2.5
(17
.0,
29
.2)
9.6
(6.8
, 1
3.5
)
Urb
an
37
.4(2
8.9
, 4
6.9
)3
4.2
(29
.9,
38
.7)
20
.7(1
7.4
, 2
4.4
)6
2.3
(56
.5,
67
.8)
24
.7(2
0.4
, 2
9.5
)
Ru
ral
38
.3(2
9.7
, 4
7.6
)2
6.1
(21
.0,
32
.0)
18
.6(1
4.1
, 2
4.0
)4
3.7
(37
.4,
50
.1)
19
.8(1
5.0
, 2
5.6
)
Les
s t
ha
n p
rim
ary
sch
oo
l co
mp
lete
d1
8.5
(13
.6,
24
.6)
12
.4(9
.6,
15
.9)
10
.7(8
.0,
14
.1)
23
.7(1
8.8
, 2
9.4
)1
0.6
(7.9
, 1
4.2
)
Pri
ma
ry s
cho
ol
com
ple
ted
27
.0(2
0.9
, 3
4.0
)2
3.6
(19
.3,
28
.4)
15
.8(1
2.3
, 2
0.1
)4
2.8
(37
.8,
48
.0)
17
.8(1
4.4
, 2
1.7
)
Se
con
da
ry s
cho
ol
com
ple
ted
41
.3(3
3.4
, 4
9.7
)3
7.0
(31
.5,
42
.9)
20
.9(1
6.9
, 2
5.6
)6
0.8
(54
.8,
66
.6)
27
.0(2
2.0
, 3
2.6
)
Hig
h s
cho
ol
com
ple
ted
54
.7(4
7.0
, 6
2.1
)4
2.4
(37
.7,
47
.3)
26
.3(2
2.5
, 3
0.4
)7
4.7
(70
.2,
78
.8)
28
.9(2
4.3
, 3
4.0
)
Co
lle
ge
or
Un
ive
rsit
y +
67
.2(5
7.1
, 7
5.9
)4
6.8
(40
.0,
53
.6)
34
.0(2
7.3
, 4
1.4
)8
5.6
(80
.6,
89
.6)
37
.0(2
9.8
, 4
4.8
)
Em
plo
yed
47
.8(4
0.2
, 5
5.5
)3
6.7
(32
.0,
41
.8)
23
.2(1
9.5
, 2
7.3
)6
5.1
(59
.5,
70
.4)
25
.8(2
1.4
, 3
0.7
)
Se
lf-e
mp
loye
d3
7.4
(29
.2,
46
.2)
26
.9(2
0.9
, 3
3.7
)2
1.4
(16
.0,
27
.9)
44
.0(3
7.4
, 5
0.8
)2
2.7
(16
.6,
30
.2)
Stu
de
nts
43
.7(3
4.0
, 5
4.0
)3
7.9
(32
.0,
44
.2)
21
.5(1
6.2
, 2
7.9
)6
3.3
(55
.7,
70
.4)
27
.9(2
0.9
, 3
6.2
)
Ho
me
ma
ke
rs3
0.8
(24
.7,
37
.5)
28
.1(2
4.3
, 3
2.1
)1
6.9
(14
.2,
20
.0)
51
.2(4
5.7
, 5
6.7
)1
8.7
(15
.7,
22
.1)
Un
-em
plo
yed
30
.9(2
2.9
, 4
0.2
)2
2.3
(16
.8,
29
.0)
12
.6(9
.2,
17
.2)
46
.1(3
8.5
, 5
4.0
)1
8.1
(13
.5,
23
.9)
Ge
nd
er
† C
OP
D =
Ch
ron
ic O
bs
tru
ctiv
e P
ulm
on
ary
Dis
ea
se
1 In
clu
de
s d
ail
y a
nd
occ
as
ion
al(
les
s t
ha
n d
ail
y) s
mo
ke
rs.
2 I
ncl
ud
es
fo
rme
r a
nd
ne
ver
sm
ok
ers
.
Pe
rce
nta
ge
(95
% C
I)
Ta
ble
9.1
A (
con
t):
Pe
rce
nta
ge
of
ad
ult
s ≥
15
ye
ars
old
wh
o b
eli
eve
th
at
sm
ok
ing
ca
us
es
CO
PD
, b
lad
de
r ca
nce
r, s
tom
ach
ca
nce
r, p
rem
atu
re b
irth
, o
r b
on
e l
os
s,
by
sm
ok
ing
sta
tus
an
d s
ele
cte
d d
em
og
rap
hic
ch
ara
cte
ris
tics
– G
AT
S I
nd
on
es
ia,
20
11
.
Ad
ult
s w
ho
be
lie
ve
th
at
smo
kin
g c
au
ses…
CO
PD
†B
lad
de
r C
an
cer
Sto
ma
ch C
an
cer
Pre
ma
ture
Bir
thB
on
e L
oss
De
mo
gra
ph
ic C
ha
ract
eri
stic
s
Occ
up
ati
on
/Wo
rk s
tatu
s
Ed
uca
tio
n L
ev
el
Re
sid
en
ce
Ag
e (
ye
ars
)

89 Knowledge, Attitudes and Perceptions
Overall 23.9 (20.3, 28.1) 24.5 (16.6, 34.6) 23.9 (20.2, 28.1)
Male 25.5 (21.6, 29.8) 39.0 (25.1, 55.0) 25.3 (21.4, 29.5)
Female 22.4 (18.6, 26.8) 13.3 (8.0, 21.3) 22.6 (18.8, 27.0)
15-24 25.0 (20.9, 29.7) -- 24.8 (20.7, 29.4)
25-44 26.3 (22.2, 30.8) 30.5 (17.4, 47.7) 26.2 (22.2, 30.7)
45-64 21.3 (17.4, 25.7) 31.5 (19.0, 47.4) 21.1 (17.2, 25.6)
65+ 14.4 (10.2, 20.0) 3.4 (1.0, 10.6) 15.4 (10.8, 21.3)
Urban 21.6 (16.9, 27.3) 25.9 (14.7, 41.6) 21.6 (16.8, 27.3)
Rura l 26.2 (20.9, 32.4) 23.7 (13.9, 37.4) 26.3 (20.9, 32.5)
Less than primary school completed 17.6 (13.3, 22.9) 11.5 (5.6, 22.1) 17.9 (13.5, 23.3)
Primary school completed 22.7 (18.0, 28.3) 41.1 (24.5, 59.9) 22.6 (17.8, 28.1)
Secondary school completed 24.4 (20.6, 28.6) -- 24.2 (20.4, 28.4)
High school completed 27.4 (22.7, 32.6) -- 27.2 (22.6, 32.4)
Col lege or Univers i ty + 36.5 (28.1, 45.9) -- 36.6 (28.1, 46.0)
Employed 25.4 (21.2, 30.0) 28.5 (16.1, 45.3) 25.3 (21.2, 30.0)
Sel f-employed 24.8 (19.8, 30.7) 29.5 (16.9, 46.2) 24.7 (19.7, 30.6)
Students 27.1 (21.4, 33.6) -- 26.8 (21.2, 33.4)
Home makers 21.2 (17.4, 25.7) 18.8 (10.1, 32.1) 21.3 (17.4, 25.8)
Un-employed 18.9 (13.9, 25.1) 1.5 (0.2, 11.0) 19.4 (14.3, 25.8)
-- Indicator estimate based on less than 25 un-weighted cases and has been suppressed.
Percentage (95% CI)
Table 9.1B: Percentage of adults ≥15 years old who bel ieve that us ing smokeless tobacco causes serious i l lness by
the s tatus of smokeless tobacco use and selected demographic characteris tics – GATS Indones ia , 2011.
Smokeless tobacco use causes serious illness…
Overall Among current users1 Among non-users2Demographic Characteristics
Age (years)
Gender
1 Includes dai ly and occas ional (less than dai ly) smokeless tobacco users .2 Includes former and never smokeless tobacco users .
Occupation/Work status
Education Level
Residence

90 Knowledge, Attitudes and Perceptions
Overall 73.7 (70.2, 76.9) 67.8 (63.4, 71.9) 76.8 (73.5, 79.8)
Male 74.1 (70.4, 77.5) 68.3 (63.9, 72.4) 85.8 (82.9, 88.3)
Female 73.3 (69.5, 76.7) 55.8 (45.0, 66.1) 73.7 (69.9, 77.2)
15-24 82.8 (79.0, 86.0) 72.7 (66.2, 78.5) 86.4 (82.6, 89.4)
25-44 78.3 (74.8, 81.4) 73.5 (69.0, 77.5) 81.2 (77.8, 84.2)
45-64 64.4 (60.0, 68.6) 60.5 (54.8, 66.0) 66.9 (62.6, 71.0)
65+ 43.9 (37.3, 50.7) 40.8 (31.9, 50.4) 45.2 (38.2, 52.5)
Urban 79.5 (74.8, 83.6) 75.1 (68.9, 80.3) 81.6 (77.2, 85.4)
Rura l 67.8 (62.5, 72.6) 61.6 (55.3, 67.6) 71.5 (66.3, 76.1)
Less than primary school completed 46.4 (41.5, 51.4) 42.6 (36.7, 48.7) 48.7 (43.1, 54.4)
Primary school completed 70.1 (65.6, 74.2) 67.1 (60.6, 72.9) 71.9 (67.2, 76.1)
Secondary school completed 83.0 (79.9, 85.8) 76.1 (70.8, 80.7) 86.2 (83.1, 88.9)
High school completed 89.8 (87.3, 91.8) 83.7 (79.2, 87.3) 92.9 (90.6, 94.6)
Col lege or Univers i ty + 93.2 (89.3, 95.8) 89.1 (81.3, 93.9) 94.8 (91.4, 96.9)
Employed 80.3 (76.1, 84.0) 75.0 (69.4, 79.8) 85.0 (80.9, 88.4)
Sel f-employed 66.6 (61.2, 71.7) 62.8 (57.0, 68.2) 70.5 (64.5, 75.9)
Students 90.4 (86.2, 93.4) 81.2 (63.8, 91.4) 91.9 (88.4, 94.4)
Home makers 73.3 (68.9, 77.3) 67.3 (52.1, 79.6) 73.5 (69.0, 77.5)
Un-employed 63.9 (57.8, 69.6) 58.4 (48.3, 67.8) 66.5 (59.9, 72.5)1 Includes dai ly and occas ional (less than dai ly) smokers2 Includes former and never smokers .
Table 9.2: Percentage of adults ≥ 15 years old who bel ieve that breathing other people's smoke causes serious
i l lness in non-smokers , by smoking s tatus and selected demographic characteris tics – GATS Indones ia , 2011.
Overall Current smokers1
Non-smokers2
Percentage(95% CI )
Believe that breathing other people’s smoke causes serious illness in non-smokers
Demographic Characteristics
Occupation/Work status
Education Level
Residence
Gender
Age (years)

91 Conclusion and Recommendations
10. Conclusion and Recommendations
10.1. Conclusion
The GATS uses a global standard tool for systematically monitoring adult tobacco use and for tracking key tobacco control indicators that can be utilized by policy makers to strengthen tobacco control activities in Indonesia. In addition, it allows international comparability and opportunities to exchange experiences and to learn lessons from other countries.
The GATS is the first ever nationwide survey that provides comprehensive information on various kinds of tobacco products including smokeless tobacco, and other key indicators of tobacco control, using a nationally representative sample of persons aged 15 years and above. It provides national estimates for both smoking and smokeless tobacco usage by gender, age group, residence, educational level and occupation. In addition, indicators are also available on various dimensions of tobacco control such as exposure to SHS, anti-tobacco information and tobacco advertisements, and expenditure related to tobacco.
The prevalence of tobacco use as reported in GATS is comparable with findings of other nationally representative surveys conducted earlier in Indonesia, such as the National Health Survey, 2004 and the Baseline Health Research of 2007 and 2010.
10.2. Recommendations
The results from the GATS provide recent information on tobacco use (both smoked and smokeless) and new information on key indicators related to a package of six policies known as MPOWER; these will help in monitoring and evaluating tobacco control policies and programmes. Major policy recommendations aimed at developing, tracking and implementing more effective tobacco control interventions specifically under WHO’s MPOWER guidelines are discussed below.
M: Monitor
The GATS has provided national representative data on the use of both smoked and smokeless tobacco among the adult population for the year 2011. To effectively monitor tobacco use and the tobacco control programme in Indonesia, regular surveillance of key indicators is necessary.
Strategic activities should include the following:
Periodic implementation of national surveys using standard GTSS protocol, such as a repeat GATS
Strengthening of the National Tobacco Control surveillance system by integrating standard “tobacco questions for surveys” (TQS) in ongoing national surveys such as SUSENAS and national family health surveys
Dissemination of the GATS data to multiple stakeholders for advocacy of tobacco control with a view to implementing the MPOWER policy package as envisaged in the 61st Regional Committee resolution
Social networking and collaboration among tobacco control experts from various institutions and among tobacco control stakeholders to strengthen the tobacco surveillance system
Consultation and advocacy with national agencies for technical and financial support to regularly administer surveys under the GTSS
Strengthening the channel of coordination between local tobacco control networks and the nationwide tobacco control surveillance system
Applying information technology to establish an efficient and effective tobacco surveillance system.

92 Conclusion and Recommendations
P: Protect
The GATS has shown that a large percentage of people are exposed to SHS in the workplace, in public places and at home. The community as a whole, and especially vulnerable groups such as women and children should be protected from tobacco smoke by the following measures:
Advocate for 100% smoke-free regulation in public places at the national and subnational levels to protect the community from exposure to tobacco smoke.
Enforce smoke-free regulation actively and effectively.
Enhance public awareness using various media campaigns on the harm caused by SHS, and the right of non-smokers to be free from exposure to tobacco smoke.
Formulate both formal and informal education curricula to enhance knowledge and develop proper attitudes and perceptions among the populace about the harm caused by the use of tobacco and SHS.
O: Offer help
Many smokers have made a quit attempt in the past 12 months, or have planned to quit. Many smokers have also been advised to quit by health-care providers. To help such people, the following actions should be taken:
Establish quit-line centres and smoking cessation centres across the entire country to provide counselling/psychobehavioural therapy, as well as NRT, as needed.
Conduct widespread publicity campaigns and public health education regarding the harm of smoking and SHS.
Develop counselling skills among health-care providers (public and private) on tobacco cessation services as part of routine health services.
Provide formal training to students of health professions.
Integrate tobacco cessation services in primary health-care settings.
W: Warn
The GATS has shown that the existing warning messages have a limited reach since they are currently in a textual form and presented in tiny words. These warnings, coupled with public education, can be more effective and have a better impact by taking the following measures:
Use effective pictorial health warnings on all types of cigarette packages, and on all kinds of tobacco products, including imported tobacco products.
Disseminate information on the health and economic impact of smoking and exposure to SHS.
Formulate policies to ban smuggling/import of tobacco products without health warnings prefereably pictorial ones.
E: Enforce
Exposure to tobacco advertisements and promotion of tobacco products have been reported to be very high in the GATS. There is hence a need to formulate effective bans on tobacco advertising, promotion and sponsorship at the national and subnational levels, and enforce the same by taking the following measures:

93 Conclusion and Recommendations
Raise social awareness on the harm caused by tobacco, and expose the motives of the tobacco industry for their tobacco promotion activities.
Coordinate tobacco control activities with government and nongovernmental organizations for the systematic monitoring of advertising by the tobacco industry at every level, especially in remote and isolated areas.
Complele ban advertising, promotion and sponsorship by the tobacco industry Enforce laws and regulations rigorously at all governmental levels .
Increase the capacity of call centres dealing with complaints on violation of tobacco control regulations, and provide an effective response system.
R: Raise taxes on tobacco
As increasing the excise tax on all tobacco products has been referred to as one of the most effective ways of discouraging youth from starting to smoke, reduce the use of tobacco by the community. also In addition, to prevent morbidity and premature mortality, the following measures are recommended:
Conduct advocacy for raising taxes on cigarettes and other tobacco products, taking into account inflation and rising per capita income in Indonesia.
Increase the level of public concern regarding illicit cigarettes (locally produced).
Enhance advocacy for better political commitment of the government and members of parliament to regularly revise and increase taxes on cigarettes and other tobacco products.
Find innovative ways to control evasion of tax.

94 Bibliography
Bibliography
Adioetomo SM, Triasih Djutaharta T, Hendrato. Cigarette consumption, taxation and household income: Indonesia case study. HNP Discussion Paper No. 26. Washington DC: World Bank and Geneva: World Health Organization, 2005.
Badan Penelitian dan Pengembangan Kesehatan - Departemen Kesehatan Republik Indonesia. (2011). Riset Kesehatan Dasar 2010
Barber S, Adioetomo SM, Ahsan A, Setyonaluri D. Tobacco economics in Indonesia. Paris: International Union against Tuberculosis and Lung Disease, 2008.
Blecher E , Walbeek CV. An analysis of cigarette affordability. Paris: International Union Against Tuberculosis and Lung Diseases, 2008.
Departemen Kesehatan R.I., Direktorat Jendral Bina Pelayanan Medik (2007), Buku Tarif INA-DRG RS Umum dan Khusus Kelas C & D. (Keputusan Menteri Kesehatan R.I., No. 1161/MENKES/SK/X/2007 Tanggal 31 Oktober 2007)
Eriksen M, Mackay J, Ross H. The tobacco atlas. 4th edn. Georgia: American Cancer Society, 2012.
Global Adult Tobacco Survey Collaborative Group. Global Adult Tobacco Survey (GATS): core questionnaire with optional questions, Versions 2.0. Atlanta: Centers for Disease Control and Prevention, 2010.
Global Adult Tobacco Survey Collaborative Group. Global Adult Tobacco Survey (GATS): programmer’s guide to general survey system, Version 2.0. Atlanta: Centers for Disease Control and Prevention, 2010.
Global Adult Tobacco Survey Collaborative Group. Global Adult Tobacco Survey (GATS): data management implementation plan, Version 2.0. Atlanta: Centers for Disease Control and Prevention, 2010.
Global Adult Tobacco Survey Collaborative Group. Global Adult Tobacco Survey (GATS): field interviewer manual, Version 2.0. Atlanta: Centers for Disease Control and Prevention, 2010.
Global Adult Tobacco Survey Collaborative Group. Global Adult Tobacco Survey (GATS): field supervisor manual, Version 2.0. Atlanta: Centers for Disease Control and Prevention, 2010.
Global Adult Tobacco Survey Collaborative Group. Global Adult Tobacco Survey (GATS): question by question specifications, Version 2.0. Atlanta: Centers for Disease Control and Prevention, 2010.
Global Adult Tobacco Survey Collaborative Group. Global Adult Tobacco Survey (GATS): data management training guide, Version 1.0. Atlanta: Centers for Disease Control and Prevention, 2010.
Global Adult Tobacco Survey Collaborative Group. Global Adult Tobacco Survey (GATS): mapping and listing manual, Version 2.0. Atlanta: Centers for Disease Control and Prevention, 2010.
Global Adult Tobacco Survey Collaborative Group. Global Adult Tobacco Survey (GATS): sample design manual, Version 2.0. Atlanta: Centers for Disease Control and Prevention, 2010.
Global Adult Tobacco Survey Collaborative Group. Global Adult Tobacco Survey (GATS): sample weights manual, Version 2.0. Atlanta: Centers for Disease Control and Prevention, 2010.
Global Adult Tobacco Survey Collaborative Group. Global Adult Tobacco Survey (GATS): quality assurance: guidelines and documentation, Version 2.0. Atlanta: Centers for Disease Control and Prevention, 2010.
Global Adult Tobacco Survey Collaborative Group. Global Adult Tobacco Survey (GATS): country report: tabulation plan and guidelines, Version 2.0. Atlanta: Centers for Disease Control and Prevention, 2011.
Kosen S. Study on medical expenditures and burden of major of tobacco attributed diseases in Indonesia. Jakarta: Ministry of Health Republic of Indonesia, National Institute of Health Research and Development, 2010.

95 Bibliography
Ministry of Health, Republic of Indonesia. The tobacco source book: data to support a national tobacco control strategy. Jakarta, 2004.
National Institute of Health Research and Development, Ministry of Health Republic of Indonesia. Baseline health research 2007. Jakarta, 2008.
Shafey O, Eriksen M, Ross H, Mackay J. The tobacco atlas. 3rd edn. Georgia: American Cancer Society, 2009.
Tobacco Control Support Center. Fakta tembakau permasalahannya di Indonesia tahun 2010. Jakarta, TCSC IAKMI, 2010. US Department of Health and Human Services. How tobacco smoke causes diseases: the biology and behavioral basis for smoking attribuable disease: a report of the surgeon general . Georgia: Centers for Diseases Control and Prevention, 2010.
Warren WC, Sinha DN, Lee J, Lea V, Jones N, Asma S. Tobacco use, exposure to secondhand smoke, and cessation counselling training among dental students around the world. Journal of Dental Education. 2011 Mar; 75(3): 385-405.
Warren WC, Sinha DN, Lee J, Lea V, Jones N, Asma S. Tobacco use, exposure to secondhand smoke, and cessation counseling among medical students: cross country data from Global Health Professions Student Survey (GHPSS), 2005-2008. BMC Public Health. 2011; 11(72): 3-16.
World Health Organization, Regional Office for South-East Asia. Indonesia Global School Personnel Survey (GSPS): factsheet. New Delhi: WHO-SEARO, 2009. http://www.searo.who.int/LinkFiles/GSPS_Indonesia_2009_Factsheet.pdf
World Health Organization. WHO report on the global tobacco epidemic, 2008: the MPOWER package. Geneva: WHO, 2008.

96 Appendix A: Estimates of Sampling Errors
Appendix A: Estimates of Sampling Errors
The estimates from a sample survey are affected by two types of errors: (1) non-sampling errors, and (2) sampling errors. Non-sampling errors are the result of errors or mistakes that cannot be attributed to sampling and are made during data collection and data processing, such as errors in coverage, response errors, non-response errors, faulty questionnaires, interviewer recording errors, data processing errors, etc. Although numerous efforts were made during the implementation of theGATS to minimize these errors, non-sampling errors are impossible to avoid and difficult to evaluate statistically.
The sample of respondents selected in the GATS was only one of the samples that could have been selected from the same population, using the same design and sample size. Each of these samples would yield results that differed somewhat from the results of the actual sample selected. Sampling errors are a measure of the variability between all possible samples. The extent of variability is not known exactly, but can be estimated statistically from the survey results.
The following sampling error measures are presented for each of the selected indicators:
Value (R): Weighted prevalence estimate of the indicator
Standard error (SE): Sampling errors are usually measured in terms of standard errors for a particular estimate or indicator (R). Standard error of an estimate is thus simply the square root of the variance of that estimate, and is computed in the same units as the estimate.
Sample size (N): The total number of observations used to calculate the prevalence estimate (R)
Design effect: Design effect denoted by “deff” is the ratio of the actual variance of an indicator under the sampling method used in the survey, to the variance calculated under the assumption of simple random sampling. The square root of the design effect, denoted by “deft”, is used to show the efficiency of the sample design and is calculated for each estimate as the ratio between the standard error using the given sample design and the standard error that would result if a simple random sample had been used. A DEFT value of 1.0 indicates that the sample design is as efficient as a simple random sample, while a DEFT value above 1.0 indicates an increase in the standard error due to the use of a more complex sample design. In general, for a well-designed survey, DEFT usually ranges from 1 to 3. It is common, however, for DEFT to be much larger, up to 7 or 8.
Relative standard error (RSE): Relative standard error, also known as coefficient of variation (CV), is the ratio of the standard error to the value of the indicator.
Margin of error (MOE): Margin of error is computed as the product of the desired confidence measure and the standard error of the estimate. The level of confidence is usually based on a value (Z) of the standard normal distribution. For example, for a 95% level of confidence, we can use Z=1.96.
Confidence limits (R±1.96 SE): Confidence limits are calculated to show the interval within which the true value for the population can be reasonably assumed to fall. For any given statistic calculated from the survey, the value of that statistic will fall within a range of plus or minus two times the standard error of the statistic in 95% of all possible samples of identical size and design.
Calculation of standard error If the sample of respondents had been selected as a simple random sample, it would have been possible to use straightforward formulae for calculating sampling errors. However, the GATS 2011 sample is the result of a multistage stratified design and, consequently, it was necessary to use more complex formulae. For the calculation of sampling errors from the GATS 2011 data, SPSS version 18 was used. The Taylor linearization method of variance estimation was used for survey estimates that were means or proportions.

97 Appendix A: Estimates of Sampling Errors
The Taylor linearization method treats any percentage or average as a ratio estimate, r = y/x, where y represents the total sample value for variable y, and x represents the total number of cases in the group or subgroup under consideration. The variance of r is computed using the formula given below:
2
1 1
2
2
2
2
1
1)var()(
h
m
i h
hhi
h
hh
m
ZZ
m
m
x
frrSE
in which ,hihihi rxyZ and hhh rxyZ
where h (=1 or 2) represents the stratum which is urban or rural,
mh is the total number of PSUs selected in the hth stratum,
yhi is the sum of the weighted values of variable y in the ith PSU in the hth stratum,
xhi is the sum of the weighted number of cases in the ith PSU in the hth stratum, and
f is the overall sampling fraction, which is so small that it is ignored.
The results are presented in this appendix for the country as a whole, for urban and rural areas, and by gender. For
each variable or indicator, the type of statistic (mean, proportion or rate) and the base population are given in
Table A.1. In addition to the standard error (SE) described above, Tables A.2 to A.6 include the value of the
estimate (R), the sample size, the design effect (DEFF or DEFT), the relative standard error (SE/R), margin of error
(MOE) and the 95% confidence limits (R±1.96 SE) for each variable or indicator.

98 Appendix A: Estimates of Sampling Errors
Indicator Estimate Base Population
Current Tobacco Users Proportion Adults ≥ 15 years old
Current Tobacco Smokers Proportion Adults ≥ 15 years old
Current Cigarette Smokers Proportion Adults ≥ 15 years old
Current White Cigarette Smokers Proportion Adults ≥ 15 years old
Current Hand-rolled Cigarette Smokers Proportion Adults ≥ 15 years old
Current Kretek Cigarette Smokers Proportion Adults ≥ 15 years old
Current Users of Smokeless Tobacco Proportion Adults ≥ 15 years old
Daily Tobacco Users Proportion Adults ≥ 15 years old
Daily Tobacco Smoker Proportion Adults ≥ 15 years old
Daily Cigarette Smokers Proportion Adults ≥ 15 years old
Daily White Cigarette Smokers Proportion Adults ≥ 15 years old
Daily Hand-rolled Cigarette Smokers Proportion Adults ≥ 15 years old
Daily Kretek Cigarette Smokers Proportion Adults ≥ 15 years old
Daily Users of Smokeless Tobacco Proportion Adults ≥ 15 years old
Former Daily Tobacco Smokers Among All Adults Proportion Adults ≥ 15 years old
Former Tobacco Smokers Among Ever Daily Smokers Proportion Ever daily tobacco smokers ≥ 15 years old
Time to First Tobacco use within 5 minutes of waking Proportion Daily tobacco users ≥ 15 years old
Time to First Tobacco use within 6-30 minutes of waking Proportion Daily tobacco users ≥ 15 years old
Smoking Quit Attempt in the Past 12 Months ProportionCurrent smokers and former smokers who have been
abstinent for less than 12 months
Health Care Provider Asked about Smoking Proportion
Current smokers and former smokers who have been
abstinent for less than 12 months and who visited a HCP
during the past 12 months
Health Care Provider Advised Quitting Smoking Proportion
Current smokers and former smokers who have been
abstinent for less than 12 months and who visited a HCP
during the past 12 months
Use of Counseling/Advice or Quit Lines for Smoking Cessation ProportionCurrent smokers and former smokers who have been
abstinent for less than 12 months
Planning to quit, thinking about quitting, or will quit smoking Proportion Current smokers ≥ 15 years old
Exposure to SHS at Home Proportion Adults ≥ 15 years old
Exposure to SHS at Workplace Proportion Adults who work indoors
Exposure to SHS in Government Buildings/Offices Proportion Adults ≥ 15 years old who have visited in past 30 days
Exposure to SHS in Health Care Facilities Proportion Adults ≥ 15 years old who have visited in past 30 days
Exposure to SHS in Restaurants Proportion Adults ≥ 15 years old who have visited in past 30 days
Exposure to SHS in Public Transportation Proportion Adults ≥ 15 years old who have visited in past 30 days
Last kretek purchase in store Proportion Current manufactured cigarette smokers ≥ 15 years old
Last kretek purchase at kiosk Proportion Current manufactured cigarette smokers ≥ 15 years old
Noticed Anti-tobacco Information on radio or television Proportion Adults ≥ 15 years old
Noticed Health Warning Labels on Cigarette Packages Proportion Current smokers ≥ 15 years old
Thinking of Quitting Because of Health Warning Labels on Cigarette Package Proportion Current smokers ≥ 15 years old
Noticed Any Cigarette Advertisement or Promotion Proportion Adults ≥ 15 years old
Noticed Cigarette Marketing in Stores Where Cigarettes are Sold Proportion Adults ≥ 15 years old
Believes that Tobacco Smoking Causes Serious Illness Proportion Adults ≥ 15 years old
Believes that Tobacco Smoking Causes Strokes Proportion Adults ≥ 15 years old
Believes that Tobacco Smoking Causes Heart Attacks Proportion Adults ≥ 15 years old
Believes that Tobacco Smoking Causes Lung Cancer Proportion Adults ≥ 15 years old
Believes that Tobacco Smoking Causes Chronic Obstructive Pulmonary
Disease (COPD)Proportion Adults ≥ 15 years old
Believes that Tobacco Smoking Causes Premature Birth Proportion Adults ≥ 15 years old
Believes that Using Smokeless Tobacco Causes Serious Illness Proportion Adults ≥ 15 years old
Believes that SHS Causes Serious Illness in Non-Smokers Proportion Adults ≥ 15 years old
Number of Cigarettes Smoked per Day (by daily smokers) Mean Current daily cigarette smokers ≥ 15 years old
Time since Quitting Smoking (in years) Mean Former smokers ≥ 15 years old
Average Amount Spent on 20 Kretek Cigarettes Mean Current Kretek cigarette smokers ≥ 15 years old
Monthly Expenditures on Kretek Cigarettes Mean Current Kretek cigarette smokers ≥ 15 years old
Age at Daily Smoking Initiation Among Adults Age 20-34 Mean Ever daily smokers ≥ 15 years old
Table A.1: List of Indicators for Sampling Errors, GATS Indonesia, 2011

99 Appendix A: Estimates of Sampling Errors
Indicator
Estimate
(R)
Standard
Error
(SE)
Sample
size
(n)
Design
Effect
(DEFT)
Relative
Error
(SE/R)
M argin
of Error
(M OE)
Lower Limit
(R-1.96SE)
Upper Limit
(R+1.96SE)
Current Tobacco Users 0.361 0.009 8227 2.632 0.024 0.017 0.344 0.378
Current Tobacco Smokers 0.348 0.008 8305 2.4 0.023 0.016 0.332 0.364
Current Cigarette Smokers 0.348 0.008 8305 2.4 0.023 0.016 0.332 0.364
Current White Cigarette Smokers 0.022 0.003 8305 4.338 0.153 0.007 0.015 0.029
Current Hand-rolled Cigarette Smokers 0.047 0.007 8305 8.436 0.143 0.013 0.034 0.061
Current Kretek Cigarette Smokers 0.315 0.009 8305 3.029 0.028 0.017 0.298 0.333
Current Users of Smokeless Tobacco 0.017 0.002 8176 1.907 0.115 0.004 0.013 0.021
Daily Tobacco Users 0.298 0.008 8305 2.862 0.028 0.017 0.282 0.315
Daily Tobacco Smoker 0.292 0.008 8305 2.782 0.028 0.016 0.276 0.309
Daily Cigarette Smokers 0.292 0.008 8305 2.774 0.028 0.016 0.276 0.308
Daily White Cigarette Smokers 0.016 0.002 8305 3.318 0.158 0.005 0.011 0.021
Daily Hand-rolled Cigarette Smokers 0.038 0.006 8305 7.148 0.148 0.011 0.027 0.049
Daily Kretek Cigarette Smokers 0.259 0.009 8305 3.247 0.033 0.017 0.242 0.276
Daily Users of Smokeless Tobacco 0.012 0.001 8176 1.454 0.122 0.003 0.009 0.015
Former Daily Tobacco Smokers Among All Adults 0.033 0.003 8305 2.135 0.087 0.006 0.027 0.039
Former Tobacco Smokers Among Ever Daily Smokers 0.095 0.008 2880 2.37 0.088 0.017 0.079 0.112
Time to First Tobacco use within 5 minutes of waking 0.068 0.01 2422 4.09 0.153 0.02 0.047 0.088
Time to First Tobacco use within 6-30 minutes of waking 0.315 0.023 2422 6.004 0.073 0.045 0.27 0.361
Smoking Quit Attempt in the Past 12 Months 0.304 0.019 2909 4.814 0.062 0.037 0.267 0.341
Health Care Provider Asked about Smoking 0.405 0.03 913 3.493 0.075 0.06 0.345 0.464
Health Care Provider Advised Quitting Smoking 0.346 0.028 913 3.263 0.082 0.056 0.29 0.402
Use of Counseling/Advice or Quit Lines for Smoking Cessation 0.07 0.018 877 4.483 0.261 0.036 0.034 0.106
Planning to quit, thinking about quitting, or will quit smoking 0.488 0.029 2851 9.497 0.059 0.057 0.431 0.545
Exposure to SHS at Home 0.784 0.016 8177 12.469 0.02 0.031 0.753 0.816
Exposure to SHS at Workplace 0.513 0.028 1317 4.016 0.054 0.054 0.459 0.567
Exposure to SHS in Government Buildings/Offices Among Those
Who Visited 0.634 0.024 1538 3.913 0.038 0.048 0.587 0.682
Exposure to SHS in Health Care Facilities Among Those Who Visited 0.179 0.015 2656 4.234 0.086 0.03 0.149 0.209
Exposure to SHS in Restaurants Among Those Who Visited 0.854 0.02 2378 7.715 0.024 0.039 0.814 0.893
Exposure to SHS on Public Transportation Among Those Who
Visited 0.7 0.021 2497 5.305 0.03 0.041 0.658 0.741
Last kretek purchase in store 0.176 0.032 2494 17.114 0.18 0.062 0.114 0.237
Last kretek purchase at kiosk 0.798 0.033 2494 17.093 0.042 0.065 0.733 0.863
Noticed Anti-tobacco Information on radio or television 0.409 0.02 8301 14.028 0.049 0.04 0.37 0.449
Noticed Health Warning Labels on Cigarette Packages 0.722 0.023 2855 7.714 0.032 0.046 0.676 0.768
Thinking of Quitting Because of Health Warning Labels on Cigarette
Package 0.271 0.019 2853 5.065 0.069 0.037 0.234 0.307
Noticed Any Cigarette Advertisement or Promotion 0.846 0.012 8292 8.731 0.014 0.023 0.823 0.869
Noticed Cigarette Marketing in Stores Where Cigarettes are Sold 0.456 0.025 8301 20.733 0.055 0.049 0.407 0.505
Believes that Tobacco Smoking Causes Serious Illness 0.86 0.012 8305 10.375 0.014 0.024 0.836 0.884
Believes that Tobacco Smoking Causes Strokes 0.455 0.022 8303 15.489 0.047 0.042 0.413 0.497
Believes that Tobacco Smoking Causes Heart Attacks 0.815 0.015 8303 11.782 0.018 0.029 0.786 0.843
Believes that Tobacco Smoking Causes Lung Cancer 0.847 0.012 8305 8.8 0.014 0.023 0.824 0.87
Believes that Tobacco Smoking Causes Chronic Obstructive
Pulmonary Disease (COPD) 0.36 0.031 8304 34.53 0.086 0.061 0.3 0.421
Believes that Tobacco Smoking Causes Premature Birth 0.495 0.021 8305 14.501 0.042 0.041 0.454 0.536
Believes that Using Smokeless Tobacco Causes Serious Illness 0.24 0.02 8304 17.828 0.083 0.039 0.201 0.279
Believes that SHS Causes Serious Illness in Non-Smokers 0.737 0.017 8301 12.1 0.023 0.033 0.704 0.77
Number of Cigarettes Smoked per Day (by daily smokers) 12.828 0.325 2422 3.229 0.025 0.638 12.191 13.466
Time since Quitting Smoking (in years) 9.622 0.593 282 1.367 0.062 1.162 8.46 10.784
Average Amount Spent on 20 Kretek Cigarettes 12718.909 300.992 2476 3.419 0.024 589.944 12128.965 13308.852
Monthly Expenditures on Kretek Cigarettes 198537.27 7271.381 2476 2.69 0.037 14251.91 184285.362 212789.176
Age at Daily Smoking Initiation Among Adults Age 20-34 17.606 0.162 861 2.159 0.009 0.318 17.288 17.924
Confidence limits
Table A.2: Sampling Errors - Overall, GATS Indonesia, 2011

100 Appendix A: Estimates of Sampling Errors
Indicator
Estimate
(R)
Standard
Error
(SE)
Sample
size
(n)
Design
Effect
(DEFT)
Relative
Error
(SE/R)
M argin
of Error
(M OE)
Lower Limit
(R-1.96SE)
Upper Limit
(R+1.96SE)
Current Tobacco Users 0.674 0.013 3931 2.953 0.019 0.025 0.649 0.699
Current Tobacco Smokers 0.67 0.013 3948 2.949 0.019 0.025 0.645 0.696
Current Cigarette Smokers 0.67 0.013 3948 2.947 0.019 0.025 0.645 0.695
Current White Cigarette Smokers 0.043 0.007 3948 4.165 0.154 0.013 0.03 0.056
Current Hand-rolled Cigarette Smokers 0.09 0.013 3948 8.268 0.146 0.026 0.064 0.116
Current Kretek Cigarette Smokers 0.609 0.015 3948 3.689 0.025 0.029 0.58 0.638
Current Users of Smokeless Tobacco 0.015 0.003 3882 2 0.183 0.005 0.01 0.021
Daily Tobacco Users 0.568 0.015 3948 3.438 0.026 0.029 0.539 0.596
Daily Tobacco Smoker 0.567 0.015 3948 3.47 0.026 0.029 0.539 0.596
Daily Cigarette Smokers 0.567 0.015 3948 3.437 0.026 0.029 0.538 0.595
Daily White Cigarette Smokers 0.031 0.005 3948 3.134 0.158 0.01 0.021 0.04
Daily Hand-rolled Cigarette Smokers 0.072 0.011 3948 6.876 0.15 0.021 0.051 0.093
Daily Kretek Cigarette Smokers 0.503 0.016 3948 3.949 0.031 0.031 0.472 0.534
Daily Users of Smokeless Tobacco 0.011 0.002 3882 1.521 0.188 0.004 0.007 0.015
Former Daily Tobacco Smokers Among All Adults 0.06 0.005 3948 2.024 0.09 0.011 0.049 0.07
Former Tobacco Smokers Among Ever Daily Smokers 0.09 0.008 2750 2.239 0.091 0.016 0.074 0.106
Time to First Tobacco use within 5 minutes of waking 0.067 0.01 2332 3.859 0.152 0.02 0.047 0.086
Time to First Tobacco use within 6-30 minutes of waking 0.319 0.023 2332 5.777 0.073 0.045 0.274 0.365
Smoking Quit Attempt in the Past 12 Months 0.298 0.019 2765 4.678 0.063 0.037 0.261 0.335
Health Care Provider Asked about Smoking 0.416 0.031 858 3.313 0.074 0.06 0.356 0.477
Health Care Provider Advised Quitting Smoking 0.357 0.029 858 3.033 0.08 0.056 0.301 0.413
Use of Counseling/Advice or Quit Lines for Smoking Cessation 0.066 0.017 818 3.734 0.254 0.033 0.033 0.099
Planning to quit, thinking about quitting, or will quit smoking 0.489 0.029 2716 9.225 0.06 0.057 0.432 0.546
Exposure to SHS at Home 0.814 0.016 3899 6.39 0.019 0.031 0.783 0.845
Exposure to SHS at Workplace 0.58 0.032 778 3.245 0.055 0.063 0.517 0.642
Exposure to SHS in Government Buildings/Offices Among Those
Who Visited 0.694 0.031 859 3.788 0.044 0.06 0.634 0.754
Exposure to SHS in Health Care Facilities Among Those Who Visited 0.201 0.021 988 2.83 0.107 0.042 0.159 0.243
Exposure to SHS in Restaurants Among Those Who Visited 0.908 0.015 1467 4.128 0.017 0.03 0.878 0.938
Exposure to SHS on Public Transportation Among Those Who
Visited 0.79 0.02 1088 2.718 0.026 0.04 0.75 0.83
Last kretek purchase in store 0.174 0.031 2391 16.04 0.178 0.061 0.113 0.235
Last kretek purchase at kiosk 0.799 0.033 2391 16.134 0.041 0.065 0.734 0.863
Noticed Anti-tobacco Information on radio or television 0.435 0.022 3946 8.075 0.052 0.044 0.391 0.479
Noticed Health Warning Labels on Cigarette Packages 0.733 0.024 2720 7.818 0.032 0.047 0.686 0.779
Thinking of Quitting Because of Health Warning Labels on Cigarette
Package 0.275 0.019 2718 5.179 0.071 0.038 0.237 0.313
Noticed Any Cigarette Advertisement or Promotion 0.911 0.01 3946 5.079 0.011 0.02 0.891 0.931
Noticed Cigarette Marketing in Stores Where Cigarettes are Sold 0.534 0.029 3946 12.953 0.053 0.056 0.478 0.59
Believes that Tobacco Smoking Causes Serious Illness 0.857 0.013 3948 5.678 0.015 0.026 0.831 0.883
Believes that Tobacco Smoking Causes Strokes 0.466 0.023 3947 8.57 0.05 0.046 0.42 0.512
Believes that Tobacco Smoking Causes Heart Attacks 0.829 0.014 3947 5.812 0.017 0.028 0.801 0.858
Believes that Tobacco Smoking Causes Lung Cancer 0.852 0.012 3948 4.45 0.014 0.023 0.828 0.875
Believes that Tobacco Smoking Causes Chronic Obstructive
Pulmonary Disease (COPD) 0.374 0.032 3947 17.074 0.085 0.062 0.312 0.437
Believes that Tobacco Smoking Causes Premature Birth 0.484 0.023 3948 8.191 0.047 0.045 0.439 0.528
Believes that Using Smokeless Tobacco Causes Serious Illness 0.255 0.021 3947 9.015 0.082 0.041 0.215 0.296
Believes that SHS Causes Serious Illness in Non-Smokers 0.741 0.018 3946 6.58 0.024 0.035 0.706 0.776
Number of Cigarettes Smoked per Day (by daily smokers) 12.982 0.332 2332 3.214 0.026 0.651 12.331 13.633
Time since Quitting Smoking (in years) 9.571 0.569 255 1.177 0.059 1.115 8.455 10.686
Average Amount Spent on 20 Kretek Cigarettes 12753.216 303.789 2375 3.315 0.024 595.427 12157.79 13348.643
Monthly Expenditures on Kretek Cigarettes 202083.77 7337.213 2375 2.577 0.036 14380.94 187702.83 216464.705
Age at Daily Smoking Initiation Among Adults Aged 20-34 17.6 0.164 846 2.204 0.009 0.32 17.28 17.921
Confidence limits
Table A.3: Sampling Errors - M ale, GATS Indonesia, 2011

101 Appendix A: Estimates of Sampling Errors
IndicatorEstimate
(R )
Standard
Erro r (SE)
Sample size
(n)
D esign
Effect
(D EF T )
R elat ive
Erro r
(SE/ R )
M argin o f
Erro r
(M OE)
Lo wer Limit
(R -1.96SE)
Upper Limit
(R +1.96SE)
Current Tobacco Users 0.045 0.005 4296 2.553 0.112 0.01 0.035 0.055
Current Tobacco Smokers 0.027 0.004 4357 2.318 0.139 0.007 0.019 0.034
Current Cigarette Smokers 0.027 0.004 4357 2.318 0.139 0.007 0.019 0.034
Current White Cigarette Smokers 0.001 0.001 4357 1.792 0.589 0.001 0 0.003
Current Hand-rolled Cigarette Smokers 0.005 0.001 4357 1.688 0.283 0.003 0.002 0.008
Current Kretek Cigarette Smokers 0.023 0.004 4357 2.387 0.152 0.007 0.016 0.03
Current Users of Smokeless Tobacco 0.02 0.003 4294 2.362 0.166 0.006 0.013 0.026
Daily Tobacco Users 0.03 0.003 4357 1.747 0.114 0.007 0.023 0.037
Daily Tobacco Smoker 0.018 0.003 4357 1.722 0.146 0.005 0.013 0.023
Daily Cigarette Smokers 0.018 0.003 4357 1.722 0.146 0.005 0.013 0.023
Daily White Cigarette Smokers 0.001 0.001 4357 2.149 0.733 0.001 0 0.002
Daily Hand-rolled Cigarette Smokers 0.004 0.001 4357 1.738 0.332 0.002 0.001 0.006
Daily Kretek Cigarette Smokers 0.015 0.002 4357 1.676 0.158 0.005 0.011 0.02
Daily Users of Smokeless Tobacco 0.013 0.002 4294 1.728 0.177 0.004 0.008 0.017
Former Daily Tobacco Smokers Among All Adults 0.006 0.002 4357 1.866 0.266 0.003 0.003 0.009
Former Tobacco Smokers Among Ever Daily Smokers 0.232 0.051 130 1.874 0.219 0.1 0.132 0.332
Time to First Tobacco use w ithin 5 minutes of w aking 0.101 0.037 90 1.378 0.372 0.073 0.027 0.174
Time to First Tobacco use w ithin 6-30 minutes of w aking 0.2 0.053 90 1.579 0.267 0.104 0.095 0.304
Smoking Quit Attempt in the Past 12 Months 0.446 0.045 144 1.192 0.102 0.089 0.357 0.535
Health Care Provider Asked about Smoking 0.179 0.058 55 1.249 0.326 0.114 0.064 0.293
Health Care Provider Advised Quitting Smoking 0.13 0.052 55 1.308 0.403 0.103 0.027 0.233
Use of Counseling/Advice or Quit Lines for Smoking Cessation 0.131 0.062 59 1.931 0.469 0.121 0.01 0.252
Planning to quit, thinking about quitting, or w ill quit smoking 0.458 0.069 135 2.546 0.15 0.135 0.323 0.592
Exposure to SHS at Home 0.754 0.018 4278 7.592 0.024 0.036 0.719 0.79
Exposure to SHS at Workplace 0.414 0.031 539 2.083 0.074 0.06 0.354 0.474
Exposure to SHS in Government Buildings/Offices Among Those Who Visited 0.554 0.029 679 2.254 0.052 0.056 0.498 0.61
Exposure to SHS in Health Care Facilities Among Those Who Visited 0.165 0.016 1668 2.906 0.094 0.03 0.135 0.196
Exposure to SHS in Restaurants Among Those Who Visited 0.761 0.031 911 4.766 0.041 0.06 0.701 0.822
Exposure to SHS on Public Transportation Among Those Who Visited 0.624 0.028 1409 4.784 0.045 0.055 0.568 0.679
Last kretek purchase in store 0.218 0.066 103 2.607 0.303 0.129 0.089 0.348
Last kretek purchase at kiosk 0.778 0.066 103 2.599 0.085 0.13 0.648 0.908
Noticed Anti-tobacco Information on radio or television 0.384 0.02 4355 7.588 0.053 0.04 0.344 0.424
Noticed Health Warning Labels on Cigarette Packages 0.454 0.067 135 2.439 0.148 0.132 0.322 0.586
Thinking of Quitting Because of Health Warning Labels on Cigarette Package 0.17 0.043 135 1.748 0.253 0.084 0.086 0.254
Noticed Any Cigarette Advertisement or Promotion 0.782 0.015 4346 5.52 0.019 0.029 0.753 0.811
Noticed Cigarette Marketing in Stores Where Cigarettes are Sold 0.378 0.023 4355 9.665 0.06 0.045 0.333 0.423
Believes that Tobacco Smoking Causes Serious Illness 0.863 0.013 4357 6.665 0.016 0.026 0.836 0.889
Believes that Tobacco Smoking Causes Strokes 0.444 0.022 4356 8.424 0.049 0.043 0.401 0.487
Believes that Tobacco Smoking Causes Heart Attacks 0.8 0.017 4356 7.61 0.021 0.033 0.767 0.832
Believes that Tobacco Smoking Causes Lung Cancer 0.842 0.014 4357 6.236 0.016 0.027 0.815 0.869
Believes that Tobacco Smoking Causes Chronic Obstructive Pulmonary Disease (COPD) 0.347 0.031 4357 18.601 0.09 0.061 0.286 0.408
Believes that Tobacco Smoking Causes Premature Birth 0.506 0.022 4357 8.357 0.043 0.043 0.463 0.549
Believes that Using Smokeless Tobacco Causes Serious Illness 0.224 0.02 4357 10.308 0.09 0.04 0.184 0.264
Believes that SHS Causes Serious Illness in Non-Smokers 0.733 0.018 4355 7.289 0.025 0.035 0.697 0.768
Number of Cigarettes Smoked per Day (by daily smokers) 8.053 0.773 90 1.527 0.096 1.516 6.536 9.569
Time since Quitting Smoking (in years) 10.134 2.065 27 1.161 0.204 4.048 6.086 14.181
Average Amount Spent on 20 Kretek Cigarettes 11019.855 913.977 101 2.284 0.083 1791.396 9228.459 12811.25
Monthly Expenditures on Kretek Cigarettes 98979.196 10442.259 101 0.932 0.105 20466.828 78512.368 119446.024
Age at Daily Smoking Initiation Among Adults Age 20-34 17.944 1.109 15 0.72 0.062 2.174 15.77 20.117
C o nfidence limits
Table A.4: Sampling Errors - Female, GATS Indonesia, 2011.

102 Appendix A: Estimates of Sampling Errors
Indicator
Estimate
(R)
Standard
Error
(SE)
Sample
size
(n)
Design
Effect
(DEFT)
Relativ
e Error
(SE/R)
M argin
of Error
(M OE)
Lower Limit
(R-1.96SE)
Upper Limit
(R+1.96SE)
Current Tobacco Users 0.33 0.011 4053 2.221 0.033 0.022 0.309 0.352
Current Tobacco Smokers 0.319 0.011 4102 2.22 0.034 0.021 0.298 0.341
Current Cigarette Smokers 0.319 0.011 4102 2.22 0.034 0.021 0.298 0.341
Current White Cigarette Smokers 0.028 0.006 4102 5.125 0.207 0.011 0.017 0.04
Current Hand-rolled Cigarette Smokers 0.024 0.006 4102 6.106 0.247 0.012 0.012 0.035
Current Kretek Cigarette Smokers 0.286 0.012 4102 3.091 0.043 0.024 0.262 0.31
Current Users of Smokeless Tobacco 0.012 0.002 4024 1.613 0.178 0.004 0.008 0.017
Daily Tobacco Users 0.267 0.01 4102 2.221 0.039 0.02 0.246 0.287
Daily Tobacco Smoker 0.263 0.01 4102 2.222 0.039 0.02 0.243 0.283
Daily Cigarette Smokers 0.263 0.01 4102 2.222 0.039 0.02 0.243 0.283
Daily White Cigarette Smokers 0.021 0.004 4102 3.573 0.202 0.008 0.013 0.029
Daily Hand-rolled Cigarette Smokers 0.019 0.005 4102 5.769 0.272 0.01 0.009 0.029
Daily Kretek Cigarette Smokers 0.233 0.011 4102 2.596 0.046 0.021 0.213 0.254
Daily Users of Smokeless Tobacco 0.009 0.002 4024 1.279 0.191 0.003 0.005 0.012
Former Daily Tobacco Smokers Among All Adults 0.037 0.004 4102 2.257 0.121 0.009 0.028 0.045
Former Tobacco Smokers Among Ever Daily Smokers 0.114 0.014 1337 2.429 0.119 0.027 0.087 0.14
Time to First Tobacco use within 5 minutes of waking 0.07 0.015 1092 3.613 0.21 0.029 0.041 0.099
Time to First Tobacco use within 6-30 minutes of waking 0.34 0.036 1092 6.472 0.107 0.072 0.268 0.411
Smoking Quit Attempt in the Past 12 Months 0.359 0.031 1343 5.519 0.086 0.06 0.299 0.419
Health Care Provider Asked about Smoking 0.421 0.04 403 2.655 0.095 0.079 0.343 0.5
Health Care Provider Advised Quitting Smoking 0.356 0.034 403 2.029 0.096 0.067 0.289 0.422
Use of Counseling/Advice or Quit Lines for Smoking Cessation 0.085 0.028 493 4.833 0.325 0.054 0.031 0.139
Planning to quit, thinking about quitting, or will quit smoking 0.506 0.045 1304 10.478 0.089 0.088 0.419 0.594
Exposure to SHS at Home 0.685 0.028 3998 14.123 0.04 0.054 0.631 0.739
Exposure to SHS at Workplace 0.478 0.034 1000 4.508 0.07 0.066 0.412 0.544
Exposure to SHS in Government Buildings/Offices Among Those
Who Visited 0.586 0.031 951 3.781 0.053 0.061 0.525 0.647
Exposure to SHS in Health Care Facilities Among Those Who Visited 0.2 0.023 1501 4.852 0.114 0.045 0.155 0.244
Exposure to SHS in Restaurants Among Those Who Visited 0.874 0.016 1575 3.647 0.018 0.031 0.842 0.905
Exposure to SHS on Public Transportation Among Those Who
Visited 0.702 0.027 1528 5.495 0.039 0.054 0.648 0.756
Last kretek purchase in store 0.194 0.043 1147 13.703 0.223 0.085 0.11 0.279
Last kretek purchase at kiosk 0.788 0.044 1147 13.179 0.056 0.086 0.702 0.874
Noticed Anti-tobacco Information on radio or television 0.511 0.031 4098 15.772 0.061 0.061 0.45 0.572
Noticed Health Warning Labels on Cigarette Packages 0.731 0.036 1307 8.495 0.049 0.07 0.66 0.801
Thinking of Quitting Because of Health Warning Labels on Cigarette
Package 0.279 0.027 1305 4.675 0.096 0.053 0.227 0.332
Noticed Any Cigarette Advertisement or Promotion 0.897 0.012 4095 6.747 0.014 0.024 0.873 0.921
Noticed Cigarette Marketing in Stores Where Cigarettes are Sold 0.514 0.036 4098 20.942 0.069 0.07 0.444 0.584
Believes that Tobacco Smoking Causes Serious Illness 0.881 0.017 4102 11.537 0.019 0.034 0.848 0.915
Believes that Tobacco Smoking Causes Strokes 0.55 0.031 4100 16.043 0.057 0.061 0.489 0.611
Believes that Tobacco Smoking Causes Heart Attacks 0.854 0.019 4100 12.294 0.023 0.038 0.816 0.892
Believes that Tobacco Smoking Causes Lung Cancer 0.872 0.016 4102 9.822 0.019 0.032 0.84 0.904
Believes that Tobacco Smoking Causes Chronic Obstructive
Pulmonary Disease (COPD) 0.357 0.045 4101 36.715 0.127 0.089 0.268 0.446
Believes that Tobacco Smoking Causes Premature Birth 0.583 0.029 4102 13.706 0.049 0.056 0.527 0.639
Believes that Using Smokeless Tobacco Causes Serious Illness 0.217 0.027 4101 17.037 0.122 0.052 0.165 0.269
Believes that SHS Causes Serious Illness in Non-Smokers 0.795 0.022 4098 12.256 0.028 0.043 0.752 0.839
Number of Cigarettes Smoked per Day (by daily smokers) 12.254 0.394 1095 2.414 0.032 0.772 11.482 13.026
Time since Quitting Smoking (in years) 9.508 0.804 153 1.391 0.085 1.576 7.932 11.084
Average Amount Spent on 20 Kretek Cigarettes 14095.101 445.586 1145 4.603 0.032 873.348 13221.752 14968.449
Monthly Expenditures on Kretek Cigarettes 214470.94 10150.436 1145 2.388 0.047 19894.86 194576.084 234365.794
Age at Daily Smoking Initiation Among Adults Age 20-34 17.732 0.199 422 1.465 0.011 0.389 17.342 18.121
Table A.5: Sampling Errors - Urban, GATS Indonesia, 2011
Confidence limits

103 Appendix A: Estimates of Sampling Errors
Indicator
Estimate
(R)
Standard
Error
(SE)
Sample
size
(n)
Design
Effect
(DEFT)
Relative
Error
(SE/R)
M argin
of Error
(M OE)
Lower Limit
(R-1.96SE)
Upper Limit
(R+1.96SE)
Current Tobacco Users 0.391 0.013 4174 2.995 0.033 0.026 0.365 0.417
Current Tobacco Smokers 0.377 0.012 4203 2.558 0.032 0.023 0.353 0.4
Current Cigarette Smokers 0.376 0.012 4203 2.558 0.032 0.023 0.353 0.4
Current White Cigarette Smokers 0.016 0.003 4203 2.701 0.202 0.006 0.009 0.022
Current Hand-rolled Cigarette Smokers 0.071 0.012 4203 9.623 0.173 0.024 0.047 0.095
Current Kretek Cigarette Smokers 0.345 0.012 4203 2.898 0.036 0.024 0.321 0.369
Current Users of Smokeless Tobacco 0.022 0.003 4152 2.038 0.147 0.006 0.016 0.029
Daily Tobacco Users 0.33 0.013 4203 3.442 0.041 0.026 0.304 0.357
Daily Tobacco Smoker 0.322 0.013 4203 3.292 0.041 0.026 0.296 0.348
Daily Cigarette Smokers 0.321 0.013 4203 3.276 0.041 0.026 0.296 0.347
Daily White Cigarette Smokers 0.011 0.003 4203 2.611 0.24 0.005 0.006 0.016
Daily Hand-rolled Cigarette Smokers 0.057 0.01 4203 7.892 0.177 0.02 0.037 0.077
Daily Kretek Cigarette Smokers 0.284 0.014 4203 3.785 0.048 0.027 0.257 0.311
Daily Users of Smokeless Tobacco 0.015 0.002 4152 1.538 0.155 0.005 0.011 0.02
Former Daily Tobacco Smokers Among All Adults 0.029 0.004 4203 1.981 0.125 0.007 0.022 0.036
Former Tobacco Smokers Among Ever Daily Smokers 0.079 0.01 1543 2.266 0.131 0.02 0.059 0.099
Time to First Tobacco use within 5 minutes of waking 0.066 0.014 1330 4.513 0.22 0.028 0.037 0.094
Time to First Tobacco use within 6-30 minutes of waking 0.295 0.029 1330 5.485 0.099 0.057 0.238 0.353
Smoking Quit Attempt in the Past 12 Months 0.256 0.023 1566 4.318 0.09 0.045 0.211 0.301
Health Care Provider Asked about Smoking 0.392 0.044 510 4.101 0.112 0.086 0.306 0.478
Health Care Provider Advised Quitting Smoking 0.339 0.043 510 4.222 0.127 0.084 0.254 0.423
Use of Counseling/Advice or Quit Lines for Smoking Cessation 0.052 0.022 384 3.756 0.424 0.043 0.009 0.095
Planning to quit, thinking about quitting, or will quit smoking 0.472 0.037 1547 8.681 0.079 0.073 0.399 0.546
Exposure to SHS at Home 0.882 0.017 4179 11.616 0.019 0.033 0.849 0.916
Exposure to SHS at Workplace 0.624 0.033 317 1.468 0.053 0.065 0.559 0.689
Exposure to SHS in Government Buildings/Offices Among Those
Who Visited 0.712 0.037 587 3.962 0.052 0.073 0.639 0.785
Exposure to SHS in Health Care Facilities Among Those Who Visited 0.151 0.019 1155 3.263 0.126 0.037 0.114 0.189
Exposure to SHS in Restaurants Among Those Who Visited 0.817 0.048 803 12.274 0.059 0.094 0.723 0.911
Exposure to SHS on Public Transportation Among Those Who
Visited 0.696 0.033 969 5.013 0.048 0.065 0.631 0.761
Last kretek purchase in store 0.16 0.045 1347 20.452 0.283 0.089 0.071 0.248
Last kretek purchase at kiosk 0.806 0.049 1347 20.536 0.061 0.096 0.711 0.902
Noticed Anti-tobacco Information on radio or television 0.307 0.026 4203 12.897 0.083 0.05 0.257 0.357
Noticed Health Warning Labels on Cigarette Packages 0.715 0.031 1548 7.096 0.043 0.06 0.655 0.775
Thinking of Quitting Because of Health Warning Labels on Cigarette
Package 0.263 0.026 1548 5.434 0.099 0.051 0.212 0.315
Noticed Any Cigarette Advertisement or Promotion 0.795 0.02 4197 10.179 0.025 0.039 0.756 0.834
Noticed Cigarette Marketing in Stores Where Cigarettes are Sold 0.397 0.035 4203 21.532 0.088 0.069 0.329 0.466
Believes that Tobacco Smoking Causes Serious Illness 0.838 0.017 4203 9.449 0.021 0.034 0.804 0.872
Believes that Tobacco Smoking Causes Strokes 0.359 0.029 4203 15.541 0.081 0.057 0.302 0.416
Believes that Tobacco Smoking Causes Heart Attacks 0.774 0.022 4203 11.627 0.028 0.043 0.731 0.817
Believes that Tobacco Smoking Causes Lung Cancer 0.822 0.017 4203 8.049 0.02 0.033 0.789 0.854
Believes that Tobacco Smoking Causes Chronic Obstructive
Pulmonary Disease (COPD) 0.364 0.042 4203 32.268 0.116 0.083 0.281 0.447
Believes that Tobacco Smoking Causes Premature Birth 0.406 0.031 4203 16.359 0.075 0.06 0.346 0.466
Believes that Using Smokeless Tobacco Causes Serious Illness 0.262 0.029 4203 18.562 0.111 0.057 0.205 0.32
Believes that SHS Causes Serious Illness in Non-Smokers 0.678 0.025 4203 12.376 0.037 0.05 0.628 0.727
Number of Cigarettes Smoked per Day (by daily smokers) 13.301 0.492 1327 3.716 0.037 0.964 12.338 14.265
Time since Quitting Smoking (in years) 9.761 0.875 129 1.322 0.09 1.715 8.046 11.477
Average Amount Spent on 20 Kretek Cigarettes 11614.655 401.518 1331 2.827 0.035 786.975 10827.68 12401.63
Monthly Expenditures on Kretek Cigarettes 185143.36 10472.4 1331 3.061 0.057 20525.9 164617.457 205669.265
Age at Daily Smoking Initiation Among Adults Age 20-34 17.499 0.246 439 2.733 0.014 0.483 17.016 17.982
Confidence limits
Table A.6: Sampling Errors - Rural, GATS Indonesia, 2011

104 Appendix B: Sample Design
Appendix B: Sample Design
B.1 Introduction
The GATS was the first survey of its kind conducted in Indonesia (in 2011) to monitor tobacco use and was
designed to be a nationally representative household survey of all non-institutionalized men and women aged 15
years and above. The main objectives of this survey were to provide estimates of tobacco use, exposure to SHS and
frequency of quit attempts, and to monitor tobacco control interventions. The survey design requirements for this
study were developed such that precise estimates could be generated for the country as a whole, as well as for
two analysis groups defined by gender and urban/rural areas.
The GATS is designed to produce national and subnational estimates among adults across countries. The target
population of the GATS in Indonesia included all eligible individuals residing in all geographical areas in Indonesia.
It included the civilian non-institutionalized population of men and women aged 15 years and above living in the
included areas. This definition is important when completing the household questionnaire, which includes a
section where all eligible members of the household are listed and one is randomly chosen to complete the
individual questionnaire.
Individuals 15 years of age and above who were explicitly excluded from the survey were those who, at the time
that the Household Questionnaire was completed, were:
- non-citizens visiting the country for a few weeks (e.g. tourists, in the country to see friends/relatives, etc.);
- citizens in the military who indicated that their usual place of residence was a military base; or
- citizens who were institutionalized – people in hospitals, prisons, nursing homes and other such institutions;
such people were not sampled in the GATS.
Individuals were considered as residents of Indonesia if they were: (i) citizens of, and residing in, Indonesia; or (ii)
non-citizens who were living in Indonesia, and considered Indonesia to be their usual country of residence (i.e.
they had lived in Indonesia for at least half of the time during the 12 months prior to completing the Household
Questionnaire).
B.2 Sampling frame
The sampling frame used for the GATS 2011 was mainly CBs of the 2010 Population Census of Indonesia conducted
in May 2010. In total, there are 723 831 ordinary CBs composed of geographical areas of Indonesia. A CB is an area
within a village which is the smallest administrative area and covers 80–120 households. Therefore, a village is
completely divided into several CBs. The definition of urban and rural areas is applied to a village. Therefore, all
CBs in a village will have the same type of area as the village they belong to. If a village is an urban village, all CBs in
the village will also be urban CBs. On the other hand, if a village is a rural village, all CBs will also be rural.
The primary sampling unit (PSU) for the GATS is then defined as a group of CBs within a subdistrict in a certain
area, namely, urban or rural. In this case, a group of urban CBs and a group of rural CBs in a certain subdistrict
belong to a separate PSU. In other words, PSU is an area that is somewhere between a CB and subdistrict in size.

105 Appendix B: Sample Design
All urban CBs in the same subdistrict will be an urban PSU and all rural CBs in the same district will be a rural PSU.
Thus, a PSU in a rural area is not a village but a group of CBs classified as rural in the same subdistrict. Similarly, an
urban PSU is a group of CBs classified as urban in the same subdistrict. Both urban and rural PSUs may very well
have CBs from multiple villages or administrative areas under the subdistrict. So, each subdistrict contributes
either one or two PSUs to the GATS frame. It can be said that a PSU for the GATS design is in effect the set of all
urban CBs in a subdistrict or the set of all rural CBs in a subdistrict, in order to clearly facilitate separation of PSUs
by urban/rural areas. In this way, the GATS sampling frame consists of a list of all PSUs, including small and big
islands in Indonesia, regardless whether they are hard to reach (extremely remote) or not. In total, there are 9319
PSUs. On average, there are 78 CBs in a PSU. However, 69 among the 9319 PSUs have less than three CBs.
Remote areas are excluded from the sampling frame. In total, there are 353 PSUs among the 9319 PSUs which are
clasified as remote areas. Not all the remote areas are offshore island CBs. Some are in very isolated areas – in
forest or mountainous areas, for example. These remote areas constitute approximately 1.62% of the total
population, as shown in Table B.1.
Table B.1. Total number of PSUs by classification of areas – GATS Indonesia, 2011
AREAS PSU Census block Household Population %
Non-remote 8966 710,727 60,303,273 233,675,183 98.38
Remote 353 13,104 991,933 3,843,740 1.62
TOTAL 9319 723,831 61,295,206 237,518,923 100.00
Indonesia consists of many islands and is divided into 33 provinces and 497 districts. For implementation of the
GATS 2011, these 33 provinces were then stratified into four groups—Sumatra, which covers all provinces in
Sumatra island; Java–Bali, which covers all provinces in Java and Bali islands; Kalimantan–Nusa Tenggara, which
includes all provinces in Kalimantan and Nusa Tenggara islands; and Eastern, which consists of all other provinces
in the eastern part of Indonesia. PSUs were then stratified according to these regions.
The total number of PSUs selected for GATS Indonesia 2011 was 100. According to the GATS standard protocol, the
PSUs should be equally distributed between urban and rural areas. Hence, 50 PSUs were selected to represent
urban areas, and 50 PSUs were drawn from the rural PSUs. Before a PSU was selected, 50 PSUs in each area were
proportionally allocated to each region according to their population size, as shown in TableB.2.

106 Appendix B: Sample Design
Table B.2. Total number of sample PSUs by place of residence and region – GATS Indonesia, 2011
Urbanicity Region Population Allocation
Number of
PSU samples
1 1 18,854,356 7.728082 8
1 2 87,283,784 35.77615 36
1 3 8,678,208 3.557051 4
1 4 7,169,648 2.938718 2
URBAN 50
2 1 30,262,700 12.28246 12
2 2 64,299,312 26.0966 26
2 3 14,130,412 5.734986 6
2 4 14,502,404 5.885963 6
RURAL 50
B.3 Sample design
The GATS 2011 adopted a four-stage stratified cluster sample of households. This design was applied in each
stratum. In the first stage, a number of PSUs were selected with PPS. The measure of size (MoS) used to select
PSUs was the total number of households in each PSU according to the results of the 2010 Population Census (see
Figure B1 for the distribution of districts where PSUs were selected). In the second stage, three SSUs were also
selected using PPS, with the MoS as the total number of households in each SSU or CB. For choosing CBs within a
selected PSU, in both urban and rural PSUs, a list of CBs was sorted by village within each PSU, implying that use of
the village was implicit. Household selection in the third stage was an equal probability systematic selection with
30 households per CB, using a fractional interval technique. Finally, in the fourth stage, one individual was
randomly chosen from all the eligible persons in a selected household.
B.4 Sample size
The GATS is designed to produce estimates that meet the following precision requirements:
1. Estimates computed at the national level, by urbanicity, gender and the cross of gender and urbanicity
should have a 95% confidence interval with a margin of error of 3 percentage points or less for tobacco
use rates of 40%.
2. Sample sizes should be sufficiently large to accommodate the statistical power requirements for tests to
detect differences between survey rounds with independently chosen samples.
Assuming a design effect of 2.00 for estimates computed at the national level by urban/rural classification, by
gender and by the cross of gender and urban/rural area, the minimum sample sizes needed to accommodate these
precision requirements were 2000 respondents in each of the four groups defined by the cross of urban/rural
residence and gender. This resulted in a minimum expected respondent sample size of 8000.

107 Appendix B: Sample Design
Figure B.1. Distribution of districts where PSUs were selected – GATS Indonesia, 2011

108 Appendix B: Sample Design
However, in order to compensate for non-response based on the previous surveys done by BPS, the following
information was used to fix the number of households sampled:
- Total number of respondents in the stratum – 4000
- Individual eligibility rate – 98%
- Individual response rate – 95%
- Household eligibility rate – 100%
- Household response rate – 97%
- Percentage of households with at least one eligible respondent – 99%
Total number of selected people within households : 4000/ (0.98*0.95) = 4297
Total number of selected households : 4297/ (1*0.97*0.99) = 4475
So the total household sample will be : 2*4475 = 8950
As a result, the number of households selected in each CB was fixed at 30 households and the final adjusted
sample size of 9000 households was used.
B.5 Sampling probabilities and sampling weights
The weighting process for the GATS involved a three-step process: (1) the base weight or design weight, calculated
from all steps of random selection in the sample design, (2) an adjustment for non-response by sample households
and sample individuals eligible for the survey, and (3) a post-stratification adjustment (calibration) of sample totals
with the known population totals.
B.5.1 Base weight
The inverse of the unconditional probability of selection was the final selection weight (base weight) for each
respondent, which is the product of the probabilities of selection associated with each stage of the design. In order
to calculate the sampling weights, sampling probabilities were calculated separately for each sampling stage:
1
hip = Unconditional probability of selecting the i-th PSU in the h-th stratum;
2
hijp = Conditional probability (given PSU selections) of selecting the CB;
3
hijkp = Conditional probability (given PSU and CB selections) of selecting the household;
4
hijklp = Conditional probability (given PSU, CB and household selections) of randomly selecting one
respondent per household
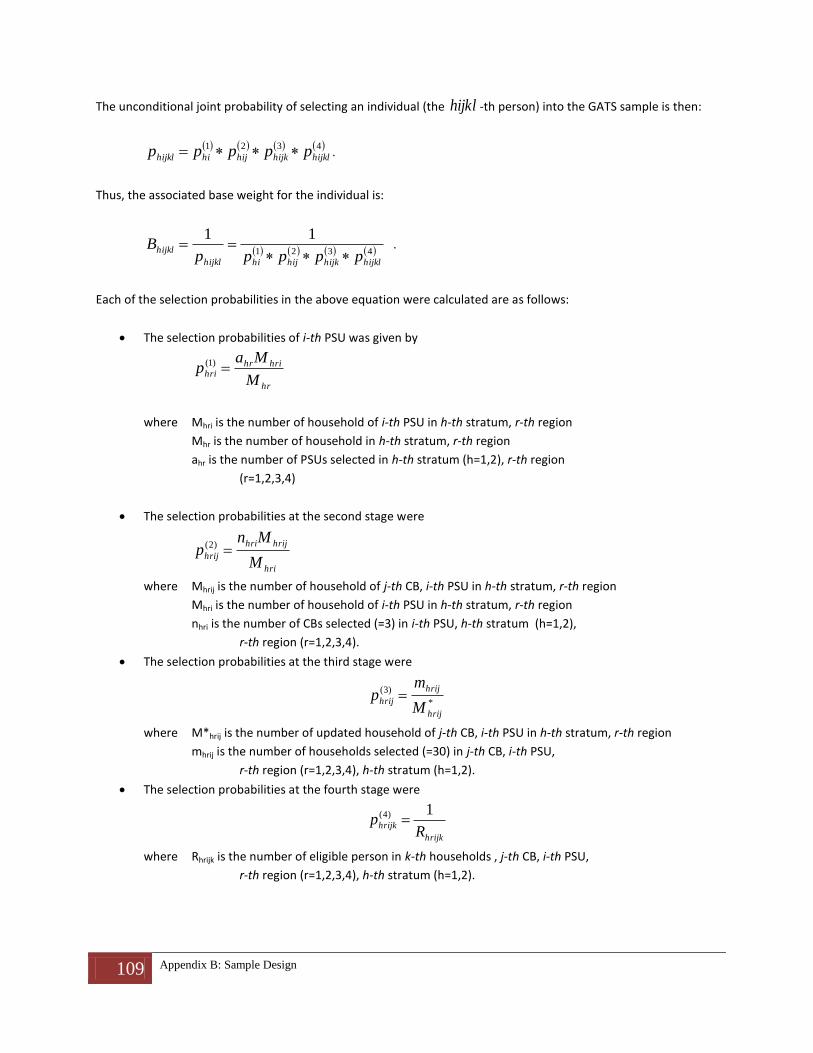
109 Appendix B: Sample Design
The unconditional joint probability of selecting an individual (the hijkl -th person) into the GATS sample is then:
4321
hijklhijkhijhihijkl ppppp .
Thus, the associated base weight for the individual is:
4321
11
hijklhijkhijhihijkl
hijklppppp
B
.
Each of the selection probabilities in the above equation were calculated are as follows:
The selection probabilities of i-th PSU was given by
hr
hrihrhri
M
Map )1(
where Mhri is the number of household of i-th PSU in h-th stratum, r-th region
Mhr is the number of household in h-th stratum, r-th region
ahr is the number of PSUs selected in h-th stratum (h=1,2), r-th region
(r=1,2,3,4)
The selection probabilities at the second stage were
hri
hrijhri
hrijM
Mnp )2(
where Mhrij is the number of household of j-th CB, i-th PSU in h-th stratum, r-th region
Mhri is the number of household of i-th PSU in h-th stratum, r-th region
nhri is the number of CBs selected (=3) in i-th PSU, h-th stratum (h=1,2),
r-th region (r=1,2,3,4).
The selection probabilities at the third stage were
*
)3(
hrij
hrij
hrijM
mp
where M*hrij is the number of updated household of j-th CB, i-th PSU in h-th stratum, r-th region
mhrij is the number of households selected (=30) in j-th CB, i-th PSU,
r-th region (r=1,2,3,4), h-th stratum (h=1,2).
The selection probabilities at the fourth stage were
hrijk
hrijkR
p1)4(
where Rhrijk is the number of eligible person in k-th households , j-th CB, i-th PSU,
r-th region (r=1,2,3,4), h-th stratum (h=1,2).

110 Appendix B: Sample Design
B.5.2 Adjustment for unit non-response
The base weights were adjusted for non-response on two factors: household-level non-response adjustments, and person-level non-response adjustments. Household-level non-response adjustments were made within the PSU. The corresponding household-level weighting class adjustment was computed as one divided by the weighted household response rate for each sample PSU. The person-level response rate was computed by roster-reported gender, age and current smoking status.
B.5.3 Post-stratification calibration adjustment
In principle, the goal of a calibration weight adjustment is to bring weighted sums of the sample data in line with the corresponding counts in the target population. Provisional population total projections of persons 15 years and above by urban/rural residence, and respondent-reported gender and age groups (15–24, 25–44, 45–64 and 65+ years) from the population projection of the 2010 Population Census of Indonesia in September 2011 were used for post-stratification calibration adjustment.
Ultimately, the final analysis weight (W) for the j-th respondent data record was computed as the product of the base weights, the non-response adjustment and post-stratification calibration adjustment. The final weights were used in all analyses to produce estimates of population parameters.

111 Appendix C: Glossary and Abbreviations
Appendix C: Glossary and Abbreviations
Adults Population 15 years of age and above
Awareness of cigarette advertising, promotion and sponsorship
Respondents who have noticed cigarettes at the point of sale, free gifts or discount offers on other products when buying cigarettes, or any advertisements or signs promoting cigarettes in stores where cigarettes are sold, in the past 30 days, or who have noticed any advertisement or sign promoting cigarettes of cigarette companies, sponsorships of sporting events other than in stores where cigarettes are sold, in the past 30 days
Beliefs about the dangers of second-hand smoke
Respondents who believe that breathing other people’s smoke causes serious illness in non-smokers.
Beliefs about the dangers of tobacco smoking
Respondents who believe that tobacco smoking causes serious illness and specific diseases, i.e. stroke, heart attack, lung cancer, COPD, Bladder Cancer, Stomach cancer, premature birth and bone loss.
BPS Badan Pusat Statistik—BPS Statistics Indonesia. It is national statistical organization working under the Ministry of Planning, Indonesia.
CB Census Block
CCT Conditional Cash Transfer
CDC US Centers for Disease Control and Prevention
COPD Chronic Obstructive Pulmonary Disease
Current smokeless tobacco user
Smokeless tobacco user who daily or occasionally uses any smokeless tobacco product
Current smoking
It includes daily smoking and occasional smoking: 1. Daily smoking means smoking at least one tobacco product every day or nearly every day
over a period of a month or more 2. Occasional smoking (less than daily)
DALY Disability-Adjusted Life Year
Exposure to anti-smoking information
Respondents who have noticed information on various media in the past 30 days about the dangers of cigarette smoking and those that encourage quitting
Exposure to second-hand smoke at home
Exposure to second-hand smoke particularly inside the respondent’s home, not including outside areas such as patio, balcony, garden, etc. which are not fully enclosed
Exposure to second-hand smoke in public places
Includes smoking by respondents and seeing somebody smoke, smelling the smoke, or seeing cigarette butts in indoor areas in public places visited by them in the past 30 days. Public places include:
Government buildings: Covers indoor areas which are designated non-smoking areas by national smoke-free laws
Health-care facilities: Covers indoor areas of both public and private health-care facilities which are designated non-smoking areas by national smoke-free laws
Restaurants: Covers the indoor areas of places selling food and/or beverages, and does not include the area in front of any building and wayside
Public transportation: Cll public transport both with and without air conditioning
FCTC Framework Convention on Tobacco Control
GATS Global Adult Tobacco Survey
GDP Gross Domestic Product
GHPSS Global Health Professions Students Survey
GSPS Global School Personnel Survey
GSS General Survey System
GTSS Global Tobacco Surveillance System
GYTS Global Youth Tobacco Survey
HCP Health-Care Provider; includes various health professionals such as medical doctors, nurses,

112 Appendix C: Glossary and Abbreviations
pharmacists, health workers, etc.
Interest in quitting smoking
Current tobacco smokers who are planning or thinking about quitting smoking within the next month, 12 months, or some day
MOH Ministry of Health, Indonesia
MoS Measure of Size
MPOWER WHO publication with six key strategies for tobacco control:
Monitor tobacco use and prevention policies
Protect people from tobacco smoke
Offer help to quit tobacco use
Warn about the dangers of tobacco
Enforce bans on tobacco advertising, promotion and sponsorship
Raise taxes on tobacco
NGO Non-Governmental Organization
NIHRD National Institute of Health Research and Development. It works under the Ministry of Health, Indonesia
NIHRD National Institute for Health Research and Development
NRT Nicotine Replacement Therapy
PPS Probability Proportional to Size
Prevalence Statistical concept referring to the number of occurrences of tobacco use present in a particular population aged 15 years and above at a given time
PSU primary sampling unit
QRC Questionnaire Review Committee. It is a group of international experts for advising a country on questionnaire issues of GATS
Quit attempt Current tobacco smokers who tried to quit during the past 12 months and former tobacco smokers who have been abstinent for >12 months
SD Secure Digital
SDF Standard Data File
SHS Second-Hand Smoke
SRC Sample Review Committee. A group of international experts for advising a country on sample issues of GATS.
SSU Secondary Sampling Unit
SUSENAS National Socio-Economic Survey
TCSC Tobacco Control Support Centre
Thinking of quitting because of health warning on cigarette packages
Current tobacco smokers who thought about quitting smoking in the past 30 days because of the warning on cigarette packages
Tobacco products There are two types of tobacco products: 1. Smoked tobacco:
a. kretek – a cigarette with cloves b. white cigarette c. hand-rolled cigarette d. other smoked tobacco products such as pipe, cigar, khi‐yo, cheroot, water pipe,
hookah, and others 2. Smokeless tobacco:
a. snuff by keeping in the mouth/nose b. chewing tobacco c. betel quid with tobacco d. others
TQS Tobacco Questions for Surveys
WHO World Health Organization
WHO SEARO World Health Organization, Regional Office for South-East Asia

113 Appendix D: Technical and Survey Staff
Appendix D: Technical and Survey Staff
Steering Committee
Dr Trihono, Director, NIHRD, MOH
Dr Wynandin Imawan, Deputy Director General for Social Statistics, BPS-
Statistics Indonesia
Principal investigator
S. Happy Hardjo, Director of People Welfare Statistics, BPS-Statistics Indonesia
Co-principal investigator
Soewarta Kosen, NIHRD, MOH
Co-investigators
Gantjang Amanullah, BPS-Statistics Indonesia
Bambang Ananto Cahyono, BPS-Statistics Indonesia
Ahmad M. Saleh, BPS-Statistics Indonesia
I Made Arcana, BPS-Statistics Indonesia
J. Purwanto Ruslam, BPS-Statistics Indonesia
Kadarmanto, BPS-Statistics Indonesia
Ingan Tarigan, NIHRD, MOH
Endang Indriasih, NIHRD, MOH
Merry Luciana, NIHRD, MOH
IT professionals
Dwino Daries, BPS-Statistics Indonesia
Nila Nurmala, BPS-Statistics Indonesia
Indra Cahyono, BPS-Statistics Indonesia
Administrative staff
Nurhaida Dolok Pasaribu, BPS-Statistics Indonesia
Mutiara Christianny, BPS-Statistics Indonesia

114 Appendix D: Technical and Survey Staff
Facilitators
Training Centre
Medan
Padang
Palembang
Bandar Lampung
Bogor
Serang
Bandung
Pontianak
Semarang
Banjarmasin
Surabaya
Makassar
Questionnaire
Din Nurika Agustina
Din Nurika Agustina
Maria Ulfa
Merry Luciana
Rida Agustina
Eva Yugiana
Ingan Tarigan
Boni
Mayang Sari
Mayang Sari
Endang Indriasih
Endang Indriasih
IT
Nila Nurmala
Nila Nurmala
Kadarmanto
Joko Widiarto
Dwino Daries
Ferandya Yudhianto
Kadarmanto
Dwi Susilo
Dwino Daries
Dwi Susilo
Indra Cahyono
Indra Cahyono
Field staff
Province Field interviewer Field supervisor
1. SUMATERA UTARA Gusli Tanjung Jenfrido Lumban Tobing
Daniel Pasaribu Ridho Julandra
Mawardi Nur Abdul Hakim Parapat
Dame Magdalena M. Iriansyah
Teza Thalita Mohammad Iqbal
Manombang Lumban
Tobing Riza Dwi Agni
2. SUMATERA BARAT Gumanto Abrianta
Devinaldi Amrin Maarin
3. RIAU Nasrun Apriyanti
Aprizal Syaputra Eko Adi Priyanto
4. JAMBI Citra Saputra Eny Kusrini

115 Appendix D: Technical and Survey Staff
5. SUMATERA SELATAN Linus Zulkarnain Nugraha Pukuh
Dina Mawarni Mariyah K.
Lahmodin Oktanata Erikson S.
Agus Arliansyah Nur Yanuar SST
Yopisyah Putra Clara Tridiana
Harmito Edyson
6. LAMPUNG John Fernando S. Anne Oktavia A.
Radika Trianda Dewi R.
Erwan Yosep
7. DKI JAKARTA Nur Pudyanto Tri Lestari
Mediana Tri Lestari
Lisiana Hasbulah
Zen AR Hasbulah
Urip K. Rini Apsari
Diah Dwi Paryani Rini Apsari
8. JAWA BARAT Cucu Hamzah K. Dedi Sugandi
Irwan Nurdiansah Z. Dindin Budiman
Hendra Wawan Rusmana
Neng Susilawati Encep Wagan R.
Dani Wildan Hakim Encep Wagan R.
Listiya Putri Ikin Sodikin
Wendi Hilman Dani Hapidin R.
Sunanto Ena Heriyana
Sugeng Wahyudi Ena Heriyana
Indra Satrio Enung Rohaeti
Agus Rosidi Asep Surya
Yulia Puspitasari Mina Nur Aini
Jajang Sudrajat Mina Nur Aini
Warsa Kartiwa Dibya

116 Appendix D: Technical and Survey Staff
Neni Agustini Dibya
Risky Hadi Pebriyandi Didin Tajudin
Moch. Faizin Yuri P. Ir. H. Mukhtarsyah
9. JAWA TENGAH Dimas Fajar Bawono Manan Ajhari
Ulfatu Afifah Syarifah Manan Ajhari
Imam Baihaqi Heni Djumadi
Ari Yulianto Heni Djumadi
Budi Setyo Wibowo Yusuf Isnandar
Sugeng Haryadi Ir. Agus Riyanto
Ana Afiqotul A Dani Dwi Widagdo
Warsidi Ir. Sad Sasmokohadi
Yuffie dwi Azmi H. Agung Wagito
Faisal Luthfi Arief Khaerul Anwar
Ekha Jaya Prianjani Dra. Tri Setyowati
Puja Sulistyawan Pudyastuti S.,
Tolkhah Mansyur Tati Rosyidah
Z. Adhi Perdana Neli Durriyati
Gagah T. Adi Yuwono Suwardi
Muhammad Wisbantoro, Djoko Sihono
10. YOGYAKARTA Rio Jakaria Ir. Dyah Maryanti
Galuh Widyastuti Ir. Dyah Maryanti
Paulus Henri Laksono Alwan Fauzani
11. JAWA TIMUR Aminin Ariyanto Sapto Wintardi
Andy Patriyanto Sapto Wintardi
Bagus Ari Prasetyo, Supardi,
H. Indrianto Kukuh Lukman Hakim
Nanang Pamungkas Supardi
Oanesa Timoralif C Lukman Hakim
Abdul Hadi Benny Kusharyadi

117 Appendix D: Technical and Survey Staff
Didik Santoso Benny Kusharyadi
Bastian Pratama Rusmaladewi
Rudhy Kendarwoko Vita Wisnandayi
M. Agung Zulkarnain Agip Yunaidi Solichin
Suryanto Bagyo Trilaksono
Moch. Hanafi Yoyok Hari Susanto
Purwaningsih Maulan
Moh. Agus Masrul Nor Amin Setiawan
12. BANTEN Andi Yusup Rinto Tajudin
Roatul Makhfud Rinto Tajudin
Didin Ritaudin Nana Suharna
Diasitta Yusuf M. Nafies
Raditya Yoga P. M. Nafies
13. NUSA TENGGARA
BARAT IGA Nyoman Sawitri Ir. H. Keman
Yustini Baiq Kartini
14. KALIMANTAN BARAT Firmansyah Any Pebruana
Arif Fajar Munawaroh
Fahrizal Munawaroh
Yusmarini Tommy
15. KALIMANTAN TENGAH Retno Setyono Febrim Leksiando Sipayung,
Restu Kristianto Nurdiansyah
16. KALIMANTAN SELATAN Agung Dwi Permatasari Sukma Handayani
Akhyar Arifin Fauzi M. Husni
17. SULAWESI UTARA
Kharis Metanoia Hendrik
YM Kusuma Dewi Kris Andriyani

118 Appendix D: Technical and Survey Staff
18. SULAWESI SELATAN Nurlela Eko Hardiyanto
Andi Alwi Bahanudding
Hj. Megawati Ajirah
Ramin Agustina Rumpa
Rhadyan Gema Bwana Agustina Rumpa
19. MALUKU Vandy Breemer Jan Piterzon Lekatompessy
Jefry Tipka Jan Piterzon Lekatompessy

119 Appendix D: Technical and Survey Staff
Questionnaire Review Committee (QRC)
Gary Giovino, QRC Chair ¯ State University of New York at Buffalo
Ben Apelberg, US Food and Drug Administration
Ron Borland, Cancer Council, Victoria
Daniel Ferrante, Ministry of Health, Argentina
Prakash Gupta, Healis¯Sekhsaria Institute for Public Health
Mostafa Mohammed, Egyptian Smoking Prevention Research Institute
Jeremy Morton, QRC Coordinator ¯ US Centers for Disease Control and Prevention
Sample Review Committee (SRC)
William D. Kalsbeek, SRC Chair ¯ University of North Carolina Gillings School of Public Health
Michael Bowling, University of North Carolina Gillings School of Public Health
Tarun K. Roy, International Institute for Population Sciences, India
Krishna Mohan Palipudi, US Centers for Disease Control and Prevention
Sophia Y. Song, SRC Coordinator, US Centers for Disease Control and Prevention
World Health Organization
Dhirendra N. Sinha (WHO-SEARO)
Sameer Pujari (WHO-HQ)
Wibisana Widyastuti (WHO-Indonesia)
Centers for Disease Control and Prevention (CDC)
Samira Asma, Chief, Global Tobacco Control Branch
Krishna Mohan Palipudi, Senior Survey Statistician, CDC Focal Point
Linda Andes
Glenda Blutcher Nelson
Edward O Rainey
Brian Taitt
Sophia Y. Song
GATS partner organizations
Centers for Disease Control and Prevention (CDC)
CDC Foundation
Johns Hopkins Bloomberg School of Public Health (JHSPH)
RTI International
World Health Organization (WHO)

120 Appendix E: Questionnaires
Appendix E: Questionnaires
Household questionnaire
INTRO. [THE HOUSEHOLD SCREENING RESPONDENT SHOULD BE 18 YEARS OF AGE OR OLDER AND YOU MUST
BE CONFIDENT THAT THIS PERSON CAN PROVIDE ACCURATE INFORMATION ABOUT ALL MEMBERS OF
THE HOUSEHOLD. IF NEEDED, VERIFY THE AGE OF THE HOUSEHOLD SCREENING RESPONDENT TO MAKE
SURE HE/SHE IS 18 YEARS OF AGE OR OLDER.
THE HOUSEHOLD SCREENING RESPONDENT CAN BE LESS THAN 18 YEARS OF AGE ONLY IF NO
HOUSEHOLD MEMBERS ARE 18 YEARS OF AGE OR OLDER.]
INTRO1. An important survey of adult tobacco use behaviour is being conducted by BPS-Statistics Indonesia
throughout Indonesia and your household has been selected to participate. All houses selected were
chosen from a scientific sample and it is very important to the success of this project that each
participates in the survey. All information gathered will be kept strictly confidential. I have a few
questions to find out who in your household is eligible to participate.
HH1. First, I’d like to ask you a few questions about your household. In total, how many persons live in
this household?
[INCLUDE ANYONE WHO CONSIDERS THIS HOUSEHOLD THEIR USUAL PLACE OF RESIDENCE]
HH2. How many of these household members are 15 years of age or older?
[IF HH2 = 00 (NO HOUSEHOLD MEMBERS > 15 YEARS IN HOUSEHOLD)]
[THERE ARE NO ELIGIBLE HOUSEHOLD MEMBERS.]
THANK THE RESPONDENT FOR HIS/HER TIME.
THIS WILL BE RECORDED IN THE RECORD OF CALLS AS CODE 201.]

121 Appendix E: Questionnaires
HH4. I would now like to collect information about only these persons that live in this household who
are 15 years of age or older. Let’s start listing them from oldest to youngest.
HH4a. What is the {oldest/next oldest} person’s first name? ________________________
HH4b. What is this person’s age?
[IF RESPONDENT DOESN’T KNOW, PROBE FOR AN ESTIMATE]
[IF REPORTED AGE IS 15 THROUGH 17 YEARS, BIRTH DATE IS ASKED]
HH4c. What is the month of this person’s date of birth?
HH4cYEAR. What is the year of this person’s date of birth?
[IF DON’T KNOW, ENTER 7777
IF REFUSED, ENTER 9999]
HH4d. Is this person a man or woman?
MAN ................. 1
WOMAN............ 2
HH4e. Does this person currently smoke tobacco, including cigarettes, kretek cigarettes, cigars,
pipes?
YES .................... 1
NO .................... 2
DON’T KNOW ... 7
REFUSED ........... 9
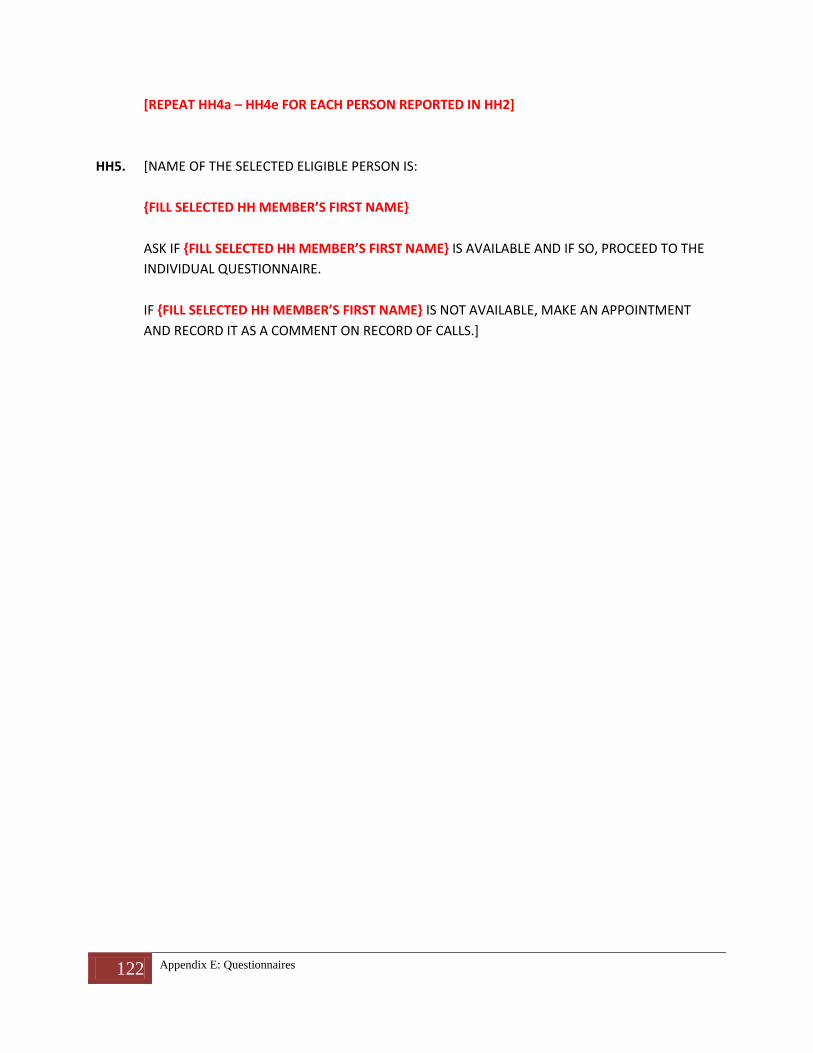
122 Appendix E: Questionnaires
[REPEAT HH4a – HH4e FOR EACH PERSON REPORTED IN HH2]
HH5. [NAME OF THE SELECTED ELIGIBLE PERSON IS:
{FILL SELECTED HH MEMBER’S FIRST NAME}
ASK IF {FILL SELECTED HH MEMBER’S FIRST NAME} IS AVAILABLE AND IF SO, PROCEED TO THE
INDIVIDUAL QUESTIONNAIRE.
IF {FILL SELECTED HH MEMBER’S FIRST NAME} IS NOT AVAILABLE, MAKE AN APPOINTMENT
AND RECORD IT AS A COMMENT ON RECORD OF CALLS.]

123 Appendix E: Questionnaires
Individual questionnaire
CONSENT1. [SELECT THE APPROPRIATE AGE CATEGORY BELOW. IF NEEDED, CHECK THE AGE OF THE
SELECTED RESPONDENT FROM THE “CASE INFO” SCREEN IN THE TOOLS MENU.]
15–17 ............................................... 1 → GO TO CONSENT 2
18 OR OLDER .................................... 2 → GO TO CONSENT 5
EMANCIPATED MINOR (15–17) ....... 3 → GO TO CONSENT 5
CONSENT2. Before starting the interview, I need to obtain consent from a parent or guardian of
[NAME OF RESPONDENT] and from [NAME OF RESPONDENT].
[IF BOTH SELECTED RESPONDENT AND PARENT/GUARDIAN ARE AVAILABLE, CONTINUE
WITH INTERVIEW.
IF PARENT/GUARDIAN IS NOT AVAILABLE, BREAK OFF INTERVIEW AND SCHEDULE AN
APPOINTMENT TO RETURN.
IF MINOR RESPONDENT IS NOT AVAILABLE, CONTINUE WITH OBTAINING PARENTAL
CONSENT.]
CONSENT3. [READ THE FOLLOWING TO THE PARENT/GUARDIAN AND SELECTED RESPONDENT (IF
AVAILABLE):]
I am working with BPS-Indonesia. This institution is collecting information about tobacco use in
Indonesia. This information will be used for public health purposes by the Ministry of Health.
Your household and [NAME OF RESPONDENT]’s have been selected at random. [NAME OF
RESPONDENT]’s responses are very important to us and the community, as these answers will
represent many other persons.
The interview will last around 30 minutes. [NAME OF RESPONDENT]’s participation in this survey
is entirely voluntary. The information that [NAME OF RESPONDENT] will provide will be kept
strictly confidential and [NAME OF RESPONDENT] will not be identified by his/her responses.
Personal information will not be shared with anyone else, not even other family members
including you. [NAME OF RESPONDENT] can withdraw from the study at any time, and may
refuse to answer any question.
We will leave the necessary contact information with you. If you have any questions about this
survey, you can contact the telephone numbers listed.

124 Appendix E: Questionnaires
If you agree with [NAME OF RESPONDENT]’s participation in this survey, we will conduct a
private interview with him/her.
[ASK PARENT/GUARDIAN:] Do you agree with [NAME OF RESPONDENT]’s participation?
YES ....... 1 → GO TO CONSENT4
NO ....... 2 → END INTERVIEW
CONSENT4. [WAS THE SELECTED MINOR RESPONDENT PRESENT?]
PRESENT ................. 1 → GO TO CONSENT6
NOT PRESENT ......... 2 → GO TO CONSENT5
CONSENT5. [READ TO THE SELECTED RESPONDENT:]
I am working with BPS-Indonesia. This institution is collecting information about tobacco use in
Indonesia. This information will be used for public health purposes by the Ministry of Health.
Your household and you have been selected at random. Your responses are very important to us
and the community, as these answers will represent many other persons. The interview will last
around 30 minutes. Your participation in this survey is entirely voluntary. The information that
you will provide us will be kept strictly confidential, and you will not be identified by your
responses. Personal information will not be shared with anyone else, not even other family
members. You can withdraw from the study at any time, and may refuse to answer any question.
We will leave the necessary contact information with you. If you have any questions about this
survey, you can contact the telephone numbers listed.
{FILL IF CONSENT4=2: Your parent/guardian has given his/her permission for you to participate in
this study}
If you agree to participate, we will conduct a private interview with you.

125 Appendix E: Questionnaires
CONSENT6. [ASK SELECTED RESPONDENT:] Do you agree to participate?
YES ....... 1 → PROCEED WITH INTERVIEW
NO ....... 2 → END INTERVIEW
INTLANG. [IS THIS INTERVIEW BEING CONDUCTED IN BAHASA OR IS IT BEING TRANSLATED AND
CONDUCTED IN ANOTHER LANGUAGE?]
BAHASA ............................... 1 → GO TO SECTION A
ANOTHER LANGUAGE ......... 2
INTLANG1. [WHAT LANGUAGE IS THIS INTERVIEW BEING CONDUCTED IN?]
____________________________________________
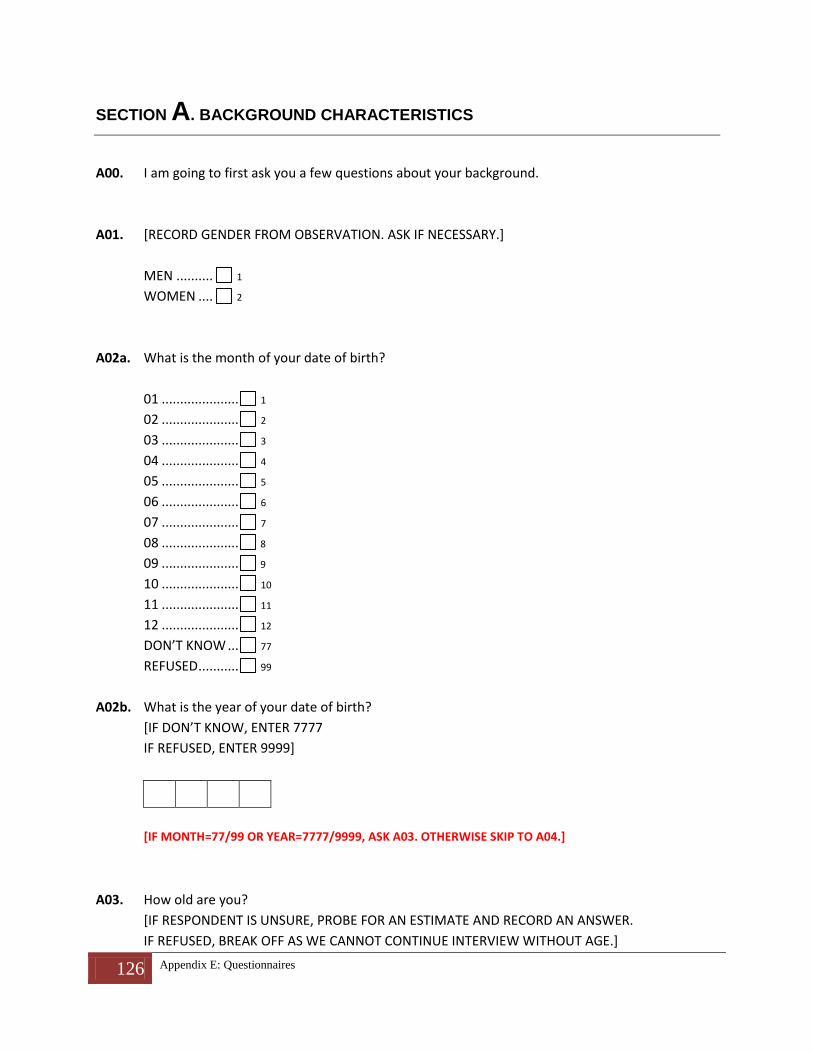
126 Appendix E: Questionnaires
SECTION A. BACKGROUND CHARACTERISTICS
A00. I am going to first ask you a few questions about your background.
A01. [RECORD GENDER FROM OBSERVATION. ASK IF NECESSARY.]
MEN .......... 1
WOMEN .... 2
A02a. What is the month of your date of birth?
01 ..................... 1
02 ..................... 2
03 ..................... 3
04 ..................... 4
05 ..................... 5
06 ..................... 6
07 ..................... 7
08 ..................... 8
09 ..................... 9
10 ..................... 10
11 ..................... 11
12 ..................... 12
DON’T KNOW ... 77
REFUSED ........... 99
A02b. What is the year of your date of birth?
[IF DON’T KNOW, ENTER 7777
IF REFUSED, ENTER 9999]
[IF MONTH=77/99 OR YEAR=7777/9999, ASK A03. OTHERWISE SKIP TO A04.]
A03. How old are you?
[IF RESPONDENT IS UNSURE, PROBE FOR AN ESTIMATE AND RECORD AN ANSWER.
IF REFUSED, BREAK OFF AS WE CANNOT CONTINUE INTERVIEW WITHOUT AGE.]

127 Appendix E: Questionnaires
A03a. [WAS RESPONSE ESTIMATED?]
YES .......................... 1
NO .......................... 2
DON’T KNOW ......... 7
A04. What is the highest level of education you have completed?
[SELECT ONLY ONE CATEGORY]
LESS THAN PRIMARY SCHOOL COMPLETED .............................. 1
PRIMARY SCHOOL COMPLETED ................................................ 2
SECONDARY SCHOOL COMPLETED ............................................ 3
HIGH SCHOOL COMPLETED ....................................................... 4
COLLEGE/UNIVERSITY COMPLETED........................................... 5
POSTGRADUATE DEGREE COMPLETED ..................................... 6
DON’T KNOW ............................................................................ 77
REFUSED .................................................................................... 99
A05. Which of the following best describes your *main* work status over the past 12 months?
Government employee, nongovernment employee, self-employed, student, home-maker,
retired, unemployed-able to work, or unemployed-unable to work?
[INCLUDE SUBSISTENCE FARMING AS SELF-EMPLOYED]
GOVERNMENT EMPLOYEE ................................... 1
NONGOVERNMENT EMPLOYEE ........................... 2
SELF-EMPLOYED/SUBSISTENCE FARMING ........... 3
STUDENT .............................................................. 4
HOME MAKER ...................................................... 5
RETIRED ................................................................ 6
UNEMPLOYED, ABLE TO WORK ........................... 7
UNEMPLOYED, UNABLE TO WORK ...................... 8
DON’T KNOW ....................................................... 77
REFUSED ............................................................... 99
A06. Please tell me whether this household or any person who lives in the household has the
following items:

128 Appendix E: Questionnaires
YES
NO
DON’T
KNOW
REFUSED
▼ ▼ ▼ ▼
a. Electricity? ............................. 1 ..... 2 ......... 7............ 9
b. Flush toilet? ........................... 1 ..... 2 ......... 7............ 9
c. Fixed telephone? ................... 1 ..... 2 ......... 7............ 9
d. Cell telephone? ..................... 1 ..... 2 ......... 7............ 9
e. Television? ............................ 1 ..... 2 ......... 7............ 9
f. Radio? ................................... 1 ..... 2 ......... 7............ 9
g. Refrigerator? ......................... 1 ..... 2 ......... 7............ 9
h. Car? ....................................... 1 ..... 2 ......... 7............ 9
i. Moped/scooter/motorcycle? 1 ..... 2 ......... 7............ 9
j. Washing machine? ................ 1 ..... 2 ......... 7............ 9
k. Computer? ............................ 1 ..... 2 ......... 7............ 9
l. Bicycle? ................................. 1 ..... 2 ......... 7............ 9
m. Boat? ..................................... 1 ..... 2 ......... 7............ 9
n. Air conditioner? .................... 1 ..... 2 ......... 7............ 9

129 Appendix E: Questionnaires
SECTION B. TOBACCO SMOKING
B00. I would now like to ask you some questions about *smoking* tobacco, including cigarettes, kretek
cigarettes, cigars, pipes.
Please do not answer about smokeless tobacco at this time.
B01. Do you *currently* smoke tobacco on a daily basis, less than daily, or not at all?
DAILY ............................. 1 → SKIP TO B04
LESS THAN DAILY ........... 2
NOT AT ALL.................... 3 → SKIP TO B03
DON’T KNOW ................ 7 → SKIP TO NEXT SECTION
REFUSED ........................ 9 → SKIP TO NEXT SECTION
B02. Have you smoked tobacco daily in the past?
YES ................................. 1 → SKIP TO B08
NO ................................. 2 → SKIP TO B10
DON’T KNOW ................ 7 → SKIP TO B10
REFUSED ........................ 9 → SKIP TO B10
B03. In the *past*, have you smoked tobacco on a daily basis, less than daily, or not at all?
[IF RESPONDENT HAS SMOKED BOTH “DAILY” AND “LESS THAN DAILY” IN THE PAST, CHECK
“DAILY”]
DAILY ............................. 1 → SKIP TO B11
LESS THAN DAILY ........... 2 → SKIP TO B13
NOT AT ALL.................... 3 → SKIP TO NEXT SECTION
DON’T KNOW ................ 7 → SKIP TO NEXT SECTION
REFUSED ........................ 9 → SKIP TO NEXT SECTION

130 Appendix E: Questionnaires
[CURRENT DAILY SMOKERS]
B04. How old were you when you first started smoking tobacco *daily*?
[IF DON’T KNOW OR REFUSED, ENTER 99]
[IF B04 = 99, ASK B05. OTHERWISE SKIP TO B06.]
B05. How many years ago did you first start smoking tobacco *daily*?
[IF REFUSED, ENTER 99]
B06. On average, how many of the following products do you currently smoke each day? Also, let me
know if you smoke the product, but not every day.
[IF RESPONDENT REPORTS SMOKING THE PRODUCT BUT NOT EVERY DAY, ENTER 888
IF RESPONDENT REPORTS IN PACKS OR CARTONS, PROBE TO FIND OUT HOW MANY ARE IN
EACH AND CALCULATE TOTAL NUMBER]
a. Manufactured white cigarettes? PER DAY
a1. [IF B06a=888] On average, how many manufactured
white cigarettes do you currently smoke each week?
PER WEEK
b. Hand-rolled (RYO) cigarettes? PER DAY
b1. [IF B06b=888] On average, how many hand-rolled (RYO)
cigarettes do you currently smoke each week?
PER WEEK
c. Kretek cigarettes? PER DAY
c1. [IF B06c=888] On average, how many kretek cigarettes
do you currently smoke each week?
PER WEEK
d. Pipes full of tobacco? PER DAY
d1. [IF B06d=888] On average, how many pipes full of
tobacco do you currently smoke each week?
PER WEEK
e. Cigars? PER DAY

131 Appendix E: Questionnaires
e1. [IF B06e=888] On average, how many cigars do you
currently smoke each week?
PER WEEK
f. Number of shisha sessions per day? PER DAY
f1. [IF B06f=888] On average, how many shisha sessions do
you currently participate in each week?
PER WEEK
g. Any others? (→ g1. Please specify the other type you
currently smoke each day:_______________________)
PER DAY
g2. [IF B06g=888] On average, how many [FILL PRODUCT] do
you currently smoke each week?
PER WEEK
B07. How soon after you wake up do you usually have your first smoke? Would you say within 5
minutes, 6–30 minutes, 31–60 minutes, or more than 60 minutes?
WITHIN 5 MINUTES .................... 1
6–30 MINUTES ........................... 2
31–60 MINUTES ......................... 3
MORE THAN 60 MINUTES .......... 4
REFUSED ..................................... 9
[SKIP TO NEXT SECTION]

132 Appendix E: Questionnaires
[CURRENT LESS THAN DAILY SMOKERS]
B08. How old were you when you first started smoking tobacco *daily*?
[IF DON’T KNOW OR REFUSED, ENTER 99]
[IF B08 = 99, ASK B09. OTHERWISE SKIP TO B10.]
B09. How many years ago did you first start smoking tobacco *daily*?
[IF REFUSED, ENTER 99]
B10. How many of the following do you currently smoke during a usual week?
[IF RESPONDENT REPORTS DOING THE ACTIVITY *WITHIN THE PAST 30 DAYS*, BUT LESS THAN
ONCE PER WEEK, ENTER 888
IF RESPONDENT REPORTS IN PACKS OR CARTONS, PROBE TO FIND OUT HOW MANY ARE IN
EACH AND CALCULATE TOTAL NUMBER]
a. Manufactured white cigarettes? .................... PER WEEK
b. Hand-rolled (RYO) cigarettes? ........................ PER WEEK
c. Kretek cigarettes? ........................................... PER WEEK
d. Pipes full of tobacco? ...................................... PER WEEK
e. Cigars? ............................................................. PER WEEK
f. Number of shisha sessions per week? ............ PER WEEK
g. Any others? ..................................................... PER WEEK
→ g1. Please specify the other type you currently smoke during a usual week:
____________________________________ [SKIP TO NEXT SECTION]
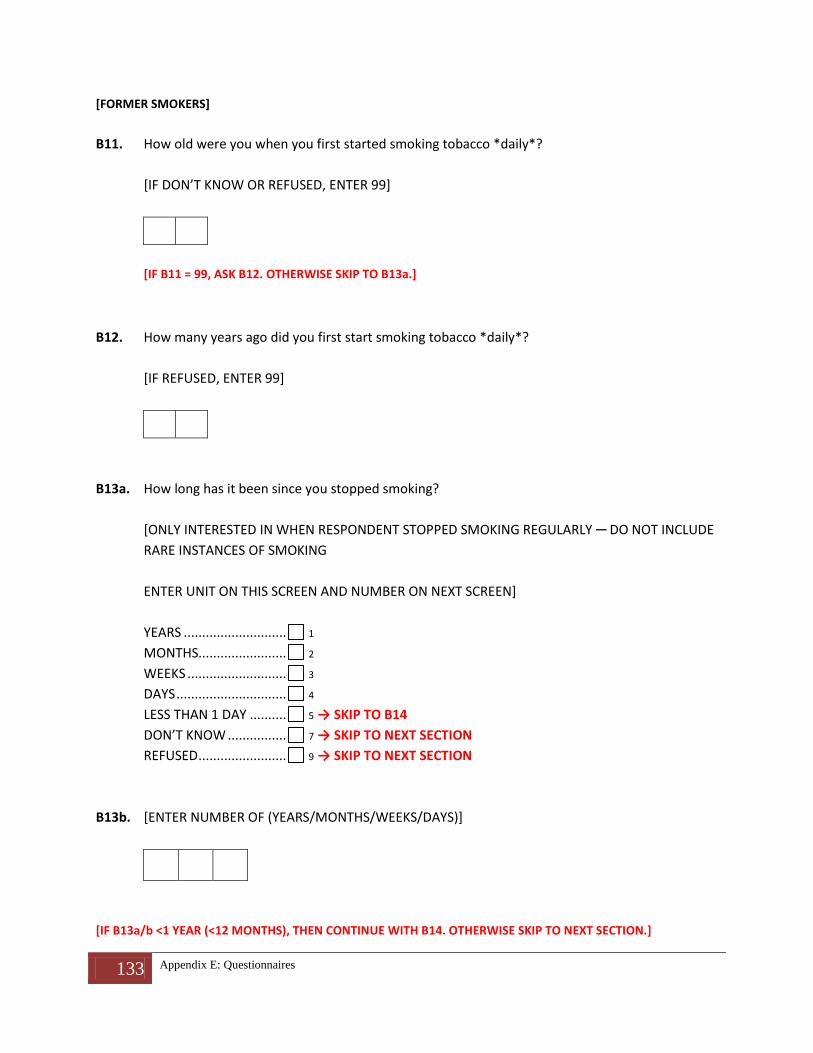
133 Appendix E: Questionnaires
[FORMER SMOKERS]
B11. How old were you when you first started smoking tobacco *daily*?
[IF DON’T KNOW OR REFUSED, ENTER 99]
[IF B11 = 99, ASK B12. OTHERWISE SKIP TO B13a.]
B12. How many years ago did you first start smoking tobacco *daily*?
[IF REFUSED, ENTER 99]
B13a. How long has it been since you stopped smoking?
[ONLY INTERESTED IN WHEN RESPONDENT STOPPED SMOKING REGULARLY ─ DO NOT INCLUDE
RARE INSTANCES OF SMOKING
ENTER UNIT ON THIS SCREEN AND NUMBER ON NEXT SCREEN]
YEARS ............................ 1
MONTHS........................ 2
WEEKS ........................... 3
DAYS .............................. 4
LESS THAN 1 DAY .......... 5 → SKIP TO B14
DON’T KNOW ................ 7 → SKIP TO NEXT SECTION
REFUSED ........................ 9 → SKIP TO NEXT SECTION
B13b. [ENTER NUMBER OF (YEARS/MONTHS/WEEKS/DAYS)]
[IF B13a/b <1 YEAR (<12 MONTHS), THEN CONTINUE WITH B14. OTHERWISE SKIP TO NEXT SECTION.]

134 Appendix E: Questionnaires
B14. Have you visited a doctor or other health-care provider in the past 12 months?
YES .................... 1
NO .................... 2 → SKIP TO B18
REFUSED ........... 9 → SKIP TO B18
B15. How many times did you visit a doctor or health-care provider in the past 12 months? Would
you say 1 or 2 times, 3–5 times, or 6 or more times?
1 OR 2 ............... 1
3–5 ................... 2
6 OR MORE ....... 3
REFUSED ........... 9
B16. During any visit to a doctor or health-care provider in the past 12 months, were you asked if you
smoke tobacco?
YES .................... 1
NO .................... 2 → SKIP TO B18
REFUSED ........... 9 → SKIP TO B18
B17. During any visit to a doctor or health-care provider in the past 12 months, were you advised to
quit smoking tobacco?
YES .................... 1
NO .................... 2
REFUSED ........... 9
B18. During the past 12 months, did you use any of the following to try to stop smoking tobacco?
YES NO REFUSED
▼ ▼ ▼
a. Counselling, including at a smoking cessation clinic? .......................... 1 ..... 2 ......... 9
b. Nicotine replacement therapy, such as a patch or gum? .................... 1 ..... 2 ......... 9
c. Other prescription medications, for example, bupropion,varenicline? 1 .... 2 ......... 9
d. Traditional medicines, for example herbal/medicinal plants? ............ 1 .... 2 ........ 9
e. Quit without assistance? ....................................................................... 1 .... 2 ........ 9
f. Switching to smokeless tobacco such as: chewing tobacco,
inhaling tobacco powder, and sirih with tobacco? ............................ 1 .... 2 ........ 9
g. Anything else? ...................................................................................... 1 .... 2 ........ 9
→ g1. Please specify what you used to try to stop smoking:
________________________________________

135 Appendix E: Questionnaires
SECTION C. SMOKELESS TOBACCO
C00. The next questions are about using smokeless tobacco, such as sirih, betel quid, tobacco leaf,
tobacco leaf and betel nut mixture. Smokeless tobacco is tobacco that is not smoked, but is sniffed
through the nose, held in the mouth, or chewed.
C01. Do you *currently* use smokeless tobacco on a daily basis, less than daily, or not at all?
[IF RESPONDENT DOES NOT KNOW WHAT SMOKELESS TOBACCO IS, EITHER PRESENT
A SHOWCARD OR READ DEFINITION FROM QXQ SCREEN]
DAILY ............................. 1 → SKIP TO NEXT SECTION
LESS THAN DAILY ........... 2
NOT AT ALL.................... 3 → SKIP TO C03
DON’T KNOW ................ 7 → SKIP TO NEXT SECTION
REFUSED ........................ 9 → SKIP TO NEXT SECTION
C02. Have you used smokeless tobacco daily in the past?
YES ................................. 1 → SKIP TO C19
NO ................................. 2 → SKIP TO C19
DON’T KNOW ................ 7 → SKIP TO C19
REFUSED ........................ 9 → SKIP TO C19
C03. In the *past*, have you used smokeless tobacco on a daily basis, less than daily, or not at all?
[IF RESPONDENT HAS DONE BOTH “DAILY” AND “LESS THAN DAILY” IN THE PAST,
CHECK “DAILY”]
DAILY ............................. 1 → SKIP TO NEXT SECTION
LESS THAN DAILY ........... 2 → SKIP TO NEXT SECTION
NOT AT ALL.................... 3 → SKIP TO NEXT SECTION
DON’T KNOW ................ 7 → SKIP TO NEXT SECTION
REFUSED ........................ 9 → SKIP TO NEXT SECTION
C19. [ADMINISTER IF B01=2 AND C01=2. ELSE GO TO NEXT SECTION.]
You mentioned that you smoke tobacco, but not every day and that you also use smokeless tobacco, but
not every day. Thinking about both smoking tobacco and using smokeless tobacco, would you say you
currently use tobacco on a daily basis or less than daily?
DAILY ............................. 1
LESS THAN DAILY ........... 2

136 Appendix E: Questionnaires
REFUSED ........................ 9
SECTION EC. ELECTRONIC CIGARETTES
EC1. Have you ever heard of electronic cigarettes?
YES ................................. 1
NO ................................. 2 → SKIP TO NEXT SECTION
REFUSED ........................ 9 → SKIP TO NEXT SECTION
EC2. Do you *currently* use electronic cigarettes on a daily basis, less than daily, or not at all?
DAILY ............................. 1
LESS THAN DAILY ........... 2
NOT AT ALL.................... 3
REFUSED ........................ 9

137 Appendix E: Questionnaires
SECTION D1. CESSATION ─ TOBACCO SMOKING
IF B01 = 1 OR 2 (RESPONDENT CURRENTLY SMOKES TOBACCO), CONTINUE WITH THIS SECTION.
IF B01 = 3, 7 OR 9 (RESPONDENT DOES NOT CURRENTLY SMOKE TOBACCO), SKIP TO NEXT SECTION.
D01. The next questions ask about any attempts to stop smoking that you might have made during
the past 12 months. Please think about tobacco smoking.
During the past 12 months, have you tried to stop smoking?
YES .................... 1
NO .................... 2 → SKIP TO D04
REFUSED ........... 9 → SKIP TO D04
D02a. Thinking about the last time you tried to quit, how long did you stop smoking?
[ENTER UNIT ON THIS SCREEN AND NUMBER ON NEXT SCREEN]
MONTHS........................................... 1
WEEKS .............................................. 2
DAYS ................................................. 3
LESS THAN 1 DAY (24 HOURS) ......... 4 → SKIP TO D03
DON’T KNOW ................................... 7 → SKIP TO D03
REFUSED ........................................... 9 → SKIP TO D03
D02b. [ENTER NUMBER OF (MONTHS/WEEKS/DAYS)]
D03. During the past 12 months, did you use any of the following to try to stop smoking tobacco?
YES NO REFUSED
▼ ▼ ▼
a. Counselling, including at a smoking cessation clinic? .......................... 1 ....... 2 ........... 9
b. Nicotine replacement therapy, such as a patch or gum? .................... 1 ....... 2 ........... 9
c. Other prescription medications, for example, bupropion,varenicline? 1 ....... 2 ........... 9
d. Traditional medicines, for example, herbal/medicinal plants? ........... 1 .... 2 ........ 9
e. Quit without assistance? ....................................................................... 1 .... 2 ........ 9
f. Switching to smokeless tobacco such as: chewing tobacco,
inhaling tobacco powder, and sirih with tobacco? ............................ 1 .... 2 ........ 9
g. Anything else? ...................................................................................... 1 .... 2 ........ 9
→ g1. Please specify what you used to try to stop smoking:
________________________________________
D04. Have you visited a doctor or other health-care provider in the past 12 months?

138 Appendix E: Questionnaires
YES .................... 1
NO .................... 2 → SKIP TO D08
REFUSED ........... 9 → SKIP TO D08
D05. How many times did you visit a doctor or health-care provider in the past 12 months? Would
you say 1 or 2 times, 3–5 times, or 6 or more times?
1 OR 2 ............... 1
3–5 ................... 2
6 OR MORE ....... 3
REFUSED ........... 9
D06. During any visit to a doctor or health-care provider in the past 12 months, were you asked if you
smoke tobacco?
YES .................... 1
NO .................... 2 → SKIP TO D08
REFUSED ........... 9 → SKIP TO D08
D07. During any visit to a doctor or health-care provider in the past 12 months, were you advised to
quit smoking tobacco?
YES .................... 1
NO .................... 2
REFUSED ........... 9
D08. Which of the following best describes your thinking about quitting smoking? I am planning to
quit within the next month, I am thinking about quitting within the next 12 months, I will quit
some day but not within the next 12 months, or I am not interested in quitting?
QUIT WITHIN THE NEXT MONTH ............................. 1
THINKING WITHIN THE NEXT 12 MONTHS .............. 2
QUIT SOMEDAY, BUT NOT NEXT 12 MONTHS. ........ 3
NOT INTERESTED IN QUITTING ................................ 4
DON’T KNOW ........................................................... 7
REFUSED ................................................................... 9

139 Appendix E: Questionnaires
SECTION E. SECOND-HAND SMOKE
E01. I would now like to ask you a few questions about smoking in various places.
Which of the following best describes the rules about smoking inside your home: Smoking is
allowed inside of your home, smoking is generally not allowed inside your home but there are
exceptions, smoking is never allowed inside your home, or there are no rules about smoking in
your home?
ALLOWED ................................................ 1
NOT ALLOWED, BUT EXCEPTIONS .......... 2
NEVER ALLOWED .................................... 3 → SKIP TO E04
NO RULES ................................................ 4 → SKIP TO E03
DON’T KNOW .......................................... 7 → SKIP TO E03
REFUSED .................................................. 9 → SKIP TO E03
E02. Inside your home, is smoking allowed in every room?
YES .......................... 1
NO .......................... 2
DON’T KNOW ......... 7
REFUSED ................. 9
E03. How often does *anyone* smoke inside your home? Would you say daily, weekly, monthly, less
than monthly, or never?
DAILY ................................... 1
WEEKLY ............................... 2
MONTHLY ............................ 3
LESS THAN MONTHLY ......... 4
NEVER.................................. 5
DON’T KNOW ...................... 7
REFUSED .............................. 9
E04. Do you currently work outside of your home?
YES ....................................... 1
NO/DON’T WORK ................ 2 → SKIP TO E09
REFUSED .............................. 9 → SKIP TO E09
E05. Do you usually work indoors or outdoors?

140 Appendix E: Questionnaires
INDOORS ................ 1 → SKIP TO E07
OUTDOORS............. 2
BOTH ...................... 3 → SKIP TO E07
REFUSED ................. 9
E06. Are there any indoor areas at your workplace?
YES .......................... 1
NO .......................... 2 → SKIP TO E09
DON’T KNOW ......... 7 → SKIP TO E09
REFUSED ................. 9 → SKIP TO E09
E07. Which of the following best describes the indoor smoking policy where you work: Smoking is
allowed anywhere, smoking is allowed only in some indoor areas, smoking is not allowed in any
indoor areas, or there is no policy?
ALLOWED ANYWHERE ......................................... 1
ALLOWED ONLY IN SOME INDOOR AREAS .......... 2
NOT ALLOWED IN ANY INDOOR AREAS ............... 3
THERE IS NO POLICY ............................................. 4
DON’T KNOW ....................................................... 7
REFUSED ............................................................... 9
E08. During the past 30 days, did anyone smoke in indoor areas where you work?
YES .......................... 1
NO .......................... 2
DON’T KNOW ......... 7
REFUSED ................. 9
E09. During the past 30 days, did you visit any government building or government office?
YES .......................... 1
NO .......................... 2 → SKIP TO E21
DON’T KNOW ......... 7 → SKIP TO E21
REFUSED ................. 9 → SKIP TO E21
E10. Did anyone smoke inside any government building or government office that you visited in the
past 30 days?
YES .......................... 1
NO .......................... 2
DON’T KNOW ......... 7
REFUSED ................. 9

141 Appendix E: Questionnaires
E21. During the past 30 days, did you visit any universities?
YES .......................... 1
NO .......................... 2 → SKIP TO E19
DON’T KNOW ......... 7 → SKIP TO E19
REFUSED ................. 9 → SKIP TO E19
E22. Did anyone smoke inside any of the universities that you visited in the past 30 days?
YES .......................... 1
NO .......................... 2
DON’T KNOW ......... 7
REFUSED ................. 9
E19. During the past 30 days, did you visit any other schools or educational facilities?
YES .......................... 1
NO .......................... 2 → SKIP TO EE1
DON’T KNOW ......... 7 → SKIP TO EE1
REFUSED ................. 9 → SKIP TO EE1
E20. Did anyone smoke inside any of the schools or educational facilities that you visited in the past
30 days?
YES .......................... 1
NO .......................... 2
DON’T KNOW ......... 7
REFUSED ................. 9
EE1. During the past 30 days, did you visit any religious facilities?
YES .......................... 1
NO .......................... 2 → SKIP TO E11
DON’T KNOW ......... 7 → SKIP TO E11
REFUSED ................. 9 → SKIP TO E11
EE2. Did anyone smoke inside any of the religious facilities that you visited in the past 30 days?
YES .......................... 1
NO .......................... 2
DON’T KNOW ......... 7

142 Appendix E: Questionnaires
REFUSED ................. 9
E11. During the past 30 days, did you visit any health-care facility?
YES .......................... 1
NO .......................... 2 → SKIP TO E13
DON’T KNOW ......... 7 → SKIP TO E13
REFUSED ................. 9 → SKIP TO E13
E12. Did anyone smoke inside any of the health-care facilities that you visited in the past 30 days?
YES .......................... 1
NO .......................... 2
DON’T KNOW ......... 7
REFUSED ................. 9
E13. During the past 30 days, did you visit any restaurant?
YES .......................... 1
NO .......................... 2 → SKIP TO E25
DON’T KNOW ......... 7 → SKIP TO E25
REFUSED ................. 9 → SKIP TO E25
E14. Did anyone smoke inside any of the restaurants that you visited in the past 30 days?
YES .......................... 1
NO .......................... 2
DON’T KNOW ......... 7
REFUSED ................. 9
E25. During the past 30 days, did you visit any bar or night club?
YES .......................... 1
NO .......................... 2 → SKIP TO E15
DON’T KNOW ......... 7 → SKIP TO E15
REFUSED ................. 9 → SKIP TO E15
E26. Did anyone smoke inside any of the bars or night clubs that you visited in the past 30 days?
YES .......................... 1
NO .......................... 2

143 Appendix E: Questionnaires
DON’T KNOW ......... 7
REFUSED ................. 9
E15. During the past 30 days, did you use any public transportation?
YES .......................... 1
NO .......................... 2 → SKIP TO EE3
DON’T KNOW ......... 7 → SKIP TO EE3
REFUSED ................. 9 → SKIP TO EE3
E16. Did anyone smoke inside any public transportation that you used in the past 30 days?
YES .......................... 1
NO .......................... 2
DON’T KNOW ......... 7
REFUSED ................. 9
EE3. During the past 30 days, did anyone smoke inside any other public places while you were
visiting?
YES .......................... 1 → EE4. Please specify:_______________________________________
NO .......................... 2
DON’T KNOW ......... 7
REFUSED ................. 9
E17. Based on what you know or believe, does breathing other people’s smoke cause serious illness
in non-smokers?
YES .......................... 1
NO .......................... 2
DON’T KNOW ......... 7
REFUSED ................. 9
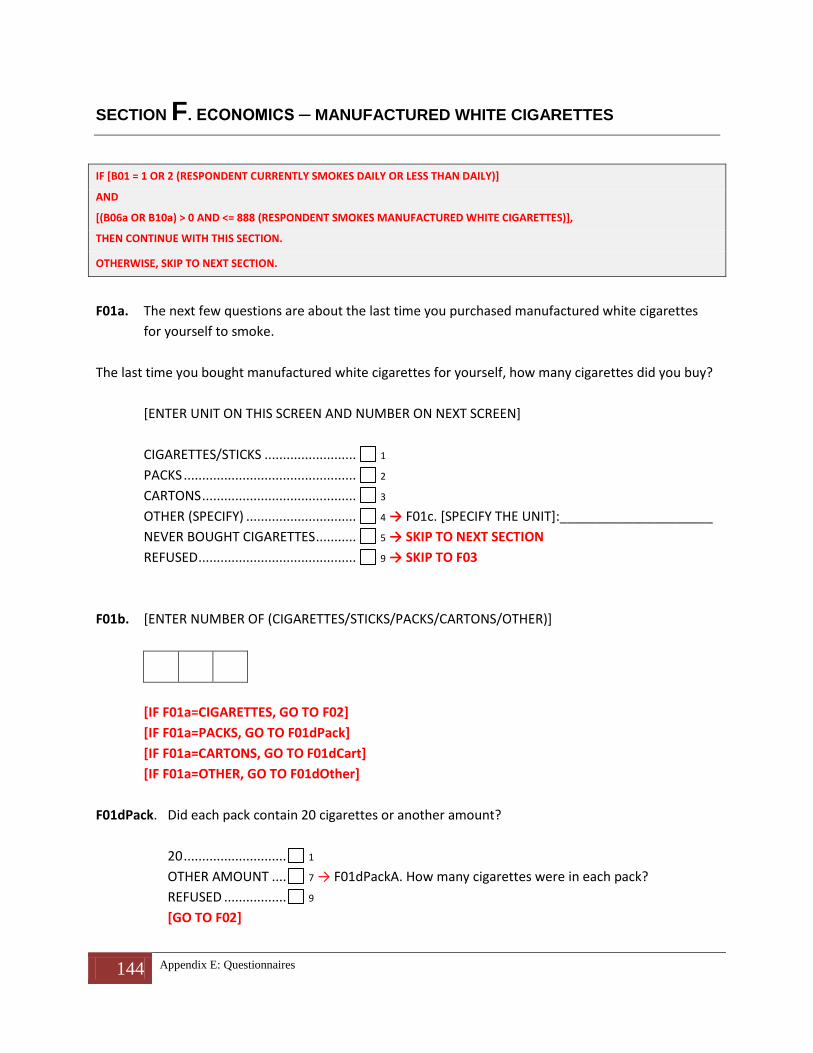
144 Appendix E: Questionnaires
SECTION F. ECONOMICS ─ MANUFACTURED WHITE CIGARETTES
IF [B01 = 1 OR 2 (RESPONDENT CURRENTLY SMOKES DAILY OR LESS THAN DAILY)]
AND
[(B06a OR B10a) > 0 AND <= 888 (RESPONDENT SMOKES MANUFACTURED WHITE CIGARETTES)],
THEN CONTINUE WITH THIS SECTION.
OTHERWISE, SKIP TO NEXT SECTION.
F01a. The next few questions are about the last time you purchased manufactured white cigarettes
for yourself to smoke.
The last time you bought manufactured white cigarettes for yourself, how many cigarettes did you buy?
[ENTER UNIT ON THIS SCREEN AND NUMBER ON NEXT SCREEN]
CIGARETTES/STICKS ......................... 1
PACKS ............................................... 2
CARTONS .......................................... 3
OTHER (SPECIFY) .............................. 4 → F01c. [SPECIFY THE UNIT]:_____________________
NEVER BOUGHT CIGARETTES ........... 5 → SKIP TO NEXT SECTION
REFUSED ........................................... 9 → SKIP TO F03
F01b. [ENTER NUMBER OF (CIGARETTES/STICKS/PACKS/CARTONS/OTHER)]
[IF F01a=CIGARETTES, GO TO F02]
[IF F01a=PACKS, GO TO F01dPack]
[IF F01a=CARTONS, GO TO F01dCart]
[IF F01a=OTHER, GO TO F01dOther]
F01dPack. Did each pack contain 20 cigarettes or another amount?
20 ............................ 1
OTHER AMOUNT .... 7 → F01dPackA. How many cigarettes were in each pack?
REFUSED ................. 9
[GO TO F02]

145 Appendix E: Questionnaires
F01dCart. Did each carton contain 200 cigarettes or another amount?
200 .......................... 1
OTHER AMOUNT .... 7 → F01dCartA. How many cigarettes were in each carton?
REFUSED ................. 9
[GO TO F02]
F01dOther. How many sticks were in each {OTHER}?
[IF REFUSED, ENTER 999]
[GO TO F02]
F02. In total, how much money did you pay for this purchase?
[IF DON’T KNOW OR REFUSED, ENTER 999999]
[RANGE: 100 – 500000]
F03. What brand did you buy the last time you purchased manufactured white cigarettes for yourself?
MARLBORO ................................ 1
LUCKY STRIKE ............................. 2
DUNHILL ..................................... 3
PALL MALL .................................. 4
KENT ........................................... 5
WINSTON ................................... 6
MILD SEVEN ............................... 7
OTHER ........................................ 8 → F03a. [SPECIFY BRAND]:_________________________
REFUSED ..................................... 99
F04. The last time you purchased manufactured white cigarettes for yourself, where did you buy them?
STORE ......................................... 2
STREET VENDOR ......................... 3
DUTY-FREE SHOP ....................... 5
OUTSIDE THE COUNTRY ............. 6
KIOSK .......................................... 7
FROM ANOTHER PERSON .......... 9
OTHER ........................................ 10 → F04a. [SPECIFY LOCATION]:______________________
DON’T REMEMBER ..................... 77
REFUSED ..................................... 99

146 Appendix E: Questionnaires
Section FK. Economics ─ kretek cigarettes
IF [B01 = 1 OR 2 (RESPONDENT CURRENTLY SMOKES DAILY OR LESS THAN DAILY)]
AND
[(B06c OR B10c) > 0 AND <= 888 (RESPONDENT SMOKES KRETEK CIGARETTES)],
THEN CONTINUE WITH THIS SECTION.
OTHERWISE, SKIP TO NEXT SECTION.
FK01a. The next few questions are about the last time you purchased kretek cigarettes for yourself to
smoke.
The last time you bought kretek cigarettes for yourself, how many kretek cigarettes did you buy?
[ENTER UNIT ON THIS SCREEN AND NUMBER ON NEXT SCREEN]
KRETEK CIGARETTES/STICKS ......................... 1
PACKS ............................................................ 2
CARTONS ....................................................... 3
OTHER (SPECIFY) ........................................... 4 → FK01c. [SPECIFY THE
UNIT]:_______________
NEVER BOUGHT KRETEK CIGARETTES ........... 5 → SKIP TO NEXT SECTION
REFUSED ........................................................ 9 → SKIP TO FK03
FK01b. [ENTER NUMBER OF (KRETEK CIGARETTES/STICKS/PACKS/CARTONS/OTHER)]
[IF FK01a=KRETEK CIGARETTES, GO TO FK02]
[IF FK01a=PACKS, GO TO FK01dPack]
[IF FK01a=CARTONS, GO TO FK01dCart]
[IF FK01a=OTHER, GO TO FK01dOther]
FK01dPack. Did each pack contain 6 kretek cigarettes, 10 kretek cigarettes, 12 kretek cigarettes, 16
kretek cigarettes, 20 kretek cigarettes, or another amount?
6 ........................................ 1
10 ...................................... 2
12 ...................................... 3
16 ...................................... 4
20 ...................................... 5
OTHER AMOUNT .............. 7 → FK01dPackA. How many kretek cigarettes were in each
pack?
REFUSED ........................... 9
[GO TO FK02]

147 Appendix E: Questionnaires
FK01dCart. Did each carton contain 60 kretek cigarettes, 100 kretek cigarettes, 120 kretek cigarettes,
160 kretek cigarettes, 200 kretek cigarettes, 320 kretek cigarettes, or another amount?
60 ............................... 1
100 ............................. 2
120 ............................. 3
160 ............................. 4
200 ............................. 5
320 ............................. 6
OTHER AMOUNT ....... 7 → FK01dCartA. How many kretek cigarettes were in each
carton?
REFUSED .................... 9
[GO TO FK02]
FK01dOther. How many kretek cigarettes were in each {OTHER}?
[IF REFUSED, ENTER 999]
[GO TO FK02]
FK02. In total, how much money did you pay for this purchase?
[IF DON’T KNOW OR REFUSED, ENTER 999999]
[RANGE: 100 – 500000]
FK03. What brand did you buy the last time you purchased kretek cigarettes for yourself?
SAMPOERNA .............................. 1
GUDANG GARAM ....................... 2
DJI SAM SOE ............................... 3
DJARUM ..................................... 4
BENTOEL..................................... 5
WISMILAK ................................... 6
OTHER ........................................ 7 → FK03a. [SPECIFY BRAND]:_________________________
REFUSED ..................................... 99

148 Appendix E: Questionnaires
FK04. The last time you purchased kretek cigarettes for yourself, where did you buy them?
STORE ......................................... 2
STREET VENDOR ......................... 3
DUTY-FREE SHOP ....................... 5
OUTSIDE THE COUNTRY ............. 6
KIOSK .......................................... 7
FROM ANOTHER PERSON .......... 9
OTHER ........................................ 10 → FK04a. [SPECIFY LOCATION]:______________________
DON’T REMEMBER ..................... 77
REFUSED ..................................... 99

149 Appendix E: Questionnaires
SECTION G. MEDIA
G201intro. The next few questions ask about your exposure to the media and advertisements in the past 30
days. For each item, I am going to ask separately about white cigarettes and kretek cigarettes.
G201a. In the past 30 days, have you noticed any information in *newspapers or in magazines* about
the dangers of use or that encourages quitting of the following tobacco products?
1. White cigarettes?
YES ................................. 1
NO ................................. 2
NOT APPLICABLE ........... 7 → SKIP TO G201b
REFUSED ........................ 9
2. Kretek cigarettes?
YES ................................. 1
NO ................................. 2
REFUSED ........................ 9
G201b. In the past 30 days, have you seen any information on *television* about the dangers of use or
that encourages quitting of the following tobacco products?
1. White cigarettes?
YES ................................. 1
NO ................................. 2
NOT APPLICABLE ........... 7 → SKIP TO G201c
REFUSED ........................ 9
2. Kretek cigarettes?
YES ................................. 1
NO ................................. 2
REFUSED ........................ 9

150 Appendix E: Questionnaires
G201c. In the past 30 days, have you heard any information on the *radio* about the dangers of use or
that encourages quitting of the following tobacco products?
1. White cigarettes?
YES ................................. 1
NO ................................. 2
NOT APPLICABLE ........... 7 → SKIP TO G201d
REFUSED ........................ 9
2. Kretek cigarettes?
YES ................................. 1
NO ................................. 2
REFUSED ........................ 9
G201d. In the past 30 days, have you noticed any information on *billboards* about the dangers of use
or that encourages quitting of the following tobacco products?
1. White cigarettes?
YES ................................. 1
NO ................................. 2
NOT APPLICABLE ........... 7 → SKIP TO G201e
REFUSED ........................ 9
2. Kretek cigarettes?
YES ................................. 1
NO ................................. 2
REFUSED ........................ 9
G201e. In the past 30 days, have you noticed any information *somewhere else* about the dangers of
use or that encourages quitting of the following tobacco products?
1. White cigarettes?
[DO NOT INCLUDE HEALTH WARNINGS ON CIGARETTE PACKAGES]
YES ................................. 1 → a. Please specify where: _______________________________
NO ................................. 2
REFUSED ........................ 9
2. Kretek cigarettes?
[DO NOT INCLUDE HEALTH WARNINGS ON KRETEK PACKAGES]
YES ................................. 1 → a. Please specify where: _______________________________
NO ................................. 2

151 Appendix E: Questionnaires
REFUSED ........................ 9
G202. In the past 30 days, did you notice any health warnings on white cigarette or kretek packages?
YES ........................................................................ 1
NO ........................................................................ 2 → SKIP TO G204a
DID NOT SEE ANY CIGARETTE PACKAGES ............ 3 → SKIP TO G204a
REFUSED ............................................................... 9 → SKIP TO G204a
G203. [ADMINISTER IF B01 = 1 OR 2. ELSE GO TO G204a]
In the past 30 days, have warning labels on white cigarette or kretek packages led you to think
about quitting?
YES ................................. 1
NO ................................. 2 → SKIP TO GG2
DON’T KNOW ................ 7 → SKIP TO GG2
REFUSED ........................ 9 → SKIP TO GG2
GG1. Would you say that the warning labels led you to think about quitting a lot or a little?
A LOT ...................... 1
A LITTLE .................. 2
DON’T KNOW ......... 7
REFUSED ................. 9
GG2. In the past 30 days, did the warning labels make you concerned or think about the dangers of
smoking cigarettes on health?
YES .......................... 1
NO .......................... 2
DON’T KNOW ......... 7
REFUSED ................. 9
G204a. In the past 30 days, have you noticed any advertisements or signs promoting the following
tobacco products in *stores where the products are sold*?
1. White cigarettes?
YES ................................. 1
NO ................................. 2

152 Appendix E: Questionnaires
NOT APPLICABLE ........... 7 → SKIP TO G204b
REFUSED ........................ 9
2. Kretek cigarettes?
YES ................................. 1
NO ................................. 2
REFUSED ........................ 9
G204b. In the past 30 days, have you seen any advertisements or signs promoting the following tobacco
products on *television*?
1. White cigarettes?
YES ................................. 1
NO ................................. 2
NOT APPLICABLE ........... 7 → SKIP TO G204c
REFUSED ........................ 9
2. Kretek cigarettes?
YES ................................. 1
NO ................................. 2
REFUSED ........................ 9
G204c. In the past 30 days, have you heard any advertisements promoting the following tobacco
products on the *radio*?
1. White cigarettes?
YES ................................. 1
NO ................................. 2
NOT APPLICABLE ........... 7 → SKIP TO G204d
REFUSED ........................ 9
2. Kretek cigarettes?
YES ................................. 1
NO ................................. 2
REFUSED ........................ 9

153 Appendix E: Questionnaires
G204d. In the past 30 days, have you noticed any advertisements promoting the following tobacco
products on *billboards*?
1. White cigarettes?
YES ................................. 1
NO ................................. 2
NOT APPLICABLE ........... 7 → SKIP TO G204e
REFUSED ........................ 9
2. Kretek cigarettes?
YES ................................. 1
NO ................................. 2
REFUSED ........................ 9
G204e. In the past 30 days, have you noticed any advertisements or signs promoting the following
tobacco products on *posters*?
1. White cigarettes?
YES ................................. 1
NO ................................. 2
NOT APPLICABLE ........... 7 → SKIP TO G204f
REFUSED ........................ 9
2. Kretek cigarettes?
YES ................................. 1
NO ................................. 2
REFUSED ........................ 9

154 Appendix E: Questionnaires
G204f. In the past 30 days, have you noticed any advertisements or signs promoting the following
tobacco products in *newspapers or magazines*?
1. White cigarettes?
YES ................................. 1
NO ................................. 2
NOT APPLICABLE ........... 7 → SKIP TO G204g
REFUSED ........................ 9
2. Kretek cigarettes?
YES ................................. 1
NO ................................. 2
REFUSED ........................ 9
G204g. In the past 30 days, have you noticed any advertisements or signs promoting the following
tobacco products in *cinemas*?
1. White cigarettes?
YES ................................. 1
NO ................................. 2
NOT APPLICABLE ........... 7 → SKIP TO G204h
REFUSED ........................ 9
2. Kretek cigarettes?
YES ................................. 1
NO ................................. 2
REFUSED ........................ 9
G204h. In the past 30 days, have you noticed any advertisements or signs promoting the following
tobacco products on the *Internet*?
1. White cigarettes?
YES ................................. 1
NO ................................. 2
NOT APPLICABLE ........... 7 → SKIP TO G204i

155 Appendix E: Questionnaires
REFUSED ........................ 9
2. Kretek cigarettes?
YES ................................. 1
NO ................................. 2
REFUSED ........................ 9
G204i. In the past 30 days, have you noticed any advertisements or signs promoting the following
tobacco products on *public transportation vehicles or stations*?
1. White cigarettes?
YES ................................. 1
NO ................................. 2
NOT APPLICABLE ........... 7 → SKIP TO G204j
REFUSED ........................ 9
2. Kretek cigarettes?
YES ................................. 1
NO ................................. 2
REFUSED ........................ 9
G204j. In the past 30 days, have you noticed any advertisements or signs promoting the following
tobacco products on *public walls*?
1. White cigarettes?
YES ................................. 1
NO ................................. 2
NOT APPLICABLE ........... 7 → SKIP TO G204ja
REFUSED ........................ 9
2. Kretek cigarettes?
YES ................................. 1
NO ................................. 2
REFUSED ........................ 9

156 Appendix E: Questionnaires
G204ja. In the past 30 days, have you noticed any advertisements or signs promoting the following
tobacco products on *banners*?
1. White cigarettes?
YES ................................. 1
NO ................................. 2
NOT APPLICABLE ........... 7 → SKIP TO G204k
REFUSED ........................ 9
2. Kretek cigarettes?
YES ................................. 1
NO ................................. 2
REFUSED ........................ 9
G204k. In the past 30 days, have you noticed any advertisements or signs promoting the following
tobacco products *anywhere else*?
1. White cigarettes?
YES ................................. 1 → a. Please specify where: _______________________________
NO ................................. 2
REFUSED ........................ 9
2. Kretek cigarettes?
YES ................................. 1 → a. Please specify where: _______________________________
NO ................................. 2
REFUSED ........................ 9
G205. In the past 30 days, have you noticed any sport or sporting event that is associated with white
cigarette brands or white cigarette companies?
YES ................................. 1
NO ................................. 2
DON’T KNOW ................ 7
REFUSED ........................ 9

157 Appendix E: Questionnaires
G205a. In the past 30 days, have you noticed any sport or sporting event that is associated with kretek
brands or kretek companies?
YES ................................. 1
NO ................................. 2
DON’T KNOW ................ 7
REFUSED ........................ 9
G205b. In the past 30 days, have you noticed any music, theatre, art or fashion event that is associated
with white cigarette brands or white cigarette companies?
YES ...................... 1
NO ...................... 2
DON’T KNOW ..... 7
REFUSED ............. 9
G205c. In the past 30 days, have you noticed any music, theatre, art or fashion event that is associated
with kretek brands or kretek companies?
YES ...................... 1
NO ...................... 2
DON’T KNOW ..... 7
REFUSED ............. 9
G206a. In the past 30 days, have you noticed distribution of any free samples of the following tobacco
products?
1. White cigarettes?
YES ................................. 1
NO ................................. 2
DON’T KNOW ................ 7
REFUSED ........................ 9
2. Kretek cigarettes?
YES ................................. 1

158 Appendix E: Questionnaires
NO ................................. 2
DON’T KNOW ................ 7
REFUSED ........................ 9
G206b. In the past 30 days, have you noticed any of the following tobacco products sold at sale prices?
1. White cigarettes?
YES ................................. 1
NO ................................. 2
DON’T KNOW ................ 7
REFUSED ........................ 9
2. Kretek cigarettes?
YES ................................. 1
NO ................................. 2
DON’T KNOW ................ 7
REFUSED ........................ 9
G206c. In the past 30 days, have you noticed any coupons for the following tobacco products?
1. White cigarettes?
YES ................................. 1
NO ................................. 2
DON’T KNOW ................ 7
REFUSED ........................ 9
2. Kretek cigarettes?
YES ................................. 1
NO ................................. 2
DON’T KNOW ................ 7
REFUSED ........................ 9

159 Appendix E: Questionnaires
G206d. In the past 30 days, have you noticed any free gifts or special discount offers on other products
when buying any of the following tobacco products?
1. White cigarettes?
YES ................................. 1
NO ................................. 2
DON’T KNOW ................ 7
REFUSED ........................ 9
2. Kretek cigarettes?
YES ................................. 1
NO ................................. 2
DON’T KNOW ................ 7
REFUSED ........................ 9
G206e. In the past 30 days, have you noticed any clothing or other item with a brand name or logo of
the following tobacco products?
1. White cigarettes?
YES ................................. 1
NO ................................. 2
DON’T KNOW ................ 7
REFUSED ........................ 9
2. Kretek cigarettes?
YES ................................. 1
NO ................................. 2
DON’T KNOW ................ 7
REFUSED ........................ 9
G206f. In the past 30 days, have you noticed any promotion in the mail for the following tobacco
products?
1. White cigarettes?
YES ................................. 1
NO ................................. 2
DON’T KNOW ................ 7
REFUSED ........................ 9
2. Kretek cigarettes?
YES ................................. 1
NO ................................. 2
DON’T KNOW ................ 7
REFUSED ........................ 9
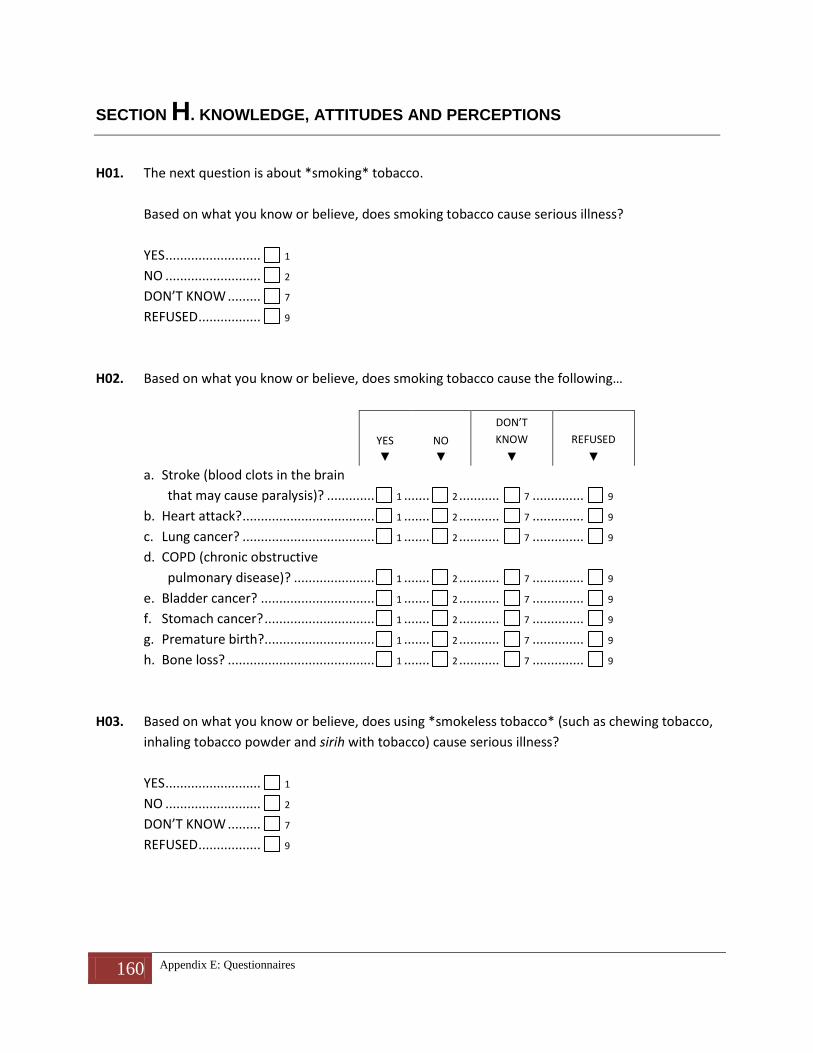
160 Appendix E: Questionnaires
SECTION H. KNOWLEDGE, ATTITUDES AND PERCEPTIONS
H01. The next question is about *smoking* tobacco.
Based on what you know or believe, does smoking tobacco cause serious illness?
YES .......................... 1
NO .......................... 2
DON’T KNOW ......... 7
REFUSED ................. 9
H02. Based on what you know or believe, does smoking tobacco cause the following…
YES
NO
DON’T
KNOW
REFUSED
▼ ▼ ▼ ▼
a. Stroke (blood clots in the brain
that may cause paralysis)? ............. 1 ....... 2 ........... 7 .............. 9
b. Heart attack? .................................... 1 ....... 2 ........... 7 .............. 9
c. Lung cancer? .................................... 1 ....... 2 ........... 7 .............. 9
d. COPD (chronic obstructive
pulmonary disease)? ...................... 1 ....... 2 ........... 7 .............. 9
e. Bladder cancer? ............................... 1 ....... 2 ........... 7 .............. 9
f. Stomach cancer? .............................. 1 ....... 2 ........... 7 .............. 9
g. Premature birth? .............................. 1 ....... 2 ........... 7 .............. 9
h. Bone loss? ........................................ 1 ....... 2 ........... 7 .............. 9
H03. Based on what you know or believe, does using *smokeless tobacco* (such as chewing tobacco,
inhaling tobacco powder and sirih with tobacco) cause serious illness?
YES .......................... 1
NO .......................... 2
DON’T KNOW ......... 7
REFUSED ................. 9

161 Appendix E: Questionnaires
END INDIVIDUAL QUESTIONNAIRE
I00. Those are all of the questions I have. Thank you very much for partcipating in this important
survey.
I02. [RECORD ANY NOTES ABOUT INTERVIEW:]
_______________________________________________________________________
_______________________________________________________________________
_______________________________________________________________________
_______________________________________________________________________
_______________________________________________________________________

162 Appendix F: MPOWER Summary Indicators
Appendix F: MPOWER Summary Indicators
Table F.1. MPOWER Summary Indicators, GATS Indonesia, 2011.
Ma le Fe ma le Urba n Rura l
M: Monitor toba c c o use a nd pre ve ntion polic ie s†
Current tobacco use1 36.1 67.4 4.5 33.0 39.1
Current tobacco smokers1 34.8 67.0 2.7 31.9 37.7
Current c igarette smokers1, 2 34.8 67.0 2.7 31.9 37.6
Current white c igarette smokers1 2.2 4.3 0.1 2.8 1.6
Current hand- rolled cigarette smokers1 4.7 9.0 0.5 2.4 7.1
Current Kretek cigarette smokers1 31.5 60.9 2.3 28.6 34.5
Current smokeless tobacco use1 1.7 1.5 2.0 1.2 2.2
Average number of c igarettes smoked per day2, 3 12.8 13.0 8.1 12.3 13.3
Average age at daily smoking initiation among daily smokers of age 20- 34 years 17.6 17.6 -- 17.7 17.5Time to first tobacco smoke within 30 minutes from waking 38.3 38.6 30.0 41.0 36.1
Former daily tobacco smokers among ever daily smokers4 9.5 9.0 23.2 11.4 7.9
P: Prote c t pe ople from toba c c o smoke†
Exposure to secondhand smoke at home at least monthly5 78.4 81.4 75.4 68.5 88.2
Exposure to secondhand smoke at work6. ‡ 51.3 58.0 41.4 47.8 62.4
Exposure to second hand smoke in public places‡:
Government buildings/offices 63.4 69.4 55.4 58.6 71.2
Health care facilities 17.9 20.1 16.5 20.0 15.1 Restaurants 85.4 90.8 76.1 87.4 81.7 Public Transportation 70.0 79.0 62.4 70.2 69.6
O: Offe r he lp to quit toba c c o use7
Made a quit attempt in the past 12 months8 30.4 29.8 44.6 35.9 25.6
Advised to quit smoking by a health care provider9 34.6 35.7 13.0 35.6 33.9
Attempted to quit smoking using a specific cessation method8:
Quit without assistance 70.7 70.7 71.1 65.6 77.0
Counseling/advice10 7.0 6.6 13.1 8.5 5.2
Interest in quitting smoking11 48.8 48.9 45.8 50.6 47.2
W: Wa rn a bout the da nge rs of toba c c o†
Belief that tobacco smoking causes serious illness 86.0 85.7 86.3 88.1 83.8Belief that smoking causes specific diseases:
Stroke 45.5 46.6 44.4 55.0 35.9 Heart attack 81.5 82.9 80.0 85.4 77.4 Lung cancer 84.7 85.2 84.2 87.2 82.2
Chronic Obstructive Pulmonary Disease (COPD) 36.0 37.4 34.7 35.7 36.4 Premature birth 49.5 48.4 50.6 58.3 40.6
Belief that breathing other peoples' smoke causes serious illness 73.7 74.1 73.3 79.5 67.8
Noticed anti- c igarette smoking information at any location‡ 52.7 57.1 48.3 64.3 41.0
Thinking of quitting because of health warnings on cigarette packages 27.1 27.5 17.0 27.9 26.3E: Enforc e ba ns on toba c c o a dve rtising, promotion, a nd
sponsorship†
Noticed any cigarette advertisement, sponsorship or promotion‡ 84.6 91.1 78.2 89.7 79.5
Noticed any cigarette marketing in the stores where cigarettes are sold‡ 45.6 53.4 37.8 51.4 39.7
R: Ra ise ta xe s on toba c c o12
Average kretek cigarette expenditure per month (Rp)@ 369,947.68 373,809.40 178,263.37 351,424.38 384,751.32
Average price paid for a pack of 20 kretek cigarettes (Rp)@ 12,718.91 12,753.22 11,019.85 14,095.10 11,614.66
Last kretek cigarette purchase was from a store 17.6 17.4 21.8 19.4 16.0
†Among all adults.
‡ In the last 30 days.
@ Indonesian Rupiah
--
Indicator estimate based on less than 25 un- weighted cases and has been suppressed
8 Among c urre nt smoke rs a nd forme r smoke rs who ha ve be e n a bs tine nt for le ss tha n 12 months .
9 Among c urre nt smoke rs a nd forme r smoke rs who ha ve be e n a bs tine nt for le ss tha n 12 months , a nd who vis ite d a HCP during the pa s t 12 months .
10 Consulta tions in he a lthc a re fa c ilitie s , inc luding spe c ia lize d offic e s on how to quit smoking.
11 Inte re s t in quitting smoking inc lude s c urre nt smoke rs who a re pla nning to quit within ne xt month, thinking a bout quitting within ne xt 12 months , a nd who will quit
some da y, but not in the ne xt 12 months .12
Among c urre nt ma nufa c ture d c iga re tte smoke rs .
3 Among c urre nt c iga re tte smoke rs .
4 Also known a s the quit ra tio for da ily smoking.
5 Adults re porting tha t smoking ins ide the ir home oc c ur da ily, we e kly, or monthly.
6 Among those re sponde nts who work outs ide of the home who usua lly work indoors or both indoors a nd outdoors .
7 Among c urre nt smoke rs (inc lude s both da ily a nd oc c a s iona l smoke rs ).
2 Ciga re tte use inc lude s white c iga re tte s , ha nd- rolle d c iga re tte s , a nd kre te k c iga re tte s
Footnote s : 1 Curre nt use inc lude s both da ily a nd oc c a s iona l (le ss tha n da ily) use .
Indic a tor Ove ra ll
Ge nde r Re side nc e

GLOBAL ADULT TOBACCO SURVEY: INDONESIA REPORT 2011GATS| INDONESIA
GLOBAL ADULT TOBACCO SURVEY: INDONESIA REPORT 2011 GLOBAL ADULT TOBACCO SURVE Y: INDONESIA REPORT 2011
BH
A
K T I H U SAD
A
Regional Office for South-East Asia
Collaborating organizations
Ministry of Health Badan Pusat Statistik (BPS-Statistics Indonesia) National Institute of Health Research and Development World Health Organization Centers for Disease Control and Prevention CDC Foundation John Hopkins Bloomberg School of Public Health RTI International
Global Adult Tobacco Survey: Indonesia Report 2011 summarizes the findings of Global Adult Tobacco Survey on tobacco control indicators and thus fulfils its obligation under MPOWER policy package to monitoring tobacco control in Indonesia GATS| inDonEsia
fullIndonesia_cover8_9_12.indd 1 8/30/2012 9:21:48 AM