Embed Size (px)
Citation preview

Gateway ConferenceSeptember 6, 2018

DisclaimerFORWARD LOOKING STATEMENTS
This presentation contains forward-looking statements within the meaning of the federal securities laws. Forward-looking statements may generallybe identified by the use of words such as "anticipate," "believe," "expect," "intend," "plan" and "will" or, in each case, their negative, or other variationsor comparable terminology. These forward-looking statements include all matters that are not historical facts. By their nature, forward-lookingstatements involve risks and uncertainties because they relate to events and depend on circumstances that may or may not occur in the future. As aresult, actual events may differ materially from those expressed in or suggested by the forward-looking statements. Factors that could cause thesedifferences include, but are not limited to, the factors set forth in “Risk Factors” included in TPB’s annual report on Form 10-K and other reports filedwith the Securities and Exchange Commission from time to time. Any forward-looking statement made by TPB in this presentation speaks only as ofthe date hereof. New risks and uncertainties come up from time to time, and it is impossible for TPB to predict these events or how they may affectit. TPB has no obligation, and does not intend, to update any forward-looking statements after the date hereof, except as required by federalsecurities laws.
This presentation includes industry and market data derived from internal analyses based upon publicly available data or proprietary research andanalysis, surveys or studies conducted by third parties and industry and general publications, including those by the Management Science Associates,Inc. (“MSAi”) and Nielsen Holdings, N.V. (“Nielsen”). Third-party industry and general publications, research, surveys and studies generally state thatthe information contained therein has been obtained from sources believed to be reliable. Although there can be no assurance as to the accuracy orcompleteness of the included information, we believe that this information is reliable. While we believe our internal analyses are reliable, they havenot been verified by any independent sources. Any such data and analysis involve risks and uncertainties and are subject to change based on variousfactors, including those set forth in “Risk Factors” included in TPB’s annual report on Form 10-K and other reports filed with the Securities andExchange Commission from time to time.
NON-GAAP RECONCILIATION
This presentation includes certain non-U.S. generally accepted accounting principles (“GAAP") financial measures, including EBITDA, Adjusted EBITDAand Net Debt. Such non-GAAP financial measures are not in accordance with, or an alternative to, financial measures prepared in accordance withGAAP. To supplement our financial information presented in accordance with generally accepted accounting principles in the United States, or U.S.GAAP, we use non-U.S. GAAP financial measures, including EBITDA, Adjusted EBITDA and Net Debt. We believe EBITDA and Adjusted EBITDA provideuseful information to management and investors regarding certain financial and business trends relating to financial condition and results ofoperations. Adjusted EBITDA and Net Debt are used by management to compare performance to that of prior periods for trend analyses and planningpurposes and are presented to our board of directors. We believe that EBITDA and Adjusted EBITDA are appropriate measures of operatingperformance because they eliminate the impact of expenses that do not relate to business performance.
Non-U.S. GAAP measures should not be considered a substitute for, or superior to, financial measures calculated in accordance with U.S. GAAP.EBITDA and Adjusted EBITDA exclude significant expenses that are required by U.S. GAAP to be recorded in our financial statements and is subject toinherent limitations. In addition, other companies in our industry may calculate these non-U.S. GAAP measure differently than we do or may notcalculate it at all, limiting its usefulness as a comparative measure.
2

• Leading Other Tobacco Products (OTP) provider (not cigarettes)
• Broad portfolio of compelling brands in higher margin tobaccoproducts
• Well positioned for growing vapor and evolving alternative productsthrough NewGen sales engine
• Creating leverage as an active consolidator through management,regulatory, purchasing and systems
3

FOCUS BRANDS DRIVE ORGANIC GROWTH
SMOKELESS SMOKING NEWGEN
• Among fastest growing MST
brands
• #2 Chew brand
• Leading vaping ecommerce
sites
• Distribution engine for vapor
and alternatives
• #1 Premium paper in U.S.
and Canada
• #1 MYO Cigar wrap
29% 37% 34%
4
% of LTM (6/18) Net Sales
Source: MSAi

STOKER’S: LONG-TERM ORGANIC GROWTH• Acquired Stoker’s brand in 2003
• Stoker’s was the original “big-bag” chew brand, and its brand equity and quality productdrove outperformance in a declining market
• Expanded a highly-differentiated and proprietary moist snuff tub (equivalent to 10 cans) in2007, which directly competed with Philip Morris and Reynolds
• Owned manufacturing in Dresden, Tennessee that allows the Company to manage costs andkeep up with growing demand and preserve proprietary product formulation
• Hit ~70,000 stores in early 2018 with launch of product in 15,000 Dollar General locations
• Industry has had three price increases over the past 18-months which the Companyfollowed; however, TPB continues to price at 25-40% discount to competition
SMOKELESS
2.0%
2.2%
2.4%
2.6%
2.8%
3.0%
3.2%
3.4%
1Q16 2Q16 3Q16 4Q16 1Q17 2Q17 3Q17 4Q17 1Q18 2Q18
Stoker’s MST Effective Share
Source: MSAi5

ZIG-ZAG: CONSISTENT SALES WITH TAILWINDS
• #1 premium paper in the U.S. and Canada
• Continued industry leading share in wraps
• Developed multiple SKUs for promising Canadian market, as our partner prepares for legalization of recreational cannabis in October 2018
• Early feedback on U.S. Hemp papers has been very positive
SMOKING
$0
$5
$10
$15
$20
$25
$30
1Q15 2Q15 3Q15 4Q15 1Q16 2Q16 3Q16 4Q16 1Q17 2Q17 3Q17 4Q17 1Q18 2Q18
Sales Gross Profit
TPB Smoking Segment: Quarterly Reported Sales and Gross Profit
6$ in millions

NEWGEN: SALES ENGINE• Acquired VaporBeast in November 2016. One of the leading wholesale distributors reaching
4,500 vape shops
• International Vapor Group (“IVG”) announced September 6, 2018, is a best in class B2C engine
• VaporBeast and IVG combined, along with Vapor Shark and Vapor Supply, creates a fully integrated supply chain with scale:
7
Best positioned in the market to navigate complex regulatory environment
Purchasing, logistics and franchise synergies
Top of the fold domain properties
Retail and franchise subsets allow for better understanding consumer trends
TPB core infrastructure in R&D and product development will drive retail wins
NEWGEN

• Acquired International Vapor Group (“IVG”) for $24 million plus $4.5 million of contingent earnouts. 6/18 LTM Sales of $47.7 million and EBITDA of $4.9 million
• IVG comprises a handful of B2C brands that provide adult consumers vaping experiences across proprietary and third-party vapor products
• Team includes leaders in online marketing, product development, IT infrastructure, retail and distribution
NEWGEN: IVG REVIEW
• IVG has nine corporate stores and 25 franchisee locations
• Will complement seven Vapor Supply corporate stores, seven Vapor Shark corporate stores and 33 Vapor Shark franchisee locations
• Consolidated TPB family will be second largest vape brick and mortar retailer in country. Good place to understand consumer dynamics across vaping and other alternatives (on top of troves of data from B2C sites)
• TPB purchasing team and logistics will drive significant synergies
• Scale out of leveraging product development and regulatory compliance
8
NEWGEN
B2C Online
International
Retail
Wholesale
Franchise
IVG LTM (6/18) Sales
To supplement our financial information presented in accordance with generally accepted accounting principles in the United States, or U.S. GAAP, we use non-U.S. GAAP financial measures including EBITDA and
Adjusted EBITDA. Please refer to the Appendix (Page 14) for a reconciliation of EBITDA to net income.
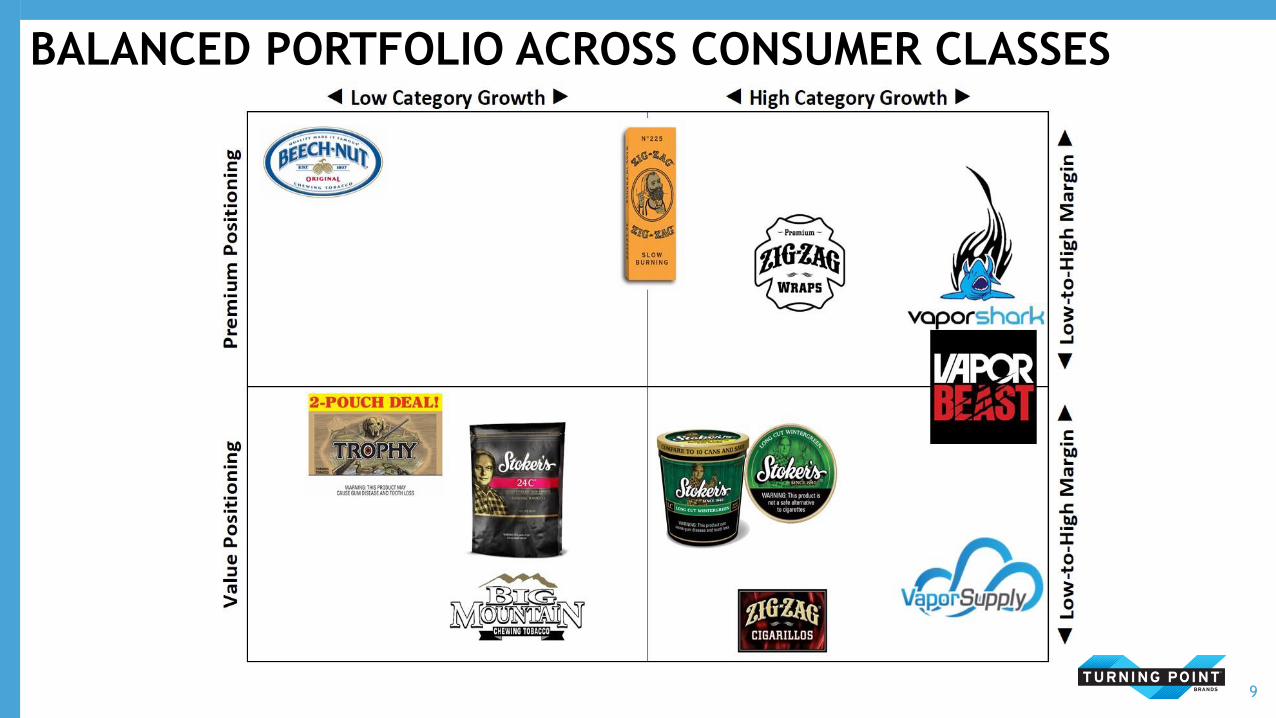
BALANCED PORTFOLIO ACROSS CONSUMER CLASSES
9

WELL-POSITIONED AS AN INDUSTRY CONSOLIDATOR
EXPERTISE IN REGULATED MARKETS
TPB Today
Expanding our FDA regulatory
infrastructure expertise through a
leadership team of QA, R&D, legal and
scientific professionals
Growing share of products in regulated
market
Regulatory changes likely to cause
significant disruption among smaller
companies
TPB Action Plan
Preparing to preserve our ability to
market quality products to adult
consumers
Reviewing TPB product lines,
determining costs and resources
needed for FDA compliance and
approval
Rationalize low-margin products not
justifying FDA investment
Influence FDA regulatory approach
FDA “continuum of risk” guiding
principle approach, reaffirmed in 2018
Extended premarket applications into
2021 & 2022
Expected pathway for future
innovation
TPB does not sell cigarettes
2017 FDA announcement and guidance
Our teams have significant experience in highly regulated environments
10

GROWING CASH FLOW AND REDUCED LEVERAGE
Increasing Adjusted EBITDA
Reduced Interest ExpenseReduced Leverage (Net Debt / Adjusted EBITDA)
Growing Net Sales
$186.7 $193.3 $200.3 $197.3 $206.2
$285.8$301.9
$30
$80
$130
$180
$230
$280
$330
2012 2013 2014 2015 2016 2017 LTM 6/18
5.2x 5.2x
6.1x
5.7x
4.1x
3.3x 3.4x
3.0x
3.5x
4.0x
4.5x
5.0x
5.5x
6.0x
6.5x
2012 2013 2014 2015 2016 2017 LTM 6/18
$43.0 $44.1
$34.3 $34.3
$26.6
$16.9$14.0
$10
$15
$20
$25
$30
$35
$40
$45
$50
2012 2013 2014 2015 2016 2017 LTM 6/18
$48.7 $49.6 $48.8$50.6
$52.4
$60.0$61.6
$30
$35
$40
$45
$50
$55
$60
$65
2012 2013 2014 2015 2016 2017 LTM 6/18
11
$ in millions
To supplement our financial information presented in accordance with generally accepted accounting principles in the United States, or U.S. GAAP, we use non-U.S. GAAP financial measures including EBITDA and
Adjusted EBITDA. We define “Adjusted EBITDA” as net income before interest expense, loss on extinguishment of debt, income taxes, depreciation, amortization, other non-cash items, and other items that we do
not consider ordinary course in our evaluation of ongoing, operating performance. Please refer to the Appendix (Page 13) for a reconciliation of Adjusted EBITDA to net income.

POSITIONED FOR FUTURE CONTINUED GROWTH
12
• Cash flow from strong focus brands
• Efficient asset-light operating
model
• Powerful sales organization and
expertise in highly regulated
environment
• Innovative, industry-leading
management team
SOLID INFRASTRUCTURE
• Reduced debt, leverage and
interest levels
• Strong cash flows, high free cash
flow conversion
EXPANDED FINANCIAL STRENGTH
• Organic growth through
consistency, innovation, sales force
investment and consumer focus
• Accretive acquisition
• Acquisition integration synergies
ATTRACTIVE GROWTH OPPORTUNITIES

APPENDIX: RECONCILIATION OF ADJUSTED EBITDA TO NET INCOME
13
(dollars in thousands) Year Ended December 31,
LTM 6/18 2017 2016 2015 2014 2013 2012
Net income (loss) attributable to Turning Point Brands, Inc. (loss) 23,244$ 20,209$ 26,913$ 9,149$ (29,405)$ (1,609)$ 430$
Add:
Interest expense 15,019 16,889 26,621 34,284 34,311 44,094 43,048
Loss on extinguishment of debt 2,384 6,116 2,824 - 42,780 441 -
Income tax expense (benefit) 9,257 7,280 (12,005) 1,078 370 486 978
Depreciation expense 1,972 1,626 1,227 1,059 933 905 968
Amortization expense 702 702 58 - - 27 38
EBITDA 52,578$ 52,822$ 45,638$ 45,570$ 48,989$ 44,344$ 45,462$
Components of Adjusted EBITDA
LIFO adjustment (a) 179 1,123 889 (56) (798) 716 2,526
Pension/postretirement expense (b) 389 284 437 341 16 407 623
Stock options, restricted stock, and incentives expense (c) 1,137 668 180 234 585 234 150
Foreign exchange hedging (d) - (90) 125 (35) - - (65)
Strategic initiatives (e) 2,991 2,133 1,587 2,259 - - -
New product launch costs (f) 1,935 2,414 2,678 1,915 - 633 -
Product line rationalizations (g) 1,571 563 - - - - -
Bonus (h) 107 107 - - - - -
IPO related compensation costs (i) - - 915 - - - -
Warehouse reconfiguration (j) - - - 376 - - -
Settlement and legal expenses (k) 680 - - - - 3,275 3
Adjusted EBITDA 61,567$ 60,024$ 52,449$ 50,604$ 48,792$ 49,609$ 48,699$
(a) Represents expense related to an inventory valuation allowance for last-in, first-out ("LIFO") reporting.
(b) Represents our non-cash Pension/postretirement expense.
(c) Represents non-cash stock options, restricted stock and incentives expense.
(d) Represents non-cash gain and loss stemming from our foreign exchange hedging activities.
(e) Represents the fees incurred for the study of strategic initiatives and acquisition expenses.
(f) Represents product launch costs of our new product lines.
(g) Represents costs associated with discontinued products related to product line rationalization.
(h) Represents bonuses associated with the December 2017 Tax Cuts and Jobs Act.
(i) Represents non-recurring compensation expenses incurred coincident with the May 2016 IPO.
(j) Represents the one-time relocation of finished product for improved logistical services.
(k) Represents settlement and legal expenses relating to the Gordian Group, LLC, complaint and the Langston Complaint for 2012+2013. For LTM, represents organizational developments.

APPENDIX: RECONCILIATION OF ADJUSTED EBITDA TO NET INCOMEIVG: LTM (6/18) EBITDA
14
(dollars in thousands) LTM 6/18
Net Income $ 4,458
Depreciation and Amortization Expense 458
Interest Expense 6
Taxes -
EBITDA $ 4,949