Embed Size (px)
Citation preview

june 30 - november 30, 2016 | 1
IMPLEMENTATION GUIDE For 2nd Year
GASB 68
For plans with fiscal years ending June 30, 2016 through November 30, 2016

june 30 - november 30, 2016 | 2
ContentsOverview & Timeline . . . . . . . . . . . . . . . . . . . . . . . . . . . . . . . . . . . . . . . . 3
GASB Implementation Timeline 3
Net Pension Liability 4
Calculating Net Pension Liability . . . . . . . . . . . . . . . . . . . . . . . . . . . . . . . . . 5
Step 1: Calculate Interest on Total Pension Liability 5
Step 2: Calculate Net Pension Liability 6
Deferred Outflows and Inflows 7
Step 3: Calculate the Recognition of Experience & Assumption Changes 7
Step 4: Calculate the Projected Investment Return & Recognition of Investment Gain or Loss 8
Step 5: Update the Deferred Outflows and Inflows Spreadsheet 9
Step 6: Calculate Pension Expense 11
Step 7: Prepare Journal Entries 12
Reconciliation of Net Pension Liability 14
Note Disclosures . . . . . . . . . . . . . . . . . . . . . . . . . . . . . . . . . . . . . . . 15
Summary of Significant Accounting Policies 15
General Information about the Pension Plan 15
Changes in Net Pension Liability 18
Pension Expense and Deferred Outflows of Resources and Deferred Inflows
of Resources Related to Pensions 19
Required Supplementary Information 19
Appendix Discussion For GASB 68 . . . . . . . . . . . . . . . . . . . . . . . . . . . . . . . 20
What’s new for the 2nd year?
• Actuarial assumptions have changed and will be found on pages 15-17.
• Most municipalities will have experience and actuarial assumptions to calculate this year that were absent in the first year. These numbers are found on your GASB 68 page in your actuarial valuation.
• Your net pension liability will likely require a journal entry to offset the previous years(s) deferred outflows and inflows for this year’s recognition on page 13.
• A new optional file has been added this year to help you reconcile your net pension liability.

june 30 - november 30, 2016 | 3
OVERVIEW & TIMELINEThis implementation guide is intended to assist you in preparing the related financial statements associated with the Government Accounting Standards Board (GASB) Statement 68 relating to pensions. It will provide examples of how to construct the required charts, journal entries, note disclosures and required
supplementary information. Excel templates are also available to help you prepare and maintain the financial statements and record keeping. The responsibility for preparing the financial statements resides with the municipality; however we have many helpful resources on our website www.mersofmich.com.
February 28, 2016Receive 2015 Statement Fiduciary Net Position (Market Value of Assets) by this date
June 30, 2016Receive actuarial valuations by this date with 2015 Total Pension Liability (TPL)
Fiscal Year Ending Between
June – November 2016Use numbers as of 2015
JAN FEB MAR APR MAY JUN JUL AUG SEP OCT NOV DEC
GASB Implementation Timelinefor Fiscal Years Ending Between June – November 2016

june 30 - november 30, 2016 | 4
Net Pension Liability Net Pension Liability is the difference between the Total Pension Liability and the Fiduciary Net Position
(also called Market Value of Assets) as of the measurement date. For MERS municipalities the measurement date is December 31st of each year.
Total Pension Liability (TPL)
This number is similar to the Actuarial Accrued Liability
Fiduciary Net Position
The actual amount of assets held in the pension trust for a plan at the measurement date
Net Pension Liability
The municipality will have completed the first year of GASB and will now be recording journal entries for the 2nd year and beyond.
• Total Pension Liability will be supplied by the actuary in the GASB 68 information section of your 2015 annual actuarial valuation, see Figure 1. This report is delivered to you by June 30th of each year, and is located on your employer portal.
• Market Value of Assets is located on your Statement of Fiduciary Net Position dated December 31, 2015. MERS will email this report in February of each year, see Figure 2.
Net Pension Liability does not necessarily need to have its own line in your financial statements; this determination will depend on the size of the liability relative to other items on your financial statements. It is important to note that Net Pension Liability is a long-term liability, and is not immediately payable. The yearly employer contribution that you make to your pension plan is calculated separately by the actuary and is in the executive summary of your annual valuation.
Figure 1.
GASB 68 requires significant Note Disclosures. The information below will be included in the December 31, 2015 valuation. More information related to Note Disclosures will be available onMERS website, for all employers including instructions and examples. The information below isspecific to the employer for whom this valuation has been calculated.
12/31/201512/31/2015
benefit terms:
Inactive employees or beneficiaries currently receiving benefits: 80Inactive employees entitled but not yet receiving benefits: 7Active employees: 49
136
Total Pension Liability as of 12/31/14 measurement date: $19,149,439
Total Pension Liability as of 12/31/15 measurement date: $23,370,040
Service Cost for the year ending on the 12/31/15 measurement date: $391,212
Change in Total Pension Liability1 due to: - Benefit changes: $0 - Differences between expected and actual experience: ($55,620) - Changes in assumptions: $2,403,119Average expected remaining service lives of all employees (active and inactive): 8
Covered employee payroll: (Needed for Required Supplementary Information) $2,496,002
1 The change in liability due to benefit changes is immediately recognized when calculating pensionexpense for the year. Changes in liability due to differences between actual and expectedexperience, and changes in assumptions, are recognized in pension expense over the averageremaining service lives of all employees. The changes in experience number
Sensitivity of Total Pension Liability due to changes in discount rate:These amounts will have to be added (and subtracted) from the Net Pension Liability as of themeasurement date in the Note Disclosures.
1% Current 1%Decrease Discount Increase(7.25%) Rate (8.25%) (9.25%)$502,080 ($403,958)
Note: The current discount rate shown for GASB 68 purposes is higher than the MERSassumed rate of return. This is because for GASB 68 purposes, the discount rate must be grossof administrative expenses, whereas for funding purposes it is net of administrative expenses.
GASB 68 Information(from the actuarial valuation)
Valuation Date:Measurement Date:
Employees covered by benefit terms. At 12/31/2015, the following employees were covered by the
Figure 2.
1134 Municipal Way City of AnaLansing, MI 48917 1234 Maple Street(800) 767-6377 Ana, MI 48555
Statement of Fiduciary Net PositionFor the Year Ended 12/31/2015
Reserve for Employee Contributions
Balance as Invoiced and other Transfers EE Refunds Interest on EE Balance as of of 1/1/2015 contributions Balance 12/31/2015
85010101 General 1,203,259 42,108 (3,874) 0 1,506 1,242,99985010102 Police 946,274 15,002 0 1,148 962,42485010110 Administrative 546,727 4,785 3,874 0 619 556,005
Total 2,696,260 61,895 0 0 3,273 0 2,761,428
Reserve for Employer Contributions
Balance as Invoiced and other Transfers Benefits Paid Net Investment Admin expenses Balance as of of 1/1/2015 contributions Income 12/31/15
85010101 General 7,525,855 103,396 (114,020) (48,902) 506,332 (21,695) 7,950,96685010102 Police 3,581,853 68,318 (31,967) 318,092 (12,704) 3,923,59285010110 Administrative 2,018,232 73,051 114,020 (28,994) 177,620 (6,599) 2,347,330
Total 13,125,940 244,765 0 (109,863) 1,002,044 (40,998) 14,221,888
Combined Reserves
Total 15,822,200 306,660 0 (109,863) 1,005,317 (40,998) 16,983,316
june 30 - november 30, 2016 | 5
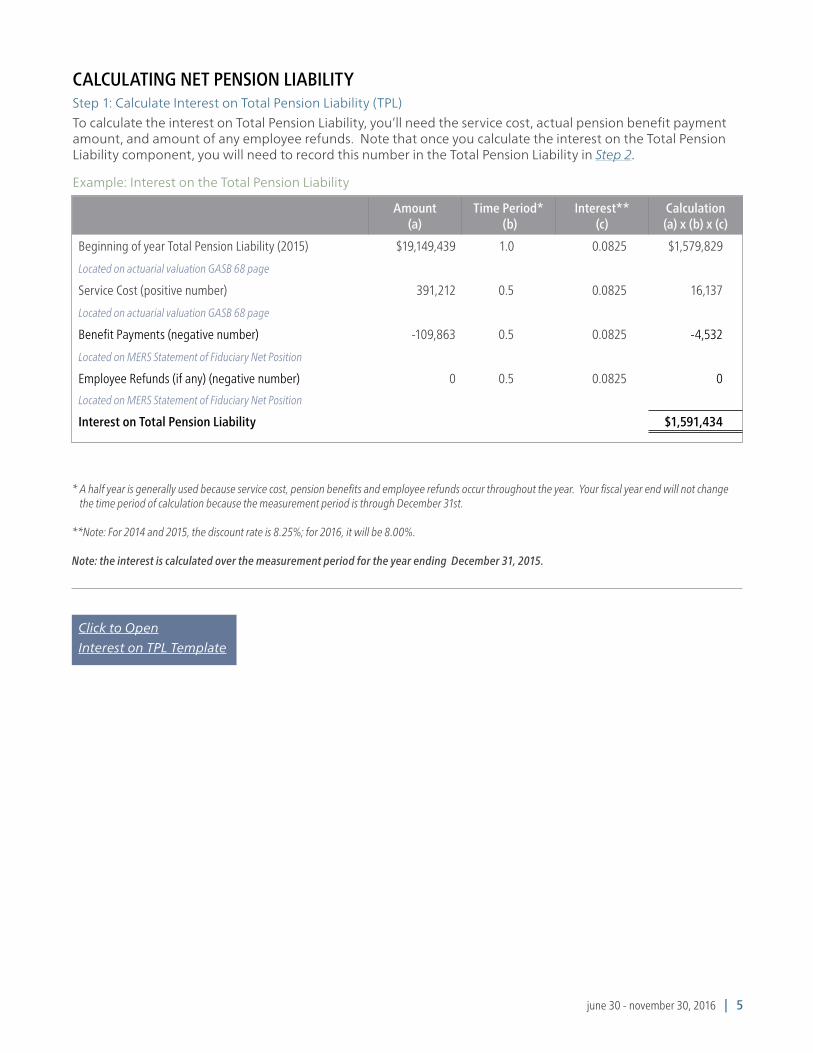
CALCULATING NET PENSION LIABILITYStep 1: Calculate Interest on Total Pension Liability (TPL)To calculate the interest on Total Pension Liability, you’ll need the service cost, actual pension benefit payment amount, and amount of any employee refunds. Note that once you calculate the interest on the Total Pension Liability component, you will need to record this number in the Total Pension Liability in Step 2.
Amount(a)
Time Period* (b)
Interest**(c)
Calculation(a) x (b) x (c)
Beginning of year Total Pension Liability (2015) $19,149,439 1.0 0.0825 $1,579,829
Located on actuarial valuation GASB 68 page
Service Cost (positive number) 391,212 0.5 0.0825 16,137
Located on actuarial valuation GASB 68 page
Benefit Payments (negative number) -109,863 0.5 0.0825 -4,532
Located on MERS Statement of Fiduciary Net Position
Employee Refunds (if any) (negative number) 0 0.5 0.0825 0
Located on MERS Statement of Fiduciary Net Position
Interest on Total Pension Liability $1,591,434
* A half year is generally used because service cost, pension benefits and employee refunds occur throughout the year. Your fiscal year end will not change the time period of calculation because the measurement period is through December 31st.
**Note: For 2014 and 2015, the discount rate is 8.25%; for 2016, it will be 8.00%.
Note: the interest is calculated over the measurement period for the year ending December 31, 2015.
Example: Interest on the Total Pension Liability
Click to Open
Interest on TPL Template
june 30 - november 30, 2016 | 6
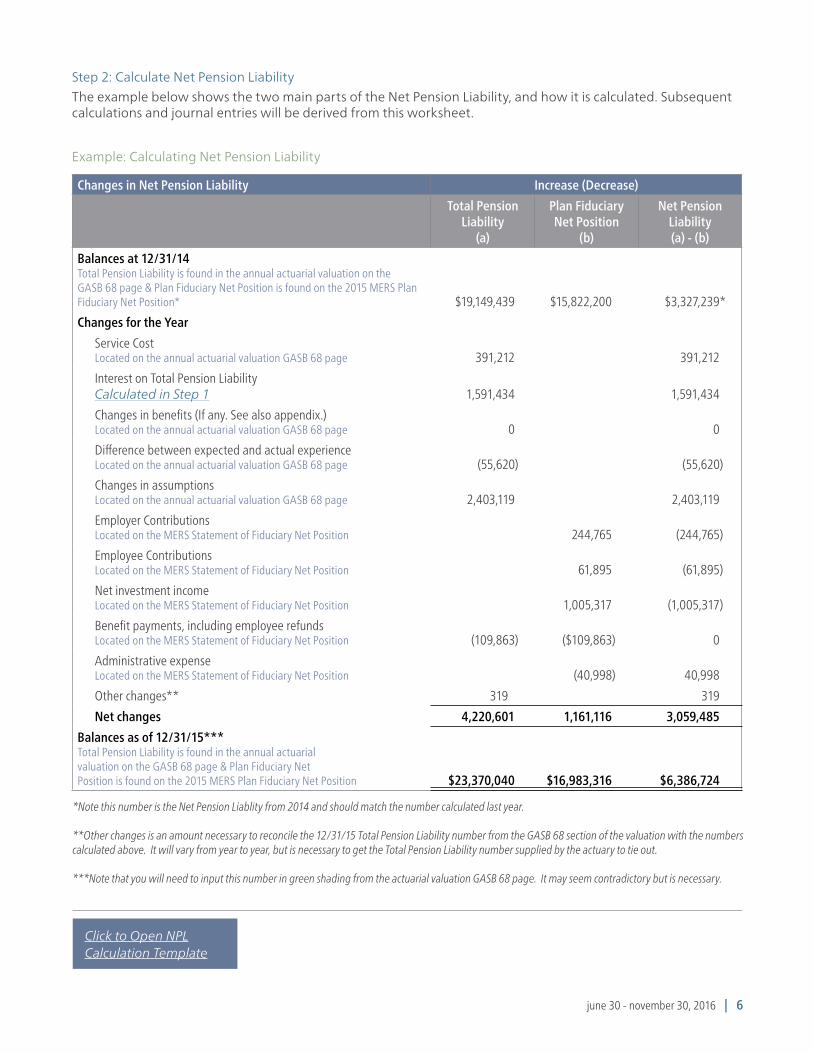
Step 2: Calculate Net Pension LiabilityThe example below shows the two main parts of the Net Pension Liability, and how it is calculated. Subsequent calculations and journal entries will be derived from this worksheet.
Example: Calculating Net Pension Liability
Changes in Net Pension Liability Increase (Decrease)
Total Pension Liability
(a)
Plan Fiduciary Net Position
(b)
Net Pension Liability(a) - (b)
Balances at 12/31/14 Total Pension Liability is found in the annual actuarial valuation on the GASB 68 page & Plan Fiduciary Net Position is found on the 2015 MERS Plan Fiduciary Net Position* $19,149,439 $15,822,200 $3,327,239*
Changes for the Year
Service Cost Located on the annual actuarial valuation GASB 68 page 391,212 391,212
Interest on Total Pension Liability Calculated in Step 1 1,591,434 1,591,434
Changes in benefits (If any. See also appendix.) Located on the annual actuarial valuation GASB 68 page 0 0
Difference between expected and actual experience Located on the annual actuarial valuation GASB 68 page (55,620) (55,620)
Changes in assumptions Located on the annual actuarial valuation GASB 68 page 2,403,119 2,403,119
Employer Contributions Located on the MERS Statement of Fiduciary Net Position 244,765 (244,765)
Employee Contributions Located on the MERS Statement of Fiduciary Net Position 61,895 (61,895)
Net investment income Located on the MERS Statement of Fiduciary Net Position 1,005,317 (1,005,317)
Benefit payments, including employee refunds Located on the MERS Statement of Fiduciary Net Position (109,863) ($109,863) 0
Administrative expense Located on the MERS Statement of Fiduciary Net Position (40,998) 40,998
Other changes** 319 319
Net changes 4,220,601 1,161,116 3,059,485
Balances as of 12/31/15*** Total Pension Liability is found in the annual actuarial valuation on the GASB 68 page & Plan Fiduciary Net Position is found on the 2015 MERS Plan Fiduciary Net Position $23,370,040 $16,983,316 $6,386,724
*Note this number is the Net Pension Liablity from 2014 and should match the number calculated last year.
**Other changes is an amount necessary to reconcile the 12/31/15 Total Pension Liability number from the GASB 68 section of the valuation with the numbers calculated above. It will vary from year to year, but is necessary to get the Total Pension Liability number supplied by the actuary to tie out.
***Note that you will need to input this number in green shading from the actuarial valuation GASB 68 page. It may seem contradictory but is necessary.
Click to Open NPLCalculation Template
june 30 - november 30, 2016 | 7
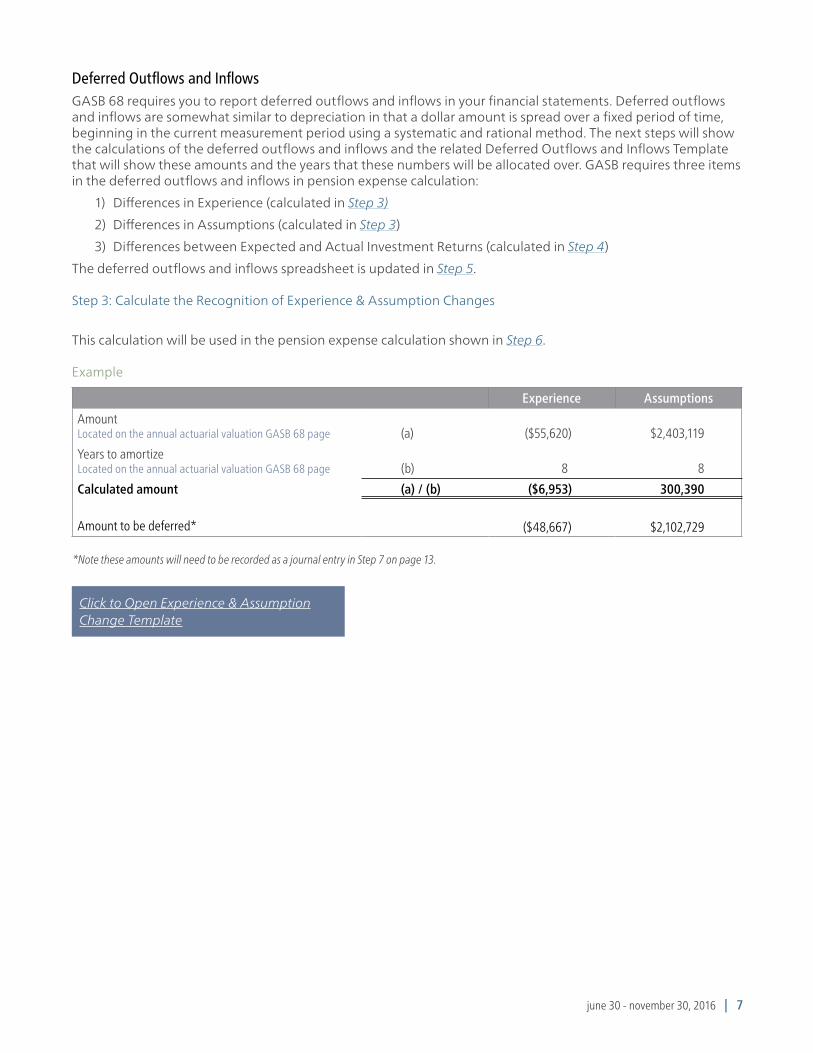
Deferred Outflows and InflowsGASB 68 requires you to report deferred outflows and inflows in your financial statements. Deferred outflows and inflows are somewhat similar to depreciation in that a dollar amount is spread over a fixed period of time, beginning in the current measurement period using a systematic and rational method. The next steps will show the calculations of the deferred outflows and inflows and the related Deferred Outflows and Inflows Template that will show these amounts and the years that these numbers will be allocated over. GASB requires three items in the deferred outflows and inflows in pension expense calculation:
1) Differences in Experience (calculated in Step 3)
2) Differences in Assumptions (calculated in Step 3)
3) Differences between Expected and Actual Investment Returns (calculated in Step 4)
The deferred outflows and inflows spreadsheet is updated in Step 5.
Step 3: Calculate the Recognition of Experience & Assumption Changes
This calculation will be used in the pension expense calculation shown in Step 6.
Example
Experience Assumptions
Amount Located on the annual actuarial valuation GASB 68 page (a) ($55,620) $2,403,119
Years to amortize Located on the annual actuarial valuation GASB 68 page (b) 8 8
Calculated amount (a) / (b) ($6,953) 300,390
Amount to be deferred* ($48,667) $2,102,729
Click to Open Experience & AssumptionChange Template
*Note these amounts will need to be recorded as a journal entry in Step 7 on page 13.

june 30 - november 30, 2016 | 8
Step 4: Calculate the Projected Investment Return & Recognition of Investment Gain or Loss
Net Investment Income Projections
Amount (a)
Time Period* (b)
Interest*** (c)
Calculation (a) x (b) x (c)
Beginning of year Fiduciary Net Position Located on Statement of Fiduciary Net Position $15,822,200 1.0 0.0825 $1,305,332
Employer Contributions Located on Statement of Fiduciary Net Position 244,265 0.5 0.0825 10,076
Employee Contributions Located on Statement of Fiduciary Net Position 61,895 0.5 0.0825 2,553
Benefit Payments Located on Statement of Fiduciary Net Position (109,863) 0.5 0.0825 (4,532)
Employee Refunds, if any Located on Statement of Fiduciary Net Position 0 0.5 0.0825 0
Administrative Expenses Located on Statement of Fiduciary Net Position (40,998) 0.5 0.0825 (1,691)
Projected Net Investment Income $1,311,738
Actual Net Investment Income for the year** Located on Statement of Fiduciary Net Position 1,005,317
Excess (Deficit) Investment returns Difference between Projected Net Investment Income and Actual Net Investment Income for the year (306,421)
Excess (Deficit) Investment returns to allocate for year (61,284)
Remaining excess/(deficit) investment returns to allocate on page 13
(245,137)
Excess (Deficit) Investment returns divided by 5 (returns are always allocated over 5 years)
* A half year is generally used because employer and employee contributions, pension payments and administrative expenses are spread throughout the year.
**In some years the actual net investment income amount will be positive or negative depending on market conditions.
*** Note: For 2014 and 2015, the discount rate is 8.25%; for 2016 and thereafter, it will be 8.00%.

june 30 - november 30, 2016 | 9
Step 5: Update the Deferred Outflows and Inflows SpreadsheetYou will need to maintain this schedule for subsequent years’ deferrals. There are different dollar amounts that will come from the actuary each year and those amounts will be seen in the GASB 68 section of your annual actuarial valuation as calculated in Step 3. These amounts are calculated over the remaining service lives of the members, also seen in the GASB 68 section of the annual actuarial valuation. In the case of net investment income returns above or below the expected investment return, the difference is recognized over a period of five years. The expected investment return is calculated in Step 4.
You will add to this spreadsheet an additional set of deferrals each year. We have shown the first year deferrals in the example below.
Deferred Outflows and Inflows Timeline (Layers) Related to Pension Expense Year 1 (Note: This example is from Year 1)
Differences in experience and assumptions are allocated out over the remaining service lives of active and inactive employees (can vary somewhat but usually consistent in years); These numbers and the service lives of the active and inactive employees are found in the GASB 68 section of the valuation.Above dates are based on measurement date, not necessarily the fiscal year.The annual actuarial valuations will add new layers each year. There will also be a yearly calculation of investment returns different from the expected returns.Note: deferred inflows are recorded as negative amounts and deferred outflows are recorded as positive amounts.
Total (O/I) to
beDeferred
AmortizationYears 2014 2015 2016 2017 2018 2019 2020 2021 2022 2023 Total
2014 Excess (Deficit) Investment Returns Calculated in Step 4 (125,814) 5 (25,163) (25,163) (25,163) (25,163) (25,162) (125,814)
2015 Excess (Deficit) Investment Returns 5
2016 Excess (Deficit) Investment Returns 5
Increase/(decrease) in pension expense (25,163) (25,163) (25,163) (25,163) (25,162) 0 0 0 0 0 (125,814)
2014 Differences in experience Located on annual actuarial valuation GASB 68 page Calculated in Step 3
104,807 8 13,101 13,101 13,101 13,101 13,101 13,101 13,101 13,100 104,807
2015 Differences in experience 0
2016 Differences in experience 0
Increase/(decrease) in pension expense 13,101 13,101 13,101 13,101 13,101 13,101 13,101 13,100 0 0 104,807
2014 Differences in assumptions Located on annual actuarial valuation GASB 68 page Calculated in Step 3
(135,344) 8 (16,918) (16,918) (16,918) (16,918) (16,918) (16,918) (16,918) (16,918) (135,344)
2015 Differences in assumptions 0
2016 Differences in assumptions 0
Increase/(decrease) in pension expense (16,918) (16,918) (16,918) (16,918) (16,918) (16,918) (16,918) (16,918) 0 0 (135,344)
Net increase (decrease) in pension expense (28,980) (28,980) (28,980) (28,980) (28,979) (3,817) (3,817) (3,818) 0 0 (156,351)

june 30 - november 30, 2016 | 10
Subsequent years are also provided to show how the different layers of deferrals are added to the example above.
Deferred Outflows and Inflows Timeline (Layers) Related to Pension Expense for Years 1 and 2
Investment returns in excess of expected are allocated out over 5 years, see also Schedule 7 for the calculation of this amount.
Differences in experience and assumptions are allocated out over the remaining service lives of Active and Inactive employees (can vary somewhat but usually consistent in years); These numbers and the service lives of the active and inactive employee, are found in the GASB 68 section of the actuarial valuation.
Above dates are based on measurement date of December 31st, not necessarily the fiscal year.
The actuarial valuations will add new layers each year. There will also be a yearly calculation of investment returns different from the expected returns that will be added each year.
Note: that deferred outflows are negative and deferred inflows are positive.
Click to Open Deferred Outflows and InflowsTimeline Template
Total (O/I) to
beDeferred
AmortizationYears 2014 2015 2016 2017 2018 2019 2020 2021 2022 2023 Total
2014 Excess (Deficit) Investment Returns (125,814) 5 (25,163) (25,163) (25,163) (25,163) (25,162) (125,814)
2015 Excess (Deficit) Investment Returns 306,421 5 61,284 61,284 61,284 61,284 61,285 306,421
2016 Excess (Deficit) Investment Returns 5 0 0 0 0 0 0
Increase (decrease) in pension expense (25,163) 36,121 36,121 36,121 36,121 61,285 0 0 0 0 180,607
2014 Differences in experience 104,807 8 13,101 13,101 13,101 13,101 13,101 13,101 13,101 13,100 104,807
2015 Differences in experience (55,620) 8 (6,953) (6,953) (6,953) (6,953) (6,953) (6,953) (6,953) (6,949) (55,620)
2016 Differences in experience 0
Increase (decrease) in pension expense 13,101 6,148 6,148 6,148 6,148 6,148 6,148 6,148 (6,949) 0 49,187
2014 Differences in assumptions (135,344) 8 (16,918) (16,918) (16,918) (16,918) (16,918) (16,918) (16,918) (16,918) (135,344
2015 Differences in assumptions 2,403,119 8 300,390 300,390 300,390 300,390 300,390 300,390 300,390 300,389 2,403,119
2016 Differences in assumptions 0
Increase (decrease) in pension expense (16,918) 283,472 283,472 283,472 283,472 283,472 283,472 283,472 300,389 0 2,267,775
Net increase (decrease) in pension expense (28,980) 325,742 325,742 325,741 325,742 350,905 289,620 289,619 293,440 0 2,497,569
june 30 - november 30, 2016 | 11
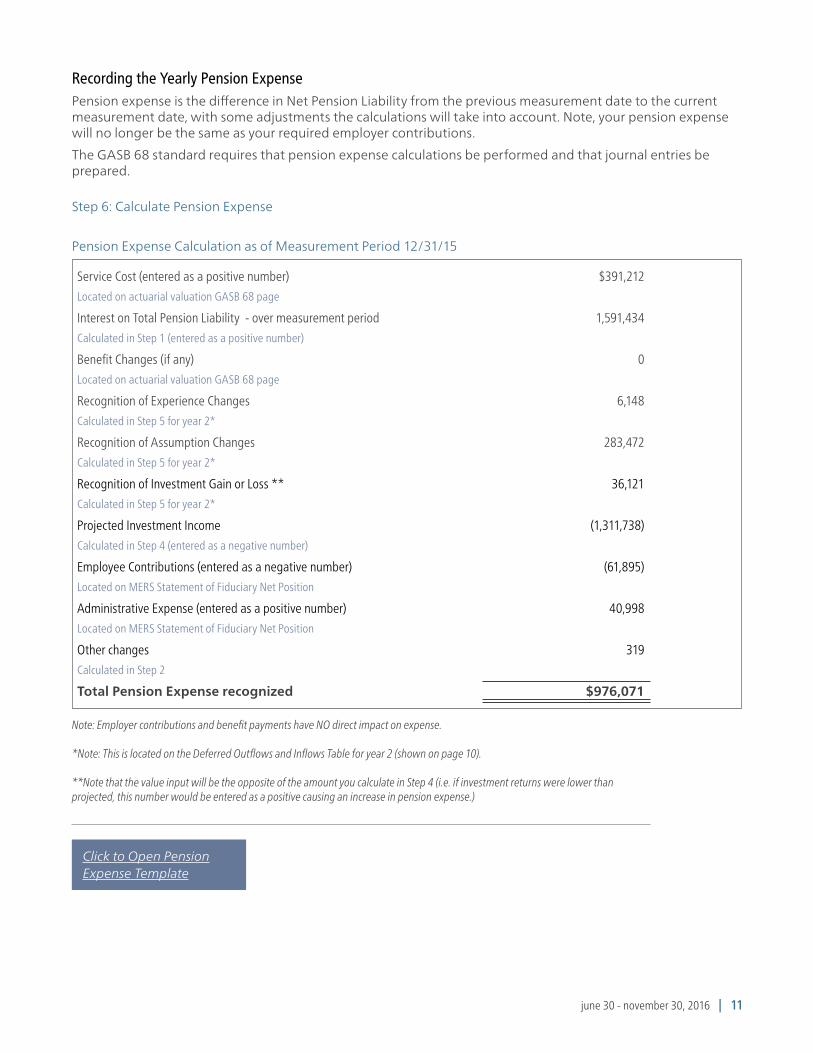
Service Cost (entered as a positive number) $391,212
Located on actuarial valuation GASB 68 page
Interest on Total Pension Liability - over measurement period 1,591,434
Calculated in Step 1 (entered as a positive number)
Benefit Changes (if any) 0
Located on actuarial valuation GASB 68 page
Recognition of Experience Changes 6,148
Calculated in Step 5 for year 2*
Recognition of Assumption Changes 283,472
Calculated in Step 5 for year 2*
Recognition of Investment Gain or Loss ** 36,121
Calculated in Step 5 for year 2*
Projected Investment Income (1,311,738)
Calculated in Step 4 (entered as a negative number)
Employee Contributions (entered as a negative number) (61,895)
Located on MERS Statement of Fiduciary Net Position
Administrative Expense (entered as a positive number) 40,998
Located on MERS Statement of Fiduciary Net Position
Other changes 319
Calculated in Step 2
Total Pension Expense recognized $976,071
Recording the Yearly Pension Expense Pension expense is the difference in Net Pension Liability from the previous measurement date to the current measurement date, with some adjustments the calculations will take into account. Note, your pension expense will no longer be the same as your required employer contributions.
The GASB 68 standard requires that pension expense calculations be performed and that journal entries be prepared.
Step 6: Calculate Pension Expense
Pension Expense Calculation as of Measurement Period 12/31/15
Note: Employer contributions and benefit payments have NO direct impact on expense.
*Note: This is located on the Deferred Outflows and Inflows Table for year 2 (shown on page 10).
**Note that the value input will be the opposite of the amount you calculate in Step 4 (i.e. if investment returns were lower than projected, this number would be entered as a positive causing an increase in pension expense.)
Click to Open PensionExpense Template
june 30 - november 30, 2016 | 12
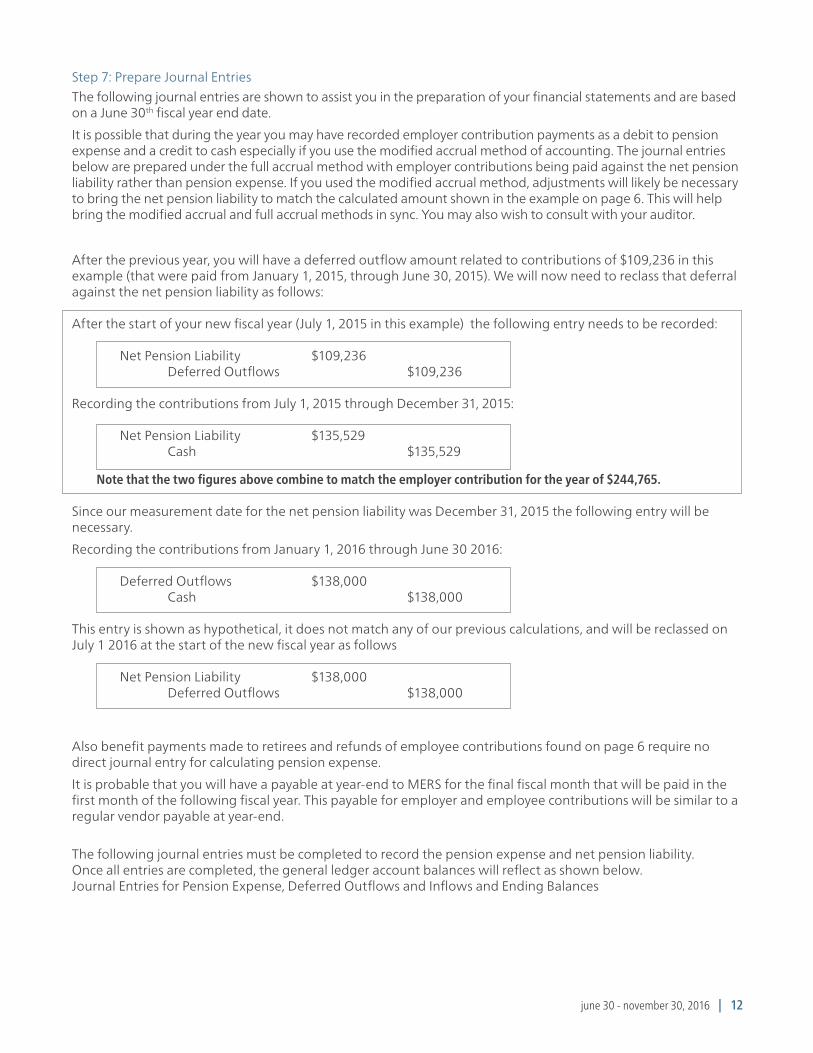
Step 7: Prepare Journal Entries The following journal entries are shown to assist you in the preparation of your financial statements and are based on a June 30th fiscal year end date.
It is possible that during the year you may have recorded employer contribution payments as a debit to pension expense and a credit to cash especially if you use the modified accrual method of accounting. The journal entries below are prepared under the full accrual method with employer contributions being paid against the net pension liability rather than pension expense. If you used the modified accrual method, adjustments will likely be necessary to bring the net pension liability to match the calculated amount shown in the example on page 6. This will help bring the modified accrual and full accrual methods in sync. You may also wish to consult with your auditor.
After the previous year, you will have a deferred outflow amount related to contributions of $109,236 in this example (that were paid from January 1, 2015, through June 30, 2015). We will now need to reclass that deferral against the net pension liability as follows:
After the start of your new fiscal year (July 1, 2015 in this example) the following entry needs to be recorded:
Net Pension Liability $109,236 Deferred Outflows $109,236
Recording the contributions from July 1, 2015 through December 31, 2015:
Net Pension Liability $135,529 Cash $135,529
Note that the two figures above combine to match the employer contribution for the year of $244,765.
Since our measurement date for the net pension liability was December 31, 2015 the following entry will be necessary.
Recording the contributions from January 1, 2016 through June 30 2016:
Deferred Outflows $138,000 Cash $138,000
This entry is shown as hypothetical, it does not match any of our previous calculations, and will be reclassed on July 1 2016 at the start of the new fiscal year as follows
Net Pension Liability $138,000 Deferred Outflows $138,000
Also benefit payments made to retirees and refunds of employee contributions found on page 6 require no direct journal entry for calculating pension expense.
It is probable that you will have a payable at year-end to MERS for the final fiscal month that will be paid in the first month of the following fiscal year. This payable for employer and employee contributions will be similar to a regular vendor payable at year-end.
The following journal entries must be completed to record the pension expense and net pension liability.Once all entries are completed, the general ledger account balances will reflect as shown below.Journal Entries for Pension Expense, Deferred Outflows and Inflows and Ending Balances

june 30 - november 30, 2016 | 13
Journal Entries for Pension Expense, Deferred Outflows and Inflows and Ending Balances
Debit CreditPension Expense
See calculation from Step 6 976,071
Net Pension Liability 976,071
Deferred outflow investment
Excess (Deficit) Investment Returns that was calculated in Step 4, minus one year of expense of ($61,284) 245,137
Net Pension Liability 245,137
Net Pension Liability
Differences in experience, that was calculated in Step 3., minus one year of expense ($6,953) 48,667
Deferred inflow experience 48,667
Deferred outflow assumptions
Differences in assumptions that was calculated in Step 3., minus one year of expense ($300,390) 2,102,729
Net Pension Liability 2,102,729
Click to Open JournalEntries Template
In 2014 deferred outflow/inflows were recorded to recognize a portion of the assumption changes, experience changes and differences between expected and actual investment returns that had not yet been expensed. At the time those amounts were adjusted as either a debit or credit to deferred outflow/inflows and an offset against net pension liability. In 2015 we will need to reclass a portion of those deferrals as follows:
Deferred inflow investments $25,163
Deferred outflow experience $13,101
Deferred inflow assumptions $16,918
Net Pension Liability $28,980
This entry is necessary to match the net pension liability amount calculated in Step 2 in 2015, tie to your trial balance and general ledger for 2015. These amounts are taken from the prior year’s deferrals for 2014 on page 10. After all the entries are recorded, the ending balances would be as follows:
Note: This amount should match the amount calculated in Step 2
Balances at Fiscal Year End Net Pension Liability
See Step 2 6,386,724
Deferred inflows investmentsSee above 169,649
Deferred outflows assumptionsSee above 2,001,221
Deferred outflows experienceSee above 29,938
Deferred outflows employer contributionsFrom page 12 138,000
june 30 - november 30, 2016 | 14
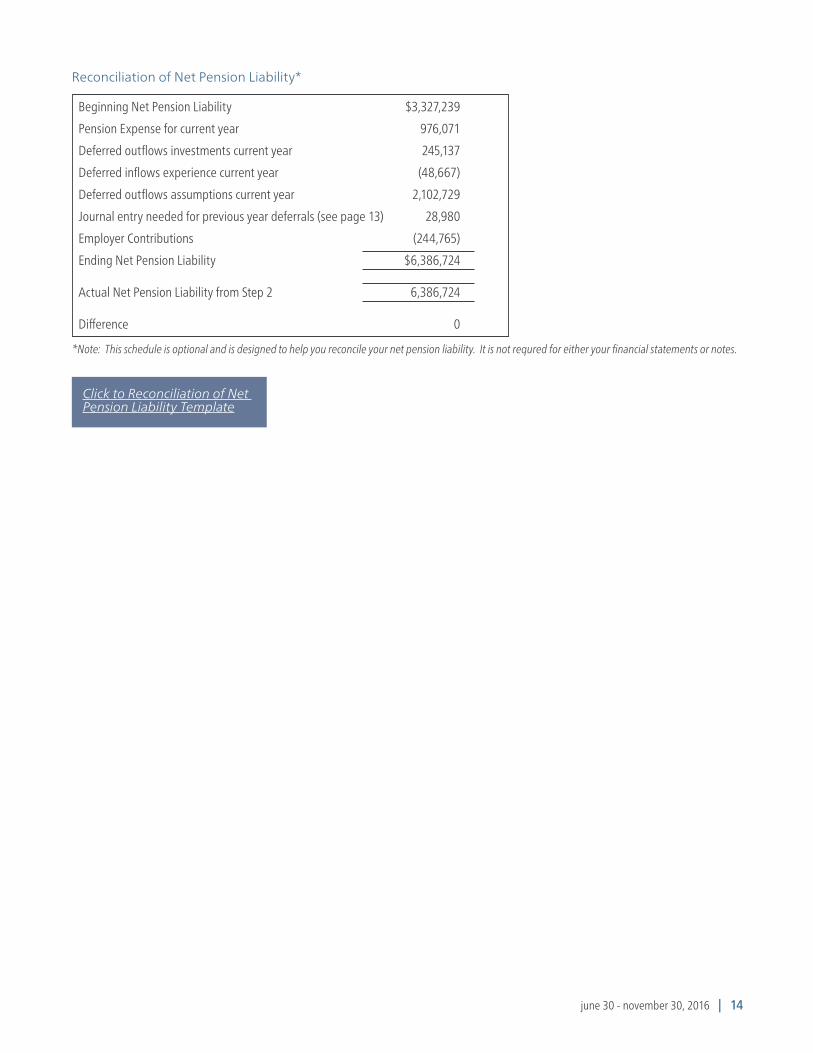
Click to Reconciliation of Net Pension Liability Template
Reconciliation of Net Pension Liability*
*Note: This schedule is optional and is designed to help you reconcile your net pension liability. It is not requred for either your financial statements or notes.
Beginning Net Pension Liability $3,327,239
Pension Expense for current year 976,071
Deferred outflows investments current year 245,137
Deferred inflows experience current year (48,667)
Deferred outflows assumptions current year 2,102,729
Journal entry needed for previous year deferrals (see page 13) 28,980
Employer Contributions (244,765)
Ending Net Pension Liability $6,386,724 Actual Net Pension Liability from Step 2 6,386,724 Difference 0

june 30 - november 30, 2016 | 15
NOTE DISCLOSURESNote disclosures are required by GASB to help explain the pension plan and Net Pension Liability calculations associated with the plan. These are rather significant and will involve many of the templates that have been completed in previous steps as well as your annual actuarial valuation.
Below are examples of note disclosures that you can customize and then copy and paste into your financial statements.
Summary of Significant Accounting PoliciesPensions . For purposes of measuring the Net Pension Liability, deferred outflows of resources and deferred inflows of resources related to pensions, and pension expense, information about the fiduciary net position of the Municipal Employees Retirement System (MERS) of Michigan and additions to/deductions from MERS’ fiduciary net position have been determined on the same basis as they are reported by MERS. For this purpose, benefit payments (including refunds of employee contributions) are recognized when due and payable in accordance with the benefit terms. Investments are reported at fair value.
General Information about the Pension PlanPlan Description . The employer’s defined benefit pension plan provides certain retirement, disability and death benefits to plan members and beneficiaries. The employer participates in the Municipal Employees Retirement System (MERS) of Michigan. MERS is an agent multiple-employer, statewide public employee pension plan established by the Michigan Legislature under Public Act 135 of 1945 and administered by a nine member Retirement Board. MERS issues a publicly available financial report that includes financial statements and required supplementary information. This report may be obtained accessing the MERS website at www.mersofmich.com.
Benefits Provided
Instructions
Copy and paste
Copy and paste
There are several ways to present this data.
Option 1)Copy Table 2 from your annual valuation.
5

june 30 - november 30, 2016 | 16
Benefits provided include plans with multipliers ranging from [ ] to [ ].
Vesting periods range from [ ] to [ ] years.
Normal retirement age is 60 with early retirement at [ ] with [ ] years of service
Final average compensation is calculated based on [ ] years. Member contributions range from [ ] to [ ].
Employees covered by benefit terms . At the December 31st [ ] valuation date, the following employees were covered by the benefit terms:
Inactive employees or beneficiaries currently receiving benefits [ ]
Inactive employees entitled to but not yet receiving benefits [ ]
Active employees [ ]
[ ]
Contributions . The employer is required to contribute amounts at least equal to the actuarially determined rate, as established by the MERS Retirement Board. The actuarially determined rate is the estimated amount necessary to finance the cost of benefits earned by employees during the year, with an additional amount to finance any unfunded accrued liability. The employer may establish contribution rates to be paid by its covered employees.
Employer contributions range from [ ] to [ ] based on annual payroll for open divisions. One division that is closed to new employees has an annual employer contribution amount of [ ] .
Net Pension Liability . The employer’s Net Pension Liability was measured as of December 31, [ ], and the total pension liability used to calculate the Net Pension Liability was determined by an annual actuarial valuation as of that date.
Actuarial assumptions . The total pension liability in the December 31, [ ] annual actuarial valuation was determined using the following actuarial assumptions, applied to all periods included in the measurement:
Inflation: 2.5%
Salary Increases: 3.75% in the long-term
Investment rate of return: 7.75%, net of investment and administrative expense including inflation
Option 2)
If you have many divisions you can summarize the benefit provisions.
Refer to the GASB 68 section of the annual valuation report for membership summary numbers.
If the pension plan is closed to new employees, the employer should disclose this fact, as required by paragraph 40b of GASB 68.
You will need to enter the contribution rates (in dollars or as a percentage of covered payrolls) made during the reporting period, then copy and paste.
Enter the date of the annual valuation, then copy and paste.
Enter the date of the annual valuation, then copy and paste. Assumptions can change annually, so be sure to update this section each year.

june 30 - november 30, 2016 | 17
Although no specific price inflation assumptions are needed for the valuation, the 2.5% long-term wage inflation assumption would be consistent with a price inflation of 3%-4%.
Mortality rates used were based on the RP-2014 Group Annuity Mortality Table of a 50% Male and 50% Female blend.
The actuarial assumptions used in valuation were based on the results of the most recent actuarial experience study of 2009-2013. The long-term expected rate of return on pension plan investments was determined using a model method in which the best-estimate ranges of expected future real rates of return (expected returns, net of investment and administrative expenses and inflation) are developed for each major asset class. These ranges are combined to produce the long-term expected rate of return by weighting the expected future real rates of return by the target asset allocation percentage and by adding expected inflation. The target allocation and best estimates of arithmetic real rates of return for each major asset class are summarized in the following table:
Asset Class Target AllocationLong-Term Expected Real Rate of Return
Global Equity 57.5% 5.02%
Global Fixed Income 20.0% 2.18%
Real Assets 12.5% 4.23%
Diversifying Strategies 10.0% 6.56%
Discount rate . The discount rate used to measure the total pension liability is 8.25% for 2015. The projection of cash flows used to determine the discount rate assumes that employer and employee contributions will be made at the rates agreed upon for employees and the actuarially determined rates for employers. Based on these assumptions, the pension plan’s fiduciary net position was projected to be available to pay all projected future benefit payments of current active and inactive employees. Therefore, the long-term expected rate of return on pension plan investments was applied to all periods of projected benefit payments to determine the total pension liability.
If the employer includes an ad hoc post-employment benefit change (commonly referred to as COLA) that information needs to be disclosed. Note that this applies to very few employers, and MERS has contacted them directly.

june 30 - november 30, 2016 | 18
Changes in Net Pension Liability
Calculating the Net Pension Liability
Changes in Net Pension Liability Increase (Decrease)
Balances at 12/31/14
Total Pension Liability
(a)
Plan Fiduciary Net Position
(b)
Net Pension Liability (a) - (b)
Changes for the Year
Service Cost
Interest on Total Pension Liability
Changes in benefits
Difference between expected and actual experience
Changes in assumptions
Employer Contributions
Employee Contributions
Net investment Income
Benefit payments, including employee refunds
Administrative expense
Other changes
Net changes
Balances as of 12/31/15
Insert table from Step 2
You will need to do this calculation. Total Pension Liability and current discount rate are located on the GASB 68 page of your annual actuarial valuation, and your Fiduciary Net Position is located on your Statement of Fiduciary Net Position.
Sensitivity of the Net Pension Liability to changes in the discount rate . The following presents the Net Pension Liability of the employer, calculated using the discount rate of 8.25%, as well as what the employer’s Net Pension Liability would be using a discount rate that is 1 percentage point lower (7.25%) or 1% higher (9.25%) than the current rate.
Click to Open Sensitivity to Changes in Discount Rate Template
1% Decrease
7 .25%
Current Discount Rate
(8 .25%)
1% Increase 9/25%
Net Pension Liability at 12/31/15 From Step 2 Excel Calculation
3,327,239
Change in Net Pension Liablity (NPL) From actuarial valuation GASB 68 page
487,401 -382,016
Calculated NPL for your Notes $3,814,640 $3,327,239 $2,945,223
Note: The current discount rate shown for GASB 68 purposes is higher than the MERS assumed rate of return. This is because for GASB purposes, the discount rate must be gross of administrative expenses, whereas for funding purposes, it is net of administrative expenses.

june 30 - november 30, 2016 | 19
Pension Expense and Deferred Outflows of Resources and Deferred Inflows of Resources Related to PensionsFor the year ended [ ] the employer recognized pension expense of [ ]. The employer reported deferred outflows and inflows of resources related to pensions from the following sources:
Enter your fiscal year end and pension expense (calculated in Step 6).
Then using the numbers you calculated in Step 5 complete the table of deferred outflows and inflows.
Deferred Outflows
of Resources
Deferred Inflows
of Resources
Differences in experience $ $
Differences in assumptions $ $
Excess (Deficit) Investment Returns $ $
Contributions subsequent to the measurement date*
$ $
Total $ $
*The amount reported as deferred outflows of resources resulting from contributions subsequent to the measurement date will be recognized as a reduction in the Net Pension Liabilityfor the year ending [ ].
Amounts reported as deferred outflows and inflows of resources related to pensions will be recognized in pension expense as follows:
Year ended 2016 [ ]
2017 [ ]
2018 [ ]
2019 [ ]
2020 [ ]
Thereafter [ ]
Required Supplementary InformationRequired supplementary information schedules are required with GASB 68. The Schedule of Employer Contributions shows the employer’s required annual contributions from the annual actuarial valuation, compared with the actual contributions remitted over the past ten years. This schedule can be filled out prospectively but many employers will have the information from prior years.
The Schedule of Changes In Employer’s Net Pension Liability and Related Ratios shows the changes in total pension liability less the statement of changes in fiduciary net position resulting in the Net Pension Liability calculation for the employer. There are ratios calculated, as well, involving covered employee payrolls. Note that this is a 10 year schedule prospectively.
• Schedule of Changes in Employer’s Net Pension Liability and Related Ratios
• Schedule of Employer Contributions
Deferred Outflows
of Resources
Deferred Inflows of Resources
Differences in experience**
$29,940
Differences in assumptions**
2,001,220
Excess (Deficit) Investment Returns**
169,649
Contributions subsequent to the measurement date***
138,000
Total $2,338,809 0
Year ended 2016 325,742
2017 325,742
2018 325,742
2019 350,904
2020 289,620
Thereafter 583,059
* Your numbers will vary. This is only meant as an illustration. These numbers come from the timeline on page 10.
** Note that these 3 numbers will figure into pension expense in the years from 2016 through 2020 and thereafter.
*** Note that this number will not figure into pension expense calculation in the years to come.
EXAMPLE based on implementation guide*
Click to Open Schedule of Changes in Employer’s NPL
Click to Open Schedule of Employer Contributions

june 30 - november 30, 2016 | 20
APPENDIX DISCUSSION FOR GASB 68
PRIMARY GOVERNMENTS AND COMPONENT UNITS
The subject of allocation of the Net Pension Liability when component units are involved is one that needs to be addressed by each individual municipality’s management and discussed with their auditors. The allocation of the Net Pension Liability can be done by several methods. One could be by divisional liability if that liability is broken out in the actuarial valuation. Another method could be by employee covered payroll, a third could be by employer contributions, or even another method that is applicable to the individual municipality’s situation. These considerations must be weighed in the context of the municipality’s circumstances. Paragraphs 18 and 39 in the GASB 68 Standard may supply additional information as well as paragraphs 33-35 in the GASB 68 Implementation Guide available at www.gasb.org. MERS also has much GASB 68 information by division that can be requested from our Service Center (800.767.6377).
EMPLOYERS WITH MORE THAN ONE DEFINED BENEFIT PLAN OUTSIDE OF MERS
If an employer participates with MERS Defined Benefit plan and also has another defined benefit plan that is separate from MERS (possibly an Act 345 plan) with a different measurement date than MERS December 31st measurement date, that second Net Pension Liability can be combined with the MERS Net Pension Liability as long as both plans’ measurement dates fall within the employer’s fiscal year. As an example, the City participates with MERS with a measurement date of December 31st, and a separate public safety plan with a March 31st year end. The City has a June 30th year end, both MERS and the 2nd plan may be combined for financial statement purposes as long as both dates are no earlier than the end of the employer’s prior fiscal year. Notes Disclosure and Required Supplementary Information can be found in Paragraphs 21, and 38-45 in the GASB 68 Standard as well as paragraph 38 in the GASB 68 Implementation Guide available at www.gasb.org.
If you are a non-MERS municipality you will need to enter your plan’s discount rate.
BLENDED DISCOUNT RATE
There are very few employers for whom the blended discount rate will apply. These employers will be contacted directly by MERS concerning their management of the total pension liability. For the vast majority of members in MERS this section will not apply to them.
BENEFIT CHANGES UNDER GASB 68 EFFECTIVE FOR 2015
Benefit changes made by municipalities require a supplemental valuation to be prepared and then adopted by the local government’s governing body. In most cases the benefit change occurs during the year and the actuary reflects it with the actuarial valuation that is done at the end of the year. For those benefit changes adopted with an effective date in 2015, an adjustment is necessary to be made to the GASB 68 information provided in your annual actuarial valuation due to the actuarial processes that were conducted for GASB 68 implementation. If a benefit change is effective after the measurement date of December 31, 2015, in the actuarial valuation used in the calculation of the municipality’s net pension liability, no adjustment is necessary, rather the prospective benefit changes will be picked up in the next actuarial valuation and pension expense will then be adjusted accordingly on the December 31, 2016 valuation.
The adjustment process needed to be taken will depend on if the new benefit is reflected in the 2015 AAV or not. (If you are not sure if a benefit change is reflected in the actuarial valuation please check Benefit Provisions Table 2 or the section titled “Benefit Provision History” in the actuarial valuation, these sections show benefit changes and when they were effective.).
If the newly adopted benefits are included in the 2015 AAV, you will pick up the changes on the GASB 68 page in the actuarial valuation. If the newly adopted benefits are not included in the 2015 AAV, see the following process.

june 30 - november 30, 2016 | 21
PROCESS: For benefits adopted with an effective date in 2015 and were NOT reflected in the 2015 AAV results, an adjustment will need to be made to the total pension liability as of 12/31/15 as shown in the following step. (An example would be a retroactive benefit change with an effective date of October 1st 2015 that is not signed until August 2016. The actuarial valuation measurement date while dated December 31, 2015, does not reflect the new benefit change as the 2015 actuarial valuation was prepared before the contract was signed in August 2016 in our example. If you are not sure if a benefit change is reflected in the actuarial valuation please check the section titled “Benefit Provision History” in the back section of the valuation, this shows benefit changes and when they were effective.)
Example of adjustment needed for 2015 Benefit Change not reflected in 2015 valuation (a) Change in benefits -359,219 From Supplement Valuation AAL 12/31/2015 7,529,745 Total Actuarial Accrued Liability from Table 6 in 2015 valuation(b) New AAL 7,170,526 (c) TPL 12/31/2015 7,336,107 Total Pension Liability (TPL) as of 12/31/15 from GASB 68 page in 2015 actuarial valuation (a/b)*c Change in Expense/TPL -367,514 You will adjust the 2015 Total Pension Liability by this amount and also record this amount as a change in total pension liability due to benefit changes
If you choose to make this adjustment for 2015, you will need to make adjustments in the following year as the benefit change will be picked up in the 2015 actuarial valuation and this should not be double counted. (The actuary will not have adjusted the 2015 total pension liability so your ending 2015 total pension liability will be different from what the actuary has for 2015 in the GASB 68 page of the 2016 actuarial valuation.)

june 30 - november 30, 2016 | 22
This publication contains a summary description of MERS benefits, policies or procedures. MERS has made every effort to ensure that the information provided is accurate and up to date as of 07/28/2016. Where the publication conflicts with the relevant Plan Document, the Plan Document controls. MERS, as a governmental plan, is exempted by federal and state law from registration with the SEC. However, it employs registered investment advisors to manage the trust fund in compliance with Michigan Public Employee Retirement System Investment Act. Past performance is not a guarantee of future returns. Please make independent investment decisions carefully and seek the assistance of independent experts when appropriate.
FORM 6103 20160811