Embed Size (px)
Citation preview

7/28/2019 Gas Turbine Emissions and Control
http://slidepdf.com/reader/full/gas-turbine-emissions-and-control 1/36
GE Power Systems
Gas Turbine Emissions and Control
Roointon Pavri
Gerald D. Moore
GE Energy Services
Atlanta, GA
GER-4211
g

7/28/2019 Gas Turbine Emissions and Control
http://slidepdf.com/reader/full/gas-turbine-emissions-and-control 2/36
7/28/2019 Gas Turbine Emissions and Control
http://slidepdf.com/reader/full/gas-turbine-emissions-and-control 3/36
Contents
Introduction . . . . . . . . . . . . . . . . . . . . . . . . . . . . . . . . . . . . . . . . . . . . . . . . . . . . . . . . . . . . . . . . . . 1
Emissions Characteristics of Conventional Combustion Systems . . . . . . . . . . . . . . . . . . . . . 1Nitrogen Oxides . . . . . . . . . . . . . . . . . . . . . . . . . . . . . . . . . . . . . . . . . . . . . . . . . . . . . . . . . . . . 2
Carbon Monoxide . . . . . . . . . . . . . . . . . . . . . . . . . . . . . . . . . . . . . . . . . . . . . . . . . . . . . . . . . . . 3
Unburned Hydrocarbons . . . . . . . . . . . . . . . . . . . . . . . . . . . . . . . . . . . . . . . . . . . . . . . . . . . . . . 5
Sulfur Oxides . . . . . . . . . . . . . . . . . . . . . . . . . . . . . . . . . . . . . . . . . . . . . . . . . . . . . . . . . . . . . . 6
Particulates . . . . . . . . . . . . . . . . . . . . . . . . . . . . . . . . . . . . . . . . . . . . . . . . . . . . . . . . . . . . . . . 7
Smoke . . . . . . . . . . . . . . . . . . . . . . . . . . . . . . . . . . . . . . . . . . . . . . . . . . . . . . . . . . . . . . . . . . . 8
Dry Emissions Estimates at Base Load . . . . . . . . . . . . . . . . . . . . . . . . . . . . . . . . . . . . . . . . . . . 8
Dry Emissions Estimates at Part Load . . . . . . . . . . . . . . . . . . . . . . . . . . . . . . . . . . . . . . . . . . . . 8
Simple-Cycle Turbines . . . . . . . . . . . . . . . . . . . . . . . . . . . . . . . . . . . . . . . . . . . . . . . . . . . . . . . 8 Exhaust Heat Recovery Turbines. . . . . . . . . . . . . . . . . . . . . . . . . . . . . . . . . . . . . . . . . . . . . . . 12
Other NO x Influences . . . . . . . . . . . . . . . . . . . . . . . . . . . . . . . . . . . . . . . . . . . . . . . . . . . . . . . . . 13
Emission Reduction Techniques . . . . . . . . . . . . . . . . . . . . . . . . . . . . . . . . . . . . . . . . . . . . . . . . 16
Nitrogen Oxides Abatement . . . . . . . . . . . . . . . . . . . . . . . . . . . . . . . . . . . . . . . . . . . . . . . . . . 16
Lean Head End (LHE) Combustion Liners. . . . . . . . . . . . . . . . . . . . . . . . . . . . . . . . . . . . . . . . . 17
Water/Steam Injection . . . . . . . . . . . . . . . . . . . . . . . . . . . . . . . . . . . . . . . . . . . . . . . . . . . . . . 18
Carbon Monoxide Control . . . . . . . . . . . . . . . . . . . . . . . . . . . . . . . . . . . . . . . . . . . . . . . . . . . . 22
Unburned Hydrocarbons Control . . . . . . . . . . . . . . . . . . . . . . . . . . . . . . . . . . . . . . . . . . . . . . . 24
Particulate and Smoke Reduction . . . . . . . . . . . . . . . . . . . . . . . . . . . . . . . . . . . . . . . . . . . . . . 24
Water/Steam Injection Hardware . . . . . . . . . . . . . . . . . . . . . . . . . . . . . . . . . . . . . . . . . . . . . . . 25
Minimum NO x Levels . . . . . . . . . . . . . . . . . . . . . . . . . . . . . . . . . . . . . . . . . . . . . . . . . . . . . . . . . 27
Maintenance Effects . . . . . . . . . . . . . . . . . . . . . . . . . . . . . . . . . . . . . . . . . . . . . . . . . . . . . . . . . . 29
Performance Effects . . . . . . . . . . . . . . . . . . . . . . . . . . . . . . . . . . . . . . . . . . . . . . . . . . . . . . . . . . 29
Summary . . . . . . . . . . . . . . . . . . . . . . . . . . . . . . . . . . . . . . . . . . . . . . . . . . . . . . . . . . . . . . . . . . . . 30
List of Figures . . . . . . . . . . . . . . . . . . . . . . . . . . . . . . . . . . . . . . . . . . . . . . . . . . . . . . . . . . . . . . . 31
List of Tables . . . . . . . . . . . . . . . . . . . . . . . . . . . . . . . . . . . . . . . . . . . . . . . . . . . . . . . . . . . . . . . . 32
Gas Turbine Emissions and Control
GE Power Systems s GER-4211 s (03/01) i

7/28/2019 Gas Turbine Emissions and Control
http://slidepdf.com/reader/full/gas-turbine-emissions-and-control 4/36
Gas Turbine Emissions and Control
GE Power Systems s GER-4211 s (03/01) ii

7/28/2019 Gas Turbine Emissions and Control
http://slidepdf.com/reader/full/gas-turbine-emissions-and-control 5/36
Introduction
Worldwide interest in gas turbine emissions and
the enactment of Federal and State regulations
in the United States have resulted in numerousrequests for information on gas turbine exhaust
emission estimates and the effect of exhaust
emission control methods on gas turbine per-
formance. This paper provides nominal esti-
mates of existing gas turbine exhaust emissions
as well as emissions estimates for numerous gas
turbine modifications and uprates. (For site-
specific emissions values, customers should con-
tact GE.) Additionally, the effects of emission
control methods are provided for gas turbine
cycle performance and recommended turbine
inspection intervals. Emission control methods
vary with both internal turbine and external
exhaust system emission control. Only the inter-
nal gas turbine emission control methods —
lean head end liners and water/steam injection
— will be covered in this paper.
In the early 1970s when emission controls were
originally introduced, the primary regulated
gas turbine emission was NOx. For the relative-
ly low levels of NOx reduction required in the1970s, it was found that injection of water or
steam into the combustion zone would produce
the desired NOx level reduction with minimal
detrimental impact to the gas turbine cycle per-
formance or parts lives. Additionally, at the
lower NOx reductions the other exhaust emis-
sions generally were not adversely affected.
Therefore GE has supplied NOx water and
steam injection systems for this application
since 1973.
With the greater NOx reduction requirements
imposed during the 1980s, further reductions
in NOx by increased water or steam injection
began to cause detrimental effects to the gas
turbine cycle performance, parts lives and
inspection criteria. Also, other exhaust emis-
sions began to rise to measurable levels of con-
cern. Based on these factors, alternative meth-
ods of emission controls have been developed:
sInternal gas turbine—Multiple nozzle quiet combustors
introduced in 1988
—Dry Low NOx combustors
introduced in 1990
s External
—Exhaust catalysts
This paper will summarize the current estimat-
ed emissions for existing gas turbines and the
effects of available emission control techniques
(liner design and water/steam injection) on gas
turbine emissions, cycle performance, and
maintenance inspection intervals. The latest
technology includes Dry Low NOx and catalytic
combustion. These topics are covered in other
GERs.
Emissions Characteristics of
Conventional Combustion Systems
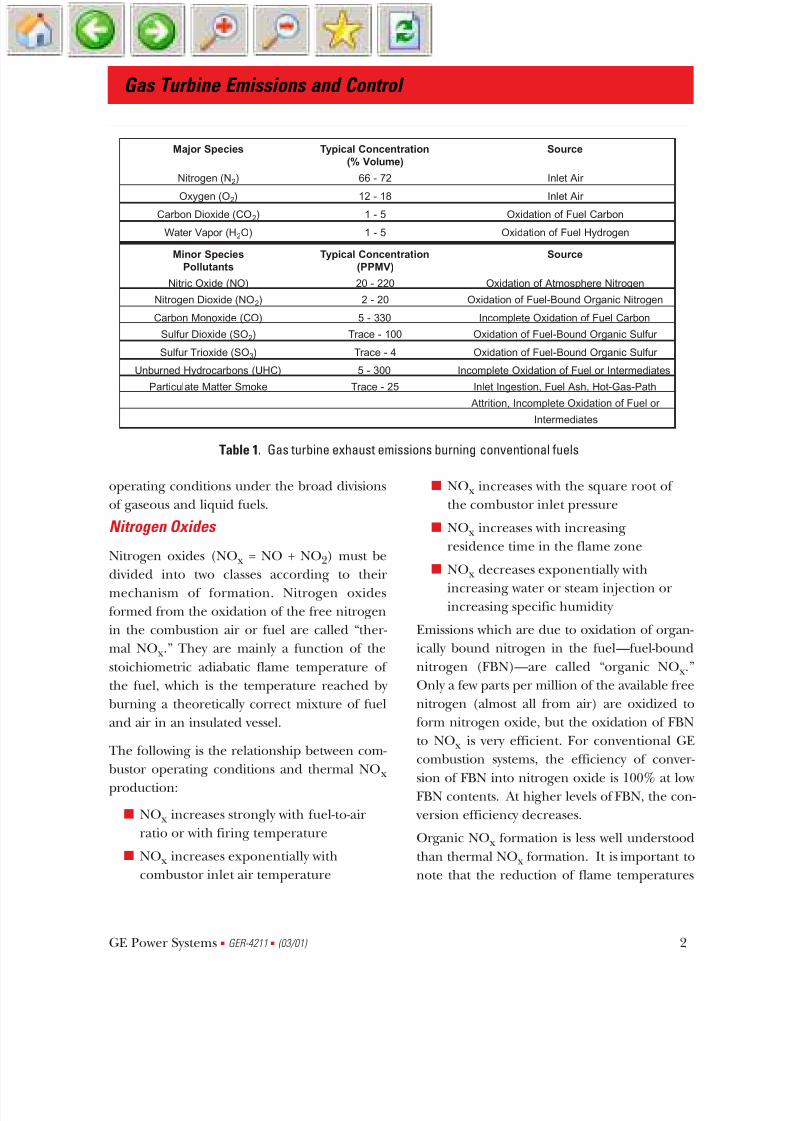
Typical exhaust emissions from a stationary gas
turbine are listed in Table 1. There are two dis-
tinct categories. The major species (CO2, N2,
H2O, and O2) are present in percent concen-
trations. The minor species (or pollutants)
such as CO, UHC, NOx, SOx, and particulates
are present in parts per million concentrations.
In general, given the fuel composition and
machine operating conditions, the major
species compositions can be calculated. The
minor species, with the exception of total sulfur
oxides, cannot. Characterization of the pollu-tants requires careful measurement and semi-
theoretical analysis.
The pollutants shown in Table 1 are a function
of gas turbine operating conditions and fuel
composition. In the following sections, each
pollutant will be considered as a function of
Gas Turbine Emissions and Control
GE Power Systems s GER-4211 s (03/01) 1
7/28/2019 Gas Turbine Emissions and Control
http://slidepdf.com/reader/full/gas-turbine-emissions-and-control 6/36
operating conditions under the broad divisions
of gaseous and liquid fuels.
Nitrogen Oxides
Nitrogen oxides (NOx = NO + NO2) must be
divided into two classes according to their
mechanism of formation. Nitrogen oxidesformed from the oxidation of the free nitrogen
in the combustion air or fuel are called “ther-
mal NOx.” They are mainly a function of the
stoichiometric adiabatic flame temperature of
the fuel, which is the temperature reached by
burning a theoretically correct mixture of fuel
and air in an insulated vessel.
The following is the relationship between com-
bustor operating conditions and thermal NOx
production:
s NOx increases strongly with fuel-to-air
ratio or with firing temperature
s NOx increases exponentially with
combustor inlet air temperature
s NOx increases with the square root of
the combustor inlet pressure
s NOx increases with increasing
residence time in the flame zone
s NOx decreases exponentially with
increasing water or steam injection orincreasing specific humidity
Emissions which are due to oxidation of organ-
ically bound nitrogen in the fuel—fuel-bound
nitrogen (FBN)—are called “organic NOx.”
Only a few parts per million of the available free
nitrogen (almost all from air) are oxidized to
form nitrogen oxide, but the oxidation of FBN
to NOx is very efficient. For conventional GE
combustion systems, the efficiency of conver-
sion of FBN into nitrogen oxide is 100% at low
FBN contents. At higher levels of FBN, the con-
version efficiency decreases.
Organic NOx formation is less well understood
than thermal NOx formation. It is important to
note that the reduction of flame temperatures
Gas Turbine Emissions and Control
GE Power Systems s GER-4211 s (03/01) 2
Major Species Typical Concentration Source
(% Volume)
Nitrogen (N2) 66 - 72 Inlet Air
Oxygen (O2) 12 - 18 Inlet Air
Carbon Dioxide (CO2) 1 - 5 Oxidation of Fuel Carbon
Water Vapor (H2O) 1 - 5 Oxidation of Fuel Hydrogen
Minor Species Typical Concentration Source
Pollutants (PPMV)
Nitric Oxide (NO) 20 - 220 Oxidation of Atmosphere Nitrogen
Nitrogen Dioxide (NO2) 2 - 20 Oxidation of Fuel-Bound Organic Nitrogen
Carbon Monoxide (CO) 5 - 330 Incomplete Oxidation of Fuel Carbon
Sulfur Dioxide (SO2) Trace - 100 Oxidation of Fuel-Bound Organic Sulfur
Sulfur Trioxide (SO3) Trace - 4 Oxidation of Fuel-Bound Organic Sulfur
Unburned Hydrocarbons (UHC) 5 - 300 Incomplete Oxidation of Fuel or Intermediates
Particulate Matter Smoke Trace - 25 Inlet Ingestion, Fuel Ash, Hot-Gas-Path
Attrition, Incomplete Oxidation of Fuel or
Intermediates
Table 1. Gas turbine exhaust emissions burning conventional fuels
7/28/2019 Gas Turbine Emissions and Control
http://slidepdf.com/reader/full/gas-turbine-emissions-and-control 7/36
to abate thermal NOx has little effect on organ-
ic NOx. For liquid fuels, water and steam injec-
tion actually increases organic NOx yields.
Organic NOx
formation is also affected by tur-
bine firing temperature. The contribution of
organic NOx is important only for fuels that
contain significant amounts of FBN such as
crude or residual oils. Emissions from these
fuels are handled on a case-by-case basis.
Gaseous fuels are generally classified according
to their volumetric heating value. This value is
useful in computing flow rates needed for a
given heat input, as well as sizing fuel nozzles,
combustion chambers, and the like. However,
the stoichiometric adiabatic flame temperature
is a more important parameter for characteriz-
ing NOx emission. Table 2 shows relative ther-
mal NOx production for the same combustor
burning different types of fuel. This table shows
the NOx relative to the methane NOx based on
adiabatic stoichiometric flame temperature.
The gas turbine is controlled to approximate
constant firing temperature and the products of
combustion for different fuels affect the report-
ed NOx correction factors. Therefore, Table 2 also shows columns for relative NOx values cal-
culated for different fuels for the same combus-
tor and constant firing temperature relative to
the NOx for methane.
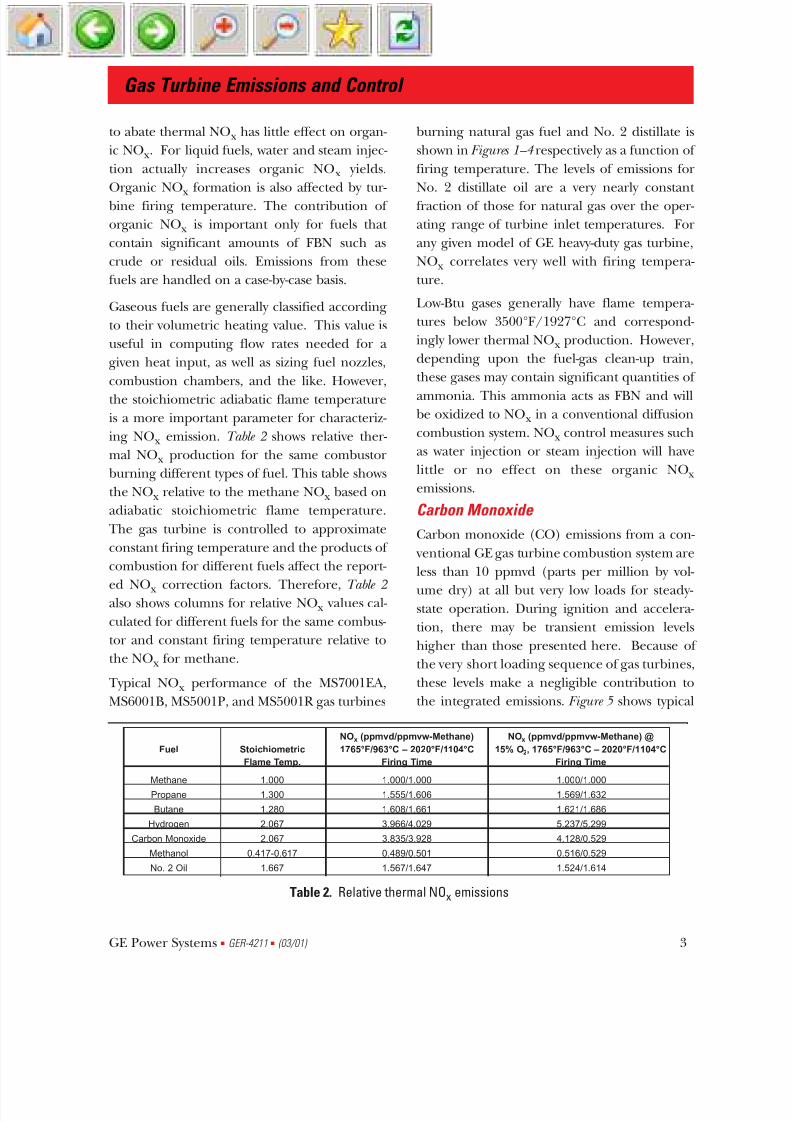
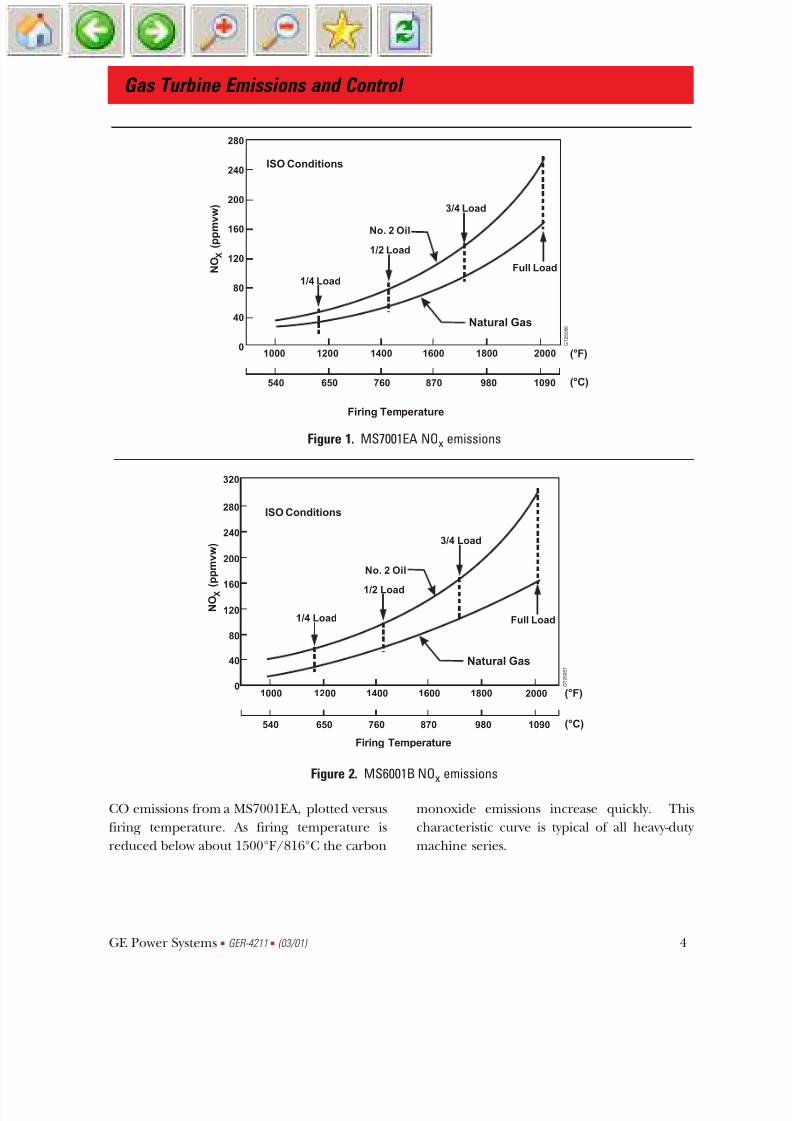
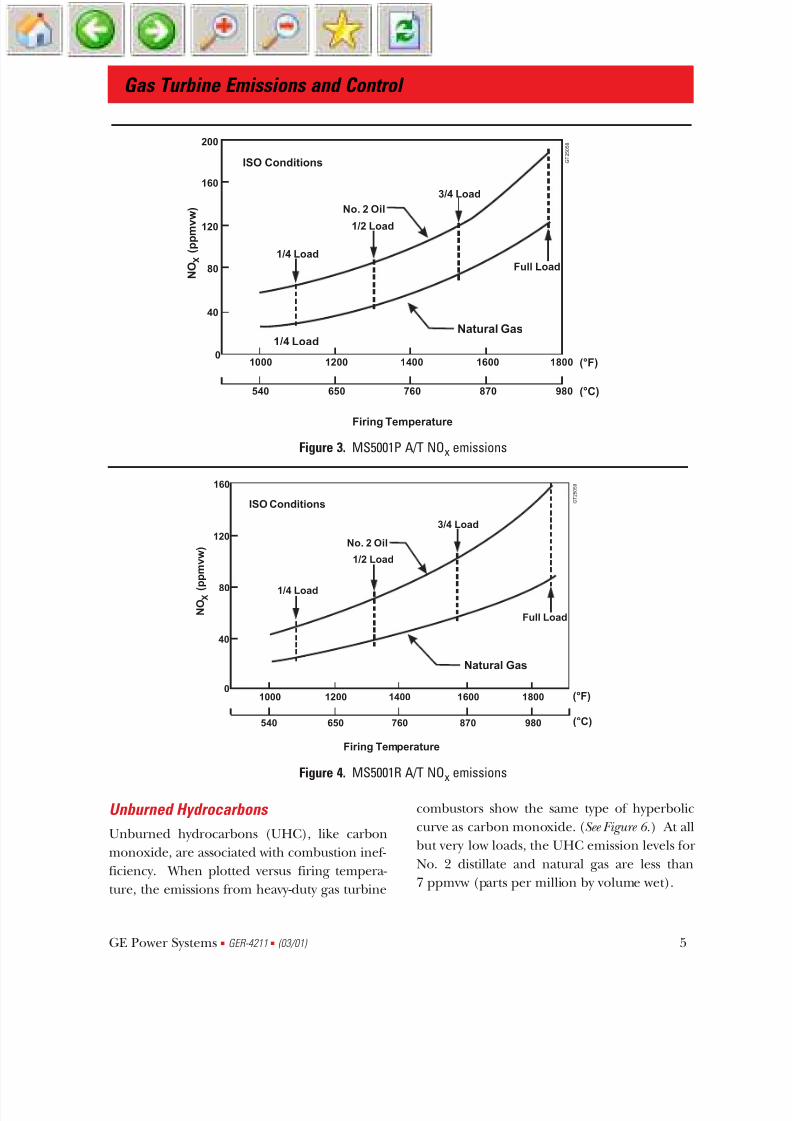
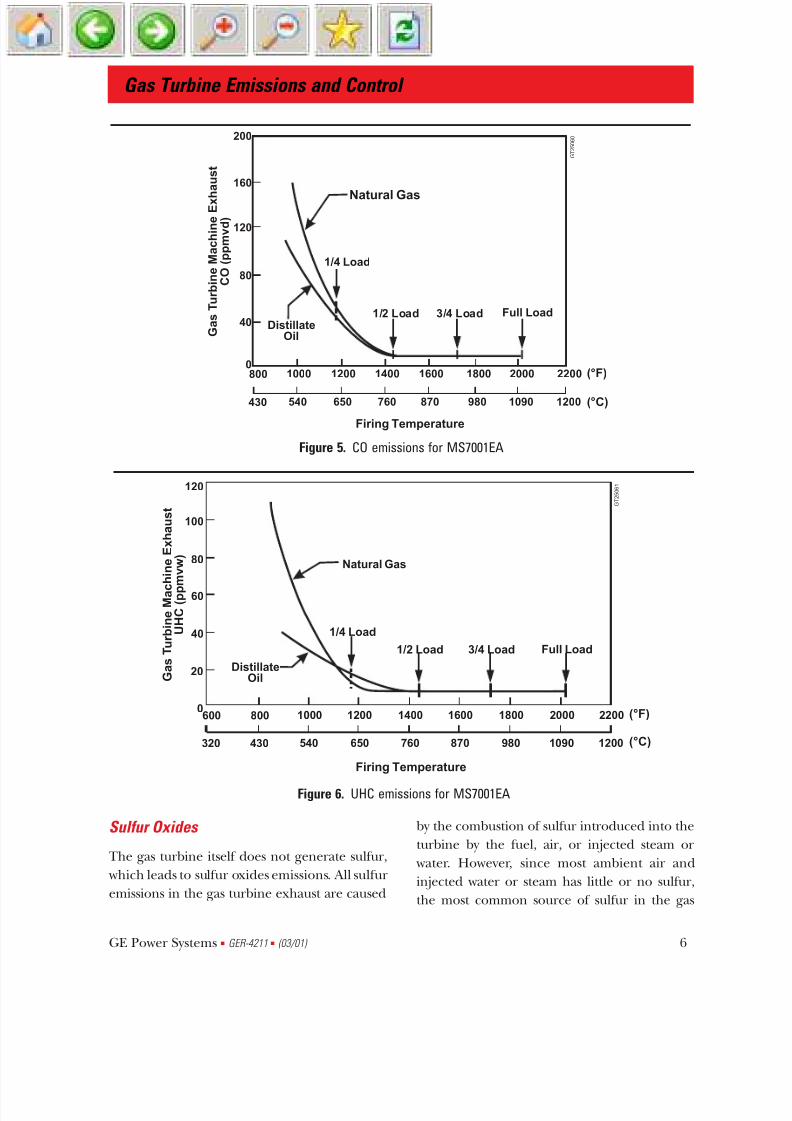
Typical NOx performance of the MS7001EA,
MS6001B, MS5001P, and MS5001R gas turbines
burning natural gas fuel and No. 2 distillate is
shown in Figures 1–4 respectively as a function of
firing temperature. The levels of emissions for
No. 2 distillate oil are a very nearly constant
fraction of those for natural gas over the oper-
ating range of turbine inlet temperatures. For
any given model of GE heavy-duty gas turbine,
NOx correlates very well with firing tempera-
ture.
Low-Btu gases generally have flame tempera-
tures below 3500°F/1927°C and correspond-
ingly lower thermal NOx production. However,
depending upon the fuel-gas clean-up train,
these gases may contain significant quantities of
ammonia. This ammonia acts as FBN and willbe oxidized to NOx in a conventional diffusion
combustion system. NOx control measures such
as water injection or steam injection will have
little or no effect on these organic NOx
emissions.
Carbon Monoxide
Carbon monoxide (CO) emissions from a con-
ventional GE gas turbine combustion system are
less than 10 ppmvd (parts per million by vol-
ume dry) at all but very low loads for steady-state operation. During ignition and accelera-
tion, there may be transient emission levels
higher than those presented here. Because of
the very short loading sequence of gas turbines,
these levels make a negligible contribution to
the integrated emissions. Figure 5 shows typical
Gas Turbine Emissions and Control
GE Power Systems s GER-4211 s (03/01) 3
NOx (ppmvd/ppmvw-Methane) NOx (ppmvd/ppmvw-Methane) @
Fuel Stoichiometric 1765°F/963°C – 2020°F/1104°C 15% O2, 1765°F/963°C – 2020°F/1104°C
Flame Temp. Firing Time Firing Time
Methane 1.000 1.000/1.000 1.000/1.000
Propane 1.300 1.555/1.606 1.569/1.632
Butane 1.280 1.608/1.661 1.621/1.686
Hydrogen 2.067 3.966/4.029 5.237/5.299
Carbon Monoxide 2.067 3.835/3.928 4.128/0.529
Methanol 0.417-0.617 0.489/0.501 0.516/0.529
No. 2 Oil 1.667 1.567/1.647 1.524/1.614
Table 2. Relative thermal NOx emissions
7/28/2019 Gas Turbine Emissions and Control
http://slidepdf.com/reader/full/gas-turbine-emissions-and-control 8/36
CO emissions from a MS7001EA, plotted versus
firing temperature. As firing temperature is
reduced below about 1500°F/816°C the carbon
monoxide emissions increase quickly. This
characteristic curve is typical of all heavy-duty
machine series.
Gas Turbine Emissions and Control
GE Power Systems s GER-4211 s (03/01) 4
1/4 Load
1/2 Load
Full Load
3/4 Load
No. 2 Oil
Natural Gas
280
240
200
160
120
80
40
0
ISO Conditions
Firing Temperature
N O
( p p m v w )
X
1000 1200 1400 1600 1800 2000 G T 2 5
0 5
6
540 650 760 870 980 1090
(°F)
(°C)
Figure 1. MS7001EA NOx emissions
ISO Conditions
Firing Temperature
N O
( p p m v w
)
X
1/4 Load
1/2 Load
Full Load
3/4 Load
No. 2 Oil
Natural Gas
320
280
240
200
160
120
80
40
01000 1200 1400 1600 1800 2000
G T 2 5
0 5 7
540 650 760 870 980 1090
(°F)
(°C)
Figure 2. MS6001B NOx emissions
7/28/2019 Gas Turbine Emissions and Control
http://slidepdf.com/reader/full/gas-turbine-emissions-and-control 9/36
Unburned Hydrocarbons
Unburned hydrocarbons (UHC), like carbon
monoxide, are associated with combustion inef-
ficiency. When plotted versus firing tempera-
ture, the emissions from heavy-duty gas turbine
combustors show the same type of hyperbolic
curve as carbon monoxide. (See Figure 6.) At all
but very low loads, the UHC emission levels for
No. 2 distillate and natural gas are less than
7 ppmvw (parts per million by volume wet).
Gas Turbine Emissions and Control
GE Power Systems s GER-4211 s (03/01) 5
Firing Temperature
ISO Conditions
1/4 Load
1/4 Load
1/2 Load
Full Load
3/4 LoadNo. 2 Oil
Natural Gas
N O
( p p m v w
)
X
200
160
120
80
40
01000 1200 1400 1600 1800
G T 2 5 0 5 8
540 650 760 870 980
(°F)
(°C)
Figure 3. MS5001P A/T NOx emissions
G T 2 5
0 5
9
ISO Conditions
Firing Temperature
N O ( p p m v w
)
X 1/4 Load
1/2 Load
Full Load
3/4 Load
No. 2 Oil
Natural Gas
160
120
80
40
01000 1200 1400 1600 1800
540 650 760 870 980
(°F)
(°C)
Figure 4. MS5001R A/T NOx emissions
7/28/2019 Gas Turbine Emissions and Control
http://slidepdf.com/reader/full/gas-turbine-emissions-and-control 10/36
Sulfur Oxides
The gas turbine itself does not generate sulfur,
which leads to sulfur oxides emissions. All sulfur
emissions in the gas turbine exhaust are caused
by the combustion of sulfur introduced into the
turbine by the fuel, air, or injected steam or
water. However, since most ambient air and
injected water or steam has little or no sulfur,
the most common source of sulfur in the gas
Gas Turbine Emissions and Control
GE Power Systems s GER-4211 s (03/01) 6
G T 2 5 0 6 0
G a s
T u r b i n e
M a c h i n e
E x h
a u s t
C O ( p p m v d )
Firing Temperature
1/4 Load
1/2 Load 3/4 Load Full LoadDistillate
Oil
Natural Gas
200
160
120
80
40
0800 1000 1200 1400 1600 1800 2000 2200
430 540 650 760 870 980 1090 1200
(°F)
(°C)
Figure 5. CO emissions for MS7001EA
0
Firing Temperature
G a s
T u r b
i n e
M a c
h i n e
E x
h a u s
t
U H C ( p p
m v w
)
1/2 Load
1/4 Load
Full Load3/4 Load
Natural Gas
DistillateOil
120
100
80
40
60
20
600 800 1000 1200 1400 1600 1800 2000 2200
G T 2 5 0 6 1
320 430 540 650 760 870 980 1090 1200
(°F)
(°C)
Figure 6. UHC emissions for MS7001EA
7/28/2019 Gas Turbine Emissions and Control
http://slidepdf.com/reader/full/gas-turbine-emissions-and-control 11/36
turbine is through the fuel. Due to the latest hot
gas path coatings, the gas turbine will readily
burn sulfur contained in the fuel with little or
no adverse effects as long as there are no alkali
metals present in the hot gas.
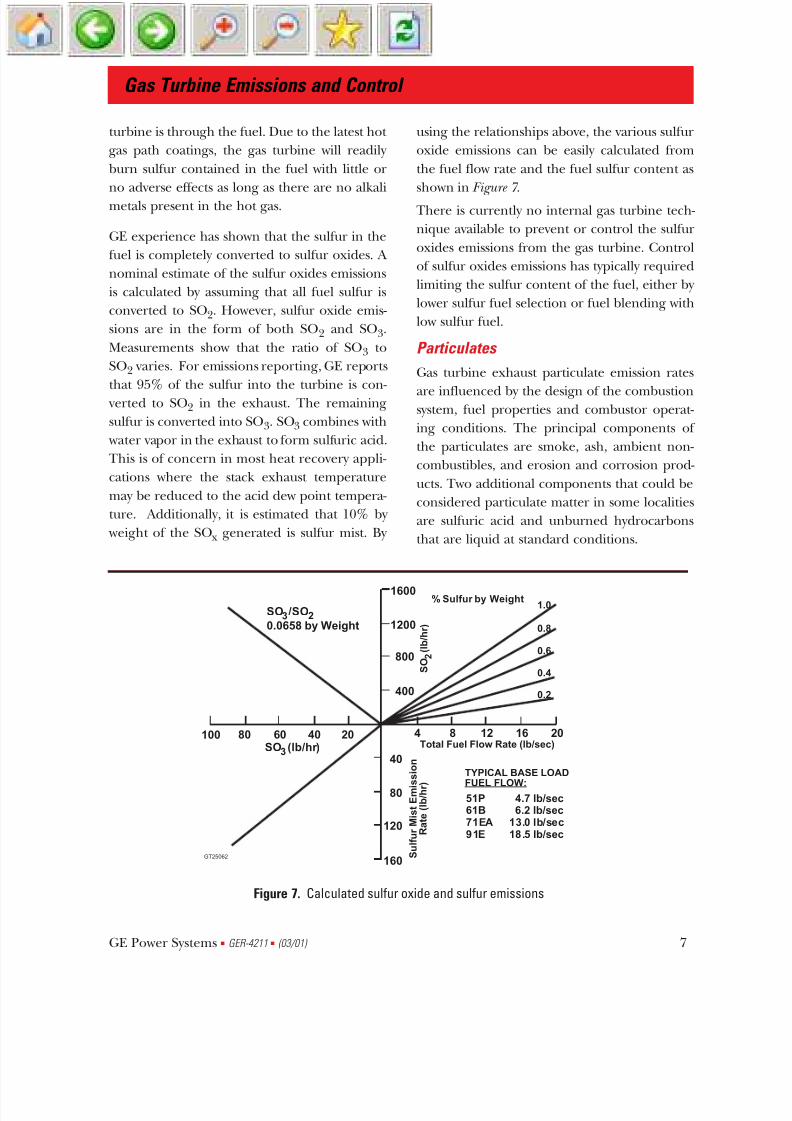
GE experience has shown that the sulfur in the
fuel is completely converted to sulfur oxides. A
nominal estimate of the sulfur oxides emissions
is calculated by assuming that all fuel sulfur is
converted to SO2. However, sulfur oxide emis-
sions are in the form of both SO2 and SO3.
Measurements show that the ratio of SO3 to
SO2 varies. For emissions reporting, GE reports
that 95% of the sulfur into the turbine is con-
verted to SO2 in the exhaust. The remaining
sulfur is converted into SO3. SO3 combines with
water vapor in the exhaust to form sulfuric acid.
This is of concern in most heat recovery appli-
cations where the stack exhaust temperature
may be reduced to the acid dew point tempera-
ture. Additionally, it is estimated that 10% by
weight of the SOx generated is sulfur mist. By
using the relationships above, the various sulfur
oxide emissions can be easily calculated from
the fuel flow rate and the fuel sulfur content as
shown in Figure 7 .
There is currently no internal gas turbine tech-
nique available to prevent or control the sulfur
oxides emissions from the gas turbine. Control
of sulfur oxides emissions has typically required
limiting the sulfur content of the fuel, either by
lower sulfur fuel selection or fuel blending with
low sulfur fuel.
Particulates
Gas turbine exhaust particulate emission rates
are influenced by the design of the combustionsystem, fuel properties and combustor operat-
ing conditions. The principal components of
the particulates are smoke, ash, ambient non-
combustibles, and erosion and corrosion prod-
ucts. Two additional components that could be
considered particulate matter in some localities
are sulfuric acid and unburned hydrocarbons
that are liquid at standard conditions.
Gas Turbine Emissions and Control
GE Power Systems s GER-4211 s (03/01) 7
TYPICAL BASE LOAD
FUEL FLOW:
100 80 60 40 20 4
1.0
0.8
0.6
0.4
0.2
8 12 16 20
1600
1200
800
400
40
80
120
160
51P 4.7 lb/sec61B 6.2 lb/sec71EA 13.0 lb/sec91E 18.5 lb/sec
SO (lb/hr)3
SO /SO3 20.0658 by Weight
Total Fuel Flow Rate (lb/sec)
% Sulfur by Weight
S u
l f u r
M i s t
E m i s s
i o n
R a
t e ( l b / h r )
S O
( l b / h r )
2
GT25062
Figure 7. Calculated sulfur oxide and sulfur emissions
7/28/2019 Gas Turbine Emissions and Control
http://slidepdf.com/reader/full/gas-turbine-emissions-and-control 12/36
Smoke
Smoke is the visible portion of filterable partic-
ulate material. The GE combustor design cou-
pled with air atomization of liquid fuels hasresulted in a nonvisible plume over the gas tur-
bine load range for a wide variety of fuels. The
GE smoke-measuring unit is the Von Brand
Reflective Smoke Number (GEVBRSN). If this
number is greater than 93 to 95 for the
MS7001E, then the plume will not be visible.
For liquid fuels, the GEVBRSN is a function of
the hydrogen content of the fuel. For natural
gas fuel, the smoke number is essentially 99 to
100 over the load range and visible smoke is not
present.
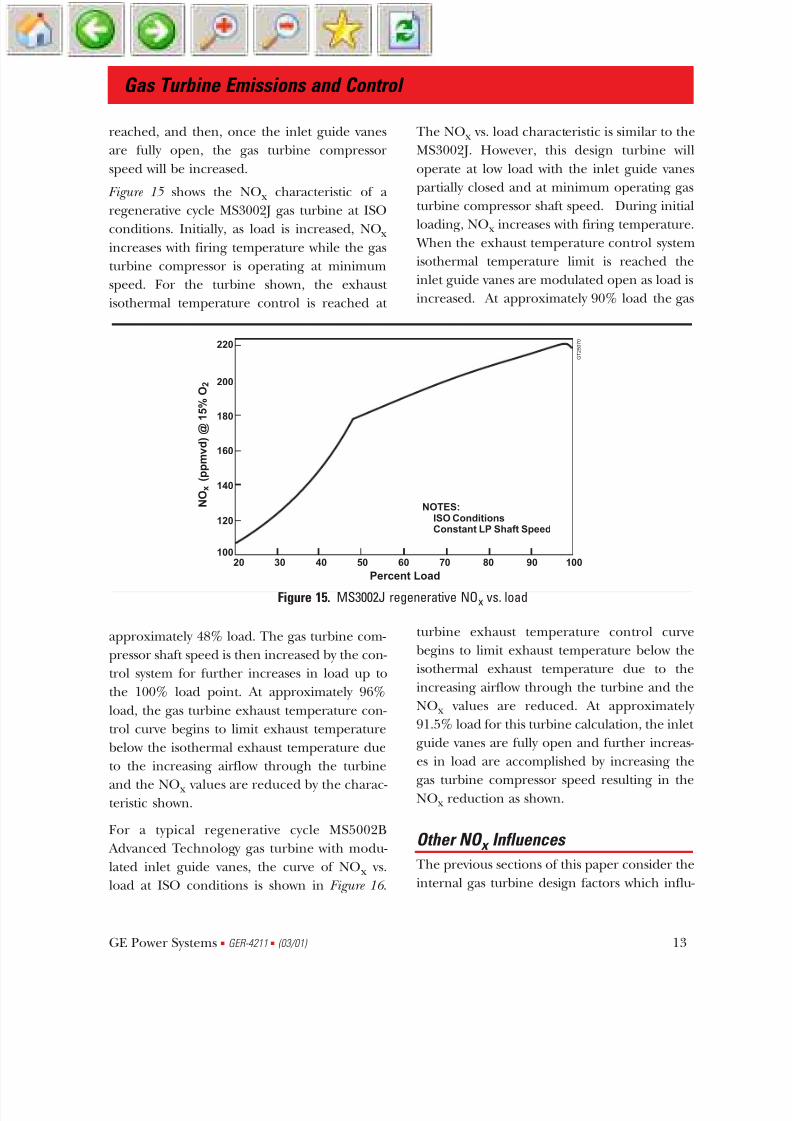
Dry Emissions Estimates at Base Load
The ISO non-abated full load emissions esti-
mates for the various GE heavy-duty gas turbine
models are provided in Table 3 . The natural gas
and #2 distillate fuel emission estimates shown
are for thermal NOx, CO, UHC, VOC, and par-
ticulates. For reporting purposes, all particu-
lates are also reported as PM-10. Therefore PM-
10 is not shown in the tables. The nominal full
rated firing temperature for each gas turbine
model is also shown in Table 3 .
As can be easily seen in the table, at base load
without NOx abatement, the emissions of CO,
UHC, VOC, and particulates are quite low. The
estimated values of NOx vary between gas tur-
bine designs and generally increase with the
frame size firing temperature.
Dry Emissions Estimates at Part Load
Simple-Cycle Turbines
At turbine outputs below base load the emis-
sions change from the values given in Table 3 .
These changes are affected by the turbine con-
figuration and application and in some cases by
the turbine controls.
Single-shaft gas turbines with non-modulating
inlet guide vanes operating at constant shaft
speed have part load emissions characteristics
which are easily estimated. For these turbines
Gas Turbine Emissions and Control
GE Power Systems s GER-4211 s (03/01) 8
MS5001P 1730/943 128 195 25 42
MS5001P-N/T 1765/963 142 211 25 42
MS6001B 2020/1104 161 279 25 65/42
MS7001B 1840/1004 109 165 25 42
MS7001B Option 3 1965/1074 124 191 25 42
MS7001B Option 4 2020/1104 132 205 25 42
MS7001EA 2020/1104 160 245 25 42
MS9001B 1940/1060 109 165 42 65
MS9001B Option 3 1965/1074 124 191 42 65
MS9001B Option 4 2020/1104 132 205 42 65
MS9001E 2020/1104 157 235 42 65
MS9001E 2055/1124 162 241 42 65
6FA 2350/1288
7FA 2400/1316
7FA 2420/1327
9FA 2350/1288
MS3002F 1575/1625/857/885 115 201 42 50
MS3002J 1730/943 128 217 42 50
MS3002J-N/T 1770/968 140 236 42 50
MS5002 1700/927 125 220 42 50
MS5002B-N/T 1770/966 137 255 42 50
* S.C. = Simple Cycle and R.C. = Regenerative Cycle
** Two-Shaft NOx Levels Are All on Gas Fuel
Single Shaft UnitsModel
Firing Temp.F/C
Gas(FG1A/FG1B)
Gas(FG1C/FG1F)Gas
Dry (Non-Abated) H2O/Steam Inj.
Dist.
Two Shaft Units*
Model
Firing Temp.
F/C S.C. S.C.S.C.
Dry (Non-Abated) H2O/Steam Inj.
R.C.**
G T 2 3 2 8 9 E
Table 3. NOx emission levels @ 15% O2 (ppmvd)

7/28/2019 Gas Turbine Emissions and Control
http://slidepdf.com/reader/full/gas-turbine-emissions-and-control 13/36
GE Power Systems s GER-4211 s (03/01) 9
Gas Turbine Emissions and Control
the NOx emissions vary exponentially with fir-
ing temperature as shown previously in Figures
1– 4 . The load points for each turbine are also
marked on these figures. Due to the conver-
sions used in the various NOx reporting meth-
ods, the information in Figures 1– 4 has been
redrawn in Figures 8 – 11. This information shows
the estimated ISO NOx emissions on a ppmvd
@ 15% O2, ppmvw, and lb/hour basis for
MS7001EA, MS6001B, MS5001P and MS5001R.
In these figures, the nominal peak load firing
temperature point is also given. It should be
noted that in some cases the NOx ppmvd@15%
O2 reporting method can cause number values
to increase as load is reduced (e.g., see theMS5001P A/T in Figure 10 .) Since the GE
MS9001E gas turbine is a scaled version of the
MS7001E gas turbine, the MS7001E gas turbine
figures can be used as an estimate of MS9001E
gas turbine part load emissions characteristics.
Many gas turbines have variable inlet guide
vanes that are modulated closed at part load
conditions in order to maintain higher exhaust
temperatures for waste heat recovery equip-
ment located in the gas turbine exhaust. As
shown in Figure 12 , closing the inlet guide vanes
has a slight effect on the gas turbine NOx
emis-
sions. Figure 12 shows the effect on NOx ppmvd
@ 15% O2 and Figure 13 shows the effect on
NOx lb/hr. The figures show both MS5001P
and MS7001E characteristics. They also show
normalized NOx (% of base load value) vs. %
base load. Curves are shown for load reductions
by either closing the inlet guide vanes while
maintaining exhaust temperature control and
for load reductions by reducing firing tempera-
ture while keeping the inlet guide vanes fully
open.Mechanical drive gas turbines typically vary the
output load shaft speed in order to adjust the
turbine output to match the load equipment
characteristic. Single-shaft gas turbines operat-
ing on exhaust temperature control have a max-
imum output NOx emissions characteristic vs.
turbine shaft speed, as shown in Figure 14 for an
MS5001R Advanced Technology uprated tur-
Firing Temperature
Peak Load
Full Load
1/4 Load1/2 Load
3/4 Load
600
500
400
300
200
100 100
400
600
800
1000
1200
800 1000 1200 1400 1600 1800 2000 22000 0
1. NO ppmvd @ 15% O - Chaindashed Curve
2. NO lb/hr - Dashed Curve
3. NO ppmvw - Solid Curve
x 2
x
x
NOTES:D - No. 2 DistillateG - Methane Natural GasISO Conditions
1
2
3
D
G
DGDG
N O
( p p m v
)
x
N O
( l b / h r )
x
430 540 650 760 870 980 1090 1200
(°F)
(°C)
GT25063
Figure 8. MS7001EA NOx emissions

7/28/2019 Gas Turbine Emissions and Control
http://slidepdf.com/reader/full/gas-turbine-emissions-and-control 14/36
GE Power Systems s GER-4211 s (03/01) 10
Gas Turbine Emissions and Control
bine. The characteristic shown is primarily due
to the gas turbine exhaust temperature control
system and the turbine thermodynamics. As
seen in Figure 14 , as the turbine output shaft
speed is reduced below 100%, NOx emissions
decrease directly with turbine shaft speed. As
the speed decreases, the exhaust temperature
increases till the exhaust component tempera-
Firing Temperature
Peak Load
Full Load
1/4 Load1/2 Load
3/4 Load
400
350
300
250
200
150
100
50 100
200
300
400
500
600
700
800
800 1000 1200 1400 1600 1800 2000 22000 0
1. NO ppmvd @ 15% O - Chaindashed Curve
2. NO lb/hr - Dashed Curve
3. NO ppmvw - Solid Curve
x 2
x
x
NOTES:D - No. 2 Distillate
G - Methane Natural GasISO Conditions
D
G
G
D
N O
( p p m v
)
x
N O
( l b / h r )
x
430 540 650 760 870 980 1090 1200
(°F)
(°C)
GT25064
Figure 9. MS6001B NOx emissions
8000
D
G
DD
GG
N O ( l b / h r )
X
Firing Temperature
N O ( p
p m v
)
X
3/4 Load
1/2 Load
1/4 Load
Peak Load
Full Load
250
200
500
400
300
200
100
01000 1200 1400 1600 1800
150
100
50
1. NO ppmvd @ 15% O - Chaindashed Curve
2. NO lb/hr - Dashed Curve
3. NO ppmvw - Solid Curve
x 2
x
x
NOTES:D - No. 2 Distillate
G - Methane Natural GasISO Conditions
GT25065
430 540 650 760 870 980
(°F)
(°C)
Figure 10. MS5001P A/T NOx emissions
7/28/2019 Gas Turbine Emissions and Control
http://slidepdf.com/reader/full/gas-turbine-emissions-and-control 15/36
GE Power Systems s GER-4211 s (03/01) 11
Gas Turbine Emissions and Control
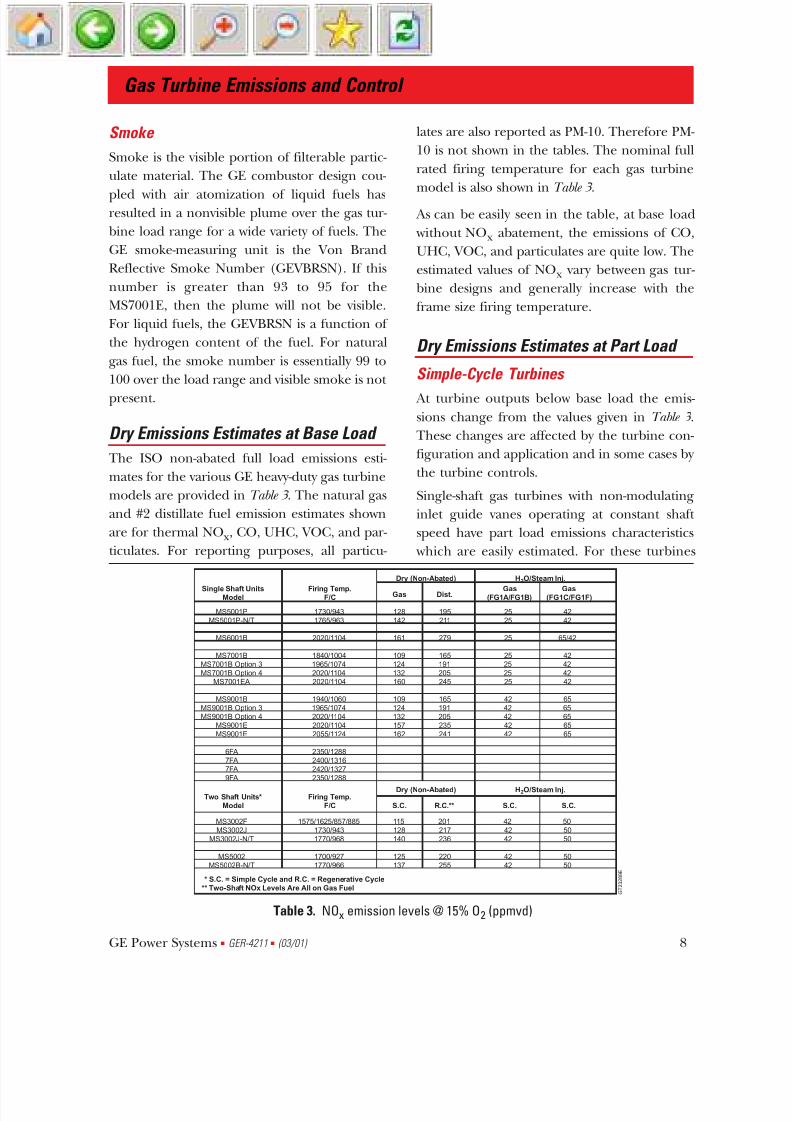
ture limit is reached. Once the exhaust isother-mal limit is reached, the variation of NOx emis-
sions with speed will become greater. In Figure 16
this exhaust isothermal temperature limit is
reached at approximately 84% speed. Two-shaft
gas turbines also vary the output turbine shaft
speed with load conditions. However the gas tur-bine compressor shaft and combustor operating
conditions are controlled independent of the
output shaft speed. On a two-shaft gas turbine, if
the gas turbine compressor shaft speed is held
constant by the control system while on exhaust
N O
( l b / h r )
X
Firing Temperature
N O
( p p m v
)
X
3/4 Load1/2 Load
1/4 LoadD
G
D
DGG
Peak Load
Full Load
200
160
400
360
320
280
240
200
160
120
80
40
0800 1000 1200 1400 1600 1800
120
80
40
0
1. NO ppmvd @ 15% O - Chaindashed Curve
2. NO lb/hr - Dashed Curve
3. NO ppmvw - Solid Curve
x 2
x
x
NOTES:D - No. 2 DistillateG - Methane Natural Gas
ISO Conditions
GT25066
430 540 650 760 870 980
(°F)
(°C)
Figure 11. MS5001R A/T NOx emissions
75 80 85 90 95 100
% Base Load
% N O
@
B a s e
L o a
d -
p p m v
d @
1 5 % O
X
2 105
100
95
90
85
80
75
ISO Conditions
1. 51P Closing IGV’s2. 51P Dropping Firing Temperature3. 71E Closing IGV’s4. 71E Dropping Firing Temperature
3
1
2 4
G T 2 5 0 6 7
Figure 12. Inlet guide vane effect on NOx ppmvd @ 15% O2 vs. load

7/28/2019 Gas Turbine Emissions and Control
http://slidepdf.com/reader/full/gas-turbine-emissions-and-control 16/36
GE Power Systems s GER-4211 s (03/01) 12
temperature control, the NOx emissions are not
affected by the load turbine shaft speed.
Exhaust Heat Recovery Turbines Regenerative cycle and waste heat recovery two-
shaft gas turbines are normally controlled to
operate the gas turbine compressor at the min-
imum speed allowable for the desired load out-
put. As load is increased from minimum, the
gas turbine compressor speed is held at mini-
mum until the turbine exhaust temperature
reaches the temperature control curve. With
further increase in load, the control system willincrease the gas turbine compressor speed
while following the exhaust temperature con-
trol curve. If the turbine has modulated inlet
guide vanes, the inlet guide vanes will open first
when the exhaust temperature control curve is
Gas Turbine Emissions and Control
75 80 85 90 95 100
% Base Load
% N O
@
B a s e
L o a
d - L
b / H o u r
X
105
100
95
90
85
80
75
70
65
ISO Conditions
1. 51P Closing IGV’s2. 51P Dropping Firing Temperature3. 71E Closing IGV’s4. 71E Dropping Firing Temperature
3
1
24
G T 2 5 0 6 8
Figure 13. Inlet guide vane effect on NOx lb/hour vs. load
75 80 85 90 95 100 105 110 115 120
Percent Compressor Speed
N O
V a
l u e s
X
110
100
90
80
70
60
50
40
30
Lb/Hr
ppmvw
NOTES:ISO Conditions
100% Compressor Speed = 5100 rpm
Natural Gas Fuel
Assumes Exhaust Isothermal LimitReached at 84 Percent Speed and Below
ppmvd @ 15% O2
G T 2 5 0 6 9
Figure 14. MS5001R A/T NOx emissions vs. shaft speed
7/28/2019 Gas Turbine Emissions and Control
http://slidepdf.com/reader/full/gas-turbine-emissions-and-control 17/36
reached, and then, once the inlet guide vanes
are fully open, the gas turbine compressor
speed will be increased.
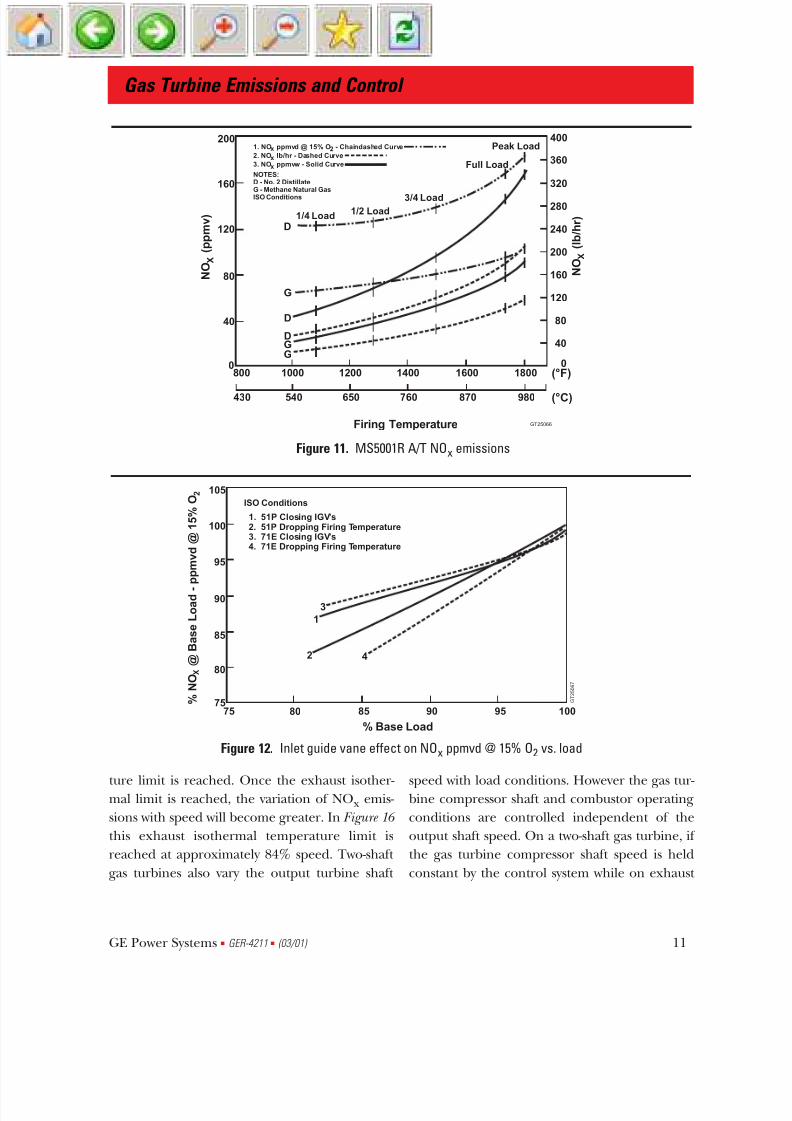
Figure 15 shows the NOx characteristic of aregenerative cycle MS3002J gas turbine at ISO
conditions. Initially, as load is increased, NOx
increases with firing temperature while the gas
turbine compressor is operating at minimum
speed. For the turbine shown, the exhaust
isothermal temperature control is reached at
approximately 48% load. The gas turbine com-
pressor shaft speed is then increased by the con-
trol system for further increases in load up to
the 100% load point. At approximately 96%
load, the gas turbine exhaust temperature con-
trol curve begins to limit exhaust temperature
below the isothermal exhaust temperature due
to the increasing airflow through the turbine
and the NOx values are reduced by the charac-teristic shown.
For a typical regenerative cycle MS5002B
Advanced Technology gas turbine with modu-
lated inlet guide vanes, the curve of NOx vs.
load at ISO conditions is shown in Figure 16 .
The NOx vs. load characteristic is similar to the
MS3002J. However, this design turbine will
operate at low load with the inlet guide vanes
partially closed and at minimum operating gas
turbine compressor shaft speed. During initial
loading, NOx increases with firing temperature.
When the exhaust temperature control system
isothermal temperature limit is reached the
inlet guide vanes are modulated open as load is
increased. At approximately 90% load the gas
turbine exhaust temperature control curve
begins to limit exhaust temperature below the
isothermal exhaust temperature due to the
increasing airflow through the turbine and the
NOx values are reduced. At approximately
91.5% load for this turbine calculation, the inlet
guide vanes are fully open and further increas-
es in load are accomplished by increasing the
gas turbine compressor speed resulting in theNOx reduction as shown.
Other NO x Influences
The previous sections of this paper consider the
internal gas turbine design factors which influ-
Gas Turbine Emissions and Control
GE Power Systems s GER-4211 s (03/01) 13
Percent Load
NOTES:ISO ConditionsConstant LP Shaft Speed
20100
120
140
160
180
200
220
30 40 50 60 70 80 90 100
N O
( p p m v
d )
@
1 5 % O
x
2
G T 2 5 0 7 0
Figure 15. MS3002J regenerative NOx vs. load

7/28/2019 Gas Turbine Emissions and Control
http://slidepdf.com/reader/full/gas-turbine-emissions-and-control 18/36
ence emissions generation. There are many
external factors to the gas turbine which impact
the formation of NOx emissions in the gas tur-
bine cycle. Some of these factors will be dis-
cussed below. In all figures under this topic, the
NOx is presented as a percentage value where
100% represents the thermal ISO NOx value for
the turbine operating on base temperature con-
trol. For all figures except for the regenerator
changes discussed, the curves drawn represent
a single “best fit ” line through the calculated
characteristics for frame 3, 5, 6, 7, and 9 gas tur-
bines. However, the characteristics shape that is
shown is the same for all turbines.
Ambient Pressure. NOx ppm emissions vary
almost directly with ambient pressure. Figure 17
provides an approximation for the ambient
pressure effect on NOx production on a lb/hr
basis and on a ppmvd @ 15% O2 basis. This fig-
ure is at constant 60% relative humidity. It should be noted that specific humidity varies
with ambient pressure and that this variation is
also included in the Figure 18 curves.
Ambient Temperature. Typical NOx emissions
variation with ambient temperature is shown in
Figure 18 . This figure is drawn at constant ambi-
ent pressure and 60% relative humidity with the
gas turbine operating constant gas turbine fir-
ing temperature. For an operating gas turbine
the actual NOx characteristic is directly influ-
enced by the control system exhaust tempera-
ture control curve, which can change the slope
of the curves. The typical exhaust temperature
control curve used by GE is designed to hold
constant turbine firing temperature in the
59°F/15°C to 90°F/32°C ambient temperature
range. The firing temperature with this typical
curve causes under-firing of approximately
20°F/11°C at 0°F/–18°C ambient, and approxi-
mately 10°F/6°C under-firing at 120°F/49°C
ambient. Factors such as load limits, shaft out-
put limits, and exhaust system temperature lim-
its are also not included in the Figure 18 curves.
Based on the actual turbine exhaust tempera-
ture control curve used and other potential lim-itations that reduce firing temperature, the esti-
mated NOx emissions for an operating gas tur-
bine are typically less than the values shown in
Figure 18 at both high and low ambients.
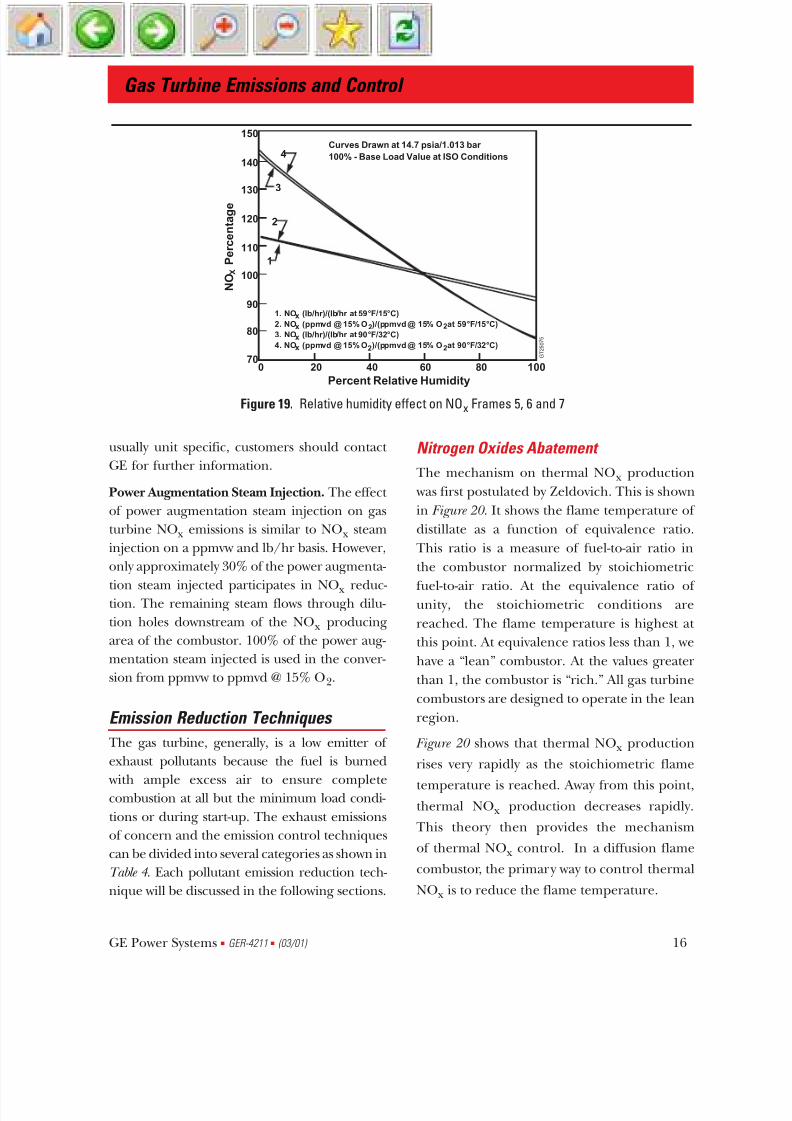
Relative Humidity. This parameter has a very
Gas Turbine Emissions and Control
GE Power Systems s GER-4211 s (03/01) 14
x
2
N O
( p p m v
d @
1 5 % O
)
Percent Load
NOTES:ISO ConditionsConstant LP Shaft Speed
40 50 60 70 80 90 100
250
200
150
100
G T 2 5 0 7 1
Figure 16. MS5002B A/T regenerative NOx vs. load

7/28/2019 Gas Turbine Emissions and Control
http://slidepdf.com/reader/full/gas-turbine-emissions-and-control 19/36
strong impact on NOx. The ambient relative
humidity effect on NOx production at constant
ambient pressure of 14.7 psia and ambient tem-
peratures of 59°F/15°C and 90°F/32°C is
shown in Figure 19 .
The impact of other parameters such as
inlet/exhaust pressure drops, regenerator char-
acteristics, evaporative/inlet coolers, etc., are
similar to the ambient parameter effects
described above. Since these parameters are
Gas Turbine Emissions and Control
GE Power Systems s GER-4211 s (03/01) 15
1. NO (lb/hr)/(ISO lb/hr)
2. NO (ppmvd @ 15% O )/(ISO ppmvd @ 15% O )22
x
x
9 10 11 12 13 14 15
Ambient Pressure
N O
P e r c e n
t a g e
X
100
90
80
70
60
50
40
Curve Drawn at 59°F/15°C, 60% Relative Humidity
100% - Base Load Value at ISO Conditions
2
1
G T 2 5
0 7
3 A
0.62 0.68 0.75 0.82 0.89 0.96 1.03
psia
bar
Figure 17. Ambient pressure effect on NOx Frames 5, 6 and 7
Ambient Temperature
N O
P e
r c e n
t a g e
X
120
110
100
90
80
70
60
50
400 20 40 60 80 100 120
2
1
Curve Drawn at 14.7 psia/1.013 bar, 0% Relative Humidity100% = Base Load Value at 59°F ambient
x
x
1. NO (lb/hr)/(ISO lb/hr)
2. NO (ppmvd @ 15% O )/(ISO ppmvd @ 15% O )2 2
G T 2 5 0 7 4 A
-18 -7 4 16 27 38 49
(°F)
(°C)
Figure 18. Ambient temperature effect on NOx Frames 5, 6 and 7
0% Relative Humidity
7/28/2019 Gas Turbine Emissions and Control
http://slidepdf.com/reader/full/gas-turbine-emissions-and-control 20/36
usually unit specific, customers should contact
GE for further information.
Power Augmentation Steam Injection. The effect
of power augmentation steam injection on gas
turbine NOx emissions is similar to NOx steam
injection on a ppmvw and lb/hr basis. However,
only approximately 30% of the power augmenta-
tion steam injected participates in NOx reduc-tion. The remaining steam flows through dilu-
tion holes downstream of the NOx producing
area of the combustor. 100% of the power aug-
mentation steam injected is used in the conver-
sion from ppmvw to ppmvd @ 15% O2.
Emission Reduction Techniques
The gas turbine, generally, is a low emitter of
exhaust pollutants because the fuel is burned
with ample excess air to ensure completecombustion at all but the minimum load condi-
tions or during start-up. The exhaust emissions
of concern and the emission control techniques
can be divided into several categories as shown in
Table 4 . Each pollutant emission reduction tech-
nique will be discussed in the following sections.
Nitrogen Oxides Abatement
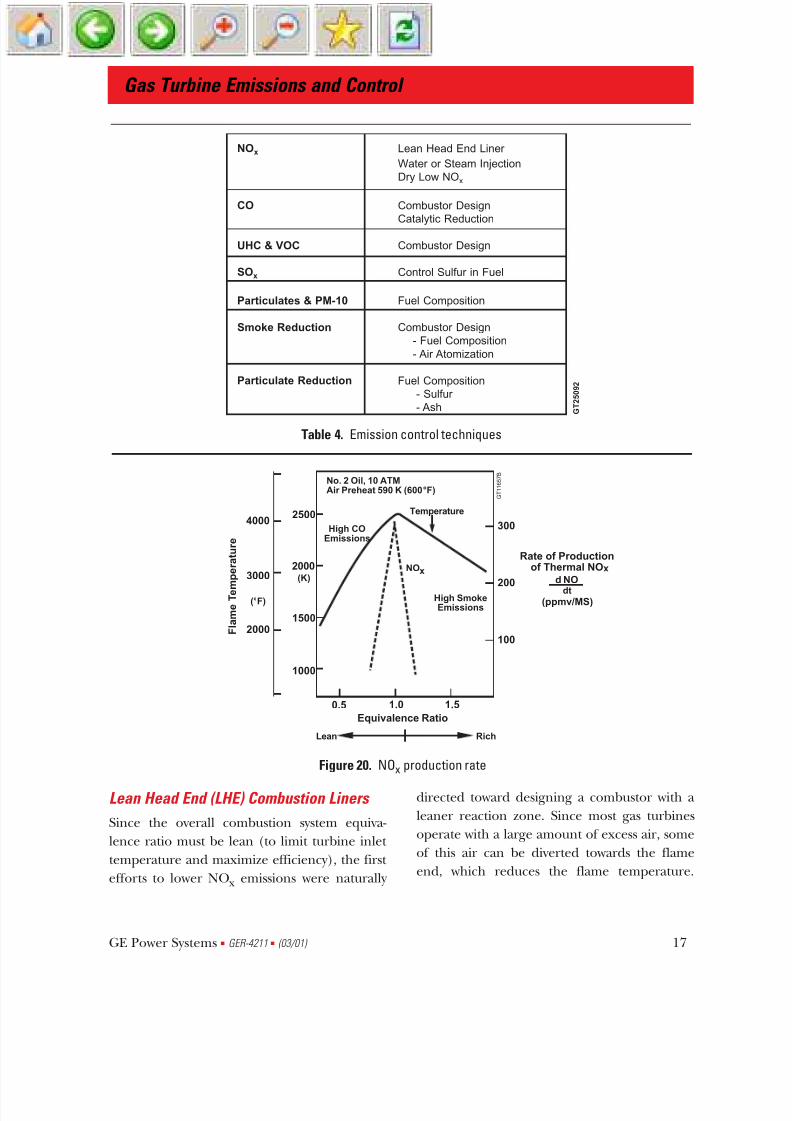
The mechanism on thermal NOx production
was first postulated by Zeldovich. This is shown
in Figure 20 . It shows the flame temperature of
distillate as a function of equivalence ratio.
This ratio is a measure of fuel-to-air ratio in
the combustor normalized by stoichiometric
fuel-to-air ratio. At the equivalence ratio of unity, the stoichiometric conditions are
reached. The flame temperature is highest at
this point. At equivalence ratios less than 1, we
have a “lean” combustor. At the values greater
than 1, the combustor is “rich.” All gas turbine
combustors are designed to operate in the lean
region.
Figure 20 shows that thermal NOx production
rises very rapidly as the stoichiometric flame
temperature is reached. Away from this point,thermal NOx production decreases rapidly.
This theory then provides the mechanism
of thermal NOx control. In a diffusion flame
combustor, the primary way to control thermal
NOx is to reduce the flame temperature.
Gas Turbine Emissions and Control
GE Power Systems s GER-4211 s (03/01) 16
x
x
x
x
1. NO (lb/hr)/(lb/hr at 59°F/15°C)
2. NO (ppmvd @ 15% O )/(ppmvd @ 15% O at 59°F/15°C)
3. NO (lb/hr)/(lb/hr at 90°F/32°C)
4. NO (ppmvd @ 15% O )/(ppmvd @ 15% O at 90°F/32°C)2
2 2
2
Percent Relative Humidity
N O
P e r c e n
t a g e
X
150
140
130
120
110
100
90
80
700 20 40 60 80 100
Curves Drawn at 14.7 psia/1.013 bar
100% - Base Load Value at ISO Conditions4
3
2
1
G T 2 5 0 7 5
Figure 19. Relative humidity effect on NOx Frames 5, 6 and 7
7/28/2019 Gas Turbine Emissions and Control
http://slidepdf.com/reader/full/gas-turbine-emissions-and-control 21/36
Lean Head End (LHE) Combustion Liners
Since the overall combustion system equiva-
lence ratio must be lean (to limit turbine inlet
temperature and maximize efficiency), the first
efforts to lower NOx emissions were naturally
directed toward designing a combustor with a
leaner reaction zone. Since most gas turbines
operate with a large amount of excess air, some
of this air can be diverted towards the flame
end, which reduces the flame temperature.
Gas Turbine Emissions and Control
GE Power Systems s GER-4211 s (03/01) 17
NOx Lean Head End Liner
Water or Steam Injection
Dry Low NOx
CO Combustor Design
Catalytic Reduction
UHC & VOC Combustor Design
SOx Control Sulfur in Fuel
Particulates & PM-10 Fuel Composition
Smoke Reduction Combustor Design
- Fuel Composition
- Air Atomization
Particulate Reduction Fuel Composition
- Sulfur - Ash
G T 2 5 0
9 2
Table 4. Emission control techniques
x
Equivalence Ratio
F l a m e
T e m
p e r a
t u r e
High SmokeEmissions
Temperature
NO
High COEmissions
No. 2 Oil, 10 ATMAir Preheat 590 K (600°F)
0.5 1.0 1.5
40002500
2000
300
200
100
1500
1000
3000
2000
RichLean
(K)
(°F)
x
Rate of Productionof Thermal NO
d NO
dt(ppmv/MS)
G T 1 1 6 5 7 B
Figure 20. NOx production rate
7/28/2019 Gas Turbine Emissions and Control
http://slidepdf.com/reader/full/gas-turbine-emissions-and-control 22/36
Leaning out the flame zone (reducing the
flame zone equivalence ratio) also reduces the
flame length, and thus reduces the residence
time a gas molecule spends at NOx
formation
temperatures. Both these mechanisms reduce
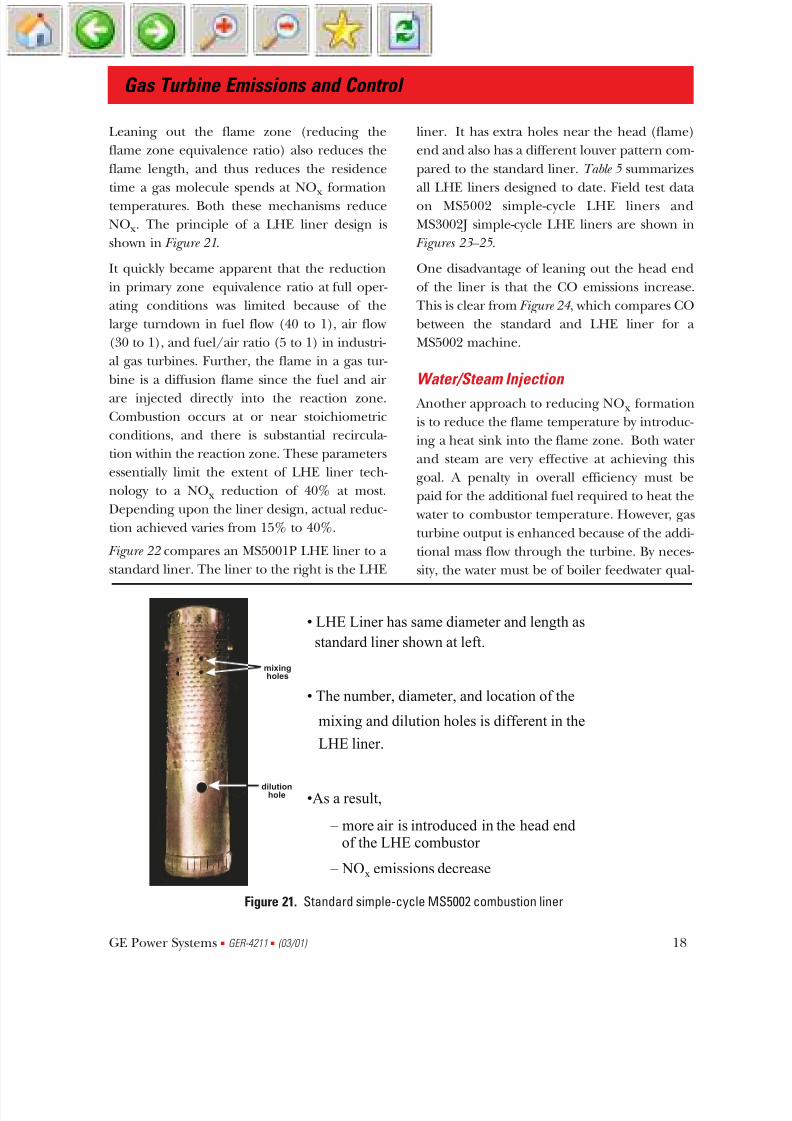
NOx. The principle of a LHE liner design is
shown in Figure 21.
It quickly became apparent that the reduction
in primary zone equivalence ratio at full oper-
ating conditions was limited because of the
large turndown in fuel flow (40 to 1), air flow
(30 to 1), and fuel/air ratio (5 to 1) in industri-
al gas turbines. Further, the flame in a gas tur-
bine is a diffusion flame since the fuel and air
are injected directly into the reaction zone.
Combustion occurs at or near stoichiometric
conditions, and there is substantial recircula-
tion within the reaction zone. These parameters
essentially limit the extent of LHE liner tech-
nology to a NOx reduction of 40% at most.
Depending upon the liner design, actual reduc-
tion achieved varies from 15% to 40%.
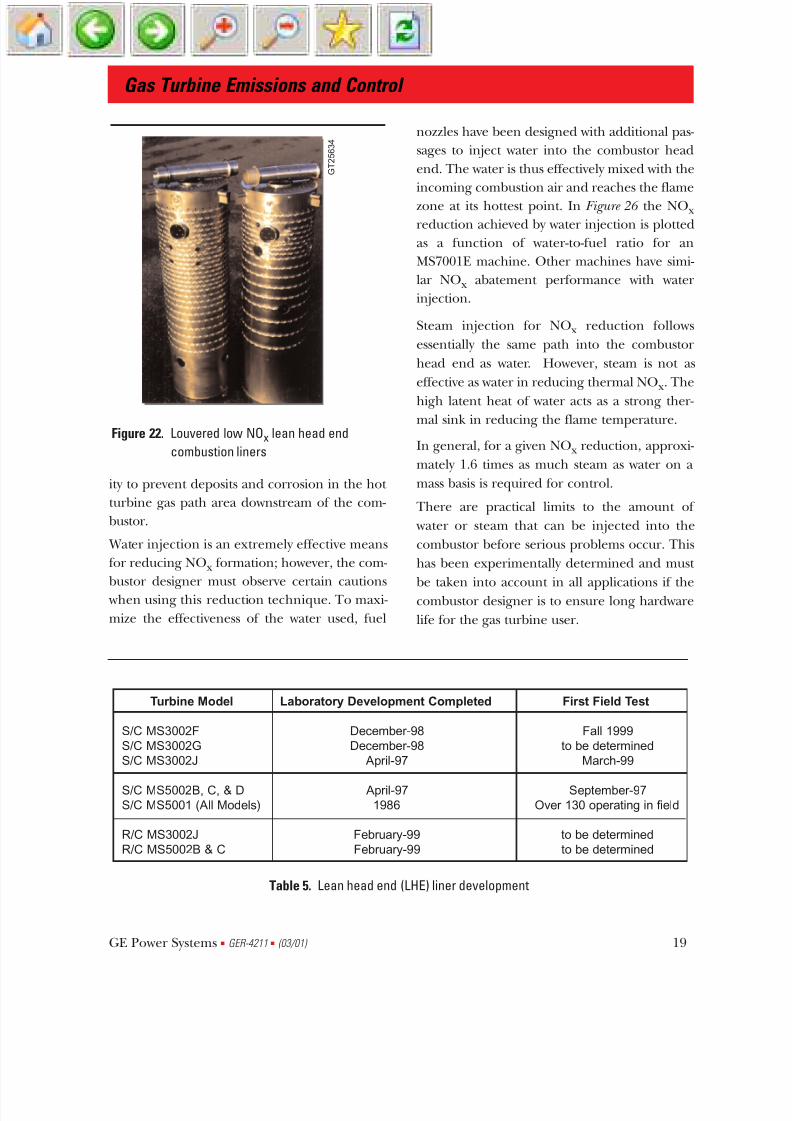
Figure 22 compares an MS5001P LHE liner to a
standard liner. The liner to the right is the LHE
liner. It has extra holes near the head (flame)
end and also has a different louver pattern com-
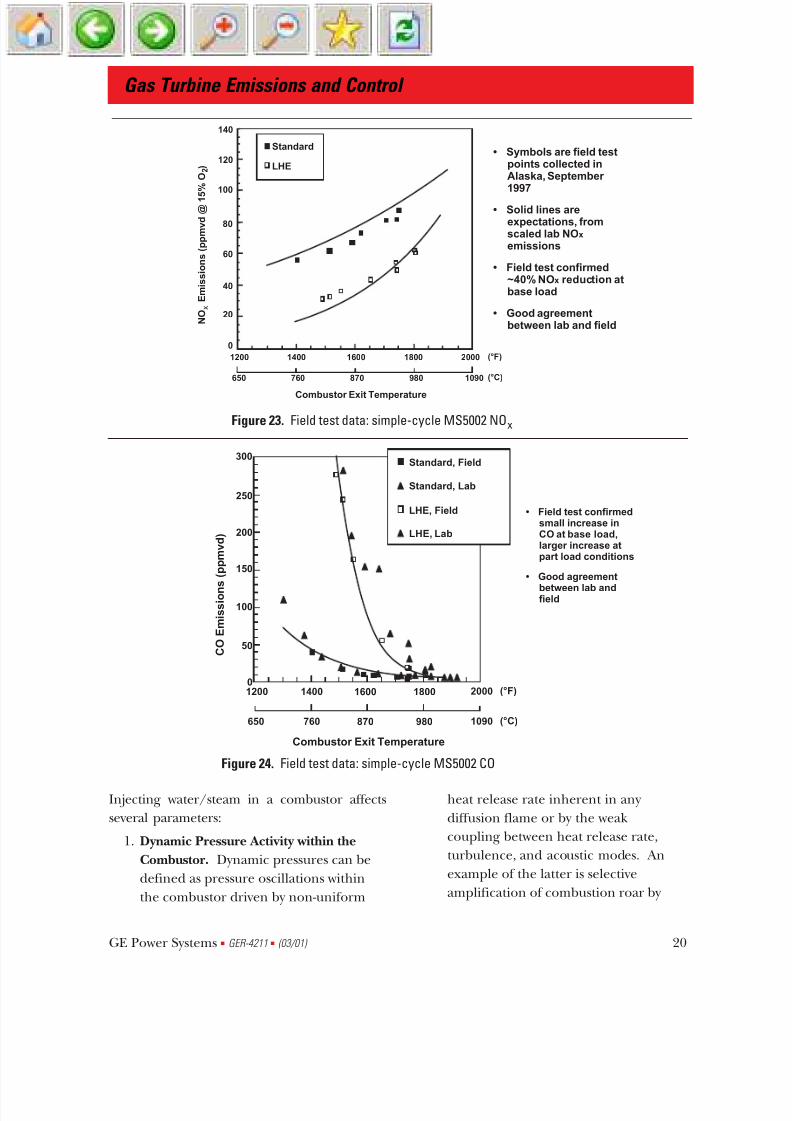
pared to the standard liner. Table 5 summarizes
all LHE liners designed to date. Field test data
on MS5002 simple-cycle LHE liners and
MS3002J simple-cycle LHE liners are shown in
Figures 23 – 25 .
One disadvantage of leaning out the head end
of the liner is that the CO emissions increase.
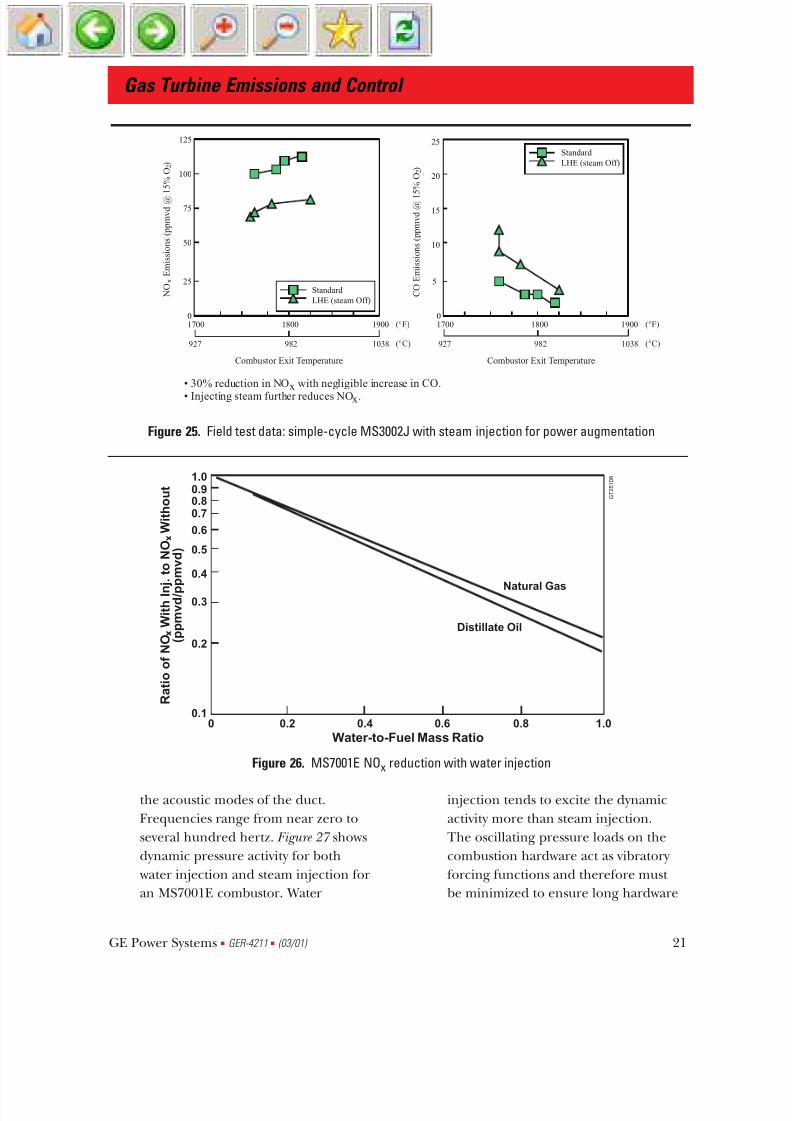
This is clear from Figure 24 , which compares CO
between the standard and LHE liner for a
MS5002 machine.
Water/Steam Injection
Another approach to reducing NOx formation
is to reduce the flame temperature by introduc-
ing a heat sink into the flame zone. Both water
and steam are very effective at achieving this
goal. A penalty in overall efficiency must be
paid for the additional fuel required to heat the
water to combustor temperature. However, gas
turbine output is enhanced because of the addi-
tional mass flow through the turbine. By neces-
sity, the water must be of boiler feedwater qual-
Gas Turbine Emissions and Control
GE Power Systems s GER-4211 s (03/01) 18
LHE Liner has same diameter and length as
standard liner shown at left.
• The number, diameter, and location of the
mixing and dilution holes is different in the
LHE liner.
•As a result,
– more air is introduced in the head endof the LHE combustor
– NOx emissions decrease
mixingholes
dilutionhole
Figure 21. Standard simple-cycle MS5002 combustion liner
7/28/2019 Gas Turbine Emissions and Control
http://slidepdf.com/reader/full/gas-turbine-emissions-and-control 23/36
ity to prevent deposits and corrosion in the hot
turbine gas path area downstream of the com-
bustor.
Water injection is an extremely effective means
for reducing NOx formation; however, the com-
bustor designer must observe certain cautions
when using this reduction technique. To maxi-
mize the effectiveness of the water used, fuel
nozzles have been designed with additional pas-
sages to inject water into the combustor head
end. The water is thus effectively mixed with the
incoming combustion air and reaches the flame
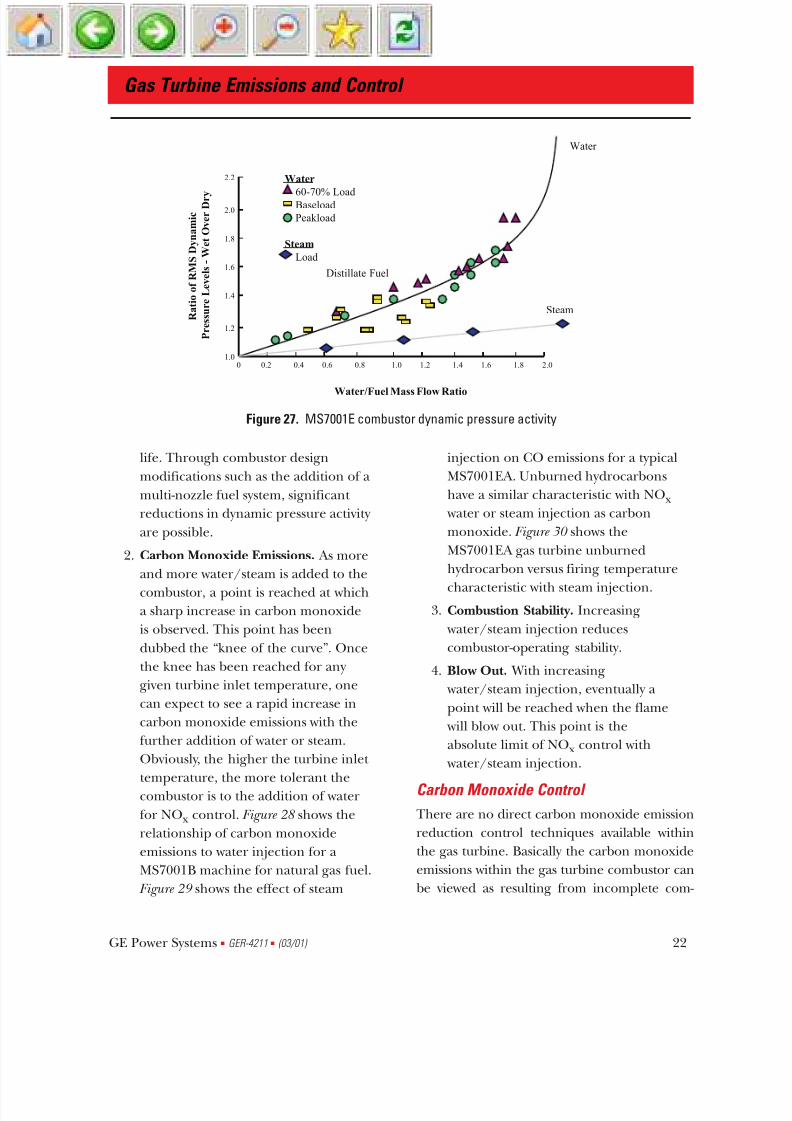
zone at its hottest point. In Figure 26 the NOx
reduction achieved by water injection is plotted
as a function of water-to-fuel ratio for an
MS7001E machine. Other machines have simi-
lar NOx abatement performance with water
injection.
Steam injection for NOx reduction follows
essentially the same path into the combustor
head end as water. However, steam is not as
effective as water in reducing thermal NOx
. The
high latent heat of water acts as a strong ther-
mal sink in reducing the flame temperature.
In general, for a given NOx reduction, approxi-
mately 1.6 times as much steam as water on a
mass basis is required for control.
There are practical limits to the amount of
water or steam that can be injected into the
combustor before serious problems occur. This
has been experimentally determined and must
be taken into account in all applications if thecombustor designer is to ensure long hardware
life for the gas turbine user.
Gas Turbine Emissions and Control
GE Power Systems s GER-4211 s (03/01) 19
Figure 22. Louvered low NOx lean head end
combustion liners
Turbine Model Laboratory Development Completed First Field Test
S/C MS3002F December-98 Fall 1999
S/C MS3002G December-98 to be determined
S/C MS3002J April-97 March-99
S/C MS5002B, C, & D April-97 September-97S/C MS5001 (All Models) 1986 Over 130 operating in field
R/C MS3002J February-99 to be determined
R/C MS5002B & C February-99 to be determined
GER 3751-19
G T 2 5 6 3 4
Table 5. Lean head end (LHE) liner development
7/28/2019 Gas Turbine Emissions and Control
http://slidepdf.com/reader/full/gas-turbine-emissions-and-control 24/36
Injecting water/steam in a combustor affects
several parameters:
1. Dynamic Pressure Activity within the
Combustor. Dynamic pressures can be
defined as pressure oscillations within
the combustor driven by non-uniform
heat release rate inherent in any
diffusion flame or by the weak
coupling between heat release rate,
turbulence, and acoustic modes. An
example of the latter is selective
amplification of combustion roar by
Gas Turbine Emissions and Control
GE Power Systems s GER-4211 s (03/01) 20
N O
E m
i s s
i o n s
( p p m v
d @
1 5
% O )
x
2
Combustor Exit Temperature
650
1200 1400 1600 1800 2000
760 870 980 1090
(°F)
(°C)
• Symbols are field testpoints collected inAlaska, September 1997
• Solid lines areexpectations, fromscaled lab NOemissions
• Field test confirmed~40% NO reduction atbase load
• Good agreementbetween lab and field
x
x
Standard
LHE
140
120
100
80
60
40
20
0
Figure 23. Field test data: simple-cycle MS5002 NOx
C O E m
i s s
i o n s
( p p m v
d )
Combustor Exit Temperature
300
250
200
150
100
50
1200
650
1400
760
1600
870
1800
980
2000
1090
0
Standard, Field
Standard, Lab
LHE, Field
LHE, Lab
(°F)
(°C)
• Field test confirmedsmall increase inCO at base load,larger increase atpart load conditions
• Good agreement
between lab andfield
Figure 24. Field test data: simple-cycle MS5002 CO
7/28/2019 Gas Turbine Emissions and Control
http://slidepdf.com/reader/full/gas-turbine-emissions-and-control 25/36
the acoustic modes of the duct.
Frequencies range from near zero to
several hundred hertz. Figure 27 shows
dynamic pressure activity for both
water injection and steam injection for
an MS7001E combustor. Water
injection tends to excite the dynamic
activity more than steam injection.
The oscillating pressure loads on the
combustion hardware act as vibratory
forcing functions and therefore must
be minimized to ensure long hardware
Gas Turbine Emissions and Control
GE Power Systems s GER-4211 s (03/01) 21
N O x E m i s s i o n s ( p p m v ,
d r y ,
1 5 %
O 2
)
C O E m i s s i o n s ( p p m v ,
d r y , 1
5 %
O 2
)
Standard
LHE (steam Off)
Standard
LHE (steam Off)
1800 1900170019001700 1800
25
0
5
10
15
20
0
25
50
75
100
125
Combustor Exit Temperature (°F)
• 30% reduction in NOx with negligible increase in CO.
• Injecting steam further reduces NOx.
N O
E m
i s s i o n s
( p p m v
d @
1 5 % O )
x
2
Combustor Exit Temperature Combustor Exit Temperature
927 982 1038
(°F)
(°C)
• 30% reduction in NO with negligible increase in CO.
• Injecting steam further reduces NO .x
x
C O E m
i s s i o n s
( p p m v
d @
1 5 % O )
2
927 982 1038
(°F)
(°C)
Figure 25. Field test data: simple-cycle MS3002J with steam injection for power augmentation
x
x
R a t i o
o f
N O
W i t h
I n
j . t o N
O
W i t h o u t
( p p m v d / p p m v d )
Water-to-Fuel Mass Ratio
Distillate Oil
Natural Gas
0 0.2 0.4 0.6 0.8 1.0
1.00.90.80.7
0.6
0.5
0.4
0.3
0.2
0.1
G T 2 5 1 0 8
Figure 26. MS7001E NOx reduction with water injection
7/28/2019 Gas Turbine Emissions and Control
http://slidepdf.com/reader/full/gas-turbine-emissions-and-control 26/36
life. Through combustor design
modifications such as the addition of a
multi-nozzle fuel system, significant
reductions in dynamic pressure activity
are possible.
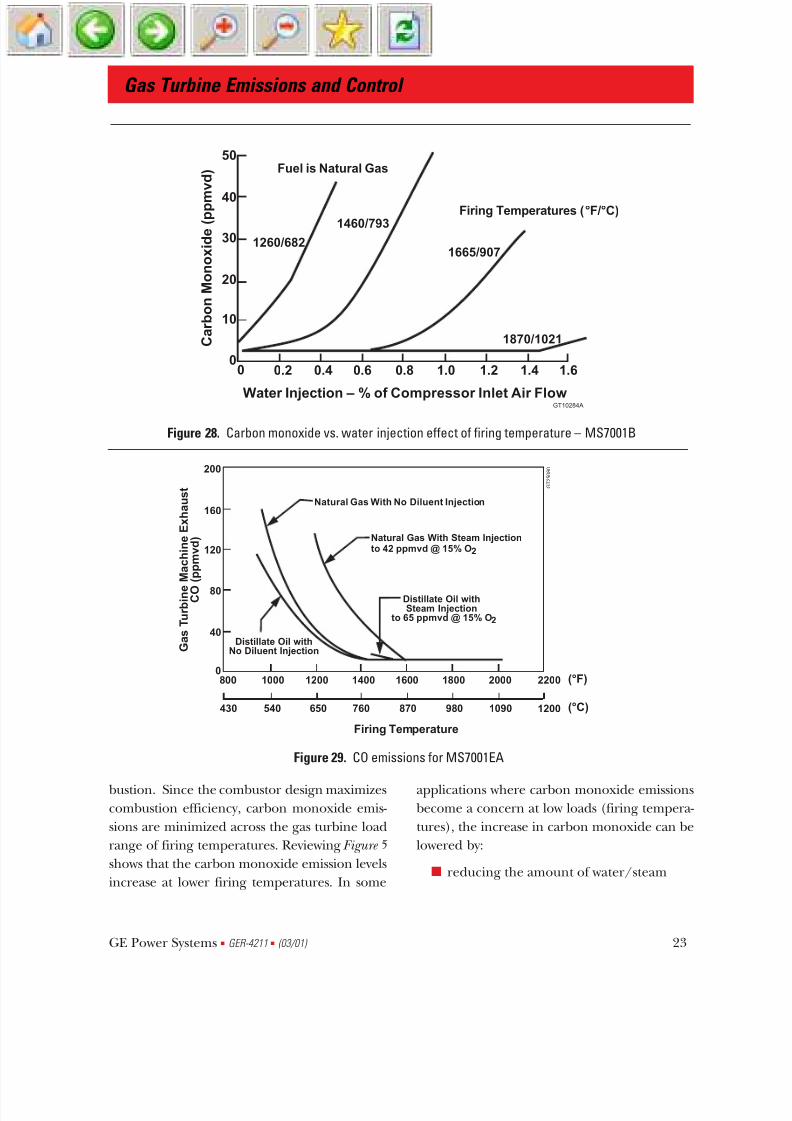
2. Carbon Monoxide Emissions. As more
and more water/steam is added to the
combustor, a point is reached at whicha sharp increase in carbon monoxide
is observed. This point has been
dubbed the “knee of the curve”. Once
the knee has been reached for any
given turbine inlet temperature, one
can expect to see a rapid increase in
carbon monoxide emissions with the
further addition of water or steam.
Obviously, the higher the turbine inlet
temperature, the more tolerant the
combustor is to the addition of water
for NOx control. Figure 28 shows the
relationship of carbon monoxide
emissions to water injection for a
MS7001B machine for natural gas fuel.
Figure 29 shows the effect of steam
injection on CO emissions for a typical
MS7001EA. Unburned hydrocarbons
have a similar characteristic with NOx
water or steam injection as carbon
monoxide. Figure 30 shows the
MS7001EA gas turbine unburned
hydrocarbon versus firing temperature
characteristic with steam injection.3. Combustion Stability. Increasing
water/steam injection reduces
combustor-operating stability.
4. Blow Out. With increasing
water/steam injection, eventually a
point will be reached when the flame
will blow out. This point is the
absolute limit of NOx control with
water/steam injection.
Carbon Monoxide Control
There are no direct carbon monoxide emission
reduction control techniques available within
the gas turbine. Basically the carbon monoxide
emissions within the gas turbine combustor can
be viewed as resulting from incomplete com-
Gas Turbine Emissions and Control
GE Power Systems s GER-4211 s (03/01) 22
2.01.81.61.41.21.00.80.60.4
1.8
0
1.2
1.0
2.2
2.0
1.6
1.4
0.2
Water
60-70% LoadBaseload
Peakload
Steam
Load
Distillate Fuel
Steam
Water
Water/Fuel Mass Flow Ratio
R a t i o o f R M S D y n a m i c
P r e s s u r e L e v e l s - W e t O v e r D r y
Figure 27. MS7001E combustor dynamic pressure activity
7/28/2019 Gas Turbine Emissions and Control
http://slidepdf.com/reader/full/gas-turbine-emissions-and-control 27/36
bustion. Since the combustor design maximizescombustion efficiency, carbon monoxide emis-
sions are minimized across the gas turbine load
range of firing temperatures. Reviewing Figure 5
shows that the carbon monoxide emission levels
increase at lower firing temperatures. In some
applications where carbon monoxide emissionsbecome a concern at low loads (firing tempera-
tures), the increase in carbon monoxide can be
lowered by:
s reducing the amount of water/steam
Gas Turbine Emissions and Control
GE Power Systems s GER-4211 s (03/01) 23
Water Injection – % of Compressor Inlet Air Flow
C a r b o n
M o n o x
i d e
( p p m
v d )
1260/682
1460/793
1665/907
1870/1021
Fuel is Natural Gas
Firing Temperatures (°F/°C)
50
40
30
20
10
00 0.2 0.4 0.6 0.8 1.0 1.2 1.4 1.6
GT10284A
Figure 28. Carbon monoxide vs. water injection effect of firing temperature – MS7001B
2
Natural Gas With Steam Injectionto 42 ppmvd @ 15% O
2
Distillate Oil withSteam Injection
to 65 ppmvd @ 15% O
Distillate Oil withNo Diluent Injection
Firing Temperature
G a s
T u r b
i n e
M a c
h i n e
E x
h a u s
t
C O
( p p m v
d )
Natural Gas With No Diluent Injection
800 1000 1200 1400 1600 1800 2000 2200
200
160
120
80
40
0
G T 2 5 0 8 0
430 540 650 760 870 980 1090 1200
(°F)
(°C)
Figure 29. CO emissions for MS7001EA

7/28/2019 Gas Turbine Emissions and Control
http://slidepdf.com/reader/full/gas-turbine-emissions-and-control 28/36
injection for NOx control (if allowed)
– or –
s closing the inlet guide vanes, which
will increase the firing temperature for
the same load.
Unburned Hydrocarbons Control
Similar to carbon monoxide, there are also no
direct UHC reduction control techniques used
within the gas turbine. UHCs are also viewed as
incomplete combustion, and the combustor is
designed to minimize these emissions. The
same indirect emissions control techniques can
be used for unburned hydrocarbons as for car-
bon monoxide.
Particulate and Smoke Reduction
Control techniques for particulate emissions with the exception of smoke are limited to con-
trol of the fuel composition.
Although smoke can be influenced by fuel com-
position, combustors can be designed which
minimize emission of this pollutant. Heavy fuels
such as crude oil and residual oil have low
hydrogen levels and high carbon residue, which
increase smoking tendencies. GE has designed
heavy-fuel combustors that have smoke per-
formance comparable with those which burn
distillate fuel.
Crude and residual fuel oil generally containalkali metals (Na, K) in addition to vanadium
and lead, which cause hot corrosion of the tur-
bine nozzles and buckets at the elevated firing
temperatures of today's gas turbine. If the fuel is
washed, water soluble compounds (alkali salts)
containing the contaminants are removed.
Filtration, centrifuging, or electrostatic precipi-
tation are also effective on reducing the solid
contaminants in the combustion products.
Contaminants that cannot be removed from the
fuel (vanadium compounds) can be controlled
through the use of inhibitors. GE uses addition
of magnesium to control vanadium corrosion in
its heavy-duty gas turbines. These magnesium
additives always form ash within the hot gas
path components. This process generally
Gas Turbine Emissions and Control
GE Power Systems s GER-4211 s (03/01) 24
2
Natural Gas with Steam Injectionto 42 ppmvd @ 15% O
Firing Temperature
G a s
T u r b
i n e
M a c
h i n e
E x
h a u s
t
U H C ( p p m v
d )
Natural Gas with No Diluent Injection
Distillate Oil Withand Without
Diluent Injection
600 800 1000 1200 1400 1600 1800 2000 2200
120
100
80
60
40
20
0
G T 2 5 0 8 1
320 430 540 650 760 870 980 1090 1200
(°F)
(°C)
Figure 30. UHC emissions for MS7001EA

7/28/2019 Gas Turbine Emissions and Control
http://slidepdf.com/reader/full/gas-turbine-emissions-and-control 29/36
requires control and removal of added ash
deposits from the turbine. The additional ash
will contribute to the exhaust particulate emis-
sions. Generally, the expected increase can be
calculated from an analysis of the particular fuel
being burned.
In some localities, condensable compounds
such as SO3 and condensable hydrocarbons are
considered particulates. SO3, like SO2, can best
be minimized by controlling the amount of sul-
fur in the fuel. The major problem associated
with sulfur compounds in the exhaust comes
from the difficulty of measurement. Emissions
of UHCs, which are a liquid or solid at room
temperature, are very low and only make aminor contribution to the exhaust particulate
loading.
Water/Steam Injection Hardware
The injection of water or steam into the com-
bustion cover/fuel nozzle area has been the pri-
mary method of NOx reduction and control in
GE heavy-duty gas turbines since the early
1970s. The same design gas turbine equipment
is supplied for conversion retrofits to existing
gas turbines for either injection method. Both
NOx control injection methods require a micro-
processor controller, therefore turbines with
older controls need to have their control sys-
tem upgraded to Mark V or Mark VI
SPEEDTRONIC™ controls conversion. The
control system for both NOx control injection
methods utilizes the standard GE gas turbine
control philosophy of two separate independ-
ent methods for shutting off the injection flow.
The NOx water injection system is shown
schematically in Figure 31 and consists of a water
pump and filter, water flowmeters, water stop
and flow control valves. This material is sup-
plied on a skid approximately 10 x 20 feet in
size for mounting at the turbine site. The water
from the skid is piped to the turbine base where
it is manifold to each of the fuel nozzles using
pigtails. The water injection at the combustion
chamber is through passages in the fuel nozzle
assembly. A typical water injection fuel nozzle
assembly is shown schematically in Figure 32 .
For this nozzle design there are eight or twelve
Gas Turbine Emissions and Control
GE Power Systems s GER-4211 s (03/01) 25
Figure 31. Schematic piping – water injection system

7/28/2019 Gas Turbine Emissions and Control
http://slidepdf.com/reader/full/gas-turbine-emissions-and-control 30/36
water spray nozzles directing the water injection
spray towards the fuel nozzle tip swirler. While
this design is quite effective in controlling the
NOx emissions, the water spray has a tendency
to impinge on the nozzle tip swirler and on the
liner cap/cowl assembly. Resulting thermal
strain usually leads to cracks, which limits the
combustion inspections to 8000 hours or less.
To eliminate this cracking, the latest design
water-injected fuel nozzle is the breech-load
fuel nozzle. (See Figure 33.) In this design the
water is injected through a central fuel nozzle
passage, injecting the water flow directly into
the combustor flame. Since the water injection
spray does not impinge on the fuel nozzle
swirler or the combustion cowl assembly, the
breech load fuel nozzle design results in lower
maintenance and longer combustion inspec-tion intervals for NOx water injection applica-
tions.
The NOx steam injection system is shown
schematically in Figure 34 , and consists of a
steam flowmeter, steam control valve, steam
stop valve, and steam blowdown valves. This
material is supplied loose for mounting near
the turbine base by the customer. The steam-
injection flow goes to the steam-injection mani-
fold on the turbine base. Flexible pigtails are
used to connect from the steam manifold to
each combustion chamber. The steam injection
into the combustion chamber is through
machined passages in the combustion can
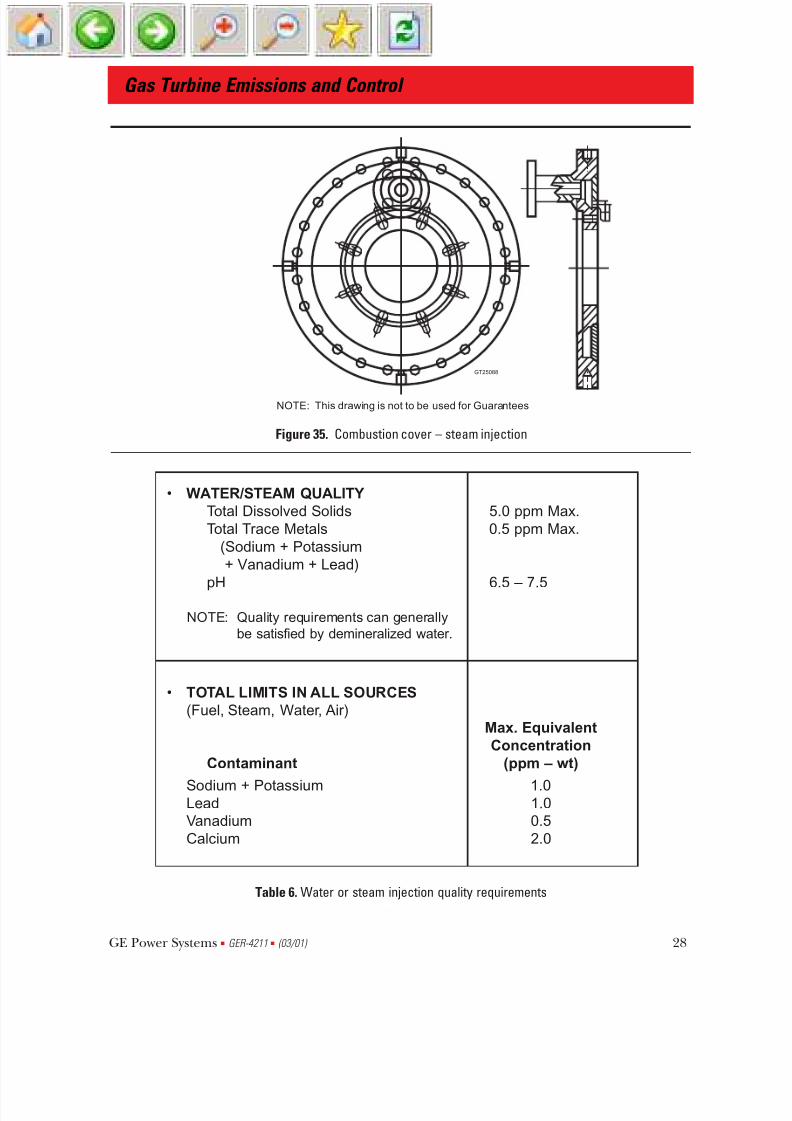
cover. A typical steam-injection combustion
cover with the machined steam-injection pas-
sage and steam injection nozzles is shown in
Figure 35 .
Water quality is of concern when injecting water
or steam into the gas turbine due to potential
problems with hot gas path corrosion, and
effects to the injection control equipment. The
injected water or steam must be clean and freeof impurities and solids. The general require-
ments of the injected water or steam quality are
shown in Table 6 . Total impurities into the gas
turbine are a total of the ambient air, fuel, and
injected water or steam. The total impurities
Gas Turbine Emissions and Control
GE Power Systems s GER-4211 s (03/01) 26
Fuel Gas Connection
Oil Connection
Water Injection Inlet
Atomizing
Air Connection
G T 2 5 0 8 5
Figure 32. Water injection fuel nozzle assembly

7/28/2019 Gas Turbine Emissions and Control
http://slidepdf.com/reader/full/gas-turbine-emissions-and-control 31/36
requirement may lower the water or steam-
injection quality requirements. It is important
to note that the total impurities requirement is
provided relative to the input fuel flow.
Minimum NO x Levels
As described above, the methods used to reduce
thermal NOx inside the gas turbine are by com-
bustor design or by diluent injection. To see
Gas Turbine Emissions and Control
GE Power Systems s GER-4211 s (03/01) 27
Fuel Gas Connection
Distillate Fuel Inlet
Water Injection Inlet
Atomizing Air Connection
G T 2
5 0 8 6
Figure 33. Breech-load fuel nozzle assembly
Figure 34. Schematic piping – steam injection system
7/28/2019 Gas Turbine Emissions and Control
http://slidepdf.com/reader/full/gas-turbine-emissions-and-control 32/36
Gas Turbine Emissions and Control
GE Power Systems s GER-4211 s (03/01) 28
GT25088
NOTE: This drawing is not to be used for Guarantees
Figure 35. Combustion cover – steam injection
• WATER/STEAM QUALITY
Total Dissolved Solids 5.0 ppm Max.
Total Trace Metals 0.5 ppm Max.
(Sodium + Potassium
+ Vanadium + Lead)
pH 6.5 – 7.5
NOTE: Quality requirements can generally
be satisfied by demineralized water.
Max. Equivalent
Concentration
Contaminant (ppm – wt)
Sodium + Potassium 1.0Lead 1.0
Vanadium 0.5
Calcium 2.0
• TOTAL LIMITS IN ALL SOURCES
(Fuel, Steam, Water, Air)
Table 6. Water or steam injection quality requirements
7/28/2019 Gas Turbine Emissions and Control
http://slidepdf.com/reader/full/gas-turbine-emissions-and-control 33/36
NOx emissions from each frame size without
any control, refer to Table 3 . With the LHE liner
design, dry (no water/steam injection) NOx
emissions could be reduced by 15–40% relative
to standard liner. This is the limit of LHE liner
technology.
With water or steam injection, significant reduc-
tion in NOx is achieved. The lowest achievable
NOx values with water/steam injection from GE
heavy-duty gas turbines are also shown in Table
3 . The table provides the current minimum
NOx levels for both methane natural gas fuel
and #2 distillate fuel oil.
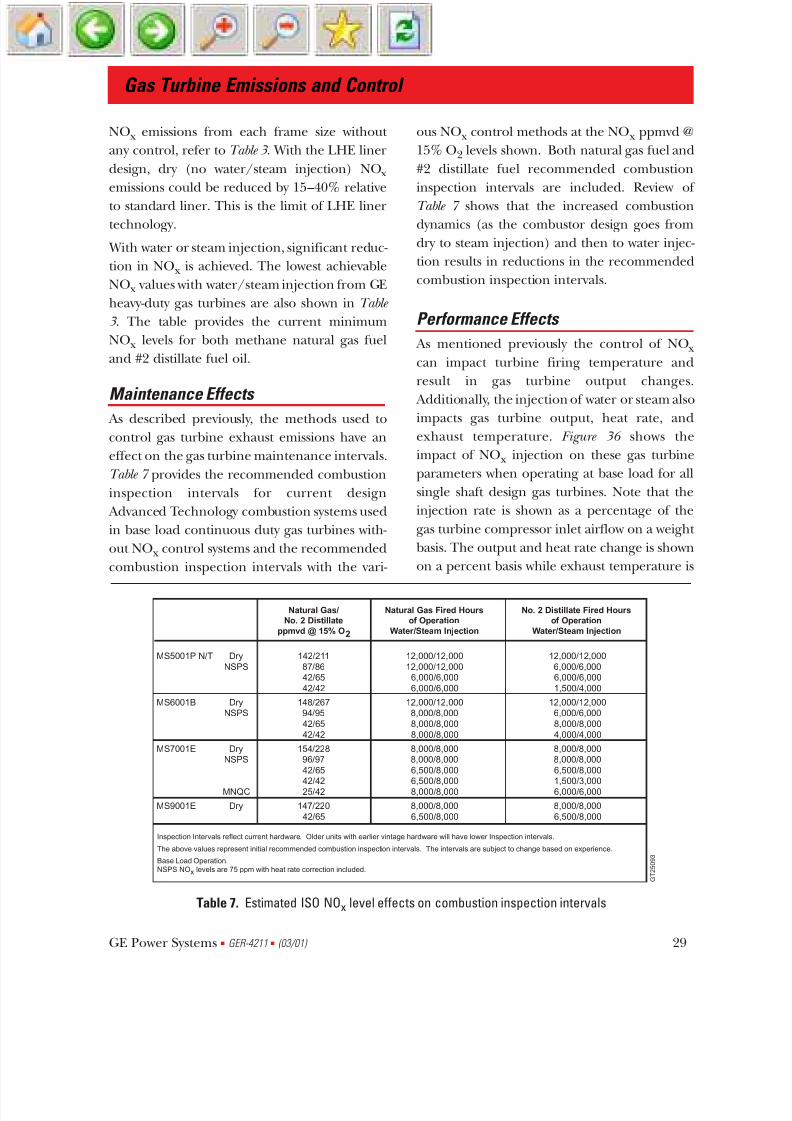
Maintenance Effects As described previously, the methods used to
control gas turbine exhaust emissions have an
effect on the gas turbine maintenance intervals.
Table 7 provides the recommended combustion
inspection intervals for current design
Advanced Technology combustion systems used
in base load continuous duty gas turbines with-
out NOx control systems and the recommended
combustion inspection intervals with the vari-
ous NOx control methods at the NOx ppmvd @
15% O2 levels shown. Both natural gas fuel and
#2 distillate fuel recommended combustion
inspection intervals are included. Review of
Table 7 shows that the increased combustion
dynamics (as the combustor design goes from
dry to steam injection) and then to water injec-
tion results in reductions in the recommended
combustion inspection intervals.
Performance Effects
As mentioned previously the control of NOx
can impact turbine firing temperature and
result in gas turbine output changes.
Additionally, the injection of water or steam also
impacts gas turbine output, heat rate, and
exhaust temperature. Figure 36 shows the
impact of NOx injection on these gas turbine
parameters when operating at base load for all
single shaft design gas turbines. Note that the
injection rate is shown as a percentage of the
gas turbine compressor inlet airflow on a weight
basis. The output and heat rate change is shown
on a percent basis while exhaust temperature is
Gas Turbine Emissions and Control
GE Power Systems s GER-4211 s (03/01) 29
Natural Gas/ Natural Gas Fired Hours No. 2 Distillate Fired Hours
No. 2 Distillate of Operation of Operation
ppmvd @ 15% O2 Water/Steam Injection Water/Steam Injection
MS5001P N/T Dry 142/211 12,000/12,000 12,000/12,000
NSPS 87/86 12,000/12,000 6,000/6,00042/65 6,000/6,000 6,000/6,000
42/42 6,000/6,000 1,500/4,000
MS6001B Dry 148/267 12,000/12,000 12,000/12,000NSPS 94/95 8,000/8,000 6,000/6,000
42/65 8,000/8,000 8,000/8,000
42/42 8,000/8,000 4,000/4,000
MS7001E Dry 154/228 8,000/8,000 8,000/8,000NSPS 96/97 8,000/8,000 8,000/8,000
42/65 6,500/8,000 6,500/8,000
42/42 6,500/8,000 1,500/3,000MNQC 25/42 8,000/8,000 6,000/6,000
MS9001E Dry 147/220 8,000/8,000 8,000/8,000
42/65 6,500/8,000 6,500/8,000
Inspection Intervals reflect current hardware. Older units with earlier vintage hardware will have lower Inspection intervals.
The above values represent initial recommended combustion inspection intervals. The intervals are subject to change based on experience.
Base Load Operation.
NSPS NOx levels are 75 ppm with heat rate correction included.
G T 2 5 0 9 3
Table 7. Estimated ISO NOx level effects on combustion inspection intervals

7/28/2019 Gas Turbine Emissions and Control
http://slidepdf.com/reader/full/gas-turbine-emissions-and-control 34/36
shown in degrees F. Review of Figure 36 shows
that turbine output is increased when NOx
injection is used. The gas turbine load equip-
ment must also be capable of this output
increase or control changes must be made in
order to reduce the gas turbine output.
Summary
The emissions characteristics of gas turbines
have been presented both at base load and part
load conditions. The interaction of emission
control on other exhaust emissions as well as
the effects on gas turbine maintenance and per-
formance have also been presented. The mini-
mum controllable NOx levels using LHE and
water/steam injection techniques have also
been presented. Using this information, emis-
sions estimates and the overall effect of the var-
ious emission control methods can be estimat-
ed.
It is not the intent of this paper to provide site-
specific emissions. For these values, the cus-
tomer must contact GE.
Gas Turbine Emissions and Control
GE Power Systems s GER-4211 s (03/01) 30
% O u t p u t I n c r e a s e
% H e a t R
a t e I n c r e a s e
C h a n g e i n E x h a u s t T e m
p
0
5
10
1 2
1 2
1 2
Diluent Injection (% Compressor Inlet Flow)
0
-2
-4
-6
-8
0
-1.1
-2.2
-3.3
-4.4
0
-4
4
-2
2
Solid Line = Water Inj for 5001
Dashed Line = Steam Inj for 5001
Chaindashed Line = Water Inj for 61, 71, 91
Dotted Line = Steam Inj for 61, 71, 91
Figure 36. Performance effects vs. diluent injection
7/28/2019 Gas Turbine Emissions and Control
http://slidepdf.com/reader/full/gas-turbine-emissions-and-control 35/36
List of Figures
Figure 1. MS7001EA NOx emissions
Figure 2. MS6001B NOx emissions
Figure 3. MS5001P A/T NOx emissions
Figure 4. MS5001R A/T NOx emissions
Figure 5. CO emissions for MS7001EA
Figure 6. UHC emissions for MS7001EA
Figure 7. Calculated sulfur oxide and sulfur emissions
Figure 8. MS7001EA NOx emissions
Figure 9. MS6001B NOx emissions
Figure 10. MS5001P A/T NOx emissions
Figure 11. MS5001R A/T NOx emissions
Figure 12. Inlet guide vane effect on NOx ppmvd @ 15% O2 vs. loadFigure 13. Inlet guide vane effect on NOx lb/hour vs. load
Figure 14. MS5001R A/T NOx emissions vs. shaft speed
Figure 15. MS3002J regenerative NOx vs. load
Figure 16. MS5002B A/T regenerative NOx vs. load
Figure 17. Ambient pressure effect on NOx frame 5, 6 and 7
Figure 18. Ambient temperature effect on NOx frame 5, 6 and 7
Figure 19. Relative humidity effect on NOx frame 5, 6 and 7
Figure 20. NOx production rate
Figure 21. Standard simple cycle MS5002 combustor liner
Figure 22. Louvered low NOx lean head end combustion liners
Figure 23. Field test data: simple-cycle MS5002 NOx
Figure 24. Field test data: simple-cycle MS5002 CO
Figure 25. Field test data: simple-cycle MS3002J with steam injection for power augmentation
Figure 26. MS7001E NOx reduction with water injection
Figure 27. MS7001E combustor dynamic pressure activity
Figure 28. Carbon monoxide vs. water injection effect of firing temperature – MS7001B
Figure 29. CO emissions for MS7001EA
Figure 30. UHC emissions for MS7001EA
Figure 31. Schematic piping – water injection system
Figure 32. Water injection fuel nozzle assembly
Figure 33. Breech-load fuel nozzle assembly
Figure 34. Schematic piping – steam injection system
Figure 35. Combustion cover – steam injection
Figure 36. Performance effects vs. diluent injection
Gas Turbine Emissions and Control
GE Power Systems s GER-4211 s (03/01) 31

7/28/2019 Gas Turbine Emissions and Control
http://slidepdf.com/reader/full/gas-turbine-emissions-and-control 36/36
List of Tables
Table 1. Gas turbine exhaust emissions burning conventional fuels
Table 2. Relative thermal NOx emissions
Table 3. NOx emission levels at 15% O2 (ppmvd)
Table 4. Emission control techniques
Table 5. Lean head end (LHE) liner development
Table 6. Water or steam injection quality requirements
Table 7. Estimated ISO NOx level effects on combustion inspection intervals
Gas Turbine Emissions and Control