Embed Size (px)
Citation preview

The INL is a U.S. Department of Energy National Laboratory operated by Battelle Energy Alliance
INL/EXT-06-11751
Gas Test Loop Booster Fuel Hydraulic Testing
Gas Test Loop Hydraulic Testing Staff
September 2006

INL/EXT-06-11751
Gas Test Loop Booster Fuel Hydraulic Testing
Gas Test Loop Hydraulic Testing Staff
September 2006
Idaho National Laboratory Idaho Falls, Idaho 83415
Prepared for the U.S. Department of Energy Office of Nuclear Energy
Under DOE Idaho Operations Office Contract DE-AC07-05ID14517

ii

iii

iv
GAS TEST LOOP BOOSTER FUEL HYDRAULIC TESTING TEAM
Michael Ayre Model Fabrication Scott Barrie Booster Fuel Mechanical Design Stanley Blattner Model Fabrication Jodie Boyce Model Fabrication Jim Byington Model Fabrication Kevin Clayton Test Fixture Design Jacob Conn Data Analysis John Crepeau University of Idaho Robert Evans Instrumentation & Controls Earl Ferrin Model Fabrication Jim Fisher Thermal Hydraulics Donna Guillen Thermal Hydraulics John Hansen Model Fabrication Lawrnel Harrison Test Fixture Design Frederick Hayner Model Fabrication Dave Herrin Federal Project Director James Hobbs Model Fabrication Roy Jenkins Model Fabrication Jerome Koehler Model Fabrication Glen Longhurst Hydraulic Testing Lead Ramond Mitchell Model Fabrication Robert Mohney Surface Analysis Nathan Oldham Drafting Aaron Orr Idaho State University Thermal Fluids Laboratory Edward Palmer Model Fabrication Bill Phoenix Idaho State University Thermal Fluids Laboratory Gary Powell Model Fabrication Jeff Powell Idaho State University Thermal Fluids Laboratory Bubba Ricker Drafting Wayne Ridgway Project Manager Gary Roberts Quality Engineering Paul Roberts Model Fabrication Mark Russell Structural/Mechanical Engineering Steven Russell Model Fabrication Ali Siahpush Alternatives Analysis Coordinator/Thermal Hydraulics Darren Simper Model Fabrication David Stites Test Fixture Design Tony Wease Model Fabrication Brian Williams Idaho State University

v
ABSTRACT
The Gas Test Loop (GTL) project is for the design of an adaptation to the Advanced Test Reactor (ATR) to create a fast-flux test space where fuels and materials for advanced reactor concepts can undergo irradiation testing. Incident to that design, it was found necessary to make use of special booster fuel to enhance the neutron flux in the reactor lobe in which the Gas Test Loop will be installed. Because the booster fuel is of a different composition and configuration from standard ATR fuel, it is necessary to qualify the booster fuel for use in the ATR. Part of that qualification is the determination that required thermal hydraulic criteria will be met under routine operation and under selected accident scenarios. The Hydraulic Testing task in the GTL project facilitates that determination by measuring flow coefficients (pressure drops) over various regions of the booster fuel over a range of primary coolant flow rates. A high-fidelity model of the NW lobe of the ATR with associated flow baffle, in-pile-tube, and below-core flow channels was designed, constructed and located in the Idaho State University Thermal Fluids Laboratory. A circulation loop was designed and constructed by the university to provide reactor-relevant water flow rates to the test system. Models of the four booster fuel elements required for GTL operation were fabricated from aluminum (no uranium or means of heating) and placed in the flow channel. One of these was instrumented with Pitot tubes to measure flow velocities in the channels between the three booster fuel plates and between the innermost and outermost plates and the side walls of the flow annulus. Flow coefficients in the range of 4 to 6.5 were determined from the measurements made for the upper and middle parts of the booster fuel elements. The flow coefficient for the lower end of the booster fuel and the sub-core flow channel was lower at 2.3.

vi
CONTENTSABSTRACT.................................................................................................................................... v 1.0 INTRODUCTION .................................................................................................................... 1 2.0 Hydraulic Testing...................................................................................................................... 4
2.1 Hydraulic Test Loop ............................................................................................................. 4 2.2 Hydraulic Test Fixture .......................................................................................................... 5 2.3 Model Booster Fuel Assemblies ......................................................................................... 11 2.4 Lower Support Ring............................................................................................................ 12 2.5 Instrumentation and Data Systems...................................................................................... 13 2.6 Testing Procedure ............................................................................................................... 14
3.0 Results..................................................................................................................................... 15 3.1 Primary Flow Data.............................................................................................................. 15 3.2 Measurement Consistency .................................................................................................. 163.3 Flow Velocities ................................................................................................................... 16 3.4 Flow Coefficient ................................................................................................................. 18 3.5 Flow-Induced Vibrations .................................................................................................... 20
4.0 Discussion ............................................................................................................................... 23 4.1 Results of Measurements .................................................................................................... 23
4.1.1 Differential Pressures................................................................................................... 234.1.2 Pitot Tube Measurements ............................................................................................ 24 4.1.3 Flow Coefficients......................................................................................................... 24 4.1.4 Frequency Spectral Data .............................................................................................. 24 4.1.5 Other Observations ...................................................................................................... 25
4.2 Problems Encountered ........................................................................................................ 26 4.2.1 Plate Attachment.......................................................................................................... 26 4.2.2 Contamination.............................................................................................................. 27 4.2.3 Corrosion...................................................................................................................... 28 4.2.4 Weld Failures ............................................................................................................... 29 4.2.5 Electrical Noise............................................................................................................ 29
4.3 Lessons Learned.................................................................................................................. 30 4.4 Needs for Further Study...................................................................................................... 31
5.0 SUMMARY............................................................................................................................ 31 References..................................................................................................................................... 32 APPENDIX A: EXPERIMENTAL PROCEDURES ................................................................... 35 APPENDIX B: DETAILED PRESSURE MEASUREMENT..................................................... 39 APPENDIX C: DYNAMIC PRESSURE MEASUREMENT DATA ....................................... 110 APPENDIX D: STROUHAL NUMBER ANALYSIS............................................................... 119 APPENDIX E: CHEMICAL TREATMENT DETAILS ........................................................... 123

vii
APPENDIX F: PUMP AND CONTROLLER SPECIFICATIONS........................................... 131 APPENDIX G: DESIGN STUDY FOR GTL HYDRAULIC TEST FIXTURE SUPPORT..... 137 APPENDIX H: MEASUREMENTS ON MODEL BOOSTER FUEL PLATES ...................... 149
FIGURES
Figure 1. ATR Lobe fuel configuration with detail at the top of the core, showing ATR driver fuel and booster fuel. ..................................................................................2
Figure 2. Booster fuel element configuration................................................................................3
Figure 3. Elements of the hydraulic test loop................................................................................4
Figure 4. The Hydraulic Testing Fixture is located within a steel column framework.................6
Figure 5. View from the mezzanine showing the upper plenum and inlet manifold (spider) of the Hydraulic Test Fixture. ..........................................................................7
Figure 6. Storage tank and recirculation manifolds of the Hydraulic Test System.......................7
Figure 7. Pump and driver motor for the Hydraulic Test System. ................................................8
Figure 8. Model booster fuel installed in the Mockup Flow Baffle Assembly. ............................8
Figure 9. Hydraulic Test Fixture assembly drawing. Release came after fabrication was complete..................................................................................................................9
Figure 10. Model booster fuel assemblies. The second from left has brackets (inset) to hold the Pitot tubes used to measure flow velocities. ..............................................11
Figure 11. The lower support ring provided vertical support and positioning for the lower ends of the model booster fuel elements............................................................12
Figure 12. View of the lower support ring from below with the model booster fuel elements installed.........................................................................................................12
Figure 13. Differential pressure transducers used in measurements. ............................................13
Figure 14. Locations of pressure sensing ports. Elevations are in inches. ....................................14
Figure 15. Differential pressure measurements corrected for viscosity changes to 107.5 F. See Figure 14 for measurement locations. ....................................................15
Figure 16. Agreement between DP 5 and the sum of DP 1 through DP 4. ...................................16
Figure 17. Flow velocities in the various channels of the model booster fuel assembly.......................................................................................................................17
Figure 18. Locations of the flow channels in the model booster fuel assembly. ..........................17
Figure 19. Flow coefficients derived from flow and pressure-drop data for the model booster fuel elements. ..................................................................................................20
Figure 20. Composite plot of spectral density for the dynamic pressures recorded. ....................21

viii
Figure 21. Motor speed characteristic for the circulation pump. ..................................................22
Figure 22. Mapping of peak frequencies at the various flow rates, believed to be due to vortex shedding........................................................................................................23
Figure 23. Scratch patterns on the surface of model booster fuel elements. .................................26
Figure 24. Pull testing specimen prepared to test glue joint strength............................................27
Figure 25. Pressure testing of the Hydraulic Test Fixture at RTC. ...............................................27
Figure 26. Corrosion on the model flow baffle (left) after pressure testing at RTC, and (right) with the model booster fuel assembly after pressure testing at the ISU Thermal Fluids Laboratory.............................................................................28
Figure 27. Weld on a model booster fuel element that cracked under the chemical treatment for corrosion (left) and after re-welding (right) showing dye penetrant at the pores in the aluminum casting............................................................29
Figure 28. Typical “bumpy” noise in recorded differential pressure data taken over a 10-minute period..........................................................................................................30
TABLES
Table 1. Comparison of combined flows derived from Pitot tube data with that given for the entire flow loop by the turbine meter............................................................................. 18
Table 2. Reference areas used in determining the flow coefficients for the Gas Test Loop Booster Fuel Assembly .................................................................................................. 19
Table 3. Pressure drop calculated through the baffle plate in the Hydraulic Test Fixture upper plenum............................................................................................................................ 19

ix
ACRONYMS
A/D analog-to-digital ATR Advanced Test Reactor BWXT BWXT Nuclear Products Division, Lynchburg VA CPU central processing unit gpm gallons per minute GTL Gas Test Loop hp horsepower INL Idaho National Laboratory ISU Idaho State University L/s liters per second rpm revolutions per minute RC resistance-capacitance RTC Reactor Technology Complex UI University of Idaho

1
1.0 INTRODUCTION The Gas Test Loop (GTL) project was initiated in June 2004 as a means for providing fast-flux neutron irradiation testing capability for development of advanced fuels and materials for the world nuclear community.1-4 After a survey of many possible hosts for this capability, it was found that the most suitable host is the Advanced Test Reactor (ATR) at the Idaho National Laboratory (INL). To meet the performance criteria of a fast neutron flux (E > 0.1 MeV) greater than 1.0 x 10¹⁵ n/cm2/s and a fast-to-thermal neutron flux ratio greater than 15, it was found necessary to augment the ATR fuel with high uranium density booster fuel, to be located just inside the flow baffle in one of the corner lobes of the ATR. This concept is shown in Figure 1.
A booster fuel assembly consists of three curved plates, each with an overall thickness of 2.54 mm (0.100 ina), consisting of a 1.01-mm (0.040-in) thick meat region, containing U3Si2enriched to 93% 235U mixed with aluminum dispersant powder, and clad on each side with 0.762-mm (0.030-in) aluminum cladding. Uranium density in the meat sections ranges from 2 to 4.8 g/cm3 with the highest fuel density in the inner-most plate. These are configured into four quadrant booster fuel elements, depicted in Figure 2, that consist of side plates of aluminum, holding the three fuel plates, and end caps at the top and bottom for strength and positioning of the fuel elements in the flow baffle.
Because this constitutes a new fuel form for the ATR, it is necessary to qualify the booster fuel for service in the ATR. Among the issues to be resolved are providing assurance that the fuel is coolable by the ATR primary coolant, that it will not substantially increase risk to the workers or to the public; and that it will be hydrodynamically stable and that flow-induced vibrations will not cause mechanical deterioration or failure of the fuel in service.
A key parameter in the coolability determination is the flow coefficient or the proportionality constant between the square root of the differential pressure across the length of the booster fuel element and the coolant flow velocity through it. Because it is not now possible or practical to obtain reliable flow coefficient data from analysis alone, it was found necessary to determine this parameter by experiment. These experiments were performed with unheated, non-fuel-bearing mockup fuel plates made from 6061-T6 aluminum. The hydraulic testing performed as part of the GTL program is to gather information that will enable determination of booster fuel coolability.
The flow testing was performed under a subcontract with the Institute for Nuclear Science and Engineering (INSE), a cooperative venture involving Idaho State University (ISU) and the University of Idaho (UI). The effective date for that subcontract was September 22, 2005, essentially at the end of FY-2005. A collaborative effort was provided by the GTL program at the INL. This report documents the activity on the Hydraulic Testing task.
a Extensive use of English units in this report reflects the fact that the experiment design and measurements were mostly made in that system and that much of the analysis of the Gas Test Loop continues to be done in those units.

2
Figu
re 1
. ATR
Lob
e fu
el c
onfig
urat
ion
with
det
ail a
t the
top
of th
e co
re, s
how
ing
ATR
driv
er fu
el a
nd b
oost
er fu
el.
ATR
DR
IVE
R F
UE
L
BO
OS
TER
FU
EL
FLU
X T
RA
P B
AFF
LE

3
Figu
re 2
. Boo
ster
fuel
ele
men
t con
figur
atio
n.
4
2.0 Hydraulic Testing The principal objective of the hydraulic testing task was to calculate the flow coefficients for various sections of the booster fuel using data obtained by measuring the flow-rate of water through a model booster fuel assembly as a function of differential pressure across those sections. The expectation is that the flow-rate will be found proportional to the square root of the pressure drop across the section. Differential pressures were measured for flow rates through the test section ranging from 12.6 to 43.5 L/s (200 to 690 gpm).
Other measurements can also be made using this system. One is the evaluation of flow-induced vibrations in the fuel elements. Another is verification that hydraulic loads do not induce buckling of the fuel plates.
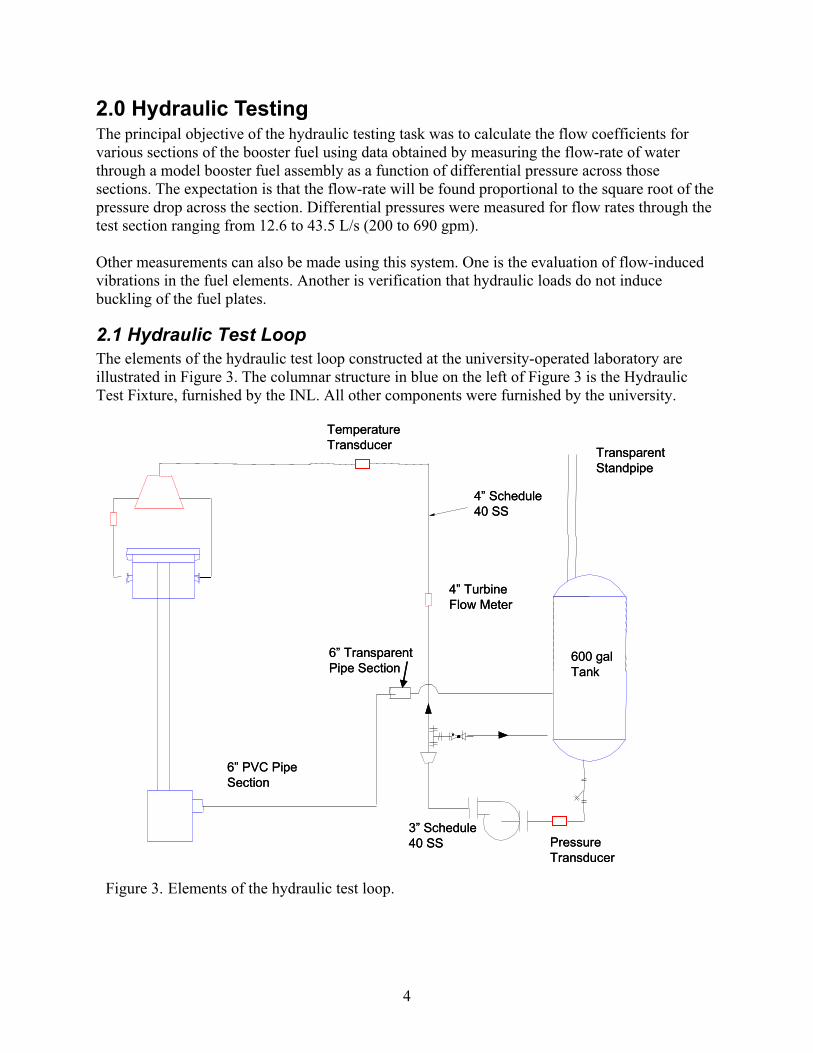
2.1 Hydraulic Test Loop The elements of the hydraulic test loop constructed at the university-operated laboratory are illustrated in Figure 3. The columnar structure in blue on the left of Figure 3 is the Hydraulic Test Fixture, furnished by the INL. All other components were furnished by the university.
Figure 3. Elements of the hydraulic test loop.
Temperature Transducer
4” Schedule 40 SS
Transparent Standpipe
Pressure Transducer
3” Schedule 40 SS
4” Turbine Flow Meter
6” Transparent Pipe Section
600 gal Tank
6” PVC Pipe Section
Temperature Transducer
4” Schedule 40 SS
Transparent Standpipe
Pressure Transducer
3” Schedule 40 SS
4” Turbine Flow Meter
6” Transparent Pipe Section
600 gal Tank
6” PVC Pipe Section

5
Beginning at the right in Figure 3, a 2.27-m3 (600-gallon) water tank serves as a reservoir for the water that circulates in the system. It features a stand-pipe that extends to a distance of approximately 4.3 m (14 ft) above the floor. Because the pressure in this tank is regulated by the water level in the stand-pipe, the main function of the reservoir is to increase the thermal mass of the circulating water, allowing it to maintain lower temperatures longer under the input of mechanical work from the pump.
The pressure transducer is a safety device. A low pressure reading on this instrument would cause a trip in power to the pump.
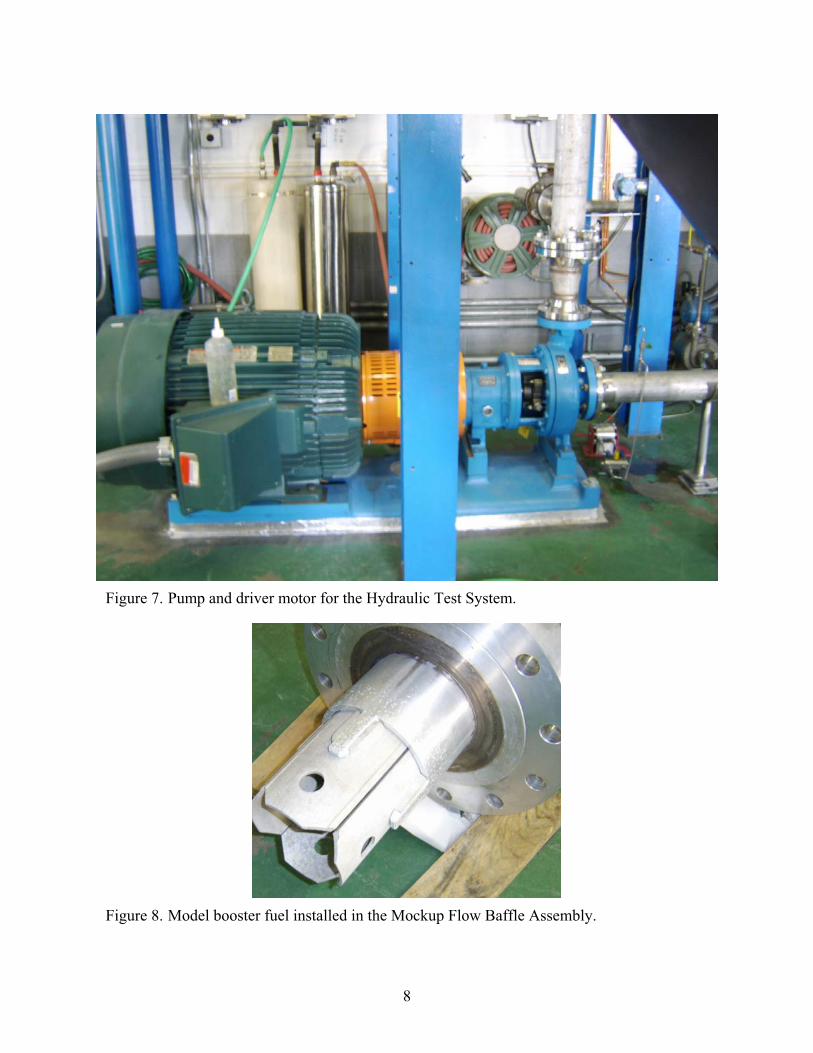
The pump is a Goulds Model 3196 MTX with a rated capacity of 47.3 L/s (750 gpm). The inlet duct is 4 inch pipe, and the outlet is 3 inch pipe. It can develop a head of 109 m (358 ft) and is 72% efficient at 3560 rpm. It is driven by a 93.3-kW (125-hp), 3-phase, 460-V electric motor. The motor is controlled by a PumpSmart PS75 controller that allows ramp-up and ramp-down power combined with actively controlled steady-state power using feedback from either a flow meter or differential pressure indicator. Specifications for the pump and controller are in Appendix F.
After a shunting connection back to the tank, the next two elements are instruments. First is a 4-inch pipe turbine flow meter, Flow Technology’s FT 64, rated from 7.88 to 78.8 L/s (125 to 1,250 gpm). Measurement precision with this instrument is ±0.63 L/s (±10 gpm). The temperature sensor shown is a simple thermocouple to indicate water temperature.
The water then enters an upper plenum where it parts into four 2 ½-inch pipe headers before entering the INL-furnished Hydraulic Test Fixture. Flow control is provided by the motor controller.
A transparent duct section is placed in the loop to allow visual observation of any entrained air bubbles that may be circulating with the water. This provides a confirmatory observation to assure that flow through the model booster fuel elements is single phase. A conical filter consisting of perforated steel plate lined with 100 mesh stainless steel screen was placed at the inlet to the transparent section.
Figures 4 to 8 show the Hydraulic Testing System installed in the laboratory.
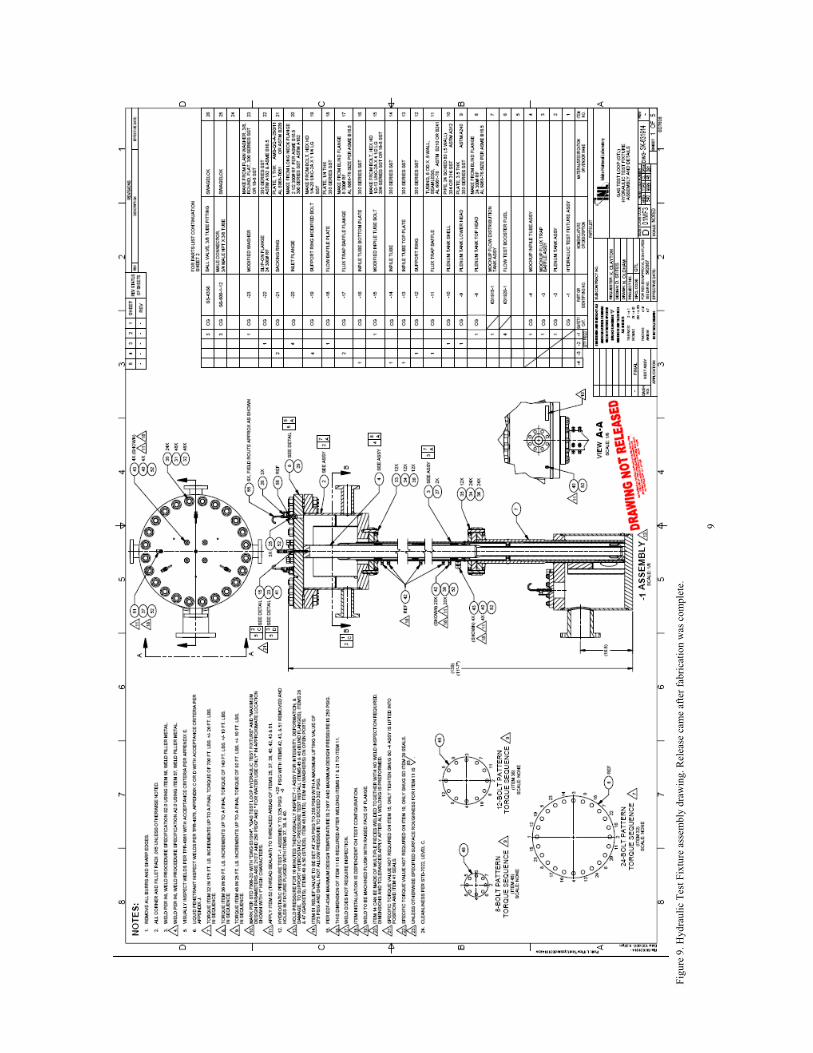
2.2 Hydraulic Test Fixture The Hydraulic Test Fixture is the part of the hydraulic test loop that replicates portions of the ATR. Designed and constructed at the INL, this part of the system generates flow conditions past the model booster fuel assembly typical of those expected in the reactor. It is shown schematically in Figure 9.
There are three main substructures in the Hydraulic Test Fixture. Lowermost is the Mockup Flow Distribution tank assembly. This part represents the flow path seen by the primary coolant in the ATR after it passes the active core on its way down. Water is collected in the plenum for return to the storage tank.

6
Figure 4. The Hydraulic Testing Fixture is located within a steel column framework.
Above that is the Mockup Flux Trap Baffle Assembly. This section represents the flux trap baffle in the ATR lobe and provides not only a housing for the model booster fuel elements, but it also serves as the outer boundary of the water flow path. Projections on the top of the Mockup Flux Trap Baffle Assembly provide attachment points for the dovetail structures on the top of the model booster fuel (Figure 8).

7
Figure 5. View from the mezzanine showing the upper plenum and inlet manifold (spider) of the Hydraulic Test Fixture.
Figure 6. Storage tank and recirculation manifolds of the Hydraulic Test System.
8
Figure 7. Pump and driver motor for the Hydraulic Test System.
Figure 8. Model booster fuel installed in the Mockup Flow Baffle Assembly.
9
Figu
re 9
. Hyd
raul
ic T
est F
ixtu
re a
ssem
bly
draw
ing.
Rel
ease
cam
e af
ter f
abric
atio
n w
as c
ompl
ete.

10

11
The Plenum Tank Assembly is uppermost. There water from the pump is admitted through 4 separate manifolds to reduce swirl, is passed up through a perforated plate, also to reduce swirl, and then travels down through the model booster fuel.
2.3 Model Booster Fuel Assemblies Model booster fuel assemblies (Figure 10) were fabricated from aluminum. Each of these has three “fuel” plates made from sections of a 6061-T6 aluminum tube machined to radius, thickness, length, and surface finish. While it is not critical that surface finish on the simulated fuel plates be identical with that of the actual booster fuel elements to be fabricated by BWXT, it has been shown5 that a finish of 1.34 m (53 micro-inches) or better (the specification for ATR driver fuel) is sufficient to give reasonable flow coefficients. Model fuel plates were machined from 6061-T6 tubing to inner and outer radii, polished as needed for surface finish, and then parted into quadrants. They were cemented into grooves in side plates using an anaerobic cement (Loctite – 648™).6 End boxes were cast from aluminum casting alloy 356.0-T71 using an investment casting technique, welded to the side plates, and then finish machined where needed.
Figure 10. Model booster fuel assemblies. The second from left has brackets (inset) to hold the Pitot tubes used to measure flow velocities.

12
2.4 Lower Support Ring Vertical support and positioning of the model booster fuel assemblies in the fixture was provided by the lower support ring (Figures 11, 12). This complex structure was fabricated from 304 stainless steel. Electro-discharge machining was used to shape the complex surfaces that interface with the end box castings on the model booster fuel assemblies. It was bolted into the model flow baffle assembly.
Figure 11. The lower support ring provided vertical support and positioning for the lower ends of the model booster fuel elements.
Figure 12. View of the lower support ring from below with the model booster fuel elements installed.

13
2.5 Instrumentation and Data Systems The main instrumentation used with this system is the set of differential pressure transducers that measure pressure differences between various points in the Hydraulic Test Fixture and the differential pressures associated with the Pitot tubes. To that were added a trio of standard pressure transducers for measuring point gage pressures, a high frequency dynamic pressure transducer, a turbine flow meter to gage the total circulating flow and a thermocouple to register the water temperature, which rises during system operation.
A total of 9 differential pressure transducers were used (Figure 13). These were Omega PX771A units of different ranges from 24.9 kPa (100 inches of water) to 2.07 MPa (300 psid). Figure 14 shows the pressure sampling points for the various pressure transducers. Differential pressures (DP 1 to DP 5) were measured from the upper point to the lower points indicated in that figure. The upper point for DP 1 and DP 5 was midway across the gap between the cast upper cap and the top of the model booster fuel plates (see zone D-6/7 in Figure 2). The lower point for DP 3 was in the gap between the bottom of the model booster fuel plate and the top of the cast bottom cap (see zone D-4/5 in Figure 2). Measurements DP 6 – 9 were the Pitot tubes with the reference pressure tap at the same elevation (2.5 cm / 1 inch above the bottom of the model booster fuel plate) as the Pitot tube tips. That was also the upper sampling point for DP 3. Inlet, Suction, and
Figure 13. Differential pressure transducers used in measurements.

14
Figure 14. Locations of pressure sensing ports. Elevations are in inches.
Dynamic pressure sensors were gage readings relative to local atmosphere. One other pressure transducer was at the pump outlet, but it was used for pump motor speed control, and no digital data were recorded for it. The dynamic pressure sensor was at mid-height on the model fuel plates (1.96 m, 77.2 inches). The differential pressure transducers were powered with 2 standard 9-V batteries connected in series after it was found that the power supplied by the Elkor ET420 current receivers was so noisy that aliasing appeared in the analog-to-digital conversion.
All instruments were calibrated by the INL Calibration Laboratory before use.
2.6 Testing Procedure The detailed testing procedure used in testing appears below as Appendix A. Basic operations consisted of turning on the data acquisition system, starting the pump at low speed and bleeding off entrapped air, re-establishing standpipe head, setting the motor to operate at one of ten pre-selected operating flow rates (random selection), after flow reached steady state collecting data at 10 samples per second for 5 minutes and dynamic data at 5000 points per second for 2 seconds, capturing the data to Excel™ - compatible data files, and going on to the next operating pressure.

15
Testing at all ten of the operating points thus took only about an hour to complete. In earlier tests, data collection continued for 10 minutes at each operating point. After about an hour, when water temperatures neared the 140 F mark, testing was stopped, and the system was drained and refilled with de-ionized water.
3.0 Results Appendix B contains detailed measurement data. Several summary displays are presented here.
3.1 Primary Flow Data One of the main test objectives was the determination of pressure drops over the model booster fuel elements as a function of flow rate. Figure 15 shows the locus of the differential pressure measurements as the flow rate through the test fixture was varied. Inlet and Suction pressures are gage pressures relative to atmospheric pressure. These data have been corrected for viscosity changes to 58.6 C (107.5 F). Tests were made at water temperatures ranging from 32.3 to 58.6 C (90.2 to 107.5 F). Over that range, the kinematic viscosity changes by 25%. Reynolds numbers in these experiments range from 15,000 to 60,000, well into the turbulent flow regime. Pressure drop is inversely proportional to the fourth root of the Reynolds number or directly proportional to the fourth root of viscosity.7 The pressure measurements were corrected by that amount in the figure. Uncertainties in pressure measurements were generally less than the symbol height in the figure.
-20
0
20
40
60
80
100
120
140
160
180
200 300 400 500 600 700 800
Total Flow Rate (gpm)
Pre
ssur
e (p
sid)
InletDP1DP2DP3DP4DP5Suction
Figure 15. Differential pressure measurements corrected for viscosity changes to 107.5 F. See Figure 14 for measurement locations.
It is interesting that the differential pressure DP 3 is negative at all flow rates, indicating pressure recovery from a point approximately 2.5 cm (1 inch) above the bottom of the model fuel plates to the middle of the gap between the bottom of the model booster fuel plates and the lower cap. There is a significant increase in flow area as the water travels from the upper to the lower

16
pressure measurement point. Flow velocities at the lower point are much lower than they are at the upper point. Hence, from the Bernoulli effect, the static pressure should be higher there, and a pressure recovery would be expected.
3.2 Measurement Consistency A check built into the experiment was the agreement of the DP 5 measurement with the sum of measurements DP 1 through DP 4 (See Figure 14). Over all flows but the highest, that agreement was reasonably good, as shown in Figure 16. At the highest flow rate (not shown in the figure), the transducer for DP 5 exceeded its range, so that data point is invalid. Because the data for the various transducers were all taken at the same temperature for each flow rate, no temperature correction was applied to the data for this comparison. The differences are on the order of the uncertainty of the measurements.
-4
-2
0
2
4
6
8
200 300 400 500 600 700
Flow Rate (gpm)
Diffe
renc
e (%
)
Figure 16. Agreement between DP 5 and the sum of DP 1 through DP 4.
A further measurement consistency to be shown later is the good agreement between indicated flow rates in the channels between the model fuel plates and the total flow through the hydraulic test loop indicated by the turbine flow meter near the pump outlet.
3.3 Flow Velocities Flow velocities from Pitot tube measurements in the four flow channels of the instrumented booster fuel element are shown graphically in Figure 17 as a function of head loss across the model booster fuel element (DP 5 in Figure 14). These are obtained from the formula8
P2u (1)
where P is the differential pressure measured by the Pitot tube and is the fluid density. These differential pressures were not corrected for viscosity changes because no friction is
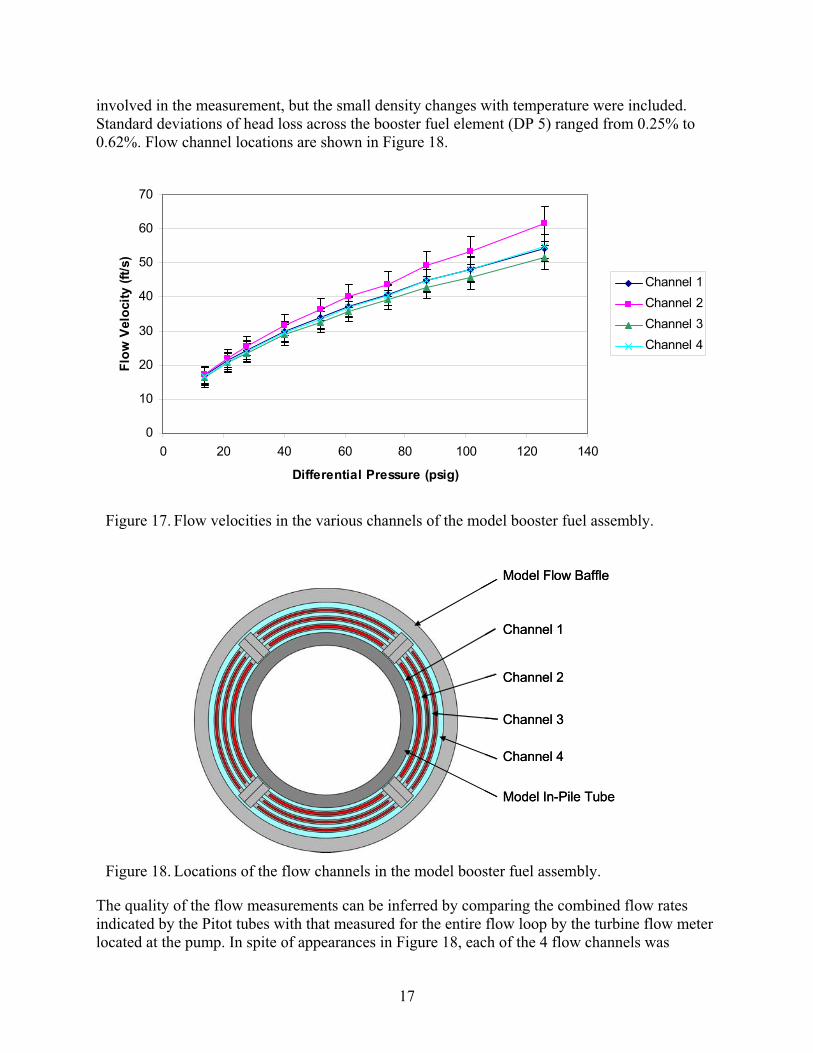
17
involved in the measurement, but the small density changes with temperature were included. Standard deviations of head loss across the booster fuel element (DP 5) ranged from 0.25% to 0.62%. Flow channel locations are shown in Figure 18.
0
10
20
30
40
50
60
70
0 20 40 60 80 100 120 140
Differential Pressure (psig)
Flow
Vel
ocity
(ft/s
)
Channel 1Channel 2Channel 3Channel 4
Figure 17. Flow velocities in the various channels of the model booster fuel assembly.
Model Flow Baffle
Channel 1
Channel 2
Channel 3
Channel 4
Model In-Pile Tube
Model Flow Baffle
Channel 1
Channel 2
Channel 3
Channel 4
Model In-Pile Tube
Figure 18. Locations of the flow channels in the model booster fuel assembly.
The quality of the flow measurements can be inferred by comparing the combined flow rates indicated by the Pitot tubes with that measured for the entire flow loop by the turbine flow meter located at the pump. In spite of appearances in Figure 18, each of the 4 flow channels was

18
designed to have a channel width of 0.078 inch. The flow areas calculated for the respective channels using that channel width are 0.211, 0.230, 0.252, and 0.274 in2, respectively. Table 1 provides the comparison of flows from Pitot tube measurements with the flow indicated by the turbine flow meter. The next to last column is the sum of the four Pitot tube measurements multiplied by 4. It does not account for flow that passes through the small gaps between the booster fuel assembly sections. Hence, it is not surprising that the difference is negative. Using a larger flow channel thickness to account for material removed by the chemical etching process gives less of a difference, but it neglects flow between the four model booster fuel sections.
Table 1. Comparison of combined flows derived from Pitot tube data with that given for the entire flow loop by the turbine meter.
Turbine Pitot Tubes Meter Channel 1 Channel 2 Channel 3 Channel 4 Total x 4 Difference (gpm) (gpm) (gpm) (gpm) (gpm) (gpm) (%)
203.8 11.2 12.4 12.8 14.1 202.0 -0.90 255.8 14.0 15.7 16.2 17.8 254.9 -0.36 294.7 16.0 18.3 18.5 20.4 293.1 -0.57 365.4 19.7 22.8 22.6 25.1 360.8 -1.25 415.8 22.3 26.1 25.6 28.5 410.2 -1.36 461.5 24.5 28.8 28.1 31.5 452.0 -2.07 502.4 26.8 31.4 30.7 34.5 493.5 -1.76 561.2 29.5 35.2 33.6 38.2 546.1 -2.68 601.9 31.7 38.1 35.9 41.0 587.0 -2.47 690.4 35.8 44.0 40.4 46.6 667.2 -3.36
3.4 Flow Coefficient The flow coefficient sought for thermal hydraulic calculations is the ratio of the head loss, P ,in a flow segment to the dynamic head in that section.
PQA
uPKf 2
2
222 (2)
where is the fluid density, u is its velocity, A is the flow area, and Q is the volumetric flow rate in the channel.9 For a structure with simple geometry such as an orifice or other structure with a well defined flow area, then the volumetric flow rate of the fluid passing through the structure is sufficient to provide the flow velocity, u, and either form in Eq.(2) may be used. For more complex geometries where only the volumetric flow rate is known, a reference area must be defined.
There are four regions in the booster fuel assembly where fK is of interest in thermal-hydraulic modeling. One is over the upper end cap of the booster fuel element. The second is through the four channels surrounding the fuel plates. The third is over the lower end cap, and the fourth is through the mockup flow distribution tank or the structure between the end of the booster fuel element and the open lower plenum. Because there are no pressure data at the end of the lower cap, the flow coefficients of the last two regions must be combined. For present purposes, the reference areas are assumed to be those listed in Table 2.

19
Table 2. Reference areas used in determining the flow coefficients for the Gas Test Loop Booster Fuel Assembly
Zone Description Basis Area (in2)1 Upper end cap Quadrant flow area (1/4 of flow annulus between
flow baffle and in-pile tube 1.618
2 Fuel plate channel 1 Arc length of 2.710 inches and channel width of 0.078 inch.
0.211
3 Fuel plate channel 2 Arc length of 2.948 inches and channel width of 0.078 inch.
0.230
4 Fuel plate channel 3 Arc length of 3.227 inches and channel width of 0.078 inch.
0.252
5 Fuel plate channel 4 Arc length of 3.507 inches and channel width of 0.078 inch.
0.274
6 Lower end cap and distribution tank
Flow annulus between flow baffle and in-pile tube
6.474
The pressure loss in zone 1, over the upper cap, will be the inlet pressure (see Figure 14) minus the combination of suction pressure and DP 5, plus a static head of 2.47 m (96.7 inches), and less the pressure drop through the orifice plate. The static head referred to is the elevation difference between the inlet and suction pressure sensors. Using the methods of Idelchik,10 pressure losses through the perforated baffle plate were calculated as a function of volumetric flow rate through the system. The results are in Table 3. The loss through the baffle plate is a small fraction of the overall pressure drop measured by DP 5. It is a more significant fraction of the drop over the upper cap on the model booster fuel assembly, and it is subtracted from the measurements in calculating the flow coefficient for Zone 1.
Table 3. Pressure drop calculated through the baffle plate in the Hydraulic Test Fixture upper plenum.
Flow rate (L/s) / (gpm)
Plate pressure drop (kPa) / (psi)
DP 5 reading (kPa) / (psi)
Plate fraction (%)
12.9 / 203.8 1.50 / 0.22 94.33 / 13.68 1.6 16.1 / 255.8 2.37 / 0.34 142.10 / 20.61 1.7 18.6 / 294.7 3.14 / 0.46 183.25 / 26.58 1.7 23.0 / 365.4 4.83 / 0.70 269.95 / 39.16 1.8 26.2 / 415.8 6.25 / 0.91 340.56 / 49.40 1.8 29.1 / 461.5 7.70 / 1.12 412.78 / 59.87 1.9 31.7 / 502.4 9.12 / 1.32 479.60 / 69.57 1.9 35.4 / 561.2 11.38 / 1.65 589.95 / 85.57 1.9 38.0 / 601.9 13.10 / 1.90 665.82 / 96.58 2.0
The pressure loss over the fuel plate elements, zones 2 through 5, will be DP 2 plus DP 1 and DP 3. Static head differences here are inconsequential because the leads to the differential pressure transducers bring the fluid to the same elevation on each side of the sensing diaphragm. The pressure loss in zone 6, over the lower cap and through the distribution tank will be DP 4 .

20
Flow coefficients were calculated for each zone at each of the 10 flow rates. The results appear graphically in Figure 19. As expected, the loss through Zone 6 is much lower than the others because it has the shortest flow length with reduced area. Zone 1 losses are higher. It is not clear why the right-most data point on the Zone-1 curve shows such marked departure from the others in that curve. Discussion on the non-uniformity of the flow coefficients for the fuel plate sections (zones 2 through 5) will be given in Section 4 below.
0
1
2
3
4
5
6
7
8
200.0 300.0 400.0 500.0 600.0 700.0
Flow Rate (gpm)
Flow
Coe
ffici
ent Zone 1
Zone 2Zone 3Zone 4Zone 5Zone 6
Figure 19. Flow coefficients derived from flow and pressure-drop data for the model booster fuel elements.
Surface roughness was measured on the model booster fuel plates. Measurements were made using a PocketSurf profilometer on both inner and outer surfaces of the machined model booster fuel plates before assembly and again on the inner surface of the innermost plate and the outer surface of the outermost plate after the chemical treatment had been performed on the assembled fuel plates. The average roughness in the latter case was 43.2 ±7.6 micro-inches. This was about 50% greater than for the as-machined plates, but it is well within the specification of 63 micro-inches for the booster fuel11 and for the ATR driver fuel.12 Appendix H has the roughness data.
3.5 Flow-Induced Vibrations The dynamic pressure sensor, located at the vertical mid-point of the model booster fuel, recorded high-speed data in an attempt to examine drivers for flow-induced vibrations in the model booster fuel element. Discrete Fourier transform analysis was performed on those data to obtain the frequency spectral density of the pressure oscillations for each of the 10 flow rates. This process and the detailed spectral data are presented in Appendix C. Figure 20 shows a composite plot of the results.

21
0314
628942
12571571
18852199
25132827
31423456
37704084
43984712
200 gpm
600 gpm
0
200
400
600
800
1000
1200
Spec
tral
Den
sity
Frequency (Hz)
Impeller Blade Peaks
Figure 20. Composite plot of spectral density for the dynamic pressures recorded.
There is a prominent range of peaks beginning at about 115 Hz for the front-most data set (203.8 gpm) and increasing to about 360 Hz for the rearmost data set (690 gpm), highlighted by the embedded frame. These peaks correspond with the frequency at which the impeller blades passed the pump outlet. Figure 21 shows the correlation of pump motor speed, S, with measured flow rate. The fit line is
945.100001.017.0 SSgpmQ (3)
With 6 impeller blades, the blade frequency in Hz is exactly one tenth the motor speed in rpm. Thus, for 203 gpm, the motor speed was 1,153 rpm. The corresponding frequency of the peak associated with blade passage at that flow rate is 115.3 Hz. These peaks are identified with vertical lines in the spectral plots in Appendix C.

22
0
100
200
300
400
500
600
700
800
0 1000 2000 3000 4000
Motor Speed (rpm)
Flow
Rat
e (g
pm)
MeasuredFit Line
Figure 21. Motor speed characteristic for the circulation pump.
Another set of prominent peaks in Figure 20 is in the 1,000 to 1,800 Hz range. At the lower flow rates, these peaks are much smaller and minor peaks are present at higher and lower frequencies. These are believed to be due to vortex shedding at the inlet to the model fuel plate channels. To see this more clearly, Figure 22 plots peak frequencies with flow rates. Also shown there are two theoretical predictions of vortex shedding frequency, one based on the geometry of the top cap trailing edge and the other on the geometry of the trailing edge of a fuel plate. These models are based on Strouhal number analysis (Appendix D) for vortex shedding from trailing edges. Another process known but not discussed further here is vortex shedding due to separating and reattaching shear layers at the leading edge of the fuel plates.
At higher flow velocities, the prominent peak frequencies follow a very linear relationship, offset from but at nearly the same slope as the fuel plate channel geometry theoretical values. At lower flow rates, the major peaks have a marked departure from that line, even though there are minor peaks nearly on the line, as shown in the figure. The cause of this low-flow-rate behavior remains to be determined.

23
0
200
400
600
800
1000
1200
1400
1600
1800
2000
0 200 400 600 800
Flow Rate (gpm)
Freq
uenc
y (H
z)
Major PeakMinor Peak HigherMinor Peak LowerFit LineFuel ChannelGap
Figure 22. Mapping of peak frequencies at the various flow rates, believed to be due to vortex shedding.
The only other persistent pattern detected in the spectral data was a peak at about 60 to 90 Hz that exists in all the cases, at a greater or lesser intensity. Although there is some variability with flow rate, it is more likely that this series of peaks is due to electrical noise in the measurement system.
The presence of other strong peaks at low frequencies, particularly at intermediate flow rates, is suspected to be due to mechanical vibration associated with the pumping system. Vibrations could clearly be felt with hand contact throughout the flow system. For example, during operations, there was a distinct resonance noise present at 350 gpm. The relatively strong peak at 408 Hz in the 365-gpm spectral density curve (Appendix C, also the lowest triangle in Figure 21) may be a harmonic on the impeller blade frequency of 199.2 Hz there.
4.0 Discussion
4.1 Results of Measurements
4.1.1 Differential Pressures Results of the differential pressure distributions in the Hydraulic Test Fixture are generally in line with predictions. The drop represented by DP 4, from the bottom of the fuel to the lower plenum was a little greater than had been expected. Because no corresponding drop has been measured in the actual ATR vessel, it is not possible to know how well this model represented the geometry below the fuel, but it should be relatively close.
24
4.1.2 Pitot Tube Measurements The agreement between Pitot tube measurements of flows in the individual channels between the model fuel plates with that given by the turbine flow meter at the pump is remarkably good. Discussion of variances in flow velocities between the flow channels is in the following section.
4.1.3 Flow Coefficients Referring to Figure 19, the flow coefficients for zones 1 and 6 in Figure 19, are quite uniform and level over the range of flows measured. That the flow coefficient for Zone 6 is lower is consistent with the length of the constriction in the flow channel (over the end caps) being shorter at the lower end of the model fuel element than at the upper end.
The flow coefficients for Zones 2 through 5, the channels between the model fuel plates, are similar in shape and values as expected. The flow coefficient for Zone 3 is clearly lower than those for the other flow channels between the plates. One hypothesis for the lower flow coefficient is higher flow velocity there due to greater flow channel thickness. In addition to surface roughness data, Appendix H contains inspection data travelers for the measurements of the flow channel thicknesses. Element 2 was the model booster fuel element instrumented with Pitot tubes. For Element 2 after assembly but before chemical treatment, the diameter of the gage that would not go between plates 1 and 2 was 0.077 inch at the top and 0.080 inch at the bottom. The same numbers for the channel between plates 2 and 3 were 0.076 inch and 0.075 inch. This difference is enough to account for the greater flow velocity seen between plates 1 and 2 compared with that between plates 2 and 3 and elsewhere. Measurements of channel thickness after chemical treatment were not made with the same resolution as those before the treatment. After treatment, all the channels would admit a 0.078-inch gage but not a 0.085-inch gage. We suppose the loss of material from the model fuel plates was uniform over all the plates, so the opening in the channel associated with Zone 3 would still be larger than the others.
The curvature of these flow coefficients at lower flow rates appears to be due mainly to the transition from wholly rough wall flow to smooth wall flow. More specifically, the Reynolds number based on flow channel hydraulic radius of 0.96 mm (0.038 inch) at 22 L/s (350 gpm) is approximately 53,000. From the Moody diagram,13 the ratio of surface roughness to hydraulic radius (e/d) at which the friction factor becomes insensitive to Reynolds number (wholly rough wall flow) is about 6.0E-04 to 1.0E-03. For these plates, surface roughness measurements after chemical treatment yields e/d = 5.5E-04. Therefore, it seems likely that the curvature of the lines for the flow channels at low flows in Figure 19 is due solely to the transition from the wholly rough zone of the Moody diagram toward more smooth-wall behavior.
4.1.4 Frequency Spectral Data Frequency spectral density data showed clearly the pump impeller speed. At higher flows, strong peaks were observed that are consistent with vortex shedding at the inlets and/or outlets of the fuel plate flow channels. Why these departed from that model at lower flows is not yet know with certainty. It is interesting that there does not appear to be any random jumping of frequencies at the low flows as may be evident if there were a flow instability and different modes were taking over. Rather, the transition seems smooth and orderly, though the points off the line appear to be grouped in the 1,000 to 1,200 Hz band.

25
In Figure 19 it was seen that flow coefficients for the channels between the booster fuel plates increase with decreasing system flow rates below about 22 L/s (350 gpm). This is about the same flow rate at which the spectral peaks in Figure 22 depart from the Strouhal model. It seems possible that these two behaviors, departure from fully rough wall flow and departure from the Strouhal model, are related.
Recall that the dynamic pressure transducer was located about mid-height on the model booster fuel plates, or about 1230 hydraulic radii from the inlet. Because the total hydraulic head must be continuous and monotonically decrease over the flow channel, pressure oscillations seen by the dynamic pressure transducer must be a reflection of passing eddies and/or mechanical vibrations in the structure. At high Reynolds numbers (flows) where the friction factor is insensitive to Reynolds number, surface roughness becomes invisible to the flow, and it is ineffective in damping out eddies generated at the inlet to the flow channel. Hence, one would expect an excellent fit with a vortex shedding model based on channel inlet geometry, as shown in Figure 22. At lower Reynolds numbers, those eddies may be expected to be damped out by the time they pass the pressure transducer, and other system conditions, such as mechanical vibrations, may govern oscillations there. For example, it was observed that a misalignment of the pump motor with the pump induced severe mechanical vibrations to the system that were observed to largely disappear at flow-rates above 22 L/s (350 gpm). It may be seen in Figure 21 that motor speed was about 2,000 rpm or 33 Hz at that flow. The major peaks lying off the model line in Figure 22 are all in the range of 1,000 to 1,200 Hz, so the pump motor itself may not be the driver, but it may be a mechanical vibration resonance in the system that was being excited by the pump misalignment.
4.1.5 Other Observations An interesting observation was made following removal of the model booster fuel elements from the Hydraulic Test Fixture. There were lines or tracks visible on the surface of the model booster fuel plates that appeared to be similar to flow field lines in flow visualization graphics. These are shown in Figure 23.
It appears that during the early operation of the flow test loop, before the particulates were fully removed from the system, circulating particulates carried by the water scratched the surface hydroxide layers on the model booster fuel plate surfaces such that over the course of further testing, those scratches became preferentially corroded, leaving visible tracks.
Besides the existence of these tracks, the interesting thing from Figure 23 is that there appears to be a substantial circumferential component of flow velocity, even at mid-height of the model booster fuel plates. This circumferential component is not visible on the inner plate surfaces where similar tracks appear, but they are fully axial in direction.
The cause of the circumferential flow component cannot be determined with certainty, but it may be due to slight bowing or other deformity in the shape of the model booster fuel element. The element on which this is most evident (the middle one of the three in Figure 23) was Element 1, which was not the one with the Pitot tube rack installed. Tracks in the vicinity of the Pitot tubes were very highly axial in direction.

26
Figure 23. Scratch patterns on the surface of model booster fuel elements.
4.2 Problems Encountered A number of fairly significant problems developed during the course of the project. These will be addressed here in chronological order.
4.2.1 Plate Attachment A concern during design and fabrication of the model booster fuel was the method of attachment of the model booster fuel plates to the side rails. The booster fuel design had assumed that the real booster fuel plates would be swaged in the same manner that plates are swaged into the side walls of the ATR driver fuel elements. This swaging requires very specialized equipment that would not be practical to obtain for this model study. It was decided to glue the plates to the side walls using an anerobically hardening cement, Loctite 648™. Like swaging, the gluing attachment would provide cantilever support at the edges of the plates, which would preserve structural stiffness characteristics in the model. There were two concerns with this approach: (1) would it be strong enough to hold the plates in place under the high flows and in the water environment for our assembly geometry, and (2) would the welding process required to attach the end caps after assembly of the plates to the side rails cause a deterioration in the strength of the cement.
To resolve this issue, a number of pull tests were conducted on samples made of the same 6061-T6 aluminum from which the plates and side rails were made. These were nominally 3 x 3 x ¼ inch plates the connecting edges of which had been machined to have the same channel and tongue geometry as the model booster fuel assemblies (Figure 24). These were cemented
27
together using the cement alone and using a hardening accelerator provided with the cement. We found that the strength with either type of joint was well above what was needed to hold the plates in place. Strength without the hardener was about 40% greater than with it, but using the hardener gave a cleaner and more predictable result.
To address the heat issue, weld beads were made on some of the samples within about ¾ inch of the joint. Some of those welds were made in air and others were made with the joint immersed in water. We found that strength was significantly deteriorated for the air-welded joints but it was not changed for the samples where the joint was kept cool by the water.
Based on these results, an effort was made to provide a good thermal bond between the side rails and the supporting jig during the welding of the end caps
Figure 24. Pull testing specimen prepared to test glue joint strength.
to the side rails. Analysis showed that the plates would not move in the side rails even if only a few inches of the cemented joint had its full strength.
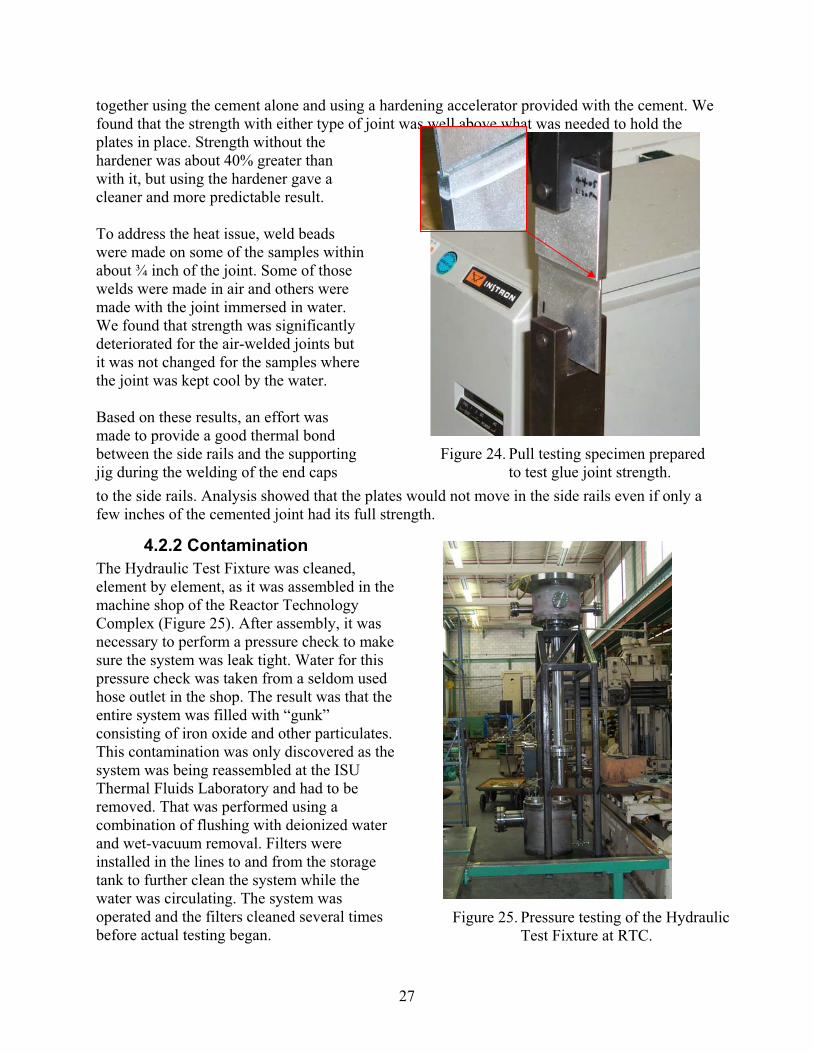
4.2.2 Contamination The Hydraulic Test Fixture was cleaned, element by element, as it was assembled in the machine shop of the Reactor Technology Complex (Figure 25). After assembly, it was necessary to perform a pressure check to make sure the system was leak tight. Water for this pressure check was taken from a seldom used hose outlet in the shop. The result was that the entire system was filled with “gunk” consisting of iron oxide and other particulates. This contamination was only discovered as the system was being reassembled at the ISU Thermal Fluids Laboratory and had to be removed. That was performed using a combination of flushing with deionized water and wet-vacuum removal. Filters were installed in the lines to and from the storage tank to further clean the system while the water was circulating. The system was operated and the filters cleaned several times before actual testing began.
Figure 25. Pressure testing of the Hydraulic Test Fixture at RTC.

28
4.2.3 Corrosion The water from the pressure test was left in the system for about 10 days. When the system was disassembled for shipment it was found that the inside of the model flow baffle assembly and the outside of that assembly that was in contact with water had become rather highly corroded. This was the result of the natural galvanic couple between the iron in the stainless steel forming the upper and lower plena and other structures with the aluminum. The contamination from the water provided the electrolytic conductor that facilitated the material movement. Our belief at that time was that if only deionized water were used in the system after cleaning and reassembly, the corrosion would not take place at a rate that would be detrimental.
The system was cleaned and flushed repeated with deionized water during its assembly at the ISU Thermal Fluids Laboratory. The assembly procedure required that the instrumented model booster fuel assembly be installed before the system was fully assembled. When assembly was complete, the system was again pressure tested. This time it was done with deionized water. The water was quickly removed, but not all the water came out, and the system was left damp for a period of three or four days. When it was disassembled, it was found that the upper cap of the instrumented model booster fuel element had become corroded, and the corrosion on the model flow baffle had become worse. Figure 26 shows the extent of that corrosion.
Figure 26. Corrosion on the model flow baffle (left) after pressure testing at RTC, and (right) with the model booster fuel assembly after pressure testing at the ISU Thermal Fluids Laboratory.
Our conclusion was that there had been enough residual contamination in the system that the deionized water could not maintain adequately low electrical conductivity. We determined that we had to provide a hydroxide coating on the model booster fuel elements and on the interior of the model flow baffle to prevent their corrosion during testing that would alter the surface roughness of the test articles and partially invalidate flow coefficient data. The procedure for doing that appears as Appendix E. It involved cleaning the aluminum surfaces in nominally 2 M NaOH, etching them in 10% HNO3, and then boiling them in 8 to 8.5 pH NaOH solution. That

29
appeared to solve the corrosion problem. The three model booster fuel elements that had not experienced corrosion did not appear to be corroded when they were removed from the system following the experiments, except for the tracks from particulate scratches mentioned above.
4.2.4 Weld Failures After the chemical treatment just described, it was found that one of the end caps had broken free of the model booster fuel element to which it had been welded. Examination of the other welds on those elements showed moderate to severe cracking. These welds had been visually inspected by a quality engineer at the time of fabrication with no defects found. Our conclusion was that the chemical process had caused corrosion cracking of the weld joints.
The model booster fuel elements were returned to the fabrication facility (North Holmes Laboratory) where the welds were all remade. Following the welding, dye penetrant inspection was performed by a quality engineer, and the welds were all found to be intact and of high quality. Figure 27 shows a cracked weld after the chemical treatment and the repaired weld with the dye penetrant visible at pores in the aluminum casting.
Figure 27. Weld on a model booster fuel element that cracked under the chemical treatment for corrosion (left) and after re-welding (right) showing dye penetrant at the pores in the aluminum casting.
Because the re-welding process destroyed the hydroxide coating on the region near the welds and elsewhere, it was necessary to repeat the coating process. This time, the chemicals were applied for only one minute each during the cleaning, but boiling for the full 5 minutes or more was performed. After this treatment, the welds were again visually inspected. There was some visual hint of attack, but moderate flexing of the joints, less than the amount that would distort them, gave confidence that the welds would hold for the flow testing. Following the hydraulic testing, each of the welds was again inspected using dye-penetrant techniques. The results showed all the welds to be perfectly intact with no evidence of cracking whatsoever.
4.2.5 Electrical Noise The data acquisition system used in collecting and recording the measurements from the differential pressure transducers and other instruments consisted of a PC running LabView14 with
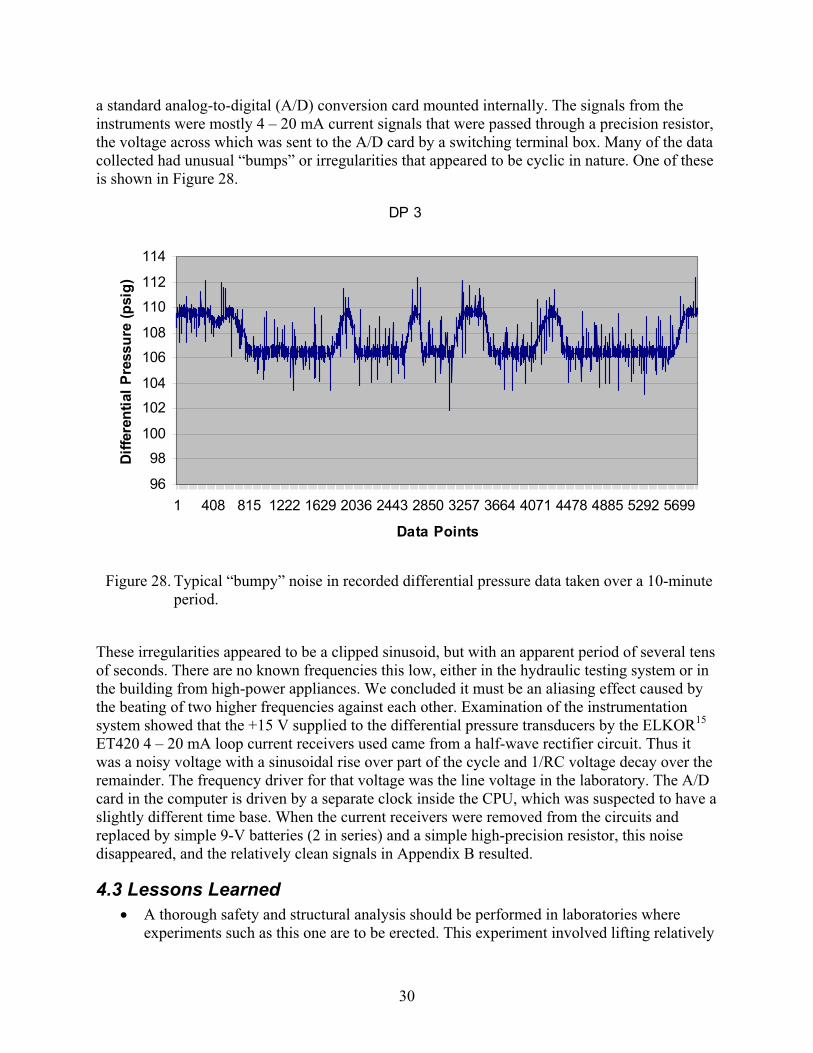
30
a standard analog-to-digital (A/D) conversion card mounted internally. The signals from the instruments were mostly 4 – 20 mA current signals that were passed through a precision resistor, the voltage across which was sent to the A/D card by a switching terminal box. Many of the data collected had unusual “bumps” or irregularities that appeared to be cyclic in nature. One of these is shown in Figure 28.
Figure 28. Typical “bumpy” noise in recorded differential pressure data taken over a 10-minute period.
These irregularities appeared to be a clipped sinusoid, but with an apparent period of several tens of seconds. There are no known frequencies this low, either in the hydraulic testing system or in the building from high-power appliances. We concluded it must be an aliasing effect caused by the beating of two higher frequencies against each other. Examination of the instrumentation system showed that the +15 V supplied to the differential pressure transducers by the ELKOR15
ET420 4 – 20 mA loop current receivers used came from a half-wave rectifier circuit. Thus it was a noisy voltage with a sinusoidal rise over part of the cycle and 1/RC voltage decay over the remainder. The frequency driver for that voltage was the line voltage in the laboratory. The A/D card in the computer is driven by a separate clock inside the CPU, which was suspected to have a slightly different time base. When the current receivers were removed from the circuits and replaced by simple 9-V batteries (2 in series) and a simple high-precision resistor, this noise disappeared, and the relatively clean signals in Appendix B resulted.
4.3 Lessons Learned A thorough safety and structural analysis should be performed in laboratories where experiments such as this one are to be erected. This experiment involved lifting relatively
DP 3
96
98
100
102
104
106
108
110
112
114
1 408 815 1222 1629 2036 2443 2850 3257 3664 4071 4478 4885 5292 5699
Data Points
Diff
eren
tial P
ress
ure
(psi
g)

31
heavy components. That was done safely and effectively, along with the system piping welding, by a professional fabrication firm subcontracted to do the job.
Motor-to-pump misalignment is a serious issue in experiments such as this one. Substantial efforts to assure proper alignment, possibly using laser theodolites, is worth while to eliminate this source of vibration in the system.
Even though aluminum and stainless steel are used in the reactor with impunity, corrosion from the galvanic couple of aluminum and iron is a significant problem in this kind of an experimental apparatus. Hydroxide coating of the aluminum appears to solve the problem.
When performing pressure tests, use only clean water from a controlled source.
The cast aluminum material used for the end caps on the model booster fuel elements is probably not of sufficient quality for use on real booster fuel elements. It is porous and has a much rougher surface than end caps procured by BWXT for the ATR fuel elements. This porosity probably contributed to weld failure under the action of the treatment chemicals. It is probably worth redesign of the booster fuel element such that welding of the end caps is not required if this same material is used in production.
Care should be exercised in designing and installing data collection systems to avoid aliasing such as was found in this work. This is a common problem in the industry. System checkout prior to experiments should check for it.
4.4 Needs for Further Study As indicated above, further design of the booster fuel element should be performed to examine alternate means of attaching the end caps to the booster fuel elements. It may also be necessary to use a method other than swaging to attach the fuel plates to the edge pieces.
We did not see any clear evidence of damage from flow-induced vibrations, but the spectral density of the dynamic pressure data taken behaved in an unusual manner at low flow rates. We did not have good frequency resolution at the comparatively low fundamental frequencies (e.g. 11 Hz) characteristic of mechanical vibrations in the booster fuel elements. It would be worthwhile to perform additional studies, especially tests over long periods of time to ensure that such vibrations would not cause lifetime problems in the booster fuel. This would require a heat exchanger in the flow loop to remove the power put in by the pump and converted to heat in the water, and thus maintain the water temperature at a level compatible with system design. Such tests should be performed with fuel plates containing depleted uranium in the actual configuration so that plate stiffness and density would be fully prototypic.
5.0 SUMMARY A high-fidelity model of the NW lobe of the ATR with associated flow baffle, in-pile-tube, snubber tube, and below-core flow channels was designed and constructed at the Idaho National Laboratory and incorporated into a high volume (700 gpm) circulating loop constructed by the

32
university and located in the Idaho State University Thermal Fluids Laboratory. The circulation loop was designed to provide reactor-relevant water flow rates to the test system. Full-scale detailed models of the four booster fuel elements required for GTL operation were fabricated from aluminum (no uranium or means of heating) and placed in the flow channel. One of these was instrumented with Pitot tubes to measure flow velocities in the channels between the three booster fuel plates and between the innermost and outermost plates and the side walls of the flow annulus.
The objective of these experiments was to measure flow coefficients for the upper, middle, and lower ends of the flow channel containing the booster fuel. Flow coefficients in the range of 4 to 6.5 were determined from the measurements made for the middle part of the booster fuel elements. The flow coefficient for the upper cap region of the booster fuel element was about 3.5. That for the lower end of the booster fuel and the sub-core flow channel was even lower at 2.3. Measurement of these flow coefficients was fully successful and satisfied the objectives of the experiment.
Of the several technical challenges encountered in preparing for and conducting the experiment, the most concerning one was surface corrosion of the aluminum components in galvanic couple with the stainless steel elsewhere in the system. This was overcome by applying a hydroxide coating to the aluminum structures. That treatment apparently caused failure of some of the aluminum welds in the model booster fuel elements. Remaking the welds with a more suitable weld preparation followed by only light chemical treatment appeared to resolve the concern.
Dynamic pressure measurements suggest it would be beneficial to conduct longer-term studies of flow-induced vibrations using fuel plates made with actual depleted uranium. Care should be exercised to remove motor-induced mechanical vibrations from the flow system insofar as it may be possible before conducting such tests.
References
1. U.S. Department of Energy Nuclear Energy Research Advisory Committee and the Generation IV International Forum, December 2002, A Technology Roadmap for Generation IV Nuclear Energy Systems, GIF-002-00.
2. Department of Energy, Office of Nuclear Energy, Science and Technology, June 28, 2004, Justification of Mission Need for the Gas Test Loop, INEEL/EXT-04-02018, Idaho National Engineering and Environmental Laboratory, Idaho Falls, Idaho.
3. G. R. Longhurst, S. T. Khericha, and J. L. Jones, September 2004., “Gas Test Loop Functional and Technical Requirements,” INL/EXT-04-02273, Idaho National Engineering and Environmental Laboratory.
4. Gas Test Loop Project Staff, “Gas Test Loop Conceptual Design Report,” Draft INL/EXT-05-00261, Rev. A, Idaho National Laboratory, Idaho Falls, Idaho.

33
5. D. P. Guillen and T. S. Yoder, May 2006, “Specification of Surface Roughness for Hydraulic Flow Test Plates,” INL/CON-06-01063, 5th International Surface Engineering Conference, Seattle, WA, May 15 – 18, 2006.
6. Henkel Technologies, Düsseldorf, Germany, http://www.loctite.us/int_henkel/loctite_us/index.cfm
7. H. Blasius., 1961, Forschungsarbeiten auf dem Gebiete des Ingenieurwesens, 131, 1913; cited in J. K. Vennard. Elementary Fluid Mechanics, 4th Ed., New York, John Wiley & Sons, Inc, p. 284.
8. J. K. Vennard, 1961, Elementary Fluid Mechanics, 4th Edition., New York, John Wiley & Sons, Inc., p. 99
9. White, F.M., Fluid Mechanics, 5th Edition, McGraw Hill, p. 312-313.
10. I. E. Idelchik, 1996, Handbook of Hydraulic Resistance, 3rd Edition, New York, Begell House, p. 222.
11. Idaho National Engineering and Environmental Laboratory, ATR Gas Test Loop (GTL) Booster Fuel Element Assembly, DWG-630731, Rev. A.
12. Idaho National Engineering and Environmental Laboratory, October 29, 1974, ATR Mark VII Fuel Element Assembly, DWG-405400, Rev 19.
13. J. K. Vennard, 1961, Elementary Fluid Mechanics, 4th Edition., New York, John Wiley & Sons, Inc., p. 287.
14. National Instruments Corporation, Austin, Texas, http://www.ni.com/labview/.
15. ELKOR Technologies Inc., London, Ontario, Canada, http://www,elkor.net/.


APPENDIX A: EXPERIMENTAL PROCEDURES Pre-Test:
1. Make sure that the system is filled with deionized water. Visually inspect the standpipe for proper water level (minimum operating level of 183 inches). Fill system as needed to maintain minimum operating level. Purge air from system high points using bleed valves. Ensure all of the pressure/differential pressure impulse tubing and pressure cavities are full of water. This may require disconnecting the tubing at the transducer to allow water to flow through the tubing and using a squeeze bottle to fill the transducer cavity. If tubing is disconnected, verify proper retightening of the connection.
2. Visually inspect the clear piping section to ensure it is completely full of water. 3. Ensure proper valve line-up:
o Drain valves closed (i.e., tank, test section). o Vent valves closed (i.e., tank, test section, high point vent) o Pressure transducer isolation valves open and bypass valve closed. o Isolation valves for the Calibration Loop closed. o Fill valve closed. o Heat exchanger isolation valves closed.
4. Ensure all electronics (Data Acquisition (DAQ) system, amplifiers, indicators, etc.) are energized 30 minutes prior to testing to allow equipment warm-up.
5. Record in the laboratory logbook that Steps 1-4 were completed.
DAQ System: 1. Open and run proper LabView VI (file name “____”) 2. Ensure static values of system are indicated:
Zero flow Zero pressures (maximum should be 15 ft of water)
3. Set proper file name for data to be recorded for the particular experiment. 4. Check differential pressure transducer zero reading by opening the bypass valve and
closing the isolation valves. The differential pressure readings should be zero. Record all static and pretest pressure readings before and after the test is completed and compare the values for any discrepancies.
5. Check the differential pressure readings and the difference between the two pressure transducers to verify that they indicate the proper differential pressure for the water head.
6. Verify and record in the logbook that the system thermocouple is reading ambient temperature.
Pump start-up: 1. Align main electrical breaker, pump breaker and make sure that the power switch in
control room is on and that the main plug to the pump is connected.

APPENDIX A EXPERIMENTAL PROCEDURES
36
2. If it is the first test of the day, make sure that there is no air in the pump. Jog the pump to fill the pump casing with water: Quickly turn the pump on and off, allowing the pump to draw in water to fill the casing. Again, vent any air at the system high points through the bleed valves.
3. Start the pump.Set pump controller to desired flow rate. Allow controller to start pump ram-pup.
4. Listen to the pump for abnormal noises. If abnormal noises exist, secure pump immediately. If pump operating normally, proceed with test.
5. Visually inspect all connections and fittings for leakage. The operator and the INL auditor will determine if a leak is minor or major. A minor leak consists of intermittent drips of water coming form some part of the system. A major leak consists of a continuous stream of water leaving the system.
Minor leaks: - Determine whether to complete test prior to leak repair. - If proceeding with test, ensure water leakage is safely contained.
Major leaks: - Secure the pump immediately, suspend test, and repair the leak.
6. Verify system pressure and flow detected by DAQ. Verify positive flow by comparing Pitot tube data with flow meter reading.
7. Make a quick check of the differential pressure readings and verify that the sum of the individual differential pressures across the various segments is equal to the differential pressure across the entire test section.
Test Procedure: 1. Test Conduct:
Set controller to desired pressure for data point. Allow the system to run for 5 minutes to ensure steady state conditions exist prior to data collection. Steady state means that the pressure and flow fluctuations are less than 5%. Record data, observations and remarks in the Lab Test Manual (logbook) and DAQ system. Data that must be recorded are: Date, time of day, test number, water temperature and fluctuations, water flow rate and fluctuations, and pressure and fluctuations at designated points on the test loop.
NOTE: If water temperatures exceeds 140°F, shutdown system immediately and allow system temperature to equalize with surroundings before proceeding with testing. System temperature is limited to 140°F due to personnel protection and piping limitations. Operating above 140°F could result in a failure of system components.
2. Repeat Test Procedures Step 1 for a minimum of 10 data points, or until the temperature of the water reaches 140ºF (see Note above).
Randomly vary pressure for each data point between 50-100 psi discharge, at intervals of 10 psi; the pressure values are not to be repeated within a particular run.

APPENDIX A EXPERIMENTAL PROCEDURES
37
Review the data at each step to verify that they fall within the general, expected range. If any data readings are outside the expected range, suspend testing until the cause of the problem is identified and corrected.
Shut Down Procedure: 1. Shut down pump:
Set pump controller to zero flow, and allow pump to stop. Secure power to the pump.Open disconnect Open main breaker
2. Instruments: Secure power to all transducers. Save all data recorded by DAQ. Copy DAQ data to jump disk or CD for transport to INL.
3. System Ensure system is full of water. Clean up any water spillage.


APPENDIX B: DETAILED PRESSURE MEASUREMENT DATA
In this appendix are presented the measurement data collected by the various pressure transducers except for the dynamic pressure sensor. Data were collected for approximately 5 minutes at the rate of 10 samples per second. In the following pages, only the summary data are presented numerically. Graphical plots of the individual channels show the detailed data. Numbers in the abscissas of plots are simply data point sequence numbers.

APP
EN
DIX
B
DE
TA
ILE
D P
RE
SSU
RE
ME
ASU
RE
ME
NT
DA
TA
40
Nom
inal
Flo
w R
ate
200
gpm
Pum
p S
peed
[rpm
]: 11
53
P
ump
Dis
char
ge P
ress
ure
[psi
g]:
22.1
Te
mp
Flow
S
uctio
n In
let
DP
1 D
P2
DP
3 D
P4
DP
5 D
P6
DP
7 D
P8
DP
9
(deg
F)
(gpm
) (in
H2O
) (p
sig)
(in
H2O
) (p
sid)
(in
H2O
) (p
sid)
(p
sid)
(p
sid)
(p
sid)
(p
sid)
(p
sid)
M
edia
n 10
7.42
2 20
5.69
3 16
9.34
419
.334
32.3
0711
.158
-5.6
04
1.68
113
.671
1.90
51.
999
1.78
01.
834
Mea
n 10
7.48
7 20
3.81
3 16
9.37
119
.385
32.4
0611
.180
-5.6
68
1.68
413
.683
1.91
61.
985
1.78
91.
837
Std
Dev
0.
617
10.5
25
0.64
10.
159
0.44
40.
071
0.18
6 0.
044
0.20
80.
042
0.04
20.
054
0.04
7
200
GPM
Wat
er T
empe
ratu
re
9698100
102
104
106
108
110
112
114
118
637
155
674
192
611
1112
9614
8116
6618
5120
3622
2124
0625
9127
7629
61
Temp (deg F)

APP
EN
DIX
B
DE
TA
ILE
D P
RE
SSU
RE
ME
ASU
RE
ME
NT
DA
TA
41
200
GPM
Flo
w R
ate
050100
150
200
250
118
637
155
674
192
611
1112
9614
8116
6618
5120
3622
2124
0625
9127
7629
61
Flow (gpm)
200
GPM
Suc
tion
Hea
d
158
160
162
164
166
168
170
172
174
176
118
637
155
674
192
611
1112
9614
8116
6618
5120
3622
2124
0625
9127
7629
61
Pressure (in H2O)

APP
EN
DIX
B
DE
TA
ILE
D P
RE
SSU
RE
ME
ASU
RE
ME
NT
DA
TA
42
200
GPM
Inle
t Pre
ssur
e
18.2
18.4
18.6
18.8
19.0
19.2
19.4
19.6
19.8
20.0
116
833
550
266
983
610
0311
7013
3715
0416
7118
3820
0521
7223
3925
0626
73
Flow (gpm)
200
GPM
DP
1
2829303132333435
118
336
554
772
991
110
9312
7514
5716
3918
2120
0321
8523
6725
4927
3129
13
Pressure (in H20)

APP
EN
DIX
B
DE
TA
ILE
D P
RE
SSU
RE
ME
ASU
RE
ME
NT
DA
TA
43
200
GPM
DP
2
10.6
10.7
10.8
10.9
11.0
11.1
11.2
11.3
11.4
11.5
11.6
118
737
355
974
593
111
1713
0314
8916
7518
6120
4722
3324
1926
0527
9129
77
Pressure (psid)
200
GPM
DP
3
-7.5
-7.0
-6.5
-6.0
-5.5
-5.0
-4.5
-4.0
118
637
155
674
192
611
1112
9614
8116
6618
5120
3622
2124
0625
9127
7629
61
Pressure (in H2O)

APP
EN
DIX
B
DE
TA
ILE
D P
RE
SSU
RE
ME
ASU
RE
ME
NT
DA
TA
44
200
GPM
DP
4
0.0
0.5
1.0
1.5
2.0
2.5
118
536
955
373
792
111
0512
8914
7316
5718
4120
2522
0923
9325
7727
6129
45
Pressure (psid)
200
GPM
DP
5
0246810121416
118
336
554
772
991
110
9312
7514
5716
3918
2120
0321
8523
6725
4927
3129
13
Pressure (psid)

APP
EN
DIX
B
DE
TA
ILE
D P
RE
SSU
RE
ME
ASU
RE
ME
NT
DA
TA
45
200
GPM
DP
6
0.0
0.5
1.0
1.5
2.0
2.5
118
536
955
373
792
111
0512
8914
7316
5718
4120
2522
0923
9325
7727
6129
45
Pressure (psid)
200
GPM
DP
7
0.0
0.5
1.0
1.5
2.0
2.5
118
637
155
674
192
611
1112
9614
8116
6618
5120
3622
2124
0625
9127
7629
61
Pressure (psid)

APP
EN
DIX
B
DE
TA
ILE
D P
RE
SSU
RE
ME
ASU
RE
ME
NT
DA
TA
46
200
GPM
DP
8
0.0
0.5
1.0
1.5
2.0
2.5
118
536
955
373
792
111
0512
8914
7316
5718
4120
2522
0923
9325
7727
6129
45
Pressure (psid)
200
GPM
DP
9
0.0
0.5
1.0
1.5
2.0
2.5
118
536
955
373
792
111
0512
8914
7316
5718
4120
2522
0923
9325
7727
6129
45
Pressure (psid)

APP
EN
DIX
B
DE
TA
ILE
D P
RE
SSU
RE
ME
ASU
RE
ME
NT
DA
TA
47
Nom
inal
Flo
w R
ate
250
gpm
Pum
p S
peed
[rpm
]: 14
40
P
ump
Dis
char
ge P
ress
ure
[psi
g]:
31.5
Te
mp
Flow
S
uctio
n In
let
DP
1 D
P2
DP
3 D
P4
DP
5 D
P6
DP
7 D
P8
DP
9
(deg
F)
(gpm
) (in
H2O
) (p
sig)
(in
H2O
) (p
sid)
(in
H2O
) (p
sid)
(p
sid)
(p
sid)
(p
sid)
(p
sid)
(p
sid)
M
edia
n 95
.215
25
7.57
3 16
3.98
528
.271
49.8
7817
.261
-10.
239
2.65
821
.240
3.03
43.
219
2.84
82.
902
Mea
n 95
.104
25
5.79
4 16
4.24
528
.515
49.7
3217
.242
-10.
278
2.66
221
.235
3.02
03.
231
2.85
92.
912
Std
Dev
0.
716
10.3
96
0.88
90.
251
0.44
60.
084
0.21
4 0.
048
0.20
20.
044
0.05
00.
052
0.05
0
250
GPM
Wat
er T
empe
ratu
re
86889092949698100
118
637
155
674
192
611
1112
9614
8116
6618
5120
3622
2124
0625
9127
7629
61
Temp (deg F)
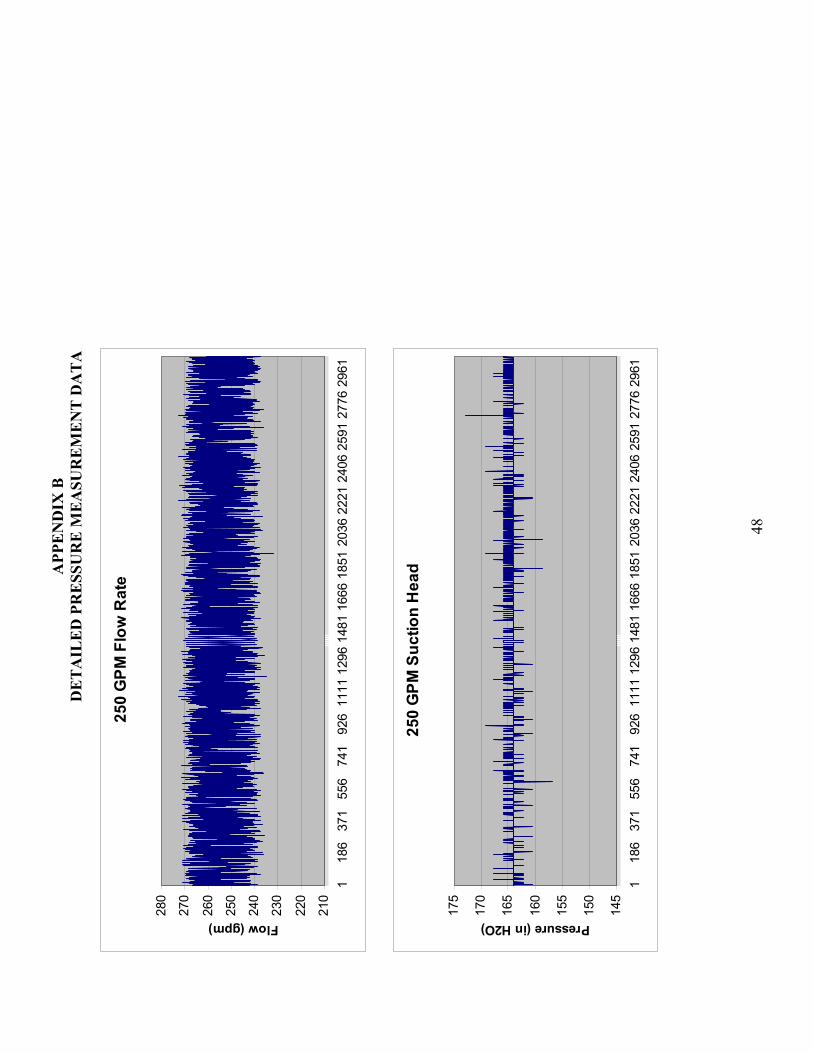
APP
EN
DIX
B
DE
TA
ILE
D P
RE
SSU
RE
ME
ASU
RE
ME
NT
DA
TA
48
250
GPM
Flo
w R
ate
210
220
230
240
250
260
270
280
118
637
155
674
192
611
1112
9614
8116
6618
5120
3622
2124
0625
9127
7629
61
Flow (gpm)
250
GPM
Suc
tion
Hea
d
145
150
155
160
165
170
175
118
637
155
674
192
611
1112
9614
8116
6618
5120
3622
2124
0625
9127
7629
61
Pressure (in H2O)

APP
EN
DIX
B
DE
TA
ILE
D P
RE
SSU
RE
ME
ASU
RE
ME
NT
DA
TA
49
250
GPM
Inle
t Pre
ssur
e
27.0
27.5
28.0
28.5
29.0
29.5
116
833
550
266
983
610
0311
7013
3715
0416
7118
3820
0521
7223
3925
0626
73
Flow (gpm)
250
GPM
DP
1
46474849505152
118
336
554
772
991
110
9312
7514
5716
3918
2120
0321
8523
6725
4927
3129
13
Pressure (in H20)

APP
EN
DIX
B
DE
TA
ILE
D P
RE
SSU
RE
ME
ASU
RE
ME
NT
DA
TA
50
250
GPM
DP
2
16.2
16.4
16.6
16.8
17.0
17.2
17.4
17.6
17.8
118
737
355
974
593
111
1713
0314
8916
7518
6120
4722
3324
1926
0527
9129
77
Pressure (psid)
250
GPM
DP
3
-12.
0-1
1.5
-11.
0-1
0.5
-10.
0-9
.5-9
.0-8
.5-8
.0
118
937
756
575
394
111
2913
1715
0516
9318
8120
6922
5724
4526
3328
2130
09
Pressure (in H2O)

APP
EN
DIX
B
DE
TA
ILE
D P
RE
SSU
RE
ME
ASU
RE
ME
NT
DA
TA
51
250
GPM
DP
4
0.0
0.5
1.0
1.5
2.0
2.5
3.0
3.5
118
536
955
373
792
111
0512
8914
7316
5718
4120
2522
0923
9325
7727
6129
45
Pressure (psid)
250
GPM
DP
5
18.5
19.0
19.5
20.0
20.5
21.0
21.5
22.0
22.5
23.0
118
737
355
974
593
111
1713
0314
8916
7518
6120
4722
3324
1926
0527
9129
77
Pressure (psid)

APP
EN
DIX
B
DE
TA
ILE
D P
RE
SSU
RE
ME
ASU
RE
ME
NT
DA
TA
52
250
GPM
DP
6
0.0
0.5
1.0
1.5
2.0
2.5
3.0
3.5
118
536
955
373
792
111
0512
8914
7316
5718
4120
2522
0923
9325
7727
6129
45
Pressure (psid)
250
GPM
DP
7
0.0
0.5
1.0
1.5
2.0
2.5
3.0
3.5
4.0
118
637
155
674
192
611
1112
9614
8116
6618
5120
3622
2124
0625
9127
7629
61
Pressure (psid)

APP
EN
DIX
B
DE
TA
ILE
D P
RE
SSU
RE
ME
ASU
RE
ME
NT
DA
TA
53
250
GPM
DP
8
0.0
0.5
1.0
1.5
2.0
2.5
3.0
3.5
118
536
955
373
792
111
0512
8914
7316
5718
4120
2522
0923
9325
7727
6129
45
Pressure (psid)
250
GPM
DP
9
0.0
0.5
1.0
1.5
2.0
2.5
3.0
3.5
118
536
955
373
792
111
0512
8914
7316
5718
4120
2522
0923
9325
7727
6129
45
Pressure (psid)

APP
EN
DIX
B
DE
TA
ILE
D P
RE
SSU
RE
ME
ASU
RE
ME
NT
DA
TA
54
Nom
inal
Flo
w R
ate
300
gpm
Pum
p S
peed
[rpm
]: 16
40
P
ump
Dis
char
ge P
ress
ure
[psi
g]:
39.5
Te
mp
Flow
S
uctio
n In
let
DP
1 D
P2
DP
3 D
P4
DP
5 D
P6
DP
7 D
P8
DP
9
(deg
F)
(gpm
) (in
H2O
) (p
sig)
(in
H2O
) (p
sid)
(in
H2O
) (p
sid)
(p
sid)
(p
sid)
(p
sid)
(p
sid)
(p
sid)
M
edia
n 92
.773
29
6.63
5 15
8.62
636
.216
64.8
8722
.264
-14.
265
3.51
227
.589
3.97
94.
379
3.70
23.
849
Mea
n 92
.648
29
4.73
3 15
8.53
336
.093
64.9
8122
.302
-14.
295
3.52
327
.563
3.97
44.
381
3.71
33.
845
Std
Dev
0.
715
10.6
21
0.85
70.
220
0.59
70.
084
0.23
0 0.
056
0.24
60.
050
0.05
20.
053
0.05
7
300
GPM
Wat
er T
empe
ratu
re
828486889092949698100
116
833
550
266
983
610
0311
7013
3715
0416
7118
3820
0521
7223
3925
0626
73
Temp (deg F)

APP
EN
DIX
B
DE
TA
ILE
D P
RE
SSU
RE
ME
ASU
RE
ME
NT
DA
TA
55
300
GPM
Flo
w R
ate
050100
150
200
250
300
350
116
833
550
266
983
610
0311
7013
3715
0416
7118
3820
0521
7223
3925
0626
73
Flow (gpm)
300
GPM
Suc
tion
Hea
d
146
148
150
152
154
156
158
160
162
164
166
116
833
550
266
983
610
0311
7013
3715
0416
7118
3820
0521
7223
3925
0626
73
Pressure (in H2O)

APP
EN
DIX
B
DE
TA
ILE
D P
RE
SSU
RE
ME
ASU
RE
ME
NT
DA
TA
56
300
GPM
Inle
t Pre
ssur
e
34.0
34.5
35.0
35.5
36.0
36.5
37.0
116
833
550
266
983
610
0311
7013
3715
0416
7118
3820
0521
7223
3925
0626
73
Flow (gpm)
300
GPM
DP
1
6162636465666768
116
633
149
666
182
699
111
5613
2114
8616
5118
1619
8121
4623
1124
7626
41
Pressure (in H20)

APP
EN
DIX
B
DE
TA
ILE
D P
RE
SSU
RE
ME
ASU
RE
ME
NT
DA
TA
57
300
GPM
DP
2
2222222222222222232323
116
633
149
666
182
699
111
5613
2114
8616
5118
1619
8121
4623
1124
7626
41
Pressure (psid)
300
GPM
DP
3
-16
-15
-14
-13
-12
-11
-10-9-8
116
733
349
966
583
199
711
6313
2914
9516
6118
2719
9321
5923
2524
9126
57
Pressure (in H2O)

APP
EN
DIX
B
DE
TA
ILE
D P
RE
SSU
RE
ME
ASU
RE
ME
NT
DA
TA
58
300
GPM
DP
4
0.0
0.5
1.0
1.5
2.0
2.5
3.0
3.5
4.0
4.5
116
733
349
966
583
199
711
6313
2914
9516
6118
2719
9321
5923
2524
9126
57
Pressure (psid)
300
GPM
DP
5
25262627272828292930
116
633
149
666
182
699
111
5613
2114
8616
5118
1619
8121
4623
1124
7626
41
Pressure (psid)

APP
EN
DIX
B
DE
TA
ILE
D P
RE
SSU
RE
ME
ASU
RE
ME
NT
DA
TA
59
300
GPM
DP
6
3.3
3.4
3.5
3.6
3.7
3.8
3.9
4.0
4.1
4.2
4.3
116
733
349
966
583
199
711
6313
2914
9516
6118
2719
9321
5923
2524
9126
57
Pressure (psi)
300
GPM
DP
7
3.8
3.9
4.0
4.1
4.2
4.3
4.4
4.5
4.6
4.7
116
833
550
266
983
610
0311
7013
3715
0416
7118
3820
0521
7223
3925
0626
73
Pressure (psid)

APP
EN
DIX
B
DE
TA
ILE
D P
RE
SSU
RE
ME
ASU
RE
ME
NT
DA
TA
60
300
GPM
DP
8
3.0
3.1
3.2
3.3
3.4
3.5
3.6
3.7
3.8
3.9
4.0
4.1
116
733
349
966
583
199
711
6313
2914
9516
6118
2719
9321
5923
2524
9126
57
Pressure (psid)
300
GPM
DP
9
3.2
3.3
3.4
3.5
3.6
3.7
3.8
3.9
4.0
4.1
4.2
116
733
349
966
583
199
711
6313
2914
9516
6118
2719
9321
5923
2524
9126
57
Pressure (psid)

APP
EN
DIX
B
DE
TA
ILE
D P
RE
SSU
RE
ME
ASU
RE
ME
NT
DA
TA
61
Nom
inal
Flo
w R
ate
350
gpm
Pum
p S
peed
[rpm
]: 19
92
P
ump
Dis
char
ge P
ress
ure
[psi
g]:
54.8
Te
mp
Flow
S
uctio
n In
let
DP
1 D
P2
DP
3 D
P4
DP
5 D
P6
DP
7 D
P8
DP
9
(deg
F)
(gpm
) (in
H2O
) (p
sig)
(in
H2O
) (p
sid)
(in
H2O
) (p
sid)
(p
sid)
(p
sid)
(p
sid)
(p
sid)
(p
sid)
M
edia
n 10
2.53
9 36
6.82
6 14
2.54
850
.615
95.6
3831
.784
-15.
973
5.31
339
.554
5.96
26.
759
5.56
25.
802
Mea
n 10
2.82
3 36
5.38
6 14
2.86
250
.713
95.7
5931
.724
-15.
949
5.31
639
.575
5.95
16.
749
5.57
25.
810
Std
Dev
0.
865
10.5
70
1.42
80.
240
0.92
50.
116
0.19
5 0.
053
0.26
40.
054
0.06
20.
062
0.05
8
350
GPM
Wat
er T
empe
ratu
re
9698100
102
104
106
108
116
733
349
966
583
199
711
6313
2914
9516
6118
2719
9321
5923
2524
9126
57
Temp (deg F)

APP
EN
DIX
B
DE
TA
ILE
D P
RE
SSU
RE
ME
ASU
RE
ME
NT
DA
TA
62
350
GPM
Flo
w R
ate
050100
150
200
250
300
350
400
450
116
733
349
966
583
199
711
6313
2914
9516
6118
2719
9321
5923
2524
9126
57
Flow (gpm)
350
GPM
Suc
tion
Hea
d
130
132
134
136
138
140
142
144
146
148
150
152
116
733
349
966
583
199
711
6313
2914
9516
6118
2719
9321
5923
2524
9126
57
Pressure (in H2O)

APP
EN
DIX
B
DE
TA
ILE
D P
RE
SSU
RE
ME
ASU
RE
ME
NT
DA
TA
63
350
GPM
Inle
t Pre
ssur
e
49
49.550
50.551
51.552
116
833
550
266
983
610
0311
7013
3715
0416
7118
3820
0521
7223
3925
0626
73
Pressure (in H2O)
350
GPM
DP
1
8990919293949596979899100
116
733
349
966
583
199
711
6313
2914
9516
6118
2719
9321
5923
2524
9126
57
Pressure (in H20)

APP
EN
DIX
B
DE
TA
ILE
D P
RE
SSU
RE
ME
ASU
RE
ME
NT
DA
TA
64
350
GPM
DP
2
313131313232323232
116
833
550
266
983
610
0311
7013
3715
0416
7118
3820
0521
7223
3925
0626
73
Pressure (psid)
350
GPM
DP
3
-18
-17
-16
-15
-14
-13
-12
116
833
550
266
983
610
0311
7013
3715
0416
7118
3820
0521
7223
3925
0626
73
Pressure (in H2O)

APP
EN
DIX
B
DE
TA
ILE
D P
RE
SSU
RE
ME
ASU
RE
ME
NT
DA
TA
65
350
GPM
DP
4
4.6
4.8
5.0
5.2
5.4
5.6
5.8
116
833
550
266
983
610
0311
7013
3715
0416
7118
3820
0521
7223
3925
0626
73
Pressure (psid)
350
GPM
DP
5
36.5
37.0
37.5
38.0
38.5
39.0
39.5
40.0
40.5
41.0
41.5
116
833
550
266
983
610
0311
7013
3715
0416
7118
3820
0521
7223
3925
0626
73
Pressure (psid)

APP
EN
DIX
B
DE
TA
ILE
D P
RE
SSU
RE
ME
ASU
RE
ME
NT
DA
TA
66
350
GPM
DP
6
5.0
5.2
5.4
5.6
5.8
6.0
6.2
6.4
6.6
116
833
550
266
983
610
0311
7013
3715
0416
7118
3820
0521
7223
3925
0626
73
Pressure (psi)
350
GPM
DP
7
6.1
6.2
6.3
6.4
6.5
6.6
6.7
6.8
6.9
7.0
7.1
116
833
550
266
983
610
0311
7013
3715
0416
7118
3820
0521
7223
3925
0626
73
Pressure (psid)

APP
EN
DIX
B
DE
TA
ILE
D P
RE
SSU
RE
ME
ASU
RE
ME
NT
DA
TA
67
350
GPM
DP
8
4.6
4.8
5.0
5.2
5.4
5.6
5.8
6.0
116
833
550
266
983
610
0311
7013
3715
0416
7118
3820
0521
7223
3925
0626
73
Pressure (psid)
350
GPM
DP
9
5.0
5.2
5.4
5.6
5.8
6.0
6.2
6.4
116
833
550
266
983
610
0311
7013
3715
0416
7118
3820
0521
7223
3925
0626
73
Pressure (psid)

APP
EN
DIX
B
DE
TA
ILE
D P
RE
SSU
RE
ME
ASU
RE
ME
NT
DA
TA
68
Nom
inal
Flo
w R
ate
400
gpm
Pum
p S
peed
[rpm
]: 22
60
P
ump
Dis
char
ge P
ress
ure
[psi
g]:
69.3
Te
mp
Flow
S
uctio
n In
let
DP
1 D
P2
DP
3 D
P4
DP
5 D
P6
DP
7 D
P8
DP
9
(deg
F)
(gpm
) (in
H2O
) (p
sig)
(in
H2O
) (p
sid)
(in
H2O
) (p
sid)
(p
sid)
(p
sid)
(p
sid)
(p
sid)
(p
sid)
M
edia
n 92
.773
41
8.09
5 13
3.61
664
.518
123.
825
40.8
15-1
5.85
1 6.
900
51.0
307.
670
8.86
57.
148
7.51
1 M
ean
93.9
05
415.
841
133.
846
64.6
2112
3.85
440
.852
-15.
810
6.91
051
.051
7.68
18.
868
7.13
67.
510
Std
Dev
1.
285
10.1
20
1.17
40.
257
1.14
40.
136
0.20
7 0.
058
0.27
00.
061
0.07
00.
059
0.06
2
400
GPM
Wat
er T
empe
ratu
re
828486889092949698100
116
833
550
266
983
610
0311
7013
3715
0416
7118
3820
0521
7223
3925
0626
73
Temp (deg F)

APP
EN
DIX
B
DE
TA
ILE
D P
RE
SSU
RE
ME
ASU
RE
ME
NT
DA
TA
69
400
GPM
Flo
w R
ate
360
370
380
390
400
410
420
430
440
116
833
550
266
983
610
0311
7013
3715
0416
7118
3820
0521
7223
3925
0626
73
Flow (gpm)
400
GPM
Suc
tion
Hea
d
122
124
126
128
130
132
134
136
138
140
116
833
550
266
983
610
0311
7013
3715
0416
7118
3820
0521
7223
3925
0626
73
Pressure (in H2O)

APP
EN
DIX
B
DE
TA
ILE
D P
RE
SSU
RE
ME
ASU
RE
ME
NT
DA
TA
70
400
GPM
Inle
t Pre
ssur
e
6363646465656666
116
833
550
266
983
610
0311
7013
3715
0416
7118
3820
0521
7223
3925
0626
73
Flow (gpm)
400
GPM
DP
1
116
118
120
122
124
126
128
130
116
833
550
266
983
610
0311
7013
3715
0416
7118
3820
0521
7223
3925
0626
73
Pressure (in H20)

APP
EN
DIX
B
DE
TA
ILE
D P
RE
SSU
RE
ME
ASU
RE
ME
NT
DA
TA
71
400
GPM
DP
2
39.8
40.0
40.2
40.4
40.6
40.8
41.0
41.2
41.4
116
833
550
266
983
610
0311
7013
3715
0416
7118
3820
0521
7223
3925
0626
73
Pressure (psid)
400
GPM
DP
3
-18
-17
-16
-15
-14
-13
-12
116
833
550
266
983
610
0311
7013
3715
0416
7118
3820
0521
7223
3925
0626
73
Pressure (in H2O)

APP
EN
DIX
B
DE
TA
ILE
D P
RE
SSU
RE
ME
ASU
RE
ME
NT
DA
TA
72
400
GPM
DP
4
6.2
6.4
6.6
6.8
7.0
7.2
7.4
116
833
550
266
983
610
0311
7013
3715
0416
7118
3820
0521
7223
3925
0626
73
Pressure (psid)
400
GPM
DP
5
48.0
48.5
49.0
49.5
50.0
50.5
51.0
51.5
52.0
52.5
53.0
53.5
116
833
550
266
983
610
0311
7013
3715
0416
7118
3820
0521
7223
3925
0626
73
Pressure (psid)

APP
EN
DIX
B
DE
TA
ILE
D P
RE
SSU
RE
ME
ASU
RE
ME
NT
DA
TA
73
400
GPM
DP
6
7.0
7.2
7.4
7.6
7.8
8.0
8.2
116
833
550
266
983
610
0311
7013
3715
0416
7118
3820
0521
7223
3925
0626
73
Pressure (psi)
400
GPM
DP
7
8.0
8.2
8.4
8.6
8.8
9.0
9.2
9.4
116
833
550
266
983
610
0311
7013
3715
0416
7118
3820
0521
7223
3925
0626
73
Pressure (psid)

APP
EN
DIX
B
DE
TA
ILE
D P
RE
SSU
RE
ME
ASU
RE
ME
NT
DA
TA
74
400
GPM
DP
8
6.4
6.6
6.8
7.0
7.2
7.4
7.6
116
833
550
266
983
610
0311
7013
3715
0416
7118
3820
0521
7223
3925
0626
73
Pressure (psid)
400
GPM
DP
9
6.8
7.0
7.2
7.4
7.6
7.8
8.0
116
833
550
266
983
610
0311
7013
3715
0416
7118
3820
0521
7223
3925
0626
73
Pressure (psid)

APP
EN
DIX
B
DE
TA
ILE
D P
RE
SSU
RE
ME
ASU
RE
ME
NT
DA
TA
75
Nom
inal
Flo
w R
ate
450
gpm
Pum
p S
peed
[rpm
]: 24
65
P
ump
Dis
char
ge P
ress
ure
[psi
g]:
81.1
Te
mp
Flow
S
uctio
n In
let
DP
1 D
P2
DP
3 D
P4
DP
5 D
P6
DP
7 D
P8
DP
9
(deg
F)
(gpm
) (in
H2O
) (p
sig)
(in
H2O
) (p
sid)
(in
H2O
) (p
sid)
(p
sid)
(p
sid)
(p
sid)
(p
sid)
(p
sid)
M
edia
n 10
7.42
2 46
3.26
1 12
2.89
875
.938
148.
352
47.7
72-1
4.63
1 8.
365
59.9
429.
256
10.8
188.
582
9.12
9 M
ean
106.
549
461.
519
122.
356
75.9
1114
8.37
747
.812
-14.
655
8.35
260
.000
9.26
210
.804
8.58
29.
135
Std
Dev
1.
201
11.2
51
1.20
70.
263
1.38
40.
139
0.21
0 0.
047
0.25
30.
059
0.07
30.
056
0.05
5
450
GPM
Wat
er T
empe
ratu
re
98100
102
104
106
108
110
112
116
132
148
164
180
196
111
2112
8114
4116
0117
6119
2120
8122
4124
0125
61
Temp (deg F)

APP
EN
DIX
B
DE
TA
ILE
D P
RE
SSU
RE
ME
ASU
RE
ME
NT
DA
TA
76
450
GPM
Flo
w R
ate
0
100
200
300
400
500
600
116
132
148
164
180
196
111
2112
8114
4116
0117
6119
2120
8122
4124
0125
61
Flow (gpm)
450
GPM
Suc
tion
Hea
d
112
114
116
118
120
122
124
126
128
130
116
132
148
164
180
196
111
2112
8114
4116
0117
6119
2120
8122
4124
0125
61
Pressure (in H2O)

APP
EN
DIX
B
DE
TA
ILE
D P
RE
SSU
RE
ME
ASU
RE
ME
NT
DA
TA
77
450
GPM
Inle
t Pre
ssur
e
74
74.575
75.576
76.577
116
132
148
164
180
196
111
2112
8114
4116
0117
6119
2120
8122
4124
0125
61
Pressure (in H2O)
450
GPM
DP
1
138
140
142
144
146
148
150
152
154
116
132
148
164
180
196
111
2112
8114
4116
0117
6119
2120
8122
4124
0125
61
Pressure (in H20)

APP
EN
DIX
B
DE
TA
ILE
D P
RE
SSU
RE
ME
ASU
RE
ME
NT
DA
TA
78
450
GPM
DP
2
46.8
47.0
47.2
47.4
47.6
47.8
48.0
48.2
48.4
116
232
348
464
580
696
711
2812
8914
5016
1117
7219
3320
9422
5524
1625
77
Pressure (psid)
450
GPM
DP
3
-18.
0
-17.
0
-16.
0
-15.
0
-14.
0
-13.
0
-12.
0
116
332
548
764
981
197
311
3512
9714
5916
2117
8319
4521
0722
6924
3125
93
Pressure (in H2O)
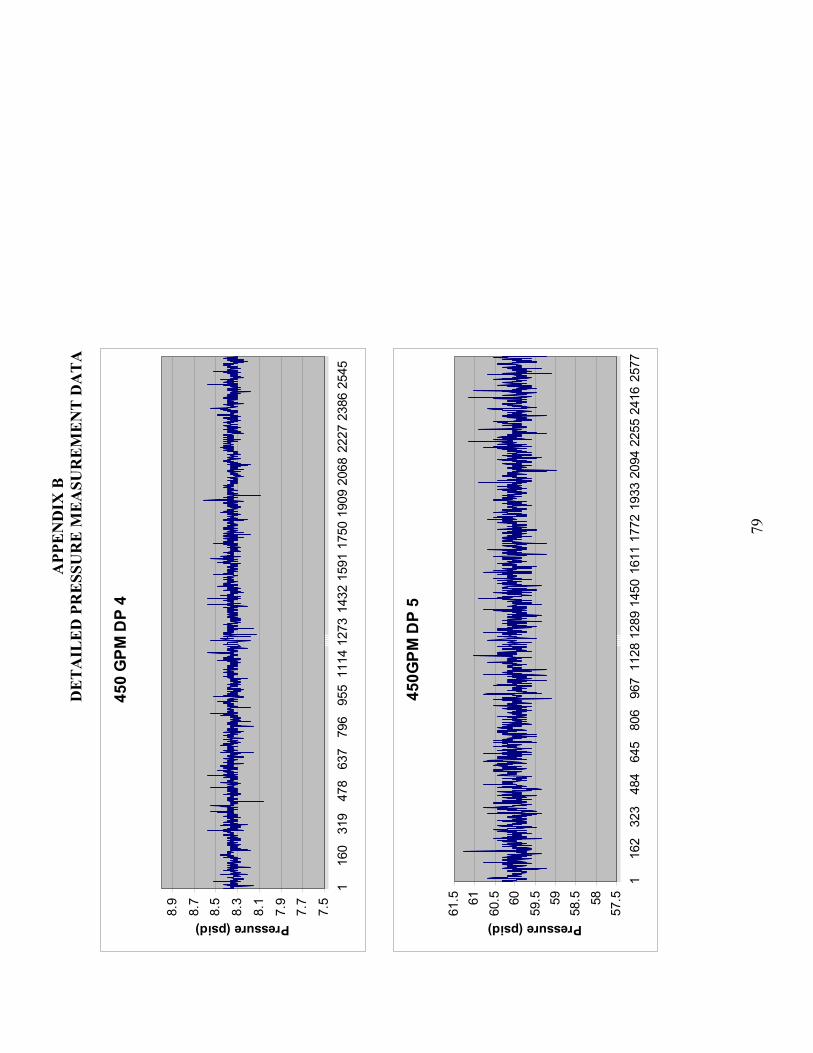
APP
EN
DIX
B
DE
TA
ILE
D P
RE
SSU
RE
ME
ASU
RE
ME
NT
DA
TA
79
450
GPM
DP
4
7.5
7.7
7.9
8.1
8.3
8.5
8.7
8.9
116
031
947
863
779
695
511
1412
7314
3215
9117
5019
0920
6822
2723
8625
45
Pressure (psid)
450G
PM D
P 5
57.558
58.559
59.560
60.561
61.5
116
232
348
464
580
696
711
2812
8914
5016
1117
7219
3320
9422
5524
1625
77
Pressure (psid)

APP
EN
DIX
B
DE
TA
ILE
D P
RE
SSU
RE
ME
ASU
RE
ME
NT
DA
TA
80
450
GPM
DP
6
8.7
8.8
8.9
9.0
9.1
9.2
9.3
9.4
9.5
9.6
9.7
116
031
947
863
779
695
511
1412
7314
3215
9117
5019
0920
6822
2723
8625
45
Pressure (psid)
450
GPM
DP
7
10.2
10.3
10.4
10.5
10.6
10.7
10.8
10.9
11.0
11.1
11.2
116
332
548
764
981
197
311
3512
9714
5916
2117
8319
4521
0722
6924
3125
93
Pressure (psid)

APP
EN
DIX
B
DE
TA
ILE
D P
RE
SSU
RE
ME
ASU
RE
ME
NT
DA
TA
81
450
GPM
DP
8
7.8
8.0
8.2
8.4
8.6
8.8
9.0
116
031
947
863
779
695
511
1412
7314
3215
9117
5019
0920
6822
2723
8625
45
Pressure (psid)
450
GPM
DP
9
8.6
8.7
8.8
8.9
9.0
9.1
9.2
9.3
9.4
9.5
116
031
947
863
779
695
511
1412
7314
3215
9117
5019
0920
6822
2723
8625
45
Pressure (psid)

APP
EN
DIX
B
DE
TA
ILE
D P
RE
SSU
RE
ME
ASU
RE
ME
NT
DA
TA
82
Nom
inal
Flo
w R
ate
500
gpm
Pum
p S
peed
[rpm
]: 27
07
P
ump
Dis
char
ge P
ress
ure
[psi
g]:
96.7
Te
mp
Flow
S
uctio
n In
let
DP
1 D
P2
DP
3 D
P4
DP
5 D
P6
DP
7 D
P8
DP
9
(deg
F)
(gpm
) (in
H2O
) (p
sig)
(in
H2O
) (p
sid)
(in
H2O
) (p
sid)
(p
sid)
(p
sid)
(p
sid)
(p
sid)
(p
sid)
M
edia
n 90
.332
50
4.15
5 11
0.39
390
.833
179.
103
58.0
24-1
3.28
9 10
.014
72.6
3911
.087
12.8
3210
.259
10.9
91
Mea
n 90
.220
50
2.39
2 11
0.53
790
.919
179.
042
58.0
52-1
3.31
1 10
.022
72.6
2111
.092
12.8
4610
.251
10.9
91
Std
Dev
1.
182
11.3
45
1.85
10.
300
1.48
00.
183
0.17
3 0.
048
0.30
20.
064
0.08
50.
056
0.05
8
500
GPM
Wat
er T
empe
ratu
re
8082848688909294
116
833
550
266
983
610
0311
7013
3715
0416
7118
3820
0521
7223
3925
0626
73
Temp (deg F)

APP
EN
DIX
B
DE
TA
ILE
D P
RE
SSU
RE
ME
ASU
RE
ME
NT
DA
TA
83
500
GPM
Flo
w R
ate
0
100
200
300
400
500
600
116
833
550
266
983
610
0311
7013
3715
0416
7118
3820
0521
7223
3925
0626
73
Flow (gpm)
500
GPM
Suc
tion
Hea
d
95100
105
110
115
120
116
833
550
266
983
610
0311
7013
3715
0416
7118
3820
0521
7223
3925
0626
73
Pressure (in H2O)
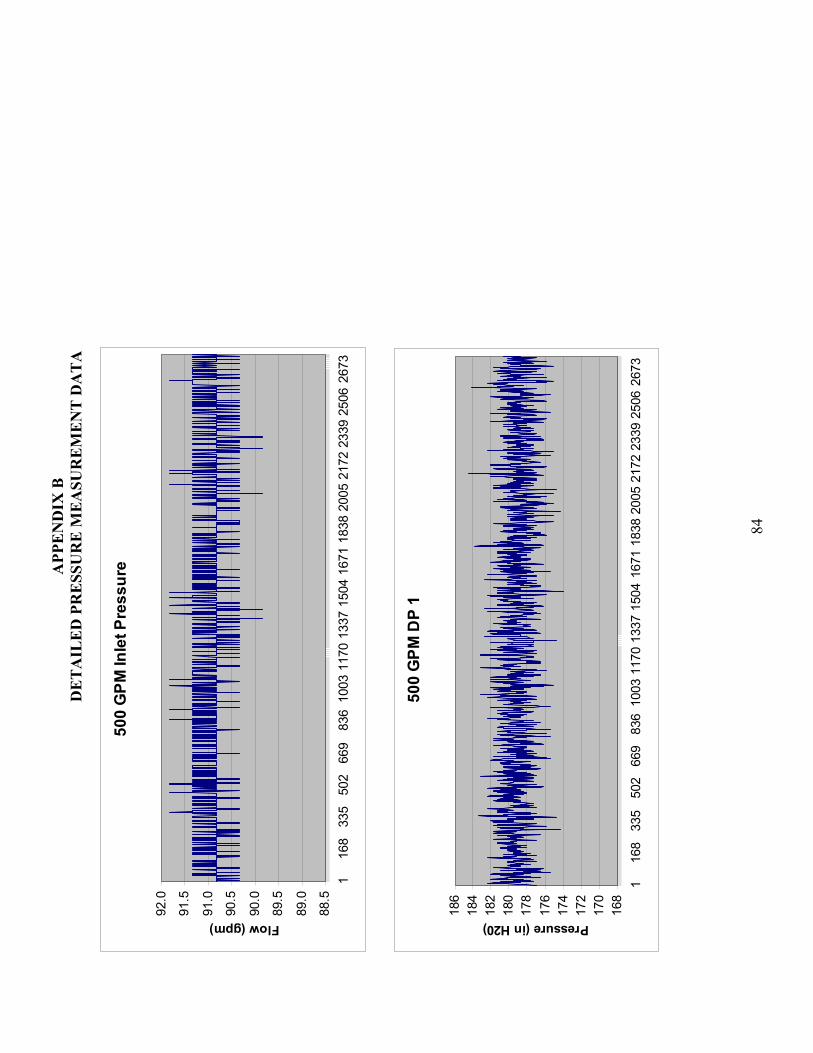
APP
EN
DIX
B
DE
TA
ILE
D P
RE
SSU
RE
ME
ASU
RE
ME
NT
DA
TA
84
500
GPM
Inle
t Pre
ssur
e
88.5
89.0
89.5
90.0
90.5
91.0
91.5
92.0
116
833
550
266
983
610
0311
7013
3715
0416
7118
3820
0521
7223
3925
0626
73
Flow (gpm)
500
GPM
DP
1
168
170
172
174
176
178
180
182
184
186
116
833
550
266
983
610
0311
7013
3715
0416
7118
3820
0521
7223
3925
0626
73
Pressure (in H20)

APP
EN
DIX
B
DE
TA
ILE
D P
RE
SSU
RE
ME
ASU
RE
ME
NT
DA
TA
85
500
GPM
DP
2
56.8
57.0
57.2
57.4
57.6
57.8
58.0
58.2
58.4
58.6
58.8
116
833
550
266
983
610
0311
7013
3715
0416
7118
3820
0521
7223
3925
0626
73
Pressure (psid)
500
GPM
DP
3
-15.
0
-14.
5
-14.
0
-13.
5
-13.
0
-12.
5
-12.
0
116
833
550
266
983
610
0311
7013
3715
0416
7118
3820
0521
7223
3925
0626
73
Pressure (in H2O)
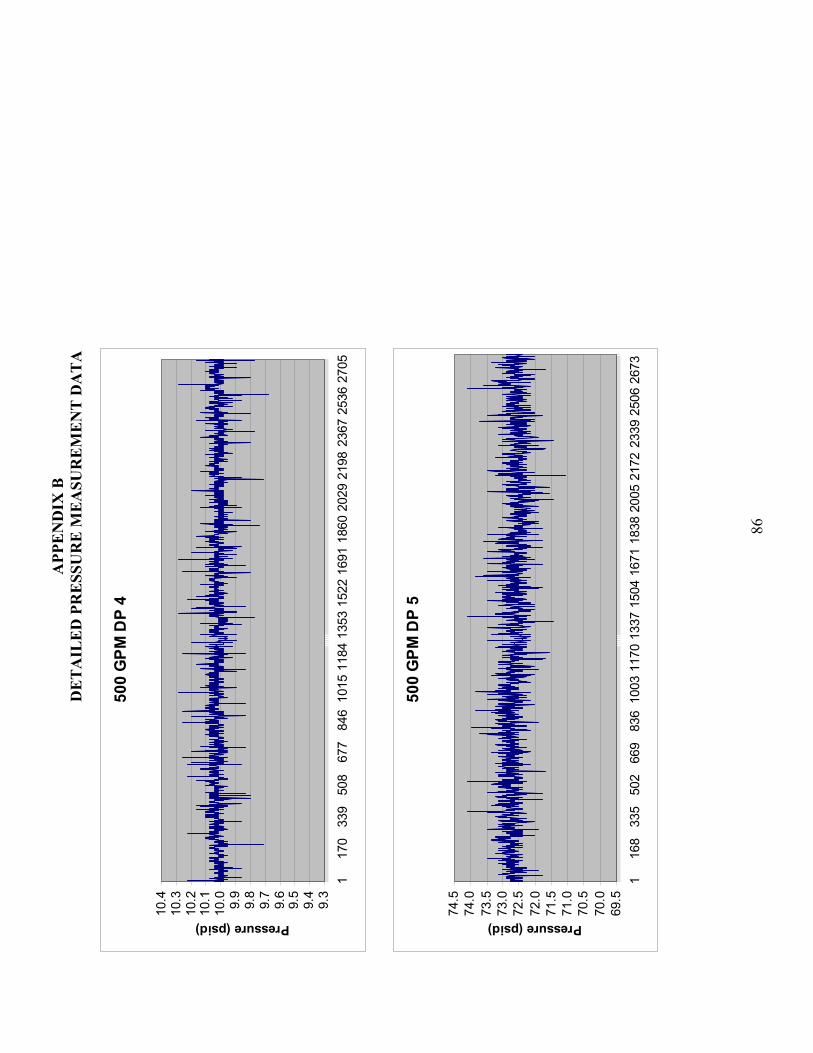
APP
EN
DIX
B
DE
TA
ILE
D P
RE
SSU
RE
ME
ASU
RE
ME
NT
DA
TA
86
500
GPM
DP
4
9.3
9.4
9.5
9.6
9.7
9.8
9.9
10.0
10.1
10.2
10.3
10.4
117
033
950
867
784
610
1511
8413
5315
2216
9118
6020
2921
9823
6725
3627
05
Pressure (psid)
500
GPM
DP
5
69.5
70.0
70.5
71.0
71.5
72.0
72.5
73.0
73.5
74.0
74.5
116
833
550
266
983
610
0311
7013
3715
0416
7118
3820
0521
7223
3925
0626
73
Pressure (psid)

APP
EN
DIX
B
DE
TA
ILE
D P
RE
SSU
RE
ME
ASU
RE
ME
NT
DA
TA
87
500
GPM
DP
6
10.4
10.5
10.6
10.7
10.8
10.9
11.0
11.1
11.2
11.3
11.4
11.5
116
833
550
266
983
610
0311
7013
3715
0416
7118
3820
0521
7223
3925
0626
73
Pressure (psid)
500
GPM
DP
7
12.0
12.2
12.4
12.6
12.8
13.0
13.2
13.4
116
833
550
266
983
610
0311
7013
3715
0416
7118
3820
0521
7223
3925
0626
73
Pressure (psid)

APP
EN
DIX
B
DE
TA
ILE
D P
RE
SSU
RE
ME
ASU
RE
ME
NT
DA
TA
88
500
GPM
DP
8
9.4
9.6
9.8
10.0
10.2
10.4
10.6
10.8
116
833
550
266
983
610
0311
7013
3715
0416
7118
3820
0521
7223
3925
0626
73
Pressure (psid)
500
GPM
DP
9
10.2
10.4
10.6
10.8
11.0
11.2
11.4
11.6
116
833
550
266
983
610
0311
7013
3715
0416
7118
3820
0521
7223
3925
0626
73
Pressure (psid)

APP
EN
DIX
B
DE
TA
ILE
D P
RE
SSU
RE
ME
ASU
RE
ME
NT
DA
TA
89
Nom
inal
Flo
w R
ate
550
gpm
Pum
p S
peed
[rpm
]: 29
50
P
ump
Dis
char
ge P
ress
ure
[psi
g]:
113.
6
Tem
p Fl
ow
Suc
tion
Inle
t D
P1
DP
2 D
P3
DP
4 D
P5
DP
6 D
P7
DP
8 D
P9
(d
eg F
) (g
pm)
(in H
2O)
(psi
g)
(in H
2O)
(psi
d)
(in H
2O)
(psi
d)
(psi
d)
(psi
d)
(psi
d)
(psi
d)
(psi
d)
Med
ian
112.
305
562.
748
92.5
3010
6.72
221
3.14
767
.421
-12.
923
12.1
8184
.726
13.3
7416
.128
12.2
7213
.372
M
ean
111.
884
561.
153
93.1
2610
6.78
021
3.20
167
.424
-12.
974
12.1
7984
.763
13.3
8616
.121
12.2
5813
.373
S
td D
ev
1.22
3 11
.990
1.
423
0.33
51.
911
0.21
10.
163
0.05
50.
325
0.07
60.
112
0.07
10.
069
550
GPM
Wat
er T
empe
ratu
re
102
104
106
108
110
112
114
116
116
833
550
266
983
610
0311
7013
3715
0416
7118
3820
0521
7223
3925
0626
73
Temp (deg F)

APP
EN
DIX
B
DE
TA
ILE
D P
RE
SSU
RE
ME
ASU
RE
ME
NT
DA
TA
90
550
GPM
Flo
w R
ate
0
100
200
300
400
500
600
700
116
833
550
266
983
610
0311
7013
3715
0416
7118
3820
0521
7223
3925
0626
73
Flow (gpm)
550
GPM
Suc
tion
Hea
d
80828486889092949698100
102
116
833
550
266
983
610
0311
7013
3715
0416
7118
3820
0521
7223
3925
0626
73
Pressure (in H2O)

APP
EN
DIX
B
DE
TA
ILE
D P
RE
SSU
RE
ME
ASU
RE
ME
NT
DA
TA
91
550
GPM
Inle
t Pre
ssur
e
104.
5
105.
0
105.
5
106.
0
106.
5
107.
0
107.
5
108.
0
116
833
550
266
983
610
0311
7013
3715
0416
7118
3820
0521
7223
3925
0626
73
Flow (gpm)
550
GPM
DP
1
195
200
205
210
215
220
225
116
833
550
266
983
610
0311
7013
3715
0416
7118
3820
0521
7223
3925
0626
73
Pressure (in H20)

APP
EN
DIX
B
DE
TA
ILE
D P
RE
SSU
RE
ME
ASU
RE
ME
NT
DA
TA
92
550
GPM
DP
2
65.5
66.0
66.5
67.0
67.5
68.0
68.5
116
833
550
266
983
610
0311
7013
3715
0416
7118
3820
0521
7223
3925
0626
73
Pressure (psid)
550
GPM
DP
3
-14.
0-1
3.8
-13.
6-1
3.4
-13.
2-1
3.0
-12.
8-1
2.6
-12.
4-1
2.2
-12.
0
116
833
550
266
983
610
0311
7013
3715
0416
7118
3820
0521
7223
3925
0626
73
Pressure (in H2O)

APP
EN
DIX
B
DE
TA
ILE
D P
RE
SSU
RE
ME
ASU
RE
ME
NT
DA
TA
93
550
GPM
DP
4
11.6
11.7
11.8
11.9
12.0
12.1
12.2
12.3
12.4
12.5
116
833
550
266
983
610
0311
7013
3715
0416
7118
3820
0521
7223
3925
0626
73
Pressure (psid)
550
GPM
DP
5
81.5
82.0
82.5
83.0
83.5
84.0
84.5
85.0
85.5
86.0
86.5
87.0
116
833
550
266
983
610
0311
7013
3715
0416
7118
3820
0521
7223
3925
0626
73
Pressure (psid)

APP
EN
DIX
B
DE
TA
ILE
D P
RE
SSU
RE
ME
ASU
RE
ME
NT
DA
TA
94
550
GPM
DP
6
12.7
12.8
12.9
13.0
13.1
13.2
13.3
13.4
13.5
13.6
13.7
13.8
116
833
550
266
983
610
0311
7013
3715
0416
7118
3820
0521
7223
3925
0626
73
Pressure (psid)
550
GPM
DP
7
15.2
15.4
15.6
15.8
16.0
16.2
16.4
16.6
116
833
550
266
983
610
0311
7013
3715
0416
7118
3820
0521
7223
3925
0626
73
Pressure (psid)

APP
EN
DIX
B
DE
TA
ILE
D P
RE
SSU
RE
ME
ASU
RE
ME
NT
DA
TA
95
550
GPM
DP
8
11.2
11.4
11.6
11.8
12.0
12.2
12.4
12.6
12.8
116
833
550
266
983
610
0311
7013
3715
0416
7118
3820
0521
7223
3925
0626
73
Pressure (psid)
550
GPM
DP
9
12.8
12.9
13.0
13.1
13.2
13.3
13.4
13.5
13.6
13.7
13.8
116
833
550
266
983
610
0311
7013
3715
0416
7118
3820
0521
7223
3925
0626
73
Pressure (psid)

APP
EN
DIX
B
DE
TA
ILE
D P
RE
SSU
RE
ME
ASU
RE
ME
NT
DA
TA
96
Nom
inal
Flo
w R
ate
600
gpm
Pum
p S
peed
[rpm
]: 31
77
P
ump
Dis
char
ge P
ress
ure
[psi
g]:
130.
9
Tem
p Fl
ow
Suc
tion
Inle
t D
P1
DP
2 D
P3
DP
4 D
P5
DP
6 D
P7
DP
8 D
P9
(d
eg F
) (g
pm)
(in H
2O)
(psi
g)
(in H
2O)
(psi
d)
(in H
2O)
(psi
d)
(psi
d)
(psi
d)
(psi
d)
(psi
d)
(psi
d)
Med
ian
100.
098
603.
642
80.0
2512
3.60
424
5.72
878
.405
-12.
679
14.1
0498
.400
15.4
7918
.936
14.0
1115
.478
M
ean
99.4
09
601.
884
80.4
9112
3.36
024
5.85
878
.441
-12.
727
14.1
0398
.414
15.4
8318
.947
14.0
1415
.488
S
td D
ev
1.53
5 9.
812
1.69
50.
379
2.08
60.
268
0.22
8 0.
067
0.39
90.
097
0.14
00.
091
0.08
3
600
GPM
Wat
er T
empe
ratu
re
9092949698100
102
104
116
833
550
266
983
610
0311
7013
3715
0416
7118
3820
0521
7223
3925
0626
73
Temp (deg F)

APP
EN
DIX
B
DE
TA
ILE
D P
RE
SSU
RE
ME
ASU
RE
ME
NT
DA
TA
97
600
GPM
Flo
w R
ate
550
560
570
580
590
600
610
620
630
116
833
550
266
983
610
0311
7013
3715
0416
7118
3820
0521
7223
3925
0626
73
Flow (gpm)
600
GPM
Suc
tion
Hea
d
657075808590
116
833
550
266
983
610
0311
7013
3715
0416
7118
3820
0521
7223
3925
0626
73
Pressure (in H2O)

APP
EN
DIX
B
DE
TA
ILE
D P
RE
SSU
RE
ME
ASU
RE
ME
NT
DA
TA
98
600
GPM
Inle
t Pre
ssur
e
120.
512
1.0
121.
512
2.0
122.
512
3.0
123.
512
4.0
124.
512
5.0
116
833
550
266
983
610
0311
7013
3715
0416
7118
3820
0521
7223
3925
0626
73
Flow (gpm)
600
GPM
DP
1
230
235
240
245
250
255
116
833
550
266
983
610
0311
7013
3715
0416
7118
3820
0521
7223
3925
0626
73
Pressure (in H20)

APP
EN
DIX
B
DE
TA
ILE
D P
RE
SSU
RE
ME
ASU
RE
ME
NT
DA
TA
99
600
GPM
DP
2
76.0
76.5
77.0
77.5
78.0
78.5
79.0
79.5
80.0
116
833
550
266
983
610
0311
7013
3715
0416
7118
3820
0521
7223
3925
0626
73
Pressure (psid)
600
GPM
DP
3
-14.
5
-14.
0
-13.
5
-13.
0
-12.
5
-12.
0
116
833
550
266
983
610
0311
7013
3715
0416
7118
3820
0521
7223
3925
0626
73
Pressure (in H2O)

APP
EN
DIX
B
DE
TA
ILE
D P
RE
SSU
RE
ME
ASU
RE
ME
NT
DA
TA
100
600
GPM
DP
4
13.2
13.4
13.6
13.8
14.0
14.2
14.4
14.6
116
833
550
266
983
610
0311
7013
3715
0416
7118
3820
0521
7223
3925
0626
73
Pressure (psid)
600
GPM
DP
5
94.0
95.0
96.0
97.0
98.0
99.0
100.
0
101.
0
116
833
550
266
983
610
0311
7013
3715
0416
7118
3820
0521
7223
3925
0626
73
Pressure (psid)

APP
EN
DIX
B
DE
TA
ILE
D P
RE
SSU
RE
ME
ASU
RE
ME
NT
DA
TA
101
600
GPM
DP
6
14.6
14.8
15.0
15.2
15.4
15.6
15.8
16.0
116
833
550
266
983
610
0311
7013
3715
0416
7118
3820
0521
7223
3925
0626
73
Pressure (psid)
600
GPM
DP
7
17.8
18.0
18.2
18.4
18.6
18.8
19.0
19.2
19.4
19.6
116
833
550
266
983
610
0311
7013
3715
0416
7118
3820
0521
7223
3925
0626
73
Pressure (psid)

APP
EN
DIX
B
DE
TA
ILE
D P
RE
SSU
RE
ME
ASU
RE
ME
NT
DA
TA
102
600
GPM
DP
8
12.8
13.0
13.2
13.4
13.6
13.8
14.0
14.2
14.4
14.6
116
833
550
266
983
610
0311
7013
3715
0416
7118
3820
0521
7223
3925
0626
73
Pressure (psid)
600
GPM
DP
9
14.6
14.8
15.0
15.2
15.4
15.6
15.8
16.0
116
833
550
266
983
610
0311
7013
3715
0416
7118
3820
0521
7223
3925
0626
73
Pressure (psid)

APP
EN
DIX
B
DE
TA
ILE
D P
RE
SSU
RE
ME
ASU
RE
ME
NT
DA
TA
103
Nom
inal
Flo
w R
ate
675
gpm
Pum
p S
peed
[rpm
]: 35
80.3
Pum
p D
isch
arge
Pre
ssur
e [p
sig]
: 15
3.0
Te
mp
Flow
S
uctio
n In
let
DP
1 D
P2
DP
3 D
P4
DP
5 D
P6
DP
7 D
P8
DP
9
(deg
F)
(gpm
) (in
H2O
) (p
sig)
(in
H2O
) (p
sid)
(in
H2O
) (p
sid)
(p
sid)
(p
sid)
(p
sid)
(p
sid)
(p
sid)
M
edia
n 12
2.07
0 69
1.53
3 51
.443
152.
899
307.
961
96.4
68-1
2.43
5 18
.072
107.
556
19.6
2825
.100
17.6
7119
.904
M
ean
120.
937
690.
384
51.0
2015
3.03
630
7.79
096
.448
-12.
417
18.0
8310
7.60
519
.619
25.1
1117
.659
19.9
14
Std
Dev
1.
719
9.55
3 1.
776
0.37
12.
543
0.31
10.
190
0.06
70.
226
0.10
30.
173
0.08
20.
083
675
GPM
Wat
er T
empe
ratu
re
112
114
116
118
120
122
124
126
116
833
550
266
983
610
0311
7013
3715
0416
7118
3820
0521
7223
3925
0626
73
Temp (deg F)

APP
EN
DIX
B
DE
TA
ILE
D P
RE
SSU
RE
ME
ASU
RE
ME
NT
DA
TA
104
675
GPM
Flo
w R
ate
640
650
660
670
680
690
700
710
720
116
833
550
266
983
610
0311
7013
3715
0416
7118
3820
0521
7223
3925
0626
73
Flow (gpm)
675
GPM
Suc
tion
Hea
d
010203040506070
116
833
550
266
983
610
0311
7013
3715
0416
7118
3820
0521
7223
3925
0626
73
Pressure (in H2O)

APP
EN
DIX
B
DE
TA
ILE
D P
RE
SSU
RE
ME
ASU
RE
ME
NT
DA
TA
105
675
GPM
Inle
t Pre
ssur
e
150.
515
1.0
151.
515
2.0
152.
515
3.0
153.
515
4.0
154.
515
5.0
116
833
550
266
983
610
0311
7013
3715
0416
7118
3820
0521
7223
3925
0626
73
Flow (gpm)
675
GPM
DP
1
285
290
295
300
305
310
315
320
116
833
550
266
983
610
0311
7013
3715
0416
7118
3820
0521
7223
3925
0626
73
Pressure (in H20)
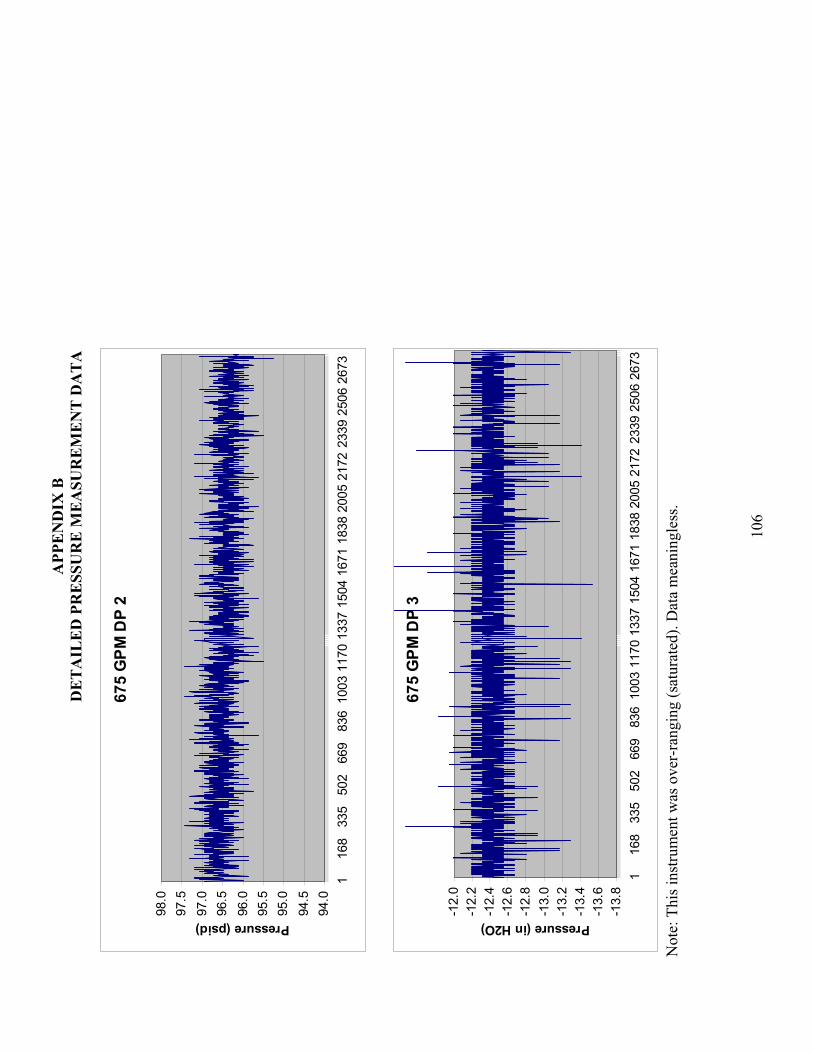
APP
EN
DIX
B
DE
TA
ILE
D P
RE
SSU
RE
ME
ASU
RE
ME
NT
DA
TA
106
675
GPM
DP
2
94.0
94.5
95.0
95.5
96.0
96.5
97.0
97.5
98.0
116
833
550
266
983
610
0311
7013
3715
0416
7118
3820
0521
7223
3925
0626
73
Pressure (psid)
675
GPM
DP
3
-13.
8-1
3.6
-13.
4-1
3.2
-13.
0-1
2.8
-12.
6-1
2.4
-12.
2-1
2.0
116
833
550
266
983
610
0311
7013
3715
0416
7118
3820
0521
7223
3925
0626
73
Pressure (in H2O)
Not
e: T
his i
nstru
men
t was
ove
r-ra
ngin
g (s
atur
ated
). D
ata
mea
ning
less
.

APP
EN
DIX
B
DE
TA
ILE
D P
RE
SSU
RE
ME
ASU
RE
ME
NT
DA
TA
107
675
GPM
DP
4
17.4
17.6
17.8
18.0
18.2
18.4
18.6
116
833
550
266
983
610
0311
7013
3715
0416
7118
3820
0521
7223
3925
0626
73
Pressure (psid)
675
GPM
DP
5
105.
010
5.5
106.
010
6.5
107.
010
7.5
108.
010
8.5
109.
0
116
833
550
266
983
610
0311
7013
3715
0416
7118
3820
0521
7223
3925
0626
73
Pressure (psid)

APP
EN
DIX
B
DE
TA
ILE
D P
RE
SSU
RE
ME
ASU
RE
ME
NT
DA
TA
108
675
GPM
DP
6
18.6
18.8
19.0
19.2
19.4
19.6
19.8
20.0
20.2
116
833
550
266
983
610
0311
7013
3715
0416
7118
3820
0521
7223
3925
0626
73
Pressure (psid)
675
GPM
DP
7
23.8
24.0
24.2
24.4
24.6
24.8
25.0
25.2
25.4
25.6
25.8
26.0
116
833
550
266
983
610
0311
7013
3715
0416
7118
3820
0521
7223
3925
0626
73
Pressure (psid)
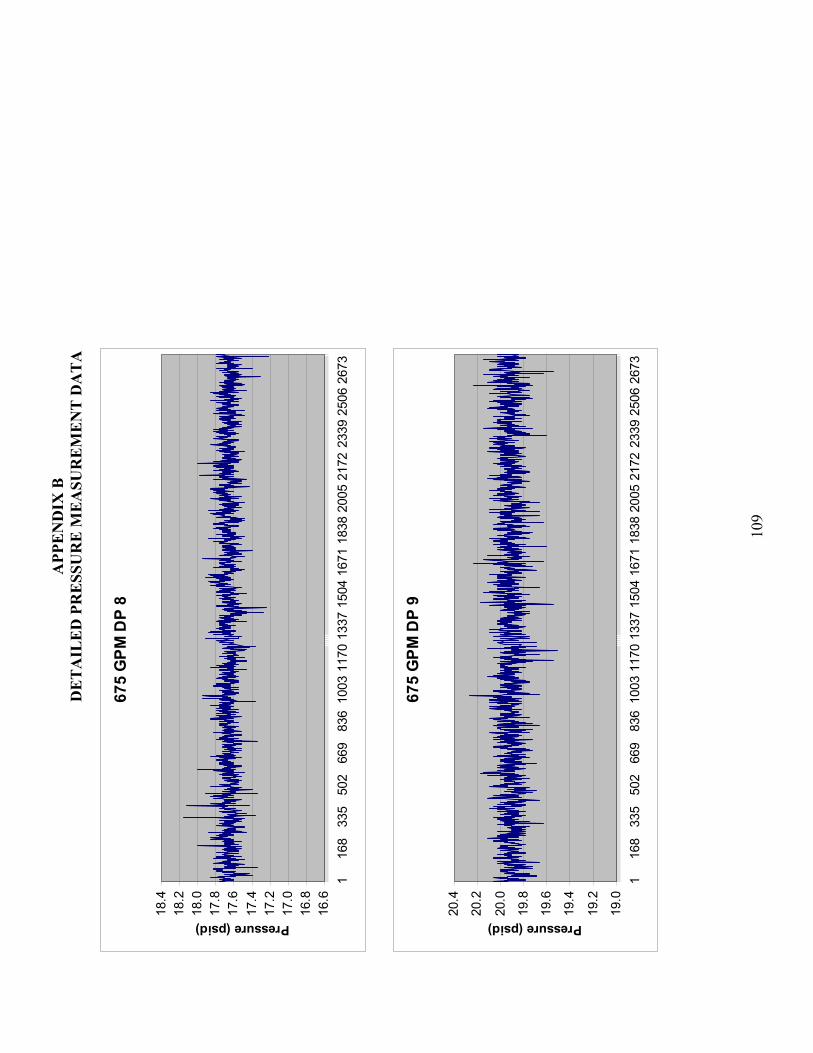
APP
EN
DIX
B
DE
TA
ILE
D P
RE
SSU
RE
ME
ASU
RE
ME
NT
DA
TA
109
675
GPM
DP
8
16.6
16.8
17.0
17.2
17.4
17.6
17.8
18.0
18.2
18.4
116
833
550
266
983
610
0311
7013
3715
0416
7118
3820
0521
7223
3925
0626
73
Pressure (psid)
675
GPM
DP
9
19.0
19.2
19.4
19.6
19.8
20.0
20.2
20.4
116
833
550
266
983
610
0311
7013
3715
0416
7118
3820
0521
7223
3925
0626
73
Pressure (psid)

APPENDIX C: DYNAMIC PRESSURE MEASUREMENT DATA
A dynamic pressure transducer is located in the wall of the simulated flow baffle at the mid height of the simulated booster fuel. It has the capacity for sending signals from 0.2 Hz to the MHz range. The first implementation of the data capture was to pass the voltage signal through an analog-to-digital converter card and record data as a text string in a computer file. This approach captured 258 readings per second. Figures C-1 and C-2 show at two different time scales such data taken with the Hydraulic Test Fixture operating at 400 gpm total flow rate, about 2/3 of the nominal capacity.
-10
-8
-6
-4
-2
0
2
4
6
8
10
0 0.5 1 1.5 2
Time (s)
Sign
al (p
sig)
Figure C-1. Dynamic pressure data for 400 gpm flow through the Hydraulic Test Fixture.
To recover spectral power density, or the frequencies at which pressure oscillations are the strongest, from these data, they are subjected to discrete Fourier transformation. Specifically, for a set of N data points equally spaced at time interval T, it is possible to define a set of N complex coefficients of the transformation equation which correspond to power at discrete frequency intervals F.
mnFTinTxmFXN
n2exp
1
0 (C-1)
where
TF 1 (C-2)

APPENDIX C DYNAMIC PRESSURE MEASUREMENT DATA
111
-10
-8
-6
-4
-2
0
2
4
6
8
10
0 0.02 0.04 0.06 0.08 0.1
Time (s)
Sig
nal (
psig
)
Figure C-2. Higher resolution image of data in Figure 1. Symbols show individual values recorded.
Practically, these values are calculated using sines and cosines with the Euler relation for complex exponentials, and the magnitude of X(mF) is the modulus of the complex number. Conversely, if a complete and accurate set of coefficients X(mF) are known, then the real part of the inverse transformation will reconstruct the original input data.
1
02exp
N
mmnFTimFXnTx (C-3)
As a demonstration of that, consider a set of 100 data points at 10-ms intervals that are samples of the signal
ttttx 38cos56sin1719cos2 (C-4)
Figure C-3 shows the distribution of the data points.

APPENDIX C DYNAMIC PRESSURE MEASUREMENT DATA
112
-30
-20
-10
0
10
20
30
0 0.2 0.4 0.6 0.8 1 1.2
Time (s)
Sign
al
Figure C-3. Input signal defined by Eq. (C-4) showing data points sampled at 10-ms intervals.
Figure C-4 shows the transformed spectral density values derived using Eq. (C-1). Notice that there is a sharp peak corresponding to each of the frequencies in Eq. (C-4). Also, there is a correspondence between the amplitude of each term in Eq. (C-4) and the peak height in Figure C-4.
0
100
200
300
400
500
600
700
800
900
0 10 20 30 40 50 60 70 80 90 100
Frequency (Hz)
Spec
tral
Den
sity
Figure C-4. Spectral density of the signal with data points shown in Figure 1.

APPENDIX C DYNAMIC PRESSURE MEASUREMENT DATA
113
Notice that in addition to peaks at the three frequencies input to the signal, there are mirror images of those peaks at frequencies coming negatively from the highest value as a consequence of aliasing.
The inverse transform reproduces the original data points, as shown in Figure C-5. They fall directly on top of the data sample values of Figure C-1.
-30
-20
-10
0
10
20
30
0 0.2 0.4 0.6 0.8 1 1.2
Time (s)
Sign
al
Figure C-5. Reconstructed data points using the inverse transform of Eq. (C-4). The original sampled signal appears as the continuous line.
The actual vibration data for tests in the Gas Test Loop Hydraulic Test Fixture were taken at nominal total circulating flow rates of 200, 250, 300, 350, 400, 450, 500, 550, 600, and 675 gpm. For each flow rate, measurements were taken at 0.00002-s intervals over a 0.2-sec period using the recording capabilities of a digital oscilloscope. Figure C-6 shows the data sets and the lower frequency half of the discrete Fourier transform. The upper frequency half is the mirror image of the lower. Figure 20 in the main report is the superposition of the charts on the right side of Figure C-6.
One of the persistent peak series in the spectral density data is at the frequencies for each flow rate at which the pump impeller blades pass the pump outlet. This frequency is indicated with a red line in the spectral density plots. Because the discrete Fourier transform process only gives spectral density at specific and equally spaced frequencies, a sharp peak falling between two of those frequencies may appear to be relatively weak and shared between two or more frequencies. Also, because of natural resonance modes, it may be that harmonics or integral multiple frequencies, may also be excited under some circumstances.
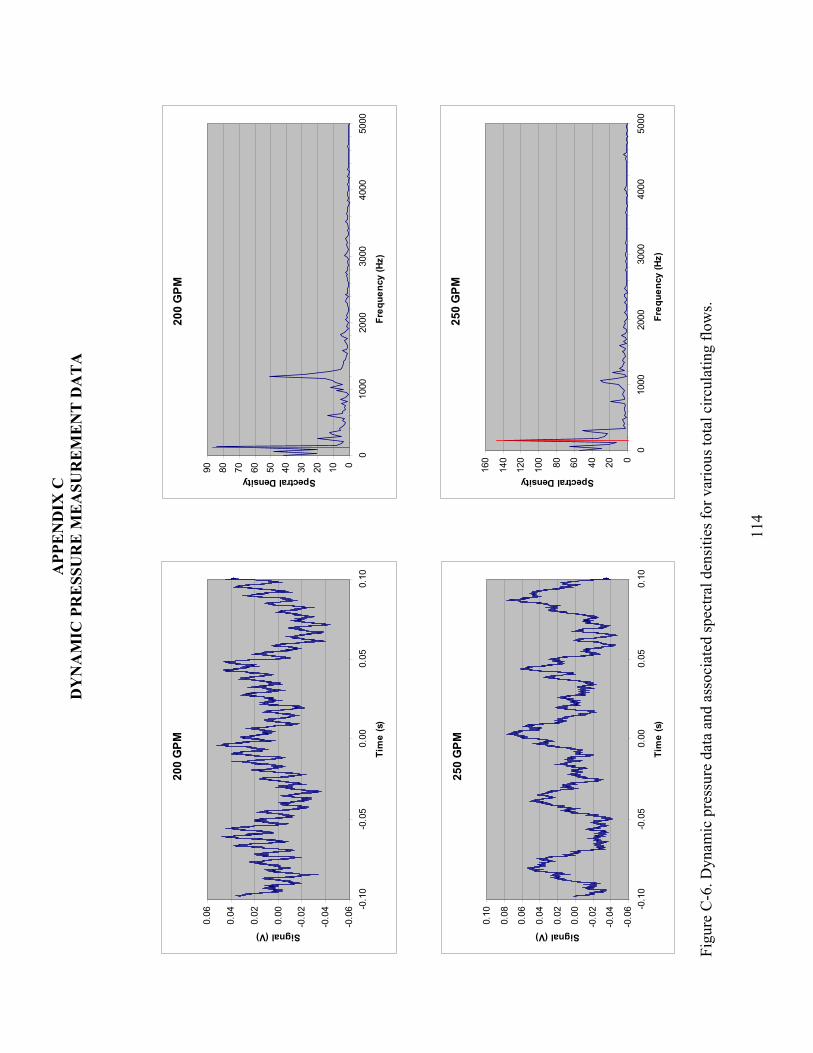
APP
EN
DIX
C
DY
NA
MIC
PR
ESS
UR
E M
EA
SUR
EM
EN
T D
AT
A
114
200
GPM
-0.0
6
-0.0
4
-0.0
2
0.00
0.02
0.04
0.06
-0.1
0-0
.05
0.00
0.05
0.10
Tim
e (s
)
Signal (V)
200
GPM
0102030405060708090
010
0020
0030
0040
0050
00
Freq
uenc
y (H
z)
Spectral Density
250
GPM
-0.0
6
-0.0
4
-0.0
2
0.00
0.02
0.04
0.06
0.08
0.10
-0.1
0-0
.05
0.00
0.05
0.10
Tim
e (s
)
Signal (V)
250
GPM
020406080100
120
140
160
010
0020
0030
0040
0050
00
Freq
uenc
y (H
z)
Spectral Density
Figu
re C
-6. D
ynam
ic p
ress
ure
data
and
ass
ocia
ted
spec
tral d
ensi
ties f
or v
ario
us to
tal c
ircul
atin
g flo
ws.

APP
EN
DIX
C
DY
NA
MIC
PR
ESS
UR
E M
EA
SUR
EM
EN
T D
AT
A
115
300
GPM
-0.0
8
-0.0
6
-0.0
4
-0.0
2
0.00
0.02
0.04
0.06
0.08
0.10
-0.1
0-0
.05
0.00
0.05
0.10
Tim
e (s
)
Signal (V)
300
GPM
020406080100
120
010
0020
0030
0040
0050
00
Freq
uenc
y (H
z)
Spectral Density
350
GPM
-0.4
0
-0.3
0
-0.2
0
-0.1
0
0.00
0.10
0.20
0.30
0.40
-0.1
0-0
.05
0.00
0.05
0.10
Tim
e (s
)
Signal (V)
350
GPM
0
200
400
600
800
1000
1200
010
0020
0030
0040
0050
00
Freq
uenc
y (H
z)
Spectral Density
Figu
re C
-6 C
ontin
ued.
Dyn
amic
pre
ssur
e da
ta a
nd a
ssoc
iate
d sp
ectra
l den
sitie
s for
var
ious
tota
l circ
ulat
ing
flow
s.

APP
EN
DIX
C
DY
NA
MIC
PR
ESS
UR
E M
EA
SUR
EM
EN
T D
AT
A
116
400
GPM
-0.4
0
-0.3
0
-0.2
0
-0.1
0
0.00
0.10
0.20
0.30
0.40
-0.1
0-0
.05
0.00
0.05
0.10
Tim
e (s
)
Signal (V)
400
GPM
0
100
200
300
400
500
600
700
800
900
010
0020
0030
0040
0050
00
Freq
uenc
y (H
z)
Spectral Density
450
GPM
-0.3
0
-0.2
0
-0.1
0
0.00
0.10
0.20
0.30
-0.1
0-0
.05
0.00
0.05
0.10
Tim
e (s
)
Signal (V)
450
GP
M
0
100
200
300
400
500
600
010
0020
0030
0040
0050
00
Freq
uenc
y (H
z)
Spectral Density
Figu
re C
-6 C
ontin
ued.
Dyn
amic
pre
ssur
e da
ta a
nd a
ssoc
iate
d sp
ectra
l den
sitie
s for
var
ious
tota
l circ
ulat
ing
flow
s.

APP
EN
DIX
C
DY
NA
MIC
PR
ESS
UR
E M
EA
SUR
EM
EN
T D
AT
A
117
500
GPM
-0.2
5-0
.20
-0.1
5-0
.10
-0.0
50.
000.
050.
100.
150.
200.
25
-0.1
0-0
.05
0.00
0.05
0.10
Tim
e (s
)
Signal (V)
500
GPM
050100
150
200
250
300
350
400
450
500
010
0020
0030
0040
0050
00
Freq
uenc
y (H
z)
Spectral Density
550
GPM
-0.2
0
-0.1
5
-0.1
0
-0.0
5
0.00
0.05
0.10
0.15
0.20
0.25
-0.1
0-0
.05
0.00
0.05
0.10
Tim
e (s
)
Signal (V)
550
GPM
050100
150
200
250
300
350
010
0020
0030
0040
0050
00
Freq
uenc
y (H
z)
Spectral Density
Figu
re C
-6 C
ontin
ued.
Dyn
amic
pre
ssur
e da
ta a
nd a
ssoc
iate
d sp
ectra
l den
sitie
s for
var
ious
tota
l circ
ulat
ing
flow
s.

APP
EN
DIX
C
DY
NA
MIC
PR
ESS
UR
E M
EA
SUR
EM
EN
T D
AT
A
118
600
GPM
-0.4
0
-0.3
0
-0.2
0
-0.1
0
0.00
0.10
0.20
0.30
0.40
-0.1
0-0
.05
0.00
0.05
0.10
Tim
e (s
)
Signal (V)
600
GPM
0
100
200
300
400
500
600
010
0020
0030
0040
0050
00
Freq
uenc
y (H
z)
Spectral Density
675
GPM
-0.4
0
-0.3
0
-0.2
0
-0.1
0
0.00
0.10
0.20
0.30
0.40
-0.1
0-0
.05
0.00
0.05
0.10
Tim
e (s
)
Signal (V)
675
GPM
0
100
200
300
400
500
600
700
010
0020
0030
0040
0050
00
Freq
uenc
y (H
z)
Spectral Density
Figu
re 6
Con
clud
ed. D
ynam
ic p
ress
ure
data
and
ass
ocia
ted
spec
tral d
ensi
ties f
or v
ario
us to
tal c
ircul
atin
g flo
ws.

APPENDIX D: STROUHAL NUMBER ANALYSIS
From dimensional analysis for an oscillating flow, it can be shown that
VtfnVtwv (D-1)
or
St=fn(Re) (D-2)
where the Reynolds number is given by the ratio of inertia to viscosity
VtRe (D-3)
and the Stanton number is given by the ratio of the oscillation to the mean speed
VtwSt v (D-4)
In these equations
V = flow velocity
wv = vortex shedding frequency
t = characteristic length (plate thickness or hydraulic radius)
= kinematic viscosity of the fluid
Vortex shedding occurs for 102<Re<107 and numerous experiments have shown that the Strouhal number remains approximately constant ( 0.2) over this range of Reynolds numbers. Resonance can occur if the vortex shedding frequency is close to the structural vibration frequency of the plates. The frequencies of such vortex shedding may be approximated by
tAStQ
tVStw
cv (D-5)
where Q is the volumetric flow rate and Ac is the cross-sectional flow area.
Pressure pulsations sensed by the dynamic pressure transducer in the Hydraulic Test Fixture could possibly come from the vortices shed from the trailing edge of the web in the upper block of the booster fuel assembly. In that case
cA is 1.618 in2, and t may be
taken as the web thickness at its end of 0.1 inch. Volumetric flowrates, Q, would be ¼ of the flows measured by the turbine flow meter. Frequencies would then be calculated using the second form in Eq. (D-4).

APPENDIX D STROUHAL NUMBER ANALYSIS
120
Another possibility is that the vortices are generated at the inlet to the flow channel between the outermost fuel plate and the model flow baffle. In that case, we may use the channel width, 0.078 inch for t and the flow velocities measured by the Pitot tube in that channel with the first form of Eq. (D-5).
Tabular representations of these results are listed in Table D-1. Figure D-1 compares these with those measured by the dynamic pressure transducer. It appears that at the higher flows, the vortex shedding may be at the inlet to the fuel plates.
Table D-1. Predicted vortex shedding frequencies for two different assumptions on geometry.
Q
(gpm)
VPitot
(ft/s)
Wv (Fuel Channel)
(Hz)
wv (gap)
(Hz)
203.8 16.6 510.3 242.5
255.8 20.9 641.6 304.3
294.7 24.0 737.0 350.7
365.4 29.5 907.0 434.7
415.8 33.5 1030.3 494.7
461.5 37.0 1137.7 549.1
502.4 40.5 1245.9 597.7
561.2 44.8 1377.4 667.6
601.9 48.1 1480.3 716.1
690.4 54.7 1682.6 821.4

APPENDIX D STROUHAL NUMBER ANALYSIS
121
0
200
400
600
800
1000
1200
1400
1600
1800
2000
0 200 400 600 800
Flow Rate (gpm)
Freq
uenc
y (H
z)
Major PeakMinor Peak HigherMinor Peak LowerFit LineFuel ChannelGap
Figure D-1. Comparison of vibration peaks measured with theoretical predictions based on geometry of the fuel plate entrance (Fuel Channel) and that of the gap between the upper cap and the fuel plates (gap).
Reference
White, F.M., Fluid Mechanics, 5th Edition, McGraw Hill, p. 312-313.


APPENDIX E: CHEMICAL TREATMENT DETAILS
This document provides technical detail on surface treatment procedures for coating the aluminum components of the Hydraulic Test Fixture for the Gas Test Loop.
VolumesFour volumes will be important in the processing: (1) that of the model booster fuel element, (2) that of the wash trough, (3) that of the boiling vessel, and (4) that of the model flow baffle.
Model Fuel Element A rough approximation of the displacement volume of the model booster fuel element is had by considering three plates of arc length 90 , radii 2.19, 2.37, and 2.55 inches, each 0.100 inch thick and 49.5 inches long; two side plates that are essentially 0.22 x 0.58 x 61 inches (count only half the volume because of spatial overlap with assumed fuel plate widths); and upper and lower spades consisting collectively of a plate 18 inches long, 0.125 inch thick and 3.3 inches wide. The result is
L16.11000
54.23.3125.186158.022.0100.05.4955.237.219.22
3
Wash Trough The wash trough volume is approximately that of a rectangular prism with a 5 x 5-inch cross section and an 84-inch length.
L4.341000
54.284553
Because this trough will not be completely filled with fluid and the model fuel element will occupy just over 1 L, 30 L should be an adequate volume to fill it.
Boiling Tank This vessel has also a 5 x 5-inch internal cross section. It is 78 inches long and it has a 2.4-inch diameter cylinder 36 inches long removed from the liquid volume. Thus its volume is
L3.291000
54.2362.178553
2
Model Flow Baffle This is a cylinder 5.25 inches in ID and 77.7 inches long. Additionally, there is a supplementary volume in the lower containment bucket that is a circular disk 6 inches in diameter and about 1.25 inches thick.
L9.271000
54.225.167.7725.54
322

APPENDIX E CORROSION RESISTANT COATING PROCEDURE
124
So assuming the same liquid can be used for cleaning all 4 fuel elements and the inside of the flow baffle, it looks like one should prepare a 30 liter (7.9 gal) batch of washing mixture.
Chemicals
NaOHSuggested supplier is Sigma-Aldrich, https://www.sigmaaldrich.com/. Order reagent grade anhydrous NaOH pellets, CAS Number: 1310-73-2, product number S5881-5KG. This will get 5 kg of pellets of >98% pure NaOH for $150.
HNO3
For 30 L of 10% acid solution purchase 2 ea Sigma-Aldrich ACS reagent, 70% Nitric Acid, CAS Number 7697, product number 438073-2.5L for $64.70 each. This will total 5 L of 70% solution (HNO3 in water).
EthanolStandard ethanol (e.g., Sigma-Aldrich anhydrous denatured ethanol, 190 proof, CAS number 64-17-5, product number 493538-4L, $143) should be used for pre-washing of components to be coated.
HClThis acid will be needed to react with the NaOH prior to its disposal. It will require 2 each Sigma-Aldrich 37% HCl, reagent grade product number 435570-2.5L @ $31.10.
NaHCO3
Sodium bicarbonate or baking soda is available at any grocery store. About 6 lb will be needed which in a grocery store will cost no more than $10. It is also available as Sigma-Aldrich part number S6014-5KG (reagent grade) for $56.50 for 2.5 kg.
Mixing/Dispensing Jugs Solutions should be prepared in high-density polyethylene containers. Recommended containers are similar to the Scienceware five-gallon HDPE jug that has flat sides, rounded corners, carrying handle, and bottom grip for pouring. The fill opening is 52 mm and contains a screw-cap having center thread for spigot, included. It is available as Sigma-Aldrich product number Z178365-1EA @ $28.10. At least 6 will be needed.
SolutionsSolutions outlined below should be prepared in a fume hood or in a space with equivalent ventilation to prevent fume inhalation by workers.

APPENDIX E CORROSION RESISTANT COATING PROCEDURE
125
Safety Notes 1. Sodium hydroxide is a strong caustic and will cause severe chemical burns if it
contacts the skin or eyes. Wear a lab coat, chemical apron, chemical goggles, face shield, and neoprene gauntlet gloves when working with or around this caustic.
2. Nitric and hydrochloric acids will cause severe chemical burns if they contact the skin or eyes. Wear a lab coat, chemical apron, chemical goggles, face shield, and neoprene gauntlet gloves when working with or around these acids.
3. Use only with positive exhaust ventilation. Do not breathe fumes or vapors as they can cause internal burns.
See MSDS for the respective compounds for details
Cleaning Solution Dissolve 2.25 kg of NaOH in 30 L of deionized water. It is exothermic on solution in water (-10.25 kcal/gmole). Heat generated will be
calgmole
cal
gmoleg
g 51077.5250,1040
250,2
This will raise the temperature of 30 L of water by 19.2 C.
This solution will be fully alkaline (pH = 14) and will require neutralization before disposal.
Etching Solution Mix 4.28 L of 70% HNO3 with 25.72 L of deionized water to make 30 L of 10% HNO3solution. Its pH will be 2.0. It also will require neutralization before disposal.
Boiling Solution A pH of 8.5 in the mixture for boiling will be achieved with 3.16E-6 N solution (10-5.5 = 3.16E-6 gram-equivalent or 0.126 mg per liter) or 3.79 mg of NaOH in 30 liters of water. Crush a NaOH pellet or collect dust from the container to this amount and mix with deionized water. Verify the pH with a pH meter (e.g., Omega Engineering PHH224 meter, $289, and PHE-4202 double junction electrode, $65, http://www.omega.com/) and adjust mixture as needed. This solution will not need neutralization before disposal.
DisposalThe solution used for boiling will be directly disposable in city sewers.
The 10% HNO3 will have to be neutralized or diluted before disposal. One thousand to one dilution will be required to get its pH up to 5.0 where it can be safely disposed of. The alternative is to neutralize it. If one considers its reaction with NaOH,
gOlOHaqNaNOaqNaOHaqHNO 2233 41
21

APPENDIX E CORROSION RESISTANT COATING PROCEDURE
126
the free energy of the products on the right side ( Fo = -118.3 kcal/gmole) is higher than that of the reactants ( Fo = -126.6 kcal/gmole), so the reaction would actually go to the left. A better neutralizer is baking soda.
gHcNaCOcNaHCOaqHNO 2333
where the free energy is 30.3 kcal/gmole to the right. There will be about 31.7 gmole of HNO3 to neutralize, which will require 2.66 kg (5.9 lb) of soda. There will also be a gas release of approximately 710 L of H2 from the reaction. Therefore, small amounts of the soda should be added at any one time and adequate ventilation should be provided to ensure that the hydrogen never exceeds the lower flammability limit of 4% in air.
Disposal of the NaOH solution will also require neutralization. Dilution would require 105 to 1 mixing to get the pH down to 9. Neutralize by diluting the 30% HCl by about 10 to 1 and mixing with the NaOH solution. The reaction
OHNaClNaOHHCl 2will liberate only about 2 kcal/gmole, so heating will not be an issue, nor will there be any gas production.
Processes
SetupArrange to perform all chemical operations in a fume hood or in a space with equivalent ventilation. Because the vessels to be used are large, performing them outdoors or with fans blowing fumes directly outdoors may be sufficient. Consult safety professional as needed for advice as to setup.
Remove the model flow baffle from the Hydraulic Test Fixture. Remove the stainless steel lower support ring by removing the mounting bolts holding it in the model flow baffle. Remove any CONAX fittings or metal pipe plugs still in the model flow baffle.
Replace metallic pipe plugs in any openings with nylon pipe plugs (20 ea McMaster Carr #48335K152 nylon hex-head pipe plug ¼” NPT @$0.63, 4 ea McMaster Carr #48335K155 Nylon hex head pipe plug, ¾” NPT @$0.59; these are also available at local hardware stores). Use Teflon tape to ensure seal. Plug the holes for the lower support ring mounting bolts using 4 ea McMaster Carr #91345A680 plastic flange-head ¼ - 20 capscrew ½ inch long (pack of 25 $11.66) with 4 ea McMaster Carr #9559K15, AS568A-10, PTFE O-rings, ¼” ID 1/16” thick (Pack of 50 $14.50). Source: http://www.mcmaster.com/.
Locate the model fuel element cleaning trough on a flat, level surface above ground level so that fluid can be drained from the trough into receptacles.
Secure the rectangular aluminum boiling vessel to a vertical support as needed for safety and stability. Wrap it with an insulting blanket (e.g. fiberglass insulation or conventional
APPENDIX E CORROSION RESISTANT COATING PROCEDURE
127
fabric insulating blanket) to facilitate heat retention (may be best done after filling to avoid getting the blanket wet). Note that fluid removal from the boiling tank is intended to be done by siphoning using any available flexible hose.
Clean/wipeClean all surfaces to be cleaned and coated with Ethanol and allow excess ethanol to evaporate before proceeding. (use a rag as needed). For model fuel plate surfaces, this should be done by immersion in the cleaning trough. Wipe the inside of the model flow baffle with an ethanol soaked rag or sponge, Clean the outside of the model flow baffle below the lower mounting flange. Also clean the inside of the model flow baffle closure bucket. Do not touch components with anything but clean cotton gloves after cleaning.
After cleaning the model flow baffle, attach the model flow baffle closure bucket to the model flow baffle using the existing gasket and bolt/nut sets used to attach the model flow baffle section to the lower plenum. Then, with the bottom of the assembly resting on a support such as a box or table sufficiently high to allow drainage from the drain valve into the mixing/storage vessel, secure the model flow baffle assembly with the bucket attached in the upright orientation to a vertical support to prevent its tipping over.
Caustic Cleaning Carefully pour about 23 L (6 gal) of the cleaning (NaOH) solution into the cleaning trough. Without touching the model booster fuel elements, lower each into the caustic cleaning solution. A suggested technique is to tie stout (>20 lb test) nylon fish line, or secure long plastic bundle ties, to each end of the element, possibly at the welded joints where the plates are connected to the end spades. Place one end in the trough at one end of the trough and lower the other end into the solution. Add caustic solution as needed to ensure that the solution adequately covers the element. Soak/dip the model fuel element for 5 minutes or until all corrosion products have been removed from the surface of the assembly. Some stirring or agitation of the bath during cleaning may be helpful in minimizing smut buildup. The same solution can be used for all four model fuel elements.
When a model fuel element is removed from the solution, place it on clean blotter paper while cleaning the other elements. Do not allow it to come in contact with metallic surfaces.
Transfer the remaining caustic cleaning fluid in the mixing container(s) to the upright model flow baffle. Add sufficient fluid from the cleaning trough to fill the model flow baffle to within one inch of the top. After at least 5 minutes but not more than 15 minutes, drain the fluid from the model flow baffle assembly
Etch Rinse Rinse the plates with clean de-ionized (DI) water at least three times. Brushing or wiping of the surfaces with a soft nylon-bristled brush may be necessary to remove smut

APPENDIX E CORROSION RESISTANT COATING PROCEDURE
128
remaining from the caustic cleaning step. (A small brush such as a toothbrush may be helpful in getting into corners or crevices on the assembly). This may be done for the model booster fuel assemblies in the cleaning trough if it is first flushed with deionized water to get the residues from cleaning out.
Bright Etch Place about 27 L (6 gal) of 10% HNO3 solution in the cleaning trough. Using the same technique as previously, place the model booster fuel elements in the trough one at a time. Soak/dip the model fuel elements for 5 minutes or more. The same solution can be used for all four plates.
When the model booster fuel elements have been etched, repeat the process on the model flow baffle by transferring the etching fluid into the model flow baffle/bucket assembly and leaving it there for at least 5 minutes but not longer than 15 minutes. After removal from the etching fluid, do not let the model fuel assemblies come in contact with other metal surfaces.
Final Rinse Rinse the model booster fuel elements in DI water at least three times. Again, the cleaning trough may be used if it is first flushed with DI water and it is emptied between each rinse. Also rinse the model flow baffle assembly.
Hydroxide Seal Insert the cleaned and etched model booster fuel elements in the square aluminum boiling vessel, taking care to ensure that there is no contact between the model booster fuel element and the electrical heating element. Fill the vessel with the boiling solution (pH = 8 to 8.5, ambient temperature). The model fuel element must be fully submerged in the soluton.) Bring the solution to a vigorous boil (100°C or local boiling temperature) and boil the plate assembly for 15 minutes minimum.
Repeat the boiling process for each of the model booster fuel elements. Verify fluid pH before each boiling cycle. Add small amounts of NaOH or water as necessary to maintain it in the 8.0 to 8.5 range.
Remove the insulating blanket from the boiling vessel and wait until the solution has cooled at least to 50 C (to avoid possible burns while handling). Then, transfer the solution from the boiling tank to the model flow baffle assembly. Transfer the heating element assembly from the square aluminum boiling vessel to the model flow baffle assembly. Wrap the model flow baffle assembly in the insulating blanket and bring the water to a boil for at least 15 minutes.
DryingRemove the plates from the boiling tank while still hot so the water will quickly evaporate from the surfaces. Allow the plates to age at room temperature for a minimum

APPENDIX E CORROSION RESISTANT COATING PROCEDURE
129
of 3 days before placing them back in water. Do not allow plates to rest in contact with other metals during this aging time.
Drain the liquid from the model flow baffle assembly through the valve at the bottom of the bucket. It would be best to wait until it has cooled to about 80 C or less. As soon as the model flow baffle can be safely touched without risk of burning, separate it from the bucket and allow it to air dry.
Reassembly
FittingsRemove the nylon pipe plugs and plastic screws from the openings in the model flow baffle and replace the stainless steel plugs or the CONAX fittings to their original positions (except the one ¾-inch CONAX fitting through which the Pitot tube leads come) using Teflon tape to assist in sealing.
Model Booster Fuel Reinstall the Pitot tube assembly to the instrumented model booster fuel plate (suggest Steve Russell from INL North Holmes Laboratory do this). Wear cotton, rubber or plastic gloves to prevent contamination of the aluminum surfaces.
Clean the lower support ring with ethanol, allowing it to air dry. Then, install the lower support ring into the model flow baffle, securing it with the 4 mounting screws. Wear cotton, rubber or plastic gloves and long sleeves to prevent contaminating the surfaces.
Install the instrumented model booster fuel assembly wearing cotton, rubber or plastic gloves and long sleeves to prevent contaminating the surfaces. Guide the new Pitot tube leads through the CONAX fitting hole and reinstall the CONAX fitting.
Model Flow Baffle Reinstall the model flow baffle to the lower plenum. Take care to avoid skin contact or other contamination of the inner surface of the model flow baffle and the outer surfaces beyond the mounting flanges, where there is close proximity to the stainless steel components of the upper and lower plena.
Complete assembly of the upper plenum, installation of the remaining model booster fuel elements, the mockup in-pile tube, and top closure.
RemainderConnect all ducts, pressure tubes, and other diagnostics as needed, verify function, and proceed with testing.
It is recommended that the hydraulic test loop not be emptied of water until testing has been completed. Once testing is complete, remove the model booster fuel elements and

APPENDIX E CORROSION RESISTANT COATING PROCEDURE
130
let them dry. To the extent practical, remove water from the gap between the upper plenum and the top of the model flow baffle. Leave the system in as dry a condition as possible.

APPENDIX F: PUMP AND CONTROLLER SPECIFICATIONS

APPENDIX F PUMP AND CONTROLLER SPECIFICATIONS
132

APPENDIX F PUMP AND CONTROLLER SPECIFICATIONS
133

APPENDIX F PUMP AND CONTROLLER SPECIFICATIONS
134

APPENDIX F PUMP AND CONTROLLER SPECIFICATIONS
135

APPENDIX G: DESIGN STUDY FOR
GTL HYDRAULIC TEST FIXTURE SUPPORT
OBJECTIVEProvide vertical support for the Hydraulic Test Fixture (HTF) of the Gas Test Loop (GTL) hydraulic test apparatus.
BACKGROUNDThe GTL program requires that accurate hydraulic flow parameters be measured on a model of the GTL Booster Fuel Assembly (BFA). The Institute for Nuclear Science and Engineering (INSE), a collaboration between the University of Idaho (UI) and Idaho State University (ISU), working at the ISU Thermal Fluids Laboratory, has been subcontracted to design and build elements of the flow test loop other than the HTF, which will be designed and built by the Idaho National Laboratory (INL).
The basic concern is that the HTF has a large heavy mass at the bottom and another at the top connected by a rather slender stalk or spool section. It will be necessary to support the weight of the upper part and secure it from lateral motion to prevent distortion or failure of the connecting spool segment. The estimated weight of the upper plenum when filled with water is in the vicinity of 1,900 lbm (Annex 1). It is likely that in addition to the loads calculated here, the frame will need to carry the weight of some piping sections and the water that is in them. The HTF will be located within an existing support frame.
REQUIREMENTSSeveral general requirements should be met.
1. The supporting structure should carry the most of the weight of the upper plenum. 2. It should provide lateral and vertical stability to prevent motion of the upper part relative
to the laboratory reference frame. 3. To the extent possible, the supporting structure should not obstruct access to the HTF,
particularly in areas such as flange attachments, instrument ports, or other locations where activities will need to be performed during the setup or conduct of the tests.
4. The design should minimize the need for modification of the existing support frame. 5. It should provide an internal adjustment or leveling capability to compensate for floor
slope or other misalignment in construction or assembly. 6. It should allow for assembly of the HTF after the support structure is in place.
CONSIDERATIONS First is the question of how to interface with the HTF: where should the supporting forces be applied. Considerations included suspension from the top of the plenum tank top head, from the bottom of the plenum tank slip-on flange, from the plenum tank shell, and from the bottom of the plenum tank lower head. Considering the above requirements and the relative fragility of the

APPENDIX G DESIGN STUDY FOR
GTL HYDRAULIC TEST FIXTURE SUPPORT
138
shell, the preferred weight-bearing surface is the bottom of the plenum tank lower head, as shown in Figure 1.
Figure 1. The preferred bearing surface is the bottom of the plenum tank lower head.
Horizontal forces on the plenum should be small. Lateral stabilization may be provided by a clamping band that could go around the plenum tank slip-on flange and around one or both of the north support columns that would hold that flange against the columns without any bending moments. A similar band around the shell of the plenum tank was considered, but that wall is relatively thin, and it would impose a bending moment from the force couple between the flange contact point with the columns and the restraint plane at the band location. A third and preferable option is to apply a lateral constraining force to the lower part of the periphery of the same plenum tank lower head that the weight-bearing force is applied to. Lateral force on the flux trap baffle flange below the preferred bearing surface was also considered. It was discarded as an option because it will be necessary to make the attachment of the flux trap baffle flange with the plenum tank in place, without constraint on the flux trap baffle flange.
DESIGNA pictorial depiction of the concept arrived at appears as Figure 2. The basic frame is constructed of 3” x 3” x ¼” thick square carbon steel tubing with welded joints. It sits just inside the existing columns and is fastened to them either by clamping or by welding simple plates to the column flanges. A support ring has three 1” x 10” long high-strength bolts welded to it. These are supported on the frame with adjustable heavy hex nuts and washers. A fence around the support ring has adjustable hex head bolts that clamp on the lower head edge. The support frame is installed before any of the HTF components. The plenum tank is lowered onto the frame, and the support ring is adjusted to provide a good fit with the flux trap baflle flange coming up from the mockup flow distribution tank.

APPENDIX G DESIGN STUDY FOR
GTL HYDRAULIC TEST FIXTURE SUPPORT
139
Figure 2. Concept for support structure for the Hydraulic Test Fixture Plenum Tank.
104.0 85.00
1.561.0
113.519.4
9.7
19.4
10.6

APPENDIX G DESIGN STUDY FOR
GTL HYDRAULIC TEST FIXTURE SUPPORT
140

APPENDIX G DESIGN STUDY FOR
GTL HYDRAULIC TEST FIXTURE SUPPORT
141
Stress Analysis A simple stress analysis was performed to verify that the frame will be strong enough to support the required weight (Annex 2). Using 30,000 lbf/in2 as the yield strength of the steel (no credit taken for heat treatment), the safety factor for all frame members in tension or compression was greater than 48.5. Buckling analysis assuming all members were pinned at the ends gave a minimum safety factor of 163 for the vertical support legs. Every other member had a greater buckling safety factor. The members holding the adjustable support bolts were examined for bending stresses. The peak bending stress was estimated to be about 490 lbf/in2. well below the yield stress of the steel. Examination of bearing and shear stresses in the nuts transmitting the loads through the three supporting screws also showed no cause for concern.
WeldingNo formal welding design or analysis was performed. The main consideration in welding is to have the material thickness through the weld joints at least as great as in the structural members themselves. Though local deformations will take place as welds cool, residual stresses will not affect joint strengths significantly. Also, it is generally recognized that welds themselves are stronger than the matrix being joined. Therefore, a reasonable requirement is for welding to be 3/16-inch fillet or flare bevel weld all around.
A further consideration is that most of the members are in compression. Thus, the welds on those members will not have to carry large tensile loads. Visual inspection should be adequate for weld quality. Factors of safety in the structural members are sufficiently high that further weld qualification seems unnecessary.
Thus, for stainless steel welds, observe INL Weld Specification S2.24 (GTAW) using AWS A5.9 filler material. For the carbon steel (A-500), follow INL Weld specification C3.5 (GTAW) using AWS A5.28 filler material. Perform Visual Inspections per INL TPR-4981.

APPENDIX G DESIGN STUDY FOR
GTL HYDRAULIC TEST FIXTURE SUPPORT
142
ANNEX 1 ESTIMATION OF UPPER STRUCTURE WEIGHT
The Plenum Tank structure was assumed to consist of a top head, an upper flange, a lower head, a shell, four inlet flanges, an inner flow sleeve, a perforated flow baffle plate, studs and nuts, and the water that fills the structure. The weights of these components are computed as follows.
Top Head The top head is a right circular cylinder 36 inches in diameter and 3 inches thick, assumed to be made of aluminum (0.097 lbm/in3).
lbminlbminin 296097.03
236
3
2
Upper Flange The upper flange is assumed to be a composite annulus 36 inches in O.D. at 2.7 inches thick and 27.6 inches in O.D. at 4.19 inches thick with a hole 24.3 inches in diameter. It is made of stainless steel at 0.282 lbm/in3.
lbminlbminininin 478282.019.43.246.277.26.2736
4 3222222
Lower Head The lower head is taken to be a stainless steel annulus 24 inches in O.D. and 8 inches in I.D. that is 3.5 inches thick.
lbminlbminin 397282.05.3824
4 3222
ShellThe cylindrical structure forming the outer wall of the upper chamber is essentially a cylindrical stainless steel plate 24 inches in diameter, 18 inches high, and ½ inch thick.
lbminlbmininin 191282.05.01824 3
Inlet Flanges There are four inlet flanges, each consisting of an annular plate 7.5 inches in O.D., 2.5 inches in I.D. and 0.94 inches thick. The plate is connected to duct sections each assumed to be 4.6 inches in O.D., 2.5 inches in I.D. and 9.0 inches long. These are of stainless steel.
lbminlbminininin 1604282.00.95.26.494.05.25.7
4 3222222

APPENDIX G DESIGN STUDY FOR
GTL HYDRAULIC TEST FIXTURE SUPPORT
143
Inner Sleeve The inner flow sleeve is taken to be a stainless steel cylindrical plate 16 inches in diameter, 14 inches high, and 0.25 inches thick.
lbminlbmininin 50282.025.01416 3
Perforated Flow Baffle Plate The perforated flow baffle plate is assumed to be made from 0.25 thick stainless steel. It is an annulus 22.875 inches in O.D. and 16.125 inches in I.D. that has 90 holes each ½ inch in diameter.
lbminlbmininin 14282.025.05.090125.16875.22
422222
Studs and Nuts Shafts for the studs and nuts are assumed to be included in the structures through which they pass (may be low because of lower aluminum density). Each end of each of the 24 studs is assumed to have the same cylindrical structure representative of a nut. These are taken to be 1.5 inch in diameter and be 1.5 inches high.
lbminlbminin 36242282.05.15.1
4 322
WaterThe water volume is approximately the sum of the 23-inch by 17-inch cylindrical chamber volume and the four 2.5-inch by 9-inch cylindrical inlet flange volumes. Water density is taken as 0.036 lbm/in3.
lbminlbminininin 256036.0495.21723
4 32222
The combined weight of all these components is 1,879 lbm.

APPENDIX G DESIGN STUDY FOR
GTL HYDRAULIC TEST FIXTURE SUPPORT
144
ANNEX 2 STRESS ANALYSIS
A simplified stress analysis was performed to assure that the frame would support the required loads. The first calculations addressed element loads of the structure considered as a space truss. A simple truss structure was defined assuming columnar members pinned at the ends. Figure G-2-1 shows the configuration. Dimensions are in inches. Table G-2-1 lists joint locations.
Figure G-2-1. Geometric model for force analysis.
Constraining Loads (lbf)
P1 574.3 P2 574.3 P3 675.7 P4 675.7
R17 911.4 R18 911.4 R19 338.6 R20 338.6
0
10
20
30
40
50
60
70
0 10 20 30
0
10
20
30
40
50
60
70
0102030405060708090100110
P1,
P4
P2, P
3
R17
, R18
R19
, R20
0
10
20
30
40
50
60
70
80
90
100
110
0 10 20 30
P1, P2 P3, P4
R17, R20 R18, R19
APPENDIX G DESIGN STUDY FOR
GTL HYDRAULIC TEST FIXTURE SUPPORT
145
Table G-2-1. Frame model joint locations used in force analysis. Element Length x y z
1 17.75 1.75 12.13 102.5 1.75 29.88 102.5
2 20.50 1.75 12.13 102.5 22.25 12.13 102.5
3 20.50 1.75 29.88 102.5 22.25 29.88 102.5
4 17.75 22.25 12.13 102.5 22.25 29.88 102.5
5 21.08 1.75 12.13 102.5 1.75 3.00 83.5
6 21.08 22.25 12.13 102.5 22.25 3.00 83.5
7 29.40 1.75 12.13 102.5 22.25 3.00 83.5
8 37.75 22.25 29.88 102.5 22.25 62.50 83.5
9 37.75 1.75 29.88 102.5 1.75 62.50 83.5
10 42.96 1.75 29.88 102.5 22.25 62.50 83.5
11 32.91 22.25 29.88 102.5 22.25 3.00 83.5
12 32.91 1.75 29.88 102.5 1.75 3.00 83.5
13 20.50 1.75 3.00 83.5 22.25 3.00 83.5
14 59.50 22.25 3.00 83.5 22.25 62.50 83.5
15 59.50 1.75 3.00 83.5 1.75 62.50 83.5
16 20.50 1.75 62.50 83.5 22.25 62.50 83.5

APPENDIX G DESIGN STUDY FOR
GTL HYDRAULIC TEST FIXTURE SUPPORT
146
17 83.50 1.75 3.00 83.5 1.75 3.00 0
18 83.50 22.25 3.00 83.5 22.25 3.00 0
19 83.50 22.25 62.50 83.5 22.25 62.50 0
20 83.50 1.75 62.50 83.5 1.75 62.50 0
The constraining loads shown in Figure B-1 were obtained using moment techniques with a supported load of 2,500 lbf for conservatism. The contribution of the force from each member to the joint is proportional to the direction cosines of the member or the projection of the member in the given direction divided by its length. By equating the components of the forces in each joint in the y and z directions to zero or one of the applied or reaction loads (P, R), considering all members but the 4 vertical legs where the loads are given, it was possible to arrive at the loads in each member:
The resulting forces and the safety factors for axial strength, assuming 30,000 lbf/in2 yield strength and a cross sectional area of 2.75 in2 are listed in Table G-2-2.
Another concern for members in compression is buckling. The critical force, P*, for a slender column in buckling is given by
2
2*
LIYP
whereY = Young’s modulus (30,000,000 lbf/in2)
I = area moment of inertia (3.494 in4 for a box 3 inches square and ¼ inch thick) L = column length
Critical forces and factors of safety in buckling are also listed in Table G-2-2. Members in tension (negative force in Table G-2-1) are not subject to buckling

APPENDIX G DESIGN STUDY FOR
GTL HYDRAULIC TEST FIXTURE SUPPORT
147
Table G-2-2. Results of stress and buckling analyses Element Force (lbf) Stress (ksi) FS (stress) P* (buckling) FS(Buckling)
Element Force (lbf) Stress (ksi) FS(stress) P* (buckling) FS(Buckling)1 500.3 0.182 164.9 3.28E+06 6.56E+032 0.0 3 0.0 4 100.1 0.036 824.5 3.28E+06 3.28E+045 1155.6 0.420 71.4 2.33E+06 2.02E+036 231.1 0.084 357.0 2.33E+06 1.01E+047 0.0 8 -788.5 -0.287 104.6 N/A 9 751.4 0.273 109.8 7.26E+05 9.66E+02
10 0.0 11 1149.4 0.418 71.8 9.55E+05 8.31E+0212 1603.0 0.583 51.5 9.55E+05 5.96E+0213 0.0 14 -1038.6 -0.378 79.4 N/A 15 -649.3 -0.236 127.1 N/A 16 0.0 17 871.8 0.317 94.6 1.48E+05 1.70E+0218 871.8 0.317 94.6 1.48E+05 1.70E+0219 378.2 0.138 218.2 1.48E+05 3.92E+02
The next step in the analysis is the consideration of bending stresses. Only members 1, 2, and 3, which carry the loads from the adjustable bolts on the support plate, experience bending. The maximum bending moment is in member 1 where the load is supported at mid span (Figure G-2-2), and for 2,500 lbf load, carried equally by the three support bolts
lbfininlbfLWM 060,4249.19
23500,2
22
For a box beam bending in a principal plane, a conservative assumption is that the bending moment is provided as a force couple consisting of the average stress in the hatched area of Figure G-2-3 times the area over which it acts and its moment arm.
hbaM 2
The required stress is then
2492375.125.032
060,42 in
lbfininin
lbfinhba
M
W
2W
2W
L
Figure G-2-2. Beam bending moment parameters.
h
a
b
Figure G-2-3 Box beam

APPENDIX G DESIGN STUDY FOR
GTL HYDRAULIC TEST FIXTURE SUPPORT
148
This is less than 2% of the yield stress assumed.
One further aspect considered is the bearing stress of the nuts on the three support bolts against the top of the support members. As an approximation, assume that the bearing surface is annular with an outside diameter of 1.375 inches and an inside diameter of 1.125 inches (0.49 in2). One third of the supported load is 833 lbf. The resulting bearing stress is
22 700,149.0
833inlbf
inlbf
b
or about 6% of the metal yield stress. Dynamic stresses from movements may result in loads of several times the assumed value, but they should not exceed the yield stress of the material.
Shear stress on the bolt threads may be approximated by estimating a shear area that is a circular cylindrical surface 95% of the screw diameter and with a height 40% of that diameter (80% nut height, 50% shear area in the threads). That area is
219.10.14.00.195.0 inininA
Again applying the 833-lbf load gives a shear stress of
22 69819.1
833inlbf
inlbf
s
also well below the metal yield stress in shear, taken as half the yield strength or 15,000 lbf/in2.
The conclusion from the above analyses is that the structure will be robust enough to handle the loads considered with ease.

APPENDIX H: MEASUREMENTS ON MODEL BOOSTER FUEL PLATES
The RELAP5 code was used to investigate the effect of surface roughness on the Gas Test Loop booster fuel plates on overall coolability of the plates. When surface roughness is too great, flow velocity of the coolant between the plates drops, and the heat removal capability of the coolant declines. That results in higher booster fuel plate temperatures. Table H-1 shows specific parameters used in that analysis. Figure H-1 shows fuel centerline and maximum coolant temperatures in graphic form. It is evident that surface roughness, e, better than 1.2 m (47 micro-inch) gives no improvement in fuel performance. The surface roughness specification for the ATR booster fuel is 1.61 m (63 micro-inch).1
Table H-1. Parameters used and results obtained from RELAP5 analysis of the Gas Test Loop booster fuel coolability under varied assumptions on fuel plate surface roughness.
MaterialQuasi-smooth
ATRcoupon ATR fuel
Drawn tubing
Commercialsteel
Galvanized iron
e (m) 3.96E-12 0.53E-06 1.31E-06 1.52E-06 4.57E-05 1.50E-04 e (ft) 1.30E-11 1.74E-06 4.30E-06 5.00E-06 0.00015 0.0005 e (microinches) 156E-06 21 52 60 1800 6000
Max. coolant temp.
385 K (233 ˚F)
386 K (236 ˚F)
388 K (239 ˚F)
389 K (240 ˚F)
417 K (291 ˚F)
439 K (330 ˚F)
Max. fuel centerline temp.
520 K (476 ˚F)
520 K (476 ˚F)
522 K (480 ˚F)
523 K (481 ˚F)
555 K (540 ˚F)
580 K (585 ˚F)
Max. fuel surface temp.
424 K (304 ˚F)
425 K (305 ˚F)
427 K (310 ˚F)
428 K (311 ˚F)
462 K (373 ˚F)
488 K (419 ˚F)
Avg. coolant velocity 14.2 m/s 13.6 m/s 13.4 m/s 13.3 m/s 9.3 m/s 7.3 m/s
Avg. coolant flow rate 589 gpm 574 gpm 557 gpm 553 gpm 386 gpm 303 gpm

APPENDIX H MEASUREMENTS ON MODEL BOOSTER FUEL PLATES
150
Figure H-1. Surface roughness better than 1.2 m results in no better performance for Gas Test Loop booster fuel.
Model booster fuel plate roughness was measured with a PocketSurf profilometer (Figure H-2) both before assembly into the composite models and after chemical treatment for corrosion.
Figure H-2. Performing surface roughness measurements after chemical treatment on the model booster fuel assemblies.
Effect of Fuel Plate Surface Roughness
0100200300400500600700
1.0E-12 1.0E-10 1.0E-08 1.0E-06 1.0E-04
Roughness (m)
Tem
pera
ture
(˚F)
Fuel Centerline Max. Coolant Max.
GTL BFA

APPENDIX H MEASUREMENTS ON MODEL BOOSTER FUEL PLATES
151
The following pages contain replicas of the inspection data travelers taken for those surface roughness measurements. Also there are travelers for measurements of spacing between the assembled model booster fuel plates. For the measurements before assembly, the average roughness over all the model fuel plates was 0.76 ± 0.27 m (29.8 ±10.6 micro-inch). Following the treatment, the roughness of the surfaces measured averaged 1.10 ± 0.19 m (43.2 ±7.6 micro-inch). This represents an average increase in surface roughness of about 45%. The plate by plate comparison for roughness before and after chemical treatment is in Table H-2. The first number in the plate designation (1,3) refers to inner and outer plates, respectively. The second is the assembly number (1 – 4).
Table H-2. Comparison of surface roughness on model fuel plates before and after chemical treatment for corrosion prevention.
Average Roughness (micro-inch)
Standard Deviation (micro-inch)
Plate Before After Change Before After Change 1-1 ID 32.63 45.00 38% 7.98 5.78 -27.6%3-1 OD 21.25 44.75 111% 15.29 4.83 -68.4%1-2 ID 37.00 45.00 22% 8.72 8.11 -7.0%3-2 OD 19.75 49.13 149% 9.06 5.99 -33.9%1-3 ID 30.88 41.00 33% 5.30 6.23 17.5%3-3 OD 20.63 39.88 93% 10.04 7.28 -27.5%1-4 ID 41.13 41.13 0% 7.18 9.93 38.4%3-4 OD 25.25 39.88 58% 10.58 9.23 -12.7%
In almost every case, chemical treatment resulted in an increase in surface roughness but a reduction in the data scatter for a given plate surface.
Reference 1. Idaho National Engineering and Environmental Laboratory, October 29, 1974, ATR Mark VII
Fuel Element Assembly, DWG-405400, Rev 19.

APPENDIX H MEASUREMENTS ON MODEL BOOSTER FUEL PLATES
152

APPENDIX H MEASUREMENTS ON MODEL BOOSTER FUEL PLATES
153

APPENDIX H MEASUREMENTS ON MODEL BOOSTER FUEL PLATES
154

APPENDIX H MEASUREMENTS ON MODEL BOOSTER FUEL PLATES
155

APPENDIX H MEASUREMENTS ON MODEL BOOSTER FUEL PLATES
156


![Hydraulic Power Units - Poclain Hydraulics · HPD Model AC Motor kW [HP] Closed loop pump cm3/rev [cu.in/rev] Preferred Hydraulic motor Single hydraulic motor drive S.1 132 [177]](https://img.dokumen.tips/doc/110x75/60dce74a6f5c4a6e147d4e1a/hydraulic-power-units-poclain-hydraulics-hpd-model-ac-motor-kw-hp-closed-loop.jpg)