Embed Size (px)
Citation preview

GAS DISTRIBUTIONPRICING METHODOLOGY23 SEPTEMBER 2014

2 | P a g e
FOREWORD
This document presents Powerco’s pricing methodology for gas distribution services for the
2014/15 pricing year. It has been prepared in accordance with the requirements of the
Commerce Act (Gas Distribution Services Input Methodologies) Determination 2012 and the
Commerce Act (Gas Distribution Services Information Disclosure) Determination 2012.
In brief, this document contains a summary of the factors that Powerco considered when
developing its pricing strategy and pricing methodology, an overview of the cost allocation
process, Powerco’s 2014/15 target revenue and the allocation of that revenue, and its
medium term pricing strategy.

3 | P a g e
CONTENTS
FOREWORD ..................................................................................................................................... 2
COMMONLY USED TERMS IN THIS REPORT ............................................................................... 4
1. EXECUTIVE SUMMARY .......................................................................................................... 5
1.1 Price Setting Policy Framework ...................................................................................................... 5
1.2 Description of the pricing methodology............................................................................................ 7
1.3 Compliance with THE pricing principles .......................................................................................... 7
2. MEDIUM-TERM PRICING STRATEGY ................................................................................... 8
3. POWERCO’S GAS NETWORK SERVICES .......................................................................... 10
3.1 History of Powerco’s gas business ................................................................................................ 10
3.2 Profile of Powerco’s gas business ................................................................................................. 11
4. OVERVIEW ............................................................................................................................ 14
4.1 DESCRIPTION OF REGULATORY REQUIREMENTs .................................................................. 14
4.2 Description of business’ price setting policy framework, including the outcomes sought by
the business from its pricing policy ................................................................................................ 18
5. PRICING METHODOLOGY ................................................................................................... 24
5.1 Description of pricing methodology for regulated services ............................................................. 24
5.2 Pricing methodology development ................................................................................................ 25
5.3 approach to setting prices for non-standard contracts ................................................................... 49
5.4 powerco’s obligations and responsibilities to customers on non-standard contracts in the
event that the supply of gas pipeline services to the customer is interrupted ................................. 49
5.5 the extent of non-standard contract use ........................................................................................ 50
5.6 the views of consumers................................................................................................................. 50
6. EXCLUDED SERVICES ......................................................................................................... 51
APPENDIX 1: ESTIMATES OF SUBSIDY FREE PRICES FOR STANDARD NETWORK
CLASSES ............................................................................................................................... 53
APPENDIX 2: TARGET REVENUE FOR 2014/2015 AND THE PROPORTION OF THE
TARGET REVENUE THAT IS COLLECTED BY EACH TARIFF TYPE ................................ 56

4 | P a g e
COMMONLY USED TERMS IN THIS REPORT
Term Definition
Demand Term used to denote the peak consumption of gas
Gas Consumer / Gas Customer This report uses the term “consumer” when discussing general characteristics of consumers of natural gas in the New Zealand market; “customer” specifically refers to a party who is connected to Powerco’s gas network and to whom Powerco provides gas distribution and/or metering services.
GDB Gas distribution business.
Gigajoule (GJ) A quantity measure of the energy content of gas. Residential gas tariffs often measure gas usage in terms of equivalent kilowatt hours (kWh); however, Powerco measures gas consumption in terms of gigajoules.
ICP Installation Control Point or individual connection to the gas network. The term ICP is used to denote a specific gas customer.
Load Group A category of Powerco distribution customer, with a defined capacity and annual consumption that receives a specific distribution tariff.
Mass Market Load groups to which standard, published tariffs apply; the bulk of Powerco’s customers are considered mass market. By contrast, non-standard customers have special requirements and individual pricing arrangements.
Standard cubic meters per hour (scmh) Flow rate of natural gas through a pipeline or a meter. The “standard” refers to the temperature and pressure conditions under which the flow rate is measured.
Volume Term used to denote consumption over a period of time, such as a day or a year.

5 | P a g e
1. EXECUTIVE SUMMARY
This document presents Powerco’s pricing methodology and proposed gas distribution
prices for the 2014/15 pricing year. The document has been prepared in accordance with
the requirements of the Commerce Act (Gas Distribution Services Input Methodologies)
Determination 2012 and the Commerce Act (Gas Distribution Services Information
Disclosure) Determination 2012.
.
1.1 PRICE SETTING POLICY FRAMEWORK
Powerco’s pricing methodology framework begins with its vision for its gas business: to
provide safe, reliable, and economically efficient gas network distribution services while
achieving sustainable earnings. The pricing framework aims to attract and retain customers
though the application of simple and fair tariffs while meeting its regulatory commitments.
When developing its pricing methodology, Powerco has considered a number of contextual
factors as summarised in the diagram below.
Schematic of Price Setting Policy Framework
Move to more cost - reflective
pricing over time and harmonise tariffs where
possible
Pricing Principles • Signal economic cost of service provision• Have regard to consumers’ demand responsiveness• Discourage uneconomic bypass and allow negotiation• Promote price stability and certainty for customers
VisionSafe , reliable and economically efficient gas network,
while achieving sustainable earnings
• Challenging consumer market• Consumer impacts• Volume risk• Inherited legacy pricing• Retail pricing issues
Pricing outcomes sought
Charge customers a fair share of the costs of using the network
Promote price stability and minimise
price shocks to consumers
Simplify tariff structure where
possible
Mitigate the volume risk faced by
Powerco
Achieve the allowable notional
revenue
Restructure pricing
anomalies
Review thefixed/variable revenue split
Maintain price stability and
monitor impact of price
changes
Pricing Actions to Achieve Outcomes
Objective
Attract and retain customers though the application of simple and fair pricing principles and tariffs; act to minimise potentially adverse customer impacts and
meet regulatory commitments
Context: Gas market and Powerco structure and history

6 | P a g e
Price Setting Considerations
There are a number of contextual factors that have helped shape the development of
Powerco’s pricing methodology; these are summarised below:
• Challenging consumer market: The consumption of natural gas is currently either
stable or increasing very slowly. Promoting an increase in connection numbers and
an increase in gas consumption would be in Powerco’s commercial interest but
would also be helpful to consumers, as it would help reduce the average cost of
distributing gas. Greater use of gas would also be consistent with the government’s
energy and climate change strategies, as natural gas, when burned directly, is a
very efficient source of energy with a smaller carbon footprint than other fossil fuels.
• Consumer impacts: Customers’ investment in gas appliances represents a
commitment to use gas in the future. As a quid pro quo, Powerco believes it has a
commitment to help keep future gas prices as stable as possible.
• Volume risk: Annual gas consumption can vary due to weather patterns. Two part
pricing can help to manage this risk.
• Pricing structure: Powerco’s current gas distribution prices are largely a product of
history; in many cases, prices have perpetuated legacy pricing structures. Where
possible, this pricing methodology aims to promote greater harmonisation and
simplification of prices.
• Retail pricing issues: Distribution prices represent 35-40% of retail gas tariffs, and
gas retailers may not have the incentives that Powerco has to attract and retain gas
customers. These differences present challenges in terms of delivering distribution
pricing signals to end-use customers.
Pricing Outcomes Sought
When developing and implementing its pricing methodology, Powerco has sought to:
• achieve its target revenue in order to sustain the gas network and provide for future
investment;
• charge customers a reasonable share of the costs of using the network;
• promote price stability and minimise price shocks to customers;
• simplify tariff structures where possible; and
• mitigate the volume risk faced by Powerco.
Summary of medium-term pricing strategy
Powerco intends to develop a new medium term pricing strategy for its gas distribution
business, which it anticipates will aim, over time, to remove pricing anomalies between
regions and customer load groups and set prices that better reflect the actual costs of
supplying those load groups. The first step in this exercise is the construction of a new gas
cost of supply model (COSM) which will incorporate clearly defined rules, based on
economic pricing theory and generally accepted accounting practice, that will allocate costs
7 | P a g e
between fixed and consumption-based charges and, where appropriate, between regions
and customer load groups and generate indicative final charges.
One of the anomalies that currently exist is that, for historical reasons, fixed charges in the
Taranaki region are significantly higher than in other regions. The new medium-term
strategy will review this discrepancy.
As part of its pricing strategy, Powerco is also concerned to ensure that reticulated gas is an
attractive fuel option for households, now and in the future. Consequently, Powerco places
a high priority on managing the effects of any price changes, with the objective of ensuring
that no individual customer’s distribution charges vary by more than 15 per cent per annum.
1.2 DESCRIPTION OF THE PRICING METHODOLOGY
The steps Powerco has followed when implementing its pricing methodology are:
1. determine Powerco’s gas distribution costs using its existing network model;
2. allocate customers to network load groups, based on historical consumption volumes;
3. allocate costs to customer groups using appropriate allocation factors. Powerco’s
network model analyses costs within each of its five gas network areas for each of its
six standard and two non-standard customer classes;
4. assess prices to determine consistency with the Commerce Commission’s pricing
principles and Powerco’s objectives.
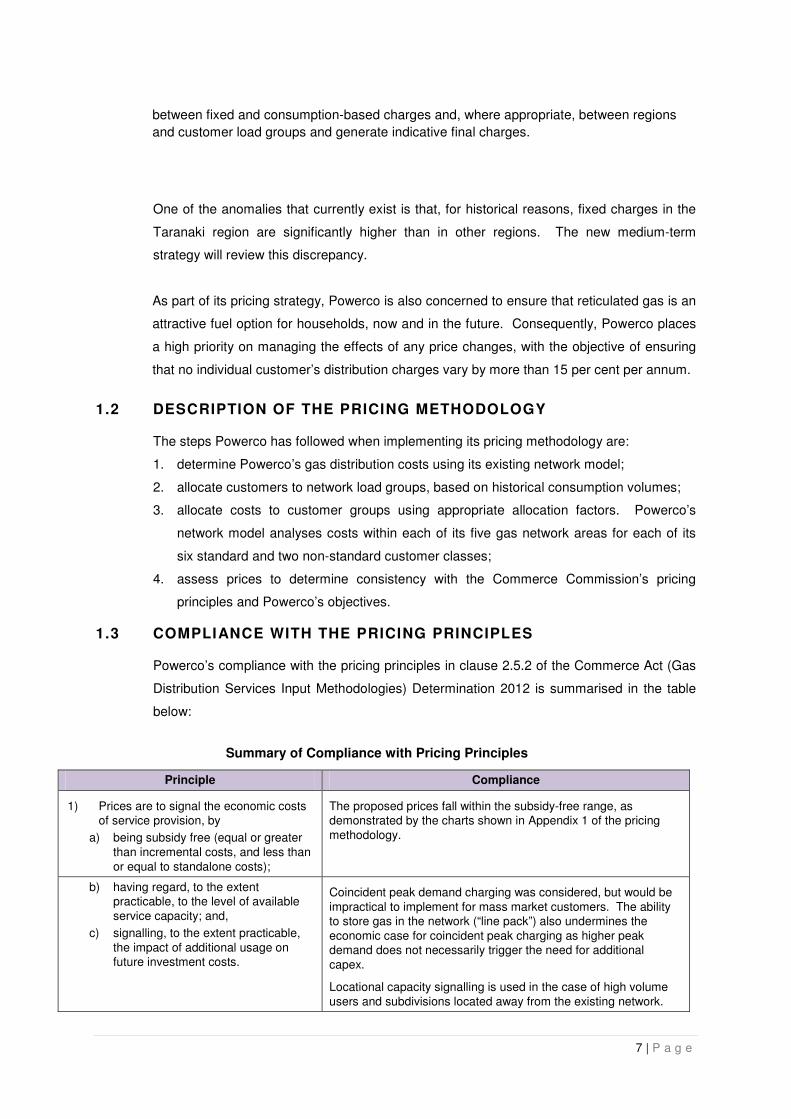
1.3 COMPLIANCE WITH THE PRICING PRINCIPLES
Powerco’s compliance with the pricing principles in clause 2.5.2 of the Commerce Act (Gas
Distribution Services Input Methodologies) Determination 2012 is summarised in the table
below:
Summary of Compliance with Pricing Principles
Principle Compliance
1) Prices are to signal the economic costs of service provision, by
a) being subsidy free (equal or greater than incremental costs, and less than or equal to standalone costs);
The proposed prices fall within the subsidy-free range, as demonstrated by the charts shown in Appendix 1 of the pricing methodology.
b) having regard, to the extent practicable, to the level of available service capacity; and,
c) signalling, to the extent practicable, the impact of additional usage on future investment costs.
Coincident peak demand charging was considered, but would be impractical to implement for mass market customers. The ability to store gas in the network (“line pack”) also undermines the economic case for coincident peak charging as higher peak demand does not necessarily trigger the need for additional capex.
Locational capacity signalling is used in the case of high volume users and subdivisions located away from the existing network.

8 | P a g e
2) Where prices based on “efficient” incremental costs would under-recover allowed revenues, the shortfall should be made up by prices being set in a manner that has regard to consumers’ demand responsiveness, to the extent practicable.
This pricing principle envisages the possible use of Ramsey pricing
1 or some form of coincident peak charging. However,
Ramsey pricing is impractical as there is very limited information available on the price elasticity of demand for gas. In any event, distribution charges are invariably smaller than the charges for the energy that is consumed in conjunction with distribution services, so any price signals provided by the distribution charge are bound to be substantially diluted. With respect to coincident peak demand charging see the comment in the cell above.
Powerco has tailored the G06 residential tariff to reflect the preferences of small residential customers.
3) Provided that prices satisfy (1) above, prices should be responsive to the requirements and circumstances of users in order to:
a) discourage uneconomic bypass, and,
b) allow negotiation to better reflect the economic value of services and enable consumers to make price/quality trade-offs or non-standard arrangements for services.
Powerco offers non-standard tariffs to industrial and commercial customers to address the risk of bypass and to enable arrangements that are tailored to customers’ needs.
These tariffs are reviewed to ensure they do not exceed stand alone cost (as a proxy for bypass).
4) Development of prices is transparent, promotes price stability and certainty for consumers, and changes to prices should have regard to the effect on consumers.
Price stability and the effect of price changes on consumers have been important considerations when designing the pricing methodology and the future strategy. With few exceptions, price increases are less than 15 per cent of yearly distribution charges for all individual customers.
2. MEDIUM-TERM PRICING STRATEGY
The Powerco gas distribution business is about to undertake a full and comprehensive
rebuild and refresh of its gas distribution cost of supply model (COSM) and a full review of
the medium-term pricing strategy. We expect that the new COSM will incorporate clearly
defined rules, based on economic pricing theory and generally accepted accounting
practice, that will allocate costs between fixed and consumption-based charges and, where
appropriate, between regions and customer load groups and generate indicative final
charges.
The principal objective when allocating the annual revenue requirement is to set prices to
ensure that Powerco recovers its operating and recoverable costs and earns the permitted
regulatory return on capital. Beyond this objective, the medium-term pricing strategy will
aim, over time, to remove pricing anomalies between regions and customer load groups and
set prices that better reflect the actual costs of supplying those load groups.
A key step in determining prices involves the calculation of total costs for the relevant period
which include operating costs (maintenance and administration costs), transmission costs
1 Ramsey pricing requires prices to be set in inverse proportion to the price elasticity of demand for the
product concerned.

9 | P a g e
and capital costs. In order to determine an appropriate allocation of these costs across
each network and tariff category, Powerco intends, in future, to use its COSM more explicitly
as part of the process of aligning prices across the networks to the underlying cost drivers.
While the medium-term pricing strategy is under review Powerco will continue to restructure
pricing inconsistencies where possible while maintaining current pricing stability.
Powerco’s commercial team will assist in this process by liaising with customers and
retailers to help ensure that customers are obtaining the best value possible from Powerco’s
services.

10 | P a g e
3. POWERCO’S GAS NETWORK SERVICES
3.1 HISTORY OF POWERCO’S GAS BUSINESS
Powerco was originally formed in 1993 when the Wanganui Rangitikei Electric Power Board
was corporatised. The acquisition in 1995 of the former gas operations of the New
Plymouth District Council and the Hawera Gas Company provided the genesis of Powerco’s
gas networks business. The subsequent acquisition of NGC’s gas distribution activities in
the region in 1998 completed Powerco’s gas distribution network in Taranaki.
Powerco’s gas assets in the Hutt Valley and Porirua areas were originally owned by the Hutt
Valley Energy Board. Subsequently, the Hutt Valley Energy Board was corporatised into
the Energy Direct Corporation, merged into TransAlta New Zealand, and then sold to
Australian Gas Light Limited (AGL). Powerco acquired the gas network assets from AGL in
2001.
Powerco’s gas network assets in Manawatu, Hawke’s Bay, and Wellington were acquired
from United Networks in 2002. Previously, the assets were owned by Orion New Zealand;
before that, the gas assets of Palmerston North City Council, East Coast Gas Supply, and
the Wellington Gas Company were amalgamated under Enerco Limited.
The diagram below summarises the formation and amalgamation of Powerco’s gas network
assets.
Summary of Powerco’s gas business history
Region
Manawatu
Hawkes Bay
Wellington
Hutt Valley /
Porirua Basin
Australian Gas Light Ltd
(March 2000 - 25 July 2001)
TransAlta New Zealand Ltd
(June 1996 - March 2000)
Enerco Limited
(Previously Auckland Gas Company Limited)
(7 Feb 1994 - 31 March 1999)
Enerco Limited(March 1997 - 31 March 1999)
Wellington Gas Company Limited
(Incorporated 1969 - March 1997)
The Palmerston North City Council
(Included Ashurst, Fielding & Levin)
(Until 30 Dec 1991)
East Coast Gas Supply Limited
(Merger of Napier Gas & Hastings Gas)
(1983 - 1989)
WelGas Holdings
(1989 - late 1992)Enerco Limited
(Late 1992 - 31 March 1999)
Taranaki
1995 19961993
Ga
s N
etw
ork
As
se
ts
Powerco Limited
(1998 - Present)
> 200420001999> 1987 1991 1992
Hawera Gas Company Ltd
(Until Dec 1993)(1 Jan 1994 - Sept 1995)
Taranaki Energy Limited
(7 May 1993 - Sept 1995)
New Plymouth City Council - MED
(until May 1993)
19901988 1989 1994
Powerco Limited
(Oct 1995 - Present)
Powerco Limited
(25 July 2001 - Present)
Powerco Limited
(1 Nov 2002 - Present)
NGC [Natural Gas Corporation Holdings Limited(Included Inglewood, Stratford, Eltham, Patea, Waverley & Opunake)
(Until 1998)
Orion New Zealand Limited
(31 March 1999 - 31 March 2000)
United Networks Ltd
(31 March 2000 - 1 Nov 2002)
Hutt Valley Energy Board
(Previously Hutt Valley EPB, Hutt Valley Electric Power and Gas Board)
(1918 - Nov 1991)
Energy Direct Corporation Ltd
(Nov 1991 - June 1996)
Progas Systems Limited(31 Dec 1991 - 7 Feb 1994)
2003200220011997 1998
11 | P a g e
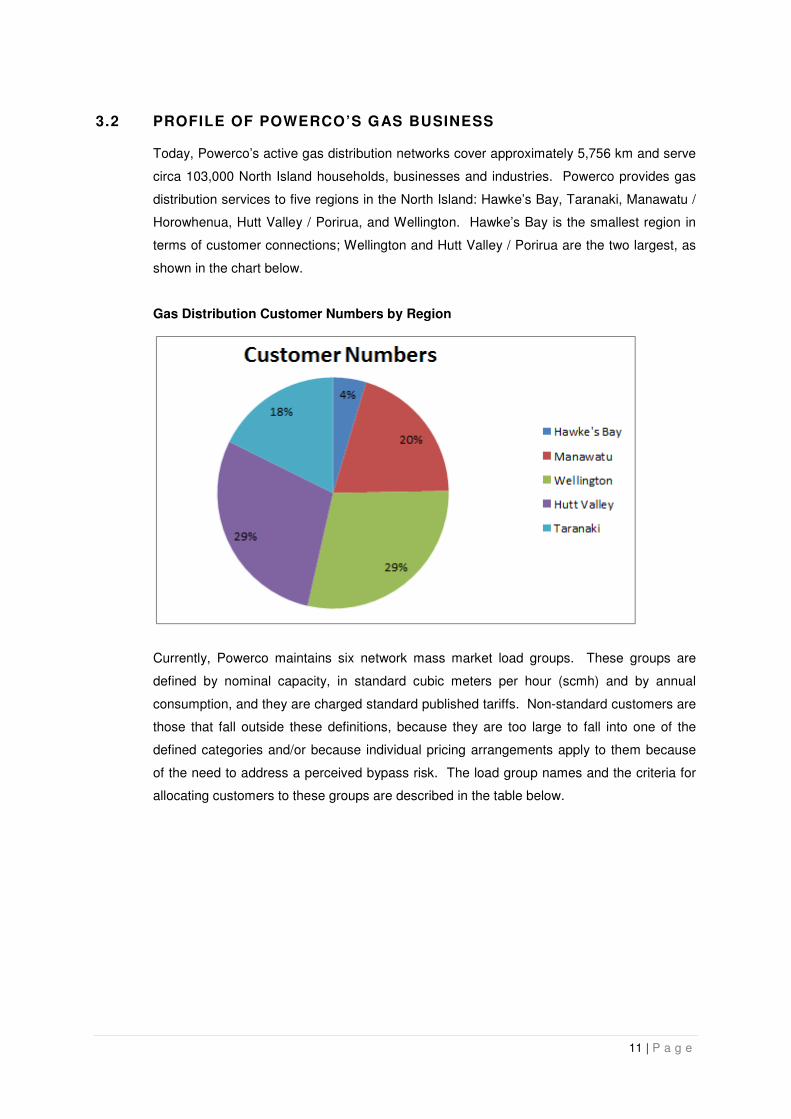
3.2 PROFILE OF POWERCO’S GAS BUSINESS
Today, Powerco’s active gas distribution networks cover approximately 5,756 km and serve
circa 103,000 North Island households, businesses and industries. Powerco provides gas
distribution services to five regions in the North Island: Hawke’s Bay, Taranaki, Manawatu /
Horowhenua, Hutt Valley / Porirua, and Wellington. Hawke’s Bay is the smallest region in
terms of customer connections; Wellington and Hutt Valley / Porirua are the two largest, as
shown in the chart below.
Gas Distribution Customer Numbers by Region
Currently, Powerco maintains six network mass market load groups. These groups are
defined by nominal capacity, in standard cubic meters per hour (scmh) and by annual
consumption, and they are charged standard published tariffs. Non-standard customers are
those that fall outside these definitions, because they are too large to fall into one of the
defined categories and/or because individual pricing arrangements apply to them because
of the need to address a perceived bypass risk. The load group names and the criteria for
allocating customers to these groups are described in the table below.

12 | P a g e
Load group definitions
End Consumer Load Group
Definition
G06 End consumers with a load size of less than or equal to 10 scm/hr and an annual Gas usage of less than 16 GJ. This tariff group is subject to a variable only charge. Consumers that qualify for this group may opt instead to be subject to G11 tariffs (which contain a fixed element).
G11 End consumers with a load size of less than or equal to 10 scm/hr and an annual Gas usage equal to 16 GJ or greater. Consumers that qualify for this group may opt instead to be subject to G06 tariffs (which are variable only).
G12 End consumers with a load size greater than 10 scm/hr and less than or equal to 25 scm/hr.
G14 End consumers with a load size greater than 25 scm/hr and less than or equal to 60 scm/hr.
G16 End consumers with a load size greater than 60 scm/hr and less than or equal to 140 scm/hr.
G18 End consumers with a load size greater than 140 scm/hr and less than or equal to 200 scm/hr.
G30 End consumers for whom network services are individually priced.
G40 End consumers for whom network services are individually priced and who have a time of use meter.
3.2.1 Rat ionale for grouping consumers in this way
The rationale for grouping consumers in this way is as follows:
• larger pipes with greater reinforcing are required by the higher volume commercial
and industrial customers;
• most of the low volume connection pipes are required to service residential customers
only;
• the delivery of gas exhibits significant economies of scale;
• some large customers may have the option of bypassing Powerco and connecting to
an alternative network.
These characteristics mean that, for high volume customers, the fixed infrastructure costs
are relatively high, but the per unit cost of delivering gas is low. Conversely, for low volume
residential customers, the fixed infrastructure costs needed to service them are relatively
low, but the per unit costs of delivering energy to them are relatively high. These differences
drive the relative balance of fixed and variable charges that apply to the different customer
groups. For the large consumers, fixed charges are higher and variable charges lower, and
the converse is the case for residential customers. Where commercial bypass is a credible
risk, individual non-standard charging arrangements may be justified.

13 | P a g e
The types of customer that fall into each load group are described in the table below.
Typical characteristics of different load group customers
Load Group Typical Customers
Mass Market Residential Load Groups
G06 Small residential customers.
G11
Large residential customers.
Small cafes, fish and chip shops, pizza shops.
Mass Market Commercial Load Groups
G12 Restaurants, small apartment / office buildings, small to mid-sized motels.
G14 Hotels, large motels, shopping complexes, swimming pools.
G16 Large office buildings, apartment blocks, commercial kitchens.
G18 Commercial laundries, dry cleaners.
Non-standard Load Groups
G30
Individually priced customers who do not have a time of use (TOU) meter
Large commercial customers, large hotels.
Smaller commercial customers which are a bypass threat.
G40
Individually priced customers with a TOU meter
Manufacturing and industrial businesses, such as Fonterra, meat processing plants, Wattie’s, ENZA, Panpac.
The vast majority of Powerco’s network customers are standard mass-market customers;
about 240 are non-standard customers. Nearly three-quarters of the customer base are in
the G11 residential Load Group. In terms of natural gas volumes, the pattern is strikingly
different: non-standard customers represent about half of Powerco’s annual gas
consumption, and the G11 Load Group accounts for less than a third. These differences
are illustrated in the charts below.

14 | P a g e
Comparison of Network Customer Numbers with Gas Consumption
4. OVERVIEW
4.1 DESCRIPTION OF REGULATORY REQUIREMENTS
4.1.1 Post Authorisat ion Arrangements
Powerco is regulated under the Commerce Commission Gas Distribution Services Default
Price-Quality Path Determination 2013 (“the DPP”), which permits its allowable notional
revenue, as defined by the DPP, to change in proportion to the movement in the Consumer
Price Index (CPI) each year.
Once every five years the regulator resets the DPP by specifying the allowable notional
revenue that will apply from the beginning of the next regulatory period and the minimum
quality standards that the gas distribution businesses are required to achieve when operating
and maintaining the gas network during the regulatory period. The requirements of the DPP
are intended to provide the suppliers of regulated goods and services with sufficient
15 | P a g e
incentives to innovate and invest, while limiting any ability to extract monopoly profits, and
also to share with consumers the benefits of any efficiency gains achieved in the supply of the
regulated goods and services. These objectives are promoted by simulating the outcomes
produced by competitive markets.
The prices applied to the tariff groups on our distribution network are set in accordance with
this pricing methodology, which ensures that the notional revenue does not exceed the
allowable notional revenue as defined by the DPP.
The starting price decision for the 2014 / 2015 pricing reset year was set at an increase of
1.69%. This was made up of an adjustment for CPI of 1.30% and pass through costs of
0.69%, giving a total price adjustment in the 2014/2015 reset year of 1.69%.
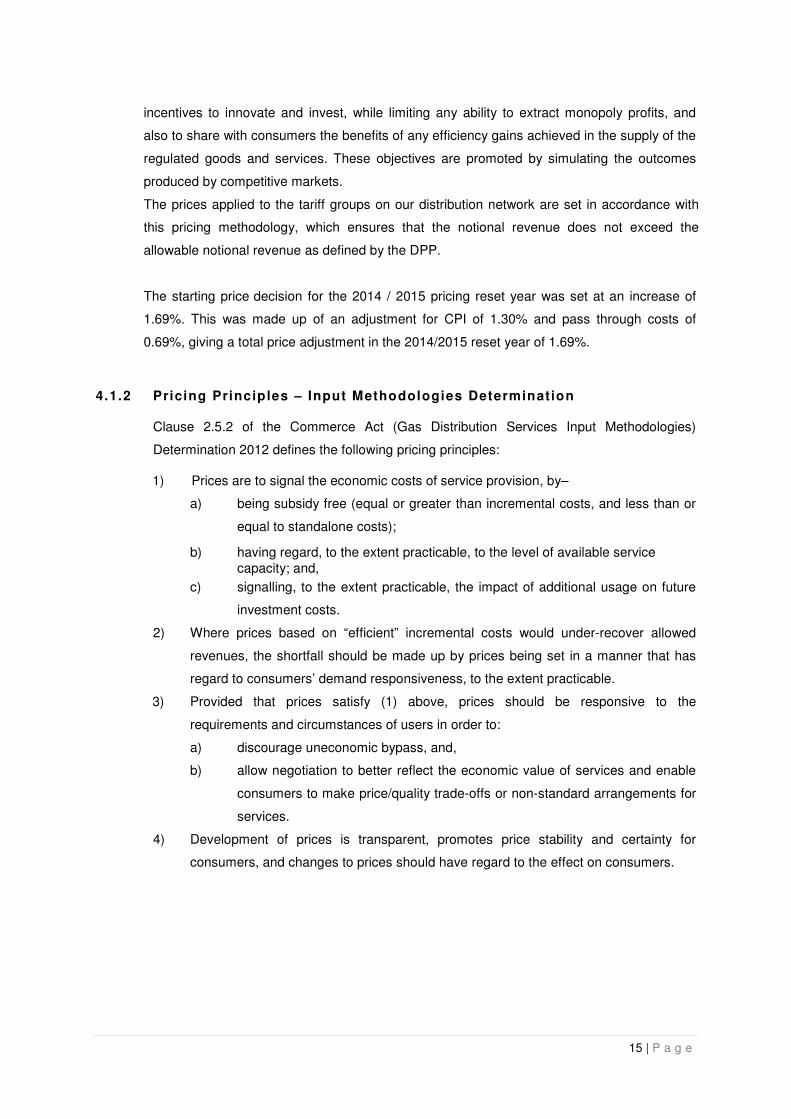
4.1.2 Pricing Principles – Input Methodologies Determination
Clause 2.5.2 of the Commerce Act (Gas Distribution Services Input Methodologies)
Determination 2012 defines the following pricing principles:
1) Prices are to signal the economic costs of service provision, by–
a) being subsidy free (equal or greater than incremental costs, and less than or
equal to standalone costs);
b) having regard, to the extent practicable, to the level of available service capacity; and,
c) signalling, to the extent practicable, the impact of additional usage on future
investment costs.
2) Where prices based on “efficient” incremental costs would under-recover allowed
revenues, the shortfall should be made up by prices being set in a manner that has
regard to consumers’ demand responsiveness, to the extent practicable.
3) Provided that prices satisfy (1) above, prices should be responsive to the
requirements and circumstances of users in order to:
a) discourage uneconomic bypass, and,
b) allow negotiation to better reflect the economic value of services and enable
consumers to make price/quality trade-offs or non-standard arrangements for
services.
4) Development of prices is transparent, promotes price stability and certainty for
consumers, and changes to prices should have regard to the effect on consumers.

16 | P a g e
4.1.3 Informat ion Disclosure Determination Requirements
Clause 2.4 of the Commerce Act (Gas Distribution Services Information Disclosure)
Determination 2012 states that, before the start of each disclosure year2, every gas
distribution business must publicly disclose a pricing methodology that satisfies the following
requirements:
1) Include sufficient information and commentary to enable interested persons to
understand how prices were set for each consumer group, including assumptions and
statistics used to determine prices for each consumer group.
2) Demonstrate the extent to which the pricing methodology is consistent with the pricing
principles and explain the reasons for any inconsistency between the pricing
methodology and the pricing principles.
3) State the target revenue to be collected for the current disclosure year.
4) Where applicable, identify the key components of the target revenue required to cover
the costs and return on investment associated with the GDB’s provision of gas
pipeline services. Disclosure must include the numerical value of each of the
components.
5) State the consumer groups for whom prices have been set, and describe:
a) the rationale for grouping consumers in this way;
b) the method and the criteria used by the GDB to allocate consumers to each of
the consumer groups.
6) If prices have changed from the prices disclosed for the immediately preceding
disclosure year, explain the reasons for changes and quantify the differences in
respect of each of those reasons.
7) Where applicable, describe the method used by the GDB to allocate target revenue
among consumer groups, including the numerical values of the target revenue
allocated to each consumer group and the rationale for allocating it in this way.
8) State the proportion of target revenue (if applicable) that is collected through each
tariff type as publicly disclosed annually. Every disclosure must, if the GDB has a
pricing strategy:
a) explain the pricing strategy for the next five disclosure years (or as close to five
years as the pricing strategy allows), including the current disclosure year for
which prices are set;
b) explain how and why prices for each consumer group are expected to change
as a result of the pricing strategy;
2 For Powerco Gas Distribution, 1 October – 30 September.

17 | P a g e
c) if the pricing strategy has changed from the preceding pricing year, identify the
changes and the reasons for the changes.
9) Describe the approach to setting prices for non-standard contracts, including:
a) the extent of non-standard contract use, including the number of ICPs
represented by non-standard contracts and the value of target revenue
anticipated for non-standard contracts;
b) how the GDB determines whether to use a non-standard contract, including
any criteria used;
c) any specific criteria or methodology used for determining prices for non-
standard contracts, and how those criteria or that methodology are consistent
with the pricing principle.
10) Describe the GDB’s obligations and responsibilities (if any) to customers on non-
standard contracts in the event that the supply of gas pipeline services to the
customer is interrupted. Disclosure must explain:
a) the extent of the differences in these terms between standard contracts and
non-standard contracts;
b) any implications of this approach for determining prices for non-standard
contracts.
11) Explain whether, and if so how, the GDB has sought the views of consumers, their
expectations in terms of price and quality, and reflected those views, in calculating the
prices payable or to be payable. If the GDB has not sought the views of customers,
the reasons for not doing so must be disclosed.

18 | P a g e
4.2 DESCRIPTION OF BUSINESS’ PRICE SETTING POLICY FRAMEWORK, INCLUDING THE OUTCOMES SOUGHT BY THE BUSINESS FROM ITS PRICING POLICY
4.2.1 Overview of the Pricing Methodology Framework
Powerco’s pricing methodology framework begins with its vision for its gas business: to
provide safe, reliable, and economically efficient gas network distribution services while
achieving sustainable earnings. The pricing framework is based on attracting and retaining
customers through the application of simple and fair pricing principles and tariffs, acting to
minimise potentially adverse customer impacts, and meeting its regulatory commitments.
When developing its pricing methodology, Powerco has considered a number of the
characteristics of gas distribution markets and has given effect to the Commission’s pricing
principles (see the diagram below).
Schematic of Price Setting Policy Framework
The costs of Powerco’s gas distribution network are characterised by economies of scale,
large and relatively lumpy investments, and long asset lives. From an economic efficiency
perspective, prices should reflect the marginal cost of providing customers with access to
the gas network. The long run marginal cost approach to pricing achieves economic
Move to more cost -reflective
pricing over time and harmonise tariffs where
possible
Pricing Principles
• Signal economic cost of service provision• Having regard to consumers’ demand responsiveness• Discourage uneconomic bypass and allow negotiation• Promote price stability and certainty for customers
Vision Safe , reliable and economically efficient gas network,
while achieving sustainable earnings
Context: Gas market and Powerco structure and history
• Challenging consumer market• Consumer impacts• Volume risk• Inherited legacy pricing
• Retail pricing issues
Pricing outcomes sought
Charge customers a fair share of the costs of using the network
Promote price stability and minimise
price shocks to consumers
Simplify tariff structure where
possible
Mitigate the volume risk faced by
Powerco
Achieve the allowable notional
revenue
Restructure pricing
anomalies
Review the
fixed/variable
revenue split
Maintain price stability and
monitor impact of price
changes
Pricing Actions to Achieve Outcomes
Objective
Attracting and retaining customers though the application of simple and fair pricing principles and tariffs, acting to minimise potentially adverse customer impacts, and
meeting regulatory commitments

19 | P a g e
efficiency by signalling the future cost of the next increment of network asset investment.
With this approach, network prices would send an economic signal to customers of the cost
of the next increment of load and provide locational signals for future investment (the
Commerce Commission’s first principle).
However, network pricing based on economically efficient marginal costs will, by definition,
not take account of the costs of already-constructed network assets; from an economic
viewpoint, these costs are “sunk.” Therefore, pricing based on marginal costs does not
recover the long run average costs of supply. Where prices based on “efficient” incremental
costs would under-recover allowed revenues the shortfall should be made up by setting
prices in a manner that has regard to consumers’ demand responsiveness, to the extent
practicable (the Commission’s second principle).
All of Powerco’s current tariffs are above the long-run incremental cost of providing the
service. The key issue when developing a pricing methodology is how network costs are
allocated between Powerco’s customer groups. There are a number of issues to consider
when doing this, particularly the need for customers to have price stability and certainty (the
Commission’s fourth principle).
4.2.2 Price Sett ing Considerat ions
The pricing methodology framework is guided by the characteristics of the gas market and
the structure and history of Powerco’s gas services. The development of Powerco’s pricing
methodology has been informed by a number of considerations, including the context and
characteristics of the gas consumer market, historical pricing structures, and the risks and
opportunities Powerco perceives in the reticulated gas market.
Challenging consumer market
Reticulated gas is a challenging consumer market in New Zealand. Although overall energy
use continues to rise more or less continuously, consumption of natural gas declined for a
number of years in the early 2000s. Since 2009/10, gas connections and gas consumption
have either held static or increased at a moderate rate. Powerco believes that this
turnaround in the demand for reticulated gas is due, at least in part, to improved marketing
and a greater focus on the needs and preferences of its customers as revealed by market
surveys and focus groups.
A commercially important characteristic of reticulated natural gas is that it is a discretionary
fuel. Reticulated gas provides the heat for cooking, water heating, and space heating, but
alternatives are available for all of these uses, including electricity, bottled gas, and solid
fuels. By contrast, reticulated electricity tends to be considered essential, as few
alternatives to an electricity connection exist for such applications as lighting, electronics
20 | P a g e
and motorised appliances. Prospective reticulated gas consumers have a range of choices
for their fuel needs, and gas prices need to be structured carefully to attract new customers.
This investment decision is reopened each time a gas appliance needs replacing, and gas
prices need to be attractive at that point in order to retain customers.
Hence, Powerco’s price-setting process for its gas distribution business begins with
consideration of its customers’ needs and characteristics. Network businesses are largely
fixed cost businesses; consequently, for every incremental gigajoule (GJ) or customer
added to the system, the average cost per customer or per GJ will decrease (until the point
where substantial new investment is required).
From a company viewpoint, growing and maintaining a sustainable gas distribution business
that can deliver stable and improving earnings for its investors and lenders is consistent with
Powerco’s corporate mission. Maximising the use of Powerco’s gas distribution network will
also enable the cost of gas distribution to remain competitive with other energy sources.
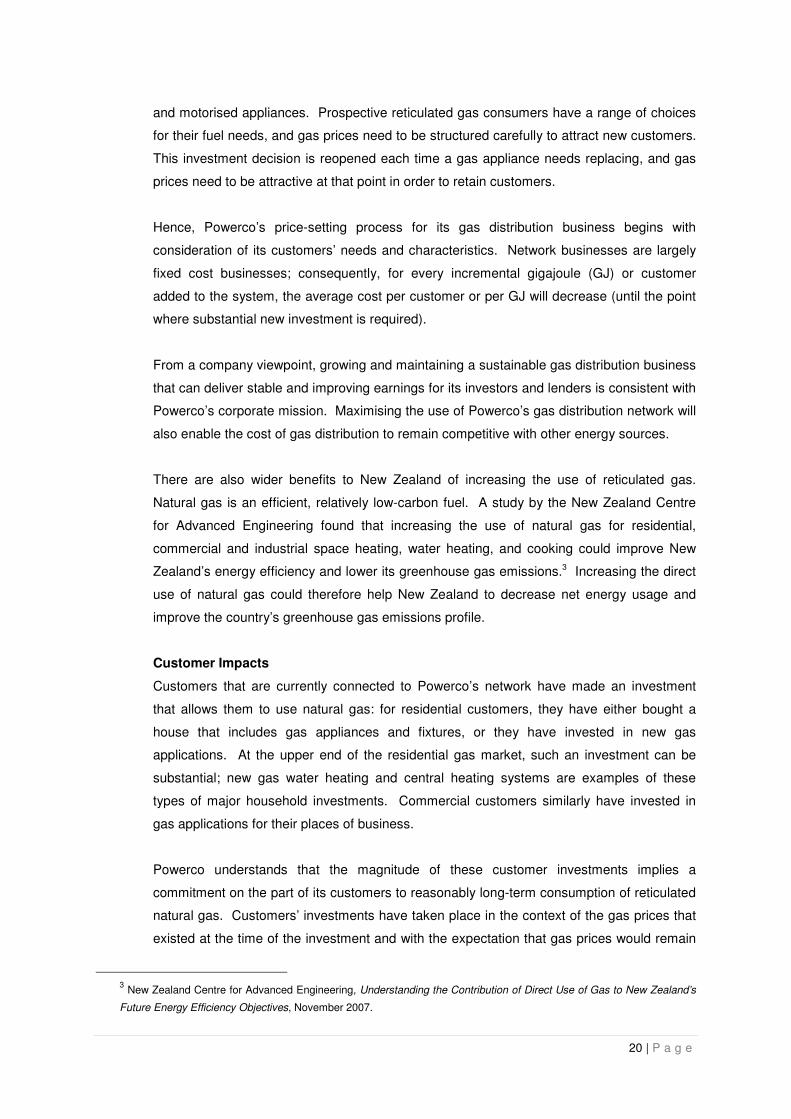
There are also wider benefits to New Zealand of increasing the use of reticulated gas.
Natural gas is an efficient, relatively low-carbon fuel. A study by the New Zealand Centre
for Advanced Engineering found that increasing the use of natural gas for residential,
commercial and industrial space heating, water heating, and cooking could improve New
Zealand’s energy efficiency and lower its greenhouse gas emissions.3 Increasing the direct
use of natural gas could therefore help New Zealand to decrease net energy usage and
improve the country’s greenhouse gas emissions profile.
Customer Impacts
Customers that are currently connected to Powerco’s network have made an investment
that allows them to use natural gas: for residential customers, they have either bought a
house that includes gas appliances and fixtures, or they have invested in new gas
applications. At the upper end of the residential gas market, such an investment can be
substantial; new gas water heating and central heating systems are examples of these
types of major household investments. Commercial customers similarly have invested in
gas applications for their places of business.
Powerco understands that the magnitude of these customer investments implies a
commitment on the part of its customers to reasonably long-term consumption of reticulated
natural gas. Customers’ investments have taken place in the context of the gas prices that
existed at the time of the investment and with the expectation that gas prices would remain
3 New Zealand Centre for Advanced Engineering, Understanding the Contribution of Direct Use of Gas to New Zealand’s
Future Energy Efficiency Objectives, November 2007.

21 | P a g e
about the same in the future. In return, Powerco believes that it has a commitment to its
customers to keep distribution prices as stable as reasonably possible.
Powerco’s understanding of the effect on customer of changes to gas prices is also
informed by previous experience. For example, retail tariffs to residential customers in
some of Powerco’s gas network regions were at one point completely variable, with no fixed
daily charge. When the incumbent gas retailer restructured its prices to include a daily fixed
residential charge, Powerco experienced a significant increase in the number of
disconnections in the regions.
Powerco therefore intends to manage carefully any change of tariffs to its gas distribution
customers, in order to honour the commitment implied by previous prices and to mitigate the
risk of customer disconnection.
Volume risk
There are two aspects to the business risk that Powerco faces as a natural gas distribution
business. The first is the risk associated with possible customer disconnection. The second
is volume risk caused by yearly variation in end-use customers’ consumption, some of
which will be weather related.
Any pricing framework must therefore have regard to the risk that it might impose on
company revenues, consistent with Powerco’s mission to provide sustainable returns and
growth for shareholders.
Pricing structure
Powerco’s experience is that reticulated gas customers, particularly residential customers,
do not fully comprehend the way in which retail gas pricing works. Gas pricing, like
electricity, is made up of a number of discrete elements that are bundled by gas retailers,
and each of these elements can itself be priced in a complex way. Gas transmission
charges, for example, can arise from the Maui pipeline or the Vector transmission system,
each of which has its own pricing arrangements. The Gas Industry Company levy has two
components, a per-ICP charge for retail customers and a per-GJ charge for wholesale
market transactions; both of these are incorporated into the retail tariffs faced by residential
and commercial customers. Gas distribution charges are another source of complexity.
Powerco’s current gas network prices are largely a product of history. As Powerco has
grown its gas business both organically and by acquiring new gas network regions, a
patchwork of different tariffs has developed through the continuation of legacy tariffs and
other historical anomalies. For Powerco, the current process of developing a pricing

22 | P a g e
methodology has been an opportunity to examine existing price structures and to consider
rationalisation and simplification where possible.
Simpler price structures would benefit gas retailers and Powerco’s own business, by
lowering the administration costs associated with tariff changes and billing procedures.
Powerco would prefer the effects of such price simplification to be passed through by
retailers and hence able to be seen by end-use customers.
Retail pricing issues
On average, gas distribution services represent about 35-40% of a residential gas
consumer’s total annual gas bill.4 While this is a significant proportion, it also means that
any pricing signals a gas distribution company attempts to convey to end use customers
may be modified in the final retail charges. This difficulty is compounded by the fact that
energy retailers may have different objectives with respect to end-use gas customers.
For the major gas retailers in New Zealand (Nova Energy and Genesis Energy on
Powerco’s networks), gas represents only a relatively small portion of their retail portfolios;
electricity retailing tends to be their primary focus. In addition, some gas retailers may also
offer liquefied petroleum gas (LPG) services to their customers. Gas retailers are therefore
able to offer their customers a range of competing energy options, while Powerco can only
provide reticulated natural gas services with its gas pipelines. This difference means that
retailers’ business incentives may not be in alignment with Powerco’s, with a resulting
mismatch between business strategies and objectives with respect to natural gas
customers.
In particular, energy retailers may be relatively indifferent as to the type of energy they
supply to customers. A customer’s decision to install natural gas appliances in an existing
household will lead to a decrease in the electricity consumed by that household, and the
switch may represent no net benefit to the retailer. Equally, a decision by a customer to
disconnect from reticulated gas will result in an increase in that household’s electricity usage
or a switch to bottled gas, and again the retailer may be indifferent between these
outcomes.
In contrast, Powerco has a very strong incentive to connect new gas customers and to
retain the ones already connected. Simply put, each additional reticulated gas customer on
Powerco’s network increases the use of our existing gas assets and lowers the cost per
customer.
4 As determined by the Ministry of Economic Development, Domestic Gas Prices, available up to 1 September 2008.
23 | P a g e
These differences are not merely academic; in Powerco’s experience, there are real
differences in gas retail and distribution business strategies, particularly with regard to
pricing. As an example, Powerco’s own experience, supported by market research
findings5, suggests that many households perceive the fixed component of retail gas tariffs
to be too expensive: increases in fixed charges have directly led to increased
disconnections and fixed charges are frequently cited as a deterrent to natural gas usage by
survey respondents. However, Powerco has found that gas retailers often prefer to set a
relatively high fixed gas tariff component, which produces a stable cash flow and a relatively
high profit margin. To a gas retailer, these benefits seem to outweigh any negative effects
that a high fixed tariff has on customer recruitment and retention. In fact, Powerco has in
the past lowered its fixed charge, only to see retailers absorb the decrease, rather than pass
it through to customers.
4.2.3 Pricing outcomes sought
Achieve the allowed target revenue
Powerco’s primary pricing objective with respect to its gas network is for pricing to contribute
as part of an overall strategy to a vibrant and sustainable gas business; that is, Powerco
seeks to recover its allowed target revenue to sustain the gas network business and provide
for future required investment.
Charge customers a reasonable share of the costs of using the network
As far as practicable, customers should be charged a price that reflects the costs of
providing the service to them. However, cost reflective charging is not the only objective
considered when determining prices.
Professor Alfred E. Kahn wrote;6
The basic defect of full cost distribution as the basis for pricing is then that they ignore the
pervasive discrepancies between marginal and average cost. T]hose discrepancies may
require prices that take into account not just the costs but also the elasticities of demand of
the various categories of service if the company is to recover its total costs. Whenever
there is some separable portion of the demand sufficiently elastic that a rate below fully-
distributed costs for it would add more to total revenue than to total costs, any insistence
that each service or group of patrons pay their fully allocated costs would be self-defeating.
It would force the firm to charge a price that would result in its turning away business that
would have covered its marginal costs – in other words would prevent it from obtaining from
customers with an elastic demand the maximum possible contribution to overheads.”
5 Powerco Market Research, Stage 1 Qualitative Research, July 2011 and Stage 2 Quantitative Research,
September2011, Peter Glen Research. 6 Alfred E. Kahn, The Economics of Regulation, Principles and Institutions, 1971, p.155.
24 | P a g e
Powerco aims to set tariffs that are cost reflective, but equally aims to ensure that
customers face prices that they perceive to be a reasonable and fair reflection of the service
provided. In particular, Powerco aims to treat low volume residential customers equitably.
Promote price stability and minimise price shocks to customers
Existing customers have chosen to invest in natural gas appliances with an expectation that
future prices will be reasonably comparable to past prices. Therefore, any necessary price
movements should be implemented gradually over time. Future price movements will be
informed by customer reactions to previous changes as well as by customer consultation on
prices.
Simplify tariff structure where possible
Simpler price structures can benefit customers, because they make understanding
distribution tariffs easier. In addition simple tariff structures benefit retailers through lower
administration costs.
Mitigate the volume risk faced by Powerco
Prices should be structured in a way that, to the extent practicable, fairly reflects the extent
of Powerco’s fixed costs, and consequently mitigates the risk associated with annual
fluctuations in consumption, while responding to customers’ preferences for variable tariffs.
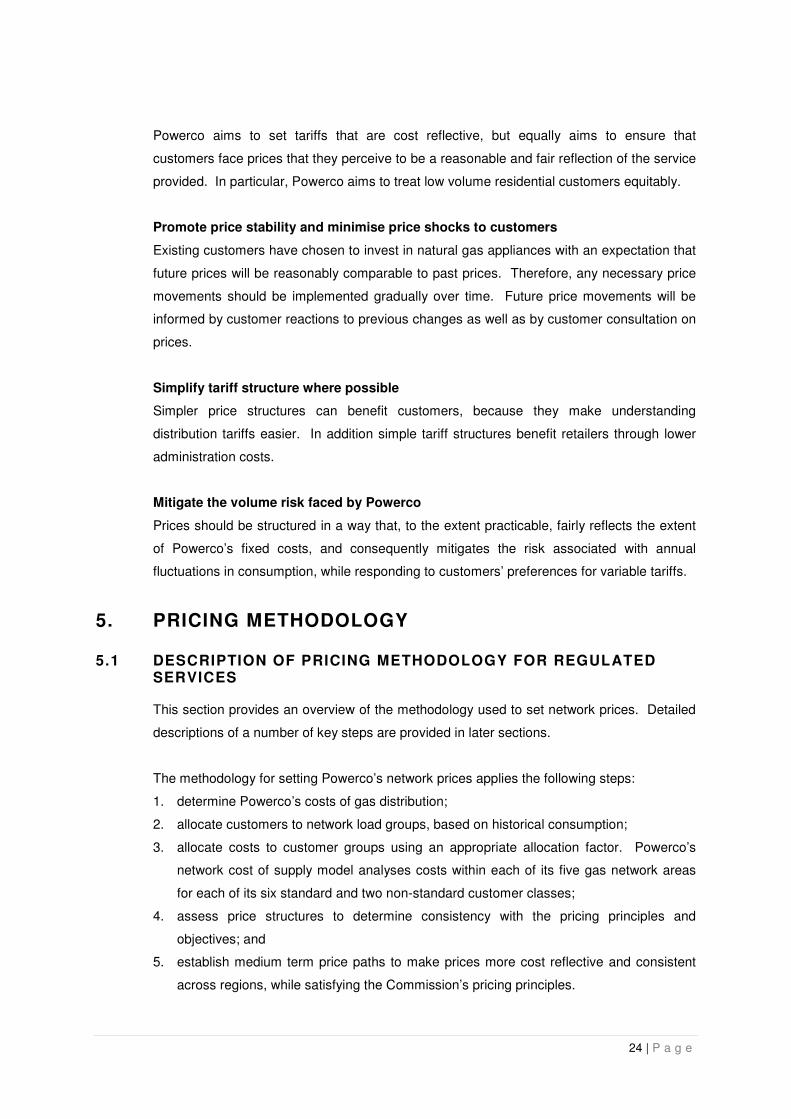
5. PRICING METHODOLOGY
5.1 DESCRIPTION OF PRICING METHODOLOGY FOR REGULATED SERVICES
This section provides an overview of the methodology used to set network prices. Detailed
descriptions of a number of key steps are provided in later sections.
The methodology for setting Powerco’s network prices applies the following steps:
1. determine Powerco’s costs of gas distribution;
2. allocate customers to network load groups, based on historical consumption;
3. allocate costs to customer groups using an appropriate allocation factor. Powerco’s
network cost of supply model analyses costs within each of its five gas network areas
for each of its six standard and two non-standard customer classes;
4. assess price structures to determine consistency with the pricing principles and
objectives; and
5. establish medium term price paths to make prices more cost reflective and consistent
across regions, while satisfying the Commission’s pricing principles.

25 | P a g e
5.2 PRICING METHODOLOGY DEVELOPMENT
5.2.1 Current cost of supply model
Powerco’s current cost of supply model for the gas network business allows the user to
allocate costs and revenues across the respective tariff load groups using alternate
allocation methods. The model develops a total cost per network load group as well as a
cost per GJ and/or a cost per day. In addition, the model allows the user to assess
alternative future tariff scenarios to compare future pricing against future costs.
A schematic of the network model is presented below. There are a number of assumption
sheets (coded grey in the figure) that include parameters such as weighted average cost of
capital (WACC), consumer price index (CPI) figures, demand forecasts, and cost and
revenue forecasts. The blue boxes show the data entry sheets that contain ICP data for
each of Powerco’s customers. Calculation sheets allocate ICPs to defined load groups and
allocate costs based on the parameters selected. Orange Pastel-coded output sheets show
distributed costs, analyse the subsidy-free tariff range and evaluate pricing scenarios for
compliance with the aggregate price cap.
As noted in section 2 above, the cost of supply model is going to be reviewed and rebuilt as
part of the development of Powerco’s new medium-term gas pricing strategy.

26 | P a g e
Network Model Schematic
5.2.2 Serv ice Class Def ini t ions and Qual ity
Network Load Group Definitions
Network Load Groups are delineated by nominal capacity, in scmh, and by annual
consumption, as shown in the chart below.
Network Load Group Definitions
scmh Annual Consumption
Load Group Min Max Min GJ Max GJ
G06 0 10 0 16
G11 0 10 16 Unlimited
G12 10 25 16 Unlimited
G14 25 60 16 Unlimited
G16 60 140 16 Unlimited
G18 140 200 16 Unlimited
G30
Individually priced customers who do not have a TOU meter n/a n/a 0 10 TJ
G40
Individually priced customers with a TOU meter n/a n/a 10 TJ Unlimited
27 | P a g e
Network Service Quality
The provision of a safe and reliable gas network distribution service is an integral part of
Powerco’s business. Consumer safety is paramount in the management and operation of a
gas pipeline network. Gas pipeline faults are inherently more dangerous to consumers than
electricity network outages, and consequently more stringent safety requirements apply to
gas pipeline operators.
Powerco must comply with the very high safety standards under the Gas Act 1992, the Gas
Regulations 1993 (SR 1993/76), and NZS5258 (Gas distribution networks). In particular,
Powerco must ensure that appropriate network pressure is maintained at all times to ensure
that domestic and commercial gas appliances connected to the network are able to operate
safely and satisfactorily.
Powerco must operate all parts of its networks to a very high level of availability, as any
form of supply interruption would result in a requirement to physically inspect all affected
gas appliances and installations, an expensive and time-consuming process. This is
because some domestic appliances do not automatically shut down in the event of a gas
supply interruption. Once gas supply is restored to these appliances, there is a risk that
pilot lights may not reignite; causing an unsafe build-up of uncombusted gas that can result
in an explosion. There is also the risk of air entering the gas pipeline and causing supply
interruptions or explosions. As a result of these risks, Powerco targets and achieves a very
high level of availability throughout its networks, and this standard is available to all
customer classes.
As the level of availability is high across the network, the network is interconnected and
consumers of different classes are geographically diverse, different levels of quality are
generally not offered to different customers, i.e. all customers receive the same level of
service quality. One exception to the rule of uniform quality across the gas distribution
network is in terms of service pressure. In some cases, large industrial customers can
specify, and receive, delivered gas pressure that satisfies the particular requirements of
their businesses.
Network service quality is monitored and audited by WorkSafe New Zealand, an
independent Crown entity. There are also legal requirements under the Gas Regulations to
report certain types of incidents. Powerco must publicly disclose other system condition and
reliability information under other regulations.

28 | P a g e
Regulated Network Service Quality Measures
The network service quality measures set by the Gas Distribution Services Default Price-
Quality Path Determination 2013 are:
A gas distribution business’s (GDB’s) response time to emergency values for each
Assessment period7 must be such that:
RTE60 ÷ RTEt ≥ 0.8 ; and
RTE180 ÷ (RTEt – RTEexcl) = 1
Where
RTEt is the total number of emergencies in the Assessment Period;
RTEexcl is the total number of emergencies in the Assessment Period for which the
Commission has granted and exclusion in writing;
RTE60 is the total number of emergencies in the Assessment period where the
GDB’s RTE was less than or equal to 60 minutes; and
RTE180 is the total number of emergencies in the Assessment period where the
GDB’s RTE was less than or equal to 180 minutes.
At the time of writing Powerco was on track to satisfy these measures for the first Assessment Period.
5.2.3 Cost Al locat ion Methodology
Cost allocation for network services
Conceptually, there are three possible categories of costs:
• costs that are directly attributable to a specific load group within a specific region;
currently no costs are allocated in this way;
• costs that are attributable to a specific region but not a specific load group, for
example the costs of reactive maintenance, scheduled maintenance and customer
initiated maintenance; and
• indirect costs, which cannot be attributed to a region or a load group, for example
administration costs, information technology costs and some pass through costs.
Costs that are directly attributable to a specific load group within a specific region do not
need to be allocated; they can merely be assigned to the relevant load group. The cost of
supply model allows costs of this nature to be included in the evaluation, though none has
been identified.
1. 7 Usually the year ended 30 September, but the first Assessment Period was 1 July 2013 to 30 September 2014.

29 | P a g e
The other two categories of costs need a specific method to allocate them to load groups. It
is important to note that networks create economies of scale though shared assets and
there is no single “correct” way of efficiently allocating the resulting common costs. In
practice, however, the possible allocators available are limited.
In all cases, Powerco has attempted to allocate costs based on the factor that is most
closely related to the cause of the costs.
Regional costs have been allocated as follows:
Regional Network Cost Allocators
Directly Attributable Costs to Regions Cost Allocator
Reactive Maintenance Replacement Cost
Scheduled Maintenance Replacement Cost
Customer Initiated Maintenance Replacement Cost
Depreciation of Network Assets Replacement Cost
Other Direct Costs
Direct Rates to Regional Property Replacement Cost
Other Direct Regional Costs Replacement Cost
Using the gross (replacement) asset value rather than a depreciated number ensures costs
are allocated using a value that directly reflects the service potential of the asset rather than
depreciated historical cost, which declines with age and then increases sharply when assets
are replaced. The method used to allocate asset values to load groups is described in the
Asset Value Allocation section below.

30 | P a g e
Indirect costs have been allocated on the basis of the following allocators:
Indirect Network Cost Allocators
Indirect Costs Cost Allocator
Administration Customer Numbers
Engineering Support Replacement Cost
Pass Through Costs
� Audit Fees Customer Numbers
� Indirect Rates Customer Numbers
� Statutory Levies Customer Numbers
� Other Indirect Costs Customer Numbers
Return on Assets
� Depreciation of Network Assets Replacement Cost
� Amortisation of Intangibles Customer Numbers
� WACC Replacement Cost
Taxation
� Taxation Expense Replacement Cost
Generally, costs that are asset-related (which include depreciation and return on assets
and, by extension, taxation) are allocated on the basis of the share of Powerco’s total
replacement cost that a particular load group uses. Costs that are not directly related to
assets, such as administration and pass through costs, are allocated equally across all
customers.
Powerco uses replacement costs as the allocator for the regulated capital charge (WACC).
For this exercise, replacement costs are more appropriate as an allocator than optimised
deprival value8 (ODV) or depreciated costs, as using depreciated costs would tend to
produce volatile allocation results over time as aged assets are replaced by new assets. By
contrast, replacement cost provides an allocator reflecting the investment without the age
dependent variation that a depreciated asset allocator would involve. An additional
consideration is that, as an element of pricing, cost allocation using ODV would act to
counter ideal economic signals; for example:
• customers mainly connected to older assets would have a lower cost allocation but
the assets may be more likely to require enhancement and economic based pricing
could be higher to reflect this; and
8 Optimised deprival value means the lower of optimised depreciated replacement cost or economic value (value of
the best alternative use of the asset).
31 | P a g e
• customers mainly connected to newer assets would have a higher cost allocation
but the assets may be more likely to have surplus capacity and economic based
pricing could be lower to reflect this.
Consequently, Powerco has used replacement costs as the basis for allocating the capital
charge because of the stability this allocator offers and because it more closely reflects
economic pricing considerations.
Network Asset Value Allocation Methodology
The costs attributable to a specific region tend to be related to the value of network assets
needed to service the region. For this reason, there is a need for a methodology to allocate
regional network asset values to load groups. Broadly, the methodology Powerco has
adopted estimates the percentage of regional assets used by each load group based on the
types of assets employed and the annual consumption of each load group.
The analysis involves the three steps, which are outlined in greater detail in the sections
below.
1. The first step is to group network assets into System Categories.
2. Load groups are assigned to one or more System Categories depending on the assets
used to supply their loads.
3. A load group’s share of the total annual consumption for System Category is used to
assign a portion of that System Category’s value. These System Category value
portions then are summed for each individual load group to give its total asset value
allocation.
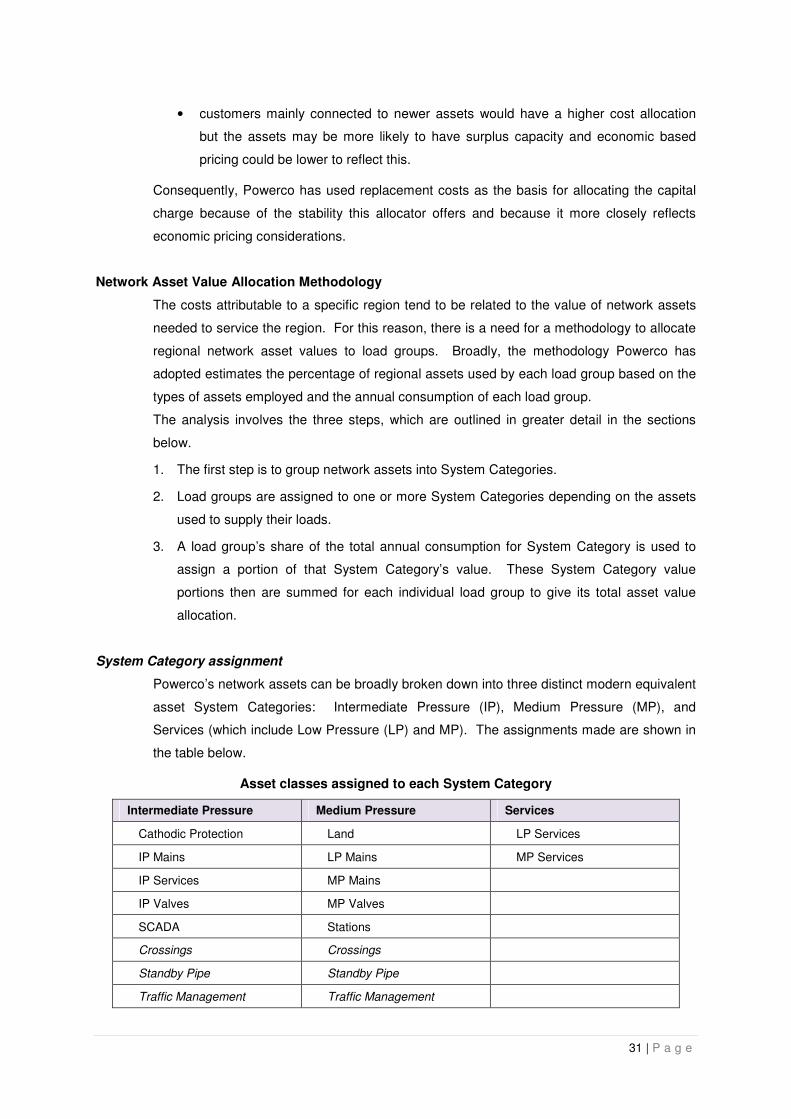
System Category assignment
Powerco’s network assets can be broadly broken down into three distinct modern equivalent
asset System Categories: Intermediate Pressure (IP), Medium Pressure (MP), and
Services (which include Low Pressure (LP) and MP). The assignments made are shown in
the table below.
Asset classes assigned to each System Category
Intermediate Pressure Medium Pressure Services
Cathodic Protection Land LP Services
IP Mains LP Mains MP Services
IP Services MP Mains
IP Valves MP Valves
SCADA Stations
Crossings Crossings
Standby Pipe Standby Pipe
Traffic Management Traffic Management

32 | P a g e
Cathodic Protection has been allocated to the IP System Category, as it would primarily be
used to protect the steel pipe that makes up all of the IP Mains. SCADA has also been
allocated to the IP System Category, as it is primarily used to monitor the gas pressures and
flows through the IP networks.
Station assets have been allocated to the MP System Category, as they only exist to
provide the lower pressures used in the MP networks. Land has also been allocated to this
System Category, as each station location requires land.
Italicised asset classes are common to both the IP and MP System Categories. In these
cases, the asset class’s value is shared between the System Categories based on the
proportion of total mains length in each System Category. For this exercise, the MP System
Category mains length is the sum of the MP Mains and LP Mains lengths.
Load Group assignment
Each load group is served by a different collection of System Categories. The large
industrial customers that make up the G40 tariff group are almost exclusively served by the
IP System Category, the Load Groups usually assigned to commercial customers are
served by the IP and MP System categories, and finally the residential load groups are
served by all three System Categories. These assignments are shown in the table below.
Assignment of Load Groups to each System Category
Intermediate Pressure Medium Pressure Services
G06 G06 G06
G11 G11 G11
G12 G12
G14 G14
G16 G16
G18 G18
G30 G30
G40
Determining Allocation Shares
The annual consumption volumes for each load group are entered into the table where they
appear, and total volumes within each System Category are calculated to give the total
annual demand for that category.
33 | P a g e
Within each System Category, a load group’s contribution to the total annual demand is
calculated as a percentage of that Category. For example, if a load group contributed 5,000
GJ to the total annual demand of 20,000 GJ in the IP System Category, then it would be
allocated 25% of the IP System Category. If this load group were also represented in the
MP System Category, then it would account for a larger percentage of the MP System
Category as the overall total would be smaller.
Within each System Category, load groups are weighted according to the percentage of
consumption volume that each contributes to the overall consumption within that category.
These percentages are then multiplied by regional asset values to derive the value of assets
used by each load group within each category. To continue the example above, if this IP
System Category had an asset value of $200,000, then the load group in question would be
allocated 25% of this amount, or $50,000. These asset value shares are then summed
across load groups to obtain the total value of system assets used by each load group.
Finally, these values are converted to a proportion of total regional network asset value.
These proportions are used as allocators in the network model.
5.2.4 Analysis of the extent to which costs are marginal , and whether the
associated price components in the tariff structure ref lect those
marginal costs
Marginal costs are very difficult to evaluate in a meaningful way for gas distribution
companies. The term “marginal” implies the cost of the next additional unit of production
and long run marginal cost (LRMC) refers to the cost of providing an additional unit including
the capital cost of added capacity. The marginal cost for a distribution company is zero
much of the time, meaning that the next unit of gas can be distributed within the existing
capacity of the network system; once in a while, marginal cost is a very large number,
meaning that the next unit of gas would require additional installed capacity to distribute it.
Because of this dichotomy, the application of a strict definition of marginal cost would lead to
a step-wise pricing function, which would be neither practical to implement nor conducive to
price stability.
In order to avoid the difficulties inherent in evaluating marginal cost, Powerco uses the long
run average incremental cost of service (LRAIC) as a proxy for marginal cost. Incremental
costs are those that are caused by the addition of incremental units of volume load on the
distribution system. LRAIC is an adaptation of the LRMC approach and is widely used by
network businesses; it involves evaluating all forward-looking load-dependent costs as a
function of incremental volume. These costs are the average costs that Powerco would
incur on a per GJ basis as a result of additional volumes of gas flowing through its
distribution pipelines and, as such, they do not include the costs related to already-

34 | P a g e
constructed assets. Prices based on these incremental costs would under-recover allowed
revenues.
The methodology used to do this evaluation is detailed in section 5.2.5 below. In 2009,
incremental costs fell between $0.0101/GJ and $0.7627/GJ for network services.
It is a characteristic of distribution companies that they have large fixed costs and
substantial economies of scale in their operation. As a result, for such companies, the
average cost of serving a customer is greater than the marginal cost of service. Attempting
to address this situation, while still providing meaningful cost signals to consumers, is the
justification for a two-part tariff: one that contains a fixed, daily charge as well as a
consumption-based variable component. From an economic point of view, such a two-part
tariff should ideally be structured such that all marginal costs are charged on a variable
basis and all other costs on a fixed basis (so as not to distort consumption behaviour).
However, this ideal is just one of several competing and sometimes contradictory objectives
Powerco is trying to balance when developing its pricing methodology.
Powerco has limited tariff tools available to signal marginal costs and, as a network
business, its marginal cost signal would generally (and correctly) be swamped by the
marginal cost of the fuel. Further, it is not practicable to reflect Powerco’s long run average
incremental costs in the variable tariff component, due to the fact that the long run marginal
cost of service is very small, compared to the average revenue that needs to be recovered
from each customer group. Instituting such a low charge for the variable component of the
tariff would mean a correspondingly higher fixed charge would need to be implemented.
Such a high fixed charge would act as a significant deterrent to existing and potential
customers.
Powerco has therefore determined that the variable tariff component must reflect at least the
LRAIC. This will ensure that the incremental costs (which are essentially avoidable costs if
no incremental load occurs) are signalled to customers. A comparison of 2009 variable
network charges and network LRAIC is shown below.

35 | P a g e
Comparison of Network LRAIC with Variable Charges in $/GJ
0.00
2.00
4.00
6.00
8.00
10.00
12.00
14.00
16.00
18.00
G06 G11 G12 G14 G16 G18
$ /
GJ
Load Group
Hawke's Bay Manawatu Wellington
Hutt Valley Taranaki Incremental Costs
5.2.5 Subsidy-free prices
For prices to be subsidy-free they must be set equal to or greater than incremental costs
and less than or equal to standalone costs.
Standalone cost methodology – standard gas distribution customers
For standard gas distribution services, standalone costs are established by estimating the
costs by load group likely to be incurred by a notional efficient competitor to Powerco’s
distribution network. In other words, the standalone cost methodology estimates the bypass
cost of supplying each of Powerco’s load groups. This is an appropriate approach to
determine standalone costs for the tariff group and is consistent with how standalone costs
have been calculated in other regulatory jurisdictions. Using tariff groups as the basis for
evaluation is the smallest practical grouping of customers that could be used for this
analysis.
Overview of the methodology
Powerco has developed a model of a nominal network that best represents its overall mix of
customers and asset types. As Powerco operates a diverse group of networks both in
terms of geographical layout and customer composition, there is no existing single network
or network segment that could be used as a representative network for developing
standalone costs. In some cases, there are too few residential customers on the network as
a proportion of the total customer base; in others, commercial customers are
underrepresented. Therefore, it is necessary to use a modelled representative network for
the standalone cost analysis.
36 | P a g e
One way of constructing such a representative network would be to construct a model that
includes all of Powerco’s approximately 103,000 customers and has many different sub-
networks made up of several thousand kilometres of pipe. However, there are practical
impediments to completing this task.
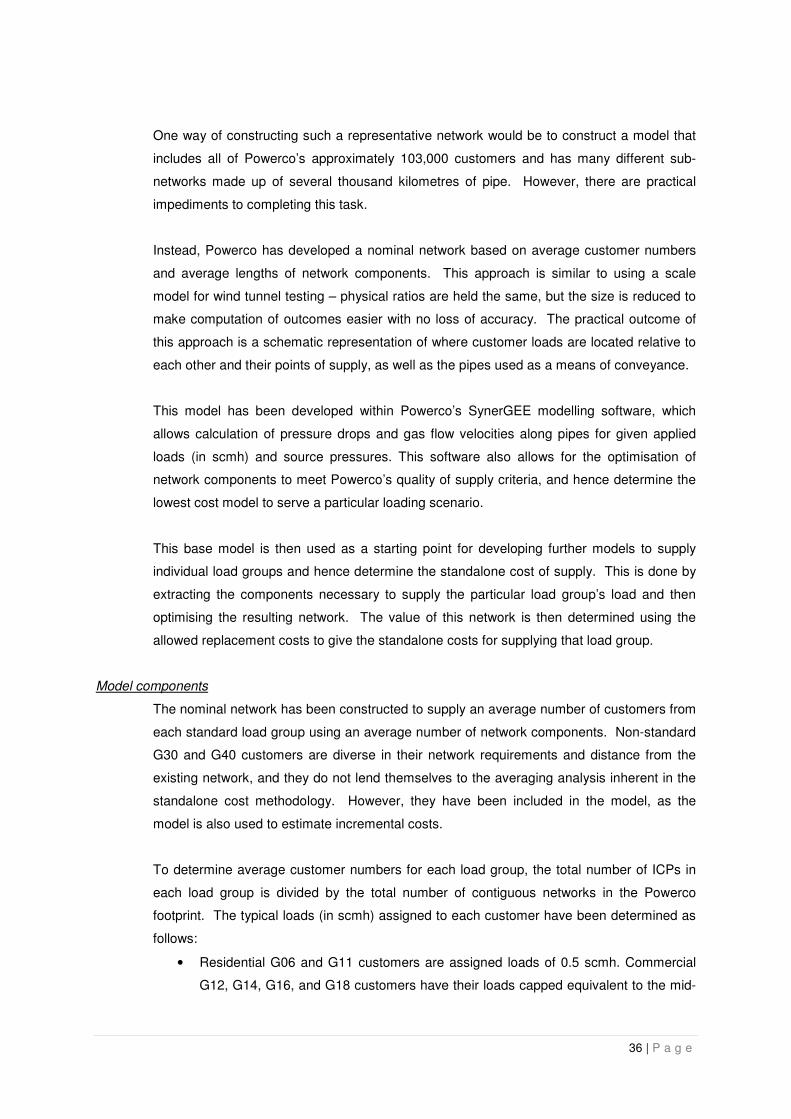
Instead, Powerco has developed a nominal network based on average customer numbers
and average lengths of network components. This approach is similar to using a scale
model for wind tunnel testing – physical ratios are held the same, but the size is reduced to
make computation of outcomes easier with no loss of accuracy. The practical outcome of
this approach is a schematic representation of where customer loads are located relative to
each other and their points of supply, as well as the pipes used as a means of conveyance.
This model has been developed within Powerco’s SynerGEE modelling software, which
allows calculation of pressure drops and gas flow velocities along pipes for given applied
loads (in scmh) and source pressures. This software also allows for the optimisation of
network components to meet Powerco’s quality of supply criteria, and hence determine the
lowest cost model to serve a particular loading scenario.
This base model is then used as a starting point for developing further models to supply
individual load groups and hence determine the standalone cost of supply. This is done by
extracting the components necessary to supply the particular load group’s load and then
optimising the resulting network. The value of this network is then determined using the
allowed replacement costs to give the standalone costs for supplying that load group.
Model components
The nominal network has been constructed to supply an average number of customers from
each standard load group using an average number of network components. Non-standard
G30 and G40 customers are diverse in their network requirements and distance from the
existing network, and they do not lend themselves to the averaging analysis inherent in the
standalone cost methodology. However, they have been included in the model, as the
model is also used to estimate incremental costs.
To determine average customer numbers for each load group, the total number of ICPs in
each load group is divided by the total number of contiguous networks in the Powerco
footprint. The typical loads (in scmh) assigned to each customer have been determined as
follows:
• Residential G06 and G11 customers are assigned loads of 0.5 scmh. Commercial
G12, G14, G16, and G18 customers have their loads capped equivalent to the mid-

37 | P a g e
point of the flow rates allowed within the tariff band. Engineering judgment is used
to adjust these loads for diversity, depending on the number of customers within
each group. Groups with very few customers are left unchanged, whereas others
are reduced by up to 50% as the number of customers increases. This approach is
a conservative method of allocating peak loads for these groups.
• G40 customers are assigned a load equivalent to the average of the peak flows of
the 20 TJ customers. Very minor adjustments to this assigned load are made
applying engineering judgement.
• G30 customers have been assigned a proportion of the G40 customers’ load based
on the ratio between the total annual demands of each load group.
Average network components have been derived by calculating the average network length
of MP mains and IP mains and then assigning appropriate pipe sizes to supply the nominal
loads in the model. In this way, pipe sizes can be optimised to reflect the modelled load
being served, thus providing a more conservative estimate of standalone cost than if actual
existing pipe sizes had been used.
Full model construction
The full model is designed to provide adequate gas supply for all Load Groups at the same
time. Adequate supply is defined as satisfying Powerco’s operating pressure and quality of
supply criteria:
• Under the modern equivalent assumption, the nominal operating pressure (NOP) of
any IP segments is set to 1,500 kPa, and for MP segments it is set to 280 kPa.
• Under Powerco’s quality of supply criteria, the maximum allowable pressure drop
within any network is 40% of its NOP, which in these cases gives a minimum
allowable pressure of 900 kPa for any point in the IP network, and 168 kPa for any
point in an MP network. These quality criteria also limit the maximum gas flow
velocity along any pipe to 20 ms-1.
The load groups are laid out such that the G30 customers are located near the Gate Station
and supplied from a small MP network via a District Regulating Station (DRS) connected to
the IP main. The G40 customers are located on the IP main directly or from laterals to
either side of the main. This replicates the standard practice of positioning the gate station
as close as possible to the major industrial loads.
At approximately the mid-point of the IP mains, a DRS reduces the pressure to supply a
strip of commercial grade customers via an MP system, and it also supplies an
interconnected mesh of residential grade customers. This replicates a common style of
town planning that allows for commercial zoning between residential zoned land and

38 | P a g e
industrial zoned land. The mesh also mimics the interconnectivity an established network
develops through double siding and cross linking. A second group of commercial customers
is supplied on the far side of the established residential customers via a DRS set up at the
end of the IP main. More residential customers added to the MP network after this point
represent newer subdivisions that were added as the notional town grew. These newer
subdivisions have a lower degree of interconnectivity, as would be expected from the
expansionary work at network extremities.
Sub-system extraction
To evaluate the standalone costs by load group, each load group needs to be extracted
from the base model. In this process, a copy of the nominal network is made for each load
group and the assets not used to service the standalone load removed.
Standalone optimisation
Each standalone model is optimised by reducing pipe diameters such that they are sized to
supply only the load group’s load. In some cases, sections of IP mains are replaced by MP
network extensions where this configuration could adequately supply the load.
These optimisations result in the lowest cost set of assets that would meet the required
loads without compromising Powerco’s quality of supply criteria. The derived asset cost for
each load group is then scaled up for each Powerco gas network region by the actual
number of customers in that region.
Standalone cost derivation
The annual depreciation and return on capital are then calculated for each load group in
each region from that group’s standalone asset costs, assuming a 60-year life of assets and
applying the regulated WACC. These results are added to the other costs that have been
allocated to that particular load group, including maintenance costs, local council rates,
administration, and engineering support, to provide an annual standalone network cost for
that load group. For the purposes of comparison, this figure is then divided by total annual
GJ of gas consumed by that load group to obtain a standalone cost in $/GJ.
This methodology provides a conservative estimate of standalone costs because:
• it evaluates standalone costs for an entire load group, rather than an individual
customer;
• it does not include the cost of service pipes (individual connections), as they are
difficult to model;
• it does not include the cost of a transmission connection point, which would be
incurred by a standalone business;
39 | P a g e
• it uses optimised pipe sizes, rather than existing pipe sizes; and
• it assumes the standalone business will incur the same indirect costs that Powerco
as a whole does.
Standalone cost methodology – non-standard gas distribution customers
The modelling approach described above works for standard customers, because standard
customers have similar characteristics and because the large number of standard
customers means that using a model based on averages will yield meaningful results. This
method cannot be used for non-standard customers, as there are large differences in
customer characteristics and relatively few customer numbers. In statistical terms, non-
standard customers have a skewed distribution in terms of customer characteristics and a
small population size. Calculating a standalone cost based on averages will not yield a
meaningful result for these customers. This means that it is not possible to calculate a
single standalone cost that would be representative of all G30 or all G40 customers.
However, individual bypass costs can be calculated for each individual G30 and G40
customer. It is Powerco’s usual practice to ensure that non-standard prices recover their
associated cost of capital and approximate the bypass costs for each G30 and G40
customer. These prices are then tested in the marketplace: in locations where there is
competition from an alternate distribution service customers can choose between the prices
offered by Powerco and the prices offered by the competitor. In locations where no bypass
pipeline exists, customers still have a choice of whether or not to locate in that area and
whether or not to use natural gas as a fuel source.
In situations where non-standard customers with a service capacity of less than 200 scmh
would fit into a standard tariff category, there is the option of switching to that tariff if it
represents a better value proposition for the customer. In situations where this is not
possible (in the case of large industrial customers), customers can test the market when the
original non-standard tariff expires. Customers with changed circumstances can also seek
to modify the terms and conditions of their service agreements.
Hence, non-standard tariffs are carefully developed using bypass cost principles and are
tested against the marketplace at a number of points. This process ensures that any non-
standard tariffs Powerco maintains are not cross-subsidising other tariff categories: if prices
were above market rates, the customer would go elsewhere.
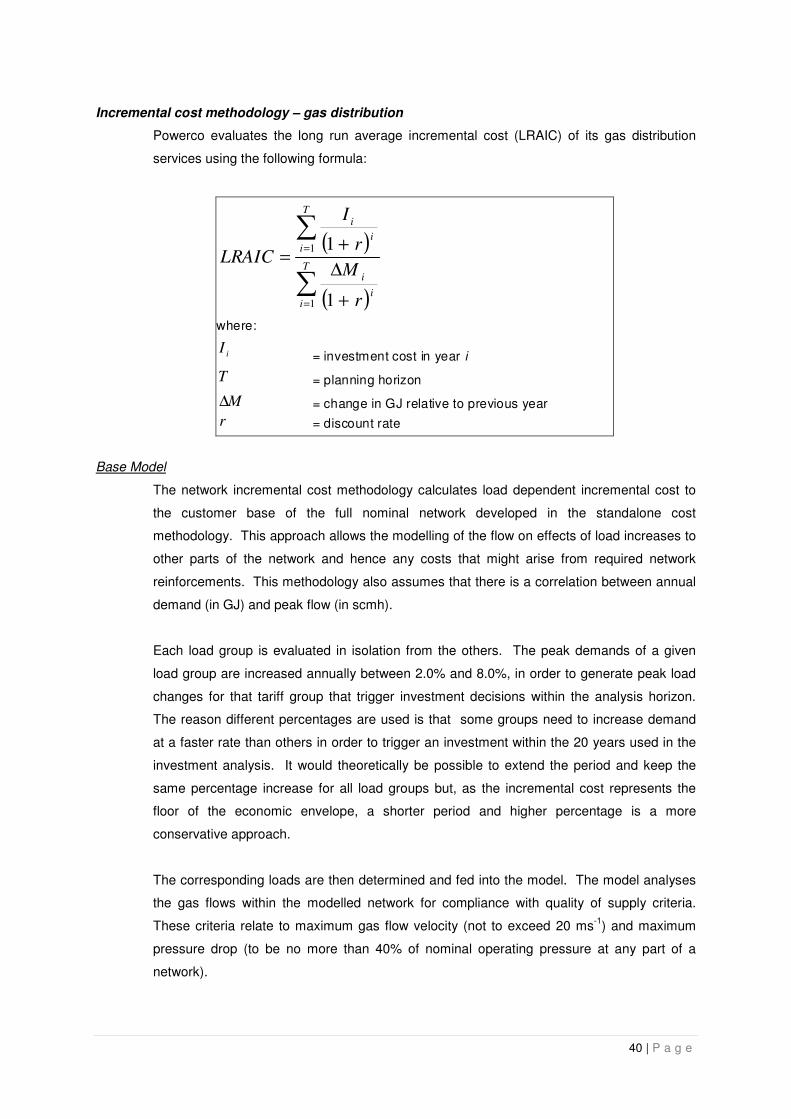
40 | P a g e
Incremental cost methodology – gas distribution
Powerco evaluates the long run average incremental cost (LRAIC) of its gas distribution
services using the following formula:
( )
( )∑
∑
=
=
+
∆
+=
T
i
i
i
T
i
i
i
r
M
r
I
LRAIC
1
1
1
1
where:
iI
= investment cost in year i
T = planning horizon
M∆ = change in GJ relative to previous year
r = discount rate
Base Model
The network incremental cost methodology calculates load dependent incremental cost to
the customer base of the full nominal network developed in the standalone cost
methodology. This approach allows the modelling of the flow on effects of load increases to
other parts of the network and hence any costs that might arise from required network
reinforcements. This methodology also assumes that there is a correlation between annual
demand (in GJ) and peak flow (in scmh).
Each load group is evaluated in isolation from the others. The peak demands of a given
load group are increased annually between 2.0% and 8.0%, in order to generate peak load
changes for that tariff group that trigger investment decisions within the analysis horizon.
The reason different percentages are used is that some groups need to increase demand
at a faster rate than others in order to trigger an investment within the 20 years used in the
investment analysis. It would theoretically be possible to extend the period and keep the
same percentage increase for all load groups but, as the incremental cost represents the
floor of the economic envelope, a shorter period and higher percentage is a more
conservative approach.
The corresponding loads are then determined and fed into the model. The model analyses
the gas flows within the modelled network for compliance with quality of supply criteria.
These criteria relate to maximum gas flow velocity (not to exceed 20 ms-1
) and maximum
pressure drop (to be no more than 40% of nominal operating pressure at any part of a
network).

41 | P a g e
If the quality of supply criteria are met, then no investment is required for that modelled year
and the analysis continues to the next modelled year. If the criteria are not met, then the
model is suitably reinforced before the analysis proceeds to the next year.
This process continues for 20 iterations to give a 20 year investment profile for that load
group. Twenty years was chosen as an appropriate long-term analysis horizon, as it
provides a reasonable long-term horizon that was not unduly time-consuming to analyse.
Further, as the incremental cost methodology uses the present value of future investments
and volume increases, extending the analysis horizon into the future would have had little
effect on the evaluated LRAIC.
Incremental Cost Derivation
The required investment stream associated with the modelled reinforcements is then
determined using the replacement costs of the network assets added to the model. These
are the incremental capital costs of load growth over the 20-year analysis. (Incremental
operating costs are assumed to be negligible in this exercise.) These costs and the
corresponding load growth (in GJ) are then evaluated according to the formula given above
to obtain an incremental cost in $/GJ.

42 | P a g e
5.2.6 Compliance with the pricing principles
Summary of Compliance with Pricing Principles
Principle Compliance
1) Prices are to signal the economic costs of service provision, by
a) being subsidy free (equal or greater than incremental costs, and less than or equal to standalone costs);
The proposed prices fall within the subsidy-free range, as demonstrated by the charts shown in Appendix 5 of the pricing methodology.
b) having regard, to the extent practicable, to the level of available service capacity; and,
c) signalling, to the extent practicable, the impact of additional usage on future investment costs.
Coincident peak demand charging was considered, but would be impractical to implement for mass market customers. The ability to store gas in the network (“line pack”) also undermines the economic case for coincident peak charging as higher peak demand does not necessarily trigger the need for additional capex.
Locational capacity signalling is used in the case of high volume users and subdivisions located away from the existing network.
2) Where prices based on “efficient” incremental costs would under-recover allowed revenues, the shortfall should be made up by prices being set in a manner that has regard to consumers’ demand responsiveness, to the extent practicable.
This pricing principle envisages the possible use of Ramsey pricing
9 or some form of coincident peak charging. However,
Ramsey pricing is impracticable as there is very limited information available on the price elasticity of demand for gas. In any event, distribution charges are invariably smaller than the charges for the energy that is consumed in conjunction with distribution services, so any price signals provided by the distribution charge are bound to be substantially diluted. With respect to coincident peak demand charging see the comment in the cell above.
Powerco has tailored a new G06 residential tariff to reflect the preferences of small residential customers.
3) Provided that prices satisfy (1) above, prices should be responsive to the requirements and circumstances of users in order to:
a) discourage uneconomic bypass, and,
b) allow negotiation to better reflect the economic value of services and enable consumers to make price/quality trade-offs or non-standard arrangements for services.
Powerco offers non-standard tariffs to industrial and commercial customers to address the risk of bypass and to enable arrangements that are tailored to customers’ needs.
These tariffs are reviewed to ensure they do not exceed stand alone cost (as a proxy for bypass).
4) Development of prices is transparent, promotes price stability and certainty for consumers, and changes to prices should have regard to the effect on consumers.
Price stability and the effect of price changes on consumers have been important considerations when designing the pricing methodology and the future strategy. With few exceptions, price increases are less than 15 per cent of yearly distribution charges for all individual customers.
9 Ramsey pricing requires prices to be set in inverse proportion to the price elasticity of demand for the
product concerned.

43 | P a g e
Principle 1: Prices are to signal the economic costs of service provision, by
a) being subsidy free (equal or greater than incremental costs, and less than or equal to standalone
costs)
The methodologies for determining standalone and incremental costs are discussed in
Section 5.2.5 above. Charts demonstrating that 2009 prices fell within the subsidy-free
range are included in Appendix 1.
b) having regard, to the extent practicable, to the level of available service capacity
Please see section (c) below.
c) signalling, to the extent practicable, the impact of additional usage on future investment costs.
Economic theory suggests that efficient prices should ignore historical costs and only look
forward to future investments; that is, prices should be based on long run marginal costs.
According to this approach, prices should be low where the need for further investment is far
in the future (and spare capacity exists). Prices should be high in cases when capacity is
constrained and investment is needed in the near future. This approach contrasts with the
average historical cost approach, which applies an accounting perspective to allocate
operating costs, depreciation, and cost of capital to customer groups.
Powerco has considered these principles from a number of perspectives. The first
consideration is, if prices are meant to signal capacity and the need for future investment,
then to whom should these pricing signals directed and what action are they meant to
prompt?
Capacity-based pricing issues
If the pricing signals are aimed at existing customers, then they should signal times of
system peak, when additional consumption could trigger the need for new investment.
Coincident peak demand pricing has been used with success in some situations to flatten
electricity demand peaks and defer then need for network upgrades. However, there are a
number of reasons why coincident peak pricing would be infeasible for Powerco’s gas
networks.
The first issue is that gas travelling through a pipeline has different delivery characteristics
to electricity travelling through wires. Electricity cannot be stored, so demand has to be
balanced instantaneously with generation at all times. This inflexibility necessarily leads to
peaky consumption patterns – major peaks are observed in daily, weekly and annual
consumption.

44 | P a g e
By contrast, reticulated gas systems do not tend to have such sharp peaks in consumption.
Unlike electricity, natural gas can be stored, and it is often stored in transmission and
distribution pipelines. At times of high usage, this stored gas (or “line pack”) is used to
serve the demand for gas consumption. Because of the smoothing effect line pack can
have on system peaks, there is less of a need for peak consumption to lead to greater
network investment.
Further, the cost of reinforcing a gas distribution network is relatively low compared to the
analogous investment in electricity. Gas distribution networks are designed for organic
growth at the margins, and the cost of progressive upgrade is relatively uniform. Step
increases in cost that restrict the ability to add new customers at the margins are rare. Even
where upstream reinforcement of the network is needed, it can typically be completed in
small incremental stages that balance the cost of upgrade against the value of additional
customers added. This means that if a capacity charge were introduced, it would be small,
as the costs of network reinforcement are small.
The third issue with coincident peak pricing is obtaining the data to implement such a pricing
structure effectively. On the supply side, although Powerco monitors overall load on its
networks, it is limited to periodic review of key network constraints. Monitoring actual
network utilisation would require significant investment in new equipment, and Powerco
considers that the cost of investment and monitoring would likely outweigh any potential
benefits.
There is also a lack of appropriate data on the demand side of the market to implement a
capacity charge. For this, one would need time of use consumption data, so that gas
consumed during a specified time period, say 5p.m. to 7p.m., would be priced at a different
rate to gas consumed the rest of the day. However, time of use data are not available for
the vast majority of Powerco’s customers. Only very large industrial customers have a time
of use meter. Converting Powerco’s mass market meters to time of use meters would be
prohibitively expensive, even if one could find time of use meters sized for the residential
market. The only information that Powerco has on its customers’ consumption is total units
of gas consumed. Consumption data are not a good proxy for estimating customer peak
demand.
Powerco therefore concludes that instituting a coincident peak demand charge in order to
influence peak customer usage is neither warranted in the case of gas distribution nor
practical from a data availability point of view.
45 | P a g e
Locational capacity signalling
Prices signalling capacity and the need to invest could also be targeted at potential gas
customers, rather than existing gas customers. In this case, the signal might act as a
means to influence potential customers’ location decisions.
On a system level, as detailed in earlier, Powerco is experiencing decreasing numbers of
gas connections and declining gas usage on its distribution network. These factors, coupled
with the fact that the gas networks are designed and constructed to accommodate
significant future growth in gas consumption, mean that there is a significant amount of
unused service capacity within the distribution network as a whole.
Across network regions, the amount of spare capacity is similar, so there would be little to
be gained by a regional capacity signal.
However, there are pockets within regions where service capacity can differ. For example,
Powerco has needed to reinforce the gas network pipe that feeds the Churton Park suburb
of Wellington. This pipe was originally installed over thirty years ago, when the suburb was
much smaller. The population growth of this region and its uptake of reticulated natural gas
have since meant that the original pipe needed replacing with a larger one. This is an
example of an instance where gas distribution prices to Churton Park residents could have
had regard to the decreasing levels of service capacity in that suburb and prices could have
signalled the effect of additional usage on future investment costs.
However, this outcome, while based on sound economic principles, would be impractical to
implement. Developing and maintaining prices on a suburb-by-suburb basis would be an
administrative burden, both for Powerco and for the retailers who sell gas on Powerco’s
network. More importantly, such a proliferation of tariffs would be confusing from a
customer point of view.
More fundamental is the question of how potential residential customers are supposed to
react to these potential pricing signals. To be effective, a pricing signal has to be
proportionate to the decision it is designed to affect. It is difficult to believe, for example,
that a prospective homeowner would use the differential prices of gas between two different
suburbs as a deciding factor in choosing a house to purchase. Equally, a prospective
restaurant owner would probably not be influenced by different gas prices when deciding on
a restaurant location. Even if the relevant decision were whether or not to connect to
reticulated gas, it is difficult to imagine that the distribution pricing differential would be able
to be distinguished in the retail tariff. Indeed, Powerco considers it unlikely that retailers

46 | P a g e
would elect to pass through such suburb by suburb pricing, even if Powerco did structure its
tariffs on this basis.
Further, implementing such a structure may lead to price instability and uncertainty for
customers. Again taking the example of Churton Park, once the pipeline is upgraded, then
there would again be spare capacity in that region, meaning prices should fall. Powerco
believes that tariffs should be constructed in a way that smooths such localised cost
differences and provides a consistent, equitable price across the region.
There a few groups of prospective gas customers for whom price signalling of capacity is a
meaningful and feasible exercise: high volume users and subdivisions located away from
the existing network may be two.
In the case of high volume users, it is Powerco’s practice to consider capacity constraints
and necessary upgrades when developing a non-standard tariff proposal for a prospective
new large industrial or commercial customer. These proposals are necessarily location-
specific and signal the level of available service capacity and any new investment required
to supply the prospective customer with the required service. In some cases, prospective
customers are considering more than one location, and different pricing proposals are
developed for each, reflecting the different costs that Powerco would face to construct the
connection and any necessary reinforcements.
Potential subdivisions located away from the existing network are similarly evaluated to
ensure that Powerco can adequately recover its cost of capital. In this case, Powerco may
require a capital contribution to connect the subdivision to its network. This capital
contribution signals the investment costs without the complexity of a proliferation of new
tariffs.
Principle 2: Where prices based on ‘efficient’ incremental costs would under-recover allowed
revenues, the shortfall should be made up by setting prices in a manner that has regard to
consumers’ demand responsiveness, to the extent practicable.
Setting prices based on a precise definition of price responsiveness, or price elasticity, is
difficult for gas distribution business, for a number of reasons. First, robust and relevant
information on price elasticity is extremely difficult to obtain, as the Commission itself stated
in the Gas Control Inquiry Few studies have been done in New Zealand; and the results of
studies conducted in other countries may not be applicable in the New Zealand context.
Second, price elasticity, strictly speaking, is the change in volume consumed in response to
a small change in price. In Powerco’s experience, the risk with increasing gas prices is less
47 | P a g e
about volumes consumed as it is about customer disconnections. As explained previously,
Powerco has experienced episodes when large numbers of customers disconnected in
response to a sudden increase in the fixed daily gas tariff. Consequently, Powerco needs to
be cautious when changing the price signals it sends to its connected customers.
The third difficulty with considering price elasticity in a formal way is that customers respond
to final prices, of which distribution represent only a portion. Retailers re-bundle distribution
prices, as well as wholesale gas and retail costs, into a final retail tariff for their customers.
In many cases, the structure of distributors’ prices – the extent to which tariffs are charged
on a daily or per unit of energy basis – is changed by the retailers. It is therefore very
difficult to discern customers’ responses to changes in distribution prices.
However, Powerco is very concerned about the potential impact of its prices on its
customers. In Powerco’s experience, customers can be very sensitive to reticulated gas
prices: as outlined above, there have been instances when an increase in the fixed portion
of residential retail gas tariffs has led to a significant number of disconnections. Powerco’s
price setting therefore addresses the issue of demand responsiveness from the perspective
of experience, rather than a quantitative assessment of price elasticities of demand.
It is Powerco’s perception that the small residential customers are the most vulnerable of its
customer groups. Customers consuming less than 16 GJ of gas per year are likely to be
using gas for only one or two small applications: cooking, perhaps, or a small gas heater.
These applications could be easily converted: gas cooktops can run on LPG gas with only
minor modifications; small gas heaters can be replaced with electric ones.
Consequently, a tariff aimed specifically at small residential customers has been created
(G06). This tariff, which is fully variable with no fixed daily charges, is the most economical
choice for customer using less than about 16 GJ of gas per year.
For the remaining customer classes, it is not known how customers will respond to any price
increases. Powerco therefore aims to take a prudent approach and implement price
changes cautiously, so that retailer responses and customer reactions can be gauged
before any subsequent pricing changes are determined.

48 | P a g e
Principle 3: Provided that prices satisfy (1) above, prices should be responsive to the requirements
and circumstances of users in order to:
a) discourage uneconomic bypass, and
b) allow negotiation to better reflect the economic value of specific services.
Powerco offers non-standard tariffs to industrial and commercial customers to address the
risk of bypass and to enable arrangements that are tailored to customers’ needs. There are
generally two groups of such non-standard customers: large industrial customers that
require capacities greater than 200 scmh (G40 customer group), and smaller commercial
and industrial customers located near a bypass pipeline (G30 customer group).
A number of criteria are considered when developing prices for non-standard customers.
For new customers, the process involves an assessment of the costs of constructing a new
connection to Powerco’s network and of the revenue required to support such an
investment. Other factors include an assessment of the estimated demand of the new
customer, the likely stability of the business (and therefore the risk the Powerco is taking on
in building dedicated assets for it), the length of the contract period, and other market
information.
For customers that fall within the defined consumption and capacity ranges of standard
customers, Powerco compares the developed non-standard price with the standard price in
the relevant customer category; the new customer is offered the lower of the two. For large
industrial customers, the developed non-standard tariff is presented as a proposal; the
possibility of bypass means that industrial customers generally are able to choose between
two or more price offers. In this way, any non-standard tariff is tested by comparison to
alternative pricing arrangements, and only those prices that represent the best value to
customers are put into place.
For existing non-standard customers, there is no investment decision on Powerco’s part, as
the connection assets have already been constructed. The expiration of a non-standard
pricing contract provides a point at which non-standard customers can revisit the terms of
their supply agreement with Powerco and ensure that their network services are consistent
with the requirements of their businesses.
While Powerco enters into direct discussions with large (G30 and G40) customers in a
number of instances, Powerco’s price discussions are generally with the retailers that
represent the large customers. In these cases, Powerco considers the retailers to be acting
as the agents for the large customers and seeking to ensure the best deals for their
customers.
49 | P a g e
By this process, Powerco discourages the uneconomic bypass of its network and allows
negotiation to tailor its services to the specific needs of businesses. Powerco expects to
continue this practice.
5.3 APPROACH TO SETTING PRICES FOR NON-STANDARD CONTRACTS
Powerco may offer non-standard tariffs to large commercial and industrial customers in
response to customer preferences or to address by pass risk. Non-standard tariffs may be
offered to customers that satisfy the following criteria:
• commercial and industrial consumers that require capacity of more than 200 scmh
with more than 10 TJ of annual consumption (G40 load group);
• commercial and industrial consumers that are located near to a potential bypass
pipeline (G30 load group) with consumption of less than 10 TJ per annum.
Considerations that may be taken into account when developing non-standard tariffs are:
• specific customer needs and preferences, such as load requirements, estimated
usage and specific location of investment;
• the most effective and efficient network solution and design to meet consumer
requirements, including the capacity of the existing Powerco network to supply the
customer’s needs;
• the cost of constructing a competitive network solution, and
• the investment risk for Powerco associated with constructing a dedicated network
solution for the customer. This assessment would include the risk associated with
the customer’s business and the period that the consumer would be willing to
commit to remain connected to the Powerco network. For a higher risk business the
contract price may be set with higher fixed component and the contract period may
be shorter.
5.4 POWERCO’S OBLIGATIONS AND RESPONSIBILITIES TO CUSTOMERS ON NON-STANDARD CONTRACTS IN THE EVENT THAT THE SUPPLY OF GAS PIPELINE SERVICES TO THE CUSTOMER IS INTERRUPTED
Powerco does not differentiate non-standard (G30-G40) customers from standard
customers with respect to interruption to supply. Basic load shedding categories are
industry set / driven and the status of customers at the ICP level are held in the Gas Industry
Company’s gas registry.

50 | P a g e
5.5 THE EXTENT OF NON-STANDARD CONTRACT USE
All customers in the G30 and G40 load groups are subject to non-standard tariffs. The total
number of ICPs represented by non-standard contracts at the end of March 2014 was 235
and the value of target revenue anticipated for these contracts in 2014/15 is $5,659,919.
5.6 THE VIEWS OF CONSUMERS
To date, Powerco has not undertaken any direct consultation with end customers about
variations in distribution prices and quality. The main reason for not doing so is that, for
mass market customers, changes to distribution prices do not flow through to end use
customers in a transparent way – how final charges are set is determined by the retailers.
However, Powerco does conduct market research (via both focus groups and customer
interviews), which helps to identify forms of pricing which may create barriers to the uptake
of gas. Customers have identified increases in fixed charges as the largest barrier to the
use of gas.
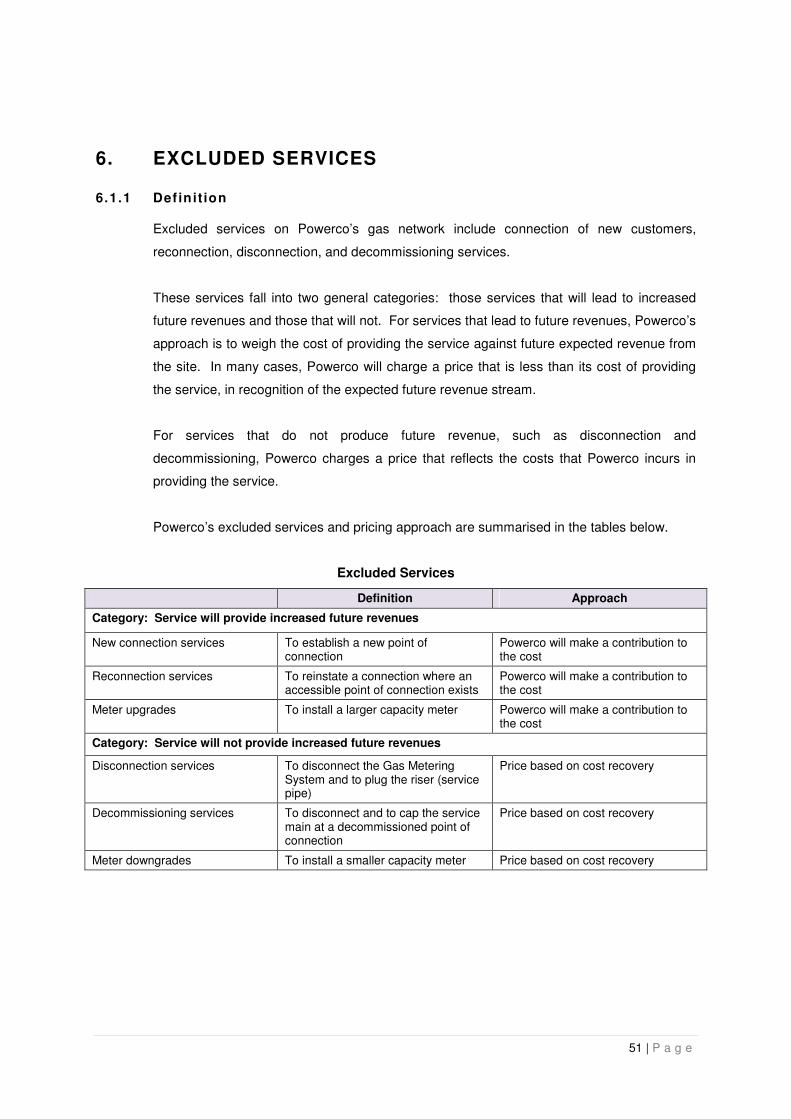
51 | P a g e
6. EXCLUDED SERVICES
6.1.1 Def init ion
Excluded services on Powerco’s gas network include connection of new customers,
reconnection, disconnection, and decommissioning services.
These services fall into two general categories: those services that will lead to increased
future revenues and those that will not. For services that lead to future revenues, Powerco’s
approach is to weigh the cost of providing the service against future expected revenue from
the site. In many cases, Powerco will charge a price that is less than its cost of providing
the service, in recognition of the expected future revenue stream.
For services that do not produce future revenue, such as disconnection and
decommissioning, Powerco charges a price that reflects the costs that Powerco incurs in
providing the service.
Powerco’s excluded services and pricing approach are summarised in the tables below.
Excluded Services
Definition Approach
Category: Service will provide increased future revenues
New connection services To establish a new point of connection
Powerco will make a contribution to the cost
Reconnection services To reinstate a connection where an accessible point of connection exists
Powerco will make a contribution to the cost
Meter upgrades To install a larger capacity meter Powerco will make a contribution to the cost
Category: Service will not provide increased future revenues
Disconnection services To disconnect the Gas Metering System and to plug the riser (service pipe)
Price based on cost recovery
Decommissioning services To disconnect and to cap the service main at a decommissioned point of connection
Price based on cost recovery
Meter downgrades To install a smaller capacity meter Price based on cost recovery

52 | P a g e
For new residential connections, the charges payable by the retailer depend on the:
• nature of the connection (standard or non-standard, defined below);
• length of the service pipe required; and
• nature of the load being connected.
For new commercial and industrial connections, Powerco will consider connection charges
on a case by case basis.
Standard residential connections are those that satisfy the following conditions:
• gas main is in the street;
• gas main runs past the property needing a connection; and
• gas main is on the same side of the road as the property needing a connection.
Standard connections have established prices. Non-standard connections may entail such
factors as gas mains extension, road crossing, long service pipes, installation on a steep
section, or a creek or river crossing. These connections are considered on a case by case
basis and the charge is based on the actual time and material required to connect the
customer and the expected customer load.
6.1.2 Medium-Term Price Strategy for Excluded Serv ices
In the medium-term, Powerco intends to maintain its policy of making a contribution to the
costs of those services that have a future revenue stream associated with them, such as
connections, reconnections, and meter upgrades. For other services, Powerco intends to
charge a price that reflects its own costs in performing the service.
Powerco intends to review its prices for these services periodically to ensure that they are
still reflective of the costs that Powerco incurs.

53 | P a g e
APPENDIX 1: ESTIMATES OF SUBSIDY FREE PRICES FOR STANDARD NETWORK CLASSES
This section sets out the results of analysis of the 2009/10 stand alone and the incremental
cost of supply, against the average tariff revenue per GJ. The network charges fell well
within the subsidy-free range at that time and this finding is unlikely to have changed in the
intervening period.
Hawke’s Bay Gas Network – 2009/10
0.00
5.00
10.00
15.00
20.00
25.00
30.00
35.00
G06 G11 G12 G14 G16 G18
$ /
GJ
Average Tariff Revenue Stand Alone Incremental Cost
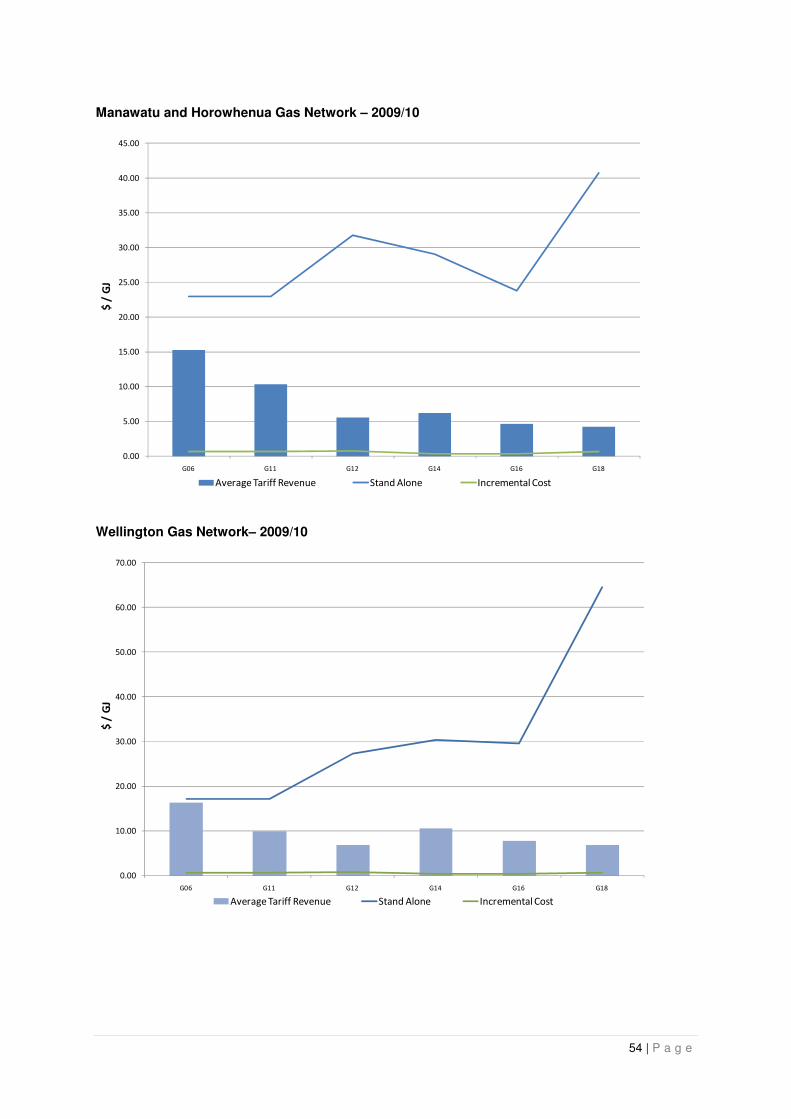
54 | P a g e
Manawatu and Horowhenua Gas Network – 2009/10
0.00
5.00
10.00
15.00
20.00
25.00
30.00
35.00
40.00
45.00
G06 G11 G12 G14 G16 G18
$ /
GJ
Average Tariff Revenue Stand Alone Incremental Cost
Wellington Gas Network– 2009/10
0.00
10.00
20.00
30.00
40.00
50.00
60.00
70.00
G06 G11 G12 G14 G16 G18
$ /
GJ
Average Tariff Revenue Stand Alone Incremental Cost

55 | P a g e
Hutt Valley and Porirua Gas Network– 2009/10
0.00
5.00
10.00
15.00
20.00
25.00
30.00
35.00
40.00
45.00
50.00
G06 G11 G12 G14 G16 G18
$ /
GJ
Average Tariff Revenue Stand Alone Incremental Cost
Taranaki Gas Network– 2009/10
0.00
5.00
10.00
15.00
20.00
25.00
30.00
35.00
40.00
45.00
50.00
G06 G11 G12 G14 G16 G18
$ /
GJ
Average Tariff Revenue Stand Alone Incremental Cost

56 | P a g e
APPENDIX 2: TARGET REVENUE FOR 2014/2015 AND THE PROPORTION OF THE TARGET REVENUE THAT IS COLLECTED BY EACH TARIFF TYPE
Target revenue for 2014/15: $49,668,593