Embed Size (px)
Citation preview

JOURNAL OF MASS SPECTROMETRY, VOL. 31, 517-526 (1996)
Gas Chromatographic and Mass Spectrometric Identification of Tetrachloroalkanoic and Dicbloroalkenoic Acids in Eel Lipids
Huiliog Mu? and Clas Wesen Division of Technical Analytical Chemistry, Center for Chemistry and Chemical Engineering, Lund University, PO Box 124, S-22100 Lund, Sweden
Peter Sundin Chemical Ecology and Ecotoxicology, Department of Ecology, Lund University, Ecology Building, S-223 62 Lund, Sweden
Einar Nilsson Center for Chemistry and Chemical Engineering, Lund University, PO Box 124, S-22100 Lund, Sweden
Chlorinated fatty acid methyl esters, transesterified from the lipids of eel (AnguiZZa mgrriZZu; obtained from the receiving waters of a chlorine bleaching pulp mill), were studied by gas chromatography (GC) using electrolytic conductivity detection and mass spectrometry (MS) with electron impact and ammonia positive-ion chemical ion- ization. GC retention indices and column difference values in combination with GC/MS demonstrated the presence of isomers of methyl dichlorotetradecenoate, methyl dichlorohexadecenoate, methyl dichlorooctadecenoate and methyl tetrachlorotetradecanoate. Isomers of methyl threo, threo-tetrachlorooctadecanoate were identified by co- injection of the eel sample and synthesized reference compounds. The results were confirmed by ammonia positive- ion chemical ionization high-resolution selective-ion monitoring of the ammonium adduct molecular ions.
KEYWORDS: methyl dichlorotetradecenoate; methyl dichlorohexadecenoate; methyl dichlorooctadecenoate; methyl tetrachlorotetradecanoate; methyl tetrachlorooctadecanoate
INTRODUCTION
Organochlorine compounds such as DDT, DDE and polychlorinated biphenyls (PCBs) are extensively studied environmental pollutants. However, in fish, the known xenobiotics normally contribute less than 5% of the extractable, organically bound chlorine (EOCI) as determined by neutron activation analysis. '-' A con- siderable portion of the remaining organochlorine com- pounds in fish have been indicated to consist of chlorinated fatty acids bound in the lipid^.^,^ These findings resulted from studies of the partitioning of chlorinated species into acidic and non-acidic (neutral) compounds before hydrolysis of the lipids, after hydro- lysis and after transesterification to fatty acid methyl esters (FAMEs). Gas chromatography (GC) with halogen-selective, electrolytic conductivity detection (ELCD) confirmed that, in fish lipids having a high con- centration of EOCl (>200 pg g-' lipid), chlorinated fatty acids accounted for up to 90% of the EOCl.4*5
In most fish samples, however, EOCl concentrations range from 20 to 60 pg g-' of lipid,'Y2 and the detection of chlorinated fatty acids is difficult owing to the large excess of the normally occurring, unchlorinated fatty
A highly elevated EOCl concentration (1200 pg g-' lipid) was found in eel (Anguilla anguilla) caught in a fjord polluted by pulp mill waste waters.z This eel
t Author to whom correspondenee should be addressed.
sample has been subjected to detailed studies, in order to develop techniques suitable for the identification of chlorinated fatty acids in fish having lower concentra- tions of EOC1. A preparative GC isolation of chlorinat- ed species among the FAMEs released from the eel lipids allowed the identification of diastereomeric forms of methyl dichloro- and tetrachlorooctadecanoates by GC/ELCD and GC/mass spectrometry (MS).6 A method for the selective enrichment of chlorinated FAMEs made it possible to demonstrate also the pres- ence of methyl dichlorotetradecanoates and dichloro- hexadecanoates by GC/ELCD and GC/MS.7 Using the enrichment method, halogenated fatty acids could be detected by GC/ELCD in the lipids of several other fish species and in bivalve lipid^.^-^ However, most of the compounds giving rise to GCIELCD peaks could not be identified, largely owing to the lack of suitable refer- ence compounds to assist in the MS identification.
In this study, methyl dichlorooctadecenoates and methyl tetrachlorooctadecanoates were synthesized and used as reference compounds in the GC/ELCD and GC/MS studies of chlorinated FAMEs enriched from the eel lipids. Linear retention indices and column dif- ference values were used for the tentative identification of unknown chlorinated FAMEs in the eel sample. GC/MS with two ionization methods, electron impact (EI) ionization and positive-ion chemical ionization (PICI) with ammonia as the reagent gas, was used for identification. High-resolution selective-ion monitoring (HRSIM) was then used to further confirm the iden- tities.
CCC 0030-493X/96/0505 17- 10 0 1996 by John Wiley & Sons, Ltd.
Received 10 November 1995 Accepted 24 January 1996

518 H. MU ET AL.
EXPERIMENTAL
Solvents and reagents
All chemicals were of reagent or analytical-reagent grade. Doubly distilled water was washed with cyclo- hexane before use. All glassware was rinsed with acetone and heated at 550 "C before use.
Analytical standards
Members of a homologous series of methyl alkanoates, separated by two methylene units (methyl hexanoate to methyl triacontanoate), were used as reference com- pounds in the study of GC retention indices. Methyl alkenoates were used as reference compounds or for the synthesis of chlorinated species [methyl 10- undecenoate, methyl 1 l-dodecenoate, methyl 12- tridecenoate, methyl 9-tetradecenoate (cis and trans forms), methyl 9-hexadecenoate (cis and trans forms), methyl 9-octadecenoate, methyl 1 l-octadecenoate (cis and trans forms), methyl ll-eicosenoate, methyl 13- docosenoate and methyl 15-tetracosenoate]. Methyl 9,12-octadecadienoate (&,cis and trans,trans forms) was used for the synthesis of chlorinated species. The methyl alkenoates had a cis configuration unless specified otherwise. All FAMEs were purchased from Larodan Fine Chemicals (Malmo, Sweden).
The preparation of methyl monochloroalkanoates and methyl dichloroalkanoates from methyl 9-hexa- decenoate, methyl 9-octadecenoate, methyl 1 l-eicose- noate, methyl 13-docosenoate and methyl 15-tetracose- noate has been described earlier.7*'0*'1 Methyl dichloroalkanoates were also prepared from methyl 10- undecenoate, methyl 1 1-dodecenoate, methyl 12- tridecenoate, methyl 9-tetradecenoate (cis and trans forms), methyl 9-hexadecenoate (cis and trans forms) and methyl ll-octadecenoate (cis and trans forms). The chlorinated FAMEs were dissolved in cyclohexane prior to GC and GC/MS analyses.
A mixture of methyl dichlorooctadecenoates and methyl tetrachlorooctadecanoates was prepared by dis- solving 40 mg of methyl 9,12-octadecadienoate (either cis,& or trans,trans form) in 1 ml of chloroform and keeping the solution at low temperature by using dry- ice. Chlorine gas was introduced into the solution for 5 s and then the solvent was evaporated to dryness under nitrogen. The reaction was carried out in the dark. Incomplete chlorination resulted in a mixture of methyl dichlorooctadecenoates (positional isomers) and methyl tetrachlorooctadecanoates (diastereomers). The mixture was dissolved in cyclohexane prior to GC and GC/MS analyses.
Sample treatments
Eel (A. angerilla) (n = 39) were obtained from the Ide- fjord (between Sweden and Norway), which at the time of sampling received effluents from a pulp mill produc- ing chlorine bleached sulphite ~ u l p . ~ , ~ The fish lipids, extracted by cyclohexane and propan-2-01,4.'' were
transesterified to FAMEs using methanol containing 1.5% sulphuric acid.4
Chlorinated FAMEs were enriched according to Mu et aL7 Briefly, the FAMEs were dissolved in 2,2,4-tri- methylpentane (4 ml) and the solution was vigorously shaken with an equal volume of ethanol-water contain- ing silver nitrate (1 g) to remove polyunsaturated FAMEs. The trimethylpentane solution, which con- tained the uncomplexed FAMEs, was isolated and evaporated to dryness. The residue was dissolved in n- hexane (4 ml) and mixed with 1.5 g of urea (moistened with 0.15 g of methanol) to remove straight-chain FAMEs. The finally remaining, uncomplexed FAMEs were dissolved in cyclohexane and studied by GC and CC/MS.
Gas chromatography
A Varian Model 3700 gas chromatograph was equipped with a DB23 column (30 m x 0.53 mm id., film thickness = 0.5 pn; J & W Scientific, Folsom, CA, USA) or a DB5 column (30 m x 0.53 mm id., film thickness = 1.5 p; J & W Scientific). The oven tem- perature was programmed from 90 to 230°C for the DB223 column and from 90 to 280°C for the DB5 column at 4°C min-'. The injector temperature was 280 "C and the splitless injection technique was used. Helium (99.9996% ; AGA, Lidingo, Sweden) was used as the carrier gas at a flow rate of 10 ml min-'. An ELCD (Tracorparian Model 1000) and a flame ionization detector (FID) were connected in parallel after the column by using a glass ~plit ter .~ The FID was oper- ated at 280°C. The ELCD was used in the halogen mode with a reactor temperature of 850 "C, a base tem- perature of 280°C and n-propanol as the solvent at a flow rate of 0.50 ml min-'. Hydrogen (99.9997%; AGA) was used as the reaction gas at a flow rate of 50 ml min-'.
Retention index
Linear retention indices (I) were calculated according to van den Do01 and Kratz?
I = l00N + 100n(R, - RN)/(RN+,, - RN)
where R, is the retention time of the analyte, RN and RN+,, are the retention times of saturated, straight-chain FAMEs, being eluted before (N carbon atoms) and after (N + n carbon atoms) the analyte, respectively. The use of this equation demands a linear GC oven temperature programme. The ELCD retention times were used for chlorinated compounds and the FID retention times were used for unchlorinated compounds, because the responses in the ELCD and the FID were virtually simultaneous.
The column difference (A1 = IDBZ3 - IDB5) was defined as the difference between the retention indices obtained by separating the same compound on two columns of different p01arities.l~

GC AND MS OF CHLORINATED FATTY ACIDS IN EEL LIPIDS 519
Mass spectrometry
A Shimadzu Model 14A gas chromatograph, equipped with a fused-silica capillary column (DB5, 30 m x 0.32 mm i.d., film thickness = 0.25 pm) was used in conjunc- tion with a JEOL JMS-SX102 mass spectrometer. The oven temperature was programmed from 90 to 280 "C at 4°C min-'. PIC1 with ammonia as the reagent gas was performed at an electron energy of 200 eV and an ion source temperature of 240 "C. The samples were analysed in the scan mode from m/z = 60 to 600 at 1 scan s-'. When using EI, the electron energy was 70 eV and the ion source temperature was 240 "C. The scan range was m/z = 33 to 800 at 1 scan s-'. All mass spectra were background subtracted.
Methyl dichloroalkenoates in the eel sample, separat- ed on the DB5 column, were also traced by HRSIM at a resolution of 7000 under similar conditions to the above (except for an initial GC oven temperature of 80°C). A resolution of 7000 was used as a compromise between sensitivity and selectivity. To exclude the satu- rated, dichlorinated FAMEs in the SIM traces of methyl dichloroalkenoates, a resolution of 18 000 should have been required. Ammonium adduct molecu- lar ions were monitored at m/z 326.1654, 328.1627 and 330.1604 (for methyl dichlorotetradecenoate), m/z 354.1967, 356.1940 and 358.1919 (for methyl dichlorohexadecenoate) and m/z 382.2280, 384.2254 and 386.2234 (for methyl dichlorooctadecenoate).
HRSIM of methyl tetrachlorooctadecanoates from the eel sample was carried out following separation on a DB23 column (30 m x 0.32 mm i.d., film thick- ness = 0.25 pm), using a GC oven temperature pro- gramme from 80 to 225 "C at 4 "C min-'. Ammonium adduct molecular ions were monitored at m/z 452.1657, 454.1629 and 456.1603.
RESULTS AND DISCUSSION
Retention index and response ratio
Linear relationships between retention indices and carbon chain lengths were obtained on both columns for members of different homologous series: methyl alk- enoates, methyl monochloroalkanoates and methyl dichloroalkanoates (Fig. 1). A comparison of the FAME retention times on the DB5 column showed that one chlorine atom had an effect corresponding to two methylene units, presumably due to the increments of mass. Similar findings were reported by Haken and Korhonen" and Sundin et u E . , ' ~ who used SE-30 and SE-54 columns, respectively. Owing to the interaction between the chlorine atoms and the stationary phase, the chlorine atoms had a more pronounced effect on the retention on the polar DB23 column than on the DB5 column (Fig. 1); one chlorine atom corresponded to the addition of four methylene units. The DB23 column also provided a better separation of the diastereomers of methyl dichloroalkanoates and of methyl tetra- chlorooctadecanoate, the latter shown in Fig. 2(B). Methyl tetrachlorooctadecanoate was eluted outside the
10 14 18 22
Carbon chain length
5
Figure 1. Linear relationship between carbon chain length and retention index of reference compounds on DB5 and DB23 columns. (0) Methyl dichloroalkanoates synthesized from methyl w l -alkenoates; (+) methyl threo-9.10-dichloroalkanoates; (0) methyl threo-dichloroalkanoates synthesized from methyl c i s - d - alkenoates; (0) methyl monochloroalkanoates synthesized from methyl cis-w9-alkenoates; (m) methyl wl -alkenoates; (A) methyl cis-9-alkenoates; (0) methyl cis-d-alkenoates.
linear temperature gradient and its linear retention index could not be calculated.
For chlorinated FAMEs, the column difference increased with increasing number of chlorine atoms (Table 1). Assuming that the index increment is con- stant, the ratio of the column difference between tetra- chlorinated and dichlorinated FAMEs would be similar to the average ratio of the column difference between dichlorinated and monochlorinated FAMEs (1.69). The column difference of tetrachlorinated FAMEs was thus estimated to be about 660.
The response ratio between ELCD and FID increased with increasing number of chlorine atoms (Table 2). The response ratios of chlorinated com- pounds with an equal number of chlorine atoms, however, decreased with an increased carbon chain
Table 1. The column difference (AI) for some FAMEs
Chain length Alkenoic Monochloroalkanoic Dichloroalkanoic 16 42 21 6 370
20 42 234 399 22 45 241 409 24 48 245
Average 43 232 391
18 40 226 387

520
% x e! n Y
C
u1
W
8 g
Y
C
rn e! 0
W
A
H. MU ET AL.
I n B
--- I I I I I I I I I I I I I I I I I I I l l [ I 1 I I l l I I I I -
I
0 10 20 30 40 50
5 3 4 6
1 2
fR (min)
Figure 2. ELCD chromatograms of chlorinated FAMEs enriched from the eel sample. (A) Separation of chlorinated FAMEs on a DB5 column. Peaks 1,3,5 and 2,4,6 represent two homologous series of methyl dichloroalkanoates previously identified (diastereomeric eryfhro and rhreo forms of dichlorotetradecanoate, dichlorohexadecanoate and dichlorooctadecanoate, respe~tively).~-' The following chlorinated FAM Es are identified in this work: a and b, methyl dichlorotetradecenoate isomers; c and d, methyl dichlorohexadecenoate isomers; e and f, methyl tetrachlorotetradecanoate isomers; g and h, methyl dichlorooctadecenoate isomers. Peaks i and j represent previously identified methyl tetrachlorooctadecanoate isomers.' (B) Part of a corresponding ELCD chromatogram obtained on a DB23 column. Peaks k and I represent previously identified methyl erythro,eryrhro-tetrachlorooctadecanoates.' (C) Co-injection of eel sample and synthesized methyl threo,rhreo-9.10,12,13-tetrachlorooctadecanoate isomers on the DB23 column (peaks m and n).
length owing to the increased FID response. Thus, the response ratio can suggest the degree of chlorination of a compound, and the combination of the response ratio and retention index can be used to aid the identifica- tion.
Identification of dichloroalkenoic acids in the eel sample
The previously identified diastereomers of methyl dichlorotetradecanoate, dichlorohexadecanoate and dichloroo~tadecanoate~~~ are indicated by the numbers 1 to 6 in Fig. 2(A). On the DB5 column, unknown chlo- rinated compounds [Fig. 2(A), peaks a, b, c, d, g and h] eluted just ahead of each pair of methyl dichloro- alkanoates. The unknown compounds had ELCD/FID response ratios similar to those of methyl dichloro- alkanoates and were suspected to be methyl dichloro- alkenoates, because on a DB5 column such compounds elute closely ahead of the corresponding methyl dichloroalkanoates.'
The major products of the short ( 5 s) chlorination of methyl trans,trans-9,12-octadecadienoate had GC reten- tion times coinciding with those of two of the unknown compounds [Fig. 2(A), peaks g and h]. GC/PICIMS showed that the molecular masses of the three major chlorination products were 364 ([M + NH,]+ = 382)
Table 2. Response ratios between ELCD and FID for FAMEs of different chain length and degree of chlorination
Chain Monochloro- Dichloro- Dichloro- Tetrachloro- length alkanoic alkanoic alkenoic alkanoic
14 52 16 23 45 18 20 40 41 80 20 18 33
followed by a typical dichlorinated isotopic cluster [Fig. 3(a)]. Monochlorinated fragment ions of m/z 346 ([M + NH, - HCI]') and dechlorinated fragment ions of
m/z 293 ([MH - 2HCl]+), 310 ([M + NH, - 2HC1]+)
1ooy 382
501
PIC1
%
loo/ PIC1 310
293 iI3"
Figure 3. (a) Ammonia PIC1 and (c) El mass spectra of the refer- ence compound methyl dichlorooctadecenoate; (b) ammonia PIC1 and (d) El mass spectra of compounds from the eel sample. The spectrum in (b) was obtained at 37.5 min [Fig. 4(a)].

521 GC AND MS OF CHLORINATED FATTY ACIDS IN EEL LIPIDS
and 312 ([M + NH, - Cl,]') were observed. Dechlori- nated fragment ions of m/z 310 dominated for the isomer eluting first, whereas dechlorinated fragment ions of m/z 312 dominated for the two later isomers (data not shown). This indicated that different fragmen- tations occurred; one isomer predominantly lost two units of HCl and the two other predominantly one unit of C1, . Additionally, the relationship between the abun- dances of ammonium adduct molecular ions and the corresponding dechlorinated fragment ions varied for the different isomers.
The same PICI ammonium adduct molecular ions and fragment ions were obtained for compounds found in the eel sample [Fig. 3(b)], and the PICI fragmentog- rams showed five isomers of methyl dichloro- octadecenoate [Fig. 4(a)]. Isomers 1 and 5 were of low abundance. Isomer 2 lost one unit of C12 and two units of HC1, whereas the others lost one unit of Cl,. GC/EIMS showed monochlorinated fragment ions of m/z 297 ([M - CH,O - HCl]+) and dechlorinated fragment ions of m/z 292 ([M - 2HCll') and 261 ([M - CH,O - 2HCll') for both the reference compounds
and methyl dichlorooctadecenoates found in the eel sample [Fig. 3(c) and (d)].
In order to further support the identification, HRSIM PICIMS was carried out for the ammonium adduct molecular ions of methyl dichlorooctadecenoate. Simi- larly to the PICIMS fragmentograms [Fig. 4(a)], five isomers were observed [Fig. 4(b)]. The ratios between the abundances of the ammonium adduct ions, (M + NH, + 2)/(M + NH,) (M + NH, + 4)/(M + NH,), of the isomers were in the ranges 0.65-0.69
and 0.1 1-0.15, respectively. These ratios indicate that the isomers contained two chlorine atoms, because the corresponding theoretical values of the methyl dichloro- octadecenoate ammonium adducts are 0.67 and 0.12, respectively. In GC/ELCD only two peaks were observed (Fig. 2, peaks g and h), presumably owing to a lower resolution in the megabore column (0.53 mm i.d.) used. The compounds were identified as methyl dichlorooctadecenoate isomers, because their MS frag- mentation patterns were similar to those of the synthe- sized methyl dichlorooctadecenoates in both PICIMS and EIMS, they had correct isotopic abundances and their GC/ELCD retention times coincided with those of two of the synthesized reference compounds.
Two linear relationships were obtained on plotting the retention indices of the methyl dichloroocta- decenoates and of peaks a, b, c and d shown in Fig. 2(A) us. the suggested carbon chain lengths (Fig. 5). Both relationships were almost parallel with those acquired for the homologous series of methyl alkenoates and methyl dichloroalkanoates (reference compounds). It is therefore reasonable to assume that the unknown com- pounds belonged to two homologous series and com- prised isomeric forms of methyl dichlorotetradecenoate and methyl dichlorohexadecenoate, in addition to the methyl dichlorooctadecenoate isomers.
The two compounds from the eel sample [Fig. 2(A), peaks a and b], tentatively identified as methyl dichlorotetradecenoates by their retention indices (Fig. 5), were also found in the MS total ion chromatogram by a comparison with the corresponding FID chro- matogram. Their PICIMS ammonium adduct molecu-
and
mlz Intensity x 10.3
TIC
386
384
382
31 2
5672
32
106
179
181
310 I I 228
295 27
293 I /l I 188
386.2234
384.2254
382.2280
(b) Retention time (min)
Figure 4. (a) GC/PICIMS fragmentograms of methyl dichloro- octadecenoates in the eel sample. Five isomers are indicated by the numbers 1 to 5; m/z 382, 384 and 386 represent ammonium adduct molecular ions and m/z 31 2, 31 0, 295 and 293 represent dechlorinated fragment ions. (b) GC/PICIMS HRSIM traces rep- resenting the chlorine isotope cluster of the ammonium adduct molecular ions of methyl dichlorooctadecenoate in the eel sample. Intensity = 461 592. The dominant peaks in ion chromatograms of m/z 384 and 386 originated in diastereomers of methyl dichloro- octadecanoate.'
lar ions were found to start at m/z 326, and the ions showed a dichlorinated isotopic cluster [Fig. qa)]. A molecular mass of 308 was thus indicated, which is two mass units less than that of methyl dichlorotetra- de~anoate .~ PICIMS also showed dechlorinated frag- ment ions of m/z 237 ([MH - 2HCl]'), 239 ([MH - Cl,]+), 254 ([M + NH, - 2HCll') and 256 ([M + NH, - Cl,]'). According to the PICIMS fragmen-
tograms of the ammonium adduct molecular ions and the dechlorinated ions [Fig. 7(a)], the presence of at least four methyl dichlorotetradecenoate isomers was indi- cated in the eel sample. A similar result was obtained by HRSIM PICIMS [(Fig. 7(b)]. The ratios between the abundances of the ammonium adduct ions, (M + NH, + 2)/(M + NH,) and (M + NH, + 4)/(M + NH,), of
the isomers were in the ranges 0.64-0.68 and 0.09-0.12,

522 H. MU ET AL.
256
326
Y,
2300 0
1500- 4 R I 1
, - ..I 18 20 22
Carbon chain length
Figure 5. Linear relationship between carbon chain length and retention index of some unknown compounds from the eel sample and reference compounds, using the DB5 column: (A) and (+) tentatively identified as methyl dichloroalkenoates; (a) methyl cis-w9-alkenoates; (0) methyl threo-dichloroalkanoates synthe- sized from methyl cis-w9-alkenoates.
236 I I I I I , m5 !
respectively. The theoretical values are 0.66 and 0.1 1, respectively.
The EI mass spectrum [Fig. 6(b)] showed dichlorinat- ed fragment ions of m/z 277 ([M - CH,O]+), dechlori- nated fragment ions of m/z 236 ([M - 2HCll') and 205 ([M - CH,O - 2HC1]+) and ions of m/z 67 and 81. The latter ions were found also in the EI mass spectra of methyl dichlorooctadecenoate [Fig. 3(c) and (d)]. EIMS fragmentograms showed four isomers of methyl dichlorotetradecenoate [Fig. 7(c)], which supported the PICIMS identification. As in the case of the methyl dichlorooctadecenoates, only two isomers of methyl dichlorotetradecenoates were found with GC/ELCD. From the data given above, the compounds [Fig. 2(A), peaks a and b] were identified as isomers of methyl dichlorotetradecenoate.
Two compounds in the eel sample [Fig. 2(A), peaks c and d] were tentatively identified as methyl dichloro-
Figure 6. (a) Ammonia PIC1 and (b) El mass spectra of methyl dichlorotetradecenoate found in the eel sample. The spectra were obtained at 28.5 and 29.75 min [Fig. 7(a) and (c)], respectively.
hexadecenoates by their GC retention indices (Fig. 5). The two compounds showed PICIMS ammonium adduct molecular ions of m/z 354 (Fig. 8). A molecular mass of 336 was thus indicated. Similarly to the results for the methyl dichlorooctadecenoates, dechlorinated fragment ions were also observed: m/z 265
- 2HC1]+) and 284 ([M + NH4 - ClJ'). PICIMS ([MH - 2HC1]+), 267 ([MH - Clz]'), 282 ([M + NH4
m/z Intensity x 1 o -3 m/z Intensity x 1 o -3
76204
51 8
383
1048
1 TIC n , 7001
87
128
160
82
mlz
yi ll I 330.1604
328.1 627 ._ L. Ill c 0 C - -
326.1654 21
._ L. Ill c 0 C - -
32 33 34
1048
29 io (C) Retention time (min)
28 29 (4 Retention time (min) (b) Retention time (min)
Figure 7. (a) GCjPlClMS fragmentograms of methyl dichlorotetradecenoates in the eel sample. Four isomers are indicated by the numbers 1 to 4; m/z 326 and 328 represent ammonium adduct molecular ions and rn/z 239 and 256 represent dechlorinated fragment ions. (b) GC/PICI HRSIM traces representing the chlorine isotope cluster of the ammonium adduct molecular ions of methyl dichlorotetradecenoates in the eel sample. Intensity = 302 828. The dominant peaks in ion chromatograms of m/z 328 and 330 originated in diastereomers of methyl dichlorotetradecanoate. (c) GC/EI MS fragmentograms of methyl dichlorotetradecenoates in the eel sample, four isomers are indicated by the numbers 1 to 4; rn/z 236 and 205 represent dechlorinated fragment ions.

GC AND MS OF CHLORINATED FATTY ACIDS IN EEL LIPIDS 523
' O 0 8
284
342 354 ~
Figure 8. Ammonia PIC1 mass spectrum of methyl dichloro- hexadecenoate found in the eel sample. The spectrum was obtained at 33.5 min [Fig. 9(a)].
fragmentograms of the ions characteristic of methyl dichlorohexadecenoate showed that at least six isomers existed in the eel sample [Fig. 9(a)]. The abundant frag- ment ions of m/z 342 (Fig. 8), which lacked a chlorine
rn/z Intensity x 10 -3
TIC
356
354
342
8259
18
33
49
42
46
358.191 9
356.1 940
354.1967
(b) Retention time (rnin)
Figure 9. (a) GC/PICI MS fragrnentograms of methyl dichloro- hexadecenoates found in the eel sample. Six isomers are indicated by the numbers 1 to 6; m/z 354 and 356 represent ammonium adduct molecular ions, m/z 265 and 282 represent dechlorinated fragment ions and m/z 342 represent fragment ions from other compounds. (b) GCIPICIMS HRSIM traces representing the chlo- rine isotope cluster of the ammonium adduct molecular ions of methyl dichlorohexadecenoates. Intensity = 77 544. The dominant peaks in ion chrornatograms of m/z 356 and 358 originated in dia- stereomers of methyl dichlorotetradecanoate.
isotopic pattern, arose from another compound eluting closely to one of the methyl dichlorohexadecenoates [Fig. 9(a)]. HRSIM further supported the full-scan results and indicated the presence of several isomers, two of which dominated [Fig. 9(b)]. These probably were the main contributors to the two peaks that were observed in the ELCD gas chromatogram. The ratios between the abundances of the ammonium adduct ions, (M + NH, + 2)/(M + NH,) and (M + NH, + 4)/(M + NH,), of the isomers were in the ranges 0.64-0.74
and 0.11--0.19, respectively. The theoretical values are 0.66 and 0.12, respectively. The last isomer appeared to have the highest (M + NH, + 2) and (M + NH, + 4) abundances, probably owing to an interaction from the saturated methyl dichlorohexadecanoate being eluted at 38.5 min [Fig. 9(b)]. By combining the GC/ELCD and GC/MS results, the compounds [Fig. 2(A), peaks c and d] were identified as isomers of methyl dichloro- hexadecenoate.
Identification of tetrachloroalkanoic acids in the eel sample
In a previous study,6 two diastereomers of methyl erythropythro-tetrachlorooctadecanoate were indicated by GC and GC/MS using EI-SIM. As a result of the selective enrichment of chlorinated FAMEs, four halo- genated compounds were detected by GC/ELCD (DB23 column) in the retention time window expected for methyl tetrachlorooctadecanoates [Fig. 2(B), peaks k, 1, m and n]. Co-injection of synthesized compounds and the eel sample showed that two of these (peaks k and 1) had the same retention times as the diastereomers of methyl erythro,erythro-tetrachlorooctadecanoate. The retention times of the other two compounds from the eel sample (peaks m and n) were found to coincide with those of the diastereomers of methyl threo, threo-tetrachlorooctadecanoate [Fig. 2(C)]. On the DB5 column (0.53 mm id.), the erythro,erythro-diaste- reomers had the same retention times as the threo, threo-diastereomers [Fig. 2(A), peaks i and j].
The synthesized methyl 9,10,12,13-tetrachlorooctade- canoates (threo,threo and erythro,erythro forms) showed PICIMS ammonium adduct molecular ions of mjz 452 with a typical tetrachlorinated isotopic cluster [Fig. 10(a)]. The PIC1 mass spectrum also showed dich- lorinated fragment ions of m/z 382 ([M + NH, - ClJ') and dechlorinated fragment ions of m/z 310 ([M + NH, - C1, - 2HCl]+), 312 ([M + NH, - 2ClJ') and 293 ([MH - C1, - 2HC1]+). EIMS showed typical fragment ions of mjz 326, 290 and 74 [Fig. 10(b)].6 Owing to their low concentration in the eel sample, the presence of these compounds could not be verified by using PICIMS or EIMS in the full-scan mode. However, on the DB23 column, HRSIM PICIMS of ammonium adduct molecular ions charac- teristic of methyl tetrachlorooctadecanoate showed the presence of five isomers in the retention time window for threo, threo- and erythro,erythro-diastereomers of methyl tetrachlorooctadecanoate (Fig. 11). By combin- ing the HRSIM results and GC/ELCD results, the two compounds [Fig. 2(B), peaks m and n] were identified
524 H. MU ET AL.
Yo
loo 1 382
H A i 300 400
(a) O J ' 200
'-i 74
326
100 200 300 (b) 0'
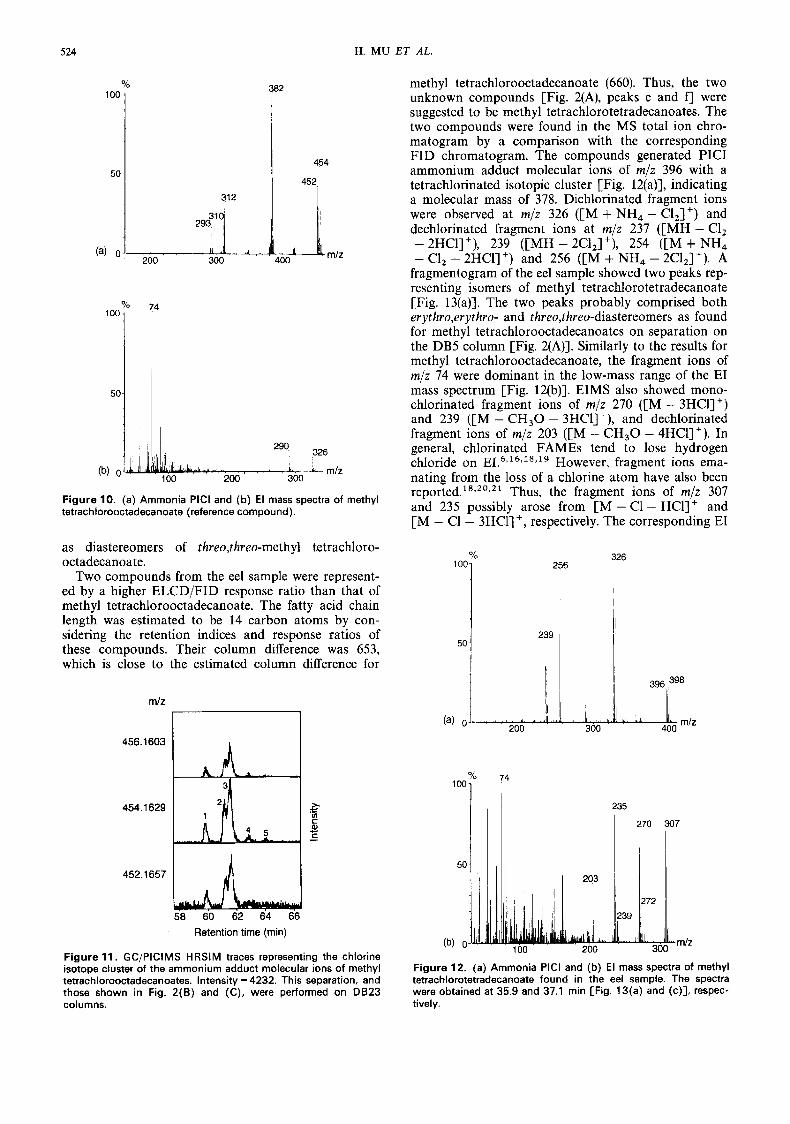
Figure 10. (a) Ammonia PlCl and (b) E l mass spectra of methyl tetrachlorooctadecanoate (reference compound).
as diastereomers of threo,threo-methyl tetrachloro- octadecanoate.
Two compounds from the eel sample were represent- ed by a higher ELCD/FID response ratio than that of methyl tetrachlorooctadecanoate. The fatty acid chain length was estimated to be 14 carbon atoms by con- sidering the retention indices and response ratios of these compounds. Their column difference was 653, which is close to the estimated column difference for
m/Z
methyl tetrachlorooctadecanoate (660). Thus, the two unknown compounds [Fig. 2(A), peaks e and fl were suggested to be methyl tetrachlorotetradecanoates. The two compounds were found in the MS total ion chro- matogram by a comparison with the corresponding FID chromatogram. The compounds generated PIC1 ammonium adduct molecular ions of m/z 396 with a tetrachlorinated isotopic cluster [Fig. 12(a)], indicating a molecular mass of 378. Dichlorinated fragment ions were observed at m/z 326 ([M + NH, - ClJ') and dechlorinated fragment ions at m/z 237 ([MH - C1,
- C1, - 2HCll') and 256 ([M + NH, - 2C12]+). A fragmentogram of the eel sample showed two peaks rep- resenting isomers of methyl tetrachlorotetradecanoate [Fig. 13(a)]. The two peaks probably comprised both erythro,erythro- and threo,threo-diastereomers as found for methyl tetrachlorooctadecanoates on separation on the DB5 column [Fig. 2(A)]. Similarly to the results for methyl tetrachlorooctadecanoate, the fragment ions of m/z 74 were dominant in the low-mass range of the EI mass spectrum [Fig. 12(b)]. EIMS also showed mono- chlorinated fragment ions of m/z 270 ([M - 3HCll') and 239 ([M - C H 3 0 - 3HCl]+), and dechlorinated fragment ions of m/z 203 ([M - CH30 - 4HCll'). In general, chlorinated FAMEs tend to lose hydrogen chloride on EI.6*'6,'s,1 However, fragment ions ema- nating from the loss of a chlorine atom have also been reported.'8*20~21 Thus, the fragment ions of m/z 307 and 235 possibly arose from [M - C1- HCl]' and [M - C1 - 3HCl]+, respectively. The corresponding EI
- 2HC1]+), 239 ([MH - 2ClJ+), 254 ([M + NH4
326 256
456.1603 I I % 74
100
235
58 60 62 64 66 Retention time (min)
Figure 11. GC/PICIMS HRSIM traces representing the chlorine isotope cluster of the ammonium adduct molecular ions of methyl tetrachlorooctadecanoates. Intensity = 4232. This separation, and those shown in Fig. 2(B) and (C), were performed on DB23 columns.
Figure 12. (a) Ammonia PlCl and (b) El mass spectra of methyl tetrachlorotetradecanoate found in the eel sample. The spectra were obtained at 35.9 and 37.1 rnin [Fig. 13(a) and (c)], respec- tively.

GC AND MS OF CHLORINATED FATTY ACIDS IN EEL LIPIDS 525
m/z
TIC
400
398
396
326
(a)
TIC
307
270
235
203
74
(4
intensity x 10 -3 pulp mill, leading to an unusually high concentration of chlorinated fatty acids in the lipid^.^,^,^,^ Both 9-
6145 octadecenoic acid and 9J2-octadecadienoic acid are present in wood extracts, and 9,1O-dichlorooctadecanoic
16 acid can be formed by chlorination of 9-octadecenoic acid in the pulp bleaching process.22 The possibility of
30 forming dichlorooctadecenoic acid and tetrachloro- octadecanoic acid by chlorination of 9J2-octadeca- dienoic acid in pulp bleaching processes has been 23 shown by McKague and Reeve.23 9,10-Dichloro-12- octadecenoic acid and 12,13-dichloro-9-octadecenoic acid have been found as a result of another chlorination process, the bleaching of flour.24 The two isomers of dichlorooctadecenoic acid in the eel lipids could thus originate from incomplete chlorination of octadecadie- noic acid in the pulp bleaching process.
It has been reported that 8-oxidation in rats can 174 result in chain shortening of halogenated fatty
a ~ i d s . ~ ~ . ~ ~ Dichlorinated hexadecanoic and tetra- 160 decanoic acids in the eel lipids have also been suggested
to be /?-oxidation product^.^,^ Accordingly, tetrachloro- 193 tetradecanoic, dichlorotetradecenoic and dichloro-
hexadecenoic acids found in the eel lipids may be p-oxidation products of tetrachlorooctadecanoic and dichlorooctadecenoic acids, respectively. As a conse- quence of 8-oxidation, the chlorine atoms of the metab- olites will be positioned closer to the functional end of
120
58302
96
314
36 37 38 39 the molecules. Retention time (min)
Figure 13. (a) GC/PICIMS fragmentograms of methyl tetra- chlorotetradecanoates found in the eel sample. Isomers are indi- cated by the numbers 1 and 2; m/z 396, 398 and 400 represent ammonium adduct molecular ions and m/z 326 represent dichlo- rinated fragment ions. (b) GC/EIMS fragmentograrns of methyl tetrachlorotetradecanoates found in the eel sample; m/z 307 rep- resent dichlorinated fragment ions, m/z 270 represent mono- chlorinated fragment ions and m/z 235 and 203 represent dechlorinated fragment ions.
fragmentograms [Fig. 13(b)] supported the PICIMS results. By combining the results of the GC/ELCD and GCiMS studies, the compounds [Fig. 2(A), peaks e and f] were identified as isomers of methyl tetra- chlorotetradecanoate.
Origin of the identified chlorinated fatty acids
It has previously been settled that the fish of this study were exposed to the effluents of a chlorine bleaching
CONCLUSIONS
Diastereomers of tetrachloroalkanoic acids and isomers of dichloroalkenoic acids are additional constituents identified among the chlorinated fatty acids in eel obtained from the receiving waters of a chlorine blea- ching pulp mill. Their presence was indicated by GC/ELCD and GC/MS.
Acknowledgements
We thank Professor Jan Skramstad at the Department of Organic Chemistry, Oslo University, for providing some of the chlorinated FAMEs, and Dr Inga-Britt Peetre at the Center for Chemistry and Chemical Engineering, Lund University, for valuable comments on the study of retention indices. Financial support from the National Swedish Environmental Protection Agency and the Swedish Council for Forestry and Agricultural Research i s gratefully acknowledged.
REFERENCES
G. Lunde, J. Gether and E. Steinnes,AMBlO 5, 180 (1976). H. HBkansson. P. Sundin, T. Anderson, B. Brunstrom, L. Dencker. M. Engwall, G. Ewald, M. Gilek. G. Holm, S. Honka- salo, J. Idestam-Almquist, P. Jonsson, N. Kautsky, G. Lund- berg, A. Lund-Kvernheim, K. Martinsen, L. Norrgren, M. Pesonen, M. Rundgren, M. StAlberg, M. Tarkpea and C. Wesen, Pharmacol. Toxicol. 69,459 (1 991 ). W. H. Newsome. P. Andrews and H. 8. S. Conacher, J.AOAC lnt. 76, 703 (1993). C. Wesen, H. Mu, A. Lund Kvernheim and P. Larsson, J. Chro- matogr. 625, 257 (1 992).
5. C. Wesen, K. Martinsen, G. Carlberg and H. Mu, in Environ- mental Fate and Effects of Bleached Pulp Mill Effluents, edited by A. Sodergren, p. 207. Report 4031, Swedish Environmental Protection Agency, Stockholm (1 992).
6. C. Wesen, H. Mu, P. Sundin, P. Froyen, J. Skramstad and G. Odham, J. Mass Spectrom. 30,959 (1 995).
7. H. Mu, C. Wesen, T. Novak, P. Sundin. J. Skramstad and G. Odham, J. Chromatogr. in press (1 996).
8. C. Wesen. H. Mu, P. Sundin. 0. Ringstad and G. Odham, in Naturally-Produced Organohalogens, edited by A. Grimvall and Ed W. B. de Leer, p. 307. Kluwer, Dordrecht (1995).

526 H. MU ET AL.
9. 10.
11.
12.
13.
14. 15.
16.
17. 18.
C. Wesin, PhD Eng. Thesis, Lund University (1 995). P. Fr0yen and J. Skrarnstad, Synfh. Commun. 24, 1871 (1 994). W. I. Lyness and F. W. Quackenbush, J. Am. Oil Chem. SOC. 32, 520 (1 955). K. Martinsen, A. Kringstad and G. E. Carlberg, Water Sci. Technol. 20(2), 13 (1 988). H. van den Do01 and P. D. Kratz, J. Chromafogr. 11, 463 (1963). C. T. Peng, J. Chromafogr. 678,189 (1 994). J. K. Haken and I. 0. 0. Korhonen, J. Chromatogr. 298, 89 (1984). P. Sundin, P. Larsson. C. Wesen and G. Odharn, Biol. Mass Spectrom. 21,633 (1 992). D. L. Heikes, J. Agric. Food Chem. 41,2034 (1 9933. F. D. Gunstone and B. S. Perera, Chem. Phys. Lipids 11, 43 (1 973).
19.
20.
21.
22.
23.
24. 25.
26.
M. Rernberger, P-A. Hynning and A. Neilson. J. Chromatogr. 508, 159 (1 990). H. Budzikiewicz, C. Djerassi and D. H. Williams, Mass Spec- trometry of Organic Compounds, Holden- Day, San Francisco (1967). F. W. McLafferty, Interpretation of Mass Spectra, 3rd edn. Benjamin, MA (1 980). J. M. Leach and A. N. Thakore, Prog. Water Technol. 9, 787 (1977). A. B. McKague and D. W. Reeve, Chem. Phys. Lipids 58, 21 3 (1 991 ). D. L. Heikes, J. Agric. Food Chem. 40,489 (1 992). B. A. Jones, I . J. Tinsley, G. Wilson and R. R. Lowry, Lipids 18, 327 (1983). J. F. Lawrence, R. K. Chadha, F. Iverson, P. McGuire and H. 6. S. Conacher, Lipids 19, 704 (1984).


![Gas chromatographic and mass spectrometric analysis of 36 ...publications.lib.chalmers.se/records/fulltext/local_72545.pdf · urban air [5] and in fog polluted by wood smoke [6]](https://img.dokumen.tips/doc/110x75/60472454b4336f706e5bd0e6/gas-chromatographic-and-mass-spectrometric-analysis-of-36-urban-air-5-and.jpg)


![Direct measurement of apolipoprotein B synthesis in human very … · enous [ "N]glycine labeling and gas-liquid chromatographic- mass spectrometric analysis, synthesis of apolipoprotein](https://img.dokumen.tips/doc/110x75/5d2c6bd588c99303268d46f5/direct-measurement-of-apolipoprotein-b-synthesis-in-human-very-enous-nglycine.jpg)