Embed Size (px)
Citation preview


THE GARY/CHICAGO INTERNATIONAL AIRPORT
STRATEGIC BUSINESS PLAN
April 2010
Prepared By:
Landrum & Brown
FIRM PROJECT ROLE
Landrum & Brown Project Management and Oversight, Strategic Vision, Air Cargo, Airport Operations and Land Utilization
Colliers Land Utilization and Commercial Development
Indiana Strategic Resource Group Business, Community, and Political Issues
RLM Associates Commercial Passenger and General Aviation Uses
Unison Consulting Finance and Governance Issues

THE GARY/CHICAGO INTERNATIONAL AIRPORT STRATEGIC BUSINESS PLAN FINAL
Landrum & Brown i April 2010
ACKNOWLEDGMENTS
The Landrum & Brown Team would like to formally thank the following stakeholders for their guidance and participation in the conduct and development of this report:
The Honorable Rudy Clay, Mayor Gary/Chicago International Airport Board and Management Northwest Indiana Regional Development Authority
In addition, we would like to express our appreciation to all those individuals, organizations, and businesses listed in Appendix K whose candor and willingness to participate in the process was so valuable.

THE GARY/CHICAGO INTERNATIONAL AIRPORT STRATEGIC BUSINESS PLAN FINAL
Landrum & Brown TOC - i April 2010
TABLE OF CONTENTS CHAPTER PAGE
ACKNOWLEDGMENTS ................................................................................... i
ACRONYMS .................................................................................. Acronyms-i EXECUTIVE SUMMARY ........................................................................Intro-1 I. RECOMMENDATIONS ......................................................................... I-1 II. NEXT STEPS...................................................................................... II-1 III. BACKGROUND AND FINDINGS ........................................................ III-1
Section III-1 - Aviation Business Development
Section III-1A Analysis of Airline Industry Trends of Fundamental Importance to Gary ........................ III-2 Section III-1B Feasibility of Scheduled Passenger Services at Gary .. III-7 Section III-1C Feasibility of Low Frequency Scheduled and
Charter Services .............................................. III-16 Section III-1D Feasibility for Corporate/General Aviation Service .... III-21 Section III-1E Feasibility of Air Cargo and Logistics ...................... III-32 Section III-1F Maintenance and Other Supporting Services ........... III-42 Section III-1G Alternative Aviation Uses ..................................... III-46
Section III-2 - Land Utilization ................................................. III-49
Section III-2A Airport Property and Operating Requirements ......... III-49 Section III-2B Collateral Land Development Opportunities ............. III-66
Section III-3 - Finance Considerations ...................................... III-79 Section III-4 - Governance ....................................................... III-92 Section III-5 - Business and Community ................................... III-98
Section III-5A Gary, Indiana History .......................................... III-98 Section III-5B Historical Sequence of Events ............................... III-99 Section III-5C Local and County Taxes ..................................... III-105 Section III-5D Interview Findings ............................................ III-107

THE GARY/CHICAGO INTERNATIONAL AIRPORT STRATEGIC BUSINESS PLAN FINAL
Landrum & Brown TOC - ii April 2010
TABLE OF CONTENTS, (CONTINUED) APPENDIX PAGE
Appendix A: Strengths – Weakness - Opportunities - Threats ........................ A-1 Appendix B: Airline Industry Trends of Peripheral Importance To Gary ............ B-1 Appendix C: Statistical Analysis of Northwest Indiana Scheduled Traffic .......... C-1 Appendix D: Passengers on Domestic Low Frequency Scheduled ....................D-1 and Charter Services Appendix E: Passengers on International Low Cost Carrier and ...................... E-1 Charter Travel from Chicago Appendix F: Area Business Profile, Within Theoretical F-1 10-Minute Drive of Site Appendix G: Demographic Profile Within Theoretical ....................................G-1 10 and 20-Minute Drive Time of Site Appendix H: Labor Market Characteristics, .................................................H-1 Gary Metropolitan Division Appendix I: Employment Profile, Gary Metropolitan Division .......................... I-I Appendix J: Retail Buying Profile Within Theoretical .....................................J-1 10 and 20-Minute Drive Time of Site Appendix K: Interviews and Contacts ......................................................... K-1
LIST OF EXHIBITS EXHIBIT PAGE
III-1 Traffic Potential for the Gary Airport ................................................ III-8 III-2 Passenger Traffic at Stewart Airport and Palmdale............................III-10 III-3 Passenger Traffic at Gary..............................................................III-10 III-4 On-Time Performance at 31 Largest Airports ...................................III-11 III-5 The South Shore Line...................................................................III-14 III-6 Estimated Low Frequency Scheduled and Air Charter ........................III-17 Activity at Midway and O’Hare – Enplaned and Deplaned Passengers III-7 Allegiant Airlines Passengers, Rockford and South Bend ....................III-18 III-8 General and Corporate Aviation at Gary..........................................III-22 III-9 General Aviation at Chicago Regional Airports .................................III-23 III-10 Based General Aviation Aircraft at Chicago Regional Airports .............III-24 III-11 Corporate Offices and Airports in Greater Chicago ............................III-25 III-12 Number of Corporate Aircraft by Airport Nearest to Place of...............III-27 Registration III-13 Crosswind Runway Analysis ..........................................................III-56 III-14 Railroad Relocation Options...........................................................III-60 III-15 Potential Areas for Development....................................................III-64

THE GARY/CHICAGO INTERNATIONAL AIRPORT STRATEGIC BUSINESS PLAN FINAL
Landrum & Brown TOC - iii April 2010
LIST OF EXHIBITS, (continued) EXHIBIT PAGE
III-16 Regional Target Prioritization.........................................................III-73 III-17 Organizational Relationships .........................................................III-80 III-18 Financial Relationships – 2008 Actual .............................................III-81 III-19 Summary of Qualification Requirements for Airport ..........................III-96 Authority Membership in Selected States III-20 Key Regional Connections........................................................... III-108
LIST OF FIGURES FIGURE PAGE
III-1 Gary-Chicago Airport 10 – (red), 20- (green) and 45-minute .......... III-66 (blue) drive time areas) III-2 Gary-Chicago Airport 10 – (red) and 20-minute (green)................. III-67 drive time areas) III-3 GYY and immediate (10-minute) draw area (red) .......................... III-67
LIST OF TABLES TABLE PAGE III-1 Gary/Chicago International Airport – Income Statement ...................III-84 III-2 2009 Rates and Charges...............................................................III-87 III-3 Capital Improvement Program – Gary/Chicago ................................III-89 International Airport – FY 2010-2014 III-4 Gary International Airport – Survey Results of General .....................III-90 Aviation and Non-Hub Airports, Comparison of Director Salary, Staffing and Annual Operating Expense

THE GARY/CHICAGO INTERNATIONAL AIRPORT STRATEGIC BUSINESS PLAN FINAL
Landrum & Brown Acronyms-i April 2010
ACRONYMS
AIP Airport Improvement Program
ALP Airport Layout Plan
AOA Airport Operations Area
ARFF Aircraft Rescue and Firefighting
BLS Bureau of Labor Statistics
CGRAA Chicago/Gary Regional Airport Authority (Board)
CN Canadian National Railroad
COIT County Option Income Tax
DUAB Distressed Units Appeal Board
EIS Environmental Impact Statement
ERA Economic Revitalization Area
EZ Enterprise Zone
FBO Fixed Base Operator
FTZ Foreign Trade Zone
GA General Aviation
GCIA or GYY Gary/Chicago International Airport
GCIAA Gary/Chicago International Airport Authority (Board)
GSE Ground Service Equipment
IEDC Indiana Economic Development Corporation
ILS Instrument Landing System
LOI Letter of Intent
LOIT Local Option Income Tax
MDW Midway International Airport
MRO Maintenance, Repair, and Overhaul
ORD Chicago O’Hare International Airport
PFC’s Passenger Facility Charges
RDA Northwest Indiana Regional Development Authority
VLJ Very Light Jet

THE GARY/CHICAGO INTERNATIONAL AIRPORT STRATEGIC BUSINESS PLAN FINAL
Landrum & Brown Intro-1 April 2010
GARY/CHICAGO INTERNATIONAL AIRPORT
STRATEGIC BUSINESS PLAN
EXECUTIVE SUMMARY An operational airport, with infrastructure and facilities in place, represents enormous economic potential for a region provided that the potential can be realized. The Gary/Chicago International Airport is faced with the challenges of a diminishing local commercial market, a struggling regional economy, diminishing revenues, adverse impacts from a modified tax structure, aeronautical infrastructure that cannot meet the operating needs of passenger and cargo carriers, complex negotiations linked to enabling the planned capital program, and a general perception of the City of Gary as a place in which to do business. The Gary/Chicago International Airport (GCIA or GYY) in partnership with the Northwest Indiana Regional Development Authority (RDA) issued a Request for Proposals to select a team of industry experts that would develop a Strategic Business Plan. A team of experts, led by Landrum & Brown, an international aviation consulting firm, was selected through a competitive bid process. Through the development of the Strategic Business Plan, GCIA and the RDA sought to:
“Affirm the vision that the Gary/Chicago International Airport should become the third major airport in the Greater Chicago Area; and identify the key steps that need to be taken to actualize that vision and the timetable to be followed;
or Demonstrate why that vision is not achievable and identify the preferred
alternative and outline how it should be pursued.” Simply stated, the questions are whether or not the Airport is or can be a viable aviation asset, and if so, how should its resources be structured and focused. The development of this strategic business plan for the Gary/Chicago International Airport is predicated upon several key assumptions. The first, and most obvious, is that this is an Airport. For the facility to survive in that capacity it was first critical to determine whether there is a realistic aviation role that the Airport could play that would provide sufficient funding to offset growing deficits and sustain the operation financially. The identification of a Core Aviation Function – i.e. the determination of a basic Mission, became the most critical element of the work. This required an examination of the primary aviation elements – passenger, cargo, maintenance, and general aviation to assess their potential for Gary. The operating systems of an airport must also be reviewed in the broader context of its physical properties including its land assets dedicated to aviation support as well as land available for the development of non-aviation functions. Current practice in the airport industry is to also explore where appropriate the potential utilization of properties adjacent to the airport to create a larger development

THE GARY/CHICAGO INTERNATIONAL AIRPORT STRATEGIC BUSINESS PLAN FINAL
Landrum & Brown Intro-2 April 2010
district that integrates airport planning with regional economic development, land use, and transportation planning. The possibility of capitalizing on the on-and off airport land assets became the second major area of focus for the Team. This included linking on- and off-airport development, and the potential disposition of Airport land which is an extremely complex process particularly if the property was donated by the Federal Government, or acquired or developed through Federal Aviation Administration funding. The management of an airport’s finances, operations, maintenance, properties, and development involves challenges that diverge substantially from the management of most businesses. The sources and potential uses of funds, the establishment of rates and charges, and matching budget and staffing allocations for continually evolving and changing tasks are often unique to the industry and can be daunting given the linkage to federal, state, and municipal guidelines, regulations, and constraints. The third and fourth elements of the planning effort focused on the financial structure and management of the Airport and the complex governance issues under which it operates. As a final element of the planning effort, the Team explored the regional business, community and political context in which the Airport operates. How a “City” airport, particularly when its population base is by itself insufficient to sustain a commercial operation, is best integrated in a broader geographic region is essential to identifying opportunities for success. The importance of a regional partnership was raised frequently during the course of the work. There are financial, business, development, and management implications associated with “regionalization” that are addressed in the Plan. The Team worked diligently over a six month period conducting extensive due diligence including interviews with more than 100 firms and individuals, and reviewed a broad range of industry and regional studies, publications and trends, as well as analyses of Airport plans, financial documents, and governance procedures. The Team then used their specialized knowledge and experience to integrate the study and evaluation into a realistic and fiscally prudent Plan for the Airport and the Region to pursue. Because of its length, the document has been structured in four sections:
1. Recommendations 2. Next Steps 3. Background and Findings 4. Appendices
A key element in shaping the report was the development of a comprehensive SWOT (Strengths, Weaknesses, Opportunities, and Threats) Analysis. This Analysis is available at Appendix A. The Team developed a listing of issues identified in the initial due diligence efforts. This listing was evaluated using criteria developed specifically for this planning effort to assist in prioritization.

THE GARY/CHICAGO INTERNATIONAL AIRPORT STRATEGIC BUSINESS PLAN FINAL
Landrum & Brown Intro-3 April 2010
SWOT ANALYSIS - EVALUATION CRITERIA
Ability to make the Airport financially self-sustaining. The planning effort, assuming that the Airport can and does serve a viable aviation segment, is largely based on developing revenue streams that can reduce the Airport’s dependency on external sources.
Reduction of financial risk. The complement to making the Airport financially self-sustaining. Certain business enterprises offering large financial contribution may also include large risks. Commercial airline service may require a risk sharing program. The risks may be too high for a public organization, however big the potential return.
Degree of client control. Variables outside the control of the GCIA may depend on external entities. For example, the growth of corporate aviation could hold potential from a business perspective but may depend on accommodating policies of the Indiana Department of Revenue.
Promotion of regionalism as part serving the Chicago region aviation market. Realistically, the Airport must develop operating policies and a business niche that will serve the region as a whole and at the same time complement the operations at O’Hare and Midway International Airports. The initiatives proposed may be more successful and self-sustaining through the creation of synergies rather than competition among the three airports.
Viability as a core business. Some alternatives are sufficiently large to sustain the airport and allow it to pursue further businesses on its own. Other options can produce activity but little in the way of Airport revenue and jobs. The core business must enable the Airport to realize enhanced revenues through both direct service and ancillary and supporting activities.
Service to a regional constituency. The population base of the City of Gary, by itself, is insufficient to sustain commercial aviation service at this time. The target market must therefore be the larger region. This will be essential to acceptance of the Airport and proposed new initiatives.
Generation of regional jobs. An airport can be an enormous economic engine for a region. Different types of carrier activity and supporting services can generate substantially different job numbers.
Attraction of new business. The changing tax structure in the region is adversely impacting the City and in turn, the Airport. Attraction of new business will serve the dual purpose of creating jobs and enhancing the regional tax base.
Ability to implement. Recognizing that the Airport currently faces a number of challenges, recommended initiatives must be realistic, timely, and fiscally prudent.
Principal Findings and Recommendations:
1) The most important finding is that there is a viable aviation niche for GCIA to pursue – Low-Frequency Scheduled Passenger Carrier and Charter Operations. This would be compatible with a broader growth strategy for the Chicago regional aviation market and assist the Airport in achieving financial stability.

THE GARY/CHICAGO INTERNATIONAL AIRPORT STRATEGIC BUSINESS PLAN FINAL
Landrum & Brown Intro-4 April 2010
2) Developing this business segment can only be achieved through the completion of the planned extension of the primary runway. Furthermore, while the extension of the primary runway is essential to the successful development and fostering of the charter operation business segment, the additional runway length will also be imperative to marketing other significant aviation business segments as well. This must become the top priority of the Gary/Chicago International Airport Authority. The immediate selection of a nationally-respected Capital Program Manager with directly relevant experience is essential to this effort.
3) At this time, the Compact with the City of Chicago is critical to Gary from both a financial position and from a business development perspective and should be retained. The growth of any aviation market segment at Gary has a substantially greater possibility for success with Chicago support.
4) The population base of the City of Gary by itself can not support a commercial aviation operation at this time. As such, the Airport should better position itself by modifying the structure of the existing Airport Board to better represent the broader regional constituency that the Airport is positioned to serve. This repositioning would serve to broaden support from both the business and political communities and provide a more logical rationale for financial support.
5) At this time, both the Airport and the City of Gary have negative perception issues from a public relations and marketing perspective. Rebranding the Airport with a new name and refocused marketing based on the core business will be a vital step in developing growth.
There are a number of additional recommendations that are essentially subsets of the five primary items indicated above. These are discussed in greater detail in the Recommendations Chapter of the Plan. In meetings with the Team, the City of Chicago Department of Aviation indicated its support of the planning effort and its willingness to be a partner as appropriate, in the pursuit of the initiatives discussed in the Plan. It is important to note however, that contributions from Chicago under the Compact are now being used by Gary to offset operating costs as opposed to the original purpose - covering capital expenses. The intent of the Compact was to forge a partnership that through integrated planning and strategic development would better serve the aviation needs of the region. This vision should not be lost. It is also important to note that although the thrust of this plan is to grow the Airport through service to a broad regional constituency, the Airport is a property of the City of Gary and should remain so. That being said,
The City of Gary has a unique opportunity to demonstrate boldness, initiative and political vision through the repositioning of the Airport asset. In so doing the leadership can become a powerful advocate for regional growth and an unquestionable activist for regional prosperity.

THE GARY/CHICAGO INTERNATIONAL AIRPORT STRATEGIC BUSINESS PLAN FINAL
Landrum & Brown Chapter I-1 April 2010
CHAPTER I RECOMMENDATIONS
INTRODUCTION Recommendations and strategies relating to Passenger and Corporate Aviation have been structured on the basis of “Core” and “Non-Core” business initiatives. A core business is one which would involve high volume activity and provide an “anchor” of sufficient scale to create a major revenue stream and justify long-term development of the Airport. The Airport must be able to develop clear competitive strengths in its core business and plan around their continued presence. Developing a core business is a critical priority of the strategic business plan. Non-core business initiatives are those which have a reasonable probability of success. They should be given a lower priority and where possible support both the Core business and ancillary growth. Recommendations and strategies relating to Land Utilization deal with both on and off airport properties. The basic strategy for development is to ensure that those properties necessary to sustain and grow aviation functions are utilized and/or protected for that purpose. Land that can provide direct, rational support to an aviation function - preferably the core business segment should be the prime development target. Other on-airport properties that may not be adjacent to airside operations can be developed for non-aviation functions as long as specific enabling procedures, largely connected to FAA requirements, are followed. Adjacent off-airport properties must follow municipal requirements but may encounter some operating or safety constraints linked to Airport operations. Ideally such properties should also be developed to provide synergies with on-airport development and service. Recommendations and strategies relating to Financing deal both with the budgetary challenges facing the Airport and the issues linked to accessing funding sources. These external funds are currently tied to Airport operating expenses and the implementation of the rail relocation and the runway extension Capital Program. Recommendations and strategies relating to Governance deal with the appropriateness of the dual Airport board structure, the constitution of the existing Airport Board, the implications of the Compact with the City of Chicago, and issues associated with privatization of the asset. Recommendations and strategies relating to Business and Community address the importance of linking the Airport to the political and business communities, as well as economic development initiatives. It is essential that the concept of regionalization become not only part of the lexicon, but part of the regional business and political infrastructure particularly with regard to the strengths that the Airport can bring and the support that it will require.

THE GARY/CHICAGO INTERNATIONAL AIRPORT STRATEGIC BUSINESS PLAN FINAL
Landrum & Brown Chapter I-2 April 2010
Primary Recommendations: Recommendation 1: Develop GYY as a Low Frequency Passenger Carrier and Charter Service Airport as the “core” business initiative. Heavy emphasis should be placed on outbound leisure travelers.
Discussion The development of this Core business segment will depend heavily on support from the Chicago Department of Aviation. Given that Gary is part of a regional aviation system, the development of the Airport to support this business niche would be consistent with the region’s overall goal of supplying superior service to the broadest constituency. This initiative will depend upon the ability of the Gary Airport to complete the planned runway extension that will provide the necessary aeronautical infrastructure.
The target markets will be the more than 500,000 annual passengers that fly out of Chicago, Rockford, and South Bend on charter flights, and those regional passengers traveling on low-cost carriers. The initial goal will be to attract 100,000 annual passengers. If this can be achieved, it will provide relief to Chicago airspace, ease pressure on limited gate, apron and on-airport real estate at O’Hare (ORD) and Midway (MDW) International Airports, and recapture passenger traffic currently using competing airports outside the regional system.
Recommendation 2: Move forward with the railroad relocation and runway extension project on the timetable approved in 2006 in order to collect the remainder of the $57.8 million of FAA grant money.
Discussion These grant payments of approximately $5.1 to $6 million per year (depending upon the number of enplaned passengers that use the airport) have been approved to reimburse GYY for actual project expenditures. The FAA’s commitment will expire after federal FY 2015, therefore, the FAA funding could be deferred if progress is unreasonably delayed and at risk if GYY is unable to implement the project by FY 2015. Completion of the project is essential to attracting and retaining the core business component as well as creating an operating environment that will be attractive to non-core business segments.
There are currently two options under discussion and negotiation for the rail relocation – Option A and Option B. The Airport’s originally proposed Option A (the one funded by the FAA) has been vetted environmentally. Option B which has been described as less costly and preferred by the railroad, may require substantial new environmental work and incur delays. The Team was advised that a draft agreement was completed in December and that the Option was not yet determined. It will be important to immediately engage a nationally recognized Capital Program Management Firm to establish a Critical Path and to begin planning the necessary work (including all necessary environmental analyses) as soon as closure on the negotiations is reached.

THE GARY/CHICAGO INTERNATIONAL AIRPORT STRATEGIC BUSINESS PLAN FINAL
Landrum & Brown Chapter I-3 April 2010
Recommendation 3: Maintain the Compact arrangement, which provides significant financial support for GYY.
Discussion The City of Chicago provides approximately 99 percent of the annual funding of the CGRAA through the Compact. GYY receives approximately $680,000 per year in direct reimbursements from the CGRAA through the Compact for approved capital or operating requirements in addition to receiving marketing and other support services. The operating budget for CY 2010 includes a minimum of $320,000 from the Compact based upon known requirements for funding several employees at GYY, but the total amount of Compact funds utilized to support GYY’s operation is likely to be approximately $450,000 based upon CY 2009 results. In addition, GYY will likely apply for approximately $230,000 to reimburse project costs based upon 2008 and 2009 results.
The City of Chicago can terminate the Compact at any time upon giving six months notice if it determines that it is no longer in their interest to support GYY. GCIAA should therefore begin discussions with the City of Chicago and the CGRAA, as appropriate to assure continuation of the Compact based on the business development strategies of GYY.
Recommendation 4: The Airport governance and operating models should be revised to reflect the broader regional community that the Airport must serve to be most viable as a commercial entity.
Discussion The most critical issue facing the Airport is to become financially self-sustaining. GYY is currently dependent on external funding sources to supplement tenant rental revenues, and limited fuel flowage and landing fees. In addition to federal funding, and monies obtained from Chicago through the Compact, and the RDA, the Airport also receives either revenues through tax allocations or services directly from the City of Gary. All of these external sources are threatened. An important element in stabilizing the Airport will be repositioning to develop support from surrounding communities, businesses, and economic development entities.
Part of this repositioning would involve the reconstitution of the existing Gary/Chicago International Airport Authority Board. To function most effectively, the reconstituted board would lease the Airport from the City of Gary. Participating entities would be represented on the new board. Board membership should be based on criteria linked to the diverse challenges of a $90 million capital program, land acquisition and development initiatives, extensive business development, financial management and airport operations and management. As part or the process of establishing criteria for membership on the reconstituted Board, it may be necessary to review the current prohibition on board membership by persons actively employed in commercial aeronautics in the region.

THE GARY/CHICAGO INTERNATIONAL AIRPORT STRATEGIC BUSINESS PLAN FINAL
Landrum & Brown Chapter I-4 April 2010
Recommendation 5: A rebranding and image initiative should be created to link to the core business and a more regional focus.
Discussion The marketing and development of the Airport will depend in large measure upon successfully rebranding the facility, and to a certain extent the economic strength of the region. Stimulating recovery and new development will require that businesses and individuals feel safe and secure. From a rebranding perspective, there is little or no difference in treating reality and perception. A strategic and broad-based campaign to address the primary areas of concern should be created in partnership with regional industry, economic development agencies, and the political infrastructure. This would include, in addition to changes to the Board structure, renaming the Airport to reflect regional positioning.
Secondary Recommendations: Recommendation 6: Based on the Business Plan, update the Master Plan and Airport Layout Plan to reflect the new capital improvements and land uses.
Discussion The FAA requires updates to the Master Plan and Airport Layout Plans every 10 years or in the event major changes are required to the airport’s operations or infrastructure. The potential for changes to certain areas for non-aviation land use, the integration of on-airport functions with off-airport development, a potential passenger-rail connection, terminal improvement plans and infrastructure modifications still to be initiated, potential enhancements to approach/departure procedures and navigational aids, future planning for additional corporate hangars and GA facilities, expansion of the Free or Foreign Trade Zone (FTZ) and possible integration with a multi-modal center are strong reasons to undertake the planning effort.
Recommendation 7: Expand the existing environmental analyses to include Airport Properties targeted for potential development.
Discussion Extensive environmental studies have been completed (in 2005-2006) to fulfill the requirements of the Environmental Impact Statement that was prepared for the extension of Runway 12-30. This work should be expanded to include baseline environmental mapping of the entire airport area. The desired output would provide a comprehensive report on all areas which are currently known to have environmental issues, as well as a preliminary report on all areas controlled by the Airport (on and off the airport operations area - the AOA) that are potentially targeted for redevelopment. This would provide the Airport with a tool to have “shovel ready” sites for development both on and off the field. The work should also address all appropriate mitigation.

THE GARY/CHICAGO INTERNATIONAL AIRPORT STRATEGIC BUSINESS PLAN FINAL
Landrum & Brown Chapter I-5 April 2010
Recommendation 8: Engage professional expertise to develop a Collateral Land Use Plan for the properties that provide development opportunities for alternate commercial, retail or industrial uses.
Discussion A total of eight sites of varying sizes and configuration have been identified as having potential to accommodate other development than primary aviation uses. These could generate additional revenues for the Airport through ground rents, vertical rents, and/or percentage fee agreements. The potential for retail services to accommodate charter activity, a possible future rail connection and general aviation growth, will be created through the growth of the core business. Strategic as opposed to incremental development of these sites will be important to a creating an integrated and focused airport facility. A key component of this effort will be the conduct of an environmental baseline for the targeted sites.
Recommendation 9: Engage professional expertise to prepare a Conceptual Development Plan for Corporate and General Aviation and Supporting or affiliated businesses.
Discussion There is a strong existing base of General Aviation and Corporate Activity already in place at GYY, anchored by Boeing. The market analysis indicates that given the planned runway length and the available capacity, an increase in General Aviation and the supporting industries that are associated with that industry segment is viable. It will be important to have in place a Conceptual Development Plan based on a detailed market assessment that will include physical facilities, market mix of services, financial targets and budget estimates, as well as a comprehensive package of potential incentives. The market assessment should be expanded to include the potential for helicopter services. The final plan should reflect a long-term vision of what this segment of the Airport will look like, and how it will be built.
Recommendation 10: Assess the feasibility of a ground – oriented regional distribution center.
Discussion Although, air cargo does not appear to be a significant near-term opportunity, (See Section III-1E, “Feasibility of Air Cargo and Logistics”), the positive elements of a central U.S. location, the low-cost of trucking, the population concentration, regional labor force, and available property for logistics development and operations offer the potential for a truck-oriented regional consolidation and distribution center. The extension of Foreign Trade Zone status to a logistics operation further broadens the potential and could stimulate interest from both the Ports of Indiana, and the Canadian National (CN) Railroad. Such an operation could help reduce regional trucking operations with a positive impact on environmental emissions. At the same time it could become an attraction for new business by reducing per pound shipping costs into and out of the region.
THE GARY/CHICAGO INTERNATIONAL AIRPORT STRATEGIC BUSINESS PLAN FINAL
Landrum & Brown Chapter I-6 April 2010
Recommendation 11: Determine the justification for extension of the Crosswind Runway - 2/20
Discussion While the core business pursuit of the Airport should be on low-frequency carrier and charter traffic, there are opportunities for growing the general aviation and corporate segments. Historically, concerns have been raised about wind conditions that could be addressed by extension of Runway 2/20. It will be necessary to undertake a thorough study of the need for and cost-benefit of a runway extension of 2/20 from the current length of 3,603’ to 5,000’. An updated Airport Master Plan & ALP would address the future design and engineering challenges of relocating Industrial Highway to accommodate a 1,400’ extension and the possibility of adding an IFR Approach Designation to runway 2/20.
Recommendation 12: Create a public outreach program to develop interest and regional acceptance within the surrounding communities.
Discussion An important component of developing regional and community buy-in and support of the Airport will be the ability to generate jobs and business opportunities. A regionally and locally focused program will also provide opportunities for economic revitalization. The potential of the Airport and the region are linked together. For the Airport to succeed the region must be a partner in that success. The outreach must go beyond the City of Gary and in the spirit of regionalization include the communities within a targeted catchment area for the Airport. Partnering with continuing education or trade schools as well as instructional training in aviation can provide additional job options, and could also result in a productive use of Airport properties and the generation of additional revenues. This outreach could include institutions such as Ivy Tech and industry trade schools at other regional airports. This is consistent with the “One Region, One Vision” campaign the NW Times and others are advancing.
A focused regional effort to develop support for the Airport should be in place to a) broaden industry outreach, and b) help sustain commercial operations that can be attracted to the Airport.
Recommendation 13: Explore regionalizing the sponsorship of GYY in order to include potential financial support from the adjoining cities and counties that would benefit from improved services at GYY.
Discussion GYY is incurring financial stress resulting from the loss of passenger service and decreasing property tax revenues due to the tax caps. Property tax revenues, which averaged approximately $1,050,000 during the most recent seven years, are budgeted to decline to approximately $543,000 in 2010 due to the state tax caps unless relief is given by the Distressed Units Appeal Board (DUAB).

THE GARY/CHICAGO INTERNATIONAL AIRPORT STRATEGIC BUSINESS PLAN FINAL
Landrum & Brown Chapter I-7 April 2010
Recommendation 14: Continue to work with the City of Chicago to provide funding for capital projects via Passenger Facility Charges collected at O’Hare and Midway International Airports.
Discussion GYY cannot collect PFCs to fund capital projects since it is not currently a commercial service airport, but by virtue of the Compact, Chicago has agreed to provide funding for a number of FAA-approved capital projects at GYY. The FAA approved the collection of $8.2 million of PFCs at ORD and $1.3 million of PFCs at MDW for the railroad relocation and runway extension project. As provided for in the Compact, the GCIAA Board has the ability each year to submit new capital projects at GYY to the CGRAA Board for its approval, including new PFC projects.
Recommendation 15: Decrease operating expenses at GYY to a level necessary to support its operation in order to reduce the dependency on the declining amount of property taxes. An initial way to begin would be to engage outside expertise to conduct an in-depth staffing and organization study to determine if the operating expenses being incurred at GYY are appropriate based upon comparisons to other comparable airports.
Discussion GYY does not currently generate enough operating income on the Airport to be profitable without financial support from property taxes, the CGRAA or some other external source.
Recommendation 16: Engage outside expertise to review the size and skill sets of airport staff and determine the appropriate mix to reflect the capacity and skills appropriate to address the existing challenges.
Discussion The Airport faces substantial challenges that collectively extend beyond the typical skill sets and expertise of an Airport Director of a general aviation or non-hub airport. These include a $90 million dollar capital improvement program compounded by detailed negotiations with the CN Railroad, substantial property acquisition and environmental issues, development of commercial activity in an economically distressed industry, shrinking revenues, critical image and branding issues, and lack of unified political, business, and public support. Staffing should be based on initiatives emerging from the Business Plan. Staffing enhancements and specific functions should be communicated to media, stakeholders, and the community to build confidence that the Airport has clear goals and is implementing the new Business Plan.
Recommendation 17: The Airport Development Zone should be retained and expanded as appropriate to encompass both the Airport and its environs.
Discussion The reconstituted board would have economic development authority over the district or zone. This will provide a single focal point and help to assure that potential development opportunities with links to aviation are

THE GARY/CHICAGO INTERNATIONAL AIRPORT STRATEGIC BUSINESS PLAN FINAL
Landrum & Brown Chapter I-8 April 2010
coordinated among the Airport, the Development Zone, and the surrounding region. To broaden utilization options creation of a Foreign Trade Zone Annex should be considered as an available strategy.
Recommendation 18: Integrate Airport planning and development with a regional created Task Force to pursue opportunities in the logistics field.
Discussion Although air cargo does not appear to be a significant near-term opportunity, the geographic positioning of the region offers potential for the integration of other modes and the longer-term potential of cargo charter activity. It will be important to continue conversations with the Canadian National/EJ&E to explore opportunities for shared rail/truck cargo consolidation, and develop further conversations with the Ports of Indiana in conjunction with the above to determine the demand for use of the FTZ and corresponding facility requirements at GYY. Targets for the effort could include: o Logistics and warehousing – particularly those uses which can use the
road and rail in the area and which might also support some value-added assembly functions.
o Limited light manufacturing – Particularly kitting, and light assembly. The scope of this use is limited more by the size of the parcels available on the GYY site than by other factors
o Time sensitive products such as critical parts warehousing, medical kitting, or electronics repair.
Recommendation 19: Integrate Airport planning with a focused marketing and development effort addressing retail and commercial activities to support passenger charter activity.
Discussion The identification of low-frequency passenger and charter activity as a viable and realistic market segment, and the Marquette Development project creates the potential for retail and commercial uses serving the Airport and the broader region. This would include segments such as convenience and tourism related retail, hotel and restaurant uses.
Recommendation 20: Develop a national and international business attraction capability for GYY and the region, specifically tasked with outreach to site selection consultants and businesses meeting the target criteria for the Airport and the region.
Discussion The inclusion of the potential benefits that the Airport can offer to a business development campaign can be significant and makes the development of a coherent and comprehensive business attraction strategy for the region. The proximity and potential availability of ready transportation as well as the benefits of a Foreign Trade Zone can substantially change a target market and marketing campaign. Any regional efforts would be best coordinated with the State of Indiana and the Indiana Economic Development Corporation (IEDC) to pre-certify GYY’s development sites for job training, property tax
THE GARY/CHICAGO INTERNATIONAL AIRPORT STRATEGIC BUSINESS PLAN FINAL
Landrum & Brown Chapter I-9 April 2010
exemption, and other key incentives which meet likely business requirements. As part of this, ensure that the state’s Enterprise Zone and EDGE tax credit programs have been specifically leveraged for this site.
Recommendation 21: Integrate the Airport’s business development process with City and regional efforts.
Discussion The success of a public asset depends to a large extent on the support of the business and public community. In the instance of such a visible and valuable facility such as GYY, it is essential that economic development organizations and local and regional public officials have a clear understanding of Airport issues, financing, management and strategic initiatives. Communications to ensure this transfer of knowledge within the region is limited and unstructured. Lake County is experiencing less growth than Newton, LaPorte and Stark Counties. These three Northwest Indiana counties are leading the region’s economic development to which the future success of the Airport could be tied. A practical, customer service approach to monitor efforts and continual dialogue with County officials and their regional agencies can help the Airport establish them as strategic partners.
Recommendation 22: As a non-core business, Market GYY as the primary Corporate Aviation Facility to serve the Chicago region’s aviation market.
Discussion In a normal growth environment, in a major aviation demand market like Chicago, general and corporate aviation represent challenges to the most efficient use of the airspace, aeronautical infrastructure, and airport property. Following the recent economic turndown, commercial activity – the primary operating component at both ORD and MDW – decreased, providing a temporary respite from a number of difficult resource allocation issues. As the economy and aviation industry recover, balancing the needs between general and commercial aviation will become more difficult, and identifying appropriate safe operating alternatives will be critical. The corporate aviation segment typically requires a longer runway than those at most general aviation airports. While many of the major corporations are located to the north, west and downtown, the previous reliance on Meigs Field and current use of Midway indicate a potential for growth at Gary provided suitable infrastructure and aeronautical operating environment are available.
Recommendation 23: The dual board structure that is currently in place should remain.
Discussion The current structure facilitates connectivity to the regional airport system and helps insure continuance of the Compact. The Chicago-Gary Regional Airport Authority’s Authority (CGRAA) role is limited to review and approval of capital expenditures, and does not overlap with the GCIAA’s role in oversight of GYY operations. This in effect creates both connectivity and a system of checks and balances.

THE GARY/CHICAGO INTERNATIONAL AIRPORT STRATEGIC BUSINESS PLAN FINAL
Landrum & Brown Chapter I-10 April 2010
Recommendation 24: Create a Supplier Diversity Initiative and a Program to foster local job development and regional support of the Airport.
Discussion For capital projects linked to the Airport initiatives, a supplier diversity program can provide business opportunities to qualified Minority and Women Business Enterprises (M/WBEs), veteran-owned businesses (VBEs), and other businesses. A comprehensive program should focus on providing local business enterprises with opportunities to compete on bidding opportunities, Requests for Proposals and other sourcing opportunities. Planning can begin immediately for a full implementation linked to the capital improvement programs.
Recommendation 25: Continue Pursuit of High Frequency Passenger Services on an ad hoc basis, as a “non-core” business initiative.
Discussion Following the recent economic turndown, commercial activity – the primary operating component at both ORD and MDW – decreased, providing a temporary respite from a number of difficult resource allocation issues. As the industry recovers, carriers will make decisions regarding existing and potential new route structures. The Chicago region will remain a priority market. However, service to MDW or ORD may be inconsistent with a carrier’s business plan, or incompatible with available airport facilities. In either case, Gary, with an extended runway, could help maintain/grow regional market share, and accommodate passenger service connecting to a hub airport outside of the region or a potential point to point operation.
Recommendation 26: Defer pursuit of Privatization efforts for the immediate future.
Discussion The issue of Privatizing the Airport was raised by a number of interviewees. The objectives are to create an immediate cash infusion and to relieve a potential on-going requirement for subsidy by the City or the RDA. This latter objective is precisely the reason why privatization would be particularly problematic. Attracting investors for a facility without commercial traffic, confronted with substantial financial challenges, and hampered by a poor public image is at best unlikely. The Airport will need to be positioned much better on a number of fronts to be a feasible prospect for any approach to privatization.
Recommendation 27: Defer pursuit of Air Cargo for the immediate future.
Discussion The state and operating practices of the air cargo industry and the enormous competition of O’Hare (which is adding one million square feet of new cargo facilities) make it extremely unlikely that any significant air cargo operation could be attracted to GYY (See Section III-1E, “Feasibility of Air Cargo and Logistics”). Despite the existence of a Foreign Trade Zone, the planned runway extension, and land capacity, the Airport still is a far less attractive alternative for cargo than ORD. However, given the lack of available property around O’Hare, there may be an opportunity for the development of a separate logistics operation structured around trucking.

THE GARY/CHICAGO INTERNATIONAL AIRPORT STRATEGIC BUSINESS PLAN FINAL
Landrum & Brown Ch II-1 April 2010
CHAPTER II NEXT STEPS This section lays out an approximate timetable for implementing the recommendations. The schedule is predicated in part upon approvals of the Plan, the time it takes to transition functional responsibility, the availability of reasonable funding, and the selection of qualified support. The effort calls for the simultaneous pursuit of multiple initiatives over the next 18 months.
There is a substantial amount of effort involved in a relatively brief time period. The pace is driven by the completion of the runway extension and the need to implement changes quickly to address the core business requirements and generate revenues. These are built around the primary strategies of:
Completing the capital program (CP)
Rebranding the Airport (RB)
Confirming the relationship with Chicago (CH)
Broadening regional outreach (RO)
Generating revenues through property utilization (PU)
Growing and managing existing Airport operations (AO), and
Establishing the targeted core aviation business (CB)
NEXT STEPS 2010 3rd Quarter
Hire a capital program management firm that has experience in the implementation of $100 million airport capital programs including the relocation of railroad tracks. As their first priority, implement the approved railroad relocation and runway extension project within a firm deadline, but absolutely no later than FY 2015. This firm should report directly to the GCIAA board, and prepare frequent progress reports that may be given to the RDA, Chicago and the CGRAA. (CP)
Initiate the planned infrastructure improvement process. (CP)
Initiate discussions with Chicago and CGRAA for the retention and strengthening of the compact. (CH)
Develop a legislative proposal to implement Airport Board restructuring and the development of a lease of the Airport to the reconstituted Board. (RB)
Initiate a rebranding campaign that addresses image, safety, and a redefined service region. (RB)
Develop a comprehensive listing of key contacts in the region for the Airport with whom it will be essential to communicate on a regular basis. (RO)

THE GARY/CHICAGO INTERNATIONAL AIRPORT STRATEGIC BUSINESS PLAN FINAL
Landrum & Brown Ch II-2 April 2010
Based on an accepted strategic plan, develop a reporting format and agenda linked to board meetings for discussion with and acceptance by the key contacts. At the same time, provide a feedback mechanism to enable recipients to comment and provide input. This will also require the creation of a follow-up system. (RO)
Identify particular issues with which the key contacts are concerned and develop a process for priority distribution of sensitive information. In virtually every instance, demonstrating financial accountability to regional constituents, the CGRAA, the RDA and the local business community for the funds flowing to the Airport will be critical for consensus building. (RO)
Institute and publicize regularly scheduled Airport community and stakeholder outreach meetings designed to both distribute information and solicit input. (RO) These sessions should minimally cover:
a) The state of the industry and how the region is affected, b) Strategic responses and proactive initiatives available to GYY, c) General airport management practices, d) Related economic development initiatives, e) Linkages between the Airport initiatives and jobs
2010 4th Quarter
Brief the FAA on the plans for the new board structure and lease of airport to identify and address concerns the FAA might have. FAA approval of the new board structure and lease will be required. (RB)
Establish an implementation strategy and timetable with the City of Chicago that is tied to the capital investment, operating requirements at ORD and MDW, and the needs of the carriers. (CH)
Utilizing external expertise, conduct an in-depth staffing and organization study to determine if the operating expenses being incurred at GYY are appropriate based upon comparisons to other comparable airports. The study should also consider the match of skill sets to near-term challenges. (AO)
Review comparable airports to identify and estimate potential additional revenue sources. (AO)
Initiate a Master Plan and Airport Layout Plan update process to ensure integration between the business planning initiatives and the required physical and environmental planning guidelines of the FAA. (AO)
Identify definitive sites on the Airport that might be available for commercial and retail development linked to future passenger activity and the Marquette Development. (PU)
Initiate an environmental baseline study for the parcels tentatively identified for development. (PU)
Identify and address other site constraints and issues (PU)
Determine the availability of a site proximate to the Airport and evaluate the feasibility of a regional logistics center. (PU)

THE GARY/CHICAGO INTERNATIONAL AIRPORT STRATEGIC BUSINESS PLAN FINAL
Landrum & Brown Ch II-3 April 2010
Explore the possibility of integrating private and public development initiatives with potential Airport benefits. (RO)
Perform direct outreach and marketing to site selection consultants to explain the advantages of the site and community. (PU)
Coordinate with the State of Indiana and the Indiana Economic Development Corporation (IEDC) to pre-certify GYY’s development sites for job training, property tax exemption, and other key incentives which meet likely business requirements. (RO)
2011 1st Quarter
Identify key targets for community and business outreach efforts and establish milestones and performance measures. (RO)
Cultivate working partnerships with regional organizations whose work and profitability can be impacted by the success of the Airport. (RO)
Improve communications with the City of Chicago directly and through the CGRAA to solicit their input and support for the plans and projects at GYY. Provide periodic reports on the progress of approved capital projects and other initiatives at GYY. (CH)
Continue to work with the City of Chicago to provide funding for capital projects via Passenger Facility Charges collected at O’Hare. Determine if amendments are needed to already-approved PFC projects due to changes in estimated costs, timing or funding sources. Discuss opportunities to provide PFC funding for future capital projects that would support agreed upon objectives. (CH)
Develop a comprehensive profile of pending or potential new business initiatives. (PU)
Integrate private and public development initiatives with potential Airport benefits. (PU)
Create a tracking function to follow-up on all new initiatives to ensure maximum pursuit of opportunities. (PU)
Explore the creation of a regional taskforce to pursue logistics development. (PU)
Discuss intermodal logistics opportunities with Canadian National, and the Ports of Indiana for multi-modal cargo consolidation. (PU)
Assess the feasibility of a regional trucking consolidation and distribution center. (PU)
Review and update the funding plan for the five-year capital improvement program including the latest cost estimates for the runway project. Identify any funding shortfalls and proposed approaches to bridge any timing gap between when funds need to be committed for the runway project and when grant reimbursements are expected. (AO)

THE GARY/CHICAGO INTERNATIONAL AIRPORT STRATEGIC BUSINESS PLAN FINAL
Landrum & Brown Ch II-4 April 2010
With the existing FBO develop a realistic short term facilities plan addressing physical and operating requirements. Discussions should include cost-sharing for aesthetic improvements to existing access roads. (AO)
Explore the implications of different tax structures in Illinois and Indiana on general and corporate aviation, and examine potential adjustments to Airport fees that could minimize any disadvantages for Gary. (AO)
With the FBO create marketing strategies to attract existing users in the region and new entrants. (AO)
Develop collateral marketing material leveraging the Boeing presence reflecting the new Airport focus and business model. (AO)
Develop and refine an airport familiarization strategy (AO)
Speak with The Boeing Company to explore synergies arising from the presence of their BBJ corporate aircraft. (AO)
2011 2nd Quarter
Perform additional due diligence on high-value manufacturing industries importing into the Chicago area to determine more specific targets for FTZ-based assembly. (PU)
Perform additional due diligence to determine the current market needs of food manufacturing users for the greater Chicago area. (PU)
Perform direct outreach and marketing to site selection consultants to explain the advantages of the site and community. (PU)
Cultivate media relationships and prepare “camera-ready” success stories that will have both local and industry-wide appeal. (RB)
Implement a mechanism to broaden the sponsorship of GYY beyond the City of Gary in order to include the participation and potential financial support from the adjoining cities and counties that would benefit from improved services at GYY. (RO)
Create direct links with the regional Chambers to develop a campaign that will get commitment from members to use GYY. (RO)
As the capital programs unfold, develop a regional job development program focused on providing opportunities for local business to compete on bidding opportunities, Requests For Proposals and other sourcing opportunities. (RO)
Develop and institute a contractor assistance programming (training) to small businesses to facilitate teaming with Prime Contractors on major airport projects. (RO)
Host a job fair at the Airport in conjunction with Workforce Development with full and aggressive press coverage. (RO)
Develop focused collateral marketing material for the potential originating market. The material should be linked to the priorities defined in the strategic plan. (CB)

THE GARY/CHICAGO INTERNATIONAL AIRPORT STRATEGIC BUSINESS PLAN FINAL
Landrum & Brown Ch II-5 April 2010
2011 3rd Quarter
As work advances on the extension of the primary runway, conduct a feasibility study and cost-benefit analysis for Runway 2/20. (AO)
Develop targeted financing programs to address tenant specific infrastructure needs (roads, utilities, etc) (AO)
Pursue partnering with continuing education or trade schools as well as instructional training in aviation. (RO)
2011 4th Quarter
Initiate market assessment and marketing for priority development parcels consistent with the Core business. (CB)
Develop a short term facilities plan (including cost estimates) consistent with timing and implementation requirements addressing terminal improvements, parking, and any operational issues. (CB)
Develop marketing material with current market analyses and information reflecting the new Airport focus and business model. (CB)
Develop a flexible, strategic approach to risk sharing that will protect the Airport and the region to the extent possible while maintaining equity in the business arrangement. (CB)
Develop and refine an airport familiarization strategy (which may include site visits) appropriate to new carriers. (CB)
Monitor the industry for potential opportunities. (CB)
2012 1st Quarter
Develop an initial rates and charges system for the Airport that would be attractive to low frequency/low cost operations. (CB)
Initiate preliminary discussions with carriers/travel wholesalers and explore charters for “sports teams” as an expanded focus. (CB)
Develop and refine an airport familiarization strategy (which may include site visits) that can be brought to the target markets. (CB)
Initiate direct marketing to carriers and other potential targets. (CB)

THE GARY/CHICAGO INTERNATIONAL AIRPORT STRATEGIC BUSINESS PLAN FINAL
Landrum & Brown Ch III-1 April 2010
CHAPTER III BACKGROUND AND FINDINGS
SECTION III-1 AVIATION BUSINESS DEVELOPMENT The Gary/Chicago International Airport (“Gary Airport”, “Airport”, GCIA or GYY) lies at the center of one of the most important issues facing Greater Chicago and northwest Indiana. The Airport is a key consideration in any initiatives to revitalize the local industrial base and counteract the long term decline of heavy industry. It can help depressed urban areas develop a new and dependable economic base. The Airport must develop in a large, sophisticated urban community, in which many airports play competitive and complementary roles. As a designated element of the Chicago regional aviation market, GYY can help the region accommodate the expanding air traffic and counteract the growing congestion at the O’Hare and Midway airports. The Airport’s location near key transcontinental surface arteries makes it a factor in any efforts to develop high speed surface transportation. The Airport can also serve as the focus of regional integration efforts for northwest Indiana, or, conversely, integrating the communities more closely into greater Chicago. However, the Airport faces socioeconomic complexities of Gary and environmental challenges are prevalent, including unique and endangered natural resources and highly contaminated ex-industrial sites. The Gary Airport has not attracted the level of activity that would be expected from its strategic location. Proposals to lengthen the main runway and to relocate a railroad line create the need to resolve the future of the Airport. The infrastructure investments would be very costly, and can only be justified if the Gary Airport plays a more prominent role in the regional community. The capital programs impart a sense of urgency to the need to identify a new revenue base for the Gary Airport. In the fall of 2008, the Airport and the Regional Development Authority initiated the development of a Strategic Business Plan for GYY. Specifically, the mandate included the following:
Evaluating aviation activities and their potential at Gary, for scheduled passenger services, charter passenger services, cargo flights, general aviation, corporate aviation, flight schools, etc.
Evaluating activities that support aviation, including aircraft repair, maintenance and overhaul (MRO), airport concessions, etc.
Evaluating non-aviation land uses for the Gary Airport;
Reviewing intermodal transportation trends and their relevance for the Gary Airport;
Consulting with key local stakeholders and leaders to identify community perspectives on the Gary Airport;
Evaluating the relationship of the Gary Airport to northwest Indiana regionalization issues;

THE GARY/CHICAGO INTERNATIONAL AIRPORT STRATEGIC BUSINESS PLAN FINAL
Landrum & Brown Ch III-2 April 2010
Developing an appropriate management structure and governance for the Airport;
Developing a system of fees and charges appropriate to the Airport’s recommended business role(s);
Identifying any environmental issues or constraints; and
Specifying any necessary capital improvements. This segment of the work assesses the suitability of passenger services and corporate aviation as key elements of the Strategic Business Plan.
Section III-1A Analysis of Airline Industry Trends of Fundamental Importance to Gary
INTRODUCTION The prospects of passenger airline services to Gary depend both on the dynamics of the Chicago/Northwest Indiana market and strategies of the airlines. Carriers already serve the northwestern Indiana market through scheduled flights to the O’Hare, Midway and South Bend airports. The introduction and development of passenger services to Gary will depend on three factors:
1. The airline industry seeking new ways to serve the Chicago/Gary region; 2. A favorable local market; and 3. An airport capable of meeting the needs of travelers and airlines.
This Section considers the first element, the airline industry. It examines the condition and the strategic focus of the commercial airline industry as it relates to the Gary Airport. Some factors affect all airlines and airports and have no specific and unique relevance to Gary. Other trends may have only a modest importance, but crucially affect Gary’s long-term prospects. The pivotal trends of direct significance to Gary are identified below. Broader industry trends of peripheral importance to Gary are presented in Appendix A.
Trend 1: Increasing Regional Jet Sizes Regional jets and 19-70 seat turboprop aircraft have allowed many low-volume airports to obtain greatly improved services. Any scheduled flights by legacy airlines to Gary would likely use regional jets. The flights would connect to a large hub, thereby offering one-stop connections to scores of domestic and international destinations. Regional jets offer large operating economies1 however they still are
1 Compared to narrow body aircraft such as the 737, the regional jets have lower capital costs. They
consume less fuel for a similar distance, and incur lower maintenance costs. Landing fees are lower because of their reduced weight. Most regional jet flights are operated by specialty airlines that sign arm contracts with the major carriers and subsequently operate under schedules specified by the major partner. The operator is paid according to flying performed, and brands its flight as an integral part of the senior airline’s network. The crew of the regional affiliate is paid considerably less than those working for a mainline carrier. While the regional jets offer significantly lower costs per flight than a larger mainline aircraft, the costs on a per seat basis are considerably higher. Regional jets therefore need relatively high fares to operate profitably.

THE GARY/CHICAGO INTERNATIONAL AIRPORT STRATEGIC BUSINESS PLAN FINAL
Landrum & Brown Ch III-3 April 2010
expensive on a per seat-mile basis. They require high fares to be profitable. Rising fuel costs and the continuing downward pressure on fares have greatly undermined the profitability of regional jets and turboprops. Bombardier has ceased production of its 50 seat regional jet. The airlines have been shifting to regional jets of 70-90 seats. Between 2003 and 2008, the average capacity of the regional fleet increased from 43 to 60 seats2. The airlines still find that 70 seat aircraft are unprofitable on many routes. This trend will complicate efforts to establish scheduled services at Gary. Services by a 50 seat aircraft would be profitable only if the flight carries premium passengers or persons connecting to intercontinental flights. As average sizes of regional jets increase, the number of passengers needed to support a service at Gary will grow. A four times daily departure with a 70 seat aircraft and a 65 percent load factor will need over 132,000 passengers per year. The flight would still require high fare passengers, although maintaining a premium would be difficult because of the proximity of low cost carriers at Midway.
For the Gary Airport, the increasing size of regional jets would require:
A larger quantity of traffic in order to attain profitability; Passengers willing to pay a higher fare to travel from Gary rather than
Midway; A well-funded and effective program of promotion to help the Gary Airport
obtain the needed traffic. It would emphasize the Airport’s value as a gateway to Northwest Indiana; and
A well funded program for risk-sharing or a revenue guarantee. A larger aircraft involves a higher risk for the Gary Airport, since breakeven revenues will increase. The Airport would therefore be asked to put forward a correspondingly richer incentives package. It will need more resources to do so.
Trend 2: Airport Specialization
Most major airports serve the full range of commercial services, including legacy scheduled flights, low cost carrier scheduled flights, charters, integrated carriers, heavy cargo carriers, corporate and general aviation. However, some airports have specialized in specific market segments and have developed their facilities and management procedures accordingly. Some airports in large markets have specialized in low cost services. They provide minimal facilities in order to control costs while developing services for leisure passengers. Examples include Sanford (for Orlando), Hahn (for Frankfurt) and Stansted (for London). The airline agreements are structured to encourage services by seasonal and low frequency operators. The low cost carrier airports relieve congestion at the primary airports. High volume/low frequency charter flights can pose gate utilization concerns at busy scheduled terminals, where most flights operate daily. They help both legacy and low cost/charter carriers differentiate their services. Communities with such airports
2 Source: United States Department of Transportation Database 28DS

THE GARY/CHICAGO INTERNATIONAL AIRPORT STRATEGIC BUSINESS PLAN FINAL
Landrum & Brown Ch III-4 April 2010
have a competitive advantage in attracting low cost scheduled and charter flights. Carriers can choose a cost/service mix that is appropriate to their clientele. Low frequency scheduled/charter airports are not common enough be called a “trend”, however, they can and do help relieve a primary airport of low yield traffic and create new advantages in the competition for better air services.
Trend 3: Consolidation Despite repeated predictions to the contrary, the United States has seen no new wave of airline consolidations. Mergers, while generating situation-specific benefits have not been effective for promoting higher earnings, nor have they necessarily resulted in lower costs. Many have proven difficult and time-consuming to implement. US Airways and America West merged in 2005 and Delta absorbed Northwest in 2008. United has been reportedly seeking a merger with Continental. While Continental originally rejected the proposal, it has withdrawn from the SkyTeam alliance (which includes Delta, Air France/KLM, Korean Air and others) in favor of the Star Alliance (United, US Airways, Lufthansa, Air Canada and others). The Delta/Northwest merger will likely result in a network rationalization. The merged airline has hubs in Atlanta, Cincinnati, Salt Lake City, Detroit, Minneapolis and Memphis. The prudent management would require that the airline eliminate redundancies, to wit, it has already greatly reduced operations at Cincinnati. Any program of hub elimination would concentrate traffic through the remaining hubs. Traffic increases on routes such as Chicago-Atlanta and Chicago-Detroit might make Gary-Atlanta/Detroit services feasible. In 2008, Delta/Northwest had only a five (5) percent share of combined O’Hare and Midway domestic boardings3. As the largest airline in the world, it may perceive the need for a higher profile in Chicago. With its Atlanta/Detroit banks already filled at O’Hare and low cost carrier competition at Midway, the airline might consider other Chicago area airports as a means to expand its share of an important market. Republic Airlines’ acquisition of Frontier and Midwest could have a decisive impact on the industry. Republic previously operated commuter flights for all network carriers. The trunk airlines specified its schedules and routes, managed its seat inventories and paid it for each departure. Republic operated on an arm’s length basis and the lack of any marketing role eliminated conflicts of interest in serving competing carriers. Now, as the owner of a low cost carrier with its own branded and independently marketed product, Republic competes directly with its regional service customers. The trunk carriers might shift their regional services to in-house divisions, or assign contracts to other pay-per-departure regional jet operators. These include Pinnacle, SkyWest and ExpressJet. These airlines could experience a temporary shortage of aircraft as they fill the gaps created by Republic. In November 2009, United Airlines signed a contract with ExpressJet involving
3 Source: United States Department of Transportation Database 28DM. The figure is only
approximate, because the database shows the identity of regional carriers, but not the senior airline on whose behalf the flights operate.

THE GARY/CHICAGO INTERNATIONAL AIRPORT STRATEGIC BUSINESS PLAN FINAL
Landrum & Brown Ch III-5 April 2010
25 Embraer regional jets. This flying was originally handled by other unspecified affiliates. For several years following the merger, there may be few carriers willing and able to inaugurate new routes with regional jets. In November 2009, Republic’s Midwest subsidiary announced a greatly expanded operation at Milwaukee. While residents of Chicago’s northern suburbs could readily drive to Milwaukee, it will be difficult for Midwest to serve the remainder of Chicago. O’Hare is relatively close to Milwaukee’s General Mitchell Airport. Midway has a strong low cost carrier presence. The Gary Airport might be the ideal way for Midwest to serve southern Chicago and Northwest Indiana markets. The factors favoring a Gary-Milwaukee service include the location of the Milwaukee airport. O’Hare’s proximity to Milwaukee reduces the benefits of a nonstop flight4. Unlike other Chicago airports, Gary has no dominant carrier. Negatives include the problems faced by most new entrants5, the location of Milwaukee that limits beyond-hub destinations for Chicago passengers and the intense competition at General Mitchell between Midwest, AirTran and Southwest. Nevertheless, the Gary Airport could eventually consider pursuing a Milwaukee route by Midwest. Further industry consolidation will occur slowly. Regulatory concerns will grow as the industry becomes increasingly concentrated. Integrating seniority lists, retaining a skilled and highly motivated workforce who exercise initiative under limited supervision, and developing company-wide procedures and attitudes have presented major problems for most mergers. The collective agreements of the post-merger entity usually include the most generous provisions of each predecessor, so costs usually increase. Free entry on domestic and most international routes has eliminated many of the reasons for a merger. The economic decline that began in 2007, prompted a severe decline in both traffic and yields and led to major airline losses in 2008 and 2009. However, by the fall of 2009, most airlines showed improved earnings (or reduced losses). Aggressive reductions in capacity proved effective in stemming losses, although traffic remains below 2007 levels. The stronger balance sheets have allowed most airlines to access the debt markets. These conditions could precipitate further consolidation. Both American and United could participate. These mergers could either help or hinder efforts to attract scheduled services to Gary.
Trend 4: Community Air Service Incentives Airlines routinely ask communities seeking air services for financial support. Temporary rebates on user charges, while widely expected, are seldom viewed as sufficient. Rather, the airlines expect some form of risk sharing, in which the community guarantees a certain flight load or revenue stream. The participating communities believe that the benefits of additional air services compensates for the risks and any resulting payments.
4 Both United and American offer nonstop O’Hare-Milwaukee flights for connecting passengers.
However, the short distance between O’Hare and the General Mitchell airport makes nonstop flights very expensive on a seat-mile measure.
5 Republic, Frontier and Midwest are well established. However, the new relationship between the airlines and their new business plan give them many of the attributes of a new entrant.

THE GARY/CHICAGO INTERNATIONAL AIRPORT STRATEGIC BUSINESS PLAN FINAL
Landrum & Brown Ch III-6 April 2010
SUMMARY AND CONCLUSIONS
The airline industry trends of greatest relevance to the Gary Airport are:
1. Increasing Sizes of Regional Jets
This increases the number of passengers and the value of any incentive package that the Airport must provide to obtain scheduled air services.
2. Airport Specialization
This factor might enable Gary to specialize in a specific passenger traffic segment rather than compete head-to-head with Midway or O’ Hare.
3. Consolidation
Industry consolidation reduces the number of candidates for serving Gary. However, it might encourage the remaining carriers to expand into additional airports in the Chicago region. Recent mergers involving Republic Airlines could create opportunities for a Gary-Milwaukee service.
4. Community Air Service Incentives
The Gary Airport must be prepared to discuss financial incentives with prospective entrants. No general rules can determine when a particular route should be supported and to what extent. Since it lacks an incumbent carrier, Gary can develop a highly innovative program.
A number of additional trends are of lesser significance to the airline industry. While they will affect the environment within which Gary grows and may impact the probabilities of success of most initiatives they have little or no specific and immediate consequences for the Gary Airport. Appendix A discusses these trends in detail and key conclusions are summarized below:
The Regional and National Economies The United States economy is recovering from the recession of 2008 and the widespread failure of financial institutions caused by the sub-prime mortgage fiasco. The long term decline of the integrated steel producers confronts Northwest Indiana with major challenges.
Low Airline Profits The airline industry’s poor profitability makes carriers reluctant to bear the risks of new routes. Communities now must provide revenue guarantees or programs for risk sharing.
Increasing Price Competition As internet websites have made airline fares increasingly transparent, price has become the leading factor to passenger choice. This may complicate any efforts to charge a fare premium for services operating at Gary.
Volatile Fuel Prices Airline earnings will remain unpredictable because fuel prices will experience wide variations. Fuel hedging will not eliminate the risks.
Maturing Technology and Cost Structures It will become increasingly difficult for the industry to obtain additional cost savings. In the future, fares will not decline as quickly as in the past three
THE GARY/CHICAGO INTERNATIONAL AIRPORT STRATEGIC BUSINESS PLAN FINAL
Landrum & Brown Ch III-7 April 2010
decades. Air traffic will grow at a slower rate than that of recent history. This will reduce the inclination (and ability) of carriers to begin services to new airports.
Convergence of Network and Low Cost Carriers Cost-saving measures by the legacy carriers and the low cost carriers’ desire to attract and retain premium passengers make the two types of operators increasingly similar. This will reduce the scope for developing Gary as either a legacy or low cost carrier airport.
Economic Vulnerability The airline industry will remain vulnerable to periodic crises. There may never be a truly ideal time for promoting the Gary Airport.
Section III-1B Feasibility of Scheduled Passenger Services at Gary
INTRODUCTION
This Section examines the local and regional context for the development of high frequency scheduled passenger services at the Gary Airport. This category of service would offer 3-4 departures daily and would link the Airport to a major hub. The prospects would depend both on the broad industry trends discussed in the previous Section and elements specific to Northwest Indiana and the southern suburbs of Chicago.
Analysis of Market Potential
A high frequency scheduled service, connecting the Gary Airport to a major hub would draw traffic from Northwest Indiana and the southern suburbs of Chicago. This market currently uses the Midway and O’Hare Airports. Over 1.4 million persons live closer to the Gary Airport than to the three competing airports – O’Hare, Midway and South Bend6. Over 448,000 employees work in this area. Despite lower incomes than other parts of Greater Chicago, the area inarguably has the raw quantities to support scheduled services. However, much of the traffic would continue to use Midway and O’Hare even if the Gary Airport had scheduled services. The true potential of the Gary Airport therefore depends on its probable share of the region’s total traffic. In the fall of 2009, the Gary Airport commissioned an analysis of true market potential. The study examined booking patterns of regional travel agencies. It estimated that the Gary-Hammond-Valparaiso-Michigan City market was 2.27 million passengers annually7. This area accounts for 5.56 percent of the total origin-destination passengers for Greater Chicago. A second study estimated that a non-stop service to the Newark Liberty Airport by Continental Airlines could capture up to 192,000 passengers annually8. The Newark potential excluded passengers for which this hub would be overly circuitous.
6 Source: United States Bureau of the Census 7 Gary/Chicago International Airport, Passenger Retention and True Market Size Analysis, Sixel
Consulting Inc. 8 Gary/Chicago International Airport, Commercial Air Service Opportunities, Sixel Consulting Inc.

THE GARY/CHICAGO INTERNATIONAL AIRPORT STRATEGIC BUSINESS PLAN FINAL
Landrum & Brown Ch III-8 April 2010
The Team applied a second approach to estimate the traffic potential of the Gary Airport. Econometric methods were applied to air traffic statistics for a sample of 228 airports in the continental United States and postal code demographic data to estimate national patterns of traffic distribution. It evaluated how distance, fare differentials between competing airports, and socioeconomic data influenced passenger behavior. Appendix B summarizes the procedure. Exhibit III-1 displays the results for the Gary Airport.
Exhibit III-1: Traffic Potential for the Gary Airport
Source: United States Department of Transportation, United States Census Bureau and consultant analysis
Based on this assessment, the Gary Airport would have a potential of 800,000 scheduled passengers if its average fares were 20 percent less than the average for South Bend, Midway and O’Hare. If its fares were 10 percent higher, it could capture a maximum of 539,000 origin-destination passengers yearly. A scheduled service to Gary would operate at low (3-4 times daily) frequencies and use regional jets. The airline would likely require a high fare premium to compensate for the higher costs. The estimate of 539,000 passengers yearly is therefore the most appropriate measure of the Airport’s potential for scheduled services. This volume could support up to four basic scheduled services by regional jets. The sheer population of the region means that such a finding is hardly remarkable. The traffic that the Airport might actually serve would be somewhat less than this potential and would depend on the route structure of the airline. The two analyses used widely different methods and definitions of market potential and while the results are not directly comparable, they are largely consistent. This current analysis supports the Airport’s conclusions that there is a genuine potential for scheduled service. However, the estimate assumes that the Northwest Indiana region will conform to nationwide patterns. The statistical process itself involves many uncertainties in measurement and estimation. Furthermore, market factors such as the increasing size of regional jets, volatile earnings, and the market inertia

THE GARY/CHICAGO INTERNATIONAL AIRPORT STRATEGIC BUSINESS PLAN FINAL
Landrum & Brown Ch III-9 April 2010
favoring Midway and O’Hare could reduce the true potential to below that calculated in the model. Under these conditions, a low value of 100,000 passengers annually is reasonable.
AIR SERVICES AT CITIES WITH MULTIPLE AIRPORTS
Greater Chicago has two airports with scheduled services, O’Hare and Midway. Before its closure in 2003, Meigs Field also accommodated a small commuter service to Springfield. Rockford and South Bend also have scheduled flights. The State of Illinois has proposed building a third high-volume airport at Peotone, IL. The air service issues at cities with multiple airports are very complicated and often controversial. The most important single factor is passenger inertia which tends to concentrate traffic at a single airport. Passengers accustomed to using one airport are usually reluctant to change. Airlines then wish to avoid starting services at a competing airport because of the added costs and the problems of competing with existing flights.
Several forces encourage traffic to disperse to other airports. The primary airport may be congested, or unable to accommodate certain services. Sometimes, a new entrant airline will develop at a secondary airport to avoid head-to-head competition with incumbents9. A secondary airport could offer operating cost advantages, or be especially convenient to certain communities. Governments sometimes impose regulations to distribute traffic among different airports. Examples include the New York La Guardia Perimeter Rule10 and the Wright Amendment that restricts service at the Dallas Love Airport. Many large cities, including Chicago, New York, Los Angeles and London have multiple high volume airports. However, efforts to establish additional scheduled service airports in an urban area are usually frustrating. The airport seeking service may spend a decade or more marketing to marginal carriers, obtaining short-lived services and suffering from extreme traffic volatility. Exhibit III-2 displays recent traffic history at the Stewart Airport north of New York City and the Palmdale Airport northeast of Los Angeles. Both have suffered from carriers entering and subsequently exiting the market. In 2007, Palmdale prepared a $4.6 million incentive package which attracted twice daily regional jet services by United to San Francisco. In December 2008, United ceased all services to Palmdale, one day after expiration of the program. The airports of Mid-America near St. Louis, Hagerstown MD near Baltimore, Wilmington DE, Ellington Airport TX, Worcester MA, Manassas VA, Portsmouth NH, Bridgeport CT, Everett WA and Lancaster PA continue to struggle to attract and retain services. They demonstrate that Gary’s recent history and current difficulties are characteristic of a problem pervasive throughout the industry.
9 In the 1980’s, Midway Airlines chose to establish a hub at its namesake airport. This choice helped
distance the carrier from the United and American hubs at O’Hare. Slot controls also impeded its growth at O’Hare. Previous efforts to establish scheduled flights at Midway had been unsuccessful.
10 This rule restricts La Guardia’s nonstop destinations to cities within a 1,500 mile radius. It helps redistribute long haul traffic to the Kennedy and Newark Liberty airports.

THE GARY/CHICAGO INTERNATIONAL AIRPORT STRATEGIC BUSINESS PLAN FINAL
Landrum & Brown Ch III-10 April 2010
Exhibit III-2: Passenger Traffic at Stewart Airport and Palmdale
0
100,000
200,000
300,000
400,000
500,000
600,000
700,000
800,000
900,000
1,000,000
1990 1991 1992 1993 1994 1995 1996 1997 1998 1999 2000 2001 2002 2003 2004 2005 2006 2007 2008
Pas
senger
s
Stewart Palmdale Source: United States Department of Transportation Databases 28DM, C298
Exhibit III-3: Passenger Traffic at Gary
Source: United States Department of Transportation Databases 28DM, C298

THE GARY/CHICAGO INTERNATIONAL AIRPORT STRATEGIC BUSINESS PLAN FINAL
Landrum & Brown Ch III-11 April 2010
Exhibit III-3 displays recent traffic history at the Gary Airport. The volatility results from the frequent entry and exit of carriers. The traffic pattern is fully typical of a secondary airport attempting to develop scheduled services when competing with large, nearby and well established airports. The volatility has no reflection on the ultimate prospects for the Gary Airport but is indicative of the kinds of fluctuations and frustrations that accompany new market development.
Chicago Airport Capacity
The O’Hare Modernization Program will provide considerably enhanced runway capacity for Chicago’s largest airport. A new terminal on the west side of the Airport will provide additional gate capacity. Despite its limited footprint, the Midway Airport also has unused airside and groundside capacity. From the standpoint of raw facility capacity, the two Chicago airports are positioned to accommodate all immediate needs.
The Bureau of Transportation Statistics of the United States Department of Transportation releases information on airport delays. Exhibit III-4 summarizes the on-time performance of Midway and O’Hare for 2008 and 2009. The rankings are based on the 31 busiest airports.
Exhibit III-4: On-Time Performance at 31 Largest Airports
Source: Bureau of Transportation Statistics
The O’Hare Modernization Program will help alleviate the Airport’s delays. Midway activity will increase as traffic rebounds particularly as Southwest Airlines continues to expand. In 2009, it added nonstop services to New York La Guardia, Minneapolis and Boston. The Airport will likely be a prominent part of any further expansion. However, Midway will likely remain unconstrained through the coming decade. Even should traffic at both Airports exceed planned levels, there will remain an ability to continue increasing throughput. This outlook does not necessary eliminate the need for reliever airports in the Chicago area. Congestion of the established airports is neither necessary nor sufficient to create a need for new airports. The large volumes using each Chicago Airport could result in airlines being unable to secure acceptable gates, excessive delays at peak periods, or certain flights being incompatible with airport operations. Such capacity issues can be identified only through a comprehensive analysis of future airport operations. These conditions mean that the Gary Airport could provide needed capacity for the appropriate niche, despite unused capacity at the two primary airports.

THE GARY/CHICAGO INTERNATIONAL AIRPORT STRATEGIC BUSINESS PLAN FINAL
Landrum & Brown Ch III-12 April 2010
Financial Support and Risk Sharing
The Gary Airport must expect that prospective carriers will require some form of risk sharing and user charge waiver. Airlines will likely perceive Gary as especially risky, since it has no scheduled services and, therefore, no pattern of use by the general public. A risk sharing would require resources beyond those of the Airport or the City of Gary. Since many users of a scheduled service would come from Merrillville, Crown Point, Valparaiso and Hammond, the airline would likely expect them to participate as evidence of broad regional support.
The Airport and the community should not necessarily incentivize every prospective entrant. No general principles can stipulate which services should be supported. However, decision criteria should include:
Most importantly, any evidence that the service would eventually become self-supporting;
The scale of the proposed service, in terms of frequency and capacity;
The degree to which it can contribute to the economic development of Northwest Indiana. A high frequency scheduled service by a major carrier to a large hub could help local businesses and would give the Airport visibility in global distribution systems and widely used websites. It would also help bring visitors to the region. A low frequency service to a leisure destination by a more obscure operator would serve outbound traffic almost exclusively. Its contribution to regional development would be more modest;
The financial health of the carrier;
The degree to which the proposed service complements the current selection at Midway and O’Hare;
The airline’s performance on other routes where it obtained community support;
Other carrier-specific factors, including but not limited to items such as fleet mix, routes, market strategies, etc.
In many instances, carriers receiving financial incentives from an airport have discontinued flights once the support was discontinued. The incentive packages are very risky for the community since any such failure causes a loss of credibility. The Team held interviews with many Northwest Indiana community leaders during the research for this Plan. Most indicated that the failure of past efforts to support scheduled services at Gary has created widespread skepticism about the region’s viability. These past experiences will make it more difficult to support any scheduled initiatives recommended by this Plan. Any incentive should be viewed as a high risk investment. However, the loss of credibility could be more damaging than the loss of the funds. Even if there is a good prospect of success, such investments may be inappropriate for public bodies or regional associations. Financial assistance programs also face complex problems with incumbent airlines that have demonstrated their commitment to the airport and usually received no assistance. They are often concerned that the airport is committing financial

THE GARY/CHICAGO INTERNATIONAL AIRPORT STRATEGIC BUSINESS PLAN FINAL
Landrum & Brown Ch III-13 April 2010
resources for their competitors. Gary, as of November 2009, has no incumbents and therefore there exists a unique opportunity to design an innovative financial incentive/risk sharing program in the event such might be warranted.
High Speed Rail
The Gary Airport may offer opportunities for connections between intercity rail and air transportation. The Norfolk Southern and CSX connect Chicago to the northeast pass immediately north of the Airport. The consolidation of the railroad industry has also led to the virtual abandonment of some trackage near the Airport; these corridors could facilitate construction of dedicated high speed passenger rail services. Although common in Europe, interfaces between airports and intercity rail services have seen limited use in the United States. The Baltimore Washington Thurgood Marshall Airport has a bus link to a busy rail station. Both Amtrak and local commuter trains make frequent stops at the station. Commuter trains bring significant traffic to the airport from Washington. Most of Amtrak’s intercity trains connect to station to Philadelphia, New York and Boston – cities that already have abundant air service. Metra’s North Central suburban trains serve the O’Hare Transfer Station. Metrolink and Amtrak intercity passenger trains serve a station close to the Bob Hope Airport in Burbank CA and Amtrak operates a station close to Milwaukee’s General Mitchell International Airport. In 2004, Amtrak, the Federal Railroad Administration and nine Midwestern states developed the Midwest Regional Rail System Plan. The Plan proposes an ambitious network of high speed rail services for the region, centered on Chicago. In August 2009, the Indiana Department of Transportation (INDOT) applied for funding to upgrade the Norfolk Southern line from the Illinois/Indiana state line to Porter, a distance of 29.3 miles. The project, to cost $71 million, would involve track rehabilitation, improved sidings and upgraded signaling. The line currently serves as Norfolk Southern’s primary gateway to the east, and accommodates Amtrak trains to Grand Rapids, Port Huron, Detroit, Boston, New York and Washington. The improvements will reduce delays on this busy segment. The trains pass through Gary within sight of the Airport, but trains do not stop for passengers. In October 2009, Indiana, Chicago and Ohio jointly applied for funds to develop a 110 mph rail service from Chicago to Toledo and Cleveland. The route would follow a lightly used CSX track, formerly the Chicago-Pittsburgh main line of the Pennsylvania Railroad. The service would include stops at the Gary Airport, Fort Wayne, Defiance, Toledo, Sandusky and other enroute points. The cost for track improvements would be $2.358 billion ($2010) and eight train sets would cost an additional $292.7 million. These projects could accompany a broader plan to optimize Chicago’s passenger and freight rail networks. The Chicago Region Environmental and Transportation Efficiency Program (CREATE) would rationalize trackage, promote railroad efficiency, and reduce conflicts between freight and passenger trains, roads and residential areas. CREATE would indirectly benefit most areas of Greater Chicago, including Gary.

THE GARY/CHICAGO INTERNATIONAL AIRPORT STRATEGIC BUSINESS PLAN FINAL
Landrum & Brown Ch III-14 April 2010
The Gary Airport’s proximity to the proposed Chicago-Cleveland high speed rail corridor would enhance the prospects for an air-rail transfer facility. Many of the Indiana and Ohio communities it would serve have limited or no air passenger services and could benefit from fast intermodal connections at Gary. Among Chicago area airports, Gary is unique in having the aviation facilities and the proximity to a proposed high speed rail corridor to permit intermodal transfers. While air-rail transfers at Gary could become feasible towards the end of the next decade, this opportunity has no immediate relevance to the near-term aviation role of the Gary Airport. Any initiative to obtain passenger services should not depend on the availability of rail connections, nor should development of a Gary Airport High Speed Rail Station be predicated on developing air services. The South Shore Line helps publicize the Gary Airport. Most trains make conditional stops at the Airport. (Exhibit III-5) The trip from the Chicago Millennium Station to the Airport takes 56 minutes and passengers need additional time to transfer from the Airport station to the terminal. Although the station is named after the Airport, it is one mile from the terminal. (Note: The trains do not always stop there – a traveler often must advise the conductor in advance. The service gives the Airport greater visibility, but it is very slow and requires a cab to transfer to the airport. The drive is about 8-10 minutes total. The Blue Line takes 37 minutes to travel from the O’Hare station to Clark and Lake Streets.
Exhibit III-5: The South Shore Line
The Orange line travels from the Midway airport to Clark and Lake in 29 minutes. The longer travel time, lower frequencies and the absence of a shuttle between the station and the Gary Airport terminal make the South Shore link uncompetitive with the other rail-airport shuttles for Chicago passengers. The South Shore line already goes directly to the terminal of the South Bend Airport. This link draws traffic from parts of northwestern Indiana that might otherwise transit the Gary Airport.

THE GARY/CHICAGO INTERNATIONAL AIRPORT STRATEGIC BUSINESS PLAN FINAL
Landrum & Brown Ch III-15 April 2010
The proposal to extend the South Shore Line to the existing passenger terminal could be implemented in the long-term, however, it does not affect the findings of this planning effort.
SUMMARY AND CONCLUSIONS
This section has examined the feasibility of high frequency scheduled passenger services at the Gary Airport. Any such flights would be operated by a well-known and high profile legacy or low cost carrier. The services if established would give the Gary Airport a visibility in the key global distribution systems and the most popular travel websites. The major findings of this section are:
Northwest Indiana could generate sufficient traffic for such a service, even if it charges a modest premium over flights at the Midway and O’Hare airports;
The traffic estimates are consistent with those produced by previous studies commissioned by the Airport, using a different methodology;
The traffic estimates, regardless of how they are developed, are subject to a wide range of uncertainty;
An airport in a metropolitan that is seeking scheduled air services will experience a lengthy period of traffic volatility, unsuccessful attempts and false starts. The recent history at Gary, with several unsuccessful attempts, is consistent with experience elsewhere. It provides no evidence of the Airport’s ultimate future;
Midway and O’Hare airports have sufficient raw capacity to meet the Greater Chicago region’s needs for scheduled services for the foreseeable future. However, traffic peaks, gate availability and other facilitation concerns may create opportunities upon which GYY could capitalize;
To launch a scheduled service operating from Gary, an airline would likely require a fare premium to compensate for the high operating costs of regional jets;
An airline considering the launch of services to Gary will likely require some form of risk sharing or a revenue guarantee. The financial resources required will exceed those of the Airport or the City of Gary;
No such financial program can or will guarantee that the route will be maintained after its conclusion;
A community-based risk sharing or revenue guarantee program should be viewed as a risky and speculative investment. The downside includes losing the funds raised by the community while obtaining no lasting improvement in air services. A more serious risk is that the Airport and its prospects for scheduled services would lose credibility among its stakeholders. The negative fallout could be long lasting and could affect many future initiatives by the Airport; and

THE GARY/CHICAGO INTERNATIONAL AIRPORT STRATEGIC BUSINESS PLAN FINAL
Landrum & Brown Ch III-16 April 2010
High speed rail services and the local commuter rail system could be integrated with the Airport. However, rail-air links have only a minor importance in the United States. The rail projects are still under review and are unlikely to be completed until late in the next decade.
Conclusion The pursuit of High Frequency Scheduled Passenger Services as a core business activity should be deferred.
Section III-1C Feasibility of Low Frequency Scheduled and Charter Services
INTRODUCTION
The previous Section examined the feasibility of high frequency scheduled passenger services at the Gary Airport. This Section examines the prospects for low frequency scheduled services and charter flights. A low frequency scheduled service would operate 1-3 times weekly, often on a seasonal basis. The 100-180 seat aircraft would operate nonstop to major destinations. Charter flights would operate either as single operations or as quasi-scheduled flights with frequencies ranging from monthly to daily.
Analysis of Market Potential
The low frequency scheduled and charter flights would serve very distinct leisure market segments. Most of the passengers would be traveling for similar reasons and following similar itineraries. Sometimes, passengers make bookings through an airline’s corporate website. The flights are usually unavailable on global distribution systems or common third party websites such as Orbitz or Travelocity. Often, passengers purchase all-inclusive vacation packages from tour companies. The tour company signs a long term contract with an airline to operate flights on its behalf and specifies the airport of departure and other specifics. Sometimes, travel wholesalers will purchase large blocks of seats on scheduled flights. Passengers usually make lengthy stays at the destination. Potential operators include Allegiant, Miami Air, Direct Air, Sun Country, Omni Air, Casino Express, USA 3000 and Ryan International. Apple Vacations, Funjet Vacations, Sun Trips, Vacation Express and Worry-Free Vacations are major vacation wholesalers, and contract with the charter airlines.
The major segments of the low frequency scheduled/charter market include:
Domestic flights to casino and leisure destinations such as Las Vegas, Orlando, and Phoenix;
Charter services to vacation destinations in Mexico;
Charter services to the Caribbean;
Low cost flights to destinations in the Mexican states of Durango, San Luis Potosi and Leon Guanajuato. These destinations are of potential interest to Greater Chicago’s large Mexican American community;

THE GARY/CHICAGO INTERNATIONAL AIRPORT STRATEGIC BUSINESS PLAN FINAL
Landrum & Brown Ch III-17 April 2010
Transatlantic charter flights; and
Charter flights for professional sports teams. Transatlantic charter flight activity is modest in the Chicago Region, but generates considerable activity in Florida and Nevada. There is no publicly available information on commercial sports charters. The chartering entities decide which airports to serve, and are very sensitive to operating costs. The marketing process would normally involve negotiations with a few large organizations. Appendices C and D summarize, respectively, recent domestic and international traffic volumes. Exhibit III-6 summarizes estimated recent activity of the major segments.
Exhibit III-6: Estimated Low Frequency Scheduled and Air Charter Activity at Midway and O’Hare
Enplaned and Deplaned Passengers
Source: United States Department of Transportation Databases 28DS and 28IS The volumes for Midway exclude ATA. It operated both scheduled and charter services. Some services had sufficient frequencies that they did not belong in the low frequency scheduled/charter category. The charter flights of predominantly scheduled carriers are difficult to identify in the Department of Transportation (DOT) databases and have been omitted from the above tables. These assumptions impart a conservative bias to the table. Allegiant Airlines operates low frequency scheduled services from secondary airports throughout the nation. The flights go to major leisure destinations such as Las Vegas, Orlando/Sanford and St. Petersburg. In 2009, it began offering Los Angeles as a destination. Allegiant has captured a significant volume of traffic from the Chicago region, as shown in Exhibit III-7.

THE GARY/CHICAGO INTERNATIONAL AIRPORT STRATEGIC BUSINESS PLAN FINAL
Landrum & Brown Ch III-18 April 2010
Exhibit III-7: Allegiant Airlines Passengers, Rockford and South Bend
Source: United States Department of Transportation Databases 28DM
Allegiant carries only limited traffic from O’Hare and Midway despite the substantial traffic. Its behavior may reflect concerns over facilities or airport costs. The South Bend and Rockford statistics suggest that it is diverting some traffic from the two primary airports. Developing Gary for low frequency leisure flights would provide an opportunity to recover regional traffic currently diverting to the South Bend and Rockford airports.
Potential Role for GYY
If low frequency scheduled and charter services could be shifted from the O’Hare and Midway airports to Gary, Gary could be developed as a low cost passenger airport, designed around the needs of leisure passengers making relatively long (one week or more) stays at their destinations. The Airport could accommodate aircraft of 100-180 seats flying at low frequencies. All airport facilities and operations would be constructed and managed to minimize costs. The use agreements would facilitate low frequency and low cost operations. At the outset, the Gary Airport would offload these flights from Midway and O’Hare. While the facilitation concerns are complex, these operations are often inconsistent with activities at either principal airport. The low frequencies can sometimes complicate gate allocation processes. The Chicago Department of Aviation often faces difficult decisions on gate assignments, and in a financially challenging environment, may opt to assign discretional gates to daily services, particularly to high value flights that bring foreign visitors to the Region. The low frequency flights in question would serve primarily outbound passengers, at least at the outset. The passengers of the low frequency scheduled/charter flights may prefer to use long term parking services and may find parking at Midway or O’Hare somewhat expensive. Shifting the leisure-oriented flights to Gary would serve the needs of low fare passengers and enable GYY, as a partner in the regional system to minimize dilution of the yields of the high frequency scheduled operators accruing to O’Hare and Midway.
THE GARY/CHICAGO INTERNATIONAL AIRPORT STRATEGIC BUSINESS PLAN FINAL
Landrum & Brown Ch III-19 April 2010
Of great importance is that a strong low frequency scheduled and charter role for the Gary Airport is unlikely to require financial incentives or risk sharing. The lower operating costs and the high priority given their needs at GYY would already be strong incentives. The Department of Aviation and the tour wholesalers would jointly help reorient the airlines to operate from Gary. In the long term, the Gary Airport could be developed as a low cost gateway to Greater Chicago. Low cost carriers are widely expected to begin transatlantic services eventually. They will be very sensitive to airport fees and charges, and may be reluctant to serve intensely competitive destinations such as O’Hare. The Gary Airport would provide both the low cost environment and the competitive distancing they seek, making Chicago a more attractive destination for this type of service. While the Orlando-Sanford, Phoenix-Williams and Tampa Bay-St. Petersburg airports offer similar circumstances, the Chicago-Gary Airport combination would be unique among major northern cities. The Chicago Department of Aviation could play a crucial role in launching Gary as a low cost passenger airport. It could encourage low frequency scheduled and charter services to shift to Gary from Midway and O’Hare. It could assist in promoting Gary to foreign carriers, as part of its comprehensive product line. Tour companies would also play an important role in encouraging the use of Gary. The low frequency scheduled and charter flights could pose operational and facility issues. Aircraft with high density seating would fly nonstop to destinations such as Las Vegas, Leon and Sanford. The operators tend to use older and retrofitted equipment such as the 757 and early versions of the 737. They will require longer runways than more modern aircraft. A transatlantic carrier would require the ability to operate high density 767-300s nonstop to London with a full payload. Runway length could be a factor. Many flights would require federal inspections facilities, and up to 180 passengers to be cleared. A concern is that volumes would be insufficient to justify a large full-time inspections staff and would require that some inspectors would be cross-utilized from other regional facilities. In pursuit of such a niche, it is essential for an airport to minimize operating costs and user charges for the charter activity. Such initiatives could include:
Making available a low cost terminal that would be open only as needed for flights.
Removal of the jetways, or clearing the terminal aprons of snow only when needed for flights.
Providing the aircraft operator with exclusive use of the terminal.
Modifying the terminal to include services designed for vacation passengers, such as facilities allowing Caribbean-bound passengers to store cold weather clothing, and
Offering free automobile storage to passengers on charter flights. The storage facility would have very strong security, possibly through being developed with the perimeter fence.

THE GARY/CHICAGO INTERNATIONAL AIRPORT STRATEGIC BUSINESS PLAN FINAL
Landrum & Brown Ch III-20 April 2010
Commercial Sports Flights Commercial sports teams make extensive use of aircraft for attending out-of-town games. Some teams own their own aircraft, while others charter from scheduled airlines and charter carriers. Depending on the airport, the flights use either the scheduled terminal or a fixed base operator. The commercial sports teams value a fast, simple and convenient transfer between surface transport and the aircraft, with a limited presence by the press or sports enthusiasts. An airport with minimal airfield and airspace delays can help a team meet a tight schedule, while minimizing travel fatigue. Both Chicago-based and visiting sports teams could benefit from the Gary Airport. Its lack of congestion, low public profile, and simple air-ground transfers could make it an ideal base. In many instances airports, after evaluating the needs of professional sports teams, consider providing facilities designed around the needs of this market segment. This could include meeting space, offices or storage areas. In other instances, an airport might work with local hotels to develop a single, integrated package for visiting teams.
GYY could extend its offerings to include other types of commercial group travel such as symphony orchestras or drama groups. Some celebrities travel in their own aircraft. They may value an airport with specialized services, such as an FBO designed around their needs, or the heightened security that a small airport such as Gary might offer. Unlike most other Chicago airports, Gary has sufficient space and with the planned runway extension, appropriate aeronautical infrastructure so that it can position itself for highly specialized users.
The potential for Gary Airport to accommodate professional athlete, celebrity, and other specialty flights while producing only limited aviation activity, would help solidify the Airport's role as a more valuable partner to O’Hare and Midway as part of the Compact.
SUMMARY AND CONCLUSIONS
The low frequency scheduled and charter market offers a large, distinct traffic segment. In 2007, these mark segments, from the Rockford, O’Hare, Midway, Gary and South Bend airports exceeded half a million passengers. As O’Hare and Midway become increasingly challenged to balance gate allocations for high frequency scheduled services, the Gary Airport could emerge as a viable niche facility. The major factors favoring this development include:
A large traffic volume;
Growth opportunities created by the possible development of international services by low cost carriers;
Proximity to the I84/I94, I90 and I65 highways;
The growing challenges at O’Hare and Midway for low frequency services;

THE GARY/CHICAGO INTERNATIONAL AIRPORT STRATEGIC BUSINESS PLAN FINAL
Landrum & Brown Ch III-21 April 2010
The ability to make the City of Chicago a highly competitive destination for low frequency scheduled and charter services through a unique and specialized operation with high levels of service;
The size of the Gary Airport and its ultimate capacity, which would be sufficient to accommodate any foreseeable growth of this market segment;
An opportunity to recover regional traffic currently diverting to the South Bend and Rockford airports;
The opportunity to work with the City of Chicago Department of Aviation and the tour wholesalers to create an operating environment attractive to the carriers, tour operators and the public, as opposed to a grass roots campaign to encourage public use; and
The absence of any need to promote Airport use through complex and speculative risk sharing and financial incentive programs.
Conclusion The Gary Airport is positioned as part of the Chicago regional aviation market, to be developed as a low cost facility for low frequency scheduled and charter services.
Section III-1D Feasibility for Corporate/General Aviation Services
INTRODUCTION Corporate aviation generates considerable activity at many airports. As a leading center of world commerce, Greater Chicago needs a large, well planned and efficient airport for corporate aviation. This business segment could provide opportunities for Gary. This section examines the feasibility of developing the Gary Airport as a node of corporate aviation.
Current Activity at Gary The Gary Airport has one fixed base operator (“FBO”), the Gary Jet Center. The Center offers maintenance services for both helicopters and fixed-wing aircraft. It manages five corporate aircraft; two Citation I’s, one Citation II and two Beechcraft 400A’s. Both Boeing and NiSource base corporate aircraft at Gary. Boeing’s 737 aircraft has extra fuel tanks that permit nonstop intercontinental flights. General aviation is a complex and heterogeneous industry. It is usually defined as any form of flight operations excluding high volume passenger and cargo services. “General aviation” may include scheduled services. “Corporate aviation” is usually viewed as a subset of the broader general aviation category. The term applies when any company uses its own aircraft to transport senior management.

THE GARY/CHICAGO INTERNATIONAL AIRPORT STRATEGIC BUSINESS PLAN FINAL
Landrum & Brown Ch III-22 April 2010
However, many companies charter aircraft as needed11. Depending on the size of the aircraft, such flights will be counted as either “general aviation” or “commuter/air taxi” operations. “General aviation” may also include a wide range of flight activities, including medivac services, flight schools, traffic law enforcement, resource management, banner towing and recreational flying. The problems of defining corporate aviation and isolating it in publicly available traffic reports complicate any analysis of published statistics. These caveats apply to the data on general aviation at Gary, displayed in Exhibit III-8.
Exhibit III-8: General and Corporate Aviation at Gary
Landings Based Aircraft 1990 42,817 115 1991 20,283 116 1992 20,283 116 1993 20,283 116 1994 16,957 86 1995 21,668 112 1996 22,929 101 1997 23,731 101 1998 26,261 101 1999 20,608 77 2000 20,441 77 2001 19,352 89 2002 21,358 92 2003 20,708 92 2004 21,666 94 2005 20,309 96 2006 20,271 96 2007 18,643 96 2008 17,324 96
Source: Federal Aviation Terminal Area Forecasts, January 2010
Exhibit III-8 shows that Gary’s general aviation activity, as measured by operations and based aircraft has declined since 1990. By the turn of the century, traffic had stabilized at approximately 20,000 landings annually, with slightly over 90 based aircraft. This scale is fully respectable, and amounts to an average of
11 Tax rules have created a close relationship between charter services and private flights operated by
corporations using company-owned aircraft. A corporation purchasing an aircraft must pay a sales tax to the state in which the aircraft is based. An owner that purchasers an aircraft in another state is exempt from such taxes, but must pay an ownership tax to the tax to the state with the base. The owner can be exempted from sales and ownership taxes if the aircraft will be flown for a sufficient time in “commercial” purposes, i.e. chartered to outside parties in arm’s length transactions. To obtain such charters, the owner of the corporate jet will authorize its FBO to solicit charter activity on its behalf. This mechanism creates a symbiotic relationship between the charter service and owned-aircraft flights.

THE GARY/CHICAGO INTERNATIONAL AIRPORT STRATEGIC BUSINESS PLAN FINAL
Landrum & Brown Ch III-23 April 2010
over 100 operations daily. In 2002, the last time a broad economic impact study was conducted, the Airport ranked 8th in Indiana, both for based aircraft and total operations12.
The areas of Greater Chicago and northwestern Indiana have a large number of General Aviation airports. While frequently viewed as a “system,” the term is a misnomer. The airports alternately complement and compete with each other, but the interactions are not sufficiently strong to create an integrated system. Each airport interacts with different airports for different aviation roles and market segments. Midway, O’Hare and, to a lesser extent, South Bend are of greatest relevance to Gary for scheduled services. The airports of Merrillville and Valparaiso serve the immediate needs of Indiana communities. The Lewis University Airport has an important instructional role. The Midway, DuPage, Chicago Executive, Aurora and Waukegan airports are the most important for the Chicago corporate market. Exhibit III-9 shows recent general aviation activity at the major general aviation airports in the Chicago region. The graph includes corporate, recreational, training, and small commercial operations. The FAA statistics provide no means to isolate corporate flying from the broader general aviation total.
Exhibit III-9: General Aviation at Chicago Regional Airports
0
20,000
40,000
60,000
80,000
100,000
120,000
140,000
160,000
1990 1991 1992 1993 1994 1995 1996 1997 1998 1999 2000 2001 2002 2003 2004 2005 2006 2007 2008
GA
Landin
gs
Gary Schaumberg Bolingbrook DuPage Lewis University
Midway O'Hare Chicago Executive Waukegan Aurora
Source: Federal Aviation Administration Terminal Area Forecasts website The graph shows uniformly static or declining general aviation traffic at all Chicago are airports. The largest corporate airports, DuPage and Chicago Executive, show modest traffic peaks in the late 1990s, followed by steep declines. Midway and O’Hare also follow a similar but less dramatic pattern. General aviation trends at Gary, Waukegan and Lewis University were relatively stable while over the 1990-2008 period, total general aviation traffic for the ten airports collectively fell by 31.5 percent.
12 Source: Indiana Department of Transportation Aeronautics Section, Indiana State Aviation System
Plan 2003 Update, (Indianapolis, 2003), pp. 2-16 to 2-18

THE GARY/CHICAGO INTERNATIONAL AIRPORT STRATEGIC BUSINESS PLAN FINAL
Landrum & Brown Ch III-24 April 2010
The number of based aircraft is an important measure of an airport’s general aviation activity. The FAA statistics do not distinguish between private recreational flying, GA commercial services and corporate aviators. However, the region’s corporate flying is focused around the Chicago Executive, DuPage, Midway and Aurora airports. Over 50 corporate jets are based at the Waukegan Airport. Gary hosts a modest corporate activity, but is also the base for many private and recreational aircraft. Exhibit III-10 portrays based General Aviation/Corporate aircraft at the major Chicago airports.
Exhibit III-10: Based General Aviation Aircraft at Chicago Regional Airports
0
50
100
150
200
250
300
350
400
450
500
DuPage ChicagoExecutive
Aurora LewisUniversity
Waukegan Bolingbrook Schaumberg Gary Midway O'Hare
Bas
ed A
ircr
aft
Source: Federal Aviation Administration Terminal Area Forecasts website
The graph indicates that Gary has a very small share of the total based aircraft. Since it hosts many recreational and private aircraft, the raw totals on the chart overstate its importance as a corporate airport. The Gary Airport’s small share of the corporate market suggests that there could be a potential for increased activity. The next section will examine the Greater Chicago region’s need for a corporate aviation facility in the vicinity of Gary. The Regional Context for Corporate Aviation A corporate aviation airport should be located close to large business offices and high income residential areas. Exhibit III-11 shows the locations of the major corporate airports and the headquarters of the largest companies in the area. The Waukegan Airport lies off the northern edge of the map. Appendix E lists the companies, their revenues, and the locations of their head offices.13
13 Large employers in the Chicago area include governments, hospitals and universities. The analysis
of corporate aviation considers only for-profit and privately owned companies.
Schaumburg

THE GARY/CHICAGO INTERNATIONAL AIRPORT STRATEGIC BUSINESS PLAN FINAL
Landrum & Brown Ch III-25 April 2010
Exhibit III-11: Corporate Offices and Airports in Greater Chicago

THE GARY/CHICAGO INTERNATIONAL AIRPORT STRATEGIC BUSINESS PLAN FINAL
Landrum & Brown Ch III-26 April 2010
Exhibit III-11 illustrates key facts about Greater Chicago’s corporate aviation needs:
There are three major clusters of corporate head offices; the northern suburbs of Northbrook/Wilmette/Rolling Meadows, the western suburbs of Naperville/Hinsdale/Willow Brook, and downtown Chicago;
All business clusters are situated close to high income residential areas;
The western business complex is close to the DuPage and Aurora airports;
The northern business complex lies close to the Chicago Executive Airport in Wheeling and the Waukegan Airport;
Although the closest airport to the Loop, Midway requires users to use congested roads, with transit times that increase significantly during rush hour.
The Gary Airport is relatively close to downtown Chicago (but not as close as Midway). The route to Gary uses controlled access highways such as the Chicago Skyway;
Only one Fortune 1000 firm, NiSource, has its headquarters close to the Gary Airport. It is a corporate tenant at the Airport;
The western and northern corporate headquarters complexes are relatively distant from the Gary Airport. The route from the northern area is especially problematic because it requires travel along the congested Kennedy and Dan Ryan Freeways, and through the most densely trafficked areas of Chicago.
The Gary Airport is well-separated from the major complexes of corporate offices and the high income residential areas in terms of both distance and time. However, it is relatively close to the Loop and its convenience to downtown Chicago is arguably is strong selling point.
The Gary Airport’s major competition for Corporate and GA activity is Midway Airport. Midway is even closer to the Loop and has, since the closing of Meigs Airport, become the primary corporate aviation gateway to downtown Chicago. It has three fixed base operators, Signature Flight Support, Atlantic Aviation and Odyssey Aviation. However, the growing passenger traffic at Midway and its small footprint suggest that it can accommodate only limited growth. As its scheduled traffic expands, corporate users will find its runways and airspace increasingly congested. There will be fewer opportunities to expand their installations, and Midway will become a less friendly environment for this segment14.
14 “It wasn’t that long ago that Midway Airport in Chicago was a great General Aviation Airport with
flight schools, flying clubs and so forth. Then, low cost carriers began using the airport, forcing General Aviation flights to go elsewhere.” Statement of Ed Bolen, President and CEO, National Business Aviation Association to the U.S. Senate Committee on Commerce, Science and Transportation; Subcommittee on Aviation Operations, Safety and Security; March 8, 2007. Note: Midway continues to host some flight training activity.

THE GARY/CHICAGO INTERNATIONAL AIRPORT STRATEGIC BUSINESS PLAN FINAL
Landrum & Brown Ch III-27 April 2010
Gary is well positioned to serve corporate aviation demands originating within the Loop, and to play the role once performed by Meigs. Aircraft registration patterns provide further information about the Chicago region’s corporate aviation needs. The Federal Aviation Administration maintains a comprehensive database of aircraft and their owners. The database includes the type of aircraft and the zip code of the owner, but does not show the airport where the aircraft is based.
Exhibit III-12 summarizes an analysis of general aviation aircraft in the Greater Chicago area. The height of the bar for each airport shows the number of aircraft for which that airport is the closest airport to the point of registration. If the point of registration corresponds to the address of the aircraft owner, then the bars show the airports’ potential for based corporate aviation aircraft. The population excludes aircraft of less than four seats, on the assumption that they serve personal and recreational pilots. It also excludes any Indiana aircraft located more than 20 miles from the Gary Airport, on the basis that they would use the Valparaiso and South Bend airports. This exclusion could reduce the number of aircraft attributed to Gary. The analysis does not consider the operational needs of the aircraft; thus the point of registration of an aircraft requiring 6,000’ of runway might be closest to an airport with 5,000’ runways. The number of aircraft shown in Exhibit III-12 is significantly less than that of Exhibit III-10. Exhibit III-9 shows the actual distribution of the full range of general aviation aircraft, not just the corporate fleet.
Exhibit III-12: Number of Corporate Aircraft by Airport Nearest to Place of Registration
0
50
100
150
200
250
Chicag
o Ex
ec.
Midway
Scha
umbu
rg
DuPa
ge
Bolin
gbro
ke
Wau
kega
n
Auro
ra
Lans
ing
Lewis
Univ.
Griffith/Merrillville
Gary
Aircra
ft
Current Gary - Midway Adj.
Source: Federal Aviation Administration and consultant analysis

THE GARY/CHICAGO INTERNATIONAL AIRPORT STRATEGIC BUSINESS PLAN FINAL
Landrum & Brown Ch III-28 April 2010
The graph shows that, of the eleven regional airports considered, Gary has the lowest number of nearby aircraft registrations. However, its longer runway could accommodate additional aircraft, attributed to other airports because of their point of registration. These aircraft may require facilities that are available at Gary but not at the attributed airport. Gary’s future role for corporate aviation depends partly on activity at Midway. Exhibit III-12 shows that Midway has the second highest potential as a corporate airport. Many business aircraft are registered in downtown Chicago and the near-western suburbs. Midway is the closest airport to these areas. The solid red portion of the Gary bar in Exhibit III-12 shows the potential for Gary Airport, should corporate aviation cease at the Midway Airport. This action would more than double the potential at Gary. It would affect the heights of most other bars in the graph. The Gary Airport would rank sixth among the ten remaining airports, exceeded by Chicago Executive, DuPage, Schaumburg, Lansing and Bolingbrook. The latter three airports have less than 4,000’ long runways, and would therefore not be in contention for basing high performance aircraft. Any such reduction at Midway would also favor Gary for visiting aircraft whose passengers are traveling to downtown Chicago. The southern extremities of the Chicago region are not a prime generator of corporate aviation traffic. They lack the concentration of corporate offices and high income residents. The Gary Airport could provide relatively fast access to corporate offices in downtown Chicago. However, Midway now serves as the primary corporate aviation gateway to downtown Chicago. As Midway’s scheduled traffic grows, operators may see advantages in shifting their activity to Gary. TAX ISSUES Taxes on corporate aviation can affect aircraft basing decisions. Different states offer widely varying tax regimes, and corporations will consider tax differences when deciding where to base their aircraft. Tax differences between Illinois and Indiana could have a major impact on Gary’s development as a corporate aviation airport. Aviation taxes are contentious and very complicated. This report does not attempt to evaluate the minutiae of the Illinois and Indiana tax regimes for commercial aviation, and makes no recommendations on changes to tax rules. However, it essential that, in its totality, the Indiana tax regime is comparable to or more favorable than that of Illinois for Gary to become a strong corporate aviation airport. Even small disadvantages could cause owners and economic opportunities, to migrate quickly to competing airports in Illinois. The state and local taxes on business aviation include:
Sales Tax
The state in which an aircraft is purchased can collect a sales tax based on the purchase price. Some states assess no taxes. Most states waive sales taxes for any aircraft that will be based in another state. Depending on the aircraft, the sales tax can exceed $3 million.

THE GARY/CHICAGO INTERNATIONAL AIRPORT STRATEGIC BUSINESS PLAN FINAL
Landrum & Brown Ch III-29 April 2010
Use Taxes
Use taxes are levied by state governments on any out-of-state aircraft purchases. The tax liability is calculated as if the transaction was closed in the state in which the aircraft is based. Tax rates and the criteria for assessing the tax vary widely. Illinois charges a tax of 6.25 percent of price or fair market value. In 2008, Indiana raised its rate from 6 percent to 7 percent.
Indiana and other states exempt any aircraft purchased exclusively to provide public transportation, and operated under FAA Part 135, 125 or 121. Operation under FAA Part 91 is not considered to be public transportation. The owner of a corporate aircraft can obtain an exemption on user taxes through employing the aircraft to generate revenue. The applicable FBO serves as its agent, and markets the use of the aircraft to third parties. If the charter flights generate sufficient revenues, the owner of the aircraft can claim that it serves to generate commercial revenues. As the capital asset of a business, it then becomes exempt from user taxes.
An operator’s ability to obtain an exemption on use taxes depends on its success in selling charter flight time on the aircraft. The criteria for granting the exemption are very complex, and depend on the “fine print” of the state’s tax legislation. To be exempt from the sales or use taxes, an Indiana airplane must generate annual leasing revenue equal to at least 10 percent of the purchase price. If the aircraft cost more than $1 million, the threshold is 7.5 percent.
Some users of the Gary Airport have challenged Indiana’s methodologies for applying use tax exemptions. The issues are very complex. However, if Indiana’s laws and their methods of application are stricter than those of Illinois, the Gary Airport would face a large impediment to growing its corporate aviation role.
A non-resident who bases an aircraft in Indiana for 60 days or more must register with the Indiana Department of Revenue and pay all applicable fees and taxes. The 60 days do not need to be continuous. An Indiana resident who bases an aircraft in another state does not need to follow the Indiana Aircraft Registration law.
Property Taxes
Some municipalities and counties levy annual property taxes on aircraft based within their jurisdictions. These taxes do not apply to Gary or other airports in greater Chicago. Indiana collects an annual excise tax that considers the gross weight, type of power plant and age. Illinois has no counterpart tax.
Proposed Luxury Tax
In 2009, Illinois proposed levying a 5 percent “luxury” tax on any aircraft valued over $500,000. Current state and local use taxes remain.

THE GARY/CHICAGO INTERNATIONAL AIRPORT STRATEGIC BUSINESS PLAN FINAL
Landrum & Brown Ch III-30 April 2010
The Future of Corporate Aviation Exhibit III-9 noted a broad-based decline in general aviation at most airports in the Chicago region. However, many experts believe that corporate aviation has a bright future. This growth will expand the need for a corporate aviation airport in the southern part of the region. As Midway faces increasing scheduled service traffic, its ability to accommodate corporate users will be tested. The Federal Aviation Administration expects total general aviation activity for the U.S. to grow at 1.8 percent annually to 2025. Flight hours of jet and turboprop aircraft will grow at 3.9 percent per year. In 2009, the FAA revised its outlook for Very Light Jets (“VLJ”). It had expected much stronger growth than had materialized. However, sluggish orders and the failure of Eclipse (a producer of VLJs) and DayJet (an operator of Eclipse aircraft, offering a per-seat, on-demand service) suggest a slower growth15. Between 1965 and 1995, the demand for business aircraft grew at a compounded annual rate of 4 percent, primarily through increased deliveries in the United States16. Throughout this period, demand has been very cyclical, displaying large declines in the 1982, 1991 and 2002 recessions. Corporate profits are particularly sensitive to economic conditions. The recession of 2007-2009 has caused a significant decline in business aircraft orders and flying activity. An economic recovery, for which growing evidence appeared in the fourth quarter of 2009, the increasing choice of aircraft (such as very light jets) and manufacturers, and the appearance of new services such as branded charters17 have the capability to boost activity. Bombardier expects the number of units sold to grow at a compounded annual rate of 4 percent over the 2009-2018 period. The Corporate Aviation Perspective and the Gary Airport The Chicago Business Aviation Association assisted the research on Gary’s suitability for corporate aviation. The Association did not provide a single, organization-wide perspective, but was instrumental in arranging interviews. The following discussions express the views of the individual contacts rather than of any organization(s). The Chicago corporate aviation community supports the development of Gary Airport for business aviation. Contacts cited Gary’s proximity to the downtown, and suggested that the Chicago Executive Airport is not convenient for access to the Loop. The interviews with the corporate aviation community revealed concerns with the congestion and the long waits for runway use at Midway. The Gary Airport lies outside the Chicago Tracon airspace, which reduces delay. The business hangars (operated by the FBOs) at Midway were described in unflattering terms. Corporate aviation departments strongly prefer to use dedicated, exclusive-use
15 Source: Federal Aviation Administration, Aerospace Forecasts 2009-2025 16 Bombardier, Business Aircraft Market Forecast 2009, page 7 17 Branded charters involve a high volume purchase of travel. The operators purchase large fleets of
aircraft and use airline scheduling practices to reduce downtime. Bombardier estimates that branded charters comprise between 20 and 30 percent of business jet orders.

THE GARY/CHICAGO INTERNATIONAL AIRPORT STRATEGIC BUSINESS PLAN FINAL
Landrum & Brown Ch III-31 April 2010
facilities, but must use community hangars at Midway. Reactions regarding Gary were mixed. One interviewee suggested that tenants of either the Executive Airport or Midway could be encouraged to relocate to Gary while another expressed considerable skepticism about the Gary Airport. Personal safety in the areas surrounding the Airport was a major concern. Safety concerns and the Gary community image were topics of discussion at most interviews in this project. However, residents and leaders of northwest Indiana have largely come to grips with and have accepted these issues as being more perceptual than real. However residents of more distant areas expressed much stronger negative feelings. Since the businesses that hopefully would develop a presence at Gary are centered in the downtown and the northern and western suburbs, the Airport will need to address concerns regarding personal safety and security concerns constructively and forcefully. The discussions included facilities at Gary. Comments suggested that the Airport required upgraded access roads, and the northern perimeter road and many of the hangars required a facelift. From an aviation perspective, the crosswind runway was considered by some as too short to accommodate corporate jet aircraft. Significantly, the most positive respondents had visited the Gary Airport previously. Those who had not visited Gary were the most concerned about personal safety and security and not surprisingly had the least favorable comments.
One out-of-state company flies executives weekly or twice weekly to a large factory near the Airport and uses the existing FBO. The company had considered using a scheduled service but was reluctant to guarantee the flights, and believed that the proposed King Air service would be suitable. Besides its corporate flights, the company uses the scheduled flights of Southwest Airlines at Midway. The company is fully satisfied with current arrangements.
One respondent referenced the Chicago Vertiport - a helicopter facility proposed in the Illinois Medical District. This area, 2.5 miles from the Chicago central business district, borders the Eisenhower Expressway. The Vertiport could be a double-edged sword - providing expedited access to Chicago’s corporate aviation airports reducing Gary’s major advantage – its relative proximity to the downtown. At the same time however, the Vertiport could also eliminate any surface transportation or safety and security concerns associated with the use of Gary Airport. The interviews reinforced the importance of the Indiana-Illinois tax regimes. While the various taxes and user charges may vary between airports, the Gary Airport must be cost-competitive. Users have a wide choice of airports, and will shift their activities rapidly to those facilities offering the best terms. A resolution of any issues concerning the Indiana use tax is very important to the future of the Gary Airport as a corporate facility. Conclusions and Considerations The current corporate activity at Gary demonstrates that the Airport can serve corporate users. The Boeing Corporation is arguably the most prestigious business tenant that any airport could attract. Gary’s corporate business can certainly expand - attracting new tenants and visiting flights, especially from Midway. The Airport’s advantages include a relative proximity to the Loop, and a total lack of

THE GARY/CHICAGO INTERNATIONAL AIRPORT STRATEGIC BUSINESS PLAN FINAL
Landrum & Brown Ch III-32 April 2010
congestion. On the negative side is the shorter distance from Midway to the downtown area. Another consideration is that most major corporate headquarters are clustered in the downtown and northern and western suburbs which is also where the majority of high income residents live. Although Gary has excellent corporate potential, it is unlikely develop on a scale comparable to the Chicago Executive or DuPage airports. Corporate aviation is therefore unlikely to provide the high volume, high economic spinoff activity that would justify making it the primary focus of the Airport. The Airport should therefore consider corporate aviation as important, but still incidental to other primary lines of business. Corporate aviation is an excellent non-core activity, but cannot serve as the Gary Airport’s primary core business focus. Corporate aviation departments are very sensitive to operating costs. The Gary Airport’s fees, charges and taxes must, in their totality, provide a more cost-effective operating environment than competing Illinois airports. The Airport is close to the Indiana-Illinois state line, and is also very sensitive to any disparities in state tax regimes. The Gary Airport’s greatest strength is its proximity to downtown Chicago. However, the Midway Airport is even closer to downtown, and sees considerable corporate use. As its scheduled traffic grows, the Midway Airport will be forced to make difficult resource allocation decisions on corporate aviation growth. The current surface access to Gary Airport from Interstate 80/94 is well marked, direct and efficient. However, it can be confusing to those not familiar with the area. There are also issues with aesthetics. Access roads do not reinforce the image of a corporate airport designed to serve very affluent and demanding persons. Improved appearances would reflect more favorably on the Airport. Negative perceptions about personal safety could impede development of Gary. The interviews suggest that the residents and businesses most distant from the Airport have the greatest concerns. Regardless of whether the wide range of expressed concerns is reality or perception, image is a challenge and will need to be addressed directly and aggressively. The National Business Aircraft Association conducts regional forums which provide excellent opportunities for networking. There is an opportunity for GYY participate in events such as the Chicago Regional Forum as well as others. A forum at Van Nuys was held on March 11, and one will take place at Teterboro on June 10. The Chicago forum will be held at the Waukegan Airport on September 9, 2010. Participation in the Chicago Area Business Aviation Association could prove beneficial to new business development.
Section III-1E Feasibility of Air Cargo and Logistics There has been a substantial amount of interest expressed in the viability of Gary emerging as a logistics hub focused on air cargo. This has been driven, at least in part, by the central location of the region within the United States, the strength of Chicago as a manufacturing center, and the misconception that O’Hare is out of

THE GARY/CHICAGO INTERNATIONAL AIRPORT STRATEGIC BUSINESS PLAN FINAL
Landrum & Brown Ch III-33 April 2010
capacity. To evaluate the concept it is first necessary to understand the nature of air cargo industry, the primary drivers, and the kinds of businesses that are most involved.
UNDERSTANDING AIR CARGO The Federal Aviation Administration (FAA) defines air cargo as freight and mail. It is also typically categorized as either international or domestic. GYY was planned for and has the aeronautical infrastructure to accommodate domestic passenger and cargo activity. It is important to remember that virtually all air cargo begins and ends its journey on a truck, making the ground distribution system equally critical. The design and location of airports and their cargo facilities must take this into consideration and be capable of accommodating growth in the landside component of the operations commensurate with growth on the airside.
Freight forwarders who effectively function as booking links between manufacturers, shippers and logistics operations, and the non-integrated carriers control about 70 percent of international cargo. Typically, to keep costs down, they book blocks of space with carriers in the belly of passenger aircraft. The other 30 percent is carried by the integrators such as FedEx and UPS who will accept shipments directly from shippers, and upon occasion will take bookings from a forwarder. On international shipments, integrators may compete directly with airline/forwarder alliances for business but overnight delivery does not necessarily play as vital a role in international shipping. Forwarders and shippers will also utilize freighters operated either independently or by the passenger carriers. In certain instances, carriers may lease freighter aircraft from a company such as Atlas or Gemini, but the numbers of such operations and their impact on airport handling requirements and infrastructure are not typically significant. One of the keys to successful international goods movement is clearance by the federal agencies. Easy and timely access for inspection is vital. If the federal agencies do not have the staffing to accommodate timely inspection and clearance, the best facilities and location in the world will not move international cargo effectively.
Domestic cargo differs dramatically from international. It is not related to Customs clearance, is dominated by the integrators, with very little influence by forwarders, has an enormous trucking component, and creates substantial demands on an airport’s aeronautical infrastructure. Integrators carry 90 percent of domestic cargo. Competition among the integrated carriers is driven by guaranteed overnight (or other time definite) delivery to almost any location. Integrators operate with a very tight shipping window to their mid-west distribution hubs; this creates a concentration of ground traffic within a region as trucks bring the packages to the airport at the last possible minute. Large volumes of domestic freight also move in the bellies of passenger aircraft. The goods are not typically as time sensitive, and arrive at the cargo facilities (both origin and destination) in smaller concentrations, but with much greater frequency, and without the well-defined shipping windows. In combination, these segments of the cargo business create pressure on airports to provide more a) terminal capacity and proximate aircraft apron, b) expanded warehousing, Ground Service Equipment (GSE), and office space, c) a more extensive network of restricted service roads, d) more remote apron and accessing
THE GARY/CHICAGO INTERNATIONAL AIRPORT STRATEGIC BUSINESS PLAN FINAL
Landrum & Brown Ch III-34 April 2010
taxiways, e) building frontage, customer and employee parking, and f) improved roadway access and geometry. Very few airports are positioned to deal effectively with the future requirements of both the passenger and cargo segments of their business. In an ideal environment, space for an on-airport cargo community would be expansive enough to include a full complement of the supporting and ancillary businesses that are important components of an air cargo operation. Geographic proximity to the carriers allows these other businesses to realize operational and financial benefits, while providing higher levels of service to their customers.
Critical Cargo Variables The goods movement industry is experiencing dramatic changes. Factors such as increased reliance on speed, e-commerce, and high speed logistics require that individual airports continually examine their business goals, market priorities, physical capacity, and the compatibility of the three in meeting the challenges of accelerating growth. Ten critical variables of goods movement by air are described below. All of these variables impact GYY to some degree. Although some of the variables are not air cargo specific, they reflect issues impacting air cargo capabilities at the Airport and its long-term compatibility with industry needs.
Growth in the passenger markets. Global forecasts indicate that the world passenger market could more than double over the next 20 years. Airports will be challenged to provide the resources to achieve targeted levels of service for both passenger and cargo growth. In instances where the capacity of an airport is exhausted, there will be pressure to shift the most easily relocated business segment – in most cases, cargo – to the nearest, most viable alternatives. The lack of scheduled passenger operations at GYY eliminates a key element of cargo development.
Growth in the cargo markets. Global forecasts call for a tripling of air cargo volumes, within 20 years. The corollary to this air cargo growth is the roadway access and truck parking spurred by the growth and necessary to prevent massive queuing, maneuvering, and loading problems. When combined with passenger growth, the constraints of the land envelope warrant business strategies, lease management practices, and physical planning that will optimize airport property and its ability to serve customers. The opportunities at Gary are severely limited by the available and growing capacity at ORD where interlining availability and volume discounts available through consolidation outweigh potential lower fees.
Key shipping windows. Two of the great myths in the industry are that air cargo aircraft operate around the clock, or only at night; this is not the case. Integrators typically schedule departures on the west coast between 8 and 10 pm to reach mid-west sortation facilities by midnight. While not as time specific as the integrated carriers, freight carriers must also operate out of shipping windows to allow for a) coordinated pickup and delivery at local and regional destinations, b) integration of transshipments, and c) restrictive overseas airport and government controls. The result is a clustering of operations and aircraft parking requirements. This causes a peaking of demand for aircraft parking on a daily basis. The location of Gary in the Central U.S. would accommodate effective distribution.

THE GARY/CHICAGO INTERNATIONAL AIRPORT STRATEGIC BUSINESS PLAN FINAL
Landrum & Brown Ch III-35 April 2010
Aircraft parking. Reliability of delivery and cost as opposed to overnight delivery have accelerated the utilization of freighter traffic in general, and integrated carrier traffic in particular. While this trend impacts airports differently, GYY has only limited ramp available for freighter aircraft parking. The growth of truck substitution. One of the most difficult variables to evaluate in air cargo is the truck substitution component. Many air cargo facilities are operating to a great extent as truck terminals, yet requirements to report truck-to-truck traffic are scarce. Airports cannot realistically evaluate comprehensive space demands, effectively plan for and phase new development, or fully capture business opportunities without careful consideration of the truck substitution component. Additionally, as truck substitution continues to play a greater role, airports must address the fact that an air cargo facility is an intermodal facility, and must be designed to accommodate trucks as well as aircraft. The primary implication for Gary is a shrinking market segment making penetration more difficult.
E-Commerce. Many of the shipments generated by home shopping networks, catalogue shopping, and most recently, e-commerce, requires specialized facilities for efficient processing and expedited delivery. Accordingly, these shipments have a greater tendency to move by air or expedited trucking. This means that the bulk of the activity will be concentrated where existing integrator operations are present. This means that the traffic will be directed towards O’Hare and Rockford.
Manufacturing creep. Manufacturing facilities, particularly those focused on time sensitive products, in response to demand for faster delivery are moving closer and/or are locating key warehouse facilities to airports, or onto airports. This reduces inventory, trucking costs, and staffing requirements, while increasing levels of customer service. The significant and growing amount of state-of-the-art distribution center facilities in proximity to an airport makes this trend important. Gary has some property available on airport as well as in the areas surrounding it. In the event a manufacturer of air eligible products were to locate there, it could create the possibility of limited cargo activity. The likelihood however is that the business would use existing service available through O’Hare.
High-speed logistics. The changes in manufacturing and shipping are giving rise to the design of new high-speed logistics facilities that can effectively integrate a number of diverse industry segments. The facilities can handle throughput and sortation, kitting (minor assembly), and returns, as well as traditional operations. These value added distribution centers can be major job generators, in some cases, approaching the employment levels of traditional manufacturing operations. While the size of these buildings (often exceeding 500,000 square feet) makes them unlikely to occur on-airport, they can be accommodated within 15 miles of the airport. Their development however would most typically be undertaken at facilities where high levels of commercial lift already exist.
Building technology. As a result of the escalating cost of storing goods, and the shortage of on-airport property, modern on-airport cargo facilities are being designed to emphasize speed of transition rather than warehousing. The result is taller buildings to handle highly mechanized equipment with sufficient depth and adequate airside and landside doors. It should be noted, however that not every

THE GARY/CHICAGO INTERNATIONAL AIRPORT STRATEGIC BUSINESS PLAN FINAL
Landrum & Brown Ch III-36 April 2010
air cargo operation requires sophisticated equipment. The demand is a function of the size of the operation, the nature of the cargo, the scheduling needs of the shippers and forwarders, and budget. Indeed, some of the interviews conducted by the team found that freight forwarders and brokers may not even use a racking system within their warehouses because the shipments move so quickly through their facilities. However, new security requirements may necessitate facility modifications that could reduce existing floor capacity and require more internal storage. There are no cargo facilities at GYY.
Aircraft technology. Modern freighters are more fuel-efficient, have greater range, and carry larger payloads. This trend will continue the evolution of global shipping patterns. The ability of new aircraft to over-fly traditional points of entry on international routes, as well as the inability of many airports to accommodate the new aircraft will affect the selection of origin and destination airports. GYY even with the lengthened runway will not be able to accommodate international freighters.
Air Cargo Success Factors
As the industry undergoes major changes, the basic ingredients of an airport’s successful air cargo operation have remained essentially intact. These factors have played major roles in the success of cargo operations to date. However, as airports mature, regional growth and evolving goods movement dynamics may negatively impact the airport’s ability to meet the needs of the air cargo industry, and eventually force shifts in operations to alternate facilities. In looking at these factors, there are substantial challenges pertaining specifically to GYY even though the attractiveness of the region for air cargo remains strong. Substantial passenger market - both O&D and transfers. The Airport has, as one of its top priorities, attracting passenger traffic. Given the fact that passenger aircraft carry cargo it is likely that a small amount of cargo activity may develop but not at any significant level, and not in the near-term. Nevertheless, positioning the Airport in any way at all will generate some related activity and jobs.
Large regional consuming and producing marketplace. The large and growing population of the region and the proximity of Chicago, along with the City’s and State’s interest in logistics and the related jobs generate relatively large volumes of inbound and outbound freight. This cargo however is handled adequately by O’Hare and Rockford and there is little need for additional supporting cargo facilities in the region.
Substantial lift to a large number of markets. A substantial number of operations to global markets and sufficient volumes of cargo to each destination enables shippers to consolidate shipments thus reducing overall shipping rates. Cargo operations require a large and diverse user universe to enable efficient interlining between passenger and freighter aircraft with a resultant global and domestic outreach. The strength and size of the ORD operations is a major attraction for cargo carriers.

THE GARY/CHICAGO INTERNATIONAL AIRPORT STRATEGIC BUSINESS PLAN FINAL
Landrum & Brown Ch III-37 April 2010
Supporting business infrastructure of freight forwarders, customs brokers, and trucking. While integrated carriers control nearly 90 percent of domestic cargo shipments, freight forwarders and customs brokers control approximately 70 percent of the international market. Typically these segments of the industry cluster on or near the transportation facility they wish to utilize. This community is critical to the growth of international cargo. Substantial numbers of these businesses are clustered around O’Hare. While much of their work can be done electronically (making physical location less critical) most of these businesses have facilities near ORD. Further, their focus is consolidation and resultant volume discounts which can only be achieved regionally at ORD.
Roadway infrastructure providing ready access to the airport and to an effective highway distribution system. One of the side effects of air cargo growth is a corresponding increase in trucking traffic and its impact on regional traffic patterns and flows. An original determinant of air cargo success at ORD was the excellent regional roadway infrastructure and the links it provided between the airport and a highway distribution system. As business has increased so has traffic around O’Hare making Gary from a ground movement perspective, more attractive. Nevertheless, congestion aside, access to and from Gary could be problematic for tractor-trailers and connection to the Interstate system is more difficult then would typically be desirable.
Physical capacity to accommodate growth. The most obvious criterion for the future success of an air cargo program is the physical capacity to accommodate the airside and landside requirements of both tenants and users. This includes aeronautical infrastructure, physical facilities, landside parking and queuing, and roadway geometry. In the case of Gary, even with the extended runway, there is no potential for international cargo activity. The extension would allow for domestic goods movement and there is property available to develop cargo facilities for carriers as well as facilities for supporting businesses and services. Efforts to market and develop this element of aviation are limited by the lack of any existing cargo facilities.
Geographic positioning to serve effectively as a major cargo center with clear advantages over potential competitors. GYY, given its ideal positioning is the Central United States is well situated – from that perspective - to serve cargo markets. However, this central location is shared with ORD, as well as Indianapolis, Dayton, Wilmington, Columbus, and Cincinnati, all of which have superior infrastructure, facilities, and access.
Bilateral and Open Skies Agreements. The use of U.S. airports by foreign flag carriers is based on international trade agreements which formally grant nations and carriers access. It is unlikely that an international carrier would petition for service to GYY given the operational advantages of ORD.
Air Cargo Business Partners A successful air cargo operation is more than a carrier operation. It is predicated upon the efficient interaction of a number of businesses with different operating requirements and facility needs. These firms have different levels of involvement based on the nature of the cargo and the markets through which it moves. In an

THE GARY/CHICAGO INTERNATIONAL AIRPORT STRATEGIC BUSINESS PLAN FINAL
Landrum & Brown Ch III-38 April 2010
ideal environment, most of these operations would be co-located on the airport, creating an efficient, integrated, air cargo community. Operating costs are lower, economies of scale can be achieved, and international goods can be cleared faster and with fewer problems. The realities of limited on airport space and higher leasing costs have required businesses to situate operations that do not require ramp access off airport.
Freight Forwarders are exporters that serve as travel agents for a shipper’s freight. Simply stated, if a shipper wants to send 1,000 pairs of shoes to Borneo, or in some instances, Brooklyn, he will call a forwarder. These firms control the routing of about 70 percent of the international freight, and about ten percent of the domestic. A forwarder facility will typically involve a small amount of office space and about 5,000 square feet of warehouse, although some larger forwarder operations may require as much as 100,000 square feet. Still, they do not need to be on the airport nor are they usually prepared to pay higher airport leasing rates. These firms tend to cluster around gateway facilities such as ORD.
Customs Brokers facilitate the clearance of international cargo through local federal customs. Like forwarders they usually maintain a small amount of office space but typically have little need for warehouse preferring instead to form alliances with trucking companies that handle any large storage requirements. They do not need to be on airport and are handling most of their business with the federal clearance agencies electronically. Like their forwarder counterparts, the customs brokers are located off airport and are found at gateway airports (even though much of their work can be done electronically).
Federal Agencies have dual responsibility for interdiction and facilitation. The bulk of the cargo activity involves U.S. Customs and Border Protection. The law enforcement agencies at the federal, state, and local levels all provide assistance as required. At an airport with a substantial international presence, it is absolutely critical that these agencies have ready access to the cargo. A centralized facility where all the agencies are located together is ideal. Such an arrangement allows for rapid coordination on clearance issues, and minimizes ground traffic by shippers and consignees. One of the primary concerns for these agencies is the ability to allocate staff and the demand for personnel at O’Hare is problematic for the allocation of additional staff to the region.
Consolidators work with freight forwarders providing assembly points for cargo prior to its delivery to a carrier on the airport. Consolidation is critical in that it creates shipping economies of scale and reduces the shipping cost per pound to specific destinations. The ability to consolidate shipments and the frequency of flights to such a broad range of destinations are important to an airport’s continued success. Consolidators do not have to be on the airport but as with forwarders and brokers, relatively easy access is important to allow for delivery of the cargo to the carriers on the airport.
Container Freight Stations are typically located off airport and handle the breakdown of inbound international freight. Their function is similar to a consolidator in that they provide relatively inexpensive space for redistribution, to a

THE GARY/CHICAGO INTERNATIONAL AIRPORT STRATEGIC BUSINESS PLAN FINAL
Landrum & Brown Ch III-39 April 2010
number of clients. In many instances, these operations are bonded to allow for the rapid movement of inbound cargo through the customs process. In the absence of freight activity, there are no such facilities at Gary.
Freighter Airlines are those carriers that specialize in heavy freight as opposed to small packages or mail. Polar, Cargolux, and NCA are examples of such carriers. Recently, throughout the industry, there has been substantial growth in “wet leases.” This kind of leasing arrangement provides carriers with an option of leasing aircraft, crew, maintenance, and insurance (ACMI) through such carriers as Atlas and Gemini. These carriers typically utilize wide-body aircraft, which because of runway length are precluded from using GYY.
Integrators are those carriers that operate a trucking component as well as their aircraft and offer point-to-point as opposed to airport-to-airport delivery. They specialize in overnight express. Examples are FedEx and UPS. Their business is driven by time definite delivery, and proximity to the regional business districts is important to their operation. Depending on their level of activity at an airport, they tend to require substantial amounts of aircraft parking although they may not require a large amount of building space. They also frequently require large amounts of truck parking, and because they are labor intensive, employee parking.
United Parcel Service (UPS)
Based out of Louisville, Kentucky, UPS is one of the leading global logistics carriers operating approximately 210 aircraft. Currently, UPS operates a massive road and air network with their main hub, the center of package consolidation, in Louisville, Kentucky. Their business model includes the creation and operation of geographically dispersed mini-hubs designed to eliminate the need to move everything through Louisville. These facilities include Philadelphia, PA, Dallas, TX, Ontario, CA, Columbia, SC, Hartford, CT, and Rockford, IL with the latter minimizing regional demand and operating requirements around Gary. Because of the heavy trucking concentration on domestic goods movement larger ground service hubs are planned for the future (depending on how the economic recovery proceeds).
UPS has the revenues and existing cargo volumes to meet the financial challenges which are inevitably faced when entering a new market. Once established in a city and cargo operations begin, the city and region are connected to the entire network, creating the possibility for other types of commerce to emerge. Locations in this hub are determined based on statistical analyses of regionally concentrated cargo, distance and time to large city-centers, and proximity to other operational centers. From that point, more detailed analyses include available airport infrastructure and the regional roadway system including critical points of access and egress. Additional considerations include the presence of a Foreign Trade Zone, operating costs and airport fees, and uncongested ground and air space.
FedEx
FedEx is the largest integrator in the world: based out of Memphis, TN the carrier operates a fleet of 658 aircraft along with a substantial trucking operation in the ground division. The entire network is divided into regions designed to feed the largest hub in Memphis, TN. Within the upper Midwest area, FedEx is heavily

THE GARY/CHICAGO INTERNATIONAL AIRPORT STRATEGIC BUSINESS PLAN FINAL
Landrum & Brown Ch III-40 April 2010
invested at two airports, Chicago O’Hare and Indianapolis, the latter of which is the carrier’s second largest hub. No expansion or addition of new facilities is being considered for the air operations of FedEx. While the carrier typically does not share criteria involved in their site selection process, they do not vary substantially from those of UPS.
Part 135 Operators
An alternative to the large integrator aircraft and other larger operations is the use of feeder aircraft. These carriers typically utilize smaller aircraft such as the Learjet 35A, Chieftain, Grand Caravan, require shorter runways, less ramp space and standard cargo handling equipment and focus on providing transport of cargo weighing 3,000 lbs. or less. These smaller general aviation aircraft move cargo for consolidation to larger airports. For this study, 12 Part 135 operators were contacted- half responded and one company participated extensively due to its business contracts with both integrators.
A Part 135 Operator will often contract with a business to carry cargo, usually to connect with the operations of a major integrator like UPS and FedEx. In other cases they directly support industries that require shipping urgent small volumes with short notice, like banks and automotive manufacturers. However, as a result of the economic downturn such cargo volumes have fallen reducing demand for smaller flights. An example of one of the better known carriers is Ameriflight which primarily works on a contract basis for the large cargo integrators - UPS and to a lesser extent FedEx.
GYY has the infrastructure to handle the smaller aircraft and their related operations. The Gary region is home to a number of manufacturers and distributor who might be interested in the potential use of part 135 contractors.
Combination Carriers, for purposes of this report, are defined as airlines that fly freighters and passenger aircraft. These carriers prefer to process both belly and freighter cargo in the same facility when possible. In rare instances, a carrier will split their belly cargo and freighter operations between airports when capacity becomes a factor. These carriers typically fly wide-body aircraft and are not a target for Gary development efforts.
Cargo Handling Companies operate on a contract basis providing service to carriers on the apron where they load and unload the aircraft and/or in the warehouse where they assemble or breakdown the freight. Their business is best conducted on the airport. Their revenue is generated on a fee for services basis, which can range from 2.5 to 6 cents per pound of cargo handled. They would only be interested in GYY if a cargo carrier were present.
Trucking Companies make up the ground component of air cargo operations. While these companies rarely lease space on an airport, it is very important that air cargo facilities be designed to accommodate trucking, including frontage, access, and roadway geometry. In the absence of an air operation, the central location of Gary may lend itself to the possible development of a regional trucking center where products can be consolidated for distribution.

THE GARY/CHICAGO INTERNATIONAL AIRPORT STRATEGIC BUSINESS PLAN FINAL
Landrum & Brown Ch III-41 April 2010
More than thirty trucking companies in the surrounding region both LTL (Less than Load – a truck that is not fully loaded) and full container and indicated strong concerns regarding the roadway and highway system to/from Gary International. The perception is that the Department of Transportation is constantly doing roadwork on I-80 and I-94 and has been for years with no apparent end in sight. The other unsettling information was that the highways that are in good condition are “toll” highways whose utilization drives costs up even more.
On another note, several of the trucking companies contacted stated that they were exploring consolidation opportunities. Depending on how those discussions evolve it could increase the potential for a regional center in Gary.
Third Party Logistics Providers handle outsourced transportation and logistics for companies with regard to part or upon occasion all of their supply chain management functions. These firms specialize in integrated operations, warehousing and transportation services that can be customized to customers needs based on market conditions and delivery service requirements for products and materials. Many of the larger freight forwarders such as Panalpina, Keuhne & Nagel, Hellmann Worldwide Logistics, and Schenkers International also serve third party logistics providers. They reduce costs to a manufacturer by eliminating the traffic department whose functions are outsourced to the forwarder.
More than twenty-five freight forwarders and related logistics companies of varying sizes were contacted regarding the possible operation of a third party logistics function out of GYY: the feedback that was obtained is consistent with other elements of the due diligence and also with each other.
SUMMARY The general perception is that GYY has a positive geographical location in the Central United States but the proximity to Chicago brings both opportunities and challenges. A substantial positive is the clustering of hundreds of manufacturing companies in the region clearly reflecting the value of the region to a logistics operation. At the same time there is a universally expressed concern regarding the viability of the highway system. This perception whether valid or not is a deterrent to growing a logistics operation in Gary. The overall results of the assessment of the air cargo potential indicate, at best, only a very limited potential over the near-term. The lack of appropriate runway length for international traffic, the existing presence of integrator operations at other airports within the region, competition from other airports for cargo operations, and most of all the presence of an established business and operating structure at ORD make a regularly scheduled air cargo operation extremely unlikely in the near-term. Further, the ground elements of goods movement perceive the surrounding roadway system from both a state-of-repair and connectivity as problematic. Nevertheless, the positive elements of a central U.S. location, the low-cost of trucking, the population concentration, regional labor force, and available property for logistics development and operations offer the potential for a truck-oriented
THE GARY/CHICAGO INTERNATIONAL AIRPORT STRATEGIC BUSINESS PLAN FINAL
Landrum & Brown Ch III-42 April 2010
regional consolidation and distribution center. The extension of Foreign Trade Zone status to a logistics operation further broadens the potential and could stimulate interest from both the Ports of Indiana, and the CN Railroad.
Section III-1F Maintenance and Other Supporting Services
Maintenance and refurbishing activities are not typically aviation elements that can be marketed with any real expectation of success. Major commercial maintenance activity is typically clustered around the hubs of a carrier’s operation in order to reduce ferry time (transportation of an empty aircraft, i.e. a non-revenue flight) for the aircraft and crew. After passenger and cargo operations, aircraft maintenance is the third major component of commercial aviation. The maintenance, repair and overhaul of aircraft (the MRO Market) began in the 1970’s when airlines, seeking to increase productivity and revenues, began contracting technicians that were idle between in-house jobs, to conduct repairs. Today the MRO industry in North America is estimated at approximately $8.2 billion, with revenues forecast to increase to over $10 billion in the next several years. The MRO industry is comprised of six core market segments. These include:
Major airlines, regional airlines, air taxi/charter services and commercial jet transport
Independent repair and overhaul station
In-house corporate flight departments
Military/government repair facilities
FBO’s (Fixed base operators independent full service vendors offering services typically focused on general aviation), and
Flight/aircraft mechanic schools and training facilities
The commercial jet MRO market is estimated at more than $55 billion worldwide. Analysts predict steady growth in this business segment over the next several years (2.7 percent through 2012) which would put the MRO market over $61 billion serving a worldwide fleet of aircraft estimated at more than 21,500. The repair operations are divided into four segments:
D Checks - Heavy maintenance visits and major modifications and retrofits
C Checks - Engine overhaul
B Checks - Component overhaul
A Checks - Regular line maintenance The required level of maintenance and repair work is dependent on several factors, including the number of hours the aircraft has flown, the number of days since its last inspection, and scheduled rotating cycles of operation. Interestingly, the number of aircraft permanently retired to the deserts of California and Arizona is

THE GARY/CHICAGO INTERNATIONAL AIRPORT STRATEGIC BUSINESS PLAN FINAL
Landrum & Brown Ch III-43 April 2010
also a determining factor of maintenance activity. Many of these planes are permanently parked, to become a source of spare parts, or alternatively designated for shipment to lesser developed countries. The newer, more efficient replacement aircraft entering the US market are designed with modern modifications requiring fewer short-term repairs. There are several broad factors that argue against pursuing commercial MRO operations at GYY to support ORD and MDW.
1. The presence of substantial and under-utilized facilities at ORD. 2. The cost to ferry (fly empty aircraft) to GYY where there is no commercial
market for outbound use of the aircraft. 3. The cost of regional labor as opposed to costs in other areas of the country. 4. The weather extremes which exacerbate heating and cooling costs for the
facilities. Given the limited probability of a scheduled passenger operation at Gary in the next 10 years, the creation of a commercial maintenance facility is unlikely. Therefore, of the six core MRO market segments, only two - FBO’s and flight/aircraft mechanic schools and training facilities are areas that Gary should consider pursuing. Smaller maintenance operations have their own operating requirements and business parameters. Interviews were conducted with aircraft maintenance and companies to determine the selection criteria with which they are most typically concerned, and on which they will most often predicate selection of an Airport site.
Generic Requirements
In climates where there are seasonal weather changes and shifts in temperature, hangars with heating.
Adequate power supply at the hangars to run appliances, tools, equipment and power units for the aircraft.
Runway with a minimum length of 5,000 feet. 6,000 feet is preferable for a client base of executive aircraft.
Facilities (hangars, offices, etc) available at affordable prices that can translate into reasonable rates for customers.
No local or state environmental restrictions for refurbishing, painting of aircraft, etc.
Available apron capacity and strength to park and handle a full range of executive aircraft and the equipment necessary to service them.
The possibility of being awarded the concession to sell fuel on an exclusive basis. This was considered extremely important as a difference maker in the operations profitability.
ILS capability is very desirable to insure operational reliability.

THE GARY/CHICAGO INTERNATIONAL AIRPORT STRATEGIC BUSINESS PLAN FINAL
Landrum & Brown Ch III-44 April 2010
Regional Requirements
The availability of supporting ground transportation companies to provide taxi and limousine service, and rental car support.
The availability of economic incentives such as tax credits, employee training, and other tax incentives.
Assistance from the local, state, federal government in establishing (to include necessary permitting) and marketing the business.
A location that has the ability to attract as many Fortune 500 companies as possible.
Proximate amenities to include lodging, dining, and medical services.
Airport and regional assistance in coordination with the appropriate FAA offices to ensure expedited assistance.
The availability of a large labor pool of qualified personnel and technicians.
Operational support services such as trucking.
Regional suppliers of small tools and equipment appropriate to any typical maintenance operation.
Available ground/air shipping companies such as FedEx, UPS, and/or DHL to ship and receive overnight service for urgent parts and supplies.
User Facilities
Fueling facilities open for business at least from 7 a.m. to 9 p.m. seven days a week.
Available hangar space with leasing options to at least 20,000 square feet.
Facilities rates and charges should be cheaper than or at the least competitive with surrounding airports of same size.
The Positives of Gary
Offers proximity to Chicago.
Potential lower operating costs result in less expensive pricing for customers.
Potentially lower labor costs and regional cost of living.
Centralized location proximate to a major market.
No congestion either airside or landside.
Low cost of operating overhead.
Available aeronautical infrastructure. The Negatives of Gary
A large number of potential competitors all within a 50 mile radius.
Limited supporting services such as avionics and on-site amenities.
Cost of relocation and set up.

THE GARY/CHICAGO INTERNATIONAL AIRPORT STRATEGIC BUSINESS PLAN FINAL
Landrum & Brown Ch III-45 April 2010
No available existing facilities.
Difficulty in attracting new, qualified employees.
Difficulty in attracting new customers from surrounding area.
Twelve companies nationwide were contacted. All are considered known and brand names in the industry and are seeking new expansion opportunities. Discussions explored potential interest in serving the regional market with Fixed Based Operations (FBO) or an alternative use that would specifically address the needs of general aviation and/or corporate aircraft.
SUMMARY GYY is located near a major market – Chicago - and therefore has access to an extensive potential clientele needing airport services. At the same time, many other regional GA airports have adequate aeronautical infrastructure, if not the existing facilities to compete for market share. To attract a prospective MRO operation in such an environment, virtually every interviewee indicated that it will be necessary to differentiate the Airport by having in place, in addition to the physical requirements, a set of incentives that will help offset initial start-up costs to include such items as marketing expenses, facility rental rebates, and modified ground rents. The provision of incentives is fairly common practice and can be structured in such a way that there is minimal risk to the Airport and at the same time fair to private partners. Considerations It should be noted that of the business development alternatives, a focus on light aircraft maintenance has the most probable likelihood of some level of success. The initiation of such a strategy can be done independently by the Airport or in conjunction with the existing FBO. In either case, discussions with the FBO should take place prior to any commitment of staff or funding to the effort. This is essential to determine whether any marketing intelligence is available to further prioritize the effort. Further, in the event that affirming due diligence does exist, it will be possible to assess the viability of a public private partnership. It will also help to specifically identify the type and range of services that could be added.
Subsequent discussions with the potential operators of an MRO type business will shape at a macro level the kinds of special considerations that might be required to attract them to Gary.
Based on a realistic assessment of the budget, potential revenue targets should be set that can be realistically achieved in conjunction with the inception of an incentive program.
The Airport must explore and identify a set of incentives that could be included in an initial incentive program provided by the Airport, regional economic development entities, local government and other key regional businesses.

THE GARY/CHICAGO INTERNATIONAL AIRPORT STRATEGIC BUSINESS PLAN FINAL
Landrum & Brown Ch III-46 April 2010
With an incentive plan in hand, detailed marketing presentations specifically designed for targeted business service combinations most likely to be attracted to GYY should be developed.
The need for MRO services is obviously critical to the aviation industry. While Gary has a strong General Aviation and Corporate base of activity, and supporting aeronautical infrastructure, the level of competition in the region, and the depressed general aviation market do not warrant a top priority for marketing in this area.
Section III-1G Alternative Aviation Uses
PART 135 HELICOPTER OPERATORS OVERVIEW There is a trend in the Fixed Based Operator industry to identify new or expanded services to meet the needs of the marketplace and become a one stop shop for customers. In discussions with these companies the topic of helicopter services was introduced. To determine the support of this idea, interest in GYY and gauge general market issues and conditions, six of the top helicopter operators in the Chicago region were contacted. Helicopter activity creates the potential for its own unique maintenance facilities and training schools. Contacted operators indicate that Chicago is an appealing market and are interested in alternative airports in the immediate area. The primary focus of their services is on the tourist industry which is substantial in the Chicago area and has potential to impact GYY given its close proximity to downtown Chicago. Of the helicopter services contacted, one operator expressed interest in using GYY for cargo service. This rather unique service specializes in cargo movements and receives contracts from the third party logistic companies (3PLs) which take responsibility for packages and commit to transporting them. In the past, shipments for the auto industry of 3,000 lbs. or less have been picked-up at GYY for air shipment. Several operators expressed reservations regarding previous difficulties resolving historical operating and business issues with GYY. These included (among others) the lack of 24 hour service, immediate access to fuel and availability of cargo handling equipment. In the current environment all of these issues can be addressed. When pressed to expand on these and other “issues”, interviewees at first declined to provide additional information. Eventually however, it became clear the primary concern for tourist related activities is the “reputation” and image of Gary. Access to the Airport from Chicago takes potential customers on roads that do not show the region in the most positive light. Nevertheless, there may still be interest and opportunity provided that the “issues” are resolvable in a manner satisfactory to both parties.
Aircraft Painting Overview The concept of aircraft painting services as a possible business venture at GYY was raised in interviews with a number of FBO’s. Aircraft painting requires knowledge of appropriate procedures and facilities which are usually determined by the lessee in accordance with established environmental guidelines. The building typically

THE GARY/CHICAGO INTERNATIONAL AIRPORT STRATEGIC BUSINESS PLAN FINAL
Landrum & Brown Ch III-47 April 2010
needs proper lighting, a temperature controlled area, adequate ventilation, and a comfortable amount of space to park planes and perform other activities. A total of six companies were contacted, four shared information although none expressed interest in expansion due to the economic slump. Advantages and Disadvantages A business will need to attract customers and a combination of aviation services would appeal to a broader market. The Fixed Based Operators interviewed mentioned potential interest in identifying the infrastructure for aircraft painting at GYY. One advantage Gary has is a prime location to a large aviation market. Aircraft painting services would require hangar space adequate for specific plane size. The facility needed to accommodate GA traffic would be 10,000 sq. ft. with a 3,025 sq. ft. pressurized climate controlled booth.
SUMMARY The outreach efforts indicated that Gary with the runway extension would have the physical assets necessary for a commercial painting operation. However, the market dynamics and available facilities at other airports better positioned geographically from both a labor cost and weather perspective, argue strongly against pursuing this as a core business. Flight Schools Typically, training facilities including classroom, simulation, and flight, for commercial aviation are located at corporate headquarters, hub facilities, and/or airports with aeronautical infrastructure sufficient to accommodate actual flight training. However, it is not unusual for training facilities for non-commercial aviation activities to be located on smaller general aviation airports. A survey was conducted that included 30 flight schools for both fixed and rotary winged aircraft. The focus of the effort was to identify the typical criteria that flight training businesses apply when selecting a school site and how those criteria relate to Gary. Despite the state of the economy, flight training remains popular. However, the financial status of most flight schools limits their interest in relocating or expanding into another city or airport. Most have invested heavily in buildings, ramp space and/or equipment at their current locations making the expense of relocation or expansion problematic.
Nevertheless, several flight schools expressed interest in exploring options with GYY. There are obvious concerns regarding cost and any incentives the Airport, City, and/or region would consider. These schools are primarily located in Indiana, south of Gary. Additionally, several flight clubs indicated they might also be interested provided landing fees, fuel flowage costs, hangar rents, etc. were satisfactory.
Generic requirements
A control tower on the airport is not critical as long as one is available nearby for the required training and certification.

THE GARY/CHICAGO INTERNATIONAL AIRPORT STRATEGIC BUSINESS PLAN FINAL
Landrum & Brown Ch III-48 April 2010
A minimum runway length of 2,000 to 3,000 feet is required.
Ramp to accommodate 10 to 30 aircraft.
A regional population sufficient to provide a student base.
An all-weather Instrument Landing System (ILS) or Global Positioning System (GPS) approach procedure.
A building providing sufficient office and classroom space (estimates range from 2,000 to 3,000 square feet).
Willingness of the Airport or FBO to negotiate a mutually beneficial fueling contract.
Regional requirements
Available and reasonably priced housing for non-regionally based students. This could include extended stay hotels and/or bed and breakfast establishments.
Avionics, maintenance and support businesses as well as the presence of supply facilities.
Available restaurants and other commercial facilities to provide both amenities and necessities required by students.
Available fuel at competitive prices. The positives of Gary
The Airport is physically unconstrained and has ample room for the development of a full range of facilities and infrastructure to conduct training and related operations.
The existing runway length is more than adequate for training on a variety of aircraft types and ramp is available.
The availability of ILS and GPS approaches.
Operating costs would be inexpensive.
Proximity to Chicago is an attraction for students.
The negatives of Gary
The Airport is not known in flight training circles as compared to better-known locations in the U.S.
There are limited regional amenities currently available to attract new students. Such items as inexpensive temporary housing, restaurants, entertainment etc. were considered important to attract and retain students.
Building facilities would need to be constructed.
There are a number of regional airports that can compete for market share.
THE GARY/CHICAGO INTERNATIONAL AIRPORT STRATEGIC BUSINESS PLAN FINAL
Landrum & Brown Ch III-49 April 2010
SUMMARY There are limited dollars to be made directly by an airport through fees in the general aviation area. Nevertheless, it offers a potentially developable market segment that GYY can access which can increase the regional job base and generate revenues through ground leases. This industry segment is made up of numerous small businesses that usually cluster in an area of an airport that is designated for general aviation use. Typically, such areas develop incrementally rather than strategically and could benefit from a comprehensive development plan. Given the limited financial resources of the Airport an initial discussion should be held with the FBO to review the possibilities of a partnership in pursuing a growth strategy for flight schools and other related training activities. This will also assist in estimating demand and the potential timing of any initiative.
SECTION III-2 LAND UTILIZATION
Section III-2A Airport Property and Operating Requirements
BACKGROUND
Gary/Chicago International Airport is located on the extreme south end of Lake Michigan, with easy access from both the Indiana Toll Road and Cline Boulevard. It is conveniently located west of downtown Gary Indiana and near both Hammond and East Chicago Indiana. The surrounding area has a predominantly industrial focus with emphasis on steel production and oil and gas tank farms. The Airport sits on approximately 700 acres of land which includes both the Airport Operating Area (AOA) and outside controlled areas. The Airport has acquired several surrounding tracts of land to accommodate the proposed extension of both the primary Runway 12-30 and secondary Runway 02-20. Additional land acquisition will be necessary to facilitate the planned extensions, and the relocation of the CN rail line on the west end of Runway 12-30. Several truck maintenance facilities surround GYY both on land rented from the Airport and on privately-owned property. These facilities could be relocated to meet the expansion plans when the Airport is ready to move forward with these plans. The primary focus of existing Airport activity and hence the development of physical facilities is on general aviation and corporate hangars. The passenger terminal, has been renovated and though somewhat dated, remains functional. It is equipped with federally required security equipment and two passenger loading bridges, which access to three narrow body aircraft parking positions. Numerous startup carriers have provided service in the past few years. Although there is currently no scheduled service, the following airlines have served GYY recently; Pan Am Airlines, Southeast Airlines, SkyValue Airlines, Skybus Airlines and Hooters Air, serving destinations such as Hartford, Connecticut, St. Petersburg, Florida, Greensboro, North Carolina and Myrtle Beach, South Carolina.

THE GARY/CHICAGO INTERNATIONAL AIRPORT STRATEGIC BUSINESS PLAN FINAL
Landrum & Brown Ch III-50 April 2010
Understanding the Airport Layout Plan
The existing Master Plan Update (2000-2020) was prepared for the Gary/Chicago Airport by HNTB in 2001. It includes an Airport Layout Plan (ALP) (dated July 2001) The ALP was prepared to reflect modifications necessary to accommodate the extension of the primary Runway 12-30 to the west by relocating the CN railroad line. (Note: Nothing in this Report should be construed as a critique of the Master Plan). The reconfiguration will increase the total runway length from 7,000’ to 8,900’. (The current runway has a displaced threshold allowing for only 5,000’ of usable runway, due to the railroad obstruction on the west end). Additional airfield design enhancements include accommodations for the cross-wind Runway 2-20 extension, a second parallel taxiway on the south side of the primary Runway 12-30, improved runway safety areas and additional navigation aids. The runway extension is considered to be an important consideration in the pursuit of commercial aviation operations. The ability to attract commercial service and large corporate aircraft is enhanced by the fact that the GYY airspace is separate from the primary Chicago facilities.
The ALP design also provides for a future terminal complex, passenger parking and rental car facilities in the northwest quadrant of the Airport. These facilities can only be functional and accessed if and when the runway extension is complete.
Additional details of the ALP provide for development of GA hangars, corporate aviation facilities, expansion of the existing terminal and a site for potential commercial development on the south side of Runway 12-30. Since the ALP was last updated in 2001-2002, an update should be made a priority to enable effective planning for an appropriately targeted market and to facilitate federal funding should any such be appropriate for future development and growth.
Property Utilization by Aviation Segment:
The Airport has facilities and/or property that can accommodate several different aviation segments. This section discusses the Airport in general and the segments as they are currently positioned. THE AIRFIELD The overall condition of the airport is excellent. The buildings are well cared for, the grounds are well maintained, and the airfield is fully operational. Tenant input indicates that these maintenance levels are satisfactory all year round and that the snow removal program is outstanding. The perimeter fence has been recently retrofitted and the entire airfield appears to be secured to meet current FAA and TSA requirements. Additional fences and gates have been added to accommodate the recent construction of the Boeing hangar facilities on the northwest corner of the airfield and the Army National Guard facilities on the southwest corner of the Airport that houses a Blackhawk Helicopter Medical Evacuation Unit. These areas are now accessible by perimeter roads with an independent gate. This enables these facilities to operate autonomously eliminating the need to enter the AOA. The vehicle service roads (VSR) are well developed and maintained. Although there is no VSR that circumnavigates the complete perimeter of the airport, much of the perimeter is accessible and all major facilities and aeronautical equipment are satisfactorily sited. The core of the aeronautical infrastructure is comprised of two

THE GARY/CHICAGO INTERNATIONAL AIRPORT STRATEGIC BUSINESS PLAN FINAL
Landrum & Brown Ch III-51 April 2010
runways – the main Runway 12-30 which is 7,000’ with a displaced threshold [715’ (RW12 end) and 546’ (RW30 end)] and the cross-wind Runway 2-20 of 3,603’. According to the Airport staff and tenants all accessing taxiways and aircraft apron are in acceptable to fair condition. Crosswind Runway Issue The crosswind Runway 2-20 measures 3,603 feet. It provides landing and take-off capacity when winds are out of the north or south. This is fairly uncommon. The Team has provided a wind analysis summary (see Exhibit III-13). The analysis finds that crosswind conditions do exist and that use of both runways provide the necessary capacity to meet the 95 percent FAA rule. Our Airfield planners have indicated that Runway 2 could use an IFR approach, and appropriate runway length of 5,000'. Additionally, Runway 12-30 falls a bit short of providing adequate wind coverage for B-II and smaller aircraft. Runway 12-30 has adequate coverage for C and D aircraft. Some of these issues are addressed in the 2001 ALP. Further definition and planning to address these airfield limitations should be addressed in an updated Airport Layout Plan. For the present however, the focus of the planning effort is to determine what if any might be the appropriate niche for the Airport to pursue for future growth and to establish a revenue stream that can contribute to future financial self sustainability. An extension of Runway 2-20 would be beneficial for General and Corporate aviation activity and the existing FBO. It would not however contribute substantially to any increase in revenues accruing to the Airport. Given the challenges of extending the primary runway, and the potential for commercial traffic that it presents, extension of the crosswind runway is of lesser importance. Pursuit of this infrastructure improvement, in the absence of any financial, operating, or safety mandate, should be deferred until such time as the extension of the primary runway is well underway.
An updated Airport Master Plan and ALP could address the future design and engineering challenges of relocating Industrial Highway to accommodate a 1,400’ extension and the possibility of adding an IFR Approach Designation to Runway 2/20. Cargo There are no scheduled cargo operations at the airport. Although there has been charter activity in the past, there are no facilities designed for the acceptance, build-up, shipping or transfer of conventional air cargo. In the past such activity has been handled on an ad hoc basis by the FBO, which still maintains that capability. Nevertheless, given the current (and projected) usable runway length and aircraft types that frequent the airport, there would be no ability to accommodate international demand for air cargo facilities or service at the Gary/Chicago International Airport, and very limited opportunities for domestic activity. The cargo charters were run by Ford Motor Company in the 1990’s to meet the parts demand at the Torrance Avenue Ford Taurus plant. At that time, DC-9 and Convair 580 aircraft were met by delivery trucks that transported the auto parts
THE GARY/CHICAGO INTERNATIONAL AIRPORT STRATEGIC BUSINESS PLAN FINAL
Landrum & Brown Ch III-52 April 2010
directly from plane side to the Ford facility. This service was provided by Jet US and Trans Auto. In the current air cargo business environment there are no indications of demand for air cargo facilities sufficient to justify construction of air cargo buildings at GYY without a tenant in hand to occupy the building.
Aviation Fueling
Aviation fuel and gasoline is housed in fuel tanks in a fuel farm located on the north side of the field. The Farm is comprised of six tanks. There are four “Jet A” fuel tanks of 20,000 gallons each and two 12,000 gallon aviation gas tanks. These tanks are refilled several times weekly by tanker. The aircraft are fueled directly by airfield tankers operated by the FBO.
Airport Facilities
Passenger Terminal Building
The currently unused passenger terminal is well-positioned in the middle of the inbound/outbound roadway, with conveniently located parking for approximately 800 passenger vehicles. The parking area is currently configured as a free lot but will in the future be paid-parking. Airport management has indicated that the semaphores have been purchased (and a cashier’s booth is in place) to provide for fee-based parking if and when it is desired. The terminal exterior is in good repair. It is a single-story stucco building with a large predominant raised seam metal roof. There is one main entrance and an interior passenger hallway that leads to ticketing, passenger gates and the baggage claim area. By modern standards, the terminal is somewhat shallow from front to rear. This could impact passenger flows from gate areas to baggage claim while passengers are checking baggage and moving to the gates.
The ticket lobby is equipped with eight agent positions and ticket counters, backwall and baggage wells with scales. Back office support space is somewhat lacking, but workable. Adjacent to the ticket counters, there are two rental car counters as well. The terminal has an enclosed concession area which is ample for a small food concession and seating for guests. The space could be configured to accommodate a bar area for liquor sales, with minor remodeling.
Baggage claim is adequate for a one level flight operation. On the passenger side a flat plate claim device is in place and provides for sufficient lay-down capacity for inbound baggage. On the ramp side, an enclosed baggage room with overhead doors has space for two to three carts and an area for ramp servicemen to deliver bags from the aircraft. The two departure/arrival gates are accessible from a common hold room just beyond the security checkpoint. Both gates are equipped with radial arm movable loading bridges. Since the terminal is one level, the bridges are in a ground-up configuration. One bridge is equipped with a ramp which provides for convenient access for both wheelchairs and pedestrian passengers. The second bridge is equipped with a stair access and a handicap lift, making it somewhat cumbersome for passenger loading and unloading. The loading bridges are in fair cosmetic condition. One of the bridges appears to have a roof leak, as indicated by wet carpet during inspection. The mechanical condition was not investigated and is therefore unknown.

THE GARY/CHICAGO INTERNATIONAL AIRPORT STRATEGIC BUSINESS PLAN FINAL
Landrum & Brown Ch III-53 April 2010
EXHIBIT III-13: CROSSWIND RUNWAY ANALYSIS Percent Coverage Percent of Time
Crosswind All Crosswind AllVelocity Weather VFR IFR Velocity Weather VFR IFR10.5 Knots 10.5 Knots
Rwy 02 62.03 61.05 73.69 Rwy 02 24.80 23.47 40.59Rwy 20 65.55 66.60 53.07 Rwy 20 28.32 29.02 19.97Combined 90.35 90.07 93.66 Calm 28.18 28.33 26.40
Common 9.05 9.25 6.7010.5 Knots Total Coverage 90.35 90.07 93.66
Rwy 12 59.10 58.58 65.24 Unfavorable 9.65 9.93 6.34Rwy 30 69.47 70.08 62.24Combined 87.01 87.21 84.72 10.5 Knots
Rwy 12 17.54 17.13 22.4813 Knots Rwy 30 27.91 28.63 19.48
Rwy 12 64.88 64.39 70.65 Calm 28.18 28.33 26.40Rwy 30 75.19 75.78 68.23 Common 13.38 13.12 16.36Combined 94.92 95.08 93.05 Total Coverage 87.01 87.21 84.72
Unfavorable 12.99 12.79 15.2816 Knots
Rwy 12 67.36 66.81 73.84 13 KnotsRwy 30 77.54 78.09 70.99 Rwy 12 19.73 19.30 24.82Combined 98.39 98.49 97.22 Rwy 30 30.04 30.69 22.40
Calm 28.18 28.33 26.40All Runways Combined Common 16.97 16.76 19.43
10.5 Knots 98.66 98.64 98.96 Total Coverage 94.92 95.08 93.0513 Knots 99.60 99.60 99.71 Unfavorable 5.08 4.92 6.95
Percent Occurrence 100.00 92.19 7.81 16 KnotsPercent Calms 28.18 28.33 26.40 Rwy 12 20.85 20.40 26.23Total Observations 87,672 80,826 6,846 Rwy 30 31.03 31.68 23.38
Calm 28.18 28.33 26.40Tail Wind = 3.0 Knots Common 18.33 18.08 21.21Calm Wind = 5.0 Knots Total Coverage 98.39 98.49 97.22Years 1996-2005 Unfavorable 1.61 1.51 2.78Based on ORD Weather DataSource: National Climatic Data Center (NCDC), O'Hare International Airport; Landrum & Brown analysis The necessity of a crosswind runway is determined on the basis of FAA regulations. Advisory Circular 150/5300-13 par. 203.b states “When a runway orientation provides less than 95 percent wind coverage for any aircraft forecasted to use the airport on a regular basis, a crosswind runway is recommended.” The Airport Reference Code (ARC) determines the crosswind velocity that can be handled by the runway. A-I and A-II aircraft would be limited to a crosswind of 10.5 knots. A-II and B-II aircraft to crosswind of 13 knots. A-III, B-III, C-I to C-III, and D-I to D-III aircraft can handle a crosswind up to 16 knots. A-I and B-I aircraft correspond to small Beechcraft, Cessna, and Piper equipment. Cessna Citations and Falcons would fall into the B-II category, while Gulfstreams and BBJs would fall into the C-II/C-III/D-II/D-III categories. 10.5-Knot Crosswind Based on these assumptions, Runways 02/20 and 12/30 provide respectively a 90.35% and 87.01% wind coverage with a 10.5 knots crosswind limitation. In other words, if used individually, these runways are unsuitable for 9.65% and 12.99% of the time, respectively. For a 10.5-knot crosswind, aircraft would need to use both runways in combination in order to reach the FAA recommendation of 95% wind coverage (see the All Runways Combined). 13.0-Knot and 16-Knot Crosswinds For larger aircraft that can handle faster crosswinds (A-II/B-II and above), Runway 12/30 covers 94.92% to 98.39% of the winds at GYY. Therefore, Runway 12/30 provides enough coverage to meet the FAA requirements under these crosswind speed assumptions. Conclusions If the aircraft is limited to a 10.5-knot crosswind, both Runways 02/20 and 12/30 have to be used in combination to meet the 95% FAA rule. Otherwise, for larger aircraft, the airport meets the 95% FAA recommendation with the use of Runway 12/30 only.

THE GARY/CHICAGO INTERNATIONAL AIRPORT STRATEGIC BUSINESS PLAN FINAL
Landrum & Brown Ch III-54 April 2010
The terminal is a clearstory configuration, with the center entrance area raised to provide additional light at the entrance. Although it is not large it provides a comfortable and spacious feeling with high ceilings in the center of the building. The interior of the terminal is in fair condition. The carpet is worn and water stained, indicating a possible roof leak. If regular scheduled service was imminent, a minor remodeling effort could put the terminal in good presentable working order.
The security checkpoint is equipped with magnetometers and baggage x-ray equipment and appears to be sufficient to accommodate a narrow-body passenger complement. The age and condition of the equipment is unknown.
Aircraft Rescue & Fire Fighting (ARFF) Building
The Air Rescue & fire Fighting (ARFF) building is aging but functional. It houses two Oshkosh 1,500 gallon fire crash rescue vehicles. One of the vehicles is equipped with a telescoping boom. It has six bays and ample support space for the current equipment and personnel.
Airfield Maintenance Building
The airfield maintenance building pictured below is conveniently located on the flight line between the hangars. It is functional for airfield equipment repairs and service and has available office space for the maintenance personnel. The building was recently expanded and is attached to the Central Administration Building. This facility is 150’ wide by 120’ deep and has four overhead doors and ample room for equipment storage, maintenance and parts storage. It houses all maintenance equipment including plows and brooms. The back corner of the building is built out with a caged area for secure storage and offices on a mezzanine level. Additional outdoor equipment storage exists adjacent to the building.
Administration Building
A recently expanded administration building houses the Airport Director and staff. It is well designed and adequately furnished to meet all of the staff’s needs. The building has private offices around the perimeter of the building with cubicles in the center for administrative staff and visitors. This building has a secure lobby with reception area as well as a large conference room and presentation/seating area for public meetings and presentations. Adequate and convenient parking is located in front of the building.
Maintenance
There are no commercial maintenance facilities. Aircraft maintenance and repair is handled by the FBO. Gary Jet Center has a full complement of Airframe & Power certified mechanics to perform on-call maintenance and repair to all aircraft that currently utilize GYY. Gary Jet Center has on-call maintenance agreements with Boeing, Menards, White Lodging, Burrell Color and several other corporate flight departments that utilize the airport. Under these contracts, they provide both periodic scheduled services as well as any other required maintenance requests.
THE GARY/CHICAGO INTERNATIONAL AIRPORT STRATEGIC BUSINESS PLAN FINAL
Landrum & Brown Ch III-55 April 2010
FBO Facilities/Hangar Facilities
General Aviation makes up the majority of the flight operations and facilities requirement at GYY. A combination of T-Hangars and larger multi-aircraft hangars house the general aviation and corporate aircraft that are based at GYY. The complement of T-hangars is almost fully occupied, and a 3rd party developer is currently constructing six executive hangar bays on the northeast side of the GA hangar area.
The Fixed Base Operator (FBO), Gary Jet Center provides facilities, maintenance, and catering services to the GA and corporate aircraft at the Airport. Gary Jet Center has leased all of the available hangar space and utilizes it to house virtually all aircraft on the field, with the exception of several corporate users who have their own exclusive hangars and the T-hangar occupants. The Airport has an extensive complement of hangar buildings. The FBO has a primary hangar and operations center #10 Gary Jet Center (Operations & General Office) on the east side of the airport where it handles its passenger and operations functions. Gary Jet Center stores and marshals aircraft in many of the other hangar buildings for their clients.
Hangar #10 is 200’ wide by 177’ deep with an 18’ door. It houses the main offices, reception area and operations center for the FBO. All of their clients come and go through this facility which also serves as the marshalling area for maintenance and pilot staff. The hangar currently houses ten to twelve small aircraft and the maintenance equipment.
Standard Oil Hangar
The oldest hangar #5, a double bay configuration originally built for the Standard Oil Company, is located on the west side of the flight line. It is used by Gary Jet Center. Although the facility is old and has a low ceiling, it remains functional and provides space for many small aircraft. The manual doors operate easily. There are basically two Quonset hut - type hangars built in the early 1950’s - 120’ x 120’ each plus a lean-to of 40’X120’, with 16’ high doors. They have extensive office areas and rest rooms built out in the middle, but these areas are damaged by roof leaks and are uninhabitable. Gary Jet Center leases these buildings and have 15 to 20 small aircraft housed in the hangars, as well as several boats and small equipment. These hangars could be upgraded with better lighting and restrooms. An engineering study and cost/benefit analysis could determine if it is possible to elevate these structures and retro-fit the doors to allow for storage of larger aircraft with taller tails as well. The roofs of both of the hangars need replacement.
New FBO Hangar
Gary Jet Center occupies a newly constructed hangar and ramp area just west of the Airport Administration building and the airport maintenance building. This hangar is 220’ wide and 160’ deep with a 24’ high door. It appears to be fully occupied by tenants of the Gary Jet Center.
Jet Select Hangar
This 60’ wide by 120’ deep hangar is leased to a fractional ownership company based in Columbus OH. The building was locked and access and interior condition is unknown.
THE GARY/CHICAGO INTERNATIONAL AIRPORT STRATEGIC BUSINESS PLAN FINAL
Landrum & Brown Ch III-56 April 2010
Boeing Corporate –Executive Flight Operations Facility
One of the newest buildings on the airport is the Boeing corporate hangar. It was built approximately seven years ago by the Airport on the far northwest corner of the field. Originally, this facility was constructed without a tenant; it was quickly leased by the Boeing Corporation when they moved their executive offices to the Chicagoland area. It was originally designed with the intention of housing a start-up carrier as well as an airframe & power plant school or an avionics academy. The lean-to on the west side (originally designed for the school rooms) is still unoccupied and has unfinished space with no floor or interior partitions.
The Boeing Corporation has outfitted the interior of the building with a complete compliment of corporate flight operations offices, crew domicile, sleeping rooms and aircraft maintenance support areas. The building has ample space for their two Boeing BBJ aircraft and four Bombardier Challenger 604/5’s. In addition to Boeing Personnel, the facility is occupied by several aircraft maintenance employees of Gary Jet Center who work exclusively for Boeing on their executive fleet.
There are several other corporate hangars on the field. These are owned by local companies and house their own corporate aircraft. These hangars have been constructed over the years, and are on ground leases with the airport. The lease-hold improvements are owned, maintained and occupied by the tenants. Burrell Colour Imaging (BC) houses corporate aircraft owned by Don Burrell a local entrepreneur.
The hangar owned and occupied by White Lodging Services houses their corporate aircraft. White Lodging is a Merrillville Indiana based Hotel owner and operator, with facilities throughout the United States. Another large hangar is owned by the Gary/Chicago Airport and leased to NIPSCO, a Northern Indiana utility company. It houses several helicopters and small fixed wing aircraft for their corporate use.
General Aviation Hangars
The Gary/Chicago Airport has a well developed complement of T-hangars. They are conveniently located east of the passenger terminal with easy access to the taxiway and both runways. These facilities are almost 100 percent occupied. There are seven buildings with a total of 50 to 60 hangar bays. They were constructed in several phases and vary in both size and configuration. A contractor is currently constructing four more units of a larger and more elaborate configuration.
National Guard Army Aviation Support Facility
On the southwest corner of the Airport the Indiana National Guard has recently built a National Guard Army Aviation Support Facility. This new 56,000 square foot project includes 12,000 square feet of support space, 14,000 square feet of shop area, and a 30,000 square foot hangar to support and service the Guard’s Blackhawk helicopters. The hangar facility includes a 172’ wide x 29’ high hangar door.

THE GARY/CHICAGO INTERNATIONAL AIRPORT STRATEGIC BUSINESS PLAN FINAL
Landrum & Brown Ch III-57 April 2010
Airport Facility Utilization With the exception of the Passenger Terminal, there is little available capacity within the existing facilities for the addition of new businesses. However, there is ample room on the Airport in general for growth. In addition to the Terminal there are developable airfield land sites, the runway expansion area and several non-aeronautical sites that have land and capacity to accommodate collateral development. There is an area adjacent to the existing Terminal that has been set aside for expansion, should that facility become too congested and unable to accommodate future growth. In addition, a future Terminal location has also been identified in the northwest corner of the Airport. This site is adjacent to the extended main Runway 12-30 and its eventual development will be predicated upon fairly substantial passenger growth.
Runway Expansion Area
The main Runway 12-30 had an EIS completed in 2006 for the runway expansion. All of the necessary planning documents are complete. The runway extension is now dependent upon reaching an agreement with the Canadian National Railroad for the relocation of its tracks. With an agreement in place the rail line can be moved and the Airport can move forward with the runway extension. The discussions with the Railroad have produced two Options – A and B for the relocation of the rail line Exhibit III-14.
Option A is preferred by the Airport while B which has been described as less costly appears to be the alternative in which CN is most interested. It is important to note that the EIS upon which FAA funding is in part based, was done in conjunction with Option A. Further analysis would be required to determine if the existing analysis is adequate for Option B should that be the final outcome of the discussions. In the event that additional environmental work is required, the commencement of the relocation effort could be substantially delayed.
The cross-wind Runway 2-20 has had only preliminary planning done for any extension plans. The extension of 2-20 would require the relocation of Industrial Highway, as well as the purchase of land to the north. Some easement work in conjunction with this has already been initiated.
Potential Development Areas for Alternative Land Use
Alternative land use is not necessarily something that an Airport can simply undertake. There are instances where the FAA requires that Airports develop a Land Disposition/Divestiture Plan as an incentive for Airports to develop an Alternate Land Use plan. There may also be a lengthy and possibly costly effort to obtain the release for land purchased with Federal funds. Land impacted by Part 150 noise must be posted on the Federal Registry for public comments before Airports are authorized to develop Non-Aeronautical uses. Nevertheless, collateral development has become an important consideration for many airports.

THE GARY/CHICAGO INTERNATIONAL AIRPORT STRATEGIC BUSINESS PLAN FINAL
Landrum & Brown Ch III-58 April 2010
The critical decision in pursuing development is “why”. It is absolutely essential that the Airport integrate business planning with physical planning in making this assessment. To the extent possible, this planning work should be integrated with regional land use planning, regional transportation planning, and economic development initiatives. For this reason, a business plan with a sound understanding of regional and industry market dynamics should form the basis for developing and prioritizing initiatives. Assuming that strategic planning of all future development is the best approach, the Airport must develop sufficient focus and business logic to react appropriately to an outside influence such as airline consolidation or regional economic slump that might precipitate a need for an interim but less satisfactory alternative to utilizing a piece of property. It is important to first understand what is meant by alternative land use. It is generally accepted that the primary uses for airport property are passenger and cargo operations, maintenance, and general aviation. These business segments receive support from a variety of different firms that typically are located off-airport because of space constraints or property costs. In an ideal environment many of these functions would elect to be located on-airport to minimize time issues, create operating synergies, and/or reduce the cost of doing business. These functions become the first order of priority. Beyond these elements, there are very basic functions that serve to meet the quality of life requirements of the airport’s working population and those of its tenants and users. These are the next order of focus. In the case of Gary, the emphasis must be tied directly to the development efforts of the primary aviation function, but a number of additional support functions could be included.

THE GARY/CHICAGO INTERNATIONAL AIRPORT STRATEGIC BUSINESS PLAN FINAL
Landrum & Brown Ch III-59 April 2010
THIS PAGE INTENTIONALLY LEFT BLANK

TH
E G
AR
Y/C
HIC
AG
O I
NTER
NA
TIO
NA
L AIR
PO
RT
S
TR
AT
EG
IC B
US
INES
S P
LA
N
F
INA
L Lan
dru
m &
Bro
wn
Ch III-6
0
April 2
010
EX
HIB
IT III-1
4: R
AIL
RO
AD
RELO
CA
TIO
N O
PTIO
NS

TH
E G
AR
Y/
CH
ICA
GO
IN
TER
NA
TIO
NA
L A
IRP
OR
T
S
TR
AT
EG
IC B
US
INES
S P
LA
N
F
INA
L
Landru
m &
Bro
wn
Ch I
II-6
1
April 2010
TH
IS P
AG
E I
NTE
NTIO
NA
LLY
LEFT
BLA
NK

THE GARY/CHICAGO INTERNATIONAL AIRPORT STRATEGIC BUSINESS PLAN FINAL
Landrum & Brown Ch III-62 April 2010
Typically, perimeter property away from the main terminal and ramp operations areas is the most appropriate and viable target for development. An airport’s first obligation is to maintain the integrity and capacity of these areas for both the near and the long-term. However, there will be instances when an airport will consider if there are alternatives that are consistent with long-term vision and goals. This means that the airport must address why it might want to change the existing planned use of an area to something else. The following are typical considerations for investigating and pursuing alternative land use.
a. The need for strategic as opposed to incremental land use planning. Airports may need to revisit existing development plans (and developments) that were the result of a more-spontaneous response to a client or airport want rather than the product of a planned approach to airport development. It may also be appropriate, given the Business Plan to create more development opportunity for a specific function, e.g. cargo and cargo support, maintenance, general aviation, etc.
b. Optimizing the available property for aeronautical use As airports mature, and business expands (or changes) the need for aeronautical infrastructure will change as well. Redevelopment may be necessary to recapture property with aeronautical adjacency.
c. Optimizing revenue potential Given the changing marketplace, shifts in revenue generation, and new business partners, airports may look to create capacity to bring new business partners on to the airport, or develop facilities for established partners that traditionally have been off airport, but who for operating, security, or cost reasons may now prefer an on airport location.
d. Integrating on and off airport planning One of the critical concerns an airport faces is compatible land use. Typically this is associated with noise and other environmental issues, but from a business perspective it is equally important. Development on airport must not be seen as a threat by local off airport businesses, and where possible should serve as a stimulus for growth.
e. Regional economic development Airports are considered economic engines. In the absence of appropriate property around an airport, available airport property (assuming appropriate approvals) could be used to accommodate an economic initiative.
An airport must address some very basic questions including whether development of additional aeronautical use facilities is desirable. It may be that the community aviation infrastructure is seeing increased demand. However, it could be just as likely that there is no market for local growth because enhanced infrastructure and services exist and are thriving at neighboring airports. An understanding of the regional market is critical to understand if development of non-aeronautical but still transportation or multi-modal related facilities would be effective for attracting growth. It is more likely if it is an area where manufacturing is strong or geographically well suited for truck, train or vessel connections. The probability diminishes if the airport is a spoke in a large network carrier’s hub, with little or no

THE GARY/CHICAGO INTERNATIONAL AIRPORT STRATEGIC BUSINESS PLAN FINAL
Landrum & Brown Ch III-63 April 2010
manufacturing and limited access to major interstate or rail lines. Growth is even less likely if the airport cannot compete with the lower rents that firms usually find off airport.
It may be that development of light industrial, commercial and even office would be the right fit. This use could serve to offer neighborhoods a soft buffer between the harshness of parking structures or hangars but would not be appropriate if it is the last contiguous land to AOA and terminal areas. Development, particularly with a private partner can generate new revenues but limit the airport as to the eventual use of the property. Long term leases can be expensive to buy back if the area is needed for other expansion so it is critical to understand the market and what drives it. An airport should think very seriously about the tradeoffs between short-term profits and long-term growth understanding if the new uses will still be the most appropriate and best use of property 10 to 20 years into the future. In reality it comes down to choices by the airport based on its position in the aviation system and its respective community. There are always a wide range of variables that must be examined, but it is important to realize that there are no uniform answers. What is an acceptable alternative to one airport may be very problematic to another. Collateral Development at GYY
Potential areas for development at Gary/Chicago International Airport are displayed on Exhibit III-15. The exhibit depicts those areas that offer opportunities for both airfield-adjacent and collateral land development.
There are eight significant buildable sites on the airport. Additional land owned or controlled by the airport that is not currently programmed for runway expansion or future airport use, is at present considered unsuitable for development due to environmental issues or wetlands designation.
Of the eight sites, five are located within the airport operations area and as such are encumbered by specific safety and operating regulations. These sites have direct runway/taxiway or vehicle service road access. The larger sites are 11.5, 15 and 38.2 acres in size. There are also three smaller sites (4.1, 1.9 and 10 acres) which could be used to accommodate a number of aviation activities.
There are three sites without airside access that could be utilized for non-aviation functions. These are located along Industrial Highway and Chicago Avenue and are described in more detail below.

TH
E G
AR
Y/C
HIC
AG
O I
NTER
NA
TIO
NA
L AIR
PO
RT
S
TR
AT
EG
IC B
US
INES
S P
LA
N
F
INA
L Lan
dru
m &
Bro
wn
Ch III-6
4
April 2
010
EX
HIB
IT III-1
5: P
OTEN
TIA
L A
REA
S F
OR
DEV
ELO
PM
EN
T

TH
E G
AR
Y/
CH
ICA
GO
IN
TER
NA
TIO
NA
L A
IRP
OR
T
S
TR
AT
EG
IC B
US
INES
S P
LA
N
F
INA
L
Landru
m &
Bro
wn
Ch I
II-6
5
April 2010
TH
IS P
AG
E I
NTE
NTIO
NA
LLY
LEFT
BLA
NK

THE GARY/CHICAGO INTERNATIONAL AIRPORT STRATEGIC BUSINESS PLAN FINAL
Landrum & Brown Ch III-65 April 2010
Site 8: This site is located near the intersection of Cline Blvd. and Chicago Avenue. The site is rectangular and is approximately 10.1 acres in size. The site is within the master plan design area. It is slated for future roadway and hourly/daily passenger parking. For this reason, it is not suitable for other long term development plans. It could be utilized for short term sublease, or a use that would require little or no capital investment.
Site 7: This site is located directly across Industrial Drive from the Airport entrance roadway and Passenger parking lot. The site is approximately 11.8 acres and is well suited for development as an airport collateral use. It could house a rental car facility or similar airport related concession. It could also provide an ideal site for a passenger rail station and associated parking should the high speed rail project linking Chicago and Detroit ever come to fruition. An environmental base-line for this property should be established and recorded, as it resides directly adjacent to the MIDCO II superfund site, which is currently being remediated.
Site 6: This site is located across Industrial Drive from the east side of the Airport Passenger parking lot and across from the T-Hangar area. It is the largest contiguous land site, off the field outside the ALP design area that is owned by the airport. It is approximately 32.8 acres. It is also well situated for collateral land development. The challenge with this parcel is the existence of dune and swale lands that are currently environmentally protected habitats. If development is anticipated for this site, the necessary local, state and federal applications and approvals should be attained in advance of any planned development.
For development efforts of these sites to be most effective, it will be important to create a direct link between this development, the core aviation functions, and off-airport development by the private sector. The intent is to create a synergy between Airport Master Planning, local transportation and land use planning, and regional economic development efforts.
Constraints on Available Property
The major constraint on available property within the control of the Airport is environmental issues. Several major land areas within the Airport’s jurisdiction have on-going environmental issues. The two most notable are the Conservation Chemical site (in line with the Runway 12-30 extension) and the Midco II site across industrial Highway from the Airport Administration building.
Other major environmental concerns include the extensive “Dune and Swale” areas that are difficult to build on due to their protected status and the predominance of wetlands on and around the airport, which would require permitting and mitigation (replacement or purchase of wetland credits within the local watershed area) prior to development.
A well developed and current environmental baseline study should be accomplished as soon as possible. This would put in place the necessary information and a road map for development of available properties.
Other constraints of concern are the surrounding roadways, and railroads. Much of the developable airport land is either north of Industrial Highway or west of the Canadian National Railroad. Development of runway, taxiway, or airfield buildings along the flight line would require relocation of these elements.

THE GARY/CHICAGO INTERNATIONAL AIRPORT STRATEGIC BUSINESS PLAN FINAL
Landrum & Brown Ch III-66 April 2010
Figure III-1: Gary-Chicago Airport 10- (red), 20- (green), and 45-minute (blue) drive time
FAA Land Use Considerations
Despite the due diligence and planning done by an airport, the ability to develop airport property for non-aviation uses will depend on approvals from the FAA particularly if there are possible federal grant encumbrances involved. It will be important to ensure that the appropriate clearances are in place before advancing the development initiatives too far. The property can be handled through a Change or Release Process.
In the instance of Land Release: 1. Land is not needed for aviation use. 2. Land can not be used for aviation. 3. Land is sold. 4. Land is removed from airport property roles. 5. Land is released from all federal obligations contained in grant agreements or
conveyance deeds. 6. Land release requirements per FAA Order 5190.6A, “Airport Compliance
Requirements” and FAR Part 155.
In the instance of a Land Use Change: 1. Land is not needed for aviation use. 2. Land cannot be used for aviation related purposes. 3. Land is leased. 4. Land remains part of airport property. 5. Land remains federally obligated.
Section III-2B Collateral Land Development Opportunities
The Team gathered data on businesses, labor force, employment, the real estate market, transportation and logistics for the Gary/Chicago Airport and surrounding area to determine:
1. The area’s strengths and weaknesses, and
2. How these might be used to attract business of various types to the site
Depending on the data source, data was available either for the Gary Metropolitan Division (which includes Lake County, IN) or for areas within a specific drive time of the site. The Team used drive-times of 10”, “20”, and “45 minutes” from the site to collect data on immediate retail markets, workforce, and broader regional factors, respectively.

THE GARY/CHICAGO INTERNATIONAL AIRPORT STRATEGIC BUSINESS PLAN FINAL
Landrum & Brown Ch III-67 April 2010
Please note that the drive-time model does not account for congestion, and therefore these areas represent an idealized, traffic-free 10, 20, and 45 minute drive. Nonetheless, the areas realistically represent draw areas for retail and workforce activity. The 45-minute band is used as a baseline for comparing the immediate Gary area (the 10 and 20 minute draw) to the broader regional context.
Local Business Environment and Clusters
One major key to future development at GYY is the regional context around the Airport. Presently, GYY is surrounded by underutilized industrial sites. The GYY is one of many economic drivers in the area and each must work as a synergistic and interdependent part of the overall economy.
The local business environment (10-minute band) around GYY shows significant concentrations (based on total employment) of the following types of businesses:
Manufacturing – Largely the steel facilities still located north of the airport
Public Administration – State and local offices, as well as social support
Educational Services – Local education
Arts, Entertainment, and Recreation – Comprised mainly of the casino operations northwest of the airport
Beyond the 10-minute ring, Retail Trade becomes the dominant economic base, reflecting the influence of suburban retail development on the Chicago outskirts.
Demographics and Labor Force
Costs, market access, and talent are the three greatest drivers for most corporate site selection projects. As such, demographic trends and labor force dynamics can significantly indicate a community’s ability to attract new projects.
Figure III-2: Gary-Chicago Airport 10- (red) and 20-minute (green) drive time areas
Figure III-3: GYY and immediate (10-minute) draw area

THE GARY/CHICAGO INTERNATIONAL AIRPORT STRATEGIC BUSINESS PLAN FINAL
Landrum & Brown Ch III-68 April 2010
As noted earlier, the area was previously a center of heavy industry, with significant concentrations in steel, port, and rail transportation. As these industries moved elsewhere, the local population and workforce has been significantly affected.
As with the retail trade analysis, data was collected on the demographics located within the 10-, 20- and 45- minute drive-times of GYY. The 10-, and 20- minute drive-times are the most relevant areas for workforce analysis as these will supply the bulk of both skilled and unskilled labor for the site. Labor force data was collected from the Bureau of Labor Statistics and reflects the characteristics of the Gary Metropolitan Division as a whole. Demographics
Both population and households have declined in both the 10- and 20- minute drive-time areas. While in both cases this is less than one percent per year, this compares to state averages that are +.57 and .67 percent for population, respectively, and national averages that are +.91 and +.94 percent. Population growth is a general indicator of an area’s economic and workforce health. Negative rates will tend to cause an area to be eliminated from a site selection screening early.
Labor Force
Total employment in the Gary Metropolitan Division has declined by roughly 10,000 full time positions over the past ten years, a decline of four percent. This has not been a steady drop. Indeed, the area grew slightly in employment from 2004 to 2007, but any gains made in this era were lost in the recession of 2007-2009. Even given this, the area’s unemployment rate has tracked that of the State of Indiana closely, exceeding it consistently, but by only .35 percent. In other words, the region’s fate has closely followed that of the rest of the state and economy after the more dramatic loss of industry 10 to 20 years ago. As noted both by BLS data and the analysis of the RDA in their Comprehensive Plans, wage rates for comparable industries tend to be up to ten percent lower in the Gary area than those in Cook County, IL. Further analysis is required to ensure that these are truly equitable peer-to-peer comparisons and not an artifact of dissimilar functions in the two locations.
Occupational Characteristics
The Gary Metropolitan Division has a mixed employment picture, reflecting its industrial past, the proximity to major metropolitan markets, and its transportation strengths.
Bureau of Labor Statistics lists the major occupational concentrations for Gary as follows. Area (G) and National (N) levels as a percent of total employment are also shown:
Office and Administration – 16 percent (G) 17 percent (N)
Sales and Related – ten percent (G) 11 percent (N)

THE GARY/CHICAGO INTERNATIONAL AIRPORT STRATEGIC BUSINESS PLAN FINAL
Landrum & Brown Ch III-69 April 2010
Food Preparation and Serving – ten percent (G) eight percent (N)
Transportation and Material Moving – ten percent (G) seven percent (N)
Production Occupations – eight percent (G) seven percent (N)
Gary has lower than average employment in office-based employment, but shows a larger than average level of employment in core manufacturing (food preparation, production) and in transportation.
Transportation and Logistics
The Gary/Chicago Airport has excellent access to multiple modes of high-volume transportation infrastructure. These include:
Road – Access to major I-80, I-90, I-94, and I-65 interstates providing key north/south and east/west access. Coupled with Gary’s central location, this provides excellent truck access to most major US markets.
Rail – Key access to the CN at Kirk yards, and the Burlington Northern Santa Fe and Norfolk Southern east-west main lines also run near the property. The CN has expressed plans to use the Kirk yard (at the US Steel plant, roughly 1.5 miles east of the airport) as a major box transfer yard.
Water – The Ports of Indiana, located 12 miles to the east of the airport
Air – Currently limited passenger access (charter) through GYY. Market, runway and facilities do not currently support regular passenger and/or freight use
Of specific interest, the Chicago Regional Environmental and Transportation Efficiency Program (CREATE) has put forth initial plans to rationalize and integrate the region’s railroad network. The railroad consolidations of the past several decades have created a set of redundant rights of way across northwest Indiana. Clearing and/or rededicating these could open areas for development and create new transportation corridors. Under current planning scenarios, Canadian National plans to develop the Kirk Yard near GYY into one of its two major hubs in the United States, making it the only regional facility with service to the Atlantic, Pacific, and Gulf of Mexico. The upgrade would increase throughput, but still free up land for non-railroad development and create opportunities for an inter-modal complex close to the Airport.
Recent Initiatives and Results
The area does not have an effective business outreach function. Most major metropolitan areas have an agency specifically tasked with outreach and business recruitment. The 2010 Area Development Economic Development Directory has no listing for Northwest Indiana or the City of Gary. Additionally, while the City of Gary’s website does list a link for a business attraction agency, the link (as of February 12, 2010) leads to an inactive web address.

THE GARY/CHICAGO INTERNATIONAL AIRPORT STRATEGIC BUSINESS PLAN FINAL
Landrum & Brown Ch III-70 April 2010
The ISRG research indicates that there is no perceived and comprehensive approach to business development. The City of Gary indicated that confidentiality requirements limited what they could discuss. Regional economic development entities, as well as the City, all indicate that their efforts to attract business to the region are complicated by several factors:
The City has no dedicated Business Representative focused on customer service to assist potential new business entrants and track their progress
The City indicated that it sometimes loses contact with businesses interested in relocating to Gary
There is no provision for incentives for businesses to remain or relocate to Gary. For smaller start-up businesses, particularly in a difficult economy, new business development is problematic.
There are regional conflicts in the vision for GYY. This results in confusion as to whether the aim is to create a third Chicago airport, a commuter airport, GAA airport, charter airport, or cargo airport.
For its part, the RDA views GYY as a third Chicago airport, in the model of Manchester’s relationship to Boston-Logan. The RDA’s Comprehensive Plan lays out a series of financial initiatives to develop the airport as a commercial passenger airport to spur additional regional economic growth in the community.
Evaluating Development Options
Success factors for attracting business and development to GYY will vary depending on the type of use. For Gary, the most likely targets are:
Corporate functions such as manufacturing, warehouse, logistics, and aviation support
Retail either supporting the airport itself or outward facing to the community
Corporations look for varying combinations of the following critical success factors when determining where to invest in new operations:
Demographics – community growth or contraction
Workforce – availability of talent and skilled labor
Business Partners – supporting vendors and suppliers
Access and Transportation Infrastructure – ability to move people and products
Operating Costs – cost competitiveness with other locations
Tax and Regulation – existence of incentives and entry barriers
Other Risks and Opportunities – quality of life, hazards and safety
Outreach by the Community – support for new business development
These vary by importance depending on the nature of the business under consideration. For example, access and transportation infrastructure are important for warehouse and logistics. These are also important for manufacturing, but there may be increased dependence on the availability of skilled labor as well.

THE GARY/CHICAGO INTERNATIONAL AIRPORT STRATEGIC BUSINESS PLAN FINAL
Landrum & Brown Ch III-71 April 2010
Critical success factors for retail success include:
Access to retail consumer markets, and/or
Proximity to other uses that draw in retail consumers
For the Airport and its environs, the first of these – access to markets - is more important for external facing retail. The second is more directly applicable to the opportunity for serving the potential customers or tenants of the Airport.
Potential Airport - Regional Synergies
The region has already put considerable efforts into attracting and nurturing hospitality uses along the lakeshore, and has also participated in the attraction of casino uses to the lakeshore and the City of Gary. Additionally, the City of Gary is exploring tourism development built around the Michael Jackson name, such as a named hotel and museum. Both of these could produce air-based activity for GYY and help create critical economic mass around the Airport. Unfortunately, the casino is active but is financially failing (Chapter 11 bankruptcy). No funding options currently exist for the Michael Jackson Museum.
The Canadian National (CN)’s purchase of the EJ&E, coupled with the airport’s relationship with the Ports of Indiana and its own Foreign Trade Zone (FTZ) could provide other regional connections to be used to GYY’s advantage. Such an integration of logistics and international advantages (rail, port, road, and FTZ) could be very attractive for warehousing, truck consolidation, and even international product kitting.
The Boeing Company currently maintains its fleet of corporate aircraft at GYY due to its proximity to headquarters in Chicago. This could represent an additional opportunity for the following reasons:
Boeing’s existing presence, investment, and knowledge of the advantages of the site;
The advantage gained by Boeing by having additional investment in Indiana (and the corresponding support they gain in Washington from the Indiana congressional delegation)
Evaluative Criteria for Target Prioritization
Corporate Use
Location selections begin by defining the need for a new location and establishing the goals that the new location must fulfill. These goals will be used to narrow the universe of possibilities to a very short list of final candidates. Location data points are then entered into a weighting and ranking model to test which communities meet the various requirements for the functions and uses to be housed there.
Demographics
Workforce
Business Partners
Access and Transportation Infrastructure

THE GARY/CHICAGO INTERNATIONAL AIRPORT STRATEGIC BUSINESS PLAN FINAL
Landrum & Brown Ch III-72 April 2010
Operating Costs
Tax and Regulation
Other Area Risks and Opportunities
Outreach by the Community
Based on the above, the Gary/Chicago Airport and immediate surroundings were reviewed by the Team producing the results indicated in Exhibit III-16 below. Retail
The Gary/Chicago Airport does not have an indigenous market within close proximity that could support significant destination retail. Household incomes within the 10- and 20- minute drive time are roughly 23-36 percent less than those for the broader region (the 45-minute drive time). Additionally, there is little existing retail activity within the 10-minute drive time immediately surrounding the airport. Hence, there is little opportunity for creating or feeding off of a “critical mass” of retail activity to draw in outside shoppers. Retail clusters become more feasible if a definable market of retail customers can be identified. As such, the airport itself could generate retail demand ancillary to the primary air service use. The potential success of this retail use would depend upon the volume and buying characteristics of the airport’s customer base. Typical uses could include convenience retail, restaurant and hospitality, and tourism based retail.
Regional Real Estate Considerations
The Gary/Chicago Airport area is subject to a variety of considerations affecting the real estate industry as a whole. These include:
Demand – Absorption is posting historic negative statistics in all areas of commercial real estate
Capital Markets – the Capital markets have largely been shut off for 2 years now and there is little change expected

THE GARY/CHICAGO INTERNATIONAL AIRPORT STRATEGIC BUSINESS PLAN FINAL
Landrum & Brown Ch III-73 April 2010
Exhibit III-16 – Regional Target Prioritization
Criteria Local Evaluation
Demographics
Declining population and household base indicate troubled community. This represents an overall risk that may cause the community to be dropped from some screenings
The above will require active outreach to consultants and target industries to ensure that the region remains on consideration lists despite these facts
Workforce
While experiencing unemployment rates slightly higher than the state averages, the area has retained significant employment
The area has key capabilities for manufacturing, production, and logistics
The area does not appear to have a particularly strong workforce for office-based employment
Area wage rates are somewhat lower than those in Chicago
Business Partners Logistics-based partners such as the CN, the Kirk Yards,
and the Ports of Indiana are key potential partners to be used as attractors for some businesses
Access and Transportation Infrastructure
Road – Access to major I-80, I-90, I-94, and I-65 interstates providing key north/south and east/west access
Rail – Key access to the CN at Kirk yards Water – Access to international Great Lakes traffic
through the Ports of Indiana Air – Currently limited passenger access through GYY.
Market, runway and facilities do not currently support regular passenger and/or freight use
Operating Costs Operating costs (utilities and real estate) are at or below
level for comparative areas closer to the center of the Greater Chicago area.
Tax and Regulation
Property taxation within Indiana has been capped (1-2-3 formula) Have tax caps at 1, 2, 3 residential, hotel, and commercial
While this reduces burdens, it also severely constrains communities’ ability to invest in infrastructure and services
The City of Gary has not recently offered tax abatements for any new businesses coming into Lake County
Other Area Risks and Opportunities
GYY is the location of an activated Foreign Trade Zone Perceptions – and realities – of crime and security risks
Outreach by the Community
The City of Gary and Lake County do not have an effective business attraction organization at the present time

THE GARY/CHICAGO INTERNATIONAL AIRPORT STRATEGIC BUSINESS PLAN FINAL
Landrum & Brown Ch III-74 April 2010
The Gary submarket faces some additional challenges:
The Northwest Indiana market tends to be the least active of all the metro Chicago markets. For the past two years, the market occupancy has contracted by over 600,000 square feet. Many of the tenants who occupied space relocated to Chicago suburban markets due to access and lack of amenities.
Values – rents have been declining for 5 consecutive years and average $2.61 per SF when the cost to construct a new building requires rents in the $3.50 to $5.00 per SF range. NW Indiana Rental Rates are below replacement cost – which means rental income cannot support the necessary cost to construct new state of the art facilities that attract multi-national corporations
The O'Hare area is really the core of the Chicago market, with a large number of buildings, a significant amount of B2B industries, and a substantial shipping/freight component.
However, there are several market strengths and opportunities for the Gary/Chicago Airport:
Central DuPage County is a local distribution and assembly market, with some larger distribution centers that could not find space any closer to O'Hare.
I-55 is a very large local/regional distribution market, with many 3rd party logistics providers and consumer goods firms providing products to the greater Chicago MSA.
I-80 is a regional Distribution Corridor, with large buildings (500,000 SF+) typically servicing a network of stores/clients through the region. Also, the proximity to intermodal facilities may attract DC operations for imported goods (such as Wal-Mart and Dollar Tree Stores).
Office
There is no recent transaction history regarding office or administrative projects of significant size in the Gary submarket.
Manufacturing
In contrast to office, there were nineteen listed transactions for the Gary submarket for manufacturing space between 50,000 and 500,000 sq. ft. since 2007, indicating at least some activity in this area. The new tenants are in the following industries:
Food preparation and production
Building materials
Metal processing
Specialty chemicals, paints, and pigments
Plastics

THE GARY/CHICAGO INTERNATIONAL AIRPORT STRATEGIC BUSINESS PLAN FINAL
Landrum & Brown Ch III-75 April 2010
Packaging
Machine Products
Warehouse and Logistics
The Northwest Indiana and South Suburbs submarket lists 45 transactions for warehouse and logistics space of between 50,000 and 500,000 sq. ft., pointing to considerable activity in this sector. (MFG since 2007: NWI = 7, South Suburbs = 12, Warehouse/Logistics since 2007: NWI =6, South Suburbs = 39) While the leases were of various terms, sizes and for spaces of varying quality, gross rents averaged $2.75 - $3.75 per square foot.
Air Cargo
The Team performed a search of aviation cargo specific real estate transactions for the greater Chicago area. This included a significant number of lease and purchase transactions in the O’Hare area, ranging in size from 15-200,000 sq. ft. No air cargo transactions were reported for the Northwest Indiana area.
Regional Growth Efforts
The Gary region is recognized as a community that was once a strong industrial community, with strong credibility as a steel manufacturing location. Unfortunately, technological advancements and the off-shoring of this industry have left the area with significant un- and underemployment, as well as aging industrial infrastructure, such as steelyards, railroad marshalling yards, and dockyards.
US Steel retains a downsized steelworks in the community. This operation remains a very important employer, with over 8,000 employees in the community.
The area currently has several uncoordinated economic development and business attraction efforts underway.
Hospitality and Residential
There is a push for recreational and hospitality development in the area. For example, the City of Gary has worked to attract casinos and large hotels to the area. While these could provide an economic boost to the area, the current properties have suffered from the current economic climate, and properties such as the Majestic Star have even shown signs of financial distress. Interestingly, the RDA’s Comprehensive Plan for the Gary area showed in its analysis of Location Quotients that the region was already over concentrated in arts and recreation (as compared to Indiana and Cook County) as a result of the casino and gaming operations. This indicates a potentially precarious reliance on this one, highly sensitive industry for developing the local economy. Additionally, the Regional Development Authority has produced plans for new development on the site of US Steel’s former south Chicago works. This could create a 1,100 acre complex of residential areas and a lakefront park, resulting in new retail demand and local workforce opportunities.

THE GARY/CHICAGO INTERNATIONAL AIRPORT STRATEGIC BUSINESS PLAN FINAL
Landrum & Brown Ch III-76 April 2010
Manufacturing and Logistics
As noted earlier, the Chicago Regional Environmental and Transportation Efficiency Program (CREATE) has put forth initial plans to rationalize and integrate the region’s railroad network. The railroad consolidations of the past several decades have created a set of redundant rights of way across northwest Indiana. Clearing and/or rededicating these could open areas for development and create new transportation corridors.
Under current planning scenarios, Canadian National plans to develop the Kirk Yard near GYY into one of its two major hubs in the United States, making it the only regional facility with service to the Atlantic, Pacific, and Gulf of Mexico. The upgrade would increase throughput, but still free up land for non-railroad development and create opportunities for an inter-modal complex close to the Airport. The RDA has identified the Airport and surrounding property as a Mega Parcel for development, specifically targeted at transportation uses. This would include both freight and passenger use. This concept has not yet progressed to the point of producing a regional master plan, nor has it produced any scheme for funding the necessary land assembly, infrastructure improvements, or other business attraction activity.
Broader Community Issues
The community is still suffering politically from the loss of the area’s economic base, and is struggling to find a new vision and leadership. The regional political environment is upon occasion “challenging”. Regionalization is both argued and opposed depending on the parties involved. The regional tax base has eroded by 60 percent. City revenues are down to the point where some estimates show that they cannot sustain the airport. Property taxation within Indiana has been capped (1-2-3 formula). While this reduces burdens, it also severely constrains communities’ ability to invest in infrastructure and services. As evidence of this, the City of Gary has not recently offered tax abatements for any new businesses coming into Lake County. GYY and the RDA are signatories to the Chicago Gary Regional Airport Authority (CGRAA). This Authority provides considerable operating and capital financing to GYY, but also balances investments to Midway (MDW) and O’Hare (ORD). The future direction of the CGRAA is somewhat uncertain, and the surrounding counties and communities which benefit from the Authority’s activities may be asked to contribute funding.
Incentives and Attraction Programs
Several tools are available to incent corporate and other developments to the area. These could be coupled with the natural advantages of the community or site to ensure that the match between location and business is a successful one.
Indiana Investment Deduction Program
The Indiana Investment Deduction program is designed to provide Indiana business taxpayers with a three-year deduction from the assessed value of real and personal property for tax purposes. The program is intended to spur new investment and hiring in the state and may not be used in conjunction with any other deductions, and may not be used in a special valuation district (such as that used for TIF). The deduction is limited to $2 million per taxpayer per county per year. Of other

THE GARY/CHICAGO INTERNATIONAL AIRPORT STRATEGIC BUSINESS PLAN FINAL
Landrum & Brown Ch III-77 April 2010
interest to the GYY, the deduction can be applied to any of the potential uses envisioned by the current report other than restaurant (such as that which might be used to serve airport passengers). The Deduction must be used to support hiring or retention of employees and/or new investment. The company filing must sign an application to this effect, and the county can revoke the deduction if such goals are not met.
Indiana Enterprise Zones
The City of Gary is a defined enterprise zone (EZ) as listed by the State. This designation carries with it access to a variety of benefits. As listed by the 2005 Fiscal Issue Brief describing the program, these include:
“Investment Cost Credit: This is a state tax credit for equity investment in an EZ business. The credit is equal to a maximum of 30 percent of the price of the ownership interest purchased by the taxpayer. The allowable credit percentage up to 30 percent varies depending upon the type of investment, the type of business, and the number of jobs created by the investment.
Employment Expense Credit: This is a state tax credit for incremental wages paid by an EZ business to employees who are EZ residents. At least 90 percent of the employee’s services must be directly related to the EZ business, and at least 50 percent of the employee’s time must be spent working at the EZ business. The credit is equal to 10 percent of the additional wages paid to a qualified employee during the year up to a maximum of $1,500.
Loan Interest Credit: This is a state tax credit for interest income earned by a taxpayer from a loan that directly benefits an EZ business, increases EZ property values, or is used to rehabilitate, repair, or improve an EZ residence. The credit is equal to five percent of the loan interest received during the year.
Property Tax Investment Deduction: This is a property tax deduction for the increased value of an EZ business property due to real and personal property investment by the business. The added valuation may be deducted for up to 10 years. Qualified investment at an EZ location includes: (1) purchase of a building, new manufacturing or production equipment, or new computers and related office equipment; (2) costs associated with the repair, rehabilitation, or modernization of an existing building and related improvements; (3) onsite infrastructure improvements; (4) construction of a new building; and (5) costs associated with retooling existing machinery.”
Further analysis would be required to determine how these could be applied to businesses interested in locating in or at GYY.
Indiana Economic Development for a Growing Economy Tax Credit (EDGE)
In addition to the above, Indiana maintains a program for discretionary business attraction incentives in the form of the EDGE credit. The EDGE tax credit program is a payroll-based program, which provides tax credits to businesses creating or retaining jobs in Indiana. The credit is a refundable tax credit against a company’s Indiana state tax liability. EDGE can be awarded for up to 10 years and up to 100 percent of projected withholdings attributable to the company’s Indiana

THE GARY/CHICAGO INTERNATIONAL AIRPORT STRATEGIC BUSINESS PLAN FINAL
Landrum & Brown Ch III-78 April 2010
project. The company must maintain operations at the project site for at least two times the number of years, for which the tax credit is awarded. The company must demonstrate that receiving the tax credit is instrumental in its location decision.
Eligible facilities include: Manufacturing companies; regional headquarters; research and development facilities; distribution centers. Companies must make a significant capital investment and create a substantial number of jobs. In addition, the local community affected by the project must provide significant local incentives. Only Indiana resident employees will be eligible. The average wage for the positions must meet or exceed the county average. Contract and temporary workers are not eligible, nor are employees being shifted from one line to another, or from one Indiana location to another.
Indiana Capital Access Program (CAP)
The Capital Access Program (CAP) is a small business credit enhancement program that creates a specific cash reserve fund for the lender to use as additional collateral for loans enrolled in the Program. CAP allows lenders to consider making slightly riskier loans that might not meet conventional lending requirements. Under the Program, the borrower, the lender and the Indiana Economic Development Corporation (IEDC) each contribute a percentage of the loan into the lender's reserve fund, which pools contributions from all CAP loans. The lender determines whether a loan is made, the interest rate, the terms and conditions and the amount contributed to the reserve fund (1.5 percent to 3.5 percent of the loan). The borrower pays its portion and the lender matches that amount (which the lender passes on to the borrower).
SUMMARY
The immediate surroundings of GYY remain a semi-developed heavy industrial area. The region possesses significant rail, highway, and other infrastructure providing access to the immediate area. Passenger rail to the site is currently limited. The workforce living within easy commuting distance of the site retains the characteristics of that for heavy industry, with concentrations of industrial occupations, slightly higher unemployment, significantly lower household incomes, and lower educational attainment (as compared to national averages). GYY maintains an activated Foreign Trade Zone (FTZ), and the Port of Indiana has expressed interest in partnering with GYY in some fashion as a result.
The potential for non-aviation development near the Airport is limited given the depressed nature of the immediate area, the workforce characteristics, and the lack of other local business infrastructure. However, there could be opportunities for small-scale industrial uses at or near the site. It also represents an attractive location for small-scale assembly due to the presence of the FTZ as well as the residual presence of machinists and other skilled workforce. (The actual size and capabilities of this workforce must be verified). The Canadian National (CN)’s purchase of the EJ&E, coupled with the airport’s relationship with the Ports of Indiana and its own Foreign Trade Zone (FTZ) could provide other regional connections to be used to GYY’s advantage.

THE GARY/CHICAGO INTERNATIONAL AIRPORT STRATEGIC BUSINESS PLAN FINAL
Landrum & Brown Ch III-79 April 2010
Since light manufacturing and maintenance could be appropriate uses for the site, the Airport should consider exploring with The Boeing Company possible additional use of the site complementary to their operations. There are mutual benefits which could accrue (discussed in the Recommendations section). Stand alone retail is not currently viable due to the lack of purchasing power in the immediate community. However, there could be demand for retail services directly associated with air charter passengers or for the convenience of other businesses locating on the site.
Airport Environmental Issues
During the investigation and preparation of this business plan, a number of airport land environmental issues have been observed. It appears that a significant amount of environmental study has gone into the Environmental Impact Statement (EIS) for the extension of Runway 12/30. Additional environmental analysis is available for specific areas that are either in remediation currently or have been identified as environmental sites that require cleanup.
It is recommended that an environmental “baseline study” be undertaken for all Airport land. This study will be a combination of current information that is held by the Airport and its consultants, as well as a review of all land holdings and areas of possible concern. A baseline study will provide Airport management with a map and back-up data to allow future construction and development to move forward without time consuming delays. This knowledge will also provide information about all tenant sites and responsibility for any environmental issues on adjoining (non-airport) land that would impact development on the Airport.
SECTION III-3 FINANCE CONSIDERATIONS
This section summarizes the financial structure and funding of the Gary-Chicago International Airport (GYY). In order to fully understand the finances of GYY, it is essential that the organizational and financial relationships between GYY and several other governmental entities be considered.
Chicago - Gary Regional Airport Authority
In 1995, the City of Chicago and the City of Gary (the Signatories) entered into a compact (Compact) relating to the establishment of the Chicago-Gary Regional Airport Authority (CGRAA). Exhibit III-17 depicts the relationships of the several organizations related to the Compact.

THE GARY/CHICAGO INTERNATIONAL AIRPORT STRATEGIC BUSINESS PLAN FINAL
Landrum & Brown Ch III-80 April 2010
Exhibit III-17 – Organizational Relationships
Unison Consulting, Inc.
The CGRAA receives funding from the City of Chicago and the City of Gary. Upon the request of a Signatory, the CGRAA Board may allocate operating funds of the Authority to a Signatory as reimbursement for the direct expenses incurred by that Signatory in complying with its obligations under the Compact.
The Compact may be terminated at any time by the City of Chicago upon six months notice and may be terminated by the City of Gary upon six months notice at five year intervals following January 1, 2001.18
Financial Relationships
Exhibit III-18 is attached to provide further clarification regarding the financial relationships of the parties to the Compact as well as to several other organizations, including:
1. The Northwest Indiana Regional Development Authority (RDA). 2. Federal Aviation Administration (FAA). 3. Lake County, Indiana. 4. Airport users
18 Source: Compact between the City of Chicago and the City of Gary Relating to the Establishment
of the Chicago-Gary Regional Airport Authority, 15-45.
Chicago-Gary Regional Airport Authority
(CGRAA)
City of Chicago (Chicago)
City of Gary (Gary)
Chicago Department of Aviation
(CDA)
Gary/Chicago International Airport Authority
(GCIAA)
Chicago – O’Hare International Airport
(ORD)
Gary/Chicago International Airport
(GYY)
Chicago - Midway International Airport
(MDW)

TH
E G
AR
Y/
CH
ICA
GO
IN
TER
NA
TIO
NA
L A
IRP
OR
T
S
TR
AT
EG
IC B
US
INES
S P
LA
N
F
INA
L
Landru
m &
Bro
wn
Ch I
II-8
1
April 2010
Exh
ibit
III
-18
– F
inan
cial
Rela
tio
nsh
ips
- 2
00
8 A
ctu
al

THE GARY/CHICAGO INTERNATIONAL AIRPORT STRATEGIC BUSINESS PLAN FINAL
Landrum & Brown Ch III-82 April 2010
The following paragraphs further describe the financial relationships of the Compact and are labeled to correspond with the flow chart on Exhibit III-18.
A. According to the terms of the Compact, each year on or before July 1, the CGRAA shall prepare a budget of its estimated expenditures for the next calendar year and request each Signatory to appropriate funds sufficient to fund its allocable portion of the Authority’s budget. The share paid by each Signatory shall be in proportion to the prior year’s operating expenses for their airports, being ORD, MDW and GYY (collectively, the Regional Airports). The share of each Signatory shall not exceed one percent (one percent) of the total operating expenses of ORD and GYY airports, respectively, in their prior fiscal year. 19 In 2007 and 2008, the City of Chicago paid $853,540 and $994,734, respectively, to the CGRAA and the City of Gary paid $4,246 and $4,383, respectively.20
B. The Compact included an Initial Capital Plan that consisted of a list of initially approved capital projects at ORD, MDW and GYY. Each year after 1996, on or before December 31, the Authority Board shall adopt a five-year Capital Plan for the Regional Airports, providing for all Capital Projects that each Signatory proposes to undertake or continue during the following five year period. If the Board fails to adopt a Capital Plan by December 31 of each year, the prior Capital Plan (including the Initial Capital Plan) shall remain in effect. Upon the request of a Signatory, the Capital Plan may be modified by the Board from time to time. Once a Capital Project is included in the Capital Plan, a Signatory is authorized to complete that Capital Project without further Board approval. Any Capital Project to be financed with passenger facility charge revenues shall be included in the Capital Plan.
The CGRAA Board may allocate operating funds of the Authority to a Signatory as reimbursement for the direct expenses incurred by that Signatory in complying with its obligations under the Compact. In 2008 and 2009, GYY received $687,342 and $683,000 directly from the CGRAA21 and the City of Chicago airports – ORD and MDW - received no funds. The CGRAA incurred additional expenditures of approximately $69,000 for its staff and approximately $170,000 “for the benefit of the Gary-Chicago International Airport”22. The funding given by CGRAA to GYY may be used for either capital projects or operating expenses. Due to a decline in anticipated property tax receipts, in 2010 GYY plans to utilize a minimum of $320,000 from CGRAA to fund staff operating expenses and is likely to request an additional $360,000 for operating expenses and as reimbursements for capital projects.
C. Lake County, Indiana, through the County Collector, collects property taxes, an auto excise tax and several other excise taxes and remits these revenues to GCIAA. In 2008, revenues from these taxes collectively totaled $1,313,111. The property tax receipts due in 2008 were $1,260,784. The $1,731,930 of 2008 property taxes shown in Table III-1 included the receipt of six months of taxes for 2007. The 2010 budget for GYY includes estimated property tax receipts of $543,273 and a total of $596,100 for the tax revenue category. The reason for the anticipated decrease in property taxes in 2010 is due to the tax caps enacted by the State of
19 Source: Compact §25-5(b)
20 Source: CGRAA 2008 Annual Report. 21 Source: GYY airport staff. 22 Source: CGRAA 2008 Annual Report.

THE GARY/CHICAGO INTERNATIONAL AIRPORT STRATEGIC BUSINESS PLAN FINAL
Landrum & Brown Ch III-83 April 2010
Indiana House Bill 1001. In December 2008, the GCIAA Board submitted a petition to the Distressed Unit Appeals Board (DUAB) to request adjustment to the tax caps, and in May 2009 it was granted one-time relief totaling $259,632. In December 2009, the Board petitioned the DUAB for relief in 2010.
D. The Cities of Gary, Hammond and East Chicago; the Counties of Lake and Porter; and the State of Indiana provide annual funding to the RDA. The cities and counties each provide $3.5 million per year from casino and economic development income taxes. The state of Indiana provided $20 million earmarked for GYY expansion projects and provides “up to” $10 million per year from monies resulting from the “Major Moves” lease of the Indiana Toll road.23 The RDA funding is projected to total $27,500,000 per year through 2015 when the state commitment expires. However, the Chapter 11 bankruptcy filing on November 23, 2009 by the Majestic Star Casino, which operates two riverboat casino boats in Gary near the GYY airport, may impact the ability to provide the pledged amount of support for the RDA. Majestic contends that they will continue to operate the casino while in reorganization. However, it has been reported that Majestic owes Gary $7.45 million.24
E. The RDA was “created to seize historic opportunity to meet the needs of the Greater Chicago transportation and other infrastructure growth”25. The RDA is focused on providing funding for four catalytic projects:
1. The Gary/Chicago Airport 2. The South Shore Railroad 3. A Regional Bus system 4. Lake Michigan shoreline development
The RDA does not contribute to the operating budget of GYY. The RDA does however make payments to the GCIAA for approved projects, such as the commitment of approximately $20 million towards the cost of GYY expansion projects.
23 Source: Northwest Indiana Regional Development Authority Comprehensive Economic Development
Plan of February 20, 2007 by Policy Analytics, LLC. 24 Source: NWI.com, November 30, 2009. 25 RDA presentation “Transforming our Economy to Robust World Class Status”

THE GARY/CHICAGO INTERNATIONAL AIRPORT STRATEGIC BUSINESS PLAN FINAL
Landrum & Brown Ch III-84 April 2010
Table III-1: Gary/Chicago International Airport – Income Statement
Income 2004 2005 2006 2007 2008 2009 2010 (Budget)
Property Taxes 502,612$ 1,996,325$ 1,196,019$ 737,590$ 1,731,930$ 1,171,840$ 543,273$
F inancial Institution Tax 4,410 9,854 2,521 7,150 4,489 3,646 4,489
Auto Excise Tax 49,250 20,190 41,290 65,913 39,577 37,534 39,577
CVET 6,917 14,830 4,028 12,486 8,761 7,841 8,761
Federal Intergovernmental - - - - - 4,253 6,500
Local Intergovernmental (CGRAA) 1,837 - - - 36,939 456,186 320,000
Fuel Flowage Charges 86,302 81,503 89,490 124,409 155,105 168,784 160,632
Terminal User Fee 21,330 9,614 12,080 10,620 16,464 11,919 16,500
Landing Fees 66,704 69,400 61,673 88,080 66,451 75,493 92,608
Parking Fees - 199,583 - 5,748 36,898 25,840 34,800
Misc. Revenue 175,026 - 138,611 98,597 52,812 75,299 119,050
Interest Income 5,895 14,926 59,256 41,155 - - 2,500
T-Hangar 151,121 131,930 135,496 138,507 139,949 131,815 145,188
Building/Land Rent 481,317 489,957 543,113 544,316 637,609 688,271 707,714
Reimbursement Income - 65,000 215,711 - - - -
Total Income 1,552,720$ 3,103,110$ 2,499,287$ 1,874,572$ 2,926,982$ 2,858,722$ 2,201,591$
Expenses
Salaries and Wages 751,645$ 780,160$ 778,588$ 913,382$ 883,444$ 800,343$ 823,374$
Employer Social Security 45,635 47,533 47,165 57,140 53,914 48,746 51,049
Employer Medicare 10,673 11,117 11,113 13,719 12,609 11,400 11,939
Employer PERF 47,569 39,803 53,475 56,121 57,577 54,343 57,636
Employer Health 53,405 113,472 107,169 106,266 101,373 95,734 104,296
Workmen's Compensation 9,207 13,304 273 9,357 - 17,708 18,316
Unemployment Comp. 288 1,690 1,628 1,849 1,765 1,442 1,309
EE Drug Screenings -New/Rand - - - 175 190 1,140 1,800
Total Personnel $918,422 $1,007,078 $999,410 $1,158,010 $1,110,872 $1,030,856 $1,069,719
Board Meeting Attendance Fees - - 2,415 3,395 3,500 3,360 5,390
EE Assistance Program - - - - - 512 450
Office Supplies 7,131 11,700 7,628 5,420 5,334 3,872 7,075
Minor Office Furn & Equip <5000 - - 1,273 3,877 26,064 - 5,000
Uniforms - - 925 330 1,063 843 1,190
Gasoline 30,914 31,695 30,090 39,744 53,842 29,816 45,000
Garage & Motor Supplies 22,473 19,645 20,386 1,182 - - -
Other Supplies 34,241 30,490 10,189 59,644 65,579 54,150 60,050
Wildlife Management 569 600 349 685 461 883 900
Repair Parts 23,965 17,854 32,461 21,329 57,428 107,070 55,600
Professional Services 647,124 980,341 443,741 201,927 222,229 593,968 253,402
Travel & Education 20,129 33,121 21,496 48,836 34,251 25,859 33,160
Telephone & Communication 57,533 55,767 68,621 70,080 63,445 47,587 53,550
Printing & Advertising 2,579 2,157 3,212 1,202 1,048 641 1,190
Publications/Training Materials - - 724 - - - -
Security Services - - 95,731 60,824 44,271 40,686 34,804
Insurance 105,586 107,592 80,717 102,388 105,254 99,834 100,250
Utility Services 352,953 421,015 314,177 284,907 266,225 221,933 306,000
Repairs & Maintenance 76,802 115,172 121,082 115,613 79,185 236,743 113,652
ARFF - Airport Rescue Firefighter - - 43,396 48,680 43,899 30,657 24,119
Landscaping Services - - 39,402 28,516 22,095 22,420 25,000
Janitorial Services - - 53,825 63,375 29,629 38,817 50,000
Air Traffic Control Service - - - 23,376 8,410 - -
Rentals 17,811 18,890 17,134 19,159 24,113 21,760 27,140
Debt Service - Principal - - - - - - -
Debt Service - Interest 6,689 8,510 23,404 - - - -
Subscriptions & Dues 10,298 22,606 10,372 12,328 12,493 11,037 11,260
Other Charges & Services 38,763 956 5,643 2,425 1,483 1,360 2,110
Capital Outlay 6,976 - 22,584 23,865 11,991 74,330 -
Total Expenses 2,380,957$ 2,885,190$ 2,470,388$ 2,401,118$ 2,294,163$ 2,698,994$ 2,286,010$
Net Income (828,237)$ 217,921$ 28,898$ (526,545)$ 632,818$ 159,728$ (84,419)$
Other Income
Operating Transfer In -$ -$ 1,142,614$ 450,000$ 230,000$ -$ -$
Other Expense
Operating Transfer Out -$ -$ 1,030,000$ -$ 680,000$ -$ -$
Total Net Income (828,237)$ 217,921$ 141,512$ (76,545)$ 182,818$ 159,728$ (84,419)$
Source: GCIA records.Compiled by Unison Consulting, Inc.

THE GARY/CHICAGO INTERNATIONAL AIRPORT STRATEGIC BUSINESS PLAN FINAL
Landrum & Brown Ch III-85 April 2010
F. Following the effective date of the Compact, the City of Chicago filed a PFC application to use a portion of PFC revenues collected at Chicago airports to provide financing for GYY capital projects included in the Initial Capital Plan. The City of Chicago also agreed to provide PFC funding for “eligible passenger facility charge projects as may from time to time in the future become part of Gary Regional Airport’s Capital Plan as approved by the Board, which Capital Projects are compatible with Gary Regional Airport’s function as a reliever airport.”26 Also, “subject to FAA approval, the amount of passenger facility charges used by the City of Chicago for Capital Projects at the Gary Regional Airport in any fiscal year … shall not exceed one and one-half percent of the aggregate passenger facility charges collected by the City of Chicago at the Chicago Airports.”27 GYY cannot collect PFC revenues because it is not currently a commercial service airport.
Between 1996 and 2006, a total of nine PFC applications were approved that included funding for twenty-three capital projects at GYY. Seven of these applications were approved for collection of PFC revenues at ORD and two applications were approved for collection of PFC revenues at MDW.
Six (of the nine approvals) included eighteen PFC projects at GYY and were approved for collection at ORD between 1996 and 2002. Each of these projects has been completed and the PFC funds have been expended. However, PFC expenditures have exceeded the approved amounts for thirteen of the PFC projects, and amendment applications will need to be filed by the City of Chicago. To avoid the potential termination of PFC collection authority, this issue should be addressed promptly.
Subsequently, between 2003 and 2006, the remaining three (of the nine) PFC applications were approved that included the following projects at GYY:
Project No. Application Number and
Project Description Original
Authority Current
Authority Amount
Expended 03-10-C-00-MDW
G1008 Expand Passenger Terminal $450,000 $0 $407,318 G6011 Hangar Ramp Construction $1,100,000 $0 $1,017,741 06-11-C-00-MDW
G6012 Railroad Relocation and Runway Extension
$1,300,000 $0 $0
06-19-C-00-ORD
G6012 Railroad Relocation and Runway Extension
$8,200,000 $8,200,000 $0
The City of Chicago amended the MDW applications to $0 in preparation for the privatization (long term lease) of MDW. Subsequently, the FAA advised the City of Chicago that they would be required to reimburse the PFC fund with other funds for the approximately $1,425,000 that had been expended on the 2003 MDW PFC application for GYY. Funding of $1,300,000 for the G6012 Railroad Relocation and Runway Extension project with PFCs collected at MDW is no longer available.
26 Compact. 27 Ibid.

THE GARY/CHICAGO INTERNATIONAL AIRPORT STRATEGIC BUSINESS PLAN FINAL
Landrum & Brown Ch III-86 April 2010
However, GYY management reports that the amendment to the Compact that allowed for the privatization of Midway included a provision that any PFC shortages from Midway would be made up by the City of Chicago from other revenue sources.
No PFC expenditures have been reported for the G6012 Railroad Relocation and Runway Extension project (source). It is understood that this project has been impeded by delays in negotiating a relocation agreement with the Canadian National Railroad. Under the FAA’s PFC program regulations, a PFC project approved for impose and use authority needs to have a notice to proceed on construction within two years of the date of approval by the FAA or the collection authority lapses, and a new application would need to be made following a notice to proceed on the project. GYY management reports that construction did start on the project within the required two years.
GYY has received no PFC funds from the Chicago airports since 2005, presumably because of slow progress on the runway project. As described above, the GCIAA Board has the ability each year to submit new capital projects at GYY, including new PFC projects, to the CGRAA Board for its approval.
G. The FAA makes AIP grant payments to GCIAA to reimburse the cost of eligible capital improvements and equipment at GYY. Funds received from the FAA by GYY are retained in a capital projects account until used to reimburse GYY for expenditures on the approved projects. The FAA awarded a $57,845,000 Letter of Intent (LOI) over 10 years (2006-2015) for the railroad relocation/runway extension project. The LOI commitment was to be matched with approximately $20 million of local funds from the State through the RDA and $9.5 million in PFC funds collected at O’Hare and Midway airports. In addition to the LOI grants, GYY received two other grants totaling $2,694,000 from the FAA in FFY 2005 and FFY 2009 28. Total FAA funding in 2008 was $6,884,700 consisting of $6,038,700 from the LOI and $846,000 from an American Recovery and Reinvestment Act grant. Under the LOI, the expected amount of FAA grant funding for Federal Fiscal Years 2010 and 2011 is $5,150,000 because GYY will only be eligible for $150,000 in AIP entitlement funds due to having less than 10,000 enplanements in CY 2008 and CY 2009. If more than 10,000 enplanements occur beginning in CY 2010, then GYY’s AIP funding would be $6,000,000 per year, including $5,000,000 in discretionary funds and $1,000,000 in entitlement funds.
The LOI schedule calls for payments through FY 2015. After expiration of the LOI, GYY will not benefit from a guaranteed level of AIP funding each year. Rather, GYY will be competing with other airports in the region and in the country for discretionary funds. FAA will base any decision to award AIP discretionary funds to GYY on its evaluation of GYY’s AIP eligible capital development needs against the FAA project priority criteria and the needs of other airports. In addition, the LOI represents a commitment of the FAA to provide AIP funding, but it is not a legally binding obligation. Before issuing a grant under an LOI the FAA typically examines the progress on the LOI project. As noted above, progress on the project has been impeded due to delays in negotiating a relocation agreement with the Canadian
28 Source: FAA records. Note The year of grant award and actual receipt of funds may differ.

THE GARY/CHICAGO INTERNATIONAL AIRPORT STRATEGIC BUSINESS PLAN FINAL
Landrum & Brown Ch III-87 April 2010
National Railroad. While it is rare for the FAA to unilaterally terminate an LOI, the FAA has in the past deferred LOI payments when a project has been interrupted due to unforeseen circumstances.
H. Airport tenants and users pay rents, fuel flowage fees, and user fees to GYY. A schedule of user fees for 2009 is included as Table III-2. The schedule of user fees appears reasonable for an airport the size of GYY. During 2008 and 2009, the total of user fees were $1,105,288 and $1,177,421, respectively, and the budget for 2010 is $1,278,991, as shown in Table III-1.
Table III-2: 2009 Rates and Charges

THE GARY/CHICAGO INTERNATIONAL AIRPORT STRATEGIC BUSINESS PLAN FINAL
Landrum & Brown Ch III-88 April 2010
Table III-2: 2009 Rates and Charges (continued)
Capital Improvement Program The Capital Improvement Program (CIP) for GYY for the Federal Fiscal Years 2009 to 2014 is included in Table III-3. This is the CIP that was presented to the FAA to identify future projects that are eligible for AIP grant funding. The CIP includes the runway expansion program, four airfield projects and one parking equipment project. However, the CIP does not show the total cost of the runway expansion program, only the AIP funding and local share for the years 2009 to 2014. GYY is generally able to receive AIP grant funding in the amount of 95 percent of the cost of eligible airfield projects, but parking projects are not AIP eligible. Therefore, GYY needs to provide only a five percent local match for airfield projects. The total estimated cost of the CIP is approximately $41 million with all but approximately $2 million to be paid with federal funds.
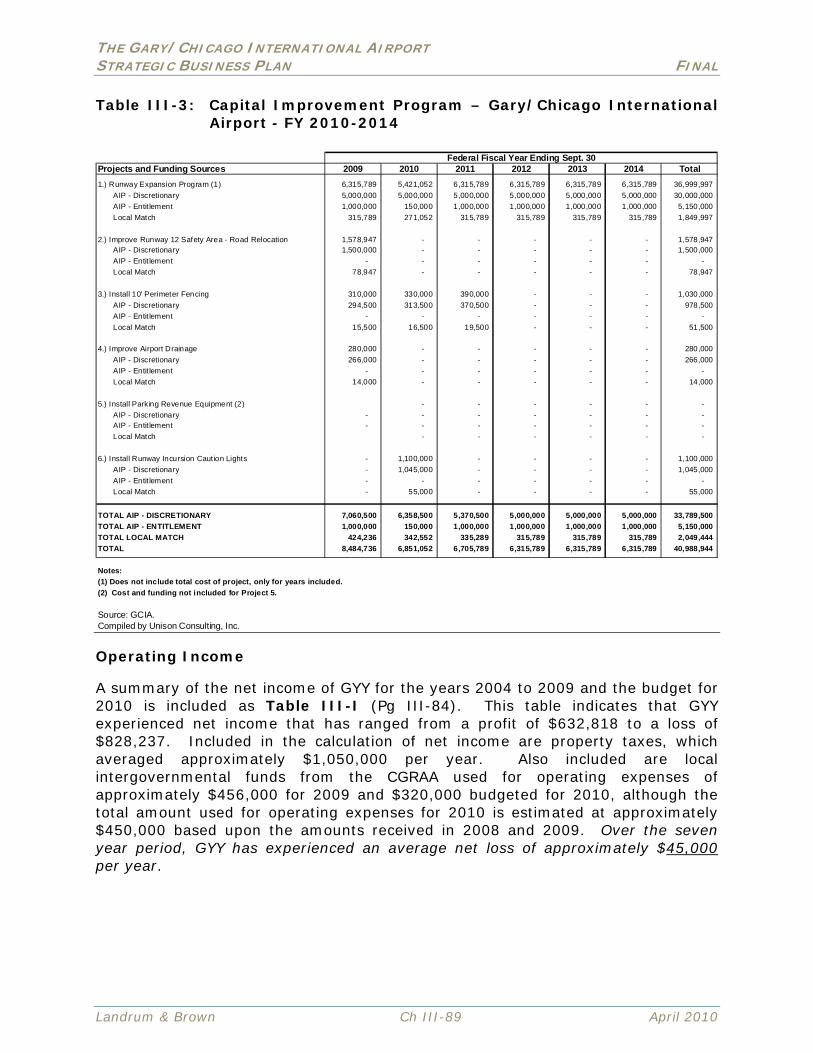
THE GARY/CHICAGO INTERNATIONAL AIRPORT STRATEGIC BUSINESS PLAN FINAL
Landrum & Brown Ch III-89 April 2010
Table III-3: Capital Improvement Program – Gary/Chicago International Airport - FY 2010-2014
Projects and Funding Sources 2009 2010 2011 2012 2013 2014 Total
1.) Runway Expansion Program (1) 6,315,789 5,421,052 6,315,789 6,315,789 6,315,789 6,315,789 36,999,997
AIP - Discretionary 5,000,000 5,000,000 5,000,000 5,000,000 5,000,000 5,000,000 30,000,000
AIP - Entit lement 1,000,000 150,000 1,000,000 1,000,000 1,000,000 1,000,000 5,150,000
Local Match 315,789 271,052 315,789 315,789 315,789 315,789 1,849,997
2.) Improve Runway 12 Safety Area - Road Relocation 1,578,947 - - - - - 1,578,947 AIP - Discretionary 1,500,000 - - - - - 1,500,000
AIP - Entit lement - - - - - - -
Local Match 78,947 - - - - - 78,947
3.) Install 10' Perimeter Fencing 310,000 330,000 390,000 - - - 1,030,000
AIP - Discretionary 294,500 313,500 370,500 - - - 978,500
AIP - Entit lement - - - - - - -
Local Match 15,500 16,500 19,500 - - - 51,500
4.) Improve Airport Drainage 280,000 - - - - - 280,000
AIP - Discretionary 266,000 - - - - - 266,000
AIP - Entit lement - - - - - - -
Local Match 14,000 - - - - - 14,000
5.) Install Parking Revenue Equipment (2) - - - - - -
AIP - Discretionary - - - - - - - AIP - Entit lement - - - - - - -
Local Match - - - - - -
6.) Install Runway Incursion Caution Lights - 1,100,000 - - - - 1,100,000
AIP - Discretionary - 1,045,000 - - - - 1,045,000
AIP - Entit lement - - - - - - -
Local Match - 55,000 - - - - 55,000
TOTAL AIP - DISCRETIONARY 7,060,500 6,358,500 5,370,500 5,000,000 5,000,000 5,000,000 33,789,500
TOTAL AIP - ENTITLEMENT 1,000,000 150,000 1,000,000 1,000,000 1,000,000 1,000,000 5,150,000
TOTAL LOCAL MATCH 424,236 342,552 335,289 315,789 315,789 315,789 2,049,444
TOTAL 8,484,736 6,851,052 6,705,789 6,315,789 6,315,789 6,315,789 40,988,944
Notes:
(1) Does not include total cost of project, only for years included.
(2) Cost and funding not included for Project 5.
Source: GCIA.Compiled by Unison Consulting, Inc.
Federal Fiscal Year Ending Sept. 30
Operating Income A summary of the net income of GYY for the years 2004 to 2009 and the budget for 2010 is included as Table III-I (Pg III-84). This table indicates that GYY experienced net income that has ranged from a profit of $632,818 to a loss of $828,237. Included in the calculation of net income are property taxes, which averaged approximately $1,050,000 per year. Also included are local intergovernmental funds from the CGRAA used for operating expenses of approximately $456,000 for 2009 and $320,000 budgeted for 2010, although the total amount used for operating expenses for 2010 is estimated at approximately $450,000 based upon the amounts received in 2008 and 2009. Over the seven year period, GYY has experienced an average net loss of approximately $45,000 per year.

TH
E G
AR
Y/
CH
ICA
GO
IN
TER
NA
TIO
NA
L A
IRP
OR
T
STR
AT
EG
IC B
US
INES
S P
LA
N
FIN
AL
Landru
m &
Bro
wn
Ch I
II-9
0
April 2010
Tab
le I
II-4
: G
ary
In
tern
ati
on
al
Air
po
rt –
Su
rvey R
esu
lts
of
Gen
era
l A
via
tio
n a
nd
No
n-H
ub
Air
po
rts
Co
mp
ari
son
of
Dir
ect
or
Sala
ry,
Sta
ffin
g a
nd
An
nu
al
Op
era
tin
g E
xp
en
se
N
on
-Hu
b
Air
po
rts
GA
-- S
urv
eyed
Air
po
rts
Air
po
rt
Ch
ara
cteri
stic
s R
ock
ford
G
ary
D
eca
tur
Du
Pag
e
An
ders
on
M
un
icip
al
Co
lum
bu
s M
un
icip
al
Elk
hart
M
un
icip
al
Ch
icag
o
Execu
tive
Au
rora
M
un
icip
al
La P
ort
e
Mu
nic
ipal
Po
rter
Co
un
ty
Mu
nic
ipal
Cit
y/
Sta
te :
Rock
ford
, IL
G
ary,
IN
D
ecatu
r, I
L D
uPa
ge,
IL
Ander
son,
IN
Colu
mbus,
IN
Elk
har
t,
IN
Chic
ago/W
hee
ling,
IL
Auro
ra,
IL
La P
ort
e,
IN
Val
par
aiso
, IN
N
um
ber
of
Runw
ays
2
2
3
4
2
2
3
3
3
2
2
Runw
ay
length
s(ft
.):
No.1
1
0,0
04
7
,00
3
8,4
96
7
,57
1
5,4
00
6
,40
0
6,5
00
5
,00
0
6,5
01
5
,00
0
70
01
N
o.2
8
,20
0
3,6
03
6
,79
9
5,1
01
3
,40
0
5,0
00
4
,00
1
4,3
86
5
,50
3
2,8
00
4
00
1
No.3
n
a
na
5,2
99
4
,75
0
Na
na
2,5
00
3
,66
0
3,1
98
n
a
na
No.4
3,3
99
Annual
Enpla
nem
ents
(2
008)
11
5,1
54
4
,35
3
1,0
96
0
0
0
0
3
2
0
0
5
Num
ber
of
airc
raft
base
d
11
4
96
9
0
36
5
73
6
8
73
2
65
2
59
6
8
15
2
Aircr
aft
Oper
atio
ns
per
day
1
21
2
85
1
22
2
73
7
4
10
7
91
2
97
1
82
5
6
19
1
Su
rvey
Info
rmati
on
2
Airport
Dir
ecto
r Annual Sala
ry 3
$
18
0,0
00
$
15
0,0
00
$
70
,00
0
NR
$
48
,00
0
$6
9,0
00
$
66
,00
0
NR
N
R
NR
$
81
,90
0
Tota
l Airport
Sta
ff
38
2
2
21
N
R
5
5
9
13
7
5
1
1 -
(3 P
T)
Annual
Oper
atin
g
Exp
ense
$
9,2
00
,00
0 $
2,7
00
,00
0 $
2,8
00
,00
0 $
6,0
00
,00
0 $
80
0,0
00
$1
,20
0,0
00
$7
50
,00
0
$7
03
,09
6
$1
,00
0,0
00
N
R
$1
,70
0,0
00
Note
: N
R indic
ates
, “N
ot
Rep
ort
ed.”
1
Cal
cula
ted b
ased
on 3
65 d
ays
per
yea
r.
2
Info
rmat
ion a
s of
2008.
3
Air
port
Direc
tor's
sala
ry f
or
Gar
y In
t'l Air
port
is
a co
nsu
ltan
t.
Sourc
e: S
urv
ey b
y U
nis
on C
onsu
ltin
g,
Inc.
THE GARY/CHICAGO INTERNATIONAL AIRPORT STRATEGIC BUSINESS PLAN FINAL
Landrum & Brown Ch III-91 April 2010
Benchmark Survey
Although the scope of the engagement did not include a detailed study of the organization and staffing of GYY, a brief survey was performed of staffing, operating expenses and airport director salaries at comparable airports in the region. The results of the survey suggest that a more detailed review should be performed of the GYY organization and operating expenses.
CONCLUSIONS
The following financial conclusions have been reached:
1. The City of Chicago provides 99 percent of the funding to the CGRAA. The City of Chicago can terminate the Compact at any time upon giving six months notice.
2. GYY receives approximately $680,000 per year directly from the CGRAA through the Compact that can be used for capital or operating requirements. The operating budget for CY 2010 includes $320,000 from the Compact, primarily for several employees at GYY, although the total amount of direct Compact funding is estimated at $680,000 based upon the amounts received in 2008 and 2009.
Property tax revenues, which averaged approximately $1,050,000 during the most recent seven years, are budgeted to decline to approximately $543,000 in 2010 due to the state tax caps unless relief is given by the DUAB.
3. The Cities of Gary, Hammond and East Chicago; the Counties of Lake and Porter; and the State of Indiana provide funding to the RDA of up to $27,500,000 per year, but the bankruptcy filing of Majestic Star Casino could impact this funding. Majestic Star reportedly owes Gary $7.45 million.
4. The RDA does not contribute to the operating budget of GYY. The RDA does make payments to the GCIAA for approved capital projects.
5. GYY cannot collect PFCs to fund capital projects since it is not currently a commercial service airport, and GYY has received no PFC funds from Midway and O’Hare since 2005. The lack of any PFC expenditures for the railroad relocation/runway extension project would indicate that the $8,200,000 of collection authority from ORD was at risk of lapsing due to the passage of time, although GYY management has indicated that the project started within the regulatory requirements and therefore the funding remains intact. The $1,300,000 of PFC collection authority from MDW was cancelled by Chicago, although GYY management states that under an amendment to the Compact, any PFC funding lost would be replaced by the City of Chicago. A new PFC application would be required to obtain PFC funding for additional projects at GYY. The GCIAA Board has the ability each year to submit new capital projects at GYY, including new PFC projects, to the CGRAA Board for its approval.
6. GYY is programmed to receive from the FAA approximately $5.1 to $6 million per year, depending upon the number of enplaned passengers that use the airport, to reimburse it for expenditures on the railroad relocation/runway
THE GARY/CHICAGO INTERNATIONAL AIRPORT STRATEGIC BUSINESS PLAN FINAL
Landrum & Brown Ch III-92 April 2010
extension project. This funding will expire after federal FY 2015. In addition, the funding could be at risk of deferral, if not outright loss, if GYY is unable to execute a relocation agreement with the Canadian National Railroad and proceed to implement the project.
7. Due to the FAA classification of GYY, it is able to receive up to 95 percent federal funding for eligible airfield projects.
8. GYY does not currently generate enough operating income on the airport to be profitable without financial support from property taxes, the CGRAA or some other external source.
9. The results of a brief survey of comparable airports in the area suggest that a more detailed review should be performed of the GYY organization and operating expenses.
SECTION III-4 GOVERNANCE
The Gary/Chicago International Airport (GYY) is governed by two separate authorities – The Gary/Chicago International Airport Authority (GCIAA) and the Chicago-Gary Regional Airport Authority (CGRAA). The GCIAA is responsible for day-to-day operation of the airport, as well as initial determination of capital development. The CGRAA provides financial support to GYY and also has authority to review and approve capital development at GYY, as well as development at Chicago O’Hare International Airport (ORD) and Chicago Midway Airport (MDW). The oversight by two separate airport authorities represents a unique governance structure.
This section of the analysis summarizes the structure and powers and qualifications requirements for each authority and offers observations about the impact of the governance structure on potential business models for the airport. The report also discusses the potential for a public-private partnership (3P) program for GYY.
GCIAA
The GCIAA is authorized by Indiana law and was established to provide regional input into the operation and development at GYY, in recognition that the Airport represents an asset not just for the City of Gary, but for the northwest Indiana region. However, except to the extent they contribute to the Northwest Indiana Regional Development Authority, which in turn contributes capital development funds to GYY, no Indiana jurisdiction other than the City of Gary, has financial responsibility for the Airport. The GCIAA is governed by a Board of Directors under the authority of IC (Indiana Code) 8-22-3-1 et seq. The Board’s powers, its makeup and membership qualifications are summarized below.
Board Powers and Authorities
The GCIAA is responsible for the day-to-day operations of GYY, including undertaking capital expenditures. The powers of the GCIAA Board are spelled out in IC 8-22-4-11. The Board has the powers typically granted to the governing bodies of airports to enable them to oversee the normal operations of the Airport. These powers include: the power to contract; the power to set fees for the use of the airport; the power to establish budgets and incur indebtedness; the power to

THE GARY/CHICAGO INTERNATIONAL AIRPORT STRATEGIC BUSINESS PLAN FINAL
Landrum & Brown Ch III-93 April 2010
acquire property by any means, including condemnation; to hire employees; the power to establish rules and regulations for the Airport; the power to approve rights-of-way, etc. Of particular relevance to the review of governance are Sections 11(4) and 11(20). Section 11(4) grants authority to levy taxes, but it also sets maximum rates for property taxes that may be imposed. However, according to the Airport’s attorney, the GCIAA may levy taxes only within the City of Gary. Section 11(20) permits the CGIAA to enter into leases or management contracts for the entire Airport of up to 99 years’ duration.
Board Makeup
The Board consists of seven members. IC 8-22-3.4.3 specifies the makeup of the Board as follows:
Four members appointed by the Mayor of Gary
One member appointed by the Lake County Commissioners (the county in which GYY is located)
One member appointed by the Porter County Commissioners (the adjacent county closest to the airport)
One member appointed by the Governor of Indiana
Board Qualifications
Qualifications for board membership are set out in IC 8-22-3-5.b. Board members must:
Be at least 18 years old
Reside in the jurisdiction of the appointing entity
Not be actively employed in commercial aeronautics in a county the GCIAA serves.
The Chicago Gary Regional Airport Authority
In 1995, the City of Chicago and the City of Gary (the Signatories) entered into a compact (Compact) relating to the establishment of the CGRAA. According to the Compact, the intent in establishing the Regional Airport Authority was to:
“Create the Authority as an interstate body politic and corporate under this Compact with the powers set forth in this Compact to jointly oversee and support the Existing Airports as set forth in this Compact, to jointly evaluate the Bi-State Region’s need for additional Airport Capacity, to jointly coordinate and plan for the continued development, enhancement and operation of the Existing Airports and the development of any New Regional Airport serving the Bi-State Region, and to assure the continued autonomous management and operation by the City of Chicago of the Chicago Airports and the

THE GARY/CHICAGO INTERNATIONAL AIRPORT STRATEGIC BUSINESS PLAN FINAL
Landrum & Brown Ch III-94 April 2010
continued autonomous management and operation by the City of Gary through the Gary Regional Airport Authority of the Gary Regional Airport.”29
The Compact was executed, in part to address the following:
“[GYY] has various capital development needs and the City of Gary and [GCIAA] have insufficient resources to fund the Capital Projects needed to enable [GYY] to function effectively as a reliever airport for the Chicago Airports.”30
The Regional Airport Authority is governed by a 12-member board of directors whose makeup and qualifications for membership are described below after a discussion of the Regional Airport Authority’s powers and role in financing GYY. This section also reviews provisions in the Compact that address Gary’s role in the regional system. CGRAA Powers The CGRAA has general oversight responsibility over the airports within its jurisdiction, being ORD, MDW and GYY. The Regional Airport Authority also has the power to issue recommendations regarding the airports and to require regular reports about the airports from Chicago and from Gary.31 The CGRAA has the power to approve the following:32
Implementation of capital projects at the airports Recommendations to the FAA regarding flight operations Actions that would transfer an airport or change the airport’s control Actions that would transfer any Board powers to another person.
In addition, the CGRAA may apply in its own name for government grants, loans, loan guarantees or credit enhancements.33 Except for the actions noted above and certain actions relating to airport financing discussed below, the Compact explicitly reserves to Chicago and the GCIAA the authority to manage, own and operate their respective airports.34 CGRAA Financing The financing of the CGRAA is governed by the Compact and is described in the chapter on airport finances. In summary, the City of Chicago provides most of the CGRAA’s budget, and the CGRAA in turn provides substantial financial support for GYY. The Compact also required Chicago to make an initial contribution of
29 Source: Compact between the City of Chicago and the City of Gary Relating to the Establishment of
the Chicago-Gary Regional Airport Authority (Compact), §5-5. The “Existing Airports” currently subject to the Compact are Chicago O’Hare International Airport (ORD), Chicago Midway Airport (MDW) and GYY.
30 Source: Compact, §§5-10(d) 31 Source: Compact, §§20-5(a) 32 Source: Compact, §§10-20(1)-(4). Section 10-20 also specifies actions relating to establishment
of a new airport, which are not relevant to this report and are not discussed. 33 Source: Compact, §20-30 34 Source: Compact, §§20-5(c), (d)

THE GARY/CHICAGO INTERNATIONAL AIRPORT STRATEGIC BUSINESS PLAN FINAL
Landrum & Brown Ch III-95 April 2010
$1.2 million for specified capital projects at GYY and to apply for authority to use PFC revenues generated at its airports to finance those projects at GYY. The Compact also provides that Chicago will from time-to-time apply for authority to use PFCs for additional GYY projects that are approved by CGRAA.35 The Compact also authorizes the use of Authority revenue to support operations of GYY.36 CGRAA Governance The CGRAA is governed by a 12-member board of directors, as follows:
Five directors appointed by the City of Chicago, including the Commissioner of Aviation, the City Comptroller and the Corporation Counsel
Five directors appointed by the City of Gary, consisting of the President, Vice President and Secretary of the GCIAA, the President of the Common Council of Gary and the Chairman of the Council’s Planning and Development Committee
One director appointed by the governor of Illinois
One director appointed by the governor of Indiana Board of Directors Qualifications The Compact provides that the appointees of the City of Chicago and the City of Gary shall be residents of each city and that the two state appointees shall be governed by the laws of each state. The Compact does not further address qualifications for appointment as a director. GYY Role as Contemplated in the Compact The Compact contemplates GYY’s primary role as being a reliever airport for the Chicago Airports.37 However, the Compact explicitly provides as well that “Nothing in this compact shall preclude or prejudice in any way the development of passenger services at [GYY].”38 Potential Alterations to Qualifications of GCIAA Board Members Given the substantial challenges facing GYY at this time, the Team also compared the qualifications requirements for board members with those of other airport authorities. It was noted that Indiana law prohibits individuals involved in commercial aviation in the locality of the airport from serving on an airport authority board. The prohibition is intended to avoid potential conflicts of interest, but it may deprive the GCIAA of the benefits of having leadership with specific knowledge of the industry in which GYY operates. To carry out the task of comparing qualification requirements, The Team reviewed a random sample of
35 Source: Compact §§25-10(a), (b) 36 Source: Compact §25-15(d) 37 Source: Compact §§5-5(d), 25-10(a), (b) 38 Source: Compact §25-(c)

THE GARY/CHICAGO INTERNATIONAL AIRPORT STRATEGIC BUSINESS PLAN FINAL
Landrum & Brown Ch III-96 April 2010
legislation governing establishment of airport authorities from other states to determine their qualification requirements for airport authority members. The results of this review are summarized in Exhibit III-19.
Exhibit III-19: Summary of Qualification Requirements for Airport Authority Membership in Selected States
State Code Reference Requirements for Membership
Alabama §4-3-5
Members must be residents of the jurisdiction electing them to board and may not hold public office (except in the case of jurisdictions with populations of 300,000-600,000) until the term of public office or board membership expires.
California CA Public Utilities Code, §22401-22410
Directors are elected. No requirements or limitations for directors
Colorado §41-3-105
Commissioners are appointed by the governing body of the jurisdiction participating in the authority and must be taxpaying electors residing in the jurisdiction appointing them
Michigan §259.111
Members must be U.S. citizens and residents of the jurisdiction appointing them, or (in the case of appointments by the Michigan governor, residents of the area where the airport is located. Members may not hold political office or be government employees. Members and their spouses may not be engaged in a civil aeronautics enterprise connected to the airport and may not own more than a 15% share in such an enterprise
Mississippi §61-3-7 (Regional Airport Authorities) Commissioners are appointed by the governing body of each jurisdiction participating in the authority
Missouri §305.304.1 Directors may not hold other public office and are elected
Ohio §308.04
No requirements or limitations for board members. However, a contract in which a trustee has a direct or indirect interest is void and unenforceable unless the member discloses the interest to the other trustees and refrains from any participation in the matter.
Tennessee §42-3-107 No requirements or limitations for commissioners Texas §22.074 No requirements or limitations for board members
Source: State Laws derived from various web-sites. States with laws governing airport authorities identified in Airport Governance and Ownership, Legal Research Digest No. 7, Appendix B (August 2009)
Based on this random sample, qualification requirements are typically limited to residency. We found no examples of requirements particular kinds of experience or background. Only one state in the sample (Michigan) prohibits members from being engaged in a commercial aeronautical enterprise at the airport governed by the authority. Another state (Ohio) addresses the potential conflict of interest by requiring disclosure of the conflict and recusal by the trustee in board of trustee consideration of contracts involving the conflict. To the extent that it is considered desirable to have aviation expertise on the GCIAA, Ohio’s approach offers a

THE GARY/CHICAGO INTERNATIONAL AIRPORT STRATEGIC BUSINESS PLAN FINAL
Landrum & Brown Ch III-97 April 2010
potential solution to the conflict of interest problem. However a modification of the Indiana code would be required to make this change in the qualification criteria for membership on the GCIAA board.
Public-Private Partnership
As noted previously, the GCIAA has the authority to enter into leases or management contracts of up to 99 years duration for all or part of GYY.39 This authority would be sufficient to enable the creation of a public-private partnership (3P) through lease or management agreement. The Indiana Public-Private Partnership Program (IC Title 8, Article 15.7) was also reviewed to determine its applicability to GYY. Airports and airport development projects are not within the scope of the program. 40
Thus, it appears that the authority to lease or execute management contracts is the sole basis for a 3P program at GYY. However, this authority is subject to two practical limitations. The first is the Compact, and the second is the AIP and its requirements. The Compact requires Regional Airport Authority approval of any transfer of GYY or other action that would affect control of the Airport. A transfer in turn is defined as “sale, conveyance mortgage, encumbrance or other transfer or disposition” of GYY.41 A lease or management contract, depending on its structure, could trigger this approval requirement. Under the AIP statute, a lease or management contract – depending on its structure – could jeopardize GYY’s eligibility for certain categories of grant funds.42 In addition, the lease payments or payments for the right to manage the Airport would be subject to requirement to use airport revenue for airport related purposes.43 These limitations could be overcome if GYY were to be approved for participation in the Airport Privatization Pilot Program (Pilot Program) authorized by 49 USC §47134. There are, however, financial consequences associated with participation in the pilot program. First, fees charged to air carriers (in GYY’s case air taxis and charter operators) are capped at current levels plus inflation unless a higher rate is approved by 65 percent of the carriers serving the Airport. Also, the percentage increase in fees charged to GA aircraft cannot exceed the percentage increase in fees charged to air carriers.44 Second, the Federal share for AIP discretionary grants is limited to 70 percent, rather than the 95 percent share GYY currently receives.45 The Pilot Program has a limited number of slots, but slots are still available.
39 Source: IC-8-22-3-11(20) 40 Source: IC-8-15.7-2-14(“Project”) 41 Source: Compact §§1-5(“Transfer”), 10-20(3) 42 Source: 49 USC §§47102(7), (20), (24), 47114 43 Source: 49 USC §§47107(b), 47133 44 Source: 49 USC §47134(c)(4) 45 Source: 49 USC §47109(a)(4)

THE GARY/CHICAGO INTERNATIONAL AIRPORT STRATEGIC BUSINESS PLAN FINAL
Landrum & Brown Ch III-98 April 2010
The GCIAA could pursue 3P opportunities for GYY in the form of lease or management contracts upon the approval of the Regional Airport Authority and with participation in the Pilot Program. However, given GYY’s current dependence on tax support and contributions from the City of Chicago under the Compact, there is some uncertainty over its ability to attract private investment. Conclusions The following conclusions about GYY’s governance have been reached:
The dual oversight by the Chicago Gary Regional Airport Authority and the GCIAA is unusual but does not seriously affect day-to-day operations and oversight of GYY. Under the terms of the Compact, the CGRAA’s role is focused on capital development and associated financing.
The absence of specific experience or background requirements for GCIAA members is typical for airport authorities. If the current prohibition on engagement in commercial aviation enterprises is considered to deprive the GCIAA of necessary experience, the approach of the State of Ohio – requiring disclosure and recusal -- may provide an alternative.
Under the terms of the Compact, GYY has the right to pursue scheduled passenger service.
Chicago can withdraw from the CGRAA on six months’ notice. Given GYY’s financial dependence on the CGRAA and Chicago, any changes to GYY’s business model or role should be coordinated with appropriate Chicago officials.
The GCIAA has the power to pursue 3P arrangements through lease or management contracts upon the approval of the CGRAA. To preserve AIP eligibility and compliance with grant requirements, participation in the Airport Privatization Pilot Program would be necessary. Given GYY’s current financial status, however, it is not clear that GYY would be viewed by the private sector as an opportunity to pursue at this point in time.
SECTION III-5 BUSINESS AND COMMUNITY
Section III-5A Gary, Indiana History There are 92 counties in Indiana. Northwest Indiana, aka the Region, is comprised of Lake, Porter, LaPorte, Newton, and Jasper counties. There are 145 government units in three counties. In Lake County alone, there are seven law enforcement agencies. Based on the 2008 census, 493,800 people reside in Lake County of which 97,715 people reside in Gary. Lake County is the 2nd largest county in Indiana and covers 501 square miles: Gary is the 5th largest city in Indiana. Gary was once a booming steel town with US Steel Gary employing 25,000 people. Over time, through a series of economic downturns and with the advent of technology, US Steel has reduced its staff to 5,000 people. With the reduction in top-paid employees, so went local doctors, dentists, lawyers, banks and restaurants.

THE GARY/CHICAGO INTERNATIONAL AIRPORT STRATEGIC BUSINESS PLAN FINAL
Landrum & Brown Ch III-99 April 2010
Educationally, Gary was one of Indiana’s top educational communities. It utilized the Wirt System of Education from 1907-1937, in which high school students were directed onto different educational tracks (academic, shops/nature study). Many students chose industry over college because at the time steel and automotive jobs paid more than white collar jobs. Eventually, the system fell out of favor due to its appearances of segregation. Wirt’s three paths were:
1. Pattern Shop 2. Foundry 3. Automotive
As the WIRT System was phased out and young people were no longer trained to work in industry, local corporations began hiring people from outside of Gary. Today, Gary has significant educational challenges. The high school graduation rate is 50.3 percent and test scores are among the worst in the state. The school district has 56 administrators earning a total of more than $4 million in salaries annually. The School City of Hammond has more students than Gary, yet Gary has more than twice the number of administrators. Gary’s School Superintendent, Dr. Myrtle Campbell, earns more than Governor Daniels. (NW Times, October 27, 2009) Gary was a City built around steel that neither anticipated nor planned for the demise of so many jobs. The city eventually transferred the burden of paying for Government spending by increasing the taxes on the mills. At one time, US Steel alone accounted for half of Gary’s total tax revenues.
Section III-5B Historical Sequence Of Events Because a primary concern of any airport is financial self-sustainability, it is important to understand how the current financial environment in Gary evolved, and the implications for the Airport. 1970:
It is determined that Real Property will be assessed every 10 years and Personal Property annually. Indiana becomes a Value and Use state - not a Market Value state.
1980:
The Homestead Credit (residential) is enacted to help to mitigate for homeowners the “sticker shock” of a 10-year reassessment value. Under provisions of Homestead Credit, if a person owns a home or is buying one on a recorded contract, and uses it as their primary place of residence, the home and up to one acre of land could qualify for a homeowner's deduction. The deduction is either 60 percent of the assessed valuation or $45,000, whichever is less. The homestead credit amount equals up to 25 percent (17 percent state and eight percent county) of the person’s gross tax according to current Indiana Code (IC 6-1.1-20.9), depending upon the taxing district.

THE GARY/CHICAGO INTERNATIONAL AIRPORT STRATEGIC BUSINESS PLAN FINAL
Landrum & Brown Ch III-100 April 2010
1995:
The St John Lawsuit was brought originally by three taxpayers in the small community in Lake County, southwest of Gary, and evolved into a class action suit on the validity of the Indiana property tax assessment system. The Indiana Tax Court consolidated the petitions, conducted a bench trial in July of 1995, and found that Indiana’s then current statutory system of property taxation was unconstitutional. As a result it was determined that it was necessary to create and maintain an objective system to assess property and to establish a new schedule of assessment - one that reassesses every 4 years. Due to delays, the 4-year cycle began in 2003, but is not yet fully functional. Under the new system other towns have been reassessed accurately for the first time, which has not been positive for everyone. For example, Miller Beach, a neighborhood in Gary was a separate town until it was annexed into the municipal boundaries of the city. Its reassessment resulted in a substantial tax increase, pushing Miller to explore secession from the County.
2000:
The census indicates that 102,746 people live in Gary. The belief of many interviewees is that through the reassessment of real property, some homes were reassessed significantly higher and, as a result, people who could not pay their tax abandoned their homes.
2001:
According to the 2001 Economic Impacts of Airports in Indiana study, conducted by the Aviation Association of Indiana, the GCIA ranked in the top ten percent of the 105 Hoosier airports surveyed. Pollsters estimated that the Airport generated an annual economic impact of more than $45 million for the region. Many business representatives believed that this was the beginning of the Airport’s potential influence as a regional economic engine.
2003:
The “Abnormal Obsolescence” judgment in favor of the steel mills and refinery was rendered. The Indiana Administrative Code defines abnormal obsolescence as, “obsolescence which occurs as a result of factors over which the taxpayer has no control and is unanticipated, unexpected, and cannot reasonably be foreseen by a prudent businessman prior to the occurrence. It is of a nonrecurring nature and includes unforeseen changes in market values, exceptional technological obsolescence, or destruction by catastrophe that has a direct effect upon the value of the personal property of the taxpayer at the tax situs (location) in question on a going concern basis. 50 IAC 4.2-9-3 (a).”
Subsequently, the Personal Property Tax 5th Pool was created for the personal property valuations of individuals who were affiliated with the steel mills and refinery. The 5th Pool was a quid pro quo in which the steel mills and refinery dropped their past appeals regarding the collection of a specific amount of past taxes in exchange for the creation of the 5th Pool that would better insulate their Personal Properties. While normal depreciation of property stops at 30 percent of original value, the 5th Pool allows for depreciation below 30 percent and is only

THE GARY/CHICAGO INTERNATIONAL AIRPORT STRATEGIC BUSINESS PLAN FINAL
Landrum & Brown Ch III-101 April 2010
applicable to steel mills and refinery individuals, thus creating greater economic stability for the wealthy.
As a result, Gary began to experience the loss of $34 million loss in tax revenues from “Abnormal Obsolescence’, and in a short period a large portion of the tax burden shifted from industry to individuals.
2004:
As a result of financial pressures the City of Gary cut its budget by $13 million and laid-off 140 employees.
2005:
Because of the tax increases, Miller Beach requested a Circuit Breaker on their personal property taxes. The General Assembly heard Miller Beach’s appeal and issued a three percent CB on residential property for Lake County ONLY.
Also in that year, under I.C. 36-7.5-3-1, the Regional Development Authority was formed by the State of Indiana to assist in:
1. The planned infrastructure improvements to the Gary-Chicago International Airport
2. The extension of commuter rail owned/operated by the Northern Indiana Commuter Transportation District
3. The creation of a regional bus system under the Regional Bus Authority 4. The redevelopment of the Lake Michigan shoreline; and, in the process, the
development of other related, qualified projects
The revenues are generated by Gary, Hammond and East Chicago each of which contributes $3.5 million annually to the RDA, along with the Lake County Council and Porter County Council. The State contributes an additional $10 million to the RDA, for a total operating budget of $27.5 million.
2006:
On January 16, 2006 the US DOT announced their intent to approve the Gary-Chicago “Letter of Intent” application which provides $57.8 million over 10 years, available in installments of up to $6 million per year, for improvements and expansion that will help the facility position itself as the third major airport in the region. The planned expansion would increase the size of the airport by roughly 50 percent and extend the main runway to a length of 9,000 feet. The infrastructure enhancements are expected to bring as many as 320 new jobs to the Gary area while also providing crucial long-term economic development opportunities for all of Northwest Indiana.
The approval of the Letter of Intent (LOI) funding meant that the GCA would no longer be dependent upon yearly funding allocations from Congress and instead will be able to move forward with long-term efforts outlined in its 20-year Master Plan to include railroad relocation and runway extensions.

THE GARY/CHICAGO INTERNATIONAL AIRPORT STRATEGIC BUSINESS PLAN FINAL
Landrum & Brown Ch III-102 April 2010
The General Assembly takes the Circuit Breaker statewide, thus creating another reassessment which again has some negative implications. In Indianapolis, for example, the Meridian Kessler neighborhood was reassessed significantly higher; tax bills increased and many people sold their homes. As a result, the legislature instituted a Circuit Breaker (caps) as follows:
One percent on residential properties
Two percent on qualified residential, which includes nursing homes, apartment rentals
Three percent on commercial, industrial, and those that other than a) or b) above
Keeping the CB in place and viable for the future, requires a constitutional amendment.
2007:
The General Assembly passed a resolution to amend the constitution for Circuit Breakers at one percent, two percent, and three percent. The full effect of the amendment will be ratified to the constitution in 2012. Until then, if a local government is not in agreement with the CB, they can appeal their case to the recently formed Distressed Units Appeal Board (DUAB). The DUAB’s primary function is to receive petitions from political subdivisions that are expected to have a reduction in their property tax collections of at least five percent (five percent) in a calendar year as a result of the Circuit Breaker caps on property tax bills.
If the fiscal body of a political subdivision submits a petition claiming distress, the DUAB is required to review the petition and if accepted, assist in establishing a financial plan for the distressed political subdivision. Placing the caps in the constitution would leave the appeals board powerless to give Gary relief, meaning Gary would need to find a way to bring its spending to within those caps by 2012. Additionally, after ratifying the constitution, the DUAB will end and the Debt Service Fund (which the DUAB did not calculate into tax reduction) will be factored in.
The City of Gary cuts its budget by $11 million by reducing operating expenses.
There are indications that Mayor Clay opposes the Circuit Breakers because of the potential adverse impact on the City. The two primary areas of concern are:
1. A negative impact on the image of the City and
2. The potential loss of tax revenues
By way of example:
$100,000 House $1,200 Current tax is at 1,2% $1,000 Circuit Breaker tax 1%
$200 Gary loses this much

THE GARY/CHICAGO INTERNATIONAL AIRPORT STRATEGIC BUSINESS PLAN FINAL
Landrum & Brown Ch III-103 April 2010
2008:
Because of growing shortfalls in tax collections, the City of Gary cut its budget by $12.5 million. A total of 23 policemen and firemen were temporarily laid off,
Under the provisions of I.C. 6-1.1-20.6, the City of Gary will be required to reduce its tax levy in the amount of $36 million in 2009 and $45 million in 2010.
Gary requests the State to raise property taxes.
Tax caps begin phasing in.
Gary collects $12 million in gaming taxes.
97,717 people reside in Gary (2008 census). The Median income is reported to be $27,195 and 25 percent live below the poverty line.
The Gary Airport learns that it will lose $675,000 in tax revenue brought about by state mandated tax caps. (NW Times, October 10, 2008). GYY elects to make an appeal to the Distressed Unit Appeals Board, but is coordinating its action with the City of Gary. The appeal is to request keeping its tax rate above the 2 percent cap mandated by House Bill 1001 (NW Times, October 10, 2008)
At the Airport traffic continues to fall: there are 29,494 landings and takeoffs in 2008, as compared to 35,601 in 2007 and 53,099 in 2002.
The Governor and Mayor publically discuss P3: Public-Private Partnership for GYY. Policy Analytics stated in their report: “There is a wide spectrum of public-private relationships, ranging from private contracts for services, to operating leases, to Greenfield development. Public private partnerships begin with an underutilized asset that provides public services and is operated and/or owned by a governmental unit. Bids are solicited from private agencies for the privilege of operating the asset over a long-term timeframe. Operations are then leased at a price that is greater than the present value of the projected revenue stream from government operations, and the operator infuses private capital and operating funds to develop the asset to its highest utilization. The private operator can make a return on its investment because it is better capitalized, can create efficiency through expert experience, best practices, and reduced bureaucracy, and has access to capital markets. In 1997, the FAA began an Airport Privatization Pilot Program that relaxed federal restrictions, and allowed up to five airports (based on accepted applications) to engage in P3 activities.”
2009:
GCIA Executive Director, Chris Curry stated that “Several studies have shown that for every $1 invested in the GCIA expansion project, the return on investment is more than $226 in economic output,” and that “the Aviation Association of Indiana, in its most recent study, determined that the airport had an economic impact of more than $153 million.” (NW Times Editorial, 3-28-09)
THE GARY/CHICAGO INTERNATIONAL AIRPORT STRATEGIC BUSINESS PLAN FINAL
Landrum & Brown Ch III-104 April 2010
Gary loses $36 million in revenue under the state-imposed property tax caps (NW Times, October 10, 2008). In January 2009, Gary appeals to the Distressed Units Appeal Board for relief from the application of the credit against tax liability established under I.C. 6-1.1-20.6 and as set forth in H.B. 1001
Gary financial struggles continue and the City is $4 million overdrawn (NW Times, September 9, 2009). Additionally. Gary is behind in paying their requisite $3.5 million to the RDA. The result is that other cities and counties are resentful of Gary’s inability to pay while they are required to pay “on time”
Both Gary and the Airport must cut budgets as revenues drop. The City owns 7,000 abandoned properties (15 percent of all parcels in town), but cannot pay the property taxes on them (Chicago Tribune, Sept. 20, 2009). Additionally, there is no money coming in from either the county option income tax (COIT) or the local option income tax (LOIT).
The City points to the County and the County to the City to trim budgets. In the interim, Gary determines that it will not provide tax abatements to new businesses.
Legislative Language passed in the General Assembly states:
(a) The authority, acting by and through its board under IC 8-21-8, may accept, receive, and receipt for federal, other public, or private monies for the acquisition, construction, enlargement, improvement, maintenance, equipment, or operation of airports, other air navigation facilities, and sites for them, and comply with federal laws made for the expenditure of federal monies upon airports and other air navigation facilities. IC 8-22-3-31 Federal, public, or private grants of funds Sec. 31.
(b) Subject to IC 8-21-8, the board has exclusive power to submit to the proper state and federal agencies applications for grants of funds for airport development and to make or execute representations, assurances and contracts, to enter into covenants and agreements with state or federal agency or agencies relative to the development of an airport, and to comply with all federal and state laws pertaining to the acquisition, development, operation, and administration of airports and properties by the authority.
(c) This subsection applies only to the airport authority established by the city of Gary. The authority may assign the powers described in this section to a lessee or other operator with whom it enters into a lease, management agreement, or other contract under section 11(20) of this chapter if the board has determined that the lessee or other operator has the expertise and experience to operate the facilities of the authority in accordance with prudent airport operating standards.
2010:
The Distressed Units Appeals Board (DUAB) will provide Gary with a financial workout plan following their inspection of the City and Airport.

THE GARY/CHICAGO INTERNATIONAL AIRPORT STRATEGIC BUSINESS PLAN FINAL
Landrum & Brown Ch III-105 April 2010
Future Implications: 2012:
If the amended constitution takes effect, Gary will need to find a way to bring its spending within caps (i.e. to balance its budget with the adjusted caps).
2015:
“The dedicated RDA funding from Major Moves ends in 2015. These factors will place a considerable strain on RDA finances after 2015, accounting for 63 percent of the RDA investment cost between 2016 and 2026. After 2015, it may be beneficial for GYY to seek private investment to finance its capital improvements.” (Policy Analytics Report 2007)
Section III-5C Local and County Taxes
A key component to being able to assist the airport’s economic development is to understand how taxes work in Lake County, as well as the State. Two types of property are taxed in Indiana: real and personal. Real property consists of land, buildings, and other major permanent structures. Personal property is almost exclusively that of businesses and includes equipment for farming, manufacturing, and product inventories.
The assessment of personal property is conducted every year, while real property assessment is performed less frequently (before 2002, the last real property assessment was conducted in 1995). Normally, assessments are conducted by elected township assessors and by an elected county assessor (except in Lake County, where the 2002 assessment for most properties was conducted by a private company). Lake County is the ONLY County in Indiana not to have a County Option Income Tax. County Taxes are a primary source of revenue. There are several different taxes:
COIT - County Option Income Tax: This is mainly metropolitan and is money used for county spending
CAGIT - County Adjusted Gross Income Tax: This is primarily rural, and represents money collected for county tax relief
CEDIT - County Economic Development Income Tax: This is money collected and used for county spending
CAGIT Rates COIT Rates CEDIT Rates 0.50% 0.20% 0.10% 0.75% 0.30% 0.20% 1.00% 0.40% 0.25% (up to) 1% 0.35% 0.40% 0.45% 0.50%
THE GARY/CHICAGO INTERNATIONAL AIRPORT STRATEGIC BUSINESS PLAN FINAL
Landrum & Brown Ch III-106 April 2010
For counties that impose CAGIT and CEDIT, the combined rates may not exceed 1.25 percent (there are some exceptions). In COIT counties, the combined COIT/CEDIT rate may not exceed one percent (with some exceptions)
Local taxes add to the County base to provide local communities additional monies. These include: LOIT - Local Option Income Tax which is intended to Freeze Property Tax Levies. If one is a CAGIT county, then the county council must adopt a LOIT. If one is a COIT county, then the COIT council must adopt this tax. The rate of the LOIT to freeze the property tax levy may not exceed one percent. LOIT - Local Option Income Tax which is intended for Property Tax Relief. Its rules for adoption are the same as above. The rate of the LOIT to provide property tax relief may not be more than one percent. During the interview process, concern was expressed by a number of participants that the rate caps would be extremely detrimental to Gary. LOIT - Local Option Income Tax which is intended for Public Safety. Its rules for adoption are the same as above. The adopting entity must impose either the LOIT to Freeze Property Tax Levy of at least 0.25 percent. The LOIT for Property Tax Relief of 0.25 percent or impose both taxes with a combined rate of at least 0.25 percent in order to impose the LOIT for public safety max rate of 0.25 percent. Tax Abatements represent a phase-in of taxes that was first authorized by the State in 1977. This gave local government the option of allowing certain businesses to phase-in those new taxes that would otherwise be assessed on their property because of new building construction or the purchase of equipment for:
Manufacturing
Research and development
Logistical distribution
Information technology The types of businesses targeted to benefit from the program are those in the manufacturing, warehousing, distribution, commercial and/or service arenas. Retail and residential facilities are not eligible for tax abatement unless located in specially designated areas. Tax abatement is considered a valuable incentive to attract new businesses into the Gary area. Its major impact, however, is to stimulate reinvestment by existing businesses -- by not penalizing them with a major tax bill when they can least afford it - after having recently invested in a facility and/or new equipment. Under the concept, because new taxes are phased-in, new annual tax money goes into the community coffers enabling businesses to retain employees and create new job opportunities for our citizens. Without this incentive, businesses would be limited in their ability to make these capital improvements. To be eligible for tax abatement, the business must apply for designation as an Economic Revitalization Area (ERA) before beginning the capital improvement.

THE GARY/CHICAGO INTERNATIONAL AIRPORT STRATEGIC BUSINESS PLAN FINAL
Landrum & Brown Ch III-107 April 2010
Under Indiana Law, an Economic Revitalization Area (ERA) is an area within the corporate limits of a city, town, or county which has become, "undesirable for, or impossible to achieve normal development and occupancy because of lack of development, cessation of growth, deterioration of improvements, or character of occupancy, age, obsolescence, substandard buildings, or other factors which have impaired values or prevented a normal development of property". Tax abatement is a three-step process.
1. The Redevelopment Commission must approve the application. 2. The City Council must approve and designate the property as an Economic
Revitalization Area (ERA). 3. The business must take application to the Lake County Auditor and/or
appropriate township assessor for a deduction from taxes authorized by the City Council.
There are two types of property tax phase-in: real - applicable to building construction, and personal - applicable to qualified machinery and/or equipment. Details and requirements regarding the designation of ERAs are outlined in the State of Indiana Code, and by the Gary City Council. Eligibility for equipment purchases include a tax phase-in period of five years provided that the equipment is new to the owner and an integral part of the operations of the business.
Section III-5D Interview Findings There is an indicated perception that opportunities for growth are lost in the complex political and business infrastructure of the region. Interviewees expressed the need for focus and efficiency as well as a practical approach to drive results faster and to implement cooperation and communication between internal and external stakeholders.
Although the Airport itself is not a complex organization, the region is. If GYY is to thrive, it must be willing and able to address the diversity of organizational and community perspectives and needs, and through the growth of the Airport help forge a unity of purpose, and become a catalyst for change. The various regional and state agencies and organizations with influence over economic growth at GYY is large: these agencies and organizations - the primary ones are indicated in Exhibit III-20 below - are critical factors in GYY’s success.
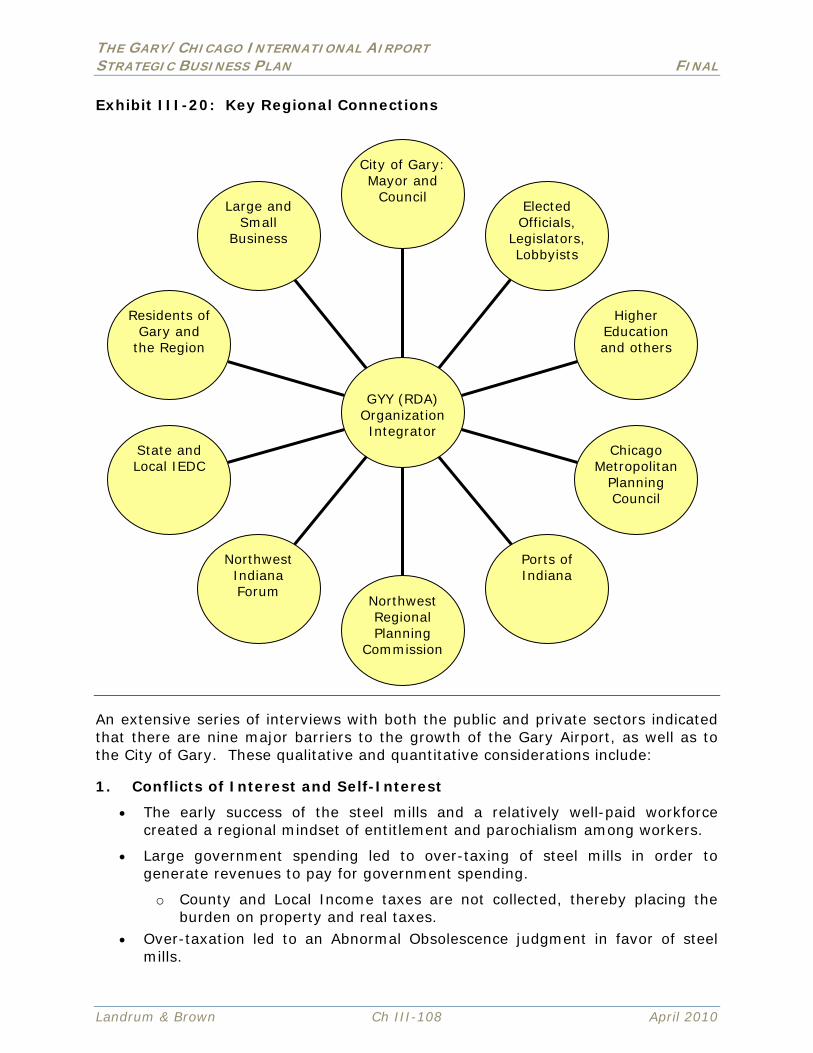
THE GARY/CHICAGO INTERNATIONAL AIRPORT STRATEGIC BUSINESS PLAN FINAL
Landrum & Brown Ch III-108 April 2010
Exhibit III-20: Key Regional Connections
An extensive series of interviews with both the public and private sectors indicated that there are nine major barriers to the growth of the Gary Airport, as well as to the City of Gary. These qualitative and quantitative considerations include:
1. Conflicts of Interest and Self-Interest
The early success of the steel mills and a relatively well-paid workforce created a regional mindset of entitlement and parochialism among workers.
Large government spending led to over-taxing of steel mills in order to generate revenues to pay for government spending.
o County and Local Income taxes are not collected, thereby placing the burden on property and real taxes.
Over-taxation led to an Abnormal Obsolescence judgment in favor of steel mills.
Large and Small
Business
Residents of Gary and
the Region
State and Local IEDC
Northwest Indiana Forum
Northwest Regional Planning
Commission
Ports of Indiana
Chicago Metropolitan
Planning Council
Higher Education and others
Elected Officials,
Legislators, Lobbyists
City of Gary: Mayor and
Council
GYY (RDA)
Organization Integrator

THE GARY/CHICAGO INTERNATIONAL AIRPORT STRATEGIC BUSINESS PLAN FINAL
Landrum & Brown Ch III-109 April 2010
The political, social, and economic positions of counties within the region differ dramatically, thereby impacting regional ability to develop a collegial approach to government, working with Gary, and strategically positioning the Airport for growth and development.
2. Polarization
Beyond conflicts of interest, there are clear differences among City, County, and the private sector as to the reasons for budgetary distress and the segmented economic erosion. More importantly, there appears to be little agreement in identifying and working towards a common solution.
3. Racial Dividedness
There are indicated concerns relating to race that appear to contribute to the region’s segmentation - Gary is 84 percent black, 11 percent white, five percent Hispanic, two percent Native American, one percent Asian. This segmentation differs substantially from the surrounding counties. Paradoxically, interviewees offered contradictory comments either that racism was prevalent or non-existent.
4. Lack of Education
Concerns over education are high. Regional input is that the area is “hungry for education,” the high school graduation rate is 50.3 percent, trade skills are not taught, and test scores are among the lowest in the state.
5. Business Development
Because of recent changes to the State tax policy (Tax Caps) and Abnormal Obsolescence, the steel mills (once one of the largest sources of City revenue) are paying lower taxes now than previously, thereby creating a severe gap in the revenue stream upon which budgets are based.
A typical response to revenue shortfalls would be the creation of new business development initiatives with specific targets and strategies, and a complimentary process to attract and facilitate City and regional investment; however, this action did not occur.
Interviews with regional economic development entities, despite their internal efforts, failed to demonstrate any cohesive and comprehensive approach to business development for the county, Gary, or the airport.
The City of Gary indicated that confidentiality requirements limited what they could discuss with the team. No specific initiatives (plans or outreach) for attracting new business other than a Michael Jackson Museum were mentioned.
Regional economic development entities, as well as the City, all indicate that their efforts to attract business to the region are complicated by several factors:
o The City has no dedicated Business Representative focused on customer service to assist potential new business entrants and track their progress.

THE GARY/CHICAGO INTERNATIONAL AIRPORT STRATEGIC BUSINESS PLAN FINAL
Landrum & Brown Ch III-110 April 2010
o The City (and others) indicated the City sometimes loses contact with businesses interested in relocating to Gary.
o The City’s Planning Commission is considered by most regional agencies to have created a process that is overly bureaucratic and cumbersome, and discourages the pursuit of new development.
o Interviewees indicated that the process, in addition to difficult was often seen to be without effective management focus.
o Gary appears to have an ordinance that denies tax abatements to projects that will relocate jobs from outside the city limits. The same ordinance denies tax abatements for moves within the city unless all employees are granted transfer rights (Nathan Newton, UC Berkeley, 1995).
o In contradiction to this feedback, the website for the City of Gary states that abatements (tax phase-ins) are permissible for certain industries in certain areas, and one must go through a 3 step process.
o Interviewees report that the process requires an “unreasonable 17 steps” that discourages new entrants.
o In a City without a demonstrable compelling attraction or benefits, there is no provision for incentives for businesses to remain or relocate to Gary. For smaller start-up businesses, particularly in a difficult economy, new business development is problematic.
From a broader Northwest Indiana regional perspective, there is area growth. Newton County is enjoying the most economic development of the regional counties. In order of greatest growth, the counties are:
o Newton o LaPorte o Stark o Porter o All others
6. Communications
Most of the interviewees stated concern over lack of communication, in both directions among the city, county, Airport (including the Board), state government, regional agencies, other municipalities. The interviewees indicated that this was attributable in part to the political philosophy of Gary city management, regional parochialism, regional competitiveness, and with regard to the Airport, the perception that it is not a regional asset.
Concerns over communication between government units regarding Airport business and operating issues are exacerbated by a lack of knowledge regarding the availability and use of funding, the status of capital improvement programs, and operating budgets.
o By way of example, City of Gary management, who appoints the majority of the Airport Board, indicated they had no knowledge that the airport director was receiving a contract extension and compensation enhancements until the media announcement of the changes.
THE GARY/CHICAGO INTERNATIONAL AIRPORT STRATEGIC BUSINESS PLAN FINAL
Landrum & Brown Ch III-111 April 2010
In the extensive series of public and private sector interviews conducted, not one individual could recall being interviewed previously about airport development needs. Two had received an informal briefing on its status.
The lack of a regularly scheduled or even informal system of communications to apprise interested regional political and business of Airport issues is a serious deterrent to developing a required regional interest in the success of the facility.
There is no formal mechanism in place other than an Airport website to keep the communities of Gary and the region advised on Airport issues and initiatives. There is a perception that the existing meetings and informal outreach could be formalized and strengthened.
7. Environmental Considerations
While there has been discussion about the utilization of existing Airport properties for collateral development, the actual amount of developable property is limited by a number of environmental issues.
o A substantial portion of “developable” land contains possible Superfund sites.
o There is the potential presence of an Endangered Species - the Blue Garner Butterfly.
o There are Dune and Swale limitations that protect certain portions of the property.
o Lastly Lake Effect snow and wind issues (given the close to the lake) could limit the desirability of certain kinds of development.
8. Leadership Focus
The region, the City, and the Airport are all faced with substantial management, business, and development challenges for the Airport. It is essential that there be a common vision as well as a unified will to pursue success through mutually agreed upon initiatives, and the effective allocation of appropriate skill sets and funding to the required initiatives.
9. Public Perception and Marketing
Mayor Clay, in an interview stated “the perception of the City is not reality”. Nevertheless, perception in many instances is what drives decision making. For the City of Gary, public perception represents a substantial challenge. The region and the Airport, through association with the negative image of Gary regarding crime and corruption, suffer “guilt by association.”
On 11-26-09 the NW Times reported that Gary had more than a dozen homicides in the last six week timeframe and that the Mayor had appointed the sixth police chief in four years in this “crime-plagued” city. Such press has a strong impact on businesses who might consider Gary a potential fit. Beside the loss of tax revenues, such press translates into increased insurance cost, increased security costs, etc. It is critical to address the basic causes.

THE GARY/CHICAGO INTERNATIONAL AIRPORT STRATEGIC BUSINESS PLAN FINAL
Landrum & Brown Ch III-112 April 2010
o Steven Levitt (author of “Freakonomics”) established that each homicide costs a city 70 people (i.e. people who move out and people who decide not to move in). In the same vein, Philip Cook (Duke University) found that each crime related gunshot wound costs a city $1 million including such things as the expense of building prisons, taxes spent of policing and money for private security systems.
There is a lack of regional consensus on a vision, branding concept, and related strategies for the Airport and environs. The facility is sometimes referred to as the “third Chicago airport,” a “regional airport,” a “city airport,” a” passenger airport,” or a “cargo airport.” These differences are reflected at the political level as well as among local business organizations. The Mayor has a strong commitment to developing the Airport for cargo despite the industry and regional dynamics that argue against this business element.
Most local businesses are not dependent on GYY, nor do they consider the Airport as a transportation option.
There is a fairly consistent history of failed commercial passenger initiatives that have adversely impacted Airport credibility from a market perspective. Of perhaps even greater concern is that these business development efforts have been tied to financial incentives, the resultant loss of which exacerbates concerns regarding the management of the Airport at both the staff and Board levels.
The Gary Southshore Air Show generates both public and industry awareness, and annual revenues. This represents potential underutilized marketing opportunities.
Despite the Compact with the Chicago Department of Aviation, there is virtually no planning or business development interface with Chicago, other than what are described as pro forma Board meetings.
There are very clear links between the political and business challenges that must be addressed in order to facilitate the development of GCIA. Comprehensive and candid interviews were conducted throughout the region to identify the issues and help evolve relevant strategies to resolve concerns and challenges. Interviewees were advised that their inputs would be without attribution, unless specific permission was received to identify them.
Based on the team’s review and discussion with representatives of the private and public sectors, there are a number of clear, related strategies that emerged. These are all directed towards positioning the Airport to establish and achieve clear goals by implementing realistic strategies that reflect a unified perspective and vision.

APPENDICES

THIS PAGE INTENTIONALLY LEFT BLANK

THE GARY/CHICAGO INTERNATIONAL AIRPORT STRATEGIC BUSINESS PLAN FINAL
Landrum & Brown A-1 April 2010
APPENDIX A STRENGTHS – WEAKNESSES – OPPORTUNITIES – THREATS
A critical step in developing the Plan was the development of a comprehensive look at regional strengths, weaknesses, opportunities, and threats. Each member of the team looked at all of the regional elements independently and weighted the items on a scale from 1 to 10 with the higher number being considered as having the greatest importance to the planning effort. The items were evaluated using the criteria indicated earlier in this document.
Aviation
Strengths Logic Rating
1. Proximity to major roads including I65/80/90/94
A strong surface feed network with good access encourages passenger activity 8.7
2. Current airport tenants Provide revenues of approximately $1.2 million per year.
8.5
3. Gary is outside Chicago airspace
Less congested airspace produces fewer delays, as well as more efficient and economical flight paths making the airport more attractive for commercial service.
8.3
4. Boeing tenancy The presence of Boeing creates a higher profile and provides instant operational credibility
8.2
5. Association with Chicago Dept. Airports
Gary is positioned to be part of a regional solution to future capacity problems in the region
7
6. Nearby casinos, Lake Michigan, Wetlands, Dunes
Recreational alternatives provide a strong destination focus and draw for charter activity 7
7. Convenience to Loop The Airport can serve downtown Chicago 6.8
8. Rates and charges flexibility
The flexibility available to Airport management on rate structures can enable it to create attractive rates and charges for tenants and users.
6.8
9. No current services While this is not a good thing, there it does enable the Airport to develop and utilize innovative risk sharing
6.7
10. Populous catchment area
Provides a large potential base from which to attract passenger traffic
6
11. Easy access and visibility from the freeway
Provides convenience and regional awareness of the facility and its services 5.8
12. Proximity to US Steel, Arcelor Mittal, NIPSCO
Large businesses create a potential demand for customers and senior management use
5.8
13. Location in NW Indiana Based on destination within the region - the Airport provides a more convenient option than ORD and MDW.
5.8

THE GARY/CHICAGO INTERNATIONAL AIRPORT STRATEGIC BUSINESS PLAN FINAL
Landrum & Brown A-2 April 2010
Strengths Logic Rating
14. Vacant on-airport land Provides opportunities for supporting collateral development and the addition of new revenue streams
5.7
15. Commercial catchment area for cargo is fairly substantial
Large amounts of air eligible cargo are generated in or destined for the GYY proximity 5.2
16. Desirable location in Central U.S.
A central location expands the Airport catchment area and positions it well for distribution of freight
5.2
17. Limited facility development and land use
Provides a “clean slate” to develop Airport facilities and services to attract business 4.8
18. Regional network of cargo businesses
Freight Forwarders and Customs Brokers as well as trucking companies are plentiful in the region.
4.8
19. Low trucking costs The region has the lowest trucking costs of any gateway area in the Country
4.7
20. Warehouses within the catchment area
The region has a substantial number of warehousing and logistics facilities demonstrating the existence of appropriate cargo handling facilities and labor
4.6
21. High unemployment The reductions in manufacturing have created a large available workforce
4.2
22. ORD focuses on both passenger and cargo movement while MDW is focused almost exclusively on passengers
Allows for other area airports with appropriate aeronautical infrastructure to focus on market segments outside the primary components.
4
23. No “fortress hub” at GYY WN(MDW), UA/AA(ORD)
Provides an open operating environment which is attractive for a new carrier 3.6

THE GARY/CHICAGO INTERNATIONAL AIRPORT STRATEGIC BUSINESS PLAN FINAL
Landrum & Brown A-3 April 2010
Weaknesses Logic Rating
1. The City and region have an unattractive public image.
Negative perception inhibits marketing as well as new business development. 10
2. Established cargo consolidation at ORD
Entrenched operating practices and enormous consolidation opportunities create economies of scale which reduce the costs of shipping out of Chicago.
10
3. Air cargo business infrastructure is centered around ORD
The freight forwarding community is physically established around ORD and prefers shipping through that facility.
10
4. Integrators have large established operations at ORD
There is little likelihood that integrators would shift even a small part of their operations. FedEx and UPS also have substantial presence at Indianapolis and Rockford.
10
5. Aeronautical infrastructure at GYY is not suitable for large aircraft
Even with the runway extension, international cargo operations that typically require a minimum of 10,000 ft will not be able to operate into Gary.
10
6. New cargo capacity at ORD
1,000,000 sf of new cargo capacity and 17 aircraft parking positions at ORD eliminate for the next several years any concerns about physical capacity.
9.7
7. Illinois, Indiana tax differences
Affects the desirability of Gary for corporate aviation. 9.5
8. Regional passenger routine of using MDW and ORD
It is difficult to change habits without some external stimulus or highly visible differentiator 9.2
9. Higher numbers of operations to multiple destinations at MDW and ORD
Gary with more limited options must identify an appropriate and complementary niche and compete on a cost basis.
8.8
10. Lack of GYY identity, visibility
GYY is not branded and people outside Gary do not have a sense of the airport or its potential advantages.
8.8
11. Competitive fares set by MDW, ORD flights
Hard to compete against the volumes in Chicago which enable lower fares to cover costs.
8.7
12. Available maintenance facilities at ORD
ORD has substantial maintenance facilities available for which there is no demand even at reduced land rental rates. Development at GYY becomes problematic.
8.6
13. Main and crosswind runway concerns
While not accurate, there are perceptions that the main runway may have operating issues as much as 15% of the time under certain wind conditions.
8.2
14. Dependence on Chicago Department of Airports
The DOA may resist certain strategic initiatives or seek unknown quid pro quos for cooperation. Gary, because of the Compact funding is tightly linked.
8
15. Scheduled service could require financial incentives
The provision of incentives, unless properly structured, can be both expensive and risky. 8

THE GARY/CHICAGO INTERNATIONAL AIRPORT STRATEGIC BUSINESS PLAN FINAL
Landrum & Brown A-4 April 2010
Weaknesses Logic Rating
16. No current cargo users at GYY
Lack of established cargo operating infrastructure and interlining capacity is a disincentive for carriers and supporting businesses to relocate.
8
17. Roadway configuration for trucking access
Indirect access to airport discourages use for trucking.
7.8
18. Competition from existing Airports for cargo
Established operations and interlining arrangements at ORD discourage relocation of cargo to GYY. Additional competition from Dayton, Columbus, Wilmington, Indianapolis, and Cincinnati for a limited market.
7.4
19. Declining number of landings and takeoffs
Decreasing revenues from airport fees place a greater reliance on external funding.
6.2
20. Carriers already serve MDW, ORD, SBN
Existing flight schedules at nearby airports make split service problematic and the threat of traffic diversion could be opposed by the Chicago DOA.
6
21. Most scheduled carriers now serve ORD or MDW
There are limited alternative scheduled carrier candidates for whom GYY might be attractive. 6
22. Increasing size of regional jets
Increases capacity at ORD and MDW and the need to maintain high load factors.
6
23. No current services Increases the difficulties in attracting a new entrant unless it is specifically an O&D operation
5.1
24. Gary Airport far from many corporate HQ’s in Chicago
There are longer travel times for executives traveling in private aircraft to corporate headquarters in the north of Chicago
5
25. Low leasing rates for cargo properties at ORD
ORD currently has some of the lowest ground lease rates in North America and the lowest of any major gateway.
5
26. Lack of public transportation
Provision of public transport could be expensive. 5
27. Lack of First Response Team
Creates potential for an operational incident. 3.7
28. Limited passenger rail access.
SS Line is close but operates infrequently. Shuttle service is available. Cost benefit of providing direct rail access would be problematic.
3.3
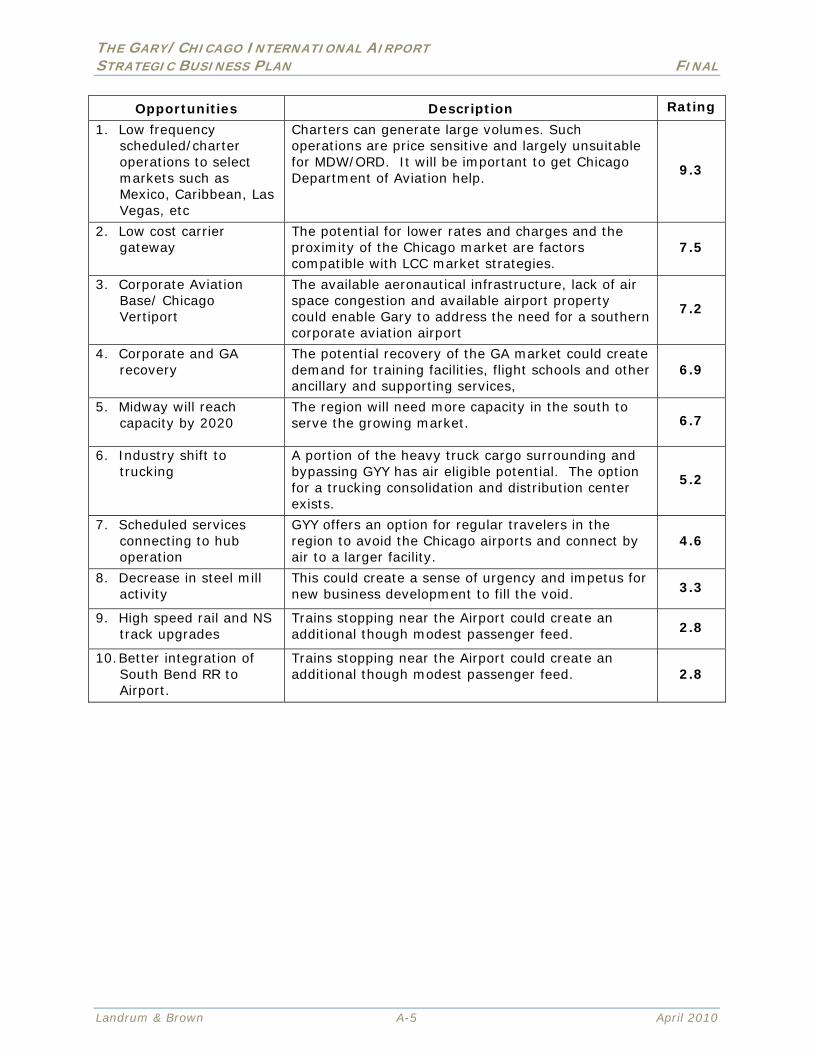
THE GARY/CHICAGO INTERNATIONAL AIRPORT STRATEGIC BUSINESS PLAN FINAL
Landrum & Brown A-5 April 2010
Opportunities Description Rating
1. Low frequency scheduled/charter operations to select markets such as Mexico, Caribbean, Las Vegas, etc
Charters can generate large volumes. Such operations are price sensitive and largely unsuitable for MDW/ORD. It will be important to get Chicago Department of Aviation help.
9.3
2. Low cost carrier gateway
The potential for lower rates and charges and the proximity of the Chicago market are factors compatible with LCC market strategies.
7.5
3. Corporate Aviation Base/ Chicago Vertiport
The available aeronautical infrastructure, lack of air space congestion and available airport property could enable Gary to address the need for a southern corporate aviation airport
7.2
4. Corporate and GA recovery
The potential recovery of the GA market could create demand for training facilities, flight schools and other ancillary and supporting services,
6.9
5. Midway will reach capacity by 2020
The region will need more capacity in the south to serve the growing market. 6.7
6. Industry shift to trucking
A portion of the heavy truck cargo surrounding and bypassing GYY has air eligible potential. The option for a trucking consolidation and distribution center exists.
5.2
7. Scheduled services connecting to hub operation
GYY offers an option for regular travelers in the region to avoid the Chicago airports and connect by air to a larger facility.
4.6
8. Decrease in steel mill activity
This could create a sense of urgency and impetus for new business development to fill the void. 3.3
9. High speed rail and NS track upgrades
Trains stopping near the Airport could create an additional though modest passenger feed. 2.8
10. Better integration of South Bend RR to Airport.
Trains stopping near the Airport could create an additional though modest passenger feed. 2.8

THE GARY/CHICAGO INTERNATIONAL AIRPORT STRATEGIC BUSINESS PLAN FINAL
Landrum & Brown A-6 April 2010
Threats Description Rating
1. Runway constraints may prove restrictive
Operational limitations will limit the scope of operations and the attractiveness of the facility to certain market segments.
9
2. Any incident involving an on-Airport crime and an Airport user
Because of existing perceptions, such an occurrence could be potentially catastrophic from a public relations and market development perspective.
8.7
3. One more failure of subsidized scheduled service
The previous lack of success has already weakened Airport credibility. An additional failure would be a major concern regionally and politically
8.6
4. Chicago Department of Aviation may resist transferring any flights
Without recognition of GYY as a component of the regional airport system by Chicago DOA, Charter services could be difficult to transfer.
8.1
5. Scheduled services unable to command load factors at fares required for profitability.
Failure to demonstrate that a carrier can achieve and maintain necessary traffic volumes will discourage any new entrant. 8
6. Large capital investments are needed at the Airport.
Higher costs could translate into higher end-user fees impacting cost competitiveness. 7.7
7. Federal inspections services prove uncooperative
Without Customs there is reduced viability for international charters. 7

THE GARY/CHICAGO INTERNATIONAL AIRPORT STRATEGIC BUSINESS PLAN FINAL
Landrum & Brown A-7 April 2010
Business & Community
Strengths Logic Rating
1. RDA Relationship The RDA is charged with focusing on GYY and surrounds, thereby keeping it a State priority. The RDA provides funding to GYY for approved capital projects.
9.7
2. Gary/Chicago Compact provides stability
Provides annual funding. In 2008 Gary received $857,000, the majority of which came from Chicago airport revenues.
9.4
3. FAA Letter of Intent grant
Provides $57.8 million for railroad relocation/runway extension project.
9.1
4. Regional Airport Authority
Structure enables GYY to tap into financial resources of Chicago airport system, although funding is not guaranteed.
9
5. Congressional relationship
This element has been critical in securing financial and political support.
8.9
6. Airport generated Economic Impact
According to the 2001 Economic Impacts of Airports in Indiana study the GCIA ranked in the top 10% of the 105 Hoosier airports surveyed with an annual economic impact of more than $45 million upon the region. Currently this element reflects more potential that reality.
8.4
7. State of Indiana Various elected and appointed officials (Senate, Congress, State Rep, and IEDC) are either actively assisting or are ready to assist GYY, Gary and NW Indiana.
8.2
8. Media interest in GYY The airport is frequently in the paper and perceived as a strong potential regional asset with operational and development issues.
6.3
9. Regional and City Diversity
Diverse communities yield different perspectives on issues and opportunities. Note: unless this can be managed it is also a major weakness
6.2
10. Gary Southshore Air Show
Generates both public and industry awareness and annual revenue.
5
11. Gary Community Believes that GYY is a “diamond in the rough.” 5
12. Chicago MPC Relationship
The MPC wants to assist in bringing sustainable revitalization efforts to NE Indiana; however, there are no funds yet to pay for their efforts.
4.4
13. Labor force Considered to be hard-working and accustomed to long, hard hours.
3
14. Elected officials Many have strong local roots and are committed to the City and Airport success.
3
15. Socio-economic range
A wide range provides a diverse potential market from which to draw customers.
2.4

THE GARY/CHICAGO INTERNATIONAL AIRPORT STRATEGIC BUSINESS PLAN FINAL
Landrum & Brown A-8 April 2010
Weaknesses Logic Rating
1. Business Management The Airport needs a clear vision and strategic plan. As a result, resource allocation is not as focused as it should be.
10
2. Reliance on alternative funding sources
If alternative funding sources fail, the Airport cannot be financially self-sustaining under existing operating scenarios.
9.7
3. Declining tax base GYY lost $675,000 in FY 2009 9.5
4. Local business do not need GYY
Local businesses are utilizing other modalities for transport and delivery.
9.3
5. Gary- budget deficit of over $4 mill
If the Gary budget continues to contract, GYY will collect even less tax dollars than currently.
9.1
6. Dependence on the City of Gary
There is a diminishing business base in the City. Gary has been unable to collect 30% of 2009 tax revenues. Further, with massive tax cuts and ensuing lay-offs, and a non-collection of COIT and LOIT which goes into the Pubic Safety fund, there concerns about Gary’s financial viability.
9
7. Public Perception of GYY/Gary
Regional businesses are not dependent on GYY. The Airport is perceived as a Gary rather than a regional asset.
8.9
8. No major compelling reason to relocate to Gary
The difficult financial conditions, depressed areas, political polarization, and the complexity of the business development process are problematic.
8.8
9. There is no long-term commitment of PFC funds from Chicago
GYY itself cannot impose a PFC and local resources are not sufficient to finance capital development needs. 8.7
10. No incentives for businesses to relocate or grow in Gary
For some projects, incentives are needed to help offset start-up costs. The absence of such inducements slows growth opportunities.
8.7
11. Reliance on RDA and Compact funding
Despite its aggressive efforts, GYY is not perceived as proactively seeking alternative funding, thereby creating frustration at the State level.
8.6
12. Limited tax abatements
Creates additional hurdles/barriers for businesses desiring to enter the marketplace.
8.5
13. No COIT, County Option Income Tax
The lack of this funding source creates an additional burden on the City and airports financial sustainability.
8.3
14. No LOIT, Local Option Income Tax
The lack of this funding source creates an additional burden on the City and airports financial sustainability.
8.3
15. Capacity to implement the Strategic Plan
Without the correct overall staff composition, successful implementation will be problematic given the potential challenges of Plan implementation.
8.1
16. Onerous process for businesses to establish in Gary
The difficult process to create a business in Gary discourages interested parties which results in unrealized tax revenues, loss of jobs, and loss of potential aviation activity
8

THE GARY/CHICAGO INTERNATIONAL AIRPORT STRATEGIC BUSINESS PLAN FINAL
Landrum & Brown A-9 April 2010
Weaknesses Logic Rating
17. Regional Communication
The communication flow of both critical and non-critical information among the Airport, the City and its management, potentially supporting municipalities and agencies, and federal entities is limited. The lack of shared information and vision limits buy-in and potential growth.
8
18. Community polarization
Polarization is acknowledged but strategies to manage differences have not been identified resulting in less trust and cooperation.
8
19. Lack of community involvement.
Without “buy-in” for objectives, initiatives will be met with resistance.
7.7
20. Airport Board Composition
Regionalization of the Board and the branding of the Airport will be essential to future success. (State Law currently prohibits individuals engaged in commercial aviation at GYY from serving on the Board).
7.7
21. Historically, GYY has not been a State priority
Local, regional, and Chicago perceptions suggest that the State has not made Gary a priority over the last 20 years.
7.6
22. Support of the Mayor’s Office
Although the Mayor has a strong vision for the Airport, it is not consistent with industry indicators. Since the City controls the Board the perception of parochial decisions discourage regional approaches to growth.
7.6
23. Airport Staff Certain skill sets critical to an Airport in a developmental stage are not available.
7.4
24. No indicated business development strategy
A pragmatic plan based on regional dynamics and available funding is necessary to focus on the right business initiatives.
7.3
25. Unfocused Marketing Marketing is broad-based without a clearly defined strategy and branding concept.
7.3
26. Highly political region Political differences inhibit a willingness to regionalize the Airport asset.
7
27. Socio-economic imbalance
Unmanaged diversity results in local, regional tensions, lack of trust, and lack of cooperation.
6.7
28. Limited or unfocused community outreach
Without community and other stakeholder involvement, “buy-in” for any objectives will be met with resistance.
6.7
29. Regional Image The physical appearance of the area around the Airport discourages interest and investment.
5.4
30. Regional Airport Authority
Adds an additional layer of review and approval for certain actions including capital expenditures.
4.9

THE GARY/CHICAGO INTERNATIONAL AIRPORT STRATEGIC BUSINESS PLAN FINAL
Landrum & Brown A-10 April 2010
Opportunities Description Rating
1. Market Charter Flights
Charter flights for destination purposes (casinos, lake, Chicago) could result in increased revenues; job creation.
9.7
2. Development as a Regional airport
Currently, Gary is a city airport. A regional airport would attract more business increasing use and position the facility to realize increased revenues.
8.9
3. 3,500 people from the area fly daily
This figure represents a market potential that could be addressed if appropriately segmented and a cost benefit for specific routes clearly demonstrated.
7.7
4. Educational satellite campuses
Bringing a trades school to GYY could satisfy a local need for education and provide tenant revenues. 7
5. Collateral Development
Targeting non-essential Airport property for new businesses including commercial, industrial, and retail could generate additional revenues, jobs, and tax benefits.
6.7
2. Michael Jackson Museum, Hotel
City of Gary is in negotiations to development a museum and hotel in honor of the late M. Jackson. Tourist attraction produces revenues; job creation, increased potential for charter and scheduled operations.
5.7
6. Military Options Housing the National Guard unit at GYY creates opportunities for additional military presence with increased revenues, visibility, and traffic (However, since military units also seek to pay minimal rents and landing fees, revenue potential may not be significant).
5.4
7. Develop/grow the annual Gary Southshore Air show
More than 500,000 spectators attend the 3rd largest over-water air show in the nation and generate significant revenues (Note that a lack of regional amenities to include local hotels could be an issue).
5.1
8. Foreign Trade Zone Activation of the FTZ (a national economic incentive program) and creation of an Annex could increase trade and manufacturing opportunities.
5
9. Public-Private Partnership (P3)
There is a wide spectrum of Public-Private Partnership opportunities and potential ownership models that could benefit the region and the operation and growth of the asset.
4.3
10. Intermodal transportation - rail connections
The use of two different modes of transportation to move goods or passengers in the region could increase revenues and create greater efficiencies as well as jobs.
3.3

THE GARY/CHICAGO INTERNATIONAL AIRPORT STRATEGIC BUSINESS PLAN FINAL
Landrum & Brown A-11 April 2010
Threats Description Rating
1. Chicago pulls out of Compact
If this funding source is gone, GYY loses approximately $900,000 per year in revenue, which would have a significant financial impact.
10
2. RDA 2015: the State stops contributing
The State contributes $10 million to the RDA annually, but will stop payments in 2015 Diminished funding threatens the viability of the Airport.
10
3. DUAB denies GYY appeal
If the Distressed Units Appeal Board denies the City’s appeal on tax caps it will have an adverse impact on tax revenues.
9.8
4. Loss of AIP funding after 2015
The LOI expires after 2015. A failure to renew or implement an alternative could mean no guaranteed AIP funds to help the Airport meet capital needs
9.6
5. Porter and others secede from the RDA
If Porter County secedes there will be less money to fund projects, and lack of unity and direction for developing regional initiatives.
9
6. Environmental Constraints
Despite its 700 acres, GYY has little available land for development and what is there is impacted by the Carner Blue Butterfly, Dune and Swale, and the Superfund status of several sites.
8.9
7. Gary’s payments to the RDA are in ($3.5 million) arrears
3 cities and 2 counties pay into the RDA, each pays $3.5 m. Shortfalls will result in less available funds for the RDA to fund projects.
8.7
8. Gary goes bankrupt For a bankrupt city, all new projects must be approved by a majority of creditors. Bankruptcy carries a greater stigma for a city than for a corporation. Borrowing ability will be hindered and available funding for the Airport will decrease.
8.4
9. 2012 DUAB ceases operations
Due to the adoption of the State Constitutional amendment, the DUAB is set to terminate. All Debt Service Funds could be calculated into tax base.
8.3
10. Steel mills fail Even though the mills are taxed less than they were in the past, they still account for substantial revenues and business. Corporate jets would depart, the tax base will shrink, and more people will leave Gary.
6.9
11. Economy downturn continues
Economic recovery has a direct impact on the numbers of passengers that fly on a discretionary basis and on a more limited basis, business travelers.
6.4
12. Airline, tenant Bankruptcies
There is continuing potential within the industry for failures and consolidations which will increase capacity at existing airports.
4.9

THE GARY/CHICAGO INTERNATIONAL AIRPORT STRATEGIC BUSINESS PLAN FINAL
Landrum & Brown A-12 April 2010
THIS PAGE INTENTIONALLY LEFT BLANK

THE GARY/CHICAGO INTERNATIONAL AIRPORT STRATEGIC BUSINESS PLAN FINAL
Landrum & Brown B-1 April 2010
APPENDIX B AIRLINE INDUSTRY TRENDS OF
PERIPHERAL IMPORTANCE TO GARY The airline industry has a high profile among investors, regulators, and the traveling public. The problems the industry has faced, whether in the recent economic contraction or previous crises, have been well publicized. This Appendix investigates the most important systemic issues affecting commercial airlines. These influences affect every carrier at every airport. They are not unique to Gary. They will affect the industry’s ability to serve Gary, and they are important to understanding the Gary Airport’s circumstances. They are beyond the Airport’s control, but could require action by the Airport. A discussion of each follows.
(i) The Regional and National Economy
The 2007 collapse of the sub-prime mortgage markets precipitated a widespread global crisis, marked by the collapse of many large financial institutions and a widespread recession. By the late Fall of 2009, the Far East1 was demonstrating clear signs of a recovery. However, the International Monetary Fund has warned that the recovery for most of the world will be long and sluggish.2 The economy of Northwest Indiana has for years been tied to the strength of the steel industry. Locally, this industry has been in decline for decades. Competition from foreign mills and the continued loss of market share of the Detroit Three automotive manufacturers have caused a retrenchment and a restructuring of the industry. A further problem has been the growth of mini-mills. Since 1970, their share of the U.S. market has grown from 10 percent in 1970 to 57 percent in 20063. The mini-mills, located throughout the nation, are now developing processes to manufacture high quality sheet steel, a market still controlled by integrated processors. In the short term, Indiana steelmakers may benefit as producers close plants elsewhere and shift production to the Gary region4. In the immediate future, the problems facing integrated steel makers will suppress growth in northern Indiana. In the longer term, any shrinkage of the steel mills could promote the restructuring of the region. The region’s strengths include several high-volume transcontinental arteries, proximity to the very large Greater Chicago market, the natural resources of the Indiana Dunes National Lakeshore, abundant land, several educational institutions, and a well-educated labor force. The Airport could help Northwest Indiana leverage these strengths, and could serve as the cornerstone of a regional development effort. This opportunity, however important to the region, has no immediate impact on the passenger air service strategies for the Airport.
1 The Economist, August 15-21 2009 2 International Monetary Fund, World Economic Outlook, (Washington, September 22, 2009) 3 Source: Environmental Protection Agency, Metallurgical Industry, (Washington, April 2009) 4 In a March 3, 2009 press release, U.S. Steel announced plans to idle plants in Nanticoke and
Hamilton Ontario, and shift production to Pittsburgh, Gary and Birmingham AL.

THE GARY/CHICAGO INTERNATIONAL AIRPORT STRATEGIC BUSINESS PLAN FINAL
Landrum & Brown B-2 April 2010
(ii) Low Airline Profits Over the 1990-2008 period, commercial airlines generated losses equal to 1.9 percent of their operating revenues5. In only nine of the nineteen years did the industry generate profits. The low profitability results from intense competition, a distribution system that favors very low fares, high fixed costs, and the difficulties airlines collectively face for reducing capacity. Low profits have impeded the industry’s access to capital and the airlines are using increasingly elderly equipment. The carriers have become very intolerant of money-losing routes and now expect new services to reach break-even quickly.
The industry’s low profitability has made airlines very averse to risk. Any new route is inherently risky, even between points it already serves. Adding a new destination is riskier. It involves the large fixed costs of establishing a station and even greater risks on the revenue side. Starting service to an airport that is not presently served can be particularly risky. The airport will not have established its popularity within the community and there will be no traffic data generated by any incumbents. If this airport is close to other airports that the airline already serves, there will be a danger that the new services merely divert traffic from existing flights. (iii) Strong Price Competition The internet and websites such as Orbitz have almost eliminated the need for traditional brick-and-mortar travel agencies. The convenience, low cost and transparency of the search engines allow passengers to rank options in stark detail. Price has emerged as the leading criterion of choice. The websites strongly encourage low fares. Traditional return trip, advance purchase and stay-over-Saturday restrictions can no longer prevent the widespread dilution of fares. The problems of maintaining adequate fares in the presence of competition and internet search engines mean that airports or routes which command a fare premium are of very high value to an airline. If residents of Northwestern Indiana are willing to pay somewhat higher fares to eliminate the need to drive to Midway or O’Hare, airlines would have a powerful inducement to serve Gary. Indeed, such a premium could be essential if the low volumes of the flight or the high costs of regional jets make Gary flights more costly per seat that those of Midway or O’Hare. However, the limited visibility of the Airport may require low fares to attract passengers.
(iv) Volatile Fuel Prices
In the Fall of 2009, benchmark prices for crude oil had stabilized at $80/barrel, substantially below the 2008 high of $147/bbl. However, fuel prices will remain volatile, and fluctuations will cause large swings in airline earnings. A carbon dioxide emissions trading scheme to address global warming could raise fuel prices further. Changes in fuel prices and airline profitability will affect the airlines’ willingness to begin new services. Higher prices will favor large, modern fuel-efficient aircraft, to the detriment of smaller regional jets or the older equipment
5 Source: Air Transport Association website

THE GARY/CHICAGO INTERNATIONAL AIRPORT STRATEGIC BUSINESS PLAN FINAL
Landrum & Brown B-3 April 2010
used by low cost carriers. If the Airport enters into any risk sharing or revenue guarantee contracts with a passenger airline, it will be absorbing many of the risks associated with the volatility of oil prices.
(v) Maturing Technology and Cost Structures
Since the middle of the last century, the air transport industry has grown much faster than the Gross Domestic Product (GDP). Lower real fares resulting from improved technology (e.g. two-person crews, low maintenance, fuel-efficient engines, improved aerodynamics, better information technology, etc.) and market liberalization (which forced the airlines to pass the savings on to travelers through lower fares) have generated most of the growth of air travel.
As technology improves, it will become increasingly difficult to obtain further improvements. For example, most commercial aircraft have two engines and two crew members, but there is no interest in further reductions. Advanced engine technologies have greatly reduced fuel consumption, but further efficiencies will be increasingly elusive. The maturing technology will mean that costs and fares will fall more slowly than previously, causing slower traffic growth. Passenger services at the Gary Airport will therefore depend more upon capturing a well defined and distinct traffic segment from O’Hare and Midway than on hoping for widespread organic growth to create a local traffic base. A tight selectivity will be more successful than seeking a small and undifferentiated part of the total scheduled market. (vi) Convergence of Network and Low Cost Carriers The U.S. domestic airline industry has had a long dichotomy between “legacy” and “low cost” carriers. The fares and levels of service were starkly different. Low cost carriers offered point-to-point services to key markets; legacy airlines provided everywhere-to-everywhere flights through strategically located hubs. The low cost carriers have expanded sufficiently that they now experience many of the economic problems of the legacy airlines. As their staff get older and view their employment as a career, they seek higher wages. Maintenance costs increase as the fleet ages. They have had to adopt many of the business approaches of the legacy carriers, such as hub and spoke systems (particularly Frontier Airlines), improved in-flight services and strategic alliances. The legacy carriers now charge separately for in-flight meals or checked luggage, while setting fares that are often less than those of the low cost airlines. Some analysts used to refer to the legacy airlines as “full service” carriers, as opposed to the more limited services of low cost airlines. This term has now disappeared from use. These changes complicate efforts to differentiate Gary from Midway and O’Hare. An initiative to brand the Airport for low cost or legacy carriers will have little impact because both types of carriers are increasingly the same. The erosion of the low cost carriers’ cost leadership will continue. These changes could benefit a third type of carrier. It makes extensive use of second-hand aircraft, and operates flights on a less than daily basis to small or low profile airports. These airlines, such as Allegiant, Direct Air and USA3000 serve
THE GARY/CHICAGO INTERNATIONAL AIRPORT STRATEGIC BUSINESS PLAN FINAL
Landrum & Brown B-4 April 2010
leisure markets. They are very cost and price sensitive and not necessarily appropriate users for highly congested and expensive airports. Economic Vulnerability The airline industry continues to experience intermittent crises marked by the failure of individual carriers, large operating losses, widespread cutbacks, and major changes in corporate strategies. Many factors have triggered these episodes, such as the oil price hikes of 1973-1974, 1979-1980, and 2008, the invasion of Iraq in 1990 and the Desert Storm military activity, the terrorist attacks of September 11 2001, the 2003 invasion of Iraq and the current economic contraction. Airlines such as Pan American, Eastern, Aloha, Western Pacific, Vanguard and SkyBus have failed; Trans World, Frontier, Reno Air, Morris Air, US Airways6, Northwest and others have been acquired, while all remaining carriers have been forced into continuous adaptation. The industry is prone to earnings crises. Its vulnerability results from chronically poor earnings, intense competition, relatively high fixed costs, large demands for cash and the need to purchase jet fuel at unpredictable prices. Websites such as Orbitz make the structure of fares completely transparent and promote price-based comparisons. It is difficult to differentiate the product, and unused seats cannot be stored in inventory. An airline with empty seats will have a temptation to undercut its rivals, but all would likely follow and suffer accordingly. These circumstances lead to intense price competition and very low airline margins. These circumstances help determine the airline(s) best able to service the Gary Airport. The Airport needs a solid, well-capitalized airline that can make a reasonable effort to establish a route. It must be able to bear the risks of a new route. Its efforts at Gary should be able to survive except for a company-wide earnings crisis. While the Airport cannot be overly selective in approaching carriers, its ability to enter into revenue guarantees and risk-sharing must reflect the quality of the airline.
6 The merged entity of America West’s acquisition of US Airways was named “US Airways”.
However, the corporate survivor was the original America West.

THE GARY/CHICAGO INTERNATIONAL AIRPORT STRATEGIC BUSINESS PLAN FINAL
Landrum & Brown C-1 April 2010
APPENDIX C STATISTICAL ANALYSIS OF
NORTHWEST INDIANA SCHEDULED TRAFFIC An airline evaluating services on a new route will focus primarily on the quantity of traffic. Estimating demand can be very difficult, especially if no airlines already serve the airport. The process is especially complex if other nearby airports compete for the traffic. Often, as at Gary, the presence of a large market will be obvious, but the share of that traffic that will actually use the airport in question will be problematic. Fare differences between airports will have a large influence in how traffic is distributed among the airports. Airlines use many sources of information and analytical techniques, but must ultimately rely on judgment. The most common method is to examine the minutiae of the community; discussions with travel agents, analyzing ticket coupon samples etc. to build up traffic estimates from finely detailed data. A second type of procedure involves a “top down” approach. It assumes that an airport’s traffic depends on many factors, including local population, employment, income, fares, proximity of competing airports and fares at each airport. Every airport conforms to this pattern, subject to a statistical deviation. The techniques of multi regression can determine the broad relationship. The Gary Airport has already undertaken an extensive analysis of the local community, regional demographics, and the economic base. This study applied a very different method to estimate traffic. It used the assumption that Northwest Indiana would behave like any region, after accounting for the economic base, population, ethnic makeup, personal incomes, household wealth, ethnic diversity, distance to other airports, and inter-airport fare differences. This study considered over 40,000 postal code records in turn. Each postal code was examined in terms of employment, average wages, population, incomes and other parameters. This data was cross-referenced to over 180 airports receiving scheduled services. A database was constructed showing, for each airport, the economics and demographics of its regional, fare differentials with other airports, and distances to other airports. A series of calculations determined which variables had the largest impact on an airport’s traffic, and those showing little significance were discarded. Results are shown below.
R Square 0.7742 Adjusted R Square 0.7681 Standard Error 0.3339 Observations 228

THE GARY/CHICAGO INTERNATIONAL AIRPORT STRATEGIC BUSINESS PLAN FINAL
Landrum & Brown C-2 April 2010
Analysis of Variance
Source Degrees of Freedom
Sum of Square
Mean Square F
Regression 6 84.487556 14.08125929 126.28 Residual 221 24.643242 0.111507884 Total 227 109.1308
Coefficients Standard
Error t Stat Intercept -2.288 1.1732682 -1.95047529 Average Fare -1.247 0.2751591 -4.53055867 Traffic, Nearest Airport -0.068 0.027878 -2.42408954 Fare Competing Airports 0.1984 0.1351755 1.467877646 Population 1.3123 0.0691233 18.98524528 House Value 1.2203 0.1315509 9.276469364 Population Closer to Other Airports -0.448 0.098171 -4.56325711
The variables chosen include:
Average Fare The average domestic fare of a particular airport and its nearest competitors. The negative value means that an airport with high average fares will capture less traffic.
Traffic Nearest Airport
The number of domestic origin-destination passengers served by the closest competing airport. The larger this value, the less traffic that the airport in question will serve, hence its negative coefficient.
Fare, Competitor Average fare at nearby competing airport (s). The higher their fares, the more traffic will use the airport in question.
Population Number of persons living closer to this airport than to any other. House Value Average value of homes in the area closer to this particular
airport than any other. Population Closer to Other Airports
Number of people living within 50 miles of this airport, but who live even closer to another airport with scheduled service.
The r-square of .77 is very high for a cross-sectional model, especially of this size and complexity. An ordinary least squares linear regression will generate estimates having statistically desirable qualities if the sample meets several conditions. A crucial assumption requires that the error term – the difference between the observed dependent variable and the expected value generated by the parameters, is strictly random. Its distribution is constant throughout the sample. Heteroscedasticity occurs when the variance of the error term depends on the exogenous variables. In a model that expresses traffic in terms of population, this condition would occur if a large population increases the likelihood of a large negative or positive deviation in traffic. The regression coefficients lose some of their desirable properties and the test statistics lose their validity.
A “generalized least squares” regression corrected for the heteroscedasticity. A transformation of the data yielded coefficients that are not directly comparable to those generated by the ordinary least squares procedure.
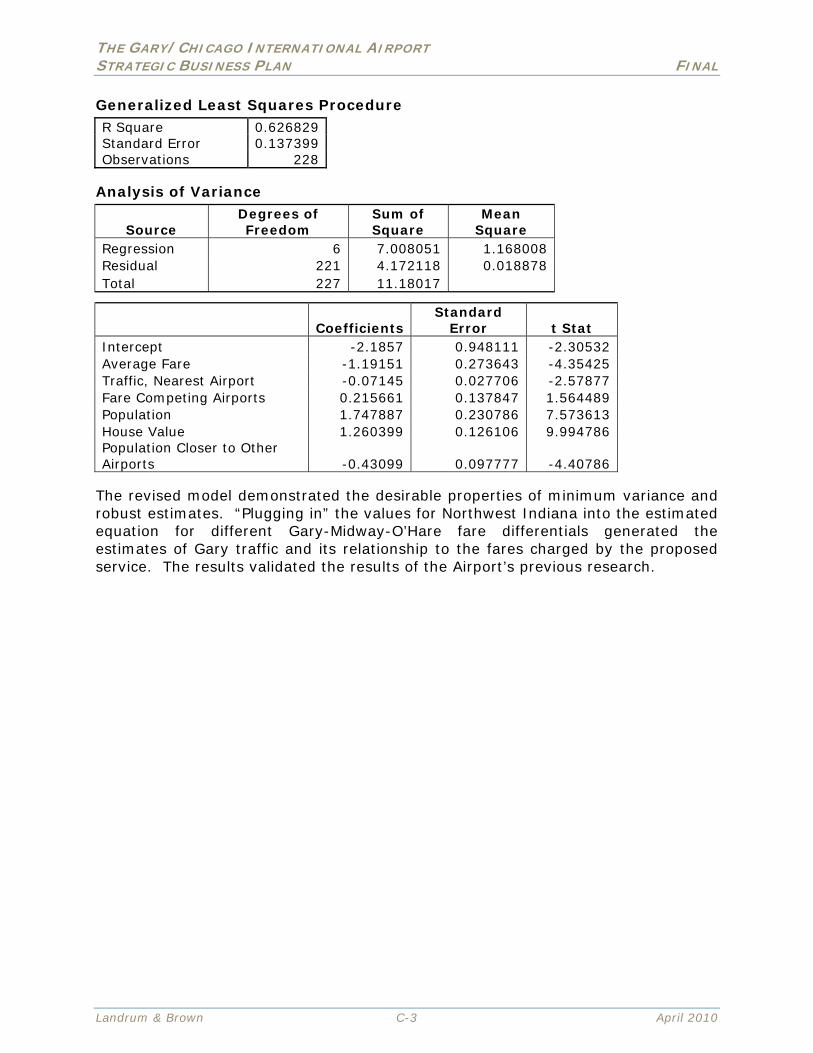
THE GARY/CHICAGO INTERNATIONAL AIRPORT STRATEGIC BUSINESS PLAN FINAL
Landrum & Brown C-3 April 2010
Generalized Least Squares Procedure R Square 0.626829 Standard Error 0.137399 Observations 228
Analysis of Variance
Source Degrees of Freedom
Sum of Square
Mean Square
Regression 6 7.008051 1.168008 Residual 221 4.172118 0.018878 Total 227 11.18017
Coefficients Standard
Error t Stat Intercept -2.1857 0.948111 -2.30532 Average Fare -1.19151 0.273643 -4.35425 Traffic, Nearest Airport -0.07145 0.027706 -2.57877 Fare Competing Airports 0.215661 0.137847 1.564489 Population 1.747887 0.230786 7.573613 House Value 1.260399 0.126106 9.994786 Population Closer to Other Airports -0.43099 0.097777 -4.40786
The revised model demonstrated the desirable properties of minimum variance and robust estimates. “Plugging in” the values for Northwest Indiana into the estimated equation for different Gary-Midway-O’Hare fare differentials generated the estimates of Gary traffic and its relationship to the fares charged by the proposed service. The results validated the results of the Airport’s previous research.

THE GARY/CHICAGO INTERNATIONAL AIRPORT STRATEGIC BUSINESS PLAN FINAL
Landrum & Brown C-4 April 2010
THIS PAGE INTENTIONALLY LEFT BLANK

THE GARY/CHICAGO INTERNATIONAL AIRPORT STRATEGIC BUSINESS PLAN FINAL
Landrum & Brown D-1 April 2010
APPENDIX D PASSENGERS ON DOMESTIC LOW FREQUENCY
SCHEDULED AND CHARTER SERVICES Gary Airport
1990 1991 1992 1993 1994 1995 1996 1997 1998 1999 2000
Sanford 0 0 0 0 0 0 0 0 0 2,016 21,651
Las Vegas 0 0 0 0 0 0 0 0 0 0 0
St. Petersburg 0 0 0 0 0 0 0 0 0 0 0
Elko 0 0 350 1,325 613 859 909 1,791 824 1,391 1,302
Phoenix 0 0 0 0 0 0 0 0 0 0 0
Salt Lake City 0 0 220 928 788 1,073 1,111 576 947 1,137 1,222
Myrtle Beach 0 0 0 0 0 0 0 0 0 0 0
Orlando 0 0 0 0 0 0 0 0 0 0 0
Omaha 0 0 0 0 357 364 670 687 361 278 423
Other 0 0 0 328 336 476 355 789 1,031 1,482 22,407
Total 0 0 570 2,581 2,094 2,772 3,045 3,843 3,163 6,304 47,005
2001 2002 2003 2004 2005 2006 2007 2008
Sanford 13,752 10,690 0 144 0 0 0 0
Las Vegas 0 0 0 0 13,697 469 7,270 99
St. Petersburg 624 4,551 0 0 1,226 835 5,733 0
Elko 245 1,072 924 600 600 0 0 0
Phoenix 0 0 0 0 0 783 9,674 0
Salt Lake City 580 329 450 677 319 0 0 0
Myrtle Beach 0 0 0 4,940 1,569 0 0 0
Orlando 0 0 0 0 0 933 5,351 0
Omaha 702 113 100 120 112 0 0 0
Other 23,419 216 100 5,824 16,904 1,228 2,855 3,562
Total 39,322 16,971 1,574 12,305 34,427 4,248 30,883 3,661 Source: United States Department of Transportation Database 28DS
Midway Airport
1990 1991 1992 1993 1994 1995 1996 1997 1998 1999 2000
Myrtle Beach 0 0 0 0 0 0 21,446 31,533 0 0 0
Miami 0 0 0 936 1,597 0 0 25,269 0 0 0
Charleston 0 0 0 0 0 0 12,225 2,088 0 0 0
Savannah 0 0 13,523 69 0 0 0 0 0 0 0
Minneapolis/St.Paul 0 0 0 475 10,369 0 0 0 0 0 0
Other 2,402 0 0 334 830 946 2,712 2,751 0 36 3,148
Total 2,402 0 13,523 1,814 12,796 946 36,383 61,641 0 36 3,148
2001 2002 2003 2004 2005 2006 2007 2008
Myrtle Beach 0 0 0 0 0 0 0 0
Miami 0 182 67 69 82 238 173 51
Charleston 0 0 0 0 0 0 0 0
Savannah 0 0 0 0 0 0 0 0
Minneapolis/St.Paul 0 0 0 0 0 0 0 0
Other 206 2,133 5,978 6,816 6,211 7,479 16,452 9,619
Total 206 2,315 6,045 6,885 6,293 7,717 16,625 9,670
Source: United States Department of Transportation Database 28DS

THE GARY/CHICAGO INTERNATIONAL AIRPORT STRATEGIC BUSINESS PLAN FINAL
Landrum & Brown D-2 April 2010
O’Hare Airport
1990 1991 1992 1993 1994 1995 1996 1997 1998 1999 2000
Las Vegas 0 0 0 0 0 0 0 0 0 0 0
Orlando 0 0 0 0 0 0 0 0 0 0 0
Elko 0 0 0 0 326 1,612 2,059 2,025 2,296 1,699 2,695
Sarasota/Bradenton 0 0 0 0 0 0 0 0 0 0 0
Salt Lake City 0 0 0 0 220 1,175 1,331 1,922 1,237 2,305 1,448
Ft. Myers 0 0 0 0 0 0 0 0 0 0 0
San Juan 0 0 0 0 0 447 9,694 0 0 0 0
Miami 0 8,919 0 0 0 0 0 0 0 0 0
Aspen 947 5,387 0 0 0 0 0 0 0 0 0
Sanford 0 0 0 0 0 0 0 0 0 0 0
Other 5,310 2,019 8,455 8,360 6,680 1,018 5,405 9,772 7,588 8,556 2,883
Total 6,257 16,325 8,455 8,360 7,226 4,252 18,489 13,719 11,121 12,560 7,026
2001 2002 2003 2004 2005 2006 2007 2008
Las Vegas 0 0 23,764 39,859 25,027 0 0 0
Orlando 0 0 0 0 14,602 14,594 13,518 0
Elko 1,745 1,698 1,259 974 852 0 0 0
Sarasota/Bradenton 0 0 0 0 0 0 2,272 15,081
Salt Lake City 570 925 693 615 437 0 0 0
Ft. Myers 0 1,681 9,043 0 0 0 0 0
San Juan 0 0 0 0 0 0 0 0
Miami 0 0 0 0 0 0 0 0
Aspen 0 0 0 0 0 0 0 0
Sanford 0 0 0 0 0 5,664 0 0
Other 6,757 5,461 17,639 18,784 15,990 11,659 15,785 17,364
Total 9,072 9,765 52,398 60,232 56,908 31,917 31,575 32,445 Source: United States Department of Transportation Database 28DS
All Chicago Airports
Gary Midway O'Hare All Points 1990 0 2,402 6,257 8,659 1991 0 0 16,325 16,325 1992 570 13,523 8,455 22,548 1993 2,581 1,814 8,360 12,755 1994 2,094 12,796 7,226 22,116 1995 2,772 946 4,252 7,970 1996 3,045 36,383 18,489 57,917 1997 3,843 61,641 13,719 79,203 1998 3,163 0 11,121 14,284 1999 6,304 36 12,560 18,900 2000 47,005 3,148 7,026 57,179 2001 39,322 206 9,072 48,600 2002 16,971 2,315 9,765 29,051 2003 1,574 6,045 52,398 60,017 2004 12,305 6,885 60,232 79,422 2005 34,427 6,293 56,908 97,628 2006 4,248 7,717 31,917 43,882 2007 30,883 16,625 31,575 79,083 2008 3,661 9,670 32,445 45,776
Source: United States Department of Transportation Database 28IM

THE GARY/CHICAGO INTERNATIONAL AIRPORT STRATEGIC BUSINESS PLAN FINAL
Landrum & Brown E-1 April 2010
APPENDIX E PASSENGERS ON INTERNATIONAL LOW COST
CARRIER AND CHARTER FLIGHTS AT CHICAGO AIRPORTS
Principal Destinations
Vacation Mexico Ethnic Mexico Caribbean
O’Hare Midway Total O’Hare Midway Total O’Hare Midway Total
1990 23,382 0 23,382 4,527 0 4,527 40,455 19,248 59,703 1991 31,402 0 31,402 2,382 0 2,382 35,380 13,816 49,196 1992 69,113 323 69,436 3,399 0 3,399 41,947 1,500 43,447 1993 106,829 0 106,829 13,943 0 13,943 62,576 0 62,576 1994 121,371 0 121,371 2,462 0 2,462 64,214 21,006 85,220 1995 107,451 0 107,451 2,349 0 2,349 50,927 36,630 87,557 1996 98,374 129 98,503 3,689 0 3,689 30,142 7,267 37,409 1997 127,262 0 127,262 18,302 0 18,302 65,328 223 65,551 1998 104,023 0 104,023 24,383 0 24,383 53,898 171 54,069 1999 123,614 0 123,614 23,406 0 23,406 49,852 95 49,947 2000 156,986 0 156,986 7,872 0 7,872 67,078 38 67,116 2001 168,785 0 168,785 5,281 0 5,281 49,324 3,544 52,868 2002 102,026 30,027 132,053 4,618 26,846 31,464 38,292 10,183 48,475 2003 82,093 50,139 132,232 25,419 39,372 64,791 18,582 15,736 34,318 2004 124,338 78,831 203,169 33,378 54,268 87,646 64,224 15,139 79,363 2005 122,443 55,990 178,433 35,569 44,618 80,187 64,714 5,338 70,052 2006 81,051 42,950 124,001 12,705 51,412 64,117 48,644 0 48,644 2007 73,257 23,128 96,385 3,945 38,094 42,039 40,633 0 40,633 2008 73,759 9,788 83,547 2,414 10,759 13,173 26,634 113 26,747
Source: United States Department of Transportation Database 28IM

THE GARY/CHICAGO INTERNATIONAL AIRPORT STRATEGIC BUSINESS PLAN FINAL
Landrum & Brown E-2 April 2010
Principal Carriers
2000 2001 2002 2003 2004 2005 2006 2007 2008
Midway
Mexico Vacation American Trans Air. 0 0 29,861 44,109 49,417 36,594 36,556 15,761 7,217
Frontier. 0 0 0 0 0 4,644 6,394 7,293 2,571
Ryan International 0 0 0 0 22,921 11,107 0 0 0
Mexico Ethnic American Trans Air. 0 0 26,846 39,372 54,268 44,618 51,412 38,094 10,759
Caribbean American Trans Air. 0 0 9,243 15,736 13,273 5,336 0 0 0
O’ Hare
Mexico Vacation USA 3000 0 0 0 0 35,578 30,711 44,883 48,082 49,281
USA 3000 0 0 0 0 22,723 28,343 15,802 15,447 22,986
Ryan International 0 0 0 10,938 27,875 26,021 3,521 5,728 536
Transmeridian 34,592 7,693 321 10,892 18,589 14,953 0 0 0
Pace 0 0 0 0 0 1,661 12,253 0 0
Transmeridian 19,739 6,269 0 9,014 14,858 13,029 0 0 0
Ryan International 0 0 0 1,698 1,856 2,396 293 3,467 0
Mexico Ethnic Aviacsa 0 0 0 21,326 29,827 32,376 7,818 0 0
USA 3000 0 0 0 0 1,109 25 4,733 2,092 2,071
Ryan International 0 0 0 0 2,442 3,168 154 1,841 0
Caribbean USA 3000 0 0 0 0 11,933 15,500 15,574 20,174 20,286
USA 3000 0 0 0 0 23,421 12,516 12,333 2,891 2,587
Ryan International 0 0 0 0 2,628 10,985 0 7,617 0
Spirit Air Lines 0 0 0 0 0 8,669 4,983 1,977 109
Cayman Airways 0 0 0 366 3,080 2,034 4,694 1,910 1,961
Pace 0 0 0 112 0 326 7,507 0 0
Condor Flugdienst 0 0 701 5,980 12,454 7,324 0 0 0
Ryan International 0 0 0 1,272 2,009 1,586 691 3,206 170
Taca Int'l 0 0 0 29 125 453 3,544 4,386 3,531
Source: United States Department of Transportation Database 28IM

THE GARY/CHICAGO INTERNATIONAL AIRPORT STRATEGIC BUSINESS PLAN FINAL
Landrum & Brown E-3 April 2010
Fortune 1000 Companies in Greater Chicago
Company National Rank Revenues $Millions) Headquarters Location
Boeing 34 60,909.00 Chicago Walgreen 36 59,034.00 Deerfield Caterpillar 44 51,324.00 Peoria Sears Holdings 49 46,770.00 Hoffman Estates Kraft Foods 53 42,867.00 Northfield Motorola 78 30,146.00 Schaumburg Abbott Laboratories 80 29,527.60 Abbott Park Allstate 81 29,394.00 Northbrook McDonald's 107 23,522.40 Oak Brook UAL 123 20,194.00 Chicago Exelon 134 18,859.00 Chicago Illinois Tool Works 148 17,217.90 Glenview Integrys Energy Group 185 14,047.80 Chicago Sara Lee 199 13,450.00 Downers Grove Baxter International 219 12,348.00 Deerfield R.R. Donnelley & Sons 233 11,581.60 Chicago NiSource 289 9,069.50 Merrillville Aon 307 8,406.00 Chicago OfficeMax 313 8,267.00 Naperville Fortune Brands 351 7,105.10 Deerfield Discover Financial Services 352 7,088.00 Riverwoods Smurfit-Stone Container 356 7,042.00 Chicago W.W. Grainger 366 6,850.00 Lake Forest Anixter International 404 6,136.60 Glenview Tenneco 416 5,916.00 Lake Forest Northern Trust Corp. 430 5,677.90 Chicago Telephone & Data Systems 465 5,092.00 Chicago United Stationers 475 4,986.90 Deerfield Brunswick 491 4,708.70 Lake Forest USG 501 4,608.00 Chicago Nalco Holding 536 4,212.40 Naperville Corn Products International 560 3,943.60 Westchester CF Industries Holdings 563 3,921.10 Deerfield Nicor 577 3,776.60 Naperville Hospira 597 3,629.50 Lake Forest Pactiv 604 3,567.00 Lake Forest General Growth Properties 636 3,361.50 Chicago Molex 642 3,328.30 Lisle Old Republic International 651 3,237.70 Chicago Hewitt Associates 653 3,227.60 Lincolnshire Unitrin 715 2,819.70 Chicago Jones Lang LaSalle 735 2,697.60 Chicago CME Group 761 2,561.00 Chicago

THE GARY/CHICAGO INTERNATIONAL AIRPORT STRATEGIC BUSINESS PLAN FINAL
Landrum & Brown E-4 April 2010
Fortune 1000 Companies in Greater Chicago (continued)
Packaging Corp. of America 812 2,360.50 Lake Forest Equity Residential 865 2,148.90 Chicago Sauer-Danfoss 879 2,090.50 Lincolnshire AptarGroup 884 2,071.70 Crystal Lake LKQ 914 1,937.30 Chicago Hub Group 944 1,860.60 Downers Grove Solo Cup 949 1,847.00 Highland Park Tellabs 996 1,729.00 Naperville Career Education 1000 1,720.80 Hoffman Estates

THE GARY/CHICAGO INTERNATIONAL AIRPORT STRATEGIC BUSINESS PLAN FINAL
Landrum & Brown F-1 April 2010
APPENDIX F AREA BUSINESS PROFILE, WITHIN
THEORETICAL 10-MINUTE DRIVE OF SITE 41.61739, -87.40964 Gary-Chicago Airport
EAST CHICAGO, IN EAST CHICAGO, IN
Site Type: Drive Time Drive Time: 10 Minutes Drive Time: 20 Minutes
Total Businesses: 1,749 16,594
Total Employees: 19,853 172,888
Total Residential Population: 75,410 639,692
Employee/Residential Population Ratio: 0.26 0.27
BUSINESS
ES EMPLOYEE
S BUSINESSE
S EMPLOYEES
# % # % # % # % Agriculture, Forestry, Fishing and Hunting
0 0.0% 0 0.0% 11 0.1% 52 0.0%
Mining 0 0.0% 0 0.0% 4 0.0% 17 0.0%
Utilities 3 0.2% 51 0.3% 24 0.1% 225 0.1%
Construction 116 6.6% 1,16
2 5.9%
1,096
6.6% 8,158 4.7%
Manufacturing 95 5.4% 3,27
5 16.5
% 601 3.6%
16,214
9.4%
Wholesale Trade 89 5.1% 744 3.7% 770 4.6% 10,71
6 6.2%
Retail Trade 170 9.7% 681 3.4% 2,65
2 16.0
% 25,72
3 14.9
% Motor Vehicle and Parts Dealers 21 1.2% 93 0.5% 347 2.1% 3,158 1.8% Furniture and Home Furnishings Stores
8 0.5% 19 0.1% 116 0.7% 657 0.4%
Electronics and Appliance Stores 7 0.4% 1 0.0% 143 0.9% 843 0.5% Building Material and Garden Equipment and Supplies Dealers
8 0.5% 37 0.2% 167 1.0% 2,548 1.5%
Food and Beverage Stores 46 2.6% 165 0.8% 465 2.8% 6,526 3.8%
Health and Personal Care Stores 11 0.6% 117 0.6% 197 1.2% 1,906 1.1%
Gasoline Stations 24 1.4% 106 0.5% 224 1.3% 1,581 0.9% Clothing and Clothing Accessories Stores
14 0.8% 36 0.2% 344 2.1% 2,048 1.2%
Sporting Goods, Hobby, Book, and Music Stores
7 0.4% 28 0.1% 153 0.9% 953 0.6%
General Merchandise Stores 9 0.5% 62 0.3% 148 0.9% 3,504 2.0%
Miscellaneous Store Retailers 12 0.7% 19 0.1% 320 1.9% 1,797 1.0%
Nonstore Retailers 1 0.1% 0 0.0% 28 0.2% 202 0.1%
Transportation and Warehousing 75 4.3% 1,07
2 5.4% 575 3.5% 8,662 5.0%
Information 21 1.2% 224 1.1% 246 1.5% 1,704 1.0%
Finance and Insurance 59 3.4% 248 1.2% 876 5.3% 5,004 2.9% Central Bank; Credit Intermediation and Related Activities
29 1.7% 190 1.0% 371 2.2% 3,412 2.0%
Securities, Commodity Contracts, and Other Financial Investments and Related Activities
6 0.3% 12 0.1% 166 1.0% 717 0.4%

THE GARY/CHICAGO INTERNATIONAL AIRPORT STRATEGIC BUSINESS PLAN FINAL
Landrum & Brown F-2 April 2010
Insurance Carriers and Related Activities; Funds, Trusts, and Other Financial Vehicles
24 1.4% 46 0.2% 339 2.0% 875 0.5%
Real Estate and Rental and Leasing 75 4.3% 411 2.1% 836 5.0% 3,931 2.3% Professional, Scientific, and Technical Services
73 4.2% 517 2.6% 989 6.0% 5,083 2.9%
Legal Services 10 0.6% 41 0.2% 171 1.0% 789 0.5% Management of Companies and Enterprises
0 0.0% 0 0.0% 10 0.1% 457 0.3%
Administrative and Support and Waste Management and Remediation Services
45 2.6% 353 1.8% 540 3.3% 3,959 2.3%
Educational Services 61 3.5% 2,41
1 12.1
% 507 3.1%
18,863
10.9%
Health Care and Social Assistance 165 9.4% 1,67
8 8.5%
1,491
9.0% 23,83
9 13.8
%
Arts, Entertainment, and Recreation 33 1.9% 2,07
8 10.5
% 278 1.7% 5,990 3.5%
Accommodation and Food Services 105 6.0% 776 3.9% 1,29
2 7.8%
13,630
7.9%
Accommodation 2 0.1% 5 0.0% 66 0.4% 859 0.5%
Food Services and Drinking Places 103 5.9% 771 3.9% 1226 7.4% 12,77
1 7.4%
Other Services (except Public Administration)
366 20.9
% 1,18
0 5.9%
3,088
18.6%
12,237
7.1%
Automotive Repair and Maintenance
56 3.2% 194 1.0% 557 3.4% 2,371 1.4%
Public Administration 156 8.9% 2,98
4 15.0
% 434 2.6% 8,157 4.7%
Unclassified Establishments 44 2.5% 7 0.0% 274 1.7% 267 0.2%
Totals 1,751
100.0%
19,852
100.0%
16,594
100.0%
172,888
100.0%
Source: ESRI forecasts for 2009. Business data provided by InfoUSA, Omaha NE Copyright 2009, all rights reserved

TH
E G
AR
Y/
CH
ICA
GO
IN
TER
NA
TIO
NA
L A
IRP
OR
T
STR
AT
EG
IC B
US
INES
S P
LA
N
FIN
AL
Landru
m &
Bro
wn
G-1
April 2010
AP
PEN
DIX
G
DEM
OG
RA
PH
IC P
RO
FIL
E W
ITH
IN
TH
EO
RETIC
AL 1
0 A
ND
20
-MIN
UTE D
RIV
E T
IME O
F S
ITE
Gary
-Ch
icag
o A
irp
ort
Lati
tud
e:
4
1.6
17
39
EA
ST C
HIC
AG
O,
IN
Lo
ng
itu
de:
-8
7.4
09
64
S
ite
Typ
e:
D
rive T
ime
D
rive
Tim
e:
1
0 M
inu
tes
Su
mm
ary
20
00
20
09
20
14
Popula
tion
79,7
28
75,4
10
73,6
74
H
ouse
hold
s
29,3
00
28,1
82
27,7
01
Fa
mili
es
19,9
47
18,2
51
17,4
96
Ave
rage
House
hold
Siz
e
2.7
0
2.6
5
2.6
4
O
wner
Occ
upie
d H
ousi
ng U
nits
15,7
67
14,7
06
14,2
98
Ren
ter
Occ
upie
d H
ousi
ng U
nits
13,5
33
13,4
76
13,4
02
M
edia
n A
ge
33.5
34.1
34.4
Tre
nd
s: 2
00
9-2
01
4 A
nn
ual R
ate
Are
a
S
tate
Nati
on
al
Po
pula
tion
-0
.46%
0.5
7%
0.9
1%
House
hold
s
-0.3
4%
0.6
7%
0.9
4%
Fam
ilies
-0.8
4%
0.3
0%
0.7
4%
Ow
ner
House
hold
s
-0.5
6%
0.6
2%
1.1
9%
Med
ian H
ouse
hold
Inco
me
0.9
9%
0.8
7%
0.8
0%
2
00
0
2
00
9
2
01
4
Ho
use
ho
lds
by I
nco
me
N
um
ber
Perc
ent
N
um
ber
Perc
ent
N
um
ber
Perc
ent
<
$15,0
00
8,5
50
29.2
%
6,6
50
23.6
%
6,4
87
23.4
%
$15,0
00 -
$24,9
99
4,7
58
16.3
%
3,9
57
14.0
%
3,8
07
13.7
%
$25,0
00 -
$34,9
99
4,1
26
14.1
%
3,6
43
12.9
%
3,2
04
11.6
%
$35,0
00 -
$49,9
99
4,3
44
14.8
%
3,8
95
13.8
%
3,3
58
12.1
%
$50,0
00 -
$74,9
99
4,2
80
14.6
%
4,9
75
17.7
%
5,9
22
21.4
%
$75,0
00 -
$99,9
99
1,8
05
6.2
%
2,8
85
10.2
%
2,8
10
10.1
%
$100,0
00 -
$149,9
99
988
3.4
%
1,4
91
5.3
%
1,4
41
5.2
%

TH
E G
AR
Y/
CH
ICA
GO
IN
TER
NA
TIO
NA
L A
IRP
OR
T
STR
AT
EG
IC B
US
INES
S P
LA
N
FIN
AL
Landru
m &
Bro
wn
G-2
April 2010
$150,0
00 -
$199,9
99
225
0.8
%
393
1.4
%
383
1.4
%
$200,0
00+
194
0.7
%
284
1.0
%
280
1.0
%
M
edia
n H
ouse
hold
Inco
me
$27,6
59
$34,5
09
$36,2
46
Ave
rage
House
hold
Inco
me
$37,8
14
$46,3
64
$47,2
78
Pe
r Cap
ita
Inco
me
$14,0
76
$17,4
05
$17,8
69
2
00
0
2
00
9
2
01
4
Po
pu
lati
on
by A
ge
N
um
ber
Perc
ent
N
um
ber
Perc
ent
N
um
ber
Perc
ent
Age
0 -
4
6,6
69
8.4
%
6,3
43
8.4
%
6,1
61
8.4
%
Age
5 -
9
6,8
31
8.6
%
6,1
88
8.2
%
6,0
17
8.2
%
Age
10 -
14
6,1
47
7.7
%
5,5
82
7.4
%
5,5
74
7.6
%
Age
15 -
19
6,1
32
7.7
%
5,6
69
7.5
%
5,1
50
7.0
%
Age
20 -
24
5,6
84
7.1
%
5,2
67
7.0
%
5,4
26
7.4
%
Age
25 -
34
9,7
48
12.2
%
9,4
46
12.5
%
9,0
78
12.3
%
Age
35 -
44
10,9
78
13.8
%
8,6
83
11.5
%
8,3
43
11.3
%
Age
45 -
54
9,2
60
11.6
%
9,6
52
12.8
%
8,2
95
11.3
%
Age
55 -
64
7,1
11
8.9
%
7,9
50
10.5
%
8,6
69
11.8
%
Age
65 -
74
6,6
64
8.4
%
5,5
80
7.4
%
6,1
31
8.3
%
Age
75 -
84
3,5
29
4.4
%
3,7
67
5.0
%
3,4
33
4.7
%
Age
85+
974
1.2
%
1,2
84
1.7
%
1,3
96
1.9
%
2
00
0
2
00
9
2
01
4
Race
an
d E
thn
icit
y
N
um
ber
Perc
ent
N
um
ber
Perc
ent
N
um
ber
Perc
ent
W
hite
Alo
ne
21,9
77
27.6
%
17,7
69
23.6
%
16,2
58
22.1
%
Bla
ck A
lone
47,0
39
59.0
%
46,2
79
61.4
%
45,5
67
61.8
%
Am
eric
an I
ndia
n A
lone
297
0.4
%
263
0.3
%
253
0.3
%
Asi
an A
lone
156
0.2
%
153
0.2
%
158
0.2
%
Pa
cific
Isla
nder
Alo
ne
35
0.0
%
39
0.1
%
40
0.1
%
Som
e O
ther
Rac
e Alo
ne
8,6
62
10.9
%
9,5
15
12.6
%
10,0
47
13.6
%
Tw
o o
r M
ore
Rac
es
1,5
64
2.0
%
1,3
92
1.8
%
1,3
52
1.8
%
H
ispan
ic O
rigin
(Any
Rac
e)
19,4
93
24.4
%
20,4
24
27.1
%
21,0
79
28.6
%
Dat
a N
ote
: I
nco
me
is e
xpre
ssed
in c
urr
ent
dolla
rs.
Sourc
e:
ESRI
fore
cast
s fo
r 2009 a
nd 2
014;
U.S
. Bure
au o
f th
e Cen
sus,
2000 C
ensu
s of
Popula
tion a
nd H
ousi
ng
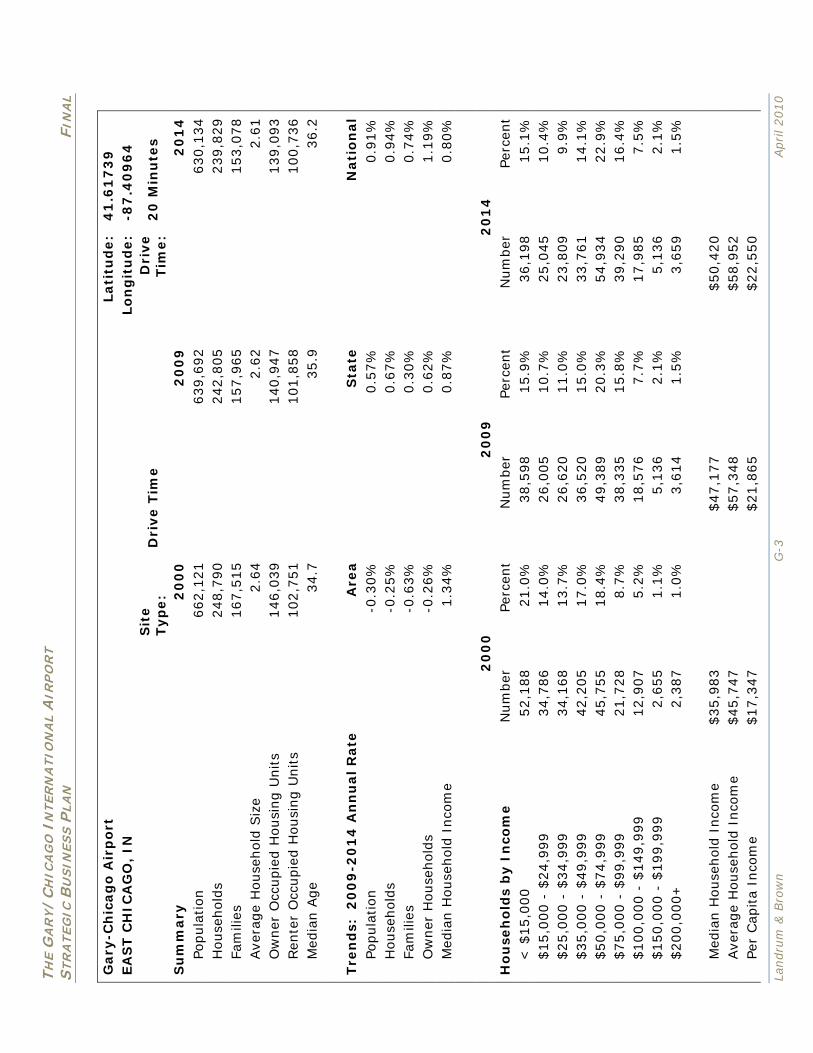
TH
E G
AR
Y/
CH
ICA
GO
IN
TER
NA
TIO
NA
L A
IRP
OR
T
STR
AT
EG
IC B
US
INES
S P
LA
N
FIN
AL
Landru
m &
Bro
wn
G-3
April 2010
Gary
-Ch
icag
o A
irp
ort
Lati
tud
e:
4
1.6
17
39
EA
ST C
HIC
AG
O,
IN
Lo
ng
itu
de:
-8
7.4
09
64
S
ite
Typ
e:
D
rive T
ime
D
rive
Tim
e:
2
0 M
inu
tes
Su
mm
ary
20
00
20
09
20
14
Popula
tion
662,1
21
639,6
92
630,1
34
H
ouse
hold
s
248,7
90
242,8
05
239,8
29
Fa
mili
es
167,5
15
157,9
65
153,0
78
Ave
rage
House
hold
Siz
e
2.6
4
2.6
2
2.6
1
O
wner
Occ
upie
d H
ousi
ng U
nits
146,0
39
140,9
47
139,0
93
Ren
ter
Occ
upie
d H
ousi
ng U
nits
102,7
51
101,8
58
100,7
36
M
edia
n A
ge
34.7
35.9
36.2
Tre
nd
s: 2
00
9-2
01
4 A
nn
ual R
ate
Are
a
S
tate
Nati
on
al
Po
pula
tion
-0
.30%
0.5
7%
0.9
1%
House
hold
s
-0.2
5%
0.6
7%
0.9
4%
Fam
ilies
-0.6
3%
0.3
0%
0.7
4%
Ow
ner
House
hold
s
-0.2
6%
0.6
2%
1.1
9%
Med
ian H
ouse
hold
Inco
me
1.3
4%
0.8
7%
0.8
0%
2
00
0
2
00
9
2
01
4
Ho
use
ho
lds
by I
nco
me
N
um
ber
Perc
ent
N
um
ber
Perc
ent
N
um
ber
Perc
ent
<
$15,0
00
52,1
88
21.0
%
38,5
98
15.9
%
36,1
98
15.1
%
$15,0
00 -
$24,9
99
34,7
86
14.0
%
26,0
05
10.7
%
25,0
45
10.4
%
$25,0
00 -
$34,9
99
34,1
68
13.7
%
26,6
20
11.0
%
23,8
09
9.9
%
$35,0
00 -
$49,9
99
42,2
05
17.0
%
36,5
20
15.0
%
33,7
61
14.1
%
$50,0
00 -
$74,9
99
45,7
55
18.4
%
49,3
89
20.3
%
54,9
34
22.9
%
$75,0
00 -
$99,9
99
21,7
28
8.7
%
38,3
35
15.8
%
39,2
90
16.4
%
$100,0
00 -
$149,9
99
12,9
07
5.2
%
18,5
76
7.7
%
17,9
85
7.5
%
$150,0
00 -
$199,9
99
2,6
55
1.1
%
5,1
36
2.1
%
5,1
36
2.1
%
$200,0
00+
2,3
87
1.0
%
3,6
14
1.5
%
3,6
59
1.5
%
M
edia
n H
ouse
hold
Inco
me
$35,9
83
$47,1
77
$50,4
20
Ave
rage
House
hold
Inco
me
$45,7
47
$57,3
48
$58,9
52
Pe
r Cap
ita
Inco
me
$17,3
47
$21,8
65
$22,5
50

TH
E G
AR
Y/
CH
ICA
GO
IN
TER
NA
TIO
NA
L A
IRP
OR
T
STR
AT
EG
IC B
US
INES
S P
LA
N
FIN
AL
Landru
m &
Bro
wn
G-4
April 2010
2
00
0
2
00
9
2
01
4
Po
pu
lati
on
by A
ge
N
um
ber
Perc
ent
N
um
ber
Perc
ent
N
um
ber
Perc
ent
Age
0 -
4
50,3
68
7.6
%
48,3
95
7.6
%
47,4
29
7.5
%
Age
5 -
9
54,4
26
8.2
%
48,3
06
7.6
%
47,2
63
7.5
%
Age
10 -
14
50,3
84
7.6
%
46,1
61
7.2
%
45,8
24
7.3
%
Age
15 -
19
47,9
91
7.2
%
46,7
40
7.3
%
42,2
56
6.7
%
Age
20 -
24
42,9
17
6.5
%
40,8
64
6.4
%
42,7
44
6.8
%
Age
25 -
34
87,1
42
13.2
%
81,8
63
12.8
%
80,0
79
12.7
%
Age
35 -
44
98,8
29
14.9
%
80,9
07
12.6
%
76,8
65
12.2
%
Age
45 -
54
84,0
10
12.7
%
89,1
57
13.9
%
78,7
31
12.5
%
Age
55 -
64
58,9
11
8.9
%
71,0
79
11.1
%
77,8
81
12.4
%
Age
65 -
74
47,7
62
7.2
%
44,8
36
7.0
%
51,3
24
8.1
%
Age
75 -
84
30,8
41
4.7
%
29,7
30
4.6
%
27,8
69
4.4
%
Age
85+
8,5
40
1.3
%
11,6
54
1.8
%
11,8
69
1.9
%
2
00
0
2
00
9
2
01
4
Race
an
d E
thn
icit
y
N
um
ber
Perc
ent
N
um
ber
Perc
ent
N
um
ber
Perc
ent
W
hite
Alo
ne
262,4
48
39.6
%
228,2
64
35.7
%
213,9
52
34.0
%
Bla
ck A
lone
337,2
68
50.9
%
336,0
86
52.5
%
332,7
64
52.8
%
Am
eric
an I
ndia
n A
lone
1,8
76
0.3
%
1,8
67
0.3
%
1,8
97
0.3
%
Asi
an A
lone
3,4
72
0.5
%
4,4
80
0.7
%
5,1
45
0.8
%
Pa
cific
Isla
nder
Alo
ne
270
0.0
%
301
0.0
%
317
0.1
%
Som
e O
ther
Rac
e Alo
ne
44,3
96
6.7
%
55,5
68
8.7
%
62,3
67
9.9
%
Tw
o o
r M
ore
Rac
es
12,3
91
1.9
%
13,1
26
2.1
%
13,6
92
2.2
%
H
ispan
ic O
rigin
(Any
Rac
e)
94,6
07
14.3
%
116,5
51
18.2
%
129,6
50
20.6
%
Dat
a N
ote
: I
nco
me
is e
xpre
ssed
in c
urr
ent
dolla
rs.
Sourc
e:
ESRI
fore
cast
s fo
r 2009 a
nd 2
014;
U.S
. Bure
au o
f th
e Cen
sus,
2000 C
ensu
s of
Popula
tion a
nd H
ousi
ng

THE GARY/CHICAGO INTERNATIONAL AIRPORT STRATEGIC BUSINESS PLAN FINAL
Landrum & Brown H-1 April 2010
APPENDIX H LABOR MARKET CHARACTERISTICS,
GARY METROPOLITAN DIVISION
Gary Total Nonfarm
Employment
Growth Rate
Cumulative Growth Rate
Gary Unemployment
State Unemployment
Year Dec Dec Dec 1999 284.8 3.9 2.8
2000 278.5 -2.2% -2.2% 3.2 2.8
2001 279 0.2% -2.0% 5.8 5.2
2002 275 -1.4% -3.4% 5.2 4.8
2003 271.2 -1.4% -4.8% 5.9 4.9
2004 276 1.8% -3.1% 5.5 5.2
2005 278.3 0.8% -2.3% 5.3 5.1
2006 281.2 1.0% -1.3% 4.7 4.5
2007 283.4 0.8% -0.5% 4.6 4.5
2008 278.3 -1.8% -2.3% 8.2 8.1
2009 273.3 -1.8% -4.0% 10.0(P) 9.8(P)

THE GARY/CHICAGO INTERNATIONAL AIRPORT STRATEGIC BUSINESS PLAN FINAL
Landrum & Brown H-2 April 2010
THIS PAGE INTENTIONALLY LEFT BLANK

TH
E G
AR
Y/C
HIC
AG
O I
NTER
NA
TIO
NA
L AIR
PO
RT
STR
AT
EG
IC B
US
INES
S P
LA
N
FIN
AL
Landru
m &
Bro
wn
I-1
April 2
010
AP
PEN
DIX
I EM
PLO
YM
EN
T P
RO
FIL
E, G
AR
Y M
ETR
OP
OLIT
AN
DIV
ISIO
N
Area: G
ary, IN M
etropolitan
Divisio
n
Period: M
ay 2008
Occu
patio
n (S
OC co
de)
Em
plo
ymen
t(1) E
mplo
ymen
t percen
t relative stan
dard
erro
r(3)
Hourly
mean
w
age
Annual
mean
w
age(2
)
Wag
e percen
t relative stan
dard
erro
r(3)
Hourly
10th
percen
tile w
age
Hourly
25th
percen
tile w
age
Hourly
med
ian
wag
e
Hourly
75th
percen
tile w
age
Hourly
90th
percen
tile w
age
Annual
10th
percen
tile w
age(2
)
Annual
25th
percen
tile w
age(2
)
Annual
med
ian
wag
e(2)
Annual
75th
percen
tile w
age(2
)
Annual
90th
percen
tile w
age(2
)
Total, all O
ccupatio
ns(0
00000)
276250
1.6
18.5
3
38530
1.4
7.3
7
9.6
6
14.8
23.6
5
33.1
15330
20100
30790
49190
68850
Man
agem
ent O
ccupatio
ns(1
10000)
8510
3.5
43.7
6
91030
1.9
19.2
2
26.8
3
37.7
3
50.7
2
(5)-
39980
55810
78470
105500
(5)-
Chief E
xecutives(1
11011)
390
8.2
67.8
7
141170
4.8
25.6
6
44.5
3
59.2
(5
)- (5
)- 53370
92620
123140
(5)-
(5)-
Gen
eral and O
peratio
ns M
anag
ers(111021)
2010
5.2
51.3
9
106900
3.5
22.6
9
30.0
9
41.1
2
64.5
6
(5)-
47200
62600
85520
134280
(5)-
Legislato
rs(111031)
200
10.8
(4
)- 101480
11.5
(4
)- (4
)- (4
)- (4
)- (4
)- 21870
26670
61730
(5)-
(5)-
Advertisin
g an
d Pro
motio
ns M
anag
ers(112011)
30
38.3
(8
)- (8
)- (8
)- (8
)- (8
)- (8
)- (8
)- (8
)- (8
)- (8
)- (8
)- (8
)- (8
)-
Marketin
g M
anag
ers(112021)
130
20.2
43.8
2
91150
6.4
18.7
3
28.5
41.2
1
53.0
9
69.0
6
38960
59270
85720
110430
143650
Sales M
anag
ers(112022)
430
9.1
49.5
5
103070
7
19.6
1
30.2
1
41.4
5
59.2
4
(5)-
40780
62840
86210
123220
(5)-
Public R
elations M
anag
ers(112031)
40
11.6
37.2
5
77480
17.5
18.8
22.4
6
30.2
39.4
52.4
3
39100
46710
62820
81950
109060
Adm
inistrative S
ervices Man
agers(1
13011)
280
11.2
33.9
7
70650
3.8
20.8
9
23.6
2
30.9
6
43.4
8
50.1
43460
49130
64400
90440
104220
Com
puter an
d In
form
ation S
ystems M
anag
ers(113021)
150
11.6
44.8
5
93280
6.1
27.9
4
34.6
7
42.5
5
50.7
9
66.1
9
58120
72110
88500
105650
137670
Finan
cial Man
agers(1
13031)
450
7
46.2
8
96270
3.6
23.7
6
32.1
8
40.7
7
54.0
8
77.4
2
49410
66940
84800
112480
161030
Com
pen
sation an
d B
enefits M
anag
ers(113041)
60
17
36.8
9
76730
7.9
18.1
23.0
8
33.8
4
46.7
4
64.9
3
37640
48000
70380
97210
135060
Train
ing an
d D
evelopm
ent M
anag
ers(113042)
40
20
43.0
8
89610
7.2
22.5
9
26.8
3
37.9
8
59.3
2
76.5
3
46980
55800
79000
123390
159180
Hum
an R
esources M
anag
ers All O
ther(1
13049)
100
8.7
48.2
7
100390
11.3
24.3
9
32.3
8
39.2
7
51.0
4
(5)-
50740
67350
81690
106170
(5)-
Industrial Pro
ductio
n M
anag
ers(113051)
400
7.2
49.6
103180
4.5
26.0
8
34.2
1
45.4
3
59.6
8
79.6
4
54250
71150
94490
124140
165650
Purch
asing M
anag
ers(113061)
70
11.3
36.4
4
75790
4.8
18.7
9
26.8
7
34.0
3
43.5
5
56.9
5
39090
55880
70790
90580
118450
Tran
sportatio
n S
torag
e and D
istributio
n M
anag
ers(113071)
230
8.8
45.7
6
95190
6
24.2
6
31.6
8
42.0
9
53.7
3
72.0
6
50460
65900
87540
111750
149880
Constru
ction M
anag
ers(119021)
620
22.7
40.3
83820
4.3
26.6
5
30.4
8
39.6
2
47.4
7
52.5
3
55430
63410
82410
98740
109260
Educatio
n A
dm
inistrato
rs Preschool an
d C
hild
Care C
enter/Pro
gram
(119031)
70
21.5
23.0
7
47990
18.1
11.5
8
13.4
7
17.1
2
28.2
2
41.0
5
24100
28030
35610
58700
85390
Educatio
n A
dm
inistrato
rs Elem
entary an
d S
econdary S
chool(1
19032)
430
7.9
(4
)- 77770
1.5
(4
)- (4
)- (4
)- (4
)- (4
)- 56430
69930
78460
89470
102300
Educatio
n A
dm
inistrato
rs Postseco
ndary(1
19033)
170
10.3
37.0
8
77120
5.5
21.8
26.1
8
34.6
7
46.8
7
57.9
5
45330
54460
72120
97480
120530
Educatio
n A
dm
inistrato
rs All O
ther(1
19039)
100
10.2
34.9
3
72650
11
19.0
8
24.5
7
31.4
5
39.6
5
51.1
6
39680
51110
65420
82470
106400
Engin
eering M
anag
ers(119041)
200
12.4
55.3
1
115040
6.4
38.1
6
43.0
2
48.3
7
59.9
2
(5)-
79370
89490
100610
124640
(5)-
Food S
ervice Man
agers(1
19051)
440
17.2
24.2
6
50460
10.3
14.3
8
16.5
3
19.6
5
28.7
8
44.6
7
29920
34380
40880
59860
92910
Med
ical and H
ealth S
ervices Man
agers(1
19111)
630
15.5
40.7
4
84740
6.5
21.4
2
26.7
7
32.9
1
42.6
6
(5)-
44550
55670
68460
88740
(5)-
Natu
ral Scien
ces Man
agers(1
19121)
50
41.9
31.0
9
64670
22.8
20.7
21.8
3
23.7
2
25.8
9
51.0
9
43050
45400
49330
53860
106260
Postm
asters and M
ail Superin
tenden
ts(119131)
40
0
30.2
5
62930
1.8
19.8
6
24.7
31.7
7
36.5
4
40.0
4
41310
51380
66090
76010
83280
Property R
eal Estate an
d C
om
munity A
ssociatio
n M
anag
ers(119141)
90
22.3
25.7
3
53530
4.8
15.3
9
20
23.4
27.9
6
44.4
7
32020
41590
48670
58160
92490
Social an
d C
om
munity S
ervice Man
agers(1
19151)
230
16.8
27.2
2
56620
6.6
16.3
4
19.0
1
22.9
31.7
6
49.1
7
33980
39540
47640
66050
102270
Man
agers A
ll Oth
er(119199)
290
7.3
30.1
2
62650
3.5
17.2
6
21.7
3
28.5
4
35.4
8
47.4
6
35900
45200
59370
73800
98710
Busin
ess and Fin
ancial O
peratio
ns O
ccupatio
ns(1
30000)
6190
5.5
27.6
6
57530
2.9
12.7
4
17.6
5
24.5
3
34.7
6
48.4
5
26490
36710
51020
72300
100780
Wholesale an
d R
etail Buyers E
xcept Farm
Products(1
31022)
180
32.1
20.0
4
41670
4.4
12.1
14.1
7
18.2
5
23.7
3
30.2
5
25180
29480
37970
49350
62930

TH
E G
AR
Y/
CH
ICA
GO
IN
TER
NA
TIO
NA
L A
IRP
OR
T
STR
AT
EG
IC B
US
INES
S P
LA
N
FIN
AL
Landru
m &
Bro
wn
I-2
April 2010
Purc
has
ing A
gen
ts E
xcep
t W
hole
sale
Ret
ail an
d F
arm
Pro
duct
s(131023)
350
11.2
27.9
5
58140
3.6
15.6
1
19.7
1
26.9
6
32.5
4
44.6
32460
41000
56080
67680
92760
Cla
ims
Adju
ster
s Exa
min
ers
and I
nve
stig
ators
(131031)
100
13.5
34.4
71550
2.9
23.7
6
31.0
2
35.4
5
39.4
9
45.3
1
49420
64520
73730
82140
94240
Com
plia
nce
Off
icer
s Exc
ept
Agricu
lture
Const
ruct
ion H
ealth a
nd S
afet
y an
d
Tra
nsp
ort
atio
n(1
31041)
190
12
24.6
6
51290
3.3
12.3
16.5
4
22.6
8
31.7
42.1
8
25590
34410
47180
65930
87720
Cost
Est
imat
ors
(131051)
510
11.1
31.4
3
65380
4
16.9
3
22.6
7
29.7
4
39.8
2
48.3
35210
47140
61850
82830
100460
Em
plo
ymen
t Rec
ruitm
ent
and P
lace
men
t Spec
ialis
ts(1
31071)
260
11.1
19.1
6
39850
4.1
11.6
4
13.6
16.2
4
23.2
8
32.2
3
24200
28290
33780
48420
67040
Com
pen
sation B
enef
its
and J
ob A
nal
ysis
Spec
ialis
ts(1
31072)
250
32.1
33.6
8
70050
9.4
17.1
6
21.0
3
28.6
6
49.1
5
56.4
7
35690
43740
59610
102240
117450
Tra
inin
g a
nd D
evel
opm
ent
Spec
ialis
ts(1
31073)
510
16.5
22.4
8
46770
6.7
9.3
3
14.1
5
20.2
3
30.6
1
38.6
19400
29440
42070
63670
80280
Hum
an R
esourc
es T
rain
ing a
nd L
abor
Rel
atio
ns
Spec
ialis
ts A
ll O
ther
(131079)
(8)-
(8
)-
19.7
8
41140
15.2
6.5
6
7.4
4
18.0
6
26.4
9
37.7
2
13650
15470
37570
55100
78460
Logis
tici
ans(
131081)
50
37
26.1
5
54400
7.3
13.4
14.8
4
20.9
6
37.1
2
47.8
2
27880
30880
43600
77220
99480
Man
agem
ent
Anal
ysts
(131111)
270
24.2
36.6
3
76190
14.2
17.9
6
21.3
6
30.7
2
55.5
62.5
5
37360
44420
63900
115430
130100
Busi
nes
s O
per
atio
ns
Spec
ialis
ts A
ll O
ther
(131199)
620
14.8
25.7
5
53550
15.8
6.6
1
7.5
5
23.9
36.0
6
54.9
2
13750
15700
49710
75000
114240
Acc
ounta
nts
and A
uditors
(132011)
1330
15
27.7
3
57690
2.7
17.5
21.1
5
25.6
9
32.1
6
40.7
5
36400
43990
53430
66890
84750
Appra
iser
s an
d A
sses
sors
of
Rea
l Est
ate(
132021)
250
35.4
18.1
7
37800
5.7
11.1
5
13.8
5
17.2
4
20.1
2
28.5
9
23180
28810
35860
41840
59460
Budget
Anal
ysts
(132031)
30
11.7
31.4
8
65490
4.5
18.8
2
26.1
8
31.4
3
38.7
2
45.3
39140
54460
65370
80550
94220
Cre
dit A
nal
ysts
(132041)
80
22
35.2
8
73380
9.5
14.0
9
16.6
8
37.4
3
53.5
1
60.1
9
29300
34680
77850
111300
125200
Finan
cial
Anal
ysts
(132051)
70
17.2
29.3
4
61040
4.7
15.2
6
20.1
1
28.4
7
37.5
2
46.2
3
31730
41820
59210
78040
96160
Pers
onal
Fin
anci
al A
dvi
sors
(132052)
160
29.1
42.2
7
87920
24.2
9.3
9
16.1
2
24.9
8
63.8
7
(5)-
19530
33540
51960
132840
(5)-
Loan
Counse
lors
(132071)
(8)-
(8
)-
32.8
4
68300
17.6
16.5
3
18.3
41.0
5
45.9
6
48.9
1
34370
38070
85390
95600
101720
Loan
Offic
ers(
132072)
440
18.5
33.6
7
70030
10.5
15.9
3
18.8
1
28.5
8
41.0
8
60.2
4
33120
39130
59440
85460
125290
Tax
Pre
par
ers(
132082)
70
30.4
13.0
8
27200
11.1
8.0
5
8.8
7
11.0
4
15.2
2
24
16730
18450
22960
31650
49930
Finan
cial
Spec
ialis
ts A
ll O
ther
(132099)
80
23
24.4
2
50790
2.4
17.1
2
20.2
8
25.7
5
28.7
5
30.5
3
35600
42180
53560
59800
63490
Com
pute
r an
d M
athem
atic
al O
ccupat
ions(
150000)
1900
7.8
27.7
5
57730
4.4
12.4
4
17.6
1
25.6
4
35.1
7
44.5
9
25870
36620
53320
73160
92740
Com
pute
r Pr
ogra
mm
ers(
151021)
80
26
25.5
4
53120
6.5
14.1
1
17.0
4
23.4
2
31.7
8
38.4
5
29350
35450
48710
66090
79990
Com
pute
r Soft
war
e Engin
eers
Applic
atio
ns(
151031)
240
13.9
35.6
5
74140
10.1
23.9
7
27.6
31.6
45.1
9
56.7
7
49870
57400
65720
94000
118090
Com
pute
r Soft
war
e Engin
eers
Sys
tem
s Soft
war
e(151032)
40
40.3
38.6
80290
9.3
21.2
24.3
8
35.0
5
40.5
8
57.4
6
44090
50700
72900
84420
119520
Com
pute
r Support
Spec
ialis
ts(1
51041)
680
10.3
18.9
9
39500
3.6
9.6
7
12.3
8
17.2
7
24.0
7
33.0
8
20120
25740
35930
50070
68810
Com
pute
r Sys
tem
s Anal
ysts
(151051)
270
14.6
32.3
7
67330
4.7
18.9
3
25.2
5
33.3
8
39.8
9
46.3
6
39370
52510
69420
82970
96430
Dat
abas
e Adm
inis
trat
ors
(151061)
50
17
29.4
5
61250
4.8
17.8
6
22.0
7
28.2
5
36.8
9
42.8
2
37150
45900
58760
76720
89070
Net
work
and C
om
pute
r Sys
tem
s Adm
inis
trat
ors
(151071)
360
8.7
27.4
57000
2.6
15.7
7
19.3
6
25.2
4
33.9
1
39.1
5
32810
40270
52500
70540
81430
Net
work
Sys
tem
s an
d D
ata
Com
munic
atio
ns
Anal
ysts
(151081)
70
17.1
27.7
3
57690
4
18.0
7
21.1
9
25.5
2
33.2
7
37.9
9
37580
44080
53080
69200
79020
Com
pute
r Spec
ialis
ts A
ll O
ther
(151099)
40
33.9
33.0
2
68680
9.3
9.0
5
25.5
2
39.4
6
45.0
9
48.5
18820
53090
82080
93780
100890
Arc
hitec
ture
and E
ngin
eeri
ng O
ccupat
ions(
170000)
3340
8.3
32.5
5
67700
2.6
18.4
9
25.2
3
31.3
9
39.0
3
47.4
2
38470
52470
65280
81180
98640
Arc
hitec
ts E
xcep
t La
ndsc
ape
and N
aval
(171011)
80
25.1
34.2
7
71280
15.6
13.7
4
20.6
1
28.6
6
44.7
1
71.6
2
28590
42870
59610
92990
148970
Surv
eyors
(171022)
80
38.6
29.3
8
61110
4.3
18.6
5
23.8
7
30.8
5
36.0
5
39.1
6
38800
49640
64170
74980
81450
Chem
ical
Engin
eers
(172041)
50
11.5
41.9
7
87300
2.8
33.4
3
36.9
3
42.0
5
48.1
53.9
1
69540
76820
87460
100040
112130
Civ
il Engin
eers
(172051)
210
23.8
34.2
7
71280
3.9
22.0
1
27.0
3
35.3
40.5
8
47.2
5
45770
56230
73430
84400
98280
Ele
ctri
cal Engin
eers
(172071)
330
29.6
36.9
9
76940
2.4
28.5
4
32.7
3
36.9
9
41.5
9
47.4
4
59370
68070
76950
86510
98670
Ele
ctro
nic
s Engin
eers
Exc
ept
Com
pute
r(172072)
(8)-
(8
)-
27.6
57410
13.6
21.8
6
23.0
4
25
34.3
39.9
8
45480
47920
52000
71340
83150
Envi
ronm
enta
l Engin
eers
(172081)
100
43.5
44.3
9
92330
16.2
25.2
27.2
9
30.8
8
46.0
3
(5)-
52410
56770
64240
95750
(5)-
H
ealth a
nd S
afet
y Engin
eers
Exc
ept
Min
ing S
afet
y Engin
eers
and
Insp
ecto
rs(1
72111)
60
17.2
39.8
82790
9.3
25.2
6
29.6
40.9
2
48.5
7
59.1
4
52550
61570
85120
101030
123000
Indust
rial
Engin
eers
(172112)
490
13.9
37.0
4
77040
2.6
26.8
4
30.9
5
36.0
5
41.3
49.6
2
55830
64370
74980
85900
103210
Mat
eria
ls E
ngin
eers
(172131)
130
26
33.0
5
68740
2.8
26.0
2
27.6
6
30.3
8
37.2
45.7
54130
57540
63190
77370
95050

TH
E G
AR
Y/C
HIC
AG
O I
NTER
NA
TIO
NA
L AIR
PO
RT
STR
AT
EG
IC B
US
INES
S P
LA
N
FIN
AL
Landru
m &
Bro
wn
I-3
April 2
010
Mech
anical E
ngin
eers(172141)
520
18.5
37.9
2
78870
3.6
23.9
3
30.6
3
36.7
9
45.0
7
54.6
7
49770
63700
76530
93740
113710
Engin
eers All O
ther(1
72199)
110
46.1
25.8
8
53840
3.5
16.1
7
17.5
3
21.0
1
34.1
4
43.8
2
33630
36470
43710
71020
91150
Arch
itectural an
d C
ivil Drafters(1
73011)
190
39.2
22.3
46380
5.3
12.9
6
14.8
3
18.7
3
29.6
36.6
6
26960
30840
38970
61570
76240
Electrical an
d E
lectronics D
rafters(173012)
40
36.8
25.7
8
53620
8.5
17.6
7
21.1
2
24.7
8
30.3
2
37.2
9
36760
43940
51530
63070
77570
Mech
anical D
rafters(173013)
150
12.7
26.8
1
55760
2.9
17.1
20.9
7
26.8
5
31.7
5
37.7
1
35560
43610
55840
66040
78430
Drafters A
ll Oth
er(173019)
40
28.6
26.6
1
55350
10.6
14.2
5
19.8
6
24.3
8
33.2
5
43.7
4
29650
41310
50720
69160
90970
Civil E
ngin
eering T
echnician
s(173022)
40
41.9
29.2
3
60790
6.4
17.0
3
19.5
2
25.0
4
39.3
2
43.3
9
35430
40610
52080
81780
90250
Electrical an
d E
lectronic E
ngin
eering T
echnician
s(173023)
180
29.6
28
58240
3.1
23.7
3
25.9
8
28.0
5
30.1
1
31.4
49370
54040
58350
62620
65310
Enviro
nm
ental E
ngin
eering T
echnician
s(173025)
30
37.1
21.7
7
45280
7.9
15.6
9
17.0
5
19.4
2
25.3
9
32.2
1
32640
35470
40390
52800
66990
Industrial E
ngin
eering T
echnician
s(173026)
(8)-
(8)-
28.5
1
59300
3.1
20.0
3
23.1
6
28.2
33.6
5
38.2
9
41670
48160
58670
69990
79650
Mech
anical E
ngin
eering T
echnician
s(173027)
140
32.3
24.9
51800
4.5
18.2
4
21.3
7
24.2
2
28.6
3
32.3
5
37950
44450
50370
59540
67280
Engin
eering T
echnician
s Excep
t Drafters A
ll Oth
er(173029)
60
37.9
26.1
1
54310
5.8
18.2
5
25.1
7
27.5
1
29.7
6
31.1
1
37970
52340
57220
61890
64710
Surveyin
g an
d M
appin
g T
echnician
s(173031)
70
34.2
18.8
6
39230
9.2
11.4
7
14.3
3
17.9
2
22.3
7
29.0
6
23850
29810
37270
46530
60450
Life Physical an
d S
ocial S
cience O
ccupatio
ns(1
90000)
1240
10.6
26.5
6
55250
3.2
14.1
5
17.7
5
23.6
2
33.8
42.1
2
29440
36930
49120
70310
87620
Micro
bio
logists(1
91022)
30
32.9
19.5
7
40710
8
13.3
14.6
9
17.5
4
22.0
8
33.2
6
27660
30560
36490
45920
69180
Chem
ists(192031)
180
14.7
32.1
2
66810
5.8
17.8
6
21.7
5
28.2
8
39.8
9
49.1
9
37150
45250
58820
82970
102310
Enviro
nm
ental S
cientists an
d S
pecialists In
cludin
g H
ealth(1
92041)
(8)-
(8)-
30.5
4
63510
14.1
15.3
17.8
1
24.0
9
39.8
1
60.1
8
31830
37030
50110
82810
125180
Market R
esearch
Analysts(1
93021)
120
20.6
25.3
4
52710
4.5
16.6
6
19.3
6
23.4
2
29.8
39.7
5
34660
40270
48710
61990
82680
Clin
ical Counselin
g an
d S
chool Psych
olo
gists(1
93031)
80
8.5
29.0
6
60440
2.7
18.1
1
21.1
5
28.5
6
35.1
2
42.6
7
37670
44000
59400
73050
88750
Urb
an an
d R
egio
nal Plan
ners(1
93051)
120
26.4
23.9
9
49900
3.6
16.7
3
18.5
4
22.2
5
26.6
5
34.8
7
34800
38550
46290
55440
72520
Bio
logical T
echnician
s(194021)
80
9.1
16.7
8
34900
5.6
11.7
1
13.4
15.4
6
18.6
5
23.2
1
24350
27860
32150
38800
48290
Chem
ical Tech
nician
s(194031)
180
11.1
27.2
2
56610
7.2
13.1
1
19.8
2
30
35.2
3
38.1
1
27260
41220
62410
73290
79260
Enviro
nm
ental S
cience an
d Pro
tection T
echnician
s Inclu
din
g H
ealth(1
94091)
40
44.8
15.6
8
32620
7.1
11.2
13.2
15.1
1
18.1
8
21.6
5
23290
27450
31430
37810
45020
Com
munity an
d S
ocial S
ervices Occu
patio
ns(2
10000)
2940
6
18.5
38480
2.9
10.1
8
13.1
8
17.2
7
22.6
9
29.9
1
21170
27420
35920
47190
62210
Substan
ce Abuse an
d B
ehavio
ral Diso
rder C
ounselo
rs(211011)
80
32
15.8
9
33040
11.2
10.1
8
13.6
2
16.5
9
18.7
20.0
2
21170
28320
34500
38890
41640
Educatio
nal V
ocatio
nal an
d S
chool C
ounselo
rs(211012)
340
12.2
23.9
5
49810
2.4
16.1
8
18.3
6
23.2
8
29.6
7
33.3
2
33650
38180
48430
61710
69310
Marriag
e and Fam
ily Therap
ists(211013)
(8)-
(8)-
25.9
5
53980
10.4
17.1
2
18.2
9
20.4
1
36.9
5
40.5
7
35610
38040
42450
76850
84380
Men
tal Health
Counselo
rs(211014)
(8)-
(8)-
18.9
1
39330
7.3
13.4
7
14.8
7
17.7
7
22.8
7
26.2
7
28020
30920
36970
47560
54630
Reh
abilitation
Counselo
rs(211015)
40
25.3
20.0
2
41640
11.5
9.7
2
13.5
9
18.5
4
27.7
8
31.2
7
20220
28270
38570
57780
65040
Child
Family an
d S
chool S
ocial W
orkers(2
11021)
550
15.8
16.9
3
35220
4.9
10.5
3
12.5
2
16.5
3
19.5
8
24.5
5
21910
26040
34380
40720
51060
Med
ical and Pu
blic H
ealth S
ocial W
orkers(2
11022)
240
37.2
25.6
1
53280
3.2
16.8
1
21.0
4
25.6
29.0
6
31.2
4
34960
43760
53250
60440
64980
Men
tal Health
and S
ubstan
ce Abuse S
ocial W
orkers(2
11023)
320
20.3
15.9
1
33090
2.5
12.4
6
13.4
3
14.9
2
17.7
1
21.5
9
25920
27930
31040
36830
44910
Social W
orkers A
ll Oth
er(211029)
200
41.5
18.5
6
38600
13
11.2
1
13.2
7
15.5
7
21.0
6
31.8
6
23310
27610
32380
43800
66280
Health
Educato
rs(211091)
120
22.4
27.4
8
57160
3.8
14.9
3
19.5
2
29.2
9
35.8
1
38.7
7
31050
40600
60930
74480
80650
Probatio
n O
fficers and C
orrectio
nal T
reatmen
t Specialists(2
11092)
290
14.8
19.1
2
39760
1.4
13.7
2
16.2
6
18.6
8
22.0
8
25.1
4
28540
33810
38850
45920
52280
Social an
d H
um
an S
ervice Assistan
ts(211093)
320
22
13.1
6
27370
6.9
8.2
9.5
5
12.3
16.4
9
19.2
8
17050
19870
25580
34300
40110
Com
munity an
d S
ocial S
ervice Specialists A
ll Oth
er(211099)
60
28.3
18.4
3
38330
13.7
9.8
3
11.4
3
15.1
5
24.7
7
32.2
2
20450
23770
31510
51520
67010
Clerg
y(212011)
140
24.1
11.6
1
24150
6.4
6.4
1
7.0
8
8.4
4
14.6
9
21.5
2
13320
14730
17550
30550
44760
Directo
rs Relig
ious A
ctivities and E
duca
tion(2
12021)
80
27.8
13.9
4
29000
9.1
10.3
5
11.4
2
13.5
4
17.2
9
19.2
1
21530
23760
28170
35970
39950
Relig
ious W
orkers A
ll Oth
er(212099)
50
19.3
13.9
5
29010
11.2
6.8
1
10.4
9
12.6
1
17.9
9
19.9
3
14160
21810
26220
37420
41460
Legal O
ccupatio
ns(2
30000)
1640
6
35.2
6
73350
9.5
13.1
3
16.0
6
22.3
8
41.7
1
(5)-
27300
33410
46550
86760
(5)-
Lawyers(2
31011)
880
9.1
49.0
2
101960
11.3
17.8
9
22.6
2
36.0
9
69.3
8
(5)-
37200
47040
75080
144310
(5)-
Judges M
agistrate Ju
dges an
d M
agistra
tes(231023)
80
11.5
42.5
6
88530
5
20.1
2
24.8
2
46.7
1
57.4
9
62.7
1
41860
51620
97160
119590
130440

TH
E G
AR
Y/
CH
ICA
GO
IN
TER
NA
TIO
NA
L A
IRP
OR
T
STR
AT
EG
IC B
US
INES
S P
LA
N
FIN
AL
Landru
m &
Bro
wn
I-4
April 2010
Para
legal
s an
d L
egal
Ass
ista
nts
(232011)
350
16.8
16.8
9
35130
3.9
12.7
5
13.9
15.7
3
18.7
6
24.3
6
26520
28910
32710
39010
50670
Court
Rep
ort
ers(
232091)
90
17.2
17.1
3
35640
3.2
13.6
5
15.7
1
17.1
3
18.7
6
19.8
3
28400
32680
35640
39020
41240
Law
Cle
rks(
232092)
40
18.4
15.9
5
33180
2.7
10.5
7
13.2
2
15.4
3
18.2
4
22.7
8
21980
27490
32100
37930
47380
Title
Exa
min
ers
Abst
ract
ors
and S
earc
her
s(232093)
50
28.7
13.3
6
27790
5.3
9.8
5
11.1
4
12.8
15.7
3
18.1
20490
23170
26630
32720
37660
Educa
tion T
rain
ing a
nd L
ibra
ry O
ccupations(
250000)
17270
3.9
18.9
3
39380
2
8.6
7
10.6
6
17.8
26.2
4
31.4
9
18030
22160
37010
54570
65490
Busi
nes
s Tea
cher
s Po
stse
condar
y(251011)
160
34
(4)-
72430
3.1
(4
)-
(4)-
(4
)-
(4)-
(4
)-
38790
52370
70100
92250
111240
Com
pute
r Sci
ence
Tea
cher
s Po
stse
condar
y(251021)
50
0
(4)-
66990
2.1
(4
)-
(4)-
(4
)-
(4)-
(4
)-
49040
57320
66690
77260
84620
Mat
hem
atic
al S
cien
ce T
each
ers
Post
seco
ndar
y(251022)
50
0
(4)-
58680
2.4
(4
)-
(4)-
(4
)-
(4)-
(4
)-
36990
46320
57040
67730
86590
Bio
logic
al S
cien
ce T
each
ers
Post
seco
ndar
y(251042)
50
0
(4)-
59530
1.9
(4
)-
(4)-
(4
)-
(4)-
(4
)-
38810
46860
56440
66710
88970
Chem
istr
y Tea
cher
s Po
stse
condar
y(251052)
40
0
(4)-
57830
2.6
(4
)-
(4)-
(4
)-
(4)-
(4
)-
26750
39530
54400
72170
98240
Nurs
ing I
nst
ruct
ors
and T
each
ers
Post
seco
ndar
y(251072)
80
5.5
(8
)-
(8)-
(8
)-
(8)-
(8
)-
(8)-
(8
)-
(8)-
(8
)-
(8)-
(8
)-
(8)-
(8
)-
Art
Dra
ma
and M
usi
c Tea
cher
s Po
stse
condar
y(251121)
(8)-
(8
)-
(4)-
54260
3.1
(4
)-
(4)-
(4
)-
(4)-
(4
)-
33920
41640
49950
64110
87170
Englis
h L
anguag
e an
d L
iter
ature
Tea
cher
s Po
stse
condar
y(251123)
(8)-
(8
)-
(4)-
50900
5.4
(4
)-
(4)-
(4
)-
(4)-
(4
)-
30010
38410
48580
59700
79060
Fore
ign L
anguag
e an
d L
iter
ature
Tea
cher
s Po
stse
condar
y(251124)
50
0
(4)-
57020
5.8
(4
)-
(4)-
(4
)-
(4)-
(4
)-
31410
42800
53300
67010
89610
Philo
sophy
and R
elig
ion T
each
ers
Post
seco
ndar
y(251126)
(8)-
(8
)-
(4)-
54230
4.1
(4
)-
(4)-
(4
)-
(4)-
(4
)-
25400
39850
55140
65780
79570
Voca
tional
Educa
tion T
each
ers
Post
seco
ndar
y(251194)
440
5.7
24.7
3
51440
13.6
13.1
5
17.0
4
23.3
2
34.3
1
38.5
1
27360
35440
48510
71370
80110
Post
seco
ndar
y Tea
cher
s All
Oth
er(2
51199)
80
21.7
(4
)-
58430
3.7
(4
)-
(4)-
(4
)-
(4)-
(4
)-
34040
43090
51060
71250
104610
Pres
chool Tea
cher
s Exc
ept
Spec
ial Educa
tion(2
52011)
1150
12.5
15.5
4
32310
14.6
8.2
6
9.7
2
11.9
7
20.5
2
28.9
8
17180
20220
24900
42680
60270
Kin
der
gar
ten T
each
ers
Exc
ept
Spec
ial Educa
tion(2
52012)
170
18.4
(4
)-
45310
2.7
(4
)-
(4)-
(4
)-
(4)-
(4
)-
28900
36740
44100
55090
63470
Ele
men
tary
Sch
ool Tea
cher
s Exc
ept
Spec
ial Educa
tion(2
52021)
3240
10.4
(4
)-
47590
2.1
(4
)-
(4)-
(4
)-
(4)-
(4
)-
32650
37020
46340
59130
65330
Mid
dle
Sch
ool Tea
cher
s Exc
ept
Spec
ial an
d V
oca
tional
Educa
tion(2
52022)
1220
16.5
(4
)-
50400
1.4
(4
)-
(4)-
(4
)-
(4)-
(4
)-
34200
39270
50260
61670
68270
Voca
tional
Educa
tion T
each
ers
Mid
dle
Sch
ool(
252023)
50
19.8
(4
)-
45370
5
(4)-
(4
)-
(4)-
(4
)-
(4)-
33610
37000
43110
52810
63890
Sec
ondar
y Sch
ool Tea
cher
s Exc
ept
Spec
ial an
d V
oca
tional
Educa
tion(2
52031)
2020
11
(4)-
47780
2.5
(4
)-
(4)-
(4
)-
(4)-
(4
)-
28840
36940
47570
60390
67100
Voca
tional
Educa
tion T
each
ers
Sec
ondary
Sch
ool(
252032)
170
29
(4)-
57160
2.7
(4
)-
(4)-
(4
)-
(4)-
(4
)-
35720
44190
57770
67520
81260
Spec
ial Educa
tion T
each
ers
Pres
chool Kin
der
gar
ten a
nd E
lem
enta
ry
Sch
ool(
252041)
600
11.3
(4
)-
50720
2.2
(4
)-
(4)-
(4
)-
(4)-
(4
)-
34900
40360
52050
61860
67290
Spec
ial Educa
tion T
each
ers
Mid
dle
Sch
ool(
252042)
170
7
(4)-
49620
2.1
(4
)-
(4)-
(4
)-
(4)-
(4
)-
34750
39280
50050
60680
66230
Spec
ial Educa
tion T
each
ers
Sec
ondar
y Sch
ool(
252043)
260
21.2
(4
)-
48940
2
(4)-
(4
)-
(4)-
(4
)-
(4)-
34580
39860
48600
59360
66020
Adult L
iter
acy
Rem
edia
l Educa
tion a
nd G
ED
Tea
cher
s an
d I
nst
ruct
ors
(253011)
100
22
17.8
7
37180
8
10.6
5
11.9
6
17.1
24.1
7
28.3
3
22160
24870
35570
50270
58930
Sel
f-Enri
chm
ent
Educa
tion T
each
ers(
253021)
360
29.5
21.5
5
44830
6.8
15.5
2
17.0
2
18.9
25.8
33.1
9
32280
35400
39320
53670
69030
Tea
cher
s an
d I
nst
ruct
ors
All
Oth
er(2
53099)
1800
9.2
(4
)-
23310
1.9
(4
)-
(4)-
(4
)-
(4)-
(4
)-
18170
20850
23130
25140
26850
Libra
rian
s(254021)
240
7.9
23.3
7
48620
2
12.1
6
18.3
6
23.7
8
29.4
7
32.6
5
25290
38190
49460
61300
67920
Libra
ry T
echnic
ians(
254031)
360
34.6
10.2
4
21310
4.6
6.7
9
8.0
9
9.5
12.0
4
14.9
7
14130
16820
19770
25040
31150
Audio
-Vis
ual
Colle
ctio
ns
Spec
ialis
ts(2
59011)
30
32.2
13.6
4
28370
25.8
6.3
1
6.8
5
7.7
5
19.0
7
30.9
9
13130
14250
16120
39670
64450
Inst
ruct
ional
Coord
inat
ors
(259031)
140
12.6
30.6
6
63770
6.4
19.4
5
21.9
3
28.7
1
36.8
48.8
8
40460
45620
59710
76550
101680
Tea
cher
Ass
ista
nts
(259041)
3270
4.8
(4
)-
19650
1.8
(4
)-
(4)-
(4
)-
(4)-
(4
)-
14810
17300
19430
21680
24780
Art
s D
esig
n E
nte
rtai
nm
ent
Sport
s an
d M
edia
Occ
upat
ions(
270000)
2330
10.5
15.4
2
32080
3.5
7.1
3
9.2
2
13.3
7
19.0
1
25.9
3
14830
19170
27810
39540
53930
Flora
l D
esig
ner
s(271023)
230
16.5
11.5
7
24060
5.4
6.9
5
9.4
8
11.3
1
13.4
1
15.8
8
14460
19720
23520
27880
33020
Gra
phic
Des
igner
s(271024)
290
18.2
17.9
6
37350
4.6
11.8
7
14.0
2
16.5
9
20.8
5
24.4
8
24690
29150
34510
43370
50910
Inte
rior
Des
igner
s(271025)
50
31.9
13.8
8
28860
5.3
8.7
4
9.6
6
13.3
2
18.1
7
20.1
2
18180
20090
27700
37790
41840
Mer
chan
dis
e D
ispla
yers
and W
indow
Trim
mer
s(271026)
60
27.5
13.4
5
27980
9.6
8.0
7
9.9
1
11.5
2
17.2
8
21.6
8
16780
20610
23970
35940
45100
Coac
hes
and S
couts
(272022)
460
32.9
(4
)-
22310
10.2
(4
)-
(4)-
(4
)-
(4)-
(4
)-
13110
14270
16420
28890
39290
Musi
cian
s an
d S
inger
s(272042)
80
34.6
12.1
6
(4)-
18.9
6.4
3
7.1
3
8.6
5
12.1
6
25.4
7
(4)-
(4
)-
(4)-
(4
)-
(4)-
Public
Addre
ss S
yste
m a
nd O
ther
Announce
rs(2
73012)
140
45.1
(8
)-
(8)-
(8
)-
(8)-
(8
)-
(8)-
(8
)-
(8)-
(8
)-
(8)-
(8
)-
(8)-
(8
)-

TH
E G
AR
Y/C
HIC
AG
O I
NTER
NA
TIO
NA
L AIR
PO
RT
STR
AT
EG
IC B
US
INES
S P
LA
N
FIN
AL
Landru
m &
Bro
wn
I-5
April 2
010
Rep
orters an
d C
orresp
onden
ts(273022)
80
40
15.1
2
31460
9.7
7.6
8
10.7
9
14.2
9
18.8
6
24.0
9
15970
22430
29710
39220
50120
Public R
elations S
pecialists(2
73031)
240
11.9
19.1
5
39840
4.8
10.0
6
13.7
7
18.5
6
24.5
1
29.1
8
20930
28640
38600
50980
60700
Writers an
d A
uth
ors(2
73043)
40
25.8
27.7
3
57680
28.5
9.1
7
17.2
9
20.1
6
25.1
8
38.0
4
19070
35960
41940
52380
79120
Interp
reters and T
ranslato
rs(273091)
40
8.9
14.3
8
29910
3.3
10.6
3
13.3
6
14.9
4
16.3
17.9
9
22110
27800
31060
33900
37410
Audio
and V
ideo
Equip
men
t Tech
nician
s(274011)
50
23.2
18.8
39110
5.6
8.5
6
12.1
8
20.5
4
23.7
3
28.3
17790
25330
42730
49360
58870
Bro
adcast T
echnician
s(274012)
30
24.3
12.6
9
26390
6.8
6.9
8.3
11.0
9
12.8
8
23.4
14360
17260
23070
26790
48670
Photo
gra
phers(2
74021)
170
23.8
11.4
5
23820
6.1
8.4
3
9.1
7
10.2
11.8
8
16.4
6
17540
19060
21230
24700
34230
Health
care Practitioner an
d T
echnical O
ccupatio
ns(2
90000)
16680
7.1
32.1
8
66930
3.1
13.6
1
19.1
5
26.0
9
36.2
6
54.3
5
28310
39820
54270
75430
113040
Chiro
practo
rs(291011)
30
20.9
29.7
1
61800
15.5
16.8
8
18.4
5
22.3
9
43.5
7
50.7
3
35110
38380
46570
90620
105520
Den
tists Gen
eral(291021)
180
10.8
88.1
8
183410
12.6
45.5
62.7
9
(5)-
(5)-
(5)-
94630
130600
(5)-
(5)-
(5)-
Dietitian
s and N
utritio
nists(2
91031)
110
21.1
22.5
9
46990
2.1
16.8
4
18.6
5
21.9
3
25.8
8
30.1
1
35030
38790
45610
53830
62620
Opto
metrists(2
91041)
90
19.2
38.4
9
80050
13.4
16.4
2
18.1
7
38.6
2
49.1
2
59.8
34150
37790
80330
102170
124390
Pharm
acists(291051)
720
25.2
47.1
7
98120
2.5
41.3
5
43.7
7
47.4
9
51.1
5
57.8
1
86000
91040
98780
106400
120250
Anesth
esiolog
ists(291061)
50
48.4
(5
)- (5
)- 21.8
(5
)- (5
)- (5
)- (5
)- (5
)- (5
)- (5
)- (5
)- (5
)- (5
)-
Family an
d G
eneral Practitio
ners(2
91062)
300
18.7
71.2
148100
6.9
41.8
6
48.3
8
68.4
9
(5)-
(5)-
87070
100620
142460
(5)-
(5)-
Intern
ists Gen
eral(291063)
(8)-
(8)- 1
01.6
9
211520
28.8
63.1
(5
)- (5
)- (5
)- (5
)- 131250
(5)-
(5)-
(5)-
(5)-
Obstetrician
s and G
yneco
logists(2
91064)
(8)-
(8)-
83.3
173260
17.5
35.2
1
40
(5)-
(5)-
(5)-
73250
83200
(5)-
(5)-
(5)-
Surg
eons(2
91067)
100
31.9
106.4
221320
12.8
79.3
2
(5)-
(5)-
(5)-
(5)-
164980
(5)-
(5)-
(5)-
(5)-
Physician
s and S
urg
eons A
ll Oth
er(291069)
580
34.2
103.8
6
216030
10.4
75.2
7
(5)-
(5)-
(5)-
(5)-
156570
(5)-
(5)-
(5)-
(5)-
Physician
Assistan
ts(291071)
100
29.2
36.5
7
76070
4.1
26.9
3
31.9
1
37.2
9
42.9
2
47.2
7
56010
66360
77560
89270
98330
Podiatrists(2
91081)
30
9.2
81.1
168680
21.6
32.0
6
51.6
5
(5)-
(5)-
(5)-
66680
107440
(5)-
(5)-
(5)-
Reg
istered N
urses(2
91111)
6130
9.4
29.1
2
60570
1.2
20.5
9
23.7
9
29.2
3
34.7
4
38.5
1
42820
49470
60800
72270
80110
Occu
patio
nal T
herap
ists(291122)
210
28.8
39.2
9
81720
3.6
27.3
3
30.6
1
37.8
5
48.7
6
56.7
9
56840
63680
78720
101410
118120
Physical T
herap
ists(291123)
470
19.2
38.8
7
80850
11.5
16.3
5
28.6
37
55.9
6
62.5
4
34010
59480
76950
116410
130090
Recreatio
nal T
herap
ists(291125)
40
19.7
14.4
2
29990
6.4
8.5
3
9.7
6
14.5
1
17.9
8
20.2
17730
20290
30170
37390
42010
Resp
iratory T
herap
ists(291126)
360
10.9
24.6
4
51260
1.8
19.2
2
21.5
8
24.6
4
28.2
7
30.7
2
39970
44890
51260
58800
63900
Speech
-Languag
e Patholo
gists(2
91127)
220
33.7
(8
)- (8
)- (8
)- (8
)- (8
)- (8
)- (8
)- (8
)- (8
)- (8
)- (8
)- (8
)- (8
)-
Med
ical and C
linical Lab
orato
ry Tech
nolo
gists(2
92011)
290
12.1
22.3
1
46410
2.4
16.2
7
18.9
4
22.2
9
25.1
5
29.8
2
33850
39400
46360
52310
62020
Med
ical and C
linical Lab
orato
ry Tech
nician
s(292012)
420
12.4
21.5
6
44840
2.2
14.0
7
17.1
3
21.9
3
25.7
1
29.4
29270
35620
45620
53480
61150
Den
tal Hyg
ienists(2
92021)
350
15.1
30.8
9
64240
4.8
19.3
8
27.6
4
32.9
7
37.2
39.7
4
40320
57480
68580
77380
82650
Card
iovascu
lar Tech
nolo
gists an
d T
echnician
s(292031)
110
16
21.3
6
44420
2.4
12.1
9
14.6
9
20.6
1
26.2
6
33.7
4
25360
30560
42870
54630
70180
Diag
nostic M
edical S
onograp
hers(2
92032)
100
23.7
32.5
5
67710
2.4
26.1
3
29.1
33.3
9
37.0
7
39.2
9
54340
60530
69450
77110
81720
Nuclear M
edicin
e Tech
nolo
gists(2
92033)
60
22.1
34.3
2
71380
1.9
27.4
8
31.9
35.2
7
38.3
1
40.6
8
57150
66350
73360
79680
84620
Rad
iolo
gic T
echnolo
gists an
d T
echnician
s(292034)
580
16.1
24.1
8
50300
1.8
18.8
7
21.2
1
24.1
1
27.6
3
30.4
8
39240
44120
50150
57470
63390
Em
ergen
cy Med
ical Tech
nician
s and Param
edics(2
92041)
720
21.7
14.6
7
30500
3.1
8.9
5
10.9
9
14.0
2
17.7
8
22.0
9
18620
22850
29160
36980
45940
Dietetic T
echnician
s(292051)
50
19
12.9
26830
2.8
9.6
7
11.1
12.9
14.8
1
17.1
2
20120
23090
26840
30810
35620
Pharm
acy Tech
nician
s(292052)
830
10.9
12.9
9
27030
1.8
10.0
1
11.1
2
12.9
3
14.7
4
16.1
20820
23120
26890
30660
33490
Resp
iratory T
herap
y Tech
nician
s(292054)
80
23.7
22.3
46380
2.1
16.9
1
18.7
7
21.9
7
25.6
1
29.3
7
35170
39040
45700
53270
61090
Surg
ical Tech
nolo
gists(2
92055)
250
20.1
19.2
3
39990
3.9
14.2
9
16.5
18.7
7
21.9
2
25.1
1
29730
34310
39030
45600
52230
Veterin
ary Tech
nolo
gists an
d T
echnician
s(292056)
(8)-
(8)-
13.7
4
28580
7.1
9.2
4
10.7
5
12.6
9
17.1
3
18.7
8
19220
22360
26400
35630
39050
Licensed
Practical and Licen
sed V
ocatio
nal N
urses(2
92061)
1660
10.4
19.8
6
41310
1.6
14.9
17.1
5
19.8
2
22.8
2
24.7
30990
35680
41220
47460
51380
Med
ical Reco
rds an
d H
ealth In
form
ation T
echnician
s(292071)
440
14.2
14.1
29330
3.4
9.1
2
11.1
13.5
6
15.8
3
19.7
4
18980
23090
28190
32920
41060

TH
E G
AR
Y/
CH
ICA
GO
IN
TER
NA
TIO
NA
L A
IRP
OR
T
STR
AT
EG
IC B
US
INES
S P
LA
N
FIN
AL
Landru
m &
Bro
wn
I-6
April 2010
Optici
ans
Dis
pen
sing(2
92081)
160
32.9
12.5
3
26050
2.4
9.6
9
10.7
3
12.1
8
14.3
4
16.0
4
20160
22320
25330
29830
33370
Hea
lth T
echnolo
gis
ts a
nd T
echnic
ians
All
Oth
er(2
92099)
(8)-
(8
)-
17.2
8
35950
17.5
10.5
6
12.5
1
15.8
8
19.7
2
29.3
1
21960
26010
33040
41020
60970
Occ
upat
ional
Hea
lth a
nd S
afet
y Spec
ialis
ts(2
99011)
100
12.2
28.6
6
59620
6.2
12.4
9
18.2
1
26.5
5
41.5
47.7
6
25980
37870
55220
86310
99340
Occ
upat
ional
Hea
lth a
nd S
afet
y Tec
hnic
ians(
299012)
100
28.4
16.6
4
34620
9.3
8.1
6
9.1
4
16.0
4
19.1
8
31.7
4
16970
19000
33360
39890
66020
Hea
lthca
re P
ract
itio
ner
and T
echnic
al W
ork
ers
All
Oth
er(2
99099)
60
43.2
21.1
4
43980
7.5
11.5
5
13.6
5
17.5
4
24.3
3
40.0
9
24030
28390
36470
50600
83400
Hea
lthca
re S
upport
Occ
upat
ions(
310000)
7790
5
12.3
4
25660
1.4
8.5
1
9.9
3
11.6
14.1
1
17.0
7
17700
20650
24140
29340
35510
Hom
e H
ealth A
ides
(311011)
1440
9.9
10.7
4
22340
2.2
8.3
1
9.4
7
10.6
5
11.9
1
13.8
17290
19690
22140
24780
28710
Nurs
ing A
ides
Ord
erlie
s an
d A
tten
dan
ts(3
11012)
2780
9.8
11.1
5
23180
1.7
8.3
3
9.4
3
10.9
4
12.5
9
14.6
2
17330
19610
22750
26190
30410
Occ
upat
ional
Ther
apis
t Ass
ista
nts
(312011)
60
25.7
24.8
5
51680
5.5
16.1
7
21.6
6
25.6
1
29.2
5
31.7
5
33630
45060
53270
60850
66030
Phys
ical
Ther
apis
t Ass
ista
nts
(312021)
180
39.5
22.3
7
46540
6.4
15.3
4
17.2
8
20.1
4
23.7
31.1
7
31910
35940
41900
49290
64840
Phys
ical
Ther
apis
t Aid
es(3
12022)
100
18.8
12.0
6
25090
4.1
7.9
5
9.4
6
11.8
9
14.4
7
17.0
9
16530
19680
24730
30110
35540
Mas
sage
Ther
apis
ts(3
19011)
120
42.3
13.7
6
28620
11.2
6.8
8
12.2
9
14.0
2
16.9
8
19.3
5
14310
25560
29160
35310
40250
Den
tal Ass
ista
nts
(319091)
640
5.3
15.6
32440
3.6
10.4
7
13.4
4
15.4
4
18.0
6
20.0
7
21780
27960
32110
37570
41730
Med
ical
Ass
ista
nts
(319092)
1340
10.4
12.6
4
26290
3.1
9.3
2
10.4
7
11.8
3
14.0
2
17.6
9
19380
21770
24610
29160
36800
Med
ical
Equip
men
t Pr
epare
rs(3
19093)
90
17.8
13.2
6
27580
4.5
9.5
3
11.4
8
13.4
3
14.8
6
15.9
5
19810
23870
27920
30910
33170
Med
ical
Tra
nsc
riptionis
ts(3
19094)
230
14
14.7
2
30620
2.4
10.6
2
12.8
3
14.8
17.1
7
18.9
1
22090
26680
30770
35710
39340
Vet
erin
ary
Ass
ista
nts
and L
abora
tory
Anim
al C
aret
aker
s(319096)
210
40.3
9.0
9
18900
10
6.2
9
6.8
9
8.5
7
11.1
6
13.2
2
13070
14340
17830
23210
27490
Hea
lthca
re S
upport
Work
ers
All
Oth
er(3
19099)
480
9.3
13.2
4
27530
2.7
10.2
9
11.1
8
12.7
7
14.8
6
16.9
2
21400
23260
26560
30920
35190
Prote
ctiv
e Ser
vice
Occ
upat
ions(
330000)
6420
5.1
15.3
4
31910
3.5
7.2
1
9.5
9
14.1
5
20.3
8
24.9
14990
19950
29420
42400
51780
Firs
t-Li
ne
Super
viso
rs/M
anag
ers
of
Polic
e an
d D
etec
tive
s(331012)
130
6.7
28.7
1
59730
2.7
20.7
4
24.2
3
27.9
6
31.3
2
38.3
7
43150
50390
58160
65130
79820
Firs
t-Li
ne
Super
viso
rs/M
anag
ers
of
Fire
Fig
hting a
nd P
reve
ntion
Work
ers(
331021)
50
8.2
25.8
5
53760
2.3
19.8
8
21.9
9
25.6
6
29.4
8
32.2
2
41340
45730
53370
61320
67020
Firs
t-Li
ne
Super
viso
rs/M
anag
ers
Prote
ctiv
e Ser
vice
Work
ers
All
Oth
er(3
31099)
110
13
20.7
9
43240
10.4
8.7
13.4
6
15.8
4
29.2
7
40.3
2
18090
28000
32950
60890
83860
Fire
Fig
hte
rs(3
32011)
530
6.6
18.6
9
38870
2.6
11.2
7
15.2
9
19.5
4
22.9
2
24.8
8
23440
31810
40630
47680
51740
Bai
liffs
(333011)
130
13.2
16.2
7
33840
4.9
12.5
3
13.4
7
15.0
1
18.2
23.1
8
26060
28010
31230
37850
48220
Corr
ectional
Offic
ers
and J
aile
rs(3
33012)
630
11.8
13.8
9
28880
2.2
10.7
12.7
4
14
15.2
6
17.0
8
22260
26500
29130
31740
35520
Det
ective
s an
d C
rim
inal
Inve
stig
ators
(333021)
150
11.5
27.7
3
57670
6.5
18.6
21.6
7
24.4
4
31.6
7
45.4
3
38690
45060
50840
65880
94500
Polic
e an
d S
her
iff's
Patr
ol O
ffic
ers(
333051)
1240
6.5
20.7
6
43180
1.5
16.1
9
17.8
7
20.9
7
23.7
4
25.8
3
33670
37170
43610
49380
53730
Gam
ing S
urv
eilla
nce
Offic
ers
and G
amin
g I
nve
stig
ators
(339031)
140
15.9
18.9
8
39470
6.3
13.5
3
15.8
8
18.3
3
22.1
5
25.3
6
28140
33030
38130
46070
52760
Sec
uri
ty G
uar
ds(
339032)
2750
9.4
11.4
3
23780
5.6
6.5
7
7.7
3
9.8
9
13.4
7
19.1
1
13670
16080
20580
28010
39740
Cro
ssin
g G
uar
ds(
339091)
110
6
9.5
19770
2.5
6.4
7
7.2
5
8.7
6
11.3
5
14.3
7
13450
15080
18220
23600
29880
Life
guar
ds
Ski
Pat
rol an
d O
ther
Rec
reational
Pro
tect
ive
Ser
vice
Work
ers(
339092)
220
17
8.6
6
18010
5
6.4
1
7.1
2
8.3
8
10.0
8
11.5
5
13340
14800
17440
20960
24020
Prote
ctiv
e Ser
vice
Work
ers
All
Oth
er(3
39099)
150
20.7
12.3
5
25680
8.6
6.8
2
8.4
1
10.2
7
11.8
4
25.9
3
14200
17490
21360
24640
53940
Food P
repar
ation a
nd S
ervi
ng R
elat
ed O
ccupat
ions(
350000)
27070
3.1
8.8
18290
1.4
6.3
1
6.8
7
7.8
5
10.0
4
12.4
7
13120
14280
16320
20880
25930
Chef
s an
d H
ead C
ooks
(351011)
60
19.9
21.4
8
44670
4.9
13.0
3
15.3
6
21.8
8
28.1
1
30.8
8
27100
31940
45510
58470
64230
Firs
t-Li
ne
Super
viso
rs/M
anag
ers
of
Food P
repar
atio
n a
nd S
ervi
ng
Work
ers(
351012)
2060
4.3
13.8
5
28810
2
8.6
8
10.7
1
13.2
15.9
9
20.5
8
18060
22280
27460
33260
42810
Cooks
Fas
t Fo
od(3
52011)
1050
17.4
7.8
5
16320
3
6.2
6
6.7
3
7.5
2
8.7
6
10.0
6
13020
14000
15640
18230
20920
Cooks
Inst
itution a
nd C
afet
eria
(352012)
990
8.3
10.2
1
21240
1.8
7.6
9
8.6
6
10.0
2
11.6
3
13.2
3
15990
18020
20850
24190
27520
Cooks
Res
taura
nt(
352014)
1380
11.7
9.5
9
19940
3.2
6.6
7.6
1
9.1
1
11.1
13.4
2
13730
15820
18950
23090
27900
Cooks
Short
Ord
er(3
52015)
440
22.3
9.5
8
19920
4.7
6.8
4
8.0
8
9.3
9
10.9
7
12.3
2
14220
16800
19530
22810
25630
Food P
repar
ation W
ork
ers(
352021)
2190
9.1
9.2
7
19280
2.6
6.6
4
7.6
7
9.0
5
10.7
1
12.4
9
13820
15950
18820
22270
25980
Bar
tender
s(353011)
1230
15.1
9.1
6
19060
6.9
6.2
3
6.7
1
7.5
2
12.1
3
14.3
2
12950
13950
15640
25240
29780
Com
bin
ed F
ood P
repar
atio
n a
nd S
ervi
ng W
ork
ers
Incl
udin
g F
ast
Food(3
53021)
8660
7.4
7.4
9
15580
1.5
6.1
9
6.5
8
7.2
3
8.0
4
9.5
4
12870
13680
15030
16730
19830

TH
E G
AR
Y/C
HIC
AG
O I
NTER
NA
TIO
NA
L AIR
PO
RT
STR
AT
EG
IC B
US
INES
S P
LA
N
FIN
AL
Landru
m &
Bro
wn
I-7
April 2
010
Counter A
ttendan
ts Cafeteria Fo
od C
oncessio
n an
d C
offee S
hop(3
53022)
970
40.9
7.8
4
16300
3
6.2
6
6.7
3
7.5
1
8.7
9
9.8
13010
13990
15620
18280
20380
Waiters an
d W
aitresses(353031)
5170
9.1
8.6
8
18060
3.3
6.3
1
6.8
6
7.7
9
10.4
3
11.9
13120
14260
16200
21700
24760
Food S
ervers Nonrestau
rant(3
53041)
360
17
9.1
5
19040
3
6.5
8
7.5
5
9.0
4
10.7
6
12.0
8
13700
15690
18800
22390
25120
Din
ing R
oom
and C
afeteria Atten
dan
ts and B
artender H
elpers(3
59011)
1030
9.9
8.1
1
16880
3.4
6.3
1
6.8
7
7.7
5
9.2
1
10.9
9
13120
14280
16130
19150
22860
Dish
wash
ers(359021)
780
12.7
8.0
2
16690
3.5
6.2
7
6.7
6
7.5
9
8.8
6
10.4
5
13040
14070
15780
18430
21730
Hosts an
d H
ostesses R
estauran
t Lounge an
d C
offee S
hop(3
59031)
670
23.1
8.0
6
16770
4.4
6.2
4
6.6
9
7.4
4
9.4
6
11.0
5
12980
13920
15470
19680
22980
Food Prep
aratio
n an
d S
erving R
elated W
orkers A
ll Oth
er(359099)
40
43.5
7.3
9
15360
3.2
6.2
1
6.6
1
7.2
8
8.0
5
9.1
7
12920
13750
15130
16750
19070
Build
ing an
d G
rounds C
leanin
g an
d M
ainten
ance O
ccupatio
ns(3
70000)
9510
3.6
11.6
3
24190
2.4
6.8
3
8.2
3
10.8
3
13.8
1
17.0
6
14210
17110
22520
28730
35490
First-Line S
uperviso
rs/Manag
ers of H
ousekeep
ing a
nd Jan
itorial W
orkers(3
71011)
380
13.3
18.2
8
38020
3.7
12.2
9
13.8
9
16.9
21.2
1
28.3
2
25560
28890
35160
44130
58910
First-Line S
uperviso
rs/Manag
ers of La
ndscap
ing La
wn S
ervice and
Gro
undskeep
ing W
orkers(3
71012)
160
23.1
22.9
5
47730
7.2
13.7
8
16.6
7
20.3
8
27.2
6
38.2
2
28670
34670
42380
56690
79490
Janito
rs and C
leaners E
xcept M
aids an
d H
ousekeep
ing C
leaners(3
72011)
5330
4.3
11.0
2
22930
2.3
6.7
6
8.0
5
10.4
9
13.5
16.0
1
14060
16750
21820
28070
33310
Maid
s and H
ousekeep
ing C
leaners(3
72012)
1510
9
9.4
6
19670
3.3
6.5
3
7.4
2
9.1
5
11.4
9
13.1
1
13580
15440
19040
23900
27260
Build
ing C
leanin
g W
orkers A
ll Oth
er(372019)
(8)-
(8)-
26.0
4
54160
13.9
7.2
2
13.7
1
32.7
9
36.0
2
37.9
6
15010
28520
68200
74920
78950
Pest Contro
l Workers(3
72021)
60
15.7
15.4
3
32100
7.7
11.0
6
13.1
4
14.9
5
17.8
8
22.2
9
23010
27330
31090
37180
46360
Landsca
pin
g an
d G
roundskeep
ing W
orkers(3
73011)
1930
9.2
12.0
4
25050
6
7.2
2
8.8
4
11.3
5
13.8
4
16.6
7
15020
18390
23620
28780
34680
Tree T
rimm
ers and Pru
ners(3
73013)
60
43.7
14.7
9
30770
2.8
11.2
6
12.9
2
14.5
16.1
19.3
23420
26880
30160
33490
40150
Personal C
are and S
ervice Occu
patio
ns(3
90000)
9250
5.8
11.3
9
23700
4.8
6.6
2
7.6
3
9.3
3
12.6
2
18.4
9
13770
15870
19410
26250
38460
Gam
ing S
uperviso
rs(391011)
280
23.2
31.5
9
65700
3.2
22.2
5
27.5
6
32.7
4
37.0
2
39.7
9
46270
57320
68100
77010
82760
First-Line S
uperviso
rs/Manag
ers of Perso
nal S
ervice Workers(3
91021)
420
18.8
13.4
8
28040
3.6
9.1
5
10.5
7
12.6
16
18.6
8
19020
21990
26200
33290
38860
Nonfarm
Anim
al Caretakers(3
92021)
270
23.7
8.2
2
17090
3.6
6.2
9
6.8
7.6
7
9.3
6
11.2
4
13070
14140
15960
19470
23370
Gam
ing D
ealers(393011)
1280
20.5
(8
)- (8
)- (8
)- (8
)- (8
)- (8
)- (8
)- (8
)- (8
)- (8
)- (8
)- (8
)- (8
)-
Ush
ers Lobby A
ttendan
ts and T
icket Takers(3
93031)
180
49.7
8.4
8
17650
9.3
6.3
6.8
3
7.6
9
9.1
12.8
8
13100
14200
15990
18920
26790
Am
usem
ent an
d R
ecreatio
n A
ttendan
ts(393091)
560
28.5
8.4
8
17630
4.3
6.3
6.8
5
7.8
2
9.5
6
12.0
4
13090
14250
16270
19890
25040
Locker R
oom
Coatro
om
and D
ressing R
oom
Atten
dan
ts(393093)
30
13
9.3
19350
4.2
6.6
3
7.6
8.9
5
11.0
5
12.4
9
13800
15800
18620
22970
25990
Em
balm
ers(394011)
90
33.4
19.7
6
41100
26.8
12.6
1
13.4
9
14.9
1
27.9
2
31.1
7
26220
28050
31020
58080
64840
Funeral A
ttendan
ts(394021)
80
44.6
10.1
4
21100
17.2
7.8
2
8.2
9
9.0
4
11.2
8
15
16260
17240
18800
23450
31200
Haird
ressers Hairstylists an
d C
osm
etolo
gists(3
95012)
1420
7.6
10.6
3
22110
9.2
6.4
6
7.2
6
8.8
1
12.2
4
18.5
2
13440
15100
18330
25450
38530
Man
icurists an
d Ped
icurists(3
95092)
40
30
10.6
6
22170
17
6.3
4
6.9
2
9.7
5
13.7
9
15.0
9
13180
14400
20280
28690
31400
Skin
Care S
pecialists(3
95094)
30
42.8
13.2
27450
14.5
6.8
9
10.7
14.0
8
16.1
1
18.1
4
14330
22260
29290
33500
37730
Tour G
uid
es and E
scorts(3
96021)
50
39.4
12.5
7
26150
5.6
8.5
9
9.6
1
12.5
7
14.9
9
17.5
5
17870
19990
26140
31190
36510
Child
Care W
orkers(3
99011)
1460
12.7
9.2
1
19160
2
6.6
3
7.6
5
9.1
4
10.8
7
12.0
3
13790
15900
19020
22600
25020
Personal an
d H
om
e Care A
ides(3
99021)
1620
11.3
9.3
6
19470
2.7
7.6
5
8.2
9
9.1
2
10.2
2
11.9
5
15920
17240
18960
21260
24850
Fitness T
rainers an
d A
erobics In
structo
rs(399031)
470
14.1
16.0
8
33440
20.5
6.6
7.5
9
11.1
7
19.1
7
35.8
5
13730
15790
23240
39880
74570
Recreatio
n W
orkers(3
99032)
520
18.6
9.9
7
20740
2.6
6.6
7
7.7
5
9.1
8
11.2
2
15.3
5
13880
16120
19090
23330
31930
Personal C
are and S
ervice Workers A
ll Oth
er(399099)
(8)-
(8)-
8
16650
8
6.2
3
6.6
7
7.3
9
8.1
3
11.1
9
12960
13860
15370
16910
23280
Sales an
d R
elated O
ccupatio
ns(4
10000)
28680
3.3
15.4
32030
3
6.6
9
7.8
6
10.3
16.8
9
30.0
6
13920
16360
21420
35120
62530
First-Line S
uperviso
rs/Manag
ers of R
etail Sales W
orkers(4
11011)
2650
4.8
20.8
5
43370
3.2
10.7
9
13.3
1
17.3
8
24.1
6
37.2
2
22440
27680
36140
50260
77420
First-Line S
uperviso
rs/Manag
ers of N
on-R
etail Sales W
orkers(4
11012)
550
13.1
40.9
1
85090
17.1
14.5
2
22.4
5
29.5
5
49.1
6
(5)-
30200
46690
61450
102250
(5)-
Cash
iers(412011)
7700
4.1
8.3
9
17460
1.1
6.3
3
6.9
7
8.0
9
9.3
4
11.1
13170
14490
16820
19420
23090
Gam
ing C
han
ge Perso
ns an
d B
ooth
Cash
iers(412012)
210
23.2
12.6
26210
7.1
9.8
3
10.7
3
12.6
8
14.4
15.4
4
20440
22320
26370
29950
32120
Counter an
d R
ental C
lerks(412021)
1210
14.8
11.7
5
24440
5.5
6.5
7
7.5
7
10.4
4
13.4
6
18.8
1
13660
15740
21710
28000
39130
Parts Salesp
ersons(4
12022)
600
14.6
14.4
8
30120
5.3
8.6
3
10.2
1
13.3
6
18.5
5
23.0
7
17940
21250
27790
38590
47980
Retail S
alesperso
ns(4
12031)
10030
7.1
11.4
4
23790
3
6.5
7
7.5
6
9.3
6
12.3
7
19.5
8
13670
15730
19470
25730
40720

TH
E G
AR
Y/
CH
ICA
GO
IN
TER
NA
TIO
NA
L A
IRP
OR
T
STR
AT
EG
IC B
US
INES
S P
LA
N
FIN
AL
Landru
m &
Bro
wn
I-8
April 2010
Adve
rtis
ing S
ales
Agen
ts(4
13011)
190
31.6
32.4
8
67560
29.6
10.1
3
11.7
6
18.1
1
28.3
8
(5)-
21070
24460
37660
59030
(5)-
Insu
rance
Sal
es A
gen
ts(4
13021)
590
25.8
25.4
8
52990
20.3
10.2
9
11.2
13.0
6
18.5
8
73.6
4
21400
23300
27170
38650
153180
Sec
uri
ties
Com
moditie
s an
d F
inan
cial
Ser
vice
s Sal
es A
gen
ts(4
13031)
280
37.5
33.5
9
69870
12.6
10.5
11.7
6
24.4
7
45.5
70.5
7
21850
24450
50890
94640
146780
Tra
vel Agen
ts(4
13041)
90
20.8
9.4
2
19590
6.4
6.4
7.1
6
9.1
1
11.2
1
12.8
13320
14900
18950
23310
26620
Sal
es R
epre
senta
tive
s Ser
vice
s All
Oth
er(4
13099)
830
15.9
26.2
3
54570
15.1
7.7
2
13.0
5
19.9
5
28.5
4
47.1
16050
27150
41500
59370
97970
Sal
es R
epre
senta
tive
s W
hole
sale
and M
anufa
cturi
ng T
echnic
al a
nd S
cien
tific
Product
s(414011)
670
19.8
44.1
8
91900
15.8
20.2
4
25.7
9
34.4
7
43.9
(5
)-
42090
53650
71700
91310
(5)-
Sal
es R
epre
senta
tive
s W
hole
sale
and M
anufa
cturi
ng E
xcep
t Tec
hnic
al a
nd
Sci
entific
Product
s(414012)
2320
8.7
27.4
57000
4.9
11.5
3
16.9
5
23.8
2
35.6
9
47.7
7
23980
35260
49550
74230
99350
Dem
onst
rato
rs a
nd P
roduct
Pro
mote
rs(4
19011)
120
8
14.9
6
31120
4.3
9.8
2
11.9
6
16.2
9
17.9
5
18.9
5
20420
24870
33880
37340
39410
Rea
l Est
ate
Bro
kers
(419021)
40
40.5
34.6
71980
10.2
13.9
2
25.6
5
36.1
3
44.3
7
53.0
5
28950
53350
75140
92280
110340
Rea
l Est
ate
Sal
es A
gen
ts(4
19022)
(8)-
(8
)-
19.2
2
39980
27.6
8.2
5
9.3
7
21.8
24.3
2
25.9
17150
19480
45330
50590
53870
Sal
es E
ngin
eers
(419031)
60
33.2
38.4
7
80010
10.8
27.4
7
29.9
6
34.1
4
51.1
5
58.4
1
57130
62320
71000
106390
121490
Sal
es a
nd R
elat
ed W
ork
ers
All
Oth
er(4
19099)
140
32.5
20.5
42640
16.2
7.6
3
10.2
8
14.7
9
27.9
2
31.2
7
15870
21380
30770
58070
65030
Offic
e an
d A
dm
inis
trat
ive
Support
Occ
upat
ions(
430000)
42830
2.3
14.1
29330
1.7
7.8
2
9.7
7
12.8
2
16.8
2
22.6
8
16270
20320
26670
34990
47180
Firs
t-Li
ne
Super
viso
rs/M
anag
ers
of
Offic
e an
d A
dm
inis
trat
ive
Support
W
ork
ers(
431011)
2220
4.7
21.2
1
44120
1.6
12.5
7
15.2
5
19.5
3
25.3
8
32.2
26150
31710
40620
52790
66970
Sw
itch
boar
d O
per
ators
Incl
udin
g A
nsw
erin
g S
ervi
ce(4
32011)
290
6.9
11.1
1
23110
2
8.1
4
9.0
4
10.6
5
12.5
6
14.8
6
16940
18790
22150
26120
30900
Bill
and A
ccount
Colle
ctors
(433011)
560
13.7
13.8
8
28880
3.4
8.7
3
10.5
7
13.2
1
16.2
8
20.1
6
18170
21980
27480
33860
41930
Bill
ing a
nd P
ost
ing C
lerk
s an
d M
achin
e O
per
ators
(433021)
1230
12.6
14.8
6
30900
2.5
9.5
6
12
14.2
9
17.1
2
20.2
4
19890
24950
29730
35610
42100
Bookk
eepin
g A
ccounting a
nd A
uditin
g C
lerk
s(433031)
3740
5.7
16.4
9
34300
5
9.0
1
11.9
6
14.7
4
18.7
9
23.8
4
18740
24880
30660
39090
49590
Gam
ing C
age
Work
ers(
433041)
270
36.8
11.8
8
24710
2.3
9.8
9
10.5
8
11.6
7
13.1
4
14.6
6
20560
22010
24280
27340
30500
Payr
oll
and T
imek
eepin
g C
lerk
s(433051)
340
8.5
16.0
7
33430
2.2
10.8
9
13.2
4
15.2
4
18.7
9
22.9
9
22650
27530
31700
39090
47810
Procu
rem
ent
Cle
rks(
433061)
60
10.5
15.8
8
33020
3.6
9.1
3
12.4
8
15.3
5
19.2
9
23.6
1
18980
25960
31920
40120
49100
Tel
lers
(433071)
1500
11.6
10.9
5
22780
2.8
8.4
2
9.2
5
10.7
7
12.3
8
14.3
17520
19240
22400
25750
29740
Bro
kera
ge
Cle
rks(
434011)
(8)-
(8
)-
17.2
7
35910
3.3
15.5
8
16.2
4
17.3
2
18.4
19.0
5
32410
33780
36020
38270
39610
Court
Munic
ipal
and L
icen
se C
lerk
s(434031)
480
17
12.1
1
25200
2.1
10.1
6
10.8
2
11.8
7
13.4
2
15.0
6
21140
22510
24690
27910
31330
Cust
om
er S
ervi
ce R
epre
senta
tive
s(434051)
3380
10
12.8
3
26680
6
6.7
1
8.0
5
10.7
6
16.8
3
21.6
1
13970
16740
22390
35020
44950
Elig
ibili
ty I
nte
rvie
wer
s G
ove
rnm
ent
Progra
ms(
434061)
280
16
16.0
2
33330
3.3
10.5
12.0
8
15.2
19.2
2
23.3
1
21840
25130
31620
39980
48490
File
Cle
rks(
434071)
290
14.9
9.9
4
20670
2.8
6.5
3
7.4
1
9.3
7
11.6
5
14.7
13580
15400
19500
24220
30580
Hote
l M
ote
l an
d R
esort
Des
k Cle
rks(
434081)
300
15.6
7.8
9
16400
3.9
6.3
6.9
7.9
4
8.9
7
9.6
2
13110
14340
16520
18660
20000
Inte
rvie
wer
s Exc
ept
Elig
ibili
ty a
nd L
oan
(434111)
540
11.6
12.4
7
25940
2.1
8.8
2
10.0
9
12.0
1
14.5
9
17.1
18340
20980
24980
30340
35560
Libra
ry A
ssis
tants
Cle
rica
l(434121)
560
9.9
9.2
5
19240
2.4
6.4
8
7.2
9
9
10.9
7
12.6
3
13470
15170
18720
22810
26260
Loan
Inte
rvie
wer
s an
d C
lerk
s(434131)
320
16.5
15.3
3
31900
4.3
10.8
7
12.4
9
14.9
17.7
20.2
6
22620
25980
31000
36830
42140
New
Acc
ounts
Cle
rks(
434141)
280
24.1
14.6
3
30420
3.6
11.0
1
12.7
4
14.7
9
17.0
1
18.5
6
22900
26490
30770
35370
38600
Ord
er C
lerk
s(434151)
210
18.4
14.3
2
29780
7.2
8.3
2
9.4
13.1
8
16.2
1
25.3
9
17310
19550
27410
33720
52810
Hum
an R
esourc
es A
ssis
tants
Exc
ept
Payr
oll
and T
imek
eepin
g(4
34161)
190
9.2
15.6
4
32540
2.8
10.9
3
12.7
4
15.1
18.0
1
20.8
1
22740
26500
31410
37450
43280
Rec
eptionis
ts a
nd I
nfo
rmat
ion C
lerk
s(434171)
2160
6.8
10.7
9
22440
1.9
7.0
9
8.4
5
10.5
2
12.9
8
15.0
2
14740
17570
21880
26990
31250
Info
rmat
ion a
nd R
ecord
Cle
rks
All
Oth
er(4
34199)
160
12.1
13.4
1
27900
5.5
7.0
5
10
13.0
5
15.6
4
20.7
9
14660
20790
27140
32520
43240
Car
go a
nd F
reig
ht
Agen
ts(4
35011)
220
41.5
18.2
4
37940
14.8
9.0
9
12.7
6
15.1
22.1
5
29.6
3
18920
26530
31400
46070
61630
Couri
ers
and M
esse
nger
s(435021)
120
10.8
11.3
3
23560
3.5
8.3
6
9.4
3
10.9
6
12.6
6
15.2
9
17390
19620
22790
26340
31800
Polic
e Fi
re a
nd A
mbula
nce
Dis
pat
cher
s(435031)
260
11.2
13.6
5
28400
2.1
9.1
5
11.6
13.7
1
15.4
2
18.7
4
19020
24130
28520
32070
38980
Dis
pat
cher
s Exc
ept
Polic
e Fi
re a
nd A
mbula
nce
(435032)
530
15.7
17.7
3
36890
4.1
10.4
5
12.7
16.0
8
21.1
29.4
5
21730
26410
33440
43880
61250
Post
al S
ervi
ce C
lerk
s(435051)
170
0
24.5
50960
(9)-
23.7
8
24.5
4
24.5
4
25.0
9
25.5
2
49460
51040
51040
52190
53080
Post
al S
ervi
ce M
ail Car
rier
s(435052)
780
0
22.9
5
47740
(9)-
17.9
8
19.8
4
24.6
4
24.6
4
25.1
9
37400
41270
51250
51250
52400

TH
E G
AR
Y/C
HIC
AG
O I
NTER
NA
TIO
NA
L AIR
PO
RT
STR
AT
EG
IC B
US
INES
S P
LA
N
FIN
AL
Landru
m &
Bro
wn
I-9
April 2
010
Postal S
ervice Mail S
orters Pro
cessors an
d Pro
cessing M
achin
e O
perato
rs(435053)
310
0
22.1
3
46030
(9)-
12
22.8
4
24.5
4
24.5
4
24.5
4
24960
47510
51040
51040
51040
Productio
n Plan
nin
g an
d E
xped
iting C
lerks(435061)
390
9.7
21.7
9
45330
4.8
11.4
16.1
2
21.4
1
27.7
4
31.9
6
23710
33540
44530
57710
66470
Ship
pin
g R
eceiving an
d T
raffic Clerks(4
35071)
1220
8.8
14.6
4
30460
3.8
8.6
5
10.7
6
13.7
18.1
9
22.6
3
17990
22380
28490
37830
47070
Sto
ck Clerks an
d O
rder Fillers(4
35081)
3730
8.1
10.4
3
21690
1.8
7.0
4
8.1
4
9.7
1
11.8
14.8
14630
16930
20190
24550
30780
Weig
hers M
easurers C
heckers an
d S
amplers R
ecord
keepin
g(4
35111)
200
25
13.6
2
28340
8.5
8.7
5
9.7
7
12.4
1
16.9
9
19.3
18200
20320
25820
35340
40140
Execu
tive Secretaries an
d A
dm
inistrative A
ssistants(4
36011)
2280
8.1
18.3
4
38150
2.1
12
14.1
6
17.3
5
22.0
7
25.9
5
24960
29450
36090
45900
53980
Legal S
ecretaries(4
36012)
550
15.6
14.2
1
29550
7
10.0
9
11.4
8
13.9
9
16.7
6
19.0
9
20990
23870
29090
34860
39710
Med
ical Secretaries(4
36013)
810
19.8
14
29130
3.3
10.2
1
11.8
2
13.6
8
15.4
5
19.0
9
21240
24580
28460
32140
39700
Secretaries E
xcept Leg
al Med
ical and E
xecutive(4
36014)
4220
5.2
14.0
3
29180
1.5
9.7
9
11.2
8
13.6
4
16.2
4
19.4
5
20360
23470
28380
33780
40460
Com
puter O
perato
rs(439011)
110
21.1
15.7
6
32770
7.4
10.2
3
11.4
9
13.9
3
20.9
9
24.8
6
21290
23900
28980
43670
51700
Data E
ntry K
eyers(439021)
260
33.3
12.1
9
25350
4
7.2
8
8.7
5
11.2
15.4
2
19.1
1
15140
18190
23290
32080
39740
Word
Processo
rs and T
ypists(4
39022)
60
23.6
13.4
7
28010
4
9.8
9
10.6
3
11.8
5
15.0
5
20.8
2
20570
22110
24660
31290
43300
Insu
rance C
laims an
d Po
licy Processin
g C
lerks(439041)
260
35
15.0
7
31350
7.1
9.0
5
10.4
7
13.4
6
15.9
2
23.3
1
18830
21770
28000
33110
48480
Mail C
lerks and M
ail Mach
ine O
perato
rs Excep
t Posta
l Service(4
39051)
120
28.9
14.0
8
29290
8
7.7
5
9.1
5
12.3
4
19.0
9
23.0
6
16120
19030
25660
39700
47960
Office C
lerks Gen
eral(439061)
6300
5.3
11.4
1
23730
2.1
6.8
5
8.2
3
10.3
2
13.6
7
16.9
14240
17110
21470
28430
35160
Office M
achin
e Operato
rs Excep
t Com
puter(4
39071)
60
43.1
13.3
5
27770
6.1
9.1
3
10.2
7
12.6
9
15.3
8
19.4
7
19000
21350
26390
31990
40500
Statistical A
ssistants(4
39111)
(8)-
(8)-
15.2
7
31770
3.8
13.0
6
13.7
5
14.9
1
16.2
18.6
9
27160
28610
31010
33690
38870
Office an
d A
dm
inistrative S
upport W
orkers A
ll Oth
er(439199)
(8)-
(8)-
16.9
2
35200
2.7
12.8
1
13.5
7
14.8
2
18.6
9
27.0
6
26640
28230
30830
38870
56290
Farmin
g Fish
ing an
d Fo
restry Occu
patio
ns(4
50000)
90
26.4
13.0
5
27140
8.8
7.6
5
10.0
2
13.1
4
15.7
2
18.5
6
15920
20840
27340
32700
38610
Farmw
orkers an
d Lab
orers C
rop N
ursery an
d G
reenhouse(4
52092)
50
38
11.2
1
23310
13.5
7.0
8
8.1
7
10.9
7
13.0
4
17.2
5
14720
17000
22820
27120
35880
Constru
ction an
d E
xtraction O
ccupatio
ns(4
70000)
16690
4.6
25.1
2
52250
2.1
11.5
6
15.9
5
25.6
33.9
7
38.9
6
24050
33180
53250
70660
81050
First-Line S
uperviso
rs/Manag
ers of C
onstru
ction T
rades an
d E
xtraction
Workers(4
71011)
1130
8.1
34.5
71760
2.8
20.3
9
26.2
33.7
6
41.1
7
50.3
5
42410
54490
70230
85640
104730
Boilerm
akers(472011)
460
20.8
27.7
9
57810
3.3
22.3
25.4
7
28.5
5
30.8
3
32.6
46390
52970
59390
64130
67800
Brickm
asons an
d B
lockm
asons(4
72021)
620
14.5
26.6
4
55410
8.5
16.6
8
19.5
9
26.6
30.9
2
38.6
7
34700
40740
55330
64310
80440
Carp
enters(4
72031)
3210
11
21.2
9
44280
6.3
10.4
3
12.5
18.9
1
30.2
5
37.5
21690
26010
39330
62920
78000
Cem
ent M
asons an
d C
oncrete Fin
ishers(4
72051)
700
22.8
23.4
8
48840
9.7
13.6
7
15.2
3
20.2
1
33.8
3
37.7
9
28440
31680
42040
70370
78610
Constru
ction Lab
orers(4
72061)
1830
11.3
21.0
1
43700
5.7
9.2
5
12.7
5
22.2
4
28.8
4
31.6
2
19240
26510
46260
59980
65770
Paving S
urfacin
g an
d T
ampin
g E
quip
men
t Operato
rs(472071)
70
28.8
18.3
2
38100
6.6
13.2
7
14.3
9
16.9
8
20.0
4
24.1
6
27600
29920
35310
41670
50260
Operatin
g E
ngin
eers and O
ther C
onstru
ction E
quip
men
t Operato
rs(472073)
890
15.7
29.4
8
61320
6
16.9
6
20.2
1
32.2
2
36.8
3
39.5
7
35280
42040
67010
76620
82310
Dryw
all and C
eiling T
ile Installers(4
72081)
(8)-
(8)-
20.2
5
42110
4.9
15.9
18.5
5
20.9
22.8
9
24.1
3
33060
38590
43470
47620
50180
Electrician
s(472111)
1940
12.2
30.3
8
63200
3.1
18.8
25.5
5
32.7
3
36.9
2
39.4
8
39110
53140
68070
76790
82110
Insu
lation W
orkers Flo
or C
eiling an
d W
all(472131)
150
38.2
18.1
6
37760
4.3
11.3
4
13.7
4
17.2
7
21.8
2
26.0
6
23580
28590
35920
45380
54210
Insu
lation W
orkers M
echanical(4
72132)
210
37.8
26.5
55110
14.9
12.6
4
18.7
9
28.4
2
34.6
3
38.5
4
26290
39080
59110
72030
80160
Painters C
onstru
ction an
d M
ainten
ance(4
72141)
320
20.6
13.8
5
28800
9.1
8.2
3
9.1
11.8
8
17.9
9
22.7
8
17120
18920
24720
37420
47380
Plum
bers Pip
efitters and S
teamfitters(4
72152)
1680
25.9
32.4
7
67540
2.9
19.1
2
27.0
2
33.8
5
39.4
5
44.0
4
39770
56190
70400
82060
91610
Rein
forcin
g Iro
n an
d R
ebar W
orkers(4
72171)
(8)-
(8)-
21.5
2
44760
6.2
8.0
5
17.6
2
22.4
2
25.6
2
32.1
3
16750
36650
46630
53300
66820
Roofers(4
72181)
410
23.1
22.0
9
45940
9.7
13.0
3
14.5
7
19.3
5
30.9
9
35.6
8
27100
30300
40250
64450
74210
Sheet M
etal Workers(4
72211)
430
35.1
29.6
61560
3.4
15.9
5
21.5
8
33.7
4
37.5
1
39.8
2
33170
44890
70170
78020
82820
Stru
ctural Iro
n an
d S
teel Workers(4
72221)
520
19
30.1
2
62640
3.7
18.1
2
27.2
8
32.2
36.0
4
38.8
5
37690
56750
66970
74970
80810
Help
ers--Carp
enters(4
73012)
290
42.1
10.8
8
22620
7.3
7.4
7
8.5
6
10.4
2
13.6
3
15.1
3
15550
17800
21670
28350
31470
Help
ers--Electrician
s(473013)
40
6.9
11.8
9
24720
2.8
9.2
10.6
6
11.9
7
13.5
5
14.9
7
19140
22170
24900
28190
31130
Help
ers--Pipelayers Plu
mbers Pip
efitters and S
teamfitters(4
73015)
120
48.3
(8
)- (8
)- (8
)- (8
)- (8
)- (8
)- (8
)- (8
)- (8
)- (8
)- (8
)- (8
)- (8
)-

TH
E G
AR
Y/
CH
ICA
GO
IN
TER
NA
TIO
NA
L A
IRP
OR
T
STR
AT
EG
IC B
US
INES
S P
LA
N
FIN
AL
Landru
m &
Bro
wn
I-10
April 2010
Hel
per
s--R
oofe
rs(4
73016)
(8)-
(8
)-
10.3
4
21500
12.1
8.0
9
8.6
2
9.5
12.0
4
14.3
4
16830
17930
19770
25040
29840
Hel
per
s Const
ruct
ion T
rades
All
Oth
er(4
73019)
50
48.7
14.1
8
29480
14.6
6.7
2
7.8
3
12.9
1
21.3
4
24.1
4
13980
16290
26850
44380
50210
Const
ruct
ion a
nd B
uild
ing I
nsp
ecto
rs(4
74011)
100
11.8
19.0
5
39620
2.8
13.0
5
15.0
5
18
20.6
9
27.9
2
27130
31300
37450
43030
58080
Haz
ardous
Mat
eria
ls R
emova
l W
ork
ers(
474041)
220
22.5
22.9
4
47710
7.6
12.9
4
15.5
2
25.6
1
28.8
30.7
7
26920
32290
53280
59910
64000
Hig
hw
ay M
ainte
nan
ce W
ork
ers(
474051)
430
28.3
14.4
5
30050
2
10.5
3
12.1
3
14.3
5
16.3
2
19.1
7
21900
25230
29850
33950
39880
Sep
tic
Tan
k Ser
vice
rs a
nd S
ewer
Pip
e Cle
aner
s(474071)
150
29.6
17.3
5
36080
3.8
11.0
9
13.6
1
17.0
7
21.6
4
24.2
23060
28310
35500
45000
50330
Ear
th D
rille
rs E
xcep
t O
il an
d G
as(4
75021)
70
45.6
(8
)-
(8)-
(8
)-
(8)-
(8
)-
(8)-
(8
)-
(8)-
(8
)-
(8)-
(8
)-
(8)-
(8
)-
Inst
alla
tion M
ainte
nan
ce a
nd R
epai
r O
ccupat
ions(
490000)
16240
6
22.0
2
45790
3
10.5
4
15.2
7
21.9
3
27.6
1
33.1
9
21930
31770
45610
57420
69040
Firs
t-Li
ne
Super
viso
rs/M
anag
ers
of
Mec
han
ics
Inst
alle
rs a
nd R
epai
rers
(491011)
1220
6.2
31.1
5
64790
4.6
18.7
9
22.8
1
29.2
3
37.5
3
45.9
4
39090
47450
60790
78070
95550
Com
pute
r Auto
mat
ed T
elle
r an
d O
ffic
e M
achin
e Rep
aire
rs(4
92011)
90
39.2
18.9
2
39360
6.4
13.0
8
15.6
6
17.6
7
20.5
28.5
2
27200
32580
36760
42640
59310
Tel
ecom
munic
atio
ns
Equip
men
t In
stal
lers
and R
epai
rers
Exc
ept
Line
Inst
alle
rs(4
92022)
420
23.9
28.2
2
58690
3.2
26.0
8
27.3
1
29.1
6
31.0
2
32.1
4
54260
56800
60660
64520
66860
Ele
ctri
c M
oto
r Po
wer
Tool an
d R
elat
ed R
epai
rers
(492092)
(8)-
(8
)-
20.7
7
43200
27.5
13.2
1
14.0
3
15.4
29.3
4
37.8
9
27480
29180
32040
61030
78810
Ele
ctri
cal an
d E
lect
ronic
s Rep
aire
rs C
om
mer
cial
and I
ndust
rial
Equip
men
t(492094)
90
34.1
24.2
7
50470
3.1
17.6
2
20.9
4
24.9
9
28.2
30.3
4
36650
43540
51980
58650
63100
Ele
ctri
cal an
d E
lect
ronic
s Rep
aire
rs P
ow
erhouse
Subst
atio
n a
nd R
elay
(492095)
70
34.2
30.5
1
63460
3.1
24.6
2
27.4
30.6
9
35.1
1
38.4
4
51200
56990
63840
73020
79960
Ele
ctro
nic
Equip
men
t In
stal
lers
and R
epai
rers
Moto
r Veh
icle
s(492096)
40
35.6
14.9
7
31140
6.5
10.3
4
11.9
7
14.5
3
17.5
9
20.3
1
21510
24900
30220
36590
42240
Ele
ctro
nic
Hom
e Ente
rtai
nm
ent
Equip
men
t In
stal
lers
and R
epai
rers
(492097)
(8)-
(8
)-
10.2
8
21390
4.2
7.9
6
8.5
9.3
9
11.4
2
14.4
9
16560
17670
19530
23760
30150
Sec
uri
ty a
nd F
ire
Ala
rm S
yste
ms
Inst
alle
rs(4
92098)
50
21.8
16.1
3
33550
5.8
7.0
7
9.7
5
14.6
4
19.1
8
30.0
1
14710
20280
30440
39900
62410
Air
craf
t M
echan
ics
and S
ervi
ce T
echnic
ians(
493011)
50
22.3
25.1
1
52230
7.5
16.0
7
18.6
7
24.8
5
30.3
1
36.8
4
33430
38840
51680
63040
76630
Auto
motive
Body
and R
elat
ed R
epai
rers
(493021)
410
15.9
25.7
5
53560
21.4
10.0
9
12.9
4
22.8
8
38.9
6
47.4
20990
26920
47580
81030
98600
Auto
motive
Ser
vice
Tec
hnic
ians
and M
echan
ics(
493023)
1340
10.7
17.3
7
36120
4.7
8.3
3
11.0
2
16
22.6
5
29.4
7
17320
22920
33290
47110
61290
Bus
and T
ruck
Mec
han
ics
and D
iese
l Engin
e Spec
ialis
ts(4
93031)
820
10.4
20.3
7
42360
3.1
12.5
2
15.9
2
20.6
5
24.5
4
28.6
26030
33110
42950
51040
59480
Mobile
Hea
vy E
quip
men
t M
echan
ics
Exc
ept
Engin
es(4
93042)
240
15.4
26.0
6
54210
5.2
14.6
19.1
4
27.5
5
31.3
36.8
2
30380
39800
57300
65100
76580
Rai
l Car
Rep
aire
rs(4
93043)
(8)-
(8
)-
22.0
6
45890
3.2
19.6
9
20.5
4
22.1
2
23.7
24.6
5
40950
42730
46010
49290
51260
Moto
rboat
Mec
han
ics(
493051)
110
42.6
14.8
3
30840
6.2
12.5
8
13.2
4
14.2
6
15.2
9
21.1
2
26170
27540
29670
31800
43930
Outd
oor
Pow
er E
quip
men
t an
d O
ther
Sm
all Engin
e M
echan
ics(
493053)
160
25.8
12.3
5
25690
6.5
7.8
3
10.4
3
12.7
5
14.6
16.0
6
16280
21680
26510
30380
33400
Tir
e Rep
aire
rs a
nd C
han
ger
s(493093)
200
41.9
11.4
7
23850
11.5
7.9
9
8.7
1
9.8
9
14.3
4
17.8
9
16620
18120
20580
29840
37210
Contr
ol an
d V
alve
Inst
alle
rs a
nd R
epai
rers
Exc
ept
Mec
han
ical
Doo
r(499012)
210
43.1
23.6
2
49140
7.3
12.4
3
15.9
5
26.5
9
29.5
3
31.2
9
25860
33170
55310
61410
65080
Hea
ting A
ir C
onditio
nin
g a
nd R
efri
ger
atio
n M
echan
ics
and I
nst
alle
rs(4
99021)
570
30.2
20.8
1
43280
6.2
13.4
15.1
5
19.3
9
24.1
3
33.2
27870
31510
40330
50180
69050
Hom
e Applia
nce
Rep
aire
rs(4
99031)
(8)-
(8
)-
14.5
9
30350
4.1
9.8
2
11.3
1
15.2
6
17.7
7
19.2
4
20420
23530
31740
36960
40030
Indust
rial
Mac
hin
ery
Mec
han
ics(
499041)
970
12.2
23.6
4
49160
5
15.8
2
20
24.7
2
28.2
5
30.3
7
32910
41600
51420
58750
63170
Mai
nte
nan
ce a
nd R
epai
r W
ork
ers
Gen
eral
(499042)
6580
12.4
22.7
9
47410
5
11.9
6
17.9
1
22.7
1
27
33.2
1
24870
37250
47240
56160
69070
Mai
nte
nan
ce W
ork
ers
Mac
hin
ery(
499043)
180
37.8
21.9
6
45670
4.6
12.3
1
16.3
5
21.8
28.4
9
30.9
3
25600
34020
45340
59260
64330
Mill
wri
ghts
(499044)
420
20.6
27.2
7
56720
4.9
17.8
6
22.9
3
28.2
32.2
1
36.6
5
37150
47700
58660
66990
76230
Ref
ract
ory
Mat
eria
ls R
epai
rers
Exc
ept
Bri
ckm
asons(
499045)
180
41.2
19.8
2
41230
10.5
13.8
4
15.8
5
19.2
22.8
2
25.4
4
28780
32980
39940
47460
52910
Tel
ecom
munic
atio
ns
Line
Inst
alle
rs a
nd R
epai
rers
(499052)
50
49.3
19.0
1
39530
3.4
13.9
1
15.7
8
18.4
2
22.2
6
24.9
2
28940
32820
38300
46290
51840
Med
ical
Equip
men
t Rep
aire
rs(4
99062)
(8)-
(8
)-
15.8
4
32940
14.4
10.8
2
11.9
6
14.2
19.9
4
24.4
8
22510
24870
29530
41480
50910
Coin
Ven
din
g a
nd A
muse
men
t M
achin
e Ser
vice
rs a
nd R
epai
rers
(499091)
120
33.7
16.8
34940
2.2
13.6
5
15.4
4
16.8
5
18.3
5
19.2
9
28380
32120
35050
38180
40130
Hel
per
s--I
nst
alla
tion M
ainte
nan
ce a
nd R
epai
r W
ork
ers(
499098)
160
19.7
13.4
4
27960
5
7.4
7
9.2
7
12.2
4
16.1
2
22.6
15540
19280
25460
33520
47020
Inst
alla
tion M
ainte
nan
ce a
nd R
epai
r W
ork
ers
All
Oth
er(4
99099)
370
10.9
10.8
2
22490
6.4
6.9
8
9.2
8
11.6
9
18.4
4
14350
16650
19310
24320
38350
Product
ion O
ccupat
ions(
510000)
23240
4.5
19.1
7
39860
2.8
9.3
9
13.1
4
18.2
3
24.2
6
30.1
9
19520
27320
37910
50460
62790
Firs
t-Li
ne
Super
viso
rs/M
anag
ers
of
Product
ion a
nd O
per
atin
g W
ork
ers(
511011)
1830
5.6
29.7
1
61790
2.6
16.1
9
22.4
2
28.6
9
35.8
9
43.7
9
33670
46640
59680
74650
91090
Coil
Win
der
s Tap
ers
and F
inis
her
s(512021)
80
46.3
(8
)-
(8)-
(8
)-
(8)-
(8
)-
(8)-
(8
)-
(8)-
(8
)-
(8)-
(8
)-
(8)-
(8
)-
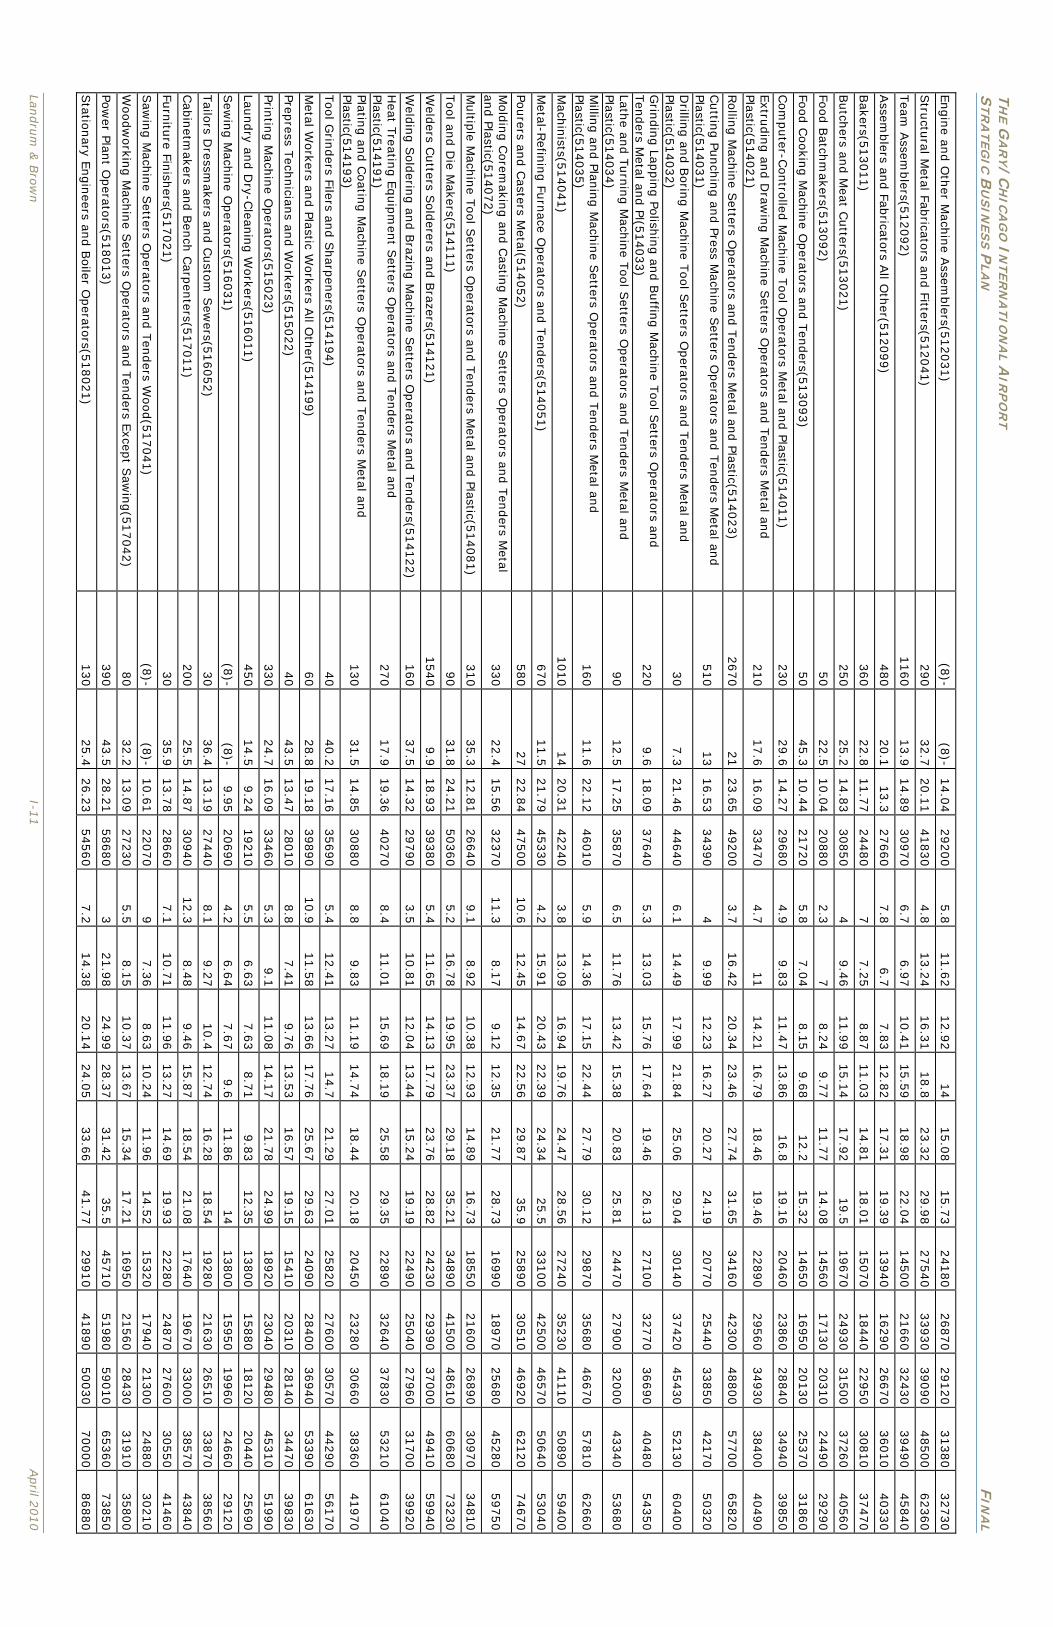
TH
E G
AR
Y/C
HIC
AG
O I
NTER
NA
TIO
NA
L AIR
PO
RT
STR
AT
EG
IC B
US
INES
S P
LA
N
FIN
AL
Landru
m &
Bro
wn
I-11
April 2
010
Engin
e and O
ther M
achin
e Assem
blers(5
12031)
(8)-
(8)-
14.0
4
29200
5.8
11.6
2
12.9
2
14
15.0
8
15.7
3
24180
26870
29120
31380
32730
Stru
ctural M
etal Fabricato
rs and Fitters(5
12041)
290
32.7
20.1
1
41830
4.8
13.2
4
16.3
1
18.8
23.3
2
29.9
8
27540
33930
39090
48500
62360
Team
Assem
blers(5
12092)
1160
13.9
14.8
9
30970
6.7
6.9
7
10.4
1
15.5
9
18.9
8
22.0
4
14500
21660
32430
39490
45840
Assem
blers an
d Fab
ricators A
ll Oth
er(512099)
480
20.1
13.3
27660
7.8
6.7
7.8
3
12.8
2
17.3
1
19.3
9
13940
16290
26670
36010
40330
Bakers(5
13011)
360
22.8
11.7
7
24480
7
7.2
5
8.8
7
11.0
3
14.8
1
18.0
1
15070
18440
22950
30810
37470
Butch
ers and M
eat Cutters(5
13021)
250
25.2
14.8
3
30850
4
9.4
6
11.9
9
15.1
4
17.9
2
19.5
19670
24930
31500
37260
40560
Food B
atchm
akers(513092)
50
22.5
10.0
4
20880
2.3
7
8.2
4
9.7
7
11.7
7
14.0
8
14560
17130
20310
24490
29290
Food C
ookin
g M
achin
e Operato
rs and T
enders(5
13093)
50
45.3
10.4
4
21720
5.8
7.0
4
8.1
5
9.6
8
12.2
15.3
2
14650
16950
20130
25370
31860
Com
puter-C
ontro
lled M
achin
e Tool O
perato
rs Metal an
d Plastic(5
14011)
230
29.6
14.2
7
29680
4.9
9.8
3
11.4
7
13.8
6
16.8
19.1
6
20460
23860
28840
34940
39850
Extru
din
g an
d D
rawin
g M
achin
e Setters O
perato
rs and T
enders M
etal and
Plastic(514021)
210
17.6
16.0
9
33470
4.7
11
14.2
1
16.7
9
18.4
6
19.4
6
22890
29560
34930
38400
40490
Rollin
g M
achin
e Setters O
perato
rs and T
enders M
etal an
d Plastic(5
14023)
2670
21
23.6
5
49200
3.7
16.4
2
20.3
4
23.4
6
27.7
4
31.6
5
34160
42300
48800
57700
65820
Cuttin
g Pu
nch
ing an
d Press M
achin
e Setters O
perato
rs and T
enders M
etal and
Plastic(514031)
510
13
16.5
3
34390
4
9.9
9
12.2
3
16.2
7
20.2
7
24.1
9
20770
25440
33850
42170
50320
Drillin
g an
d B
orin
g M
achin
e Tool S
etters Operato
rs and T
enders M
etal and
Plastic(514032)
30
7.3
21.4
6
44640
6.1
14.4
9
17.9
9
21.8
4
25.0
6
29.0
4
30140
37420
45430
52130
60400
Grin
din
g Lap
pin
g Po
lishin
g an
d B
uffin
g M
achin
e Tool S
etters Operato
rs and
Ten
ders M
etal an
d Pl(5
14033)
220
9.6
18.0
9
37640
5.3
13.0
3
15.7
6
17.6
4
19.4
6
26.1
3
27100
32770
36690
40480
54350
Lathe an
d T
urn
ing M
achin
e Tool S
etters Operato
rs and T
enders M
etal and
Plastic(514034)
90
12.5
17.2
5
35870
6.5
11.7
6
13.4
2
15.3
8
20.8
3
25.8
1
24470
27900
32000
43340
53680
Millin
g an
d Plan
ing M
achin
e Setters O
perato
rs and T
enders M
etal and
Plastic(514035)
160
11.6
22.1
2
46010
5.9
14.3
6
17.1
5
22.4
4
27.7
9
30.1
2
29870
35680
46670
57810
62660
Mach
inists(5
14041)
1010
14
20.3
1
42240
3.8
13.0
9
16.9
4
19.7
6
24.4
7
28.5
6
27240
35230
41110
50890
59400
Metal-R
efinin
g Fu
rnace O
perato
rs and T
enders(5
14051)
670
11.5
21.7
9
45330
4.2
15.9
1
20.4
3
22.3
9
24.3
4
25.5
33100
42500
46570
50640
53040
Pourers an
d C
asters Metal(5
14052)
580
27
22.8
4
47500
10.6
12.4
5
14.6
7
22.5
6
29.8
7
35.9
25890
30510
46920
62120
74670
Mold
ing C
orem
aking an
d C
asting M
achin
e Setters O
perato
rs and T
enders M
etal
and Plastic(5
14072)
330
22.4
15.5
6
32370
11.3
8.1
7
9.1
2
12.3
5
21.7
7
28.7
3
16990
18970
25680
45280
59750
Multip
le Mach
ine T
ool S
etters Operato
rs and T
enders M
etal and Plastic(5
14081)
310
35.3
12.8
1
26640
9.1
8.9
2
10.3
8
12.9
3
14.8
9
16.7
3
18550
21600
26890
30970
34810
Tool an
d D
ie Makers(5
14111)
90
31.8
24.2
1
50360
5.2
16.7
8
19.9
5
23.3
7
29.1
8
35.2
1
34890
41500
48610
60680
73230
Weld
ers Cutters S
old
erers and B
razers(514121)
1540
9.9
18.9
3
39380
5.4
11.6
5
14.1
3
17.7
9
23.7
6
28.8
2
24230
29390
37000
49410
59940
Weld
ing S
olderin
g an
d B
razing M
achin
e Setters O
perato
rs and T
enders(5
14122)
160
37.5
14.3
2
29790
3.5
10.8
1
12.0
4
13.4
4
15.2
4
19.1
9
22490
25040
27960
31700
39920
Heat T
reating E
quip
men
t Setters O
perato
rs and T
enders M
etal and
Plastic(514191)
270
17.9
19.3
6
40270
8.4
11.0
1
15.6
9
18.1
9
25.5
8
29.3
5
22890
32640
37830
53210
61040
Plating an
d C
oatin
g M
achin
e Setters O
perato
rs and T
enders M
etal an
d
Plastic(514193)
130
31.5
14.8
5
30880
8.8
9.8
3
11.1
9
14.7
4
18.4
4
20.1
8
20450
23280
30660
38360
41970
Tool G
rinders Filers an
d S
harp
eners(5
14194)
40
40.2
17.1
6
35690
5.4
12.4
1
13.2
7
14.7
21.2
9
27.0
1
25820
27600
30570
44290
56170
Metal W
orkers an
d Plastic W
orkers A
ll Oth
er(514199)
60
28.8
19.1
8
39890
10.9
11.5
8
13.6
6
17.7
6
25.6
7
29.6
3
24090
28400
36940
53390
61630
Prepress T
echnician
s and W
orkers(5
15022)
40
43.5
13.4
7
28010
8.8
7.4
1
9.7
6
13.5
3
16.5
7
19.1
5
15410
20310
28140
34470
39830
Printin
g M
achin
e Operato
rs(515023)
330
24.7
16.0
9
33460
5.3
9.1
11.0
8
14.1
7
21.7
8
24.9
9
18920
23040
29480
45310
51990
Laundry an
d D
ry-Clean
ing W
orkers(5
16011)
450
14.5
9.2
4
19210
5.5
6.6
3
7.6
3
8.7
1
9.8
3
12.3
5
13800
15880
18120
20440
25690
Sew
ing M
achin
e Operato
rs(516031)
(8)-
(8)-
9.9
5
20690
4.2
6.6
4
7.6
7
9.6
11.8
6
14
13800
15950
19960
24660
29120
Tailo
rs Dressm
akers and C
usto
m S
ewers(5
16052)
30
36.4
13.1
9
27440
8.1
9.2
7
10.4
12.7
4
16.2
8
18.5
4
19280
21630
26510
33870
38560
Cab
inetm
akers and B
ench
Carp
enters(5
17011)
200
25.5
14.8
7
30940
12.3
8.4
8
9.4
6
15.8
7
18.5
4
21.0
8
17640
19670
33000
38570
43840
Furn
iture Fin
ishers(5
17021)
30
35.9
13.7
8
28660
7.1
10.7
1
11.9
6
13.2
7
14.6
9
19.9
3
22280
24870
27600
30550
41460
Saw
ing M
achin
e Setters O
perato
rs and T
enders W
ood(5
17041)
(8)-
(8)-
10.6
1
22070
9
7.3
6
8.6
3
10.2
4
11.9
6
14.5
2
15320
17940
21300
24880
30210
Woodw
orkin
g M
achin
e Setters O
perato
rs and T
enders E
xcept S
awin
g(5
17042)
80
32.2
13.0
9
27230
5.5
8.1
5
10.3
7
13.6
7
15.3
4
17.2
1
16950
21560
28430
31910
35800
Pow
er Plant O
perato
rs(518013)
390
43.5
28.2
1
58680
3
21.9
8
24.9
9
28.3
7
31.4
2
35.5
45710
51980
59010
65360
73850
Statio
nary E
ngin
eers and B
oiler O
perato
rs(518021)
130
25.4
26.2
3
54560
7.2
14.3
8
20.1
4
24.0
5
33.6
6
41.7
7
29910
41890
50030
70000
86880

TH
E G
AR
Y/
CH
ICA
GO
IN
TER
NA
TIO
NA
L A
IRP
OR
T
STR
AT
EG
IC B
US
INES
S P
LA
N
FIN
AL
Landru
m &
Bro
wn
I-12
April 2010
Wat
er a
nd L
iquid
Was
te T
reat
men
t Pl
ant
and S
yste
m O
per
ators
(518031)
230
13.9
20.7
2
43100
5.3
13.6
8
15.9
5
19.3
7
23.7
5
29.0
9
28450
33170
40300
49410
60500
Chem
ical
Pla
nt
and S
yste
m O
per
ators
(518091)
110
30.8
20.4
42430
2.8
16.4
3
18.1
20.9
2
23.4
6
24.9
9
34180
37640
43520
48800
51970
Gas
Pla
nt
Oper
ators
(518092)
(8)-
(8
)-
24.3
5
50640
3.4
19
21.7
3
24.3
6
27.6
4
30.6
5
39510
45210
50670
57500
63740
Chem
ical
Equip
men
t O
per
ators
and T
ender
s(519011)
90
49.5
23.1
8
48220
3.2
20.0
4
21.1
5
22.9
9
24.9
3
28.4
6
41690
43990
47830
51850
59200
Sep
arat
ing F
ilter
ing C
larify
ing P
reci
pitat
ing a
nd S
till
Mac
hin
e Set
ters
Oper
ators
an
d T
ender
s(519012)
40
39.3
25.2
4
52510
8.5
18.5
2
24
26.5
1
28.7
5
30.1
38530
49930
55130
59810
62610
Cru
shin
g G
rindin
g a
nd P
olis
hin
g M
achin
e Set
ters
Oper
ators
and T
ender
s(519021)
260
8.7
22.3
9
46570
5.2
13.5
1
20.3
23.0
9
26.6
4
29.8
5
28090
42230
48020
55410
62090
Gri
ndin
g a
nd P
olis
hin
g W
ork
ers
Han
d(5
19022)
100
26
14.8
3
30840
4.5
8.7
7
9.9
8
16.3
5
18.5
8
19.9
7
18240
20770
34010
38640
41550
Mix
ing a
nd B
lendin
g M
achin
e Set
ters
Oper
ators
and T
ender
s(519023)
390
22.9
17.5
8
36580
3.3
9.2
9
14.4
5
17.8
21.6
1
24.6
7
19330
30050
37030
44950
51320
Cutt
ing a
nd S
licin
g M
achin
e Set
ters
Oper
ators
and T
ender
s(519032)
200
26.3
15.1
4
31490
5.6
9.4
3
11.4
15.8
18.3
2
20.3
6
19600
23700
32860
38100
42350
Ext
rudin
g F
orm
ing P
ress
ing a
nd C
om
pact
ing M
achin
e Set
ters
Oper
ators
and
Ten
der
s(519041)
230
41.8
14.7
1
30590
5.5
10.5
1
11.9
8
14.4
2
17.0
2
20.3
21860
24920
30000
35400
42230
Furn
ace
Kiln
Ove
n D
rier
and K
ettle
Oper
ators
and T
ender
s(519051)
(8)-
(8
)-
18.7
9
39080
17.3
10.6
7
12.6
5
17.4
5
25.7
7
29.2
3
22190
26310
36290
53590
60790
Insp
ecto
rs T
este
rs S
ort
ers
Sam
ple
rs a
nd W
eigher
s(519061)
1550
4.3
18.4
7
38420
4.4
12.3
3
16.2
6
18.0
6
19.8
7
26.7
6
25650
33810
37560
41320
55660
Jew
eler
s an
d P
reci
ous
Sto
ne
and M
etal
Work
ers(
519071)
60
43
15.8
4
32950
11.4
6.5
5
7.4
4
14.2
2
23.2
3
28.4
6
13620
15470
29570
48320
59190
Den
tal La
bora
tory
Tec
hnic
ians(
519081)
(8)-
(8
)-
16.9
3
35210
5.7
11.2
2
13.7
1
16.3
7
19.4
23.5
23340
28520
34050
40350
48880
Pack
agin
g a
nd F
illin
g M
achin
e O
per
ators
and T
ender
s(519111)
720
11.5
13.3
3
27720
5.7
8.2
2
9.7
1
12.0
9
16.9
19.2
17100
20200
25150
35160
39940
Coat
ing P
ainting a
nd S
pra
ying M
achin
e Set
ters
Oper
ators
and T
ender
s(519121)
210
13.9
13.3
2
27720
4.3
8.7
1
10.1
3
12.6
7
15.6
19.2
3
18120
21060
26360
32440
40000
Pain
ters
Tra
nsp
ort
atio
n E
quip
men
t(519122)
130
18.7
22.5
4
46890
11.6
13.5
9
16.9
1
19.5
2
29.3
36.4
7
28280
35170
40610
60950
75850
Pain
ting C
oat
ing a
nd D
ecora
ting W
ork
ers(
519123)
(8)-
(8
)-
9.5
6
19880
3.9
6.4
6
7.2
6
9.9
4
11.6
6
12.7
3
13430
15100
20680
24250
26490
Photo
gra
phic
Pro
cess
ing M
achin
e O
per
ators
(519132)
80
36.2
10.4
21620
4.6
7.4
8.3
5
9.8
11.8
1
15.4
6
15400
17380
20380
24560
32170
Hel
per
s--P
roduct
ion W
ork
ers(
519198)
1010
6.9
13.5
8
28240
7.8
8.0
2
9
12.4
9
15.9
4
23.1
2
16670
18720
25980
33150
48080
Product
ion W
ork
ers
All
Oth
er(5
19199)
160
8
18.4
1
38290
6.8
9.5
9
12.2
7
18.0
3
23.8
9
28.8
4
19940
25530
37510
49690
59990
Tra
nsp
ort
atio
n a
nd M
ater
ial M
ovi
ng O
ccupat
ions(
530000)
26400
3.8
17.1
5
35670
2.4
7.8
5
11.1
3
16.1
4
21.8
1
28.0
8
16330
23160
33560
45370
58410
Firs
t-Li
ne
Super
viso
rs/M
anag
ers
of
Hel
per
s La
bore
rs a
nd M
ater
ial M
ove
rs
Han
d(5
31021)
410
15
23.5
7
49030
5.8
9.5
5
17.3
23.7
5
28.8
8
35.0
1
19860
35990
49410
60060
72820
Firs
t-Li
ne
Super
viso
rs/M
anag
ers
of
Tra
nsp
ort
atio
n a
nd M
ater
ial-
Movi
ng M
achin
e an
d V
ehic
le O
per
ators
(531031)
600
7.6
27.0
4
56250
3.1
16.3
5
20.7
26.1
5
31.8
3
38.3
2
34020
43050
54390
66210
79700
Com
mer
cial
Pilo
ts(5
32012)
60
22.4
(8
)-
(8)-
(8
)-
(8)-
(8
)-
(8)-
(8
)-
(8)-
(8
)-
(8)-
(8
)-
(8)-
(8
)-
Am
bula
nce
Dri
vers
and A
tten
dan
ts E
xcep
t Em
ergen
cy M
edic
al
Tec
hnic
ians(
533011)
(8)-
(8
)-
11.3
23500
3.3
7.9
7
9.3
6
11.2
12.7
1
15.3
7
16590
19470
23290
26440
31970
Bus
Drive
rs T
ransi
t an
d I
nte
rcity(
533021)
(8)-
(8
)-
9.2
5
19250
7.6
6.2
7
6.7
3
7.4
9
12.4
5
14.5
8
13040
13990
15590
25890
30320
Bus
Drive
rs S
chool(
533022)
1460
24.8
13.3
2
27700
6
6.6
2
7.6
1
13.7
16
19.4
7
13770
15830
28490
33280
40490
Dri
ver/
Sal
es W
ork
ers(
533031)
550
14.5
16.7
4
34820
11.7
7.6
7
9.6
3
17.1
5
20.4
6
27.9
15940
20020
35670
42550
58030
Tru
ck D
rive
rs H
eavy
and T
ract
or-
Tra
iler(
533032)
6930
4.9
20.1
1
41830
2.6
12.2
3
15.0
7
19.0
5
24.9
4
30.1
5
25440
31340
39630
51880
62720
Tru
ck D
rive
rs L
ight
or
Del
iver
y Ser
vice
s(533033)
1680
10.1
12.9
1
26850
5.4
6.9
8
8.5
1
11.6
5
15.6
1
20.5
1
14520
17700
24240
32460
42650
Tax
i D
rive
rs a
nd C
hau
ffeu
rs(5
33041)
340
12.7
9.9
3
20660
6.4
6.7
7.7
4
9.1
9
12.2
3
14.7
5
13940
16100
19110
25450
30680
Moto
r Veh
icle
Oper
ators
All
Oth
er(5
33099)
250
33.9
(8
)-
(8)-
(8
)-
(8)-
(8
)-
(8)-
(8
)-
(8)-
(8
)-
(8)-
(8
)-
(8)-
(8
)-
Sai
lors
and M
arin
e O
ilers
(535011)
140
37.9
15.2
9
31790
5.8
9.8
1
10.7
9
13.0
1
18.4
3
26.3
6
20410
22440
27070
38330
54820
Cap
tain
s M
ates
and P
ilots
of
Wat
er V
esse
ls(5
35021)
40
47.3
35.8
8
74630
5.1
23
28.3
9
37.0
4
45.0
2
48.9
6
47850
59060
77030
93630
101840
Park
ing L
ot
Att
endan
ts(5
36021)
120
21.5
8.9
5
18610
3.8
6.4
1
7.0
9
8.1
7
9.7
13.0
2
13340
14750
16990
20170
27090
Ser
vice
Sta
tion A
tten
dan
ts(5
36031)
210
29.7
8.2
6
17180
13.4
6.2
1
6.5
9
7.2
2
8.3
12.4
8
12920
13710
15030
17260
25960
Conve
yor
Oper
ators
and T
ender
s(537011)
80
41.7
18.7
4
38970
3.1
13.8
4
16.5
8
18.3
20
25.7
1
28790
34490
38070
41590
53480
Cra
ne
and T
ow
er O
per
ators
(537021)
(8)-
(8
)-
19.5
6
40680
4.7
16.2
17.1
7
18.7
6
20.6
4
26
33700
35700
39020
42920
54090
Exc
avat
ing a
nd L
oad
ing M
achin
e an
d D
raglin
e O
per
ators
(537032)
80
28
20.0
5
41710
11.6
11.0
7
14.1
7
21.3
8
24.3
5
29.4
4
23020
29470
44460
50660
61230
Indust
rial
Tru
ck a
nd T
ract
or
Oper
ators
(537051)
2960
18.4
20.9
7
43630
3.5
13.1
7
16.8
9
21.1
6
25.3
9
29.4
2
27400
35130
44020
52810
61200
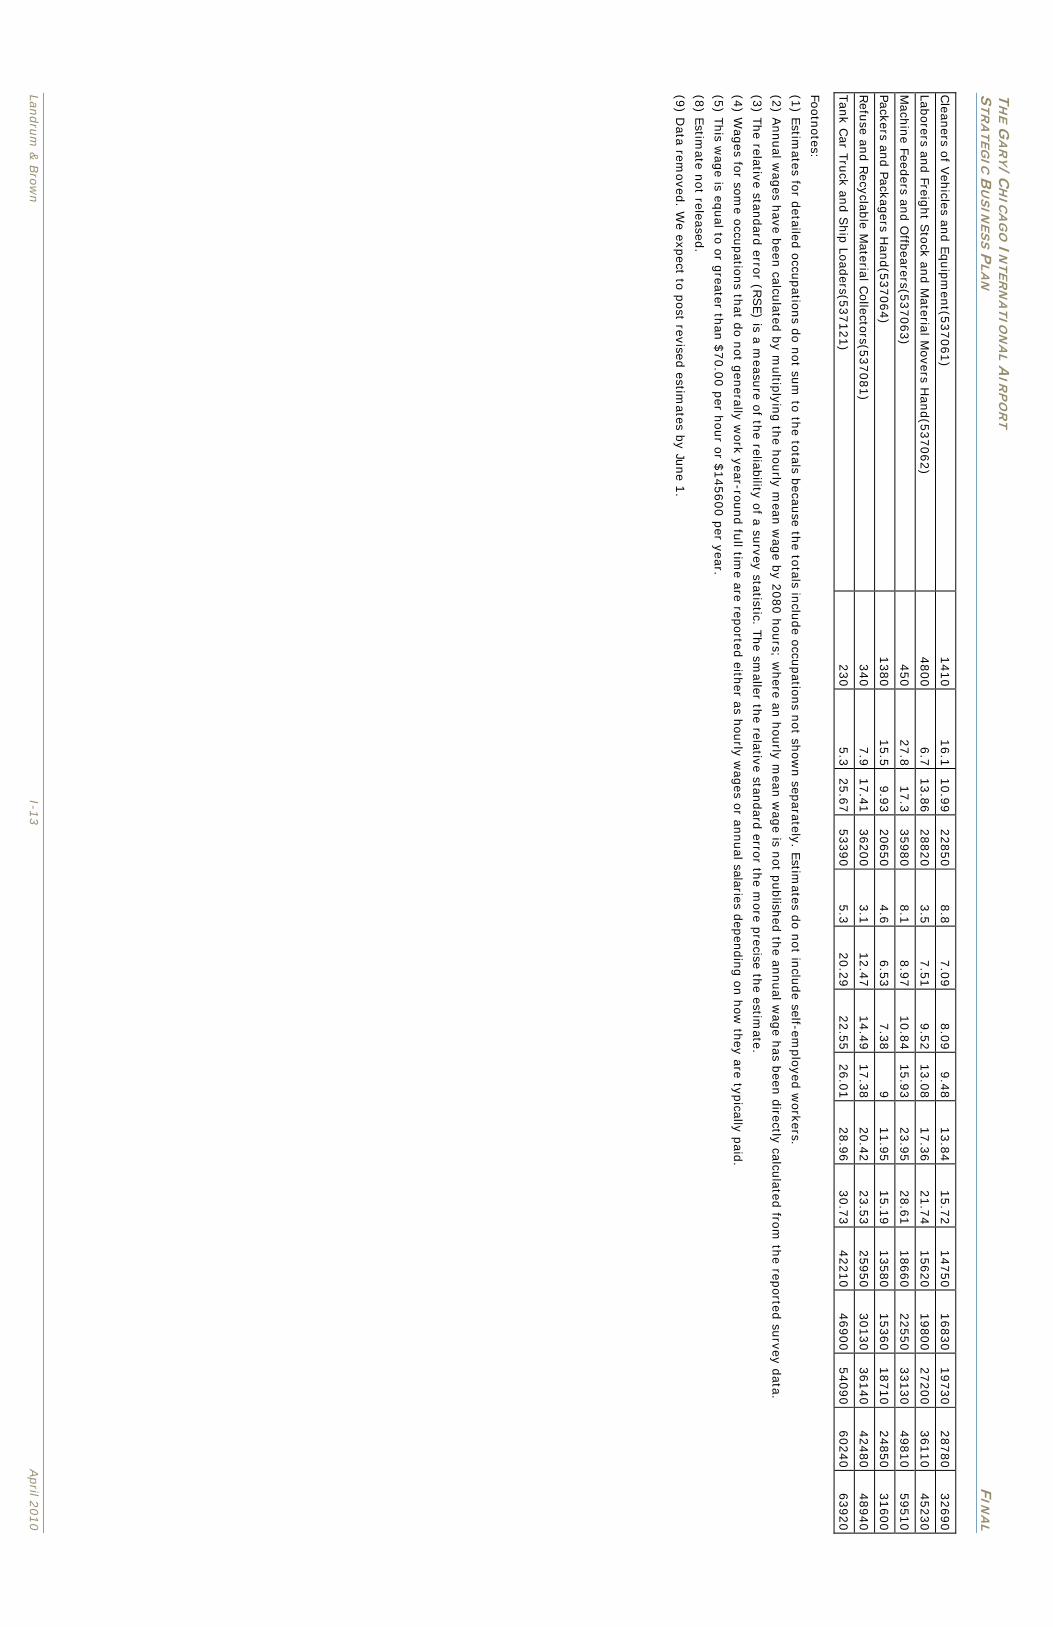
TH
E G
AR
Y/C
HIC
AG
O I
NTER
NA
TIO
NA
L AIR
PO
RT
STR
AT
EG
IC B
US
INES
S P
LA
N
FIN
AL
Landru
m &
Bro
wn
I-13
April 2
010
Clean
ers of V
ehicles an
d E
quip
men
t(537061)
1410
16.1
10.9
9
22850
8.8
7.0
9
8.0
9
9.4
8
13.8
4
15.7
2
14750
16830
19730
28780
32690
Laborers an
d Freig
ht S
tock an
d M
aterial Movers H
and(5
37062)
4800
6.7
13.8
6
28820
3.5
7.5
1
9.5
2
13.0
8
17.3
6
21.7
4
15620
19800
27200
36110
45230
Mach
ine Feed
ers and O
ffbearers(5
37063)
450
27.8
17.3
35980
8.1
8.9
7
10.8
4
15.9
3
23.9
5
28.6
1
18660
22550
33130
49810
59510
Packers and Packag
ers Hand(5
37064)
1380
15.5
9.9
3
20650
4.6
6.5
3
7.3
8
9
11.9
5
15.1
9
13580
15360
18710
24850
31600
Refu
se and R
ecyclable M
aterial Collectors(5
37081)
340
7.9
17.4
1
36200
3.1
12.4
7
14.4
9
17.3
8
20.4
2
23.5
3
25950
30130
36140
42480
48940
Tan
k Car T
ruck an
d S
hip
Load
ers(537121)
230
5.3
25.6
7
53390
5.3
20.2
9
22.5
5
26.0
1
28.9
6
30.7
3
42210
46900
54090
60240
63920
Footn
otes:
(1) E
stimates fo
r detailed
occu
patio
ns d
o n
ot su
m to
the to
tals becau
se the to
tals inclu
de occu
patio
ns n
ot sh
ow
n sep
arately. Estim
ates do n
ot in
clude self-em
plo
yed w
orkers.
(2) A
nnual w
ages h
ave been
calculated
by m
ultip
lying th
e hourly m
ean w
age b
y 2080 h
ours; w
here an
hourly m
ean w
age is n
ot p
ublish
ed th
e annual w
age h
as been
directly calcu
lated fro
m th
e reported
survey d
ata.
(3) T
he relative stan
dard
error (R
SE) is a m
easure o
f the reliab
ility of a su
rvey statistic. The sm
aller the relative stan
dard
error th
e more p
recise the estim
ate.
(4) W
ages fo
r som
e occu
patio
ns th
at do n
ot g
enerally w
ork year-rou
nd fu
ll time are rep
orted
either as h
ourly w
ages o
r annual salaries d
epen
din
g o
n h
ow
they are typ
ically paid
.
(5) T
his w
age is eq
ual to
or g
reater than
$70.0
0 p
er hour o
r $145600 p
er year.
(8) E
stimate n
ot released
.
(9) D
ata removed
. We exp
ect to p
ost revised
estimates b
y June 1
.

TH
E G
AR
Y/
CH
ICA
GO
IN
TER
NA
TIO
NA
L A
IRP
OR
T
STR
AT
EG
IC B
US
INES
S P
LA
N
FIN
AL
Landru
m &
Bro
wn
I-14
April 2010
TH
IS P
AG
E I
NTE
NTIO
NA
LLY
LEFT
BLA
NK

THE GARY/CHICAGO INTERNATIONAL AIRPORT STRATEGIC BUSINESS PLAN FINAL
Landrum & Brown J-1 April 2010
APPENDIX J RETAIL BUYING PROFILE WITHIN
THEORETICAL 10 AND 20-MINUTE DRIVE OF SITE
Site Type: Drive Time Gary-Chicago Airport East Chicago, in
East Chicago, in
East Chicago, in
Latitude: 41.61739
Longitude: -87.40964 Drive Time: 10 Minutes
Drive Time: 20 Minutes
Drive Time: 45 Minutes
2000 Households by Income
Household Income Base 29,270 248,779 2,055,871
< $15,000 29.2% 21.0% 16.0%
$15,000 - $24,999 16.3% 14.0% 11.5%
$25,000 - $34,999 14.1% 13.7% 12.0%
$35,000 - $49,999 14.8% 17.0% 16.2%
$50,000 - $74,999 14.6% 18.4% 19.8%
$75,000 - $99,999 6.2% 8.7% 11.0%
$100,000 - $149,999 3.4% 5.2% 8.4%
$150,000 - $199,999 0.8% 1.1% 2.4%
$200,000 + 0.7% 1.0% 2.6%
Average Household Income $37,814 $45,747 $59,078
2009 Households by Income
Household Income Base 28,173 242,793 2,084,767
< $15,000 23.6% 15.9% 11.8%
$15,000 - $24,999 14.0% 10.7% 8.6%
$25,000 - $34,999 12.9% 11.0% 8.6%
$35,000 - $49,999 13.8% 15.0% 13.7%
$50,000 - $74,999 17.7% 20.3% 20.3%
$75,000 - $99,999 10.2% 15.8% 18.8%
$100,000 - $149,999 5.3% 7.7% 11.0%
$150,000 - $199,999 1.4% 2.1% 3.6%
$200,000 + 1.0% 1.5% 3.7%
Average Household Income $46,364 $57,348 $73,112
2014 Households by Income
Household Income Base 27,692 239,817 2,091,842
< $15,000 23.4% 15.1% 10.7%
$15,000 - $24,999 13.7% 10.4% 8.4%
$25,000 - $34,999 11.6% 9.9% 7.8%
$35,000 - $49,999 12.1% 14.1% 13.5%
$50,000 - $74,999 21.4% 22.9% 21.0%
$75,000 - $99,999 10.1% 16.4% 19.9%
$100,000 - $149,999 5.2% 7.5% 11.2%

THE GARY/CHICAGO INTERNATIONAL AIRPORT STRATEGIC BUSINESS PLAN FINAL
Landrum & Brown J-2 April 2010
$150,000 - $199,999 1.4% 2.1% 3.6%
$200,000 + 1.0% 1.5% 3.9%
Average Household Income $47,278 $58,952 $76,065
2000 Owner Occupied Housing Units by Value
Total 15,630 145,942 1,195,861
< $50,000 33.2% 13.4% 4.7%
$50,000 - $99,999 57.8% 48.5% 23.1%
$100,000 - $149,999 6.8% 25.5% 27.0%
$150,000 - $199,999 1.3% 7.8% 19.9%
$200,000 - $299,999 0.5% 3.3% 15.1%
$300,000 - $499,999 0.1% 1.1% 7.1%
$500,000 - $999,999 0.2% 0.2% 2.5%
$1,000,000+ 0.1% 0.2% 0.6%
Average Home Value $67,920 $102,159 $177,187
2000 Specified Renter Occ. Housing Units by Contract Rent
Total 13,559 102,687 857,874
With Cash Rent 94.4% 96.6% 97.5%
No Cash Rent 5.6% 3.4% 2.5%
Median Rent $350 $466 $553
Average Rent $333 $449 $586
Data Note: Income represents the preceding year, expressed in current dollars. Household income includes wage and salary earnings, interest, dividends, net rents, pensions, SSI and welfare payments, child support and alimony. Specified Renter Occupied Housing Units exclude houses on 10+ acres. Average Rent excludes units paying no cash rent.
Source: ESRI forecasts for 2009 and 2014; U.S. Bureau of the Census, 2000 Census of Population and Housing

THE GARY/CHICAGO INTERNATIONAL AIRPORT STRATEGIC BUSINESS PLAN FINAL
Landrum & Brown J-3 April 2010
2009 Consumer Spending shows the amount spent on a variety of goods and services by households that reside in the market area. Expenditures are shown by broad budget categories that are not mutually exclusive. Consumer spending does not equal business revenue.
Apparel & Services: Total $ $33,652,389 $355,763,402 $3,938,467,086
Average Spent $1,194.11 $1,465.22 $1,889.09
Spending Potential Index 48 59 75
Computers & Accessories: Total $ $4,115,695 $44,225,601 $498,437,575
Average Spent $146.04 $182.14 $239.08
Spending Potential Index 64 80 105
Education: Total $ $23,609,607 $257,029,378 $2,856,354,906
Average Spent $837.75 $1,058.58 $1,370.05
Spending Potential Index 67 84 109
Entertainment/Recreation: Total $ $58,889,299 $632,555,575 $6,890,351,244
Average Spent $2,089.61 $2,605.20 $3,304.96
Spending Potential Index 65 80 102
Food at Home: Total $ $89,165,865 $931,317,135 $10,017,171,609
Average Spent $3,163.93 $3,835.66 $4,804.75
Spending Potential Index 69 84 105
Food Away from Home: Total $ $64,016,341 $673,936,977 $7,312,279,603
Average Spent $2,271.53 $2,775.63 $3,507.34
Spending Potential Index 68 83 105
Health Care: Total $ $73,172,579 $764,648,610 $7,760,041,720
Average Spent $2,596.43 $3,149.23 $3,722.11
Spending Potential Index 69 84 99
Household Furnishings & Equip: Total $ $33,887,605 $365,967,048 $4,090,848,612
Average Spent $1,202.46 $1,507.25 $1,962.18
Spending Potential Index 55 69 90
Investments: Total $ $20,813,012 $243,868,553 $2,894,660,010
Average Spent $738.52 $1,004.38 $1,388.43
Spending Potential Index 51 70 97
Retail Goods: Total $ $451,576,855 $4,795,250,600 $52,086,617,168
Average Spent $16,023.59 $19,749.39 $24,983.40
Spending Potential Index 62 77 97
Shelter: Total $ $284,702,764 $3,089,806,311 $35,526,308,300
Average Spent $10,102.29 $12,725.46 $17,040.23
Spending Potential Index 65 81 109
TV/Video/Sound Equipment: Total $ $23,751,181 $246,675,195 $2,625,190,349
Average Spent $842.78 $1,015.94 $1,259.18
Spending Potential Index 69 84 104
Travel: Total $ $30,961,755 $348,123,656 $3,998,088,457
Average Spent $1,098.64 $1,433.76 $1,917.69
Spending Potential Index 59 78 104
Vehicle Maintenance & Repairs: Total $ $17,215,739 $182,964,069 $1,998,654,068
Average Spent $610.88 $753.54 $958.66
Spending Potential Index 65 81 102
Data Note: The Spending Potential Index represents the amount spent in the area relative to a national average of 100.
Source: Consumer Spending data are derived from the 2005 and 2006 Consumer Expenditure Surveys, Bureau of Labor Statistics. ESRI

THE GARY/CHICAGO INTERNATIONAL AIRPORT STRATEGIC BUSINESS PLAN FINAL
Landrum & Brown J-4 April 2010
THIS PAGE INTENTIONALLY LEFT BLANK

THE GARY/CHICAGO INTERNATIONAL AIRPORT STRATEGIC BUSINESS PLAN FINAL
Landrum & Brown K-1 April 2010
APPENDIX K INTERVIEWS AND CONTACTS
Meetings with State Agencies:
Jim Staton, Director, NW Region
Indiana Economic Development Corporation 9800 Connecticut Dr, Crown Point, IN 46307
Bill Hanna, Executive Director
Northwest Indiana RDA 9800 Connecticut Dr, Crown Point, IN 46307
John Swanson, Executive Director
Northwest Indiana Regional Planning Commission 6100 Southport Road, Portage, IN
Mitch Roob, Secretary of Commerce
Indiana Economic Development Corporation One North Capitol, Indianapolis, IN
Tony Bennett, PhD IDOE Superintendent Conference call, 12-16
Indiana Department of Education 151 West Ohio Street Indianapolis, Indiana 46204
Jody Peacock Dir. of Corporate Affairs
Ports of Indiana 150 W. Market Street, Ste. 100 Indianapolis, IN 46204
Meetings with Elected Officials:
Charlie Brown State Representative
Indiana House of Representatives 200 W. Washington St., Indianapolis, IN
Mark Lopez Chief of Staff
Congressman Pete Visclosky 7895 Broadway, Suite A and B, Merrillville, IN
Earline Rogers Senator
Senate Democratic Caucus, IN General Assembly 200 W. Washington, Indianapolis, IN
Meetings with Indiana Regional Agencies:
Jean Krasoczka Deputy Director Phone interview
Lake County Community Economic Dev. Dept 2293 North Main Street, Crown Point
Vince Galbiati, President & CEO
Northwest Indiana Forum 6100 Southport Road, Portage, IN 219-763-6303

THE GARY/CHICAGO INTERNATIONAL AIRPORT STRATEGIC BUSINESS PLAN FINAL
Landrum & Brown K-2 April 2010
Meetings with City Agencies/Departments:
Joel Rodriguez Dept. of Econ Dev
City of Gary City Hall, 401 Broadway, Gary IN
Nathaniel Williams Internal Auditor
City of Gary City Hall, 401 Broadway, Gary IN
James Craig Dept. Planning, Zoning
City of Gary City Hall, 401 Broadway, Gary IN
Benjamin Robinson Building Commissioner
City of Gary City Hall, 401 Broadway, Gary IN
Carolyn Rogers Councilwoman
Gary Common Council City Hall, 401 Broadway, Suite 209, Gary IN
Rudy Clay Mayor
City of Gary City Hall, 401 Broadway, Gary IN
Meetings with the Airport:
Marion Johnson, Pastor GCIA Board Chair
Gary/Chicago International Airport 6001 W. Industrial Highway, Gary, IN
Chris Curry Executive Director
Gary/Chicago International Airport 6001 W. Industrial Highway, Gary, IN
Meetings with Other Agencies:
Charles Hughes Executive Director
Gary Chamber of Commerce 839 Broadway, Gary IN 46402
Edward Dernulc Executive Director
Merrillville Chamber of Commerce 255 W. 80th Place, Merrillville, IN
Howard Fink Town Administrator
Town of Merrillville 7820 Broadway, Merrillville, IN
Speros Batistatos President & CEO
Southshore Convention & Visitors Authority 7770 Corinne Drive, Hammond, IN 46323
Gretchen Gutman Attorney
Taft Stettinius & Hollister One Indiana Square, Indianapolis, IN
Kristi DeLaurentiis Peter Skosey Local Government and Community Relations
Chicago Metropolitan Planning Council 140 S. Dearborn; Ste 1400, Chicago, Illinois 60603 815-325-1220

THE GARY/CHICAGO INTERNATIONAL AIRPORT STRATEGIC BUSINESS PLAN FINAL
Landrum & Brown K-3 April 2010
Informal Discussions:
Mitch Daniels Governor of Indiana
.
Bill Hanna ED of the RDA
.
Bill Joiner RDA Board of Directors
Bill Sheldrake Pres, Policy Analytics
Howard Cohen RDA Board of Directors
Tom Snyder Pres, Ivy Tech
Bill Shrewsberry Pres, Shrewsberry
Teresa Lubbers IN Comm. Higher Ed Former State Senator
Mark Cahoon Lobbyist, IMA
Aviation Contacts Mr. James Tuck Manager
Aircraft Division, US Steel, Pittsburgh PA
Ms. Lorelei Weimer Executive Director
Porter County Convention, Recreation & Visitor Commission, Porter, IN
Ms. Norah Lenardic Aviation Consultant
Priester Aviation, Wheeling IL, Member Chicago Area Business Aviation Association
Mr. Robert Quinn Regional Representative-Central Region
National Business Aircraft Association
Ms. Katy Glynn AviCap Partners Chicago/Asia Access Jet Services, President, Chicago Area Business Aviation Association
Mr. Brant R. Madsen Treasurer
Madsen, Farkas & Powen L.L.C, Chicago Area Business Aviation Association
Mr. Ronald J. Rapp Attorney at Law
Vedder Price, Chicago IL
Ms. Alice Quackenbush Manager
Tax Administration, Indiana Department of Revenue, Indianapolis IN
Mr. Michael Wiser Director of Finance
Lake County IN

THE GARY/CHICAGO INTERNATIONAL AIRPORT STRATEGIC BUSINESS PLAN FINAL
Landrum & Brown K-4 April 2010
Contact List
Description Company Name Contact Title Airport Personnel Gary/Chicago
International Airport Chris Curry Robert Gyurko Nikki Thorne
Airport Director Project Manager Finance Manager
Helicopter Services Enstrom Helicopter
Company Jerry Mullins President, C.E.O.
Len Jablon Helicopters Len Jablon Owner, Operator Dupage Helicopter Randy Sank Operations Mgr. McMahon Helicopter
Services Nick McMahon Owner
Fixed Based Operators (FBO) and Maintenance, Repair and Overhaul (MRO) Services Executive Flight Ops Mark A. Jackson Senior Manager / Chief
Pilot Grand Aire, LLC Jim Renda Marketing Mgr. Jet Aviation Business
Jets David Paddock SVP Business
Development TIMCO Aviation John Eichten Operations Mgr. Dyncorp Int’l Thomas Gafne General Mgr. Phi, Inc. Lance Bospflug COO Gary Jet Center Wil Davis President Mid-Coast Aviation Tim Krisley Operations Mgr. Aircraft Painting Mid-West Painting Dean Baldwin Owner AV Source Eric Hackman GM Aerozona Jetcrafters Jim Miller Owner Prestige Walter Fredorishen Owner Part 135 Operators Ameriflight Steve Rozell Regional Manager M2 Transport Scott Beal Owner ABX Air Scott Glasser Business Development /
Sales Airnet Systems Dan Walker Operations Mgr. Castle Aviation Mike Grossman Operations Mgr. Air Now Michelle Van Ness Sales Mgr. Ameristar Jet Charter Tom Redman Operations Mgr. Cherry Air Steve Redden Operations Mgr. IFL Group Ken Jones GM Royal Air Freight Kirt Kostich GM Commercial Cargo Industry UPS Trey Hettinger, Peter
Levermore Properties
Air Cargo Community and Manufacturers Hellmann Logistics Christian Mars Terminal Manager Keuhne & Nagel Lauren Caribean Terminal Manager Conway Trucking John Warta Terminal Manager Chick Packaging Mark Pflanz Mktg. Manager US Steel James Tuck Manager, Aircraft

THE GARY/CHICAGO INTERNATIONAL AIRPORT STRATEGIC BUSINESS PLAN FINAL
Landrum & Brown K-5 April 2010
Description Company Name Contact Title Government and Public Entities Porter County
Convention, Recreation and Visitor Commission
Lorelei Weimer Executive Director
National Business Aircraft Association
Robert Quinn Regional Representative-Central Region
Chicago Area Business Aviation Association
Katy Glynn President
Farkas & Powen L.L.C Brant R. Madsen Treasurer Vedder Price Ronald Rapp Attorney at Law Indiana Department of
Revenue Alice Quackenbush Manager, Tax
Administration Lake County, Indiana Michael Wiser Director of Finance Freight Forwarders Cas International Cathy Slaski General Manager Bellair Express Larry Brosett Station Owner Transgroup Logistics Rudi Kohnke Station Manager Hellman Logistics Ken McAllen Operations Manager Triways Logistics Ramon Mangune Regional Manager Air Land & Sea Express Ginny Beck Operations Manager BAX Global / Schenker Jim Wood Branch Manager Ceva Logistics Mike Richau Manager Exel Global Logistics Craig Graber Branch Manager Forward Air Jim Webb Manager Guaranteed Air Frieght Fred Keck President Kuehne & Nagel Quincie Atkins Manager NYK Logistics Reed Niederhauer Director Panalpina John Nelson Manager UTI Ruth Bishop Manager Phoenix International Stephane Rambaud Regional Manager United Global Logistics Kevin Stancres Manager SOS Global Fernando Soler General Manager Falcon Global Edge Richard Fisher Station Sales Manager Air General Patrick Glenn Manager

THE GARY/CHICAGO INTERNATIONAL AIRPORT STRATEGIC BUSINESS PLAN FINAL
Landrum & Brown K-6 April 2010
THIS PAGE INTENTIONALLY LEFT BLANK