Embed Size (px)
Citation preview

Remote Sensing of Environment 114 (2010) 1662–1675
Contents lists available at ScienceDirect
Remote Sensing of Environment
j ourna l homepage: www.e lsev ie r.com/ locate / rse
Integrated assessment on multi-temporal and multi-sensor combinations forreducing cloud obscuration of MODIS snow cover products of the PacificNorthwest USA
Yang Gao a,b,c, Hongjie Xie b,⁎, Tandong Yao c, Chongsheng Xue a
a Faculty of Earth Sciences, China University of Geosciences, Wuhan 430073, Chinab Laboratory for Remote Sensing and Geoinformatics, University of Texas at San Antonio, San Antonio, TX 78249, USAc Key Laboratory of Tibetan Environment Changes and Land Surface Processes, Institute of Tibetan Plateau Research, Chinese Academy of Sciences, Beijing 100085, China
⁎ Corresponding author. Tel.: +1 210 458 5445; fax:E-mail address: [email protected] (H. Xie).
0034-4257/$ – see front matter © 2010 Elsevier Inc. Aldoi:10.1016/j.rse.2010.02.017
a b s t r a c t
a r t i c l e i n f oArticle history:Received 8 December 2009Received in revised form 18 February 2010Accepted 21 February 2010
Keywords:Adjacent temporal deductionFixed-day combinationFlexible multi-day combinationMulti-sensor combinationAccuracy assessment
MODIS (Moderate Resolution Imaging Spectroradiometer) snow cover products, of daily, freely available,worldwide spatial extent at medium spatial resolution, have been widely applied in regional snow cover andmodeling studies, although high cloud obscuration remains a concern in some applications. In this study,various approaches including daily combination, adjacent temporal deduction, fixed-day combination,flexible multi-day combination, and multi-sensor combination are assessed to remove cloud obscurationwhile still maintain the temporal and spatial resolutions. The performance of the resultant snow cover mapsare quantitatively evaluated against in situ observations at 244 SNOTEL stations over the Pacific NorthwestUSA during the period of 2006–2008 hydrological years. Results indicate that daily Terra and Aqua MODIScombination and adjacent temporal deduction can reduce cloud obscuration and classification errorsalthough an annual mean of 37% cloud coverage remains. Classification errors in snow-covered months areactually small and tend to underestimate the snow cover. Primary errors of MODIS daily, fixed and flexiblemulti-day combination products occur during transient months. Flexible multi-day combination is anefficient approach to maintain the balance between temporal resolution and realistic estimation of snowcover extent since it uses two thresholds to control the combination processes. Multi-sensor combinations(daily or multi-day), taking advantage of MODIS high spatial resolution and AMSR-E cloud penetrationability, provide cloud-free products but bring larger image underestimation errors as compared with theirMODIS counterparts.
+1 210 458 4469.
l rights reserved.
© 2010 Elsevier Inc. All rights reserved.
1. Introduction and background
Snow cover is one of the most important climatic factors affectingsurface albedo, energy balance and hydrological circulation. Snowcover mapping has been utilized in operational snowmelt, runoffforecasting, data assimilation and the calibration or validation ofvarious hydrological models (Andreadis & Lettenmaier, 2006; Blöschlet al., 1991; Grayson et al., 2002; Parajka & Blöschl, 2008; Udnaes et al.,2007). Daily and freely available, worldwide spatial extent, andrelatively high spatial resolution MODIS snow products have beenwidely applied in regional snow cover andmodeling studies (Brown etal., 2007; Rodell &Houser, 2004).Many studies (i.e., Hall & Riggs, 2007;Liang et al., 2008a; etc.) have demonstrated that MODIS daily snowcover products in clear-sky condition are in quite good agreementwithground based observations or other satellite-based snow coverproducts, however high cloud obscuration is a real problem in using
MODIS snow cover products for various applications (Ault et al., 2006;Bitner et al., 2002; Klein & Barnett, 2003; Lopez et al., 2008; Simic et al.,2004; Tekeli et al., 2005;Wang et al., 2008; Xie et al., 2009; Zhou et al.,2005). Obtaining cloud-free or even cloud percentage less than 10% ofdaily MODIS images remains a challenge. Various approaches havebeen proposed to reduce cloud obscuration by altering the cloudmask,separating cloud-masked pixels, and applying spatial–temporal ormulti-sensor combinations.
For example, an improved cloud mask was used in the MODISsnow cover mapping algorithm to better separate snow from cloud(Riggs & Hall, 2003). The improvement, however, is usually small asthe cloud indeed exists (Parajka & Blöschl, 2008). Wang et al. (2008)attempted to separate the cloud-masked pixels into “snow” and“land” based on the ratio of snow to land from ground observations ineach month, which can estimate overall snow percentage but cannotidentify actual snow distribution under cloud. Spatio-temporal ormulti-sensor combinations are effective approaches to reduce cloudobscuration and identify snow distribution under cloud.
Spatial approaches aim at replacing cloud pixels by the majority ofnon-cloud pixels in an eight pixel neighborhood (Parajka & Blöschl,
1663Y. Gao et al. / Remote Sensing of Environment 114 (2010) 1662–1675
2008; Tong et al., 2009; Zhao & Fernandes, 2009). This can effectivelyreduce cloud blockage of daily MODIS snow products by ∼7%. Themethod is really effective for scattered cloud cover, not for massivearea of cloud cover (i.e., all the neighboring pixels are cloud-covered).
Temporal approaches merge daily or multi-day MODIS snow coverproducts to minimize cloud coverage and maximize snow coverage,by the sacrifice of temporal resolution. Daily combination of Terra andAqua MODIS, which have a 3 hour difference, can reduce ∼10–20%cloud obscuration (Parajka & Blöschl, 2008; Wang et al., 2009; Xieet al., 2009; Yang et al., 2006). The MODIS 8-day Snow Cover Product(MOD10A2/MYD10A2) is the representative of fixed-day combinedproducts. It combines 2 to 8 days of Terra/Aqua MODIS daily snowcover products (MOD10A1/MYD10A1) over defined periods. Usingthe same algorithm, some user-defined multi-day snow cover prod-ucts are produced through combining MOD10A1 products in fixedtemporal windows (Houborg et al., 2007; Liang et al., 2008a; Parajka &Blöschl, 2008; Sorman et al., 2007; Yang et al., 2006). Theseapproaches largely reduce cloud coverage, but the fixed temporalwindows reduce the products' ability to monitor snowfall events tosome degrees. Based on a predefined maximum cloud coveragethreshold such as 10%, other multi-day composite products withflexible starting and ending dates are produced (Wang et al., 2009; Xieet al., 2009). These products have higher temporal resolution (average2–3 days per image) and relatively low cloud coverage, but ignoresome special situations. For example, when weather conditionsremain overcast for over a week, this method may result in a com-posite product of over 8 days or even several weeks. Hall et al. (2010)develop a new method to fill the cloud gap based on the most recentcloud-free observations for each cloud pixel. This gap-filling strategyis a useful and dynamic method which uses all the nearest non-cloudobservations. One disadvantage of this method is that it does notcontrol the cloud percentage for the entire image area.
Multi-sensor approaches can generate cloud-free snow covermaps through the merging of MODIS and AMSR-E snow products atthe expense of spatial resolution. This approach takes advantage ofboth high spatial resolution of optical sensors and cloud penetrationof passive microwave sensors (i.e., Foster et al., 2007; Hall et al.,2007a; Liang et al., 2008b; Gao et al., 2010). The snow classificationaccuracy of the MODIS and AMSR-E blended snow cover products is85.6%, which is much higher than the 30.7% of MODIS daily productsin all-sky condition (Liang et al., 2008b). This method sacrifices spatialresolution due to the coarse spatial resolution of the AMSR-E snowproduct (25 km).
The objectives of this paper are i) to improve some current cloudreducing approaches and generate new daily or multi-day blendedsnow cover maps based on Terra/Aqua MODIS and Aqua AMSR-Esnow products; ii) to evaluate and compare those improved snowcover products in terms of spatial extent of cloud coverage, snowcoverage and overall classification accuracy; and iii) to analyze the
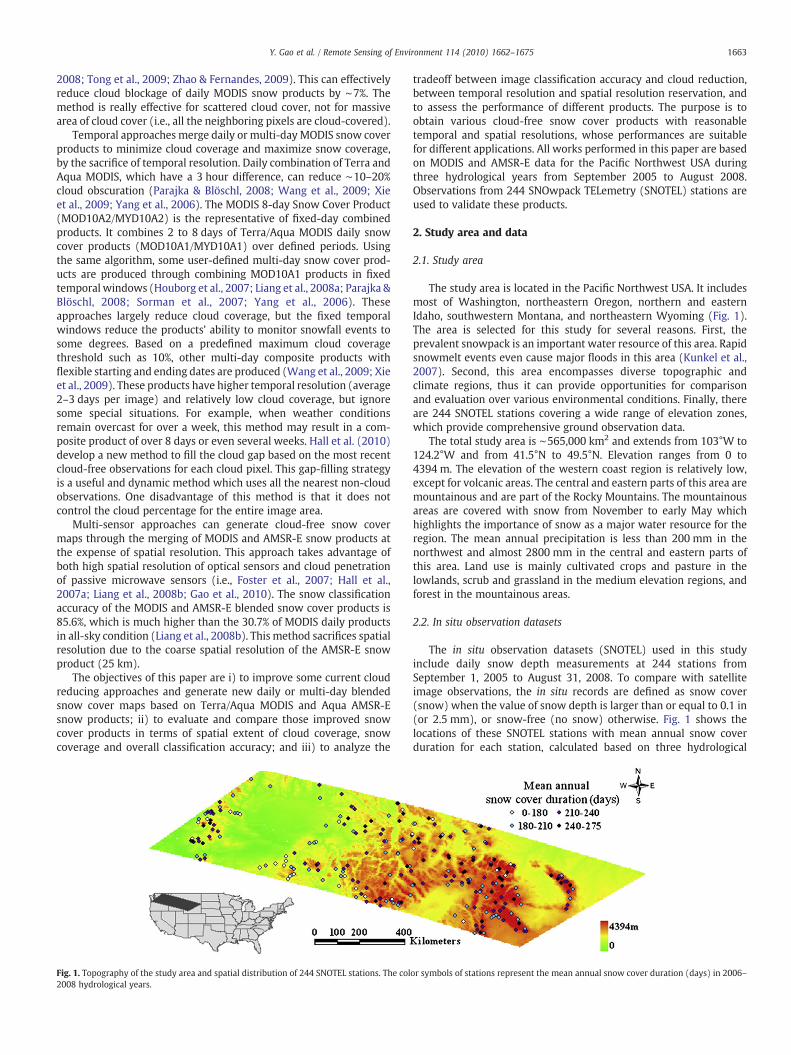
Fig. 1. Topography of the study area and spatial distribution of 244 SNOTEL stations. The col2008 hydrological years.
tradeoff between image classification accuracy and cloud reduction,between temporal resolution and spatial resolution reservation, andto assess the performance of different products. The purpose is toobtain various cloud-free snow cover products with reasonabletemporal and spatial resolutions, whose performances are suitablefor different applications. All works performed in this paper are basedon MODIS and AMSR-E data for the Pacific Northwest USA duringthree hydrological years from September 2005 to August 2008.Observations from 244 SNOwpack TELemetry (SNOTEL) stations areused to validate these products.
2. Study area and data
2.1. Study area
The study area is located in the Pacific Northwest USA. It includesmost of Washington, northeastern Oregon, northern and easternIdaho, southwestern Montana, and northeastern Wyoming (Fig. 1).The area is selected for this study for several reasons. First, theprevalent snowpack is an important water resource of this area. Rapidsnowmelt events even cause major floods in this area (Kunkel et al.,2007). Second, this area encompasses diverse topographic andclimate regions, thus it can provide opportunities for comparisonand evaluation over various environmental conditions. Finally, thereare 244 SNOTEL stations covering a wide range of elevation zones,which provide comprehensive ground observation data.
The total study area is ∼565,000 km2 and extends from 103°W to124.2°W and from 41.5°N to 49.5°N. Elevation ranges from 0 to4394 m. The elevation of the western coast region is relatively low,except for volcanic areas. The central and eastern parts of this area aremountainous and are part of the Rocky Mountains. The mountainousareas are covered with snow from November to early May whichhighlights the importance of snow as a major water resource for theregion. The mean annual precipitation is less than 200 mm in thenorthwest and almost 2800 mm in the central and eastern parts ofthis area. Land use is mainly cultivated crops and pasture in thelowlands, scrub and grassland in the medium elevation regions, andforest in the mountainous areas.
2.2. In situ observation datasets
The in situ observation datasets (SNOTEL) used in this studyinclude daily snow depth measurements at 244 stations fromSeptember 1, 2005 to August 31, 2008. To compare with satelliteimage observations, the in situ records are defined as snow cover(snow) when the value of snow depth is larger than or equal to 0.1 in(or 2.5 mm), or snow-free (no snow) otherwise. Fig. 1 shows thelocations of these SNOTEL stations with mean annual snow coverduration for each station, calculated based on three hydrological
or symbols of stations represent the mean annual snow cover duration (days) in 2006–

Fig. 2. The percentage of different elevation zones to the entire study area and thestation distribution in different elevation zones.
1664 Y. Gao et al. / Remote Sensing of Environment 114 (2010) 1662–1675
years' data from September, 2005 to August, 2008. The elevations ofthe stations vary from 308 to 3005 m. Fig. 2 shows the percentage ofdifferent elevation zones of the entire study area and the frequencydistribution of stations in different elevation zones. The majority ofthe SNOTEL stations are distributed at elevations between 1000 m and3000 m where most snowfalls occur. 25% of the study area has anelevation lower than 1000 m while 8 SNOTEL stations are located inthis elevation zone. Only 1.5% of the study area is above 3005 melevation where the highest station is located. Therefore, the spatialdistribution of these SNOTEL stations is expected to capture the vari-ability of snowfall for this region.
2.3. Remote sensing data
The snow cover images used in this study consist of MODIS dailysnow cover products MOD10A1 and MYD10A1 (MODIS Terra/AquaSnow Cover Daily L3 Global 500 m SIN GRID V005) (Hall et al., 2007b)and AMSR-E daily SnowWater Equivalent (SWE) product AE_DySno-2 (AMSR-E/Aqua daily L3 Global Snow Water Equivalent EASE-Grids)(Kelly et al., 2007) from September 1, 2005 to August 31, 2008. Detailsabout the MODIS and AMSR-E snow products can be found in Loblet al. (2002), Kawanishi et al. (2003), Hall and Riggs (2007) and Kellyet al. (2003).
Two MODIS tiles (H09V04 and H10V04) are needed to cover theentire study area. We first mosaic two tiles and then reproject theminto Albers equal-area conical projection using the MODIS Reprojec-tion Tool (MRT, 2004). Totals of 1090 MOD10A1 images and 1095MYD10A1 images, covering a period of 3 years, are used in this study(Table 1). The pixel classes in those snow cover images are reclassifiedto three categories: snow, no snow (land), and cloud. The snow-covered lake ice and snow classes are merged into a single snowcategory; the land and inland water classes are merged into the nosnow category; and the cloud, data missing and no decision dataclasses aremerged into the cloud category. In this study area, it's foundthat the total of MODIS-recorded snow-covered lake ice, data missingand no decision classes were less than 0.4%, while the other fouroriginal classes (night, ocean, detector saturated, and fill) do not occur.
The AMSR-E onboard Aqua satellite provides daily SWE products at25 km spatial resolution. A total of 1091 AE_DySno images are used in
Table 1Remote sensing images used during September, 2005–August, 2008 period.
Hydrological year MOD10A1 missing date MOD10A1 total no. MY10A1
Sep. 1, 2005–Aug. 31, 2006 Sep. 23, 2005 362 /Aug. 22, 2006Aug. 23, 2006
Sep. 1, 2006–Aug. 31, 2007 / 365 /
Sep. 1, 2007–Aug. 31, 2008 Nov. 15, 2007 363 Dec. 2, 20Dec. 13, 2007Apr. 16, 2008
this study (Table 1). These images are reprojected into Albers equal-area conical projection using the HDF EOS-to-GeoTiff (HEG) tool(Taaheri et al., 2007), in order to match with MODIS data. The pixelvalues of AMSR-E SWE include 0–240 (multiplying by 2 for true SWEvalues in mm), 248 (off-earth), 252 (land or snow impossible), 253(ice sheet), 254 (water) and255 (datamissing) (Kelly et al., 2007). TheAE_DySno classes are reclassified to three categories: snow, no snow(land), andmissing data. For example, SWE values 1–240 representingsnow-covered area are merged into the snow category; SWE value 0represents snow-free land and is transformed to the no snow (land)category; and the data missing class is retained as data missing class.The other remaining original classes do not occur in the SWE productsof the study area during the period of study.
3. Methods
Various approaches including daily combination, adjacent tempo-ral deduction, multi-temporal (fixed-day and flexible multi-day), andmulti-sensor combinations are tested to map snow cover whilereducing cloud obscuration. First, information from different MODISproducts acquired on the same day, nearest day or over multi-day isused to reduce cloud obscuration. Then AMSR-E products with lowerspatial resolution and higher retrieval rate are introduced. Fig. 3shows the workflow chart of data processing.
3.1. MODIS daily combination and adjacent temporal deduction
Daily combination means that MOD10A1 (Terra) and MYD10A1(Aqua) acquired on the same day are merged into one MODIS DailyCombined (MODISDC) snow cover product. The composite rule,similar to the generation of standard MOD10A2 snow cover products,follows the priority principle (Xie et al., 2009). A low-priority integervalue is always replaced by a high-priority integer value, with thepriority order being snowNno snow (land)Nclouds. If only MOD10A1is present (no MYD10A1 available on that day), no combination isperformed and theMOD10A1 is directly used for the next process, andvice versa.
Adjacent temporal deduction is an approach to deduce the surfaceconditions under the remaining cloud pixels using the information ofthe preceding and following days on the same pixel basis, without anysacrifice of spatial or temporal resolution (similar as Gafurov &B'ardossy, 2009; Li et al., 2008). It differs from direct replacementusing previous snow mapping results with the loss of 1 day temporalresolution (Zhao & Fernandes, 2009) and also from the spatial filteringwhich replaces cloud pixels with the majority class of the neighboringeight pixels in the same image (Parajka & Blöschl, 2008). In adjacenttemporal deduction, assuming that a pixel belongs to the cloud classin the image of the current day, three different situations may occur.(1) If the corresponding pixel values in both images of the precedingand following days are snow, the cloud pixel of the current day imageis deduced as snow; (2) if the corresponding pixel values in bothimages of the preceding and following days are land, the cloud pixel inthe current day image is deduced as land; and (3) if the pixel values inthe preceding and following day images are different (one snow, the
missing date MYD10A1 total NO. AE_DySno missing date AE_DySno total no.
365 Nov. 17, 2005 364
365 Nov. 18, 2006 363Dec. 22, 2006
07 365 Nov. 27, 2007 364Nov. 28, 2007
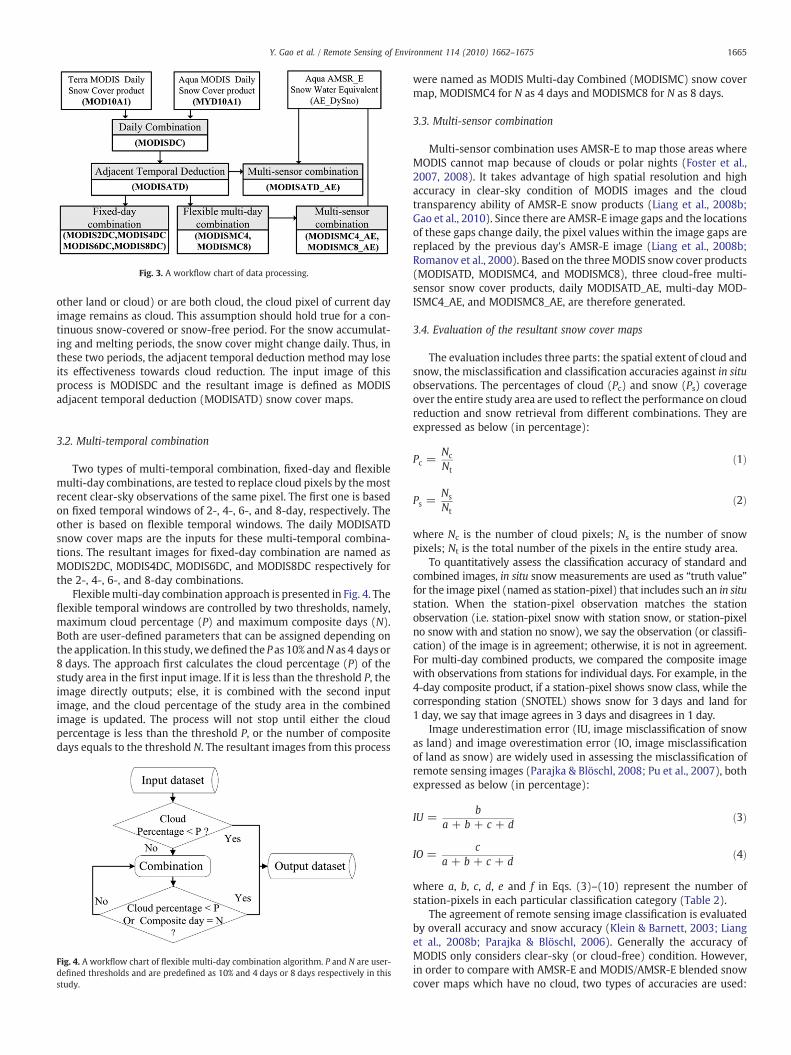
Fig. 3. A workflow chart of data processing.
1665Y. Gao et al. / Remote Sensing of Environment 114 (2010) 1662–1675
other land or cloud) or are both cloud, the cloud pixel of current dayimage remains as cloud. This assumption should hold true for a con-tinuous snow-covered or snow-free period. For the snow accumulat-ing and melting periods, the snow cover might change daily. Thus, inthese two periods, the adjacent temporal deduction method may loseits effectiveness towards cloud reduction. The input image of thisprocess is MODISDC and the resultant image is defined as MODISadjacent temporal deduction (MODISATD) snow cover maps.
3.2. Multi-temporal combination
Two types of multi-temporal combination, fixed-day and flexiblemulti-day combinations, are tested to replace cloud pixels by themostrecent clear-sky observations of the same pixel. The first one is basedon fixed temporal windows of 2-, 4-, 6-, and 8-day, respectively. Theother is based on flexible temporal windows. The daily MODISATDsnow cover maps are the inputs for these multi-temporal combina-tions. The resultant images for fixed-day combination are named asMODIS2DC, MODIS4DC, MODIS6DC, and MODIS8DC respectively forthe 2-, 4-, 6-, and 8-day combinations.
Flexiblemulti-day combination approach is presented in Fig. 4. Theflexible temporal windows are controlled by two thresholds, namely,maximum cloud percentage (P) and maximum composite days (N).Both are user-defined parameters that can be assigned depending onthe application. In this study,wedefined the P as 10% andN as 4 days or8 days. The approach first calculates the cloud percentage (P) of thestudy area in the first input image. If it is less than the threshold P, theimage directly outputs; else, it is combined with the second inputimage, and the cloud percentage of the study area in the combinedimage is updated. The process will not stop until either the cloudpercentage is less than the threshold P, or the number of compositedays equals to the threshold N. The resultant images from this process
Fig. 4. A workflow chart of flexible multi-day combination algorithm. P and N are user-defined thresholds and are predefined as 10% and 4 days or 8 days respectively in thisstudy.
were named as MODIS Multi-day Combined (MODISMC) snow covermap, MODISMC4 for N as 4 days and MODISMC8 for N as 8 days.
3.3. Multi-sensor combination
Multi-sensor combination uses AMSR-E to map those areas whereMODIS cannot map because of clouds or polar nights (Foster et al.,2007, 2008). It takes advantage of high spatial resolution and highaccuracy in clear-sky condition of MODIS images and the cloudtransparency ability of AMSR-E snow products (Liang et al., 2008b;Gao et al., 2010). Since there are AMSR-E image gaps and the locationsof these gaps change daily, the pixel values within the image gaps arereplaced by the previous day's AMSR-E image (Liang et al., 2008b;Romanov et al., 2000). Based on the threeMODIS snow cover products(MODISATD, MODISMC4, and MODISMC8), three cloud-free multi-sensor snow cover products, daily MODISATD_AE, multi-day MOD-ISMC4_AE, and MODISMC8_AE, are therefore generated.
3.4. Evaluation of the resultant snow cover maps
The evaluation includes three parts: the spatial extent of cloud andsnow, the misclassification and classification accuracies against in situobservations. The percentages of cloud (Pc) and snow (Ps) coverageover the entire study area are used to reflect the performance on cloudreduction and snow retrieval from different combinations. They areexpressed as below (in percentage):
Pc =Nc
Ntð1Þ
Ps =Ns
Ntð2Þ
where Nc is the number of cloud pixels; Ns is the number of snowpixels; Nt is the total number of the pixels in the entire study area.
To quantitatively assess the classification accuracy of standard andcombined images, in situ snow measurements are used as “truth value”for the image pixel (named as station-pixel) that includes such an in situstation. When the station-pixel observation matches the stationobservation (i.e. station-pixel snow with station snow, or station-pixelno snow with and station no snow), we say the observation (or classifi-cation) of the image is in agreement; otherwise, it is not in agreement.For multi-day combined products, we compared the composite imagewith observations from stations for individual days. For example, in the4-day composite product, if a station-pixel shows snow class, while thecorresponding station (SNOTEL) shows snow for 3 days and land for1 day, we say that image agrees in 3 days and disagrees in 1 day.
Image underestimation error (IU, image misclassification of snowas land) and image overestimation error (IO, image misclassificationof land as snow) are widely used in assessing the misclassification ofremote sensing images (Parajka & Blöschl, 2008; Pu et al., 2007), bothexpressed as below (in percentage):
IU =b
a + b + c + dð3Þ
IO =c
a + b + c + dð4Þ
where a, b, c, d, e and f in Eqs. (3)–(10) represent the number ofstation-pixels in each particular classification category (Table 2).
The agreement of remote sensing image classification is evaluatedby overall accuracy and snow accuracy (Klein & Barnett, 2003; Lianget al., 2008b; Parajka & Blöschl, 2006). Generally the accuracy ofMODIS only considers clear-sky (or cloud-free) condition. However,in order to compare with AMSR-E and MODIS/AMSR-E blended snowcover maps which have no cloud, two types of accuracies are used:

Table 2Confusion matrix for remote sensing image vs. in situ observations.
Image: snow Image: no snow Image: cloud
Ground: snow a b eGround: no snow c d f
a, b, c, d, e and f represent number of station-pixels in each particular classificationcategory.
Fig. 5. Mean percentage (monthly) of cloud coverage (Pc, A) and snow coverage (Ps, B)of the TerraMODIS (MOD10A1), AquaMODIS (MYD10A1), daily combined (MODISDC),and adjacent temporal deduction (MODISATD) snow cover maps, during 2006–2008hydrological years. S means September and O means October, and so on.
1666 Y. Gao et al. / Remote Sensing of Environment 114 (2010) 1662–1675
one in clear-sky condition and the other in all-sky condition. Theoverall accuracy in clear-sky (Oc) or in all-sky (Oa) condition isrespectively defined as the sum of matched number of station-pixelsfor snow and for no snow divided by the total number of station-pixels in clear-sky condition or in all-sky condition, both expressed asbelow (in percentage):
Oc =a + d
a + b + c + dð5Þ
Oa =a + d
a + b + c + d + e + f: ð6Þ
The sum of a, b, c, and d represents the total data under clear-sky,and the sum of a, b, c, d, e, and f represents the total data for all-sky.The overall accuracy in all-sky condition considers both theclassification accuracy and retrieval rate, so it can reflect the overallperformance of a product.
The snow accuracy in clear-sky (Sc) or in all-sky (Sa) conditions isrespectively calculated by the number of station-pixels with snowthat agreed with station snow divided by the total snow-coveredstation-pixels in clear-sky condition or in all-sky condition. The landaccuracy in clear-sky (Lc) or in all-sky (Sa) is also defined in a similarway. They are expressed as below (in percentage):
Sc =a
a + bð7Þ
Sa =a
a + b + eð8Þ
Lc =b
a + bð9Þ
La =b
a + b + e: ð10Þ
4. Results
4.1. MODIS daily combination and adjacent temporal deduction
The cloud and snow coverage (%) monthly distribution of Terra,Aqua, daily combined and adjacent temporal deduction products arepresented in Fig. 5. Fig. 5A shows that the cloud coverage of standarddaily MODIS products (MOD10A1 and MYD10A1) is high especially inwinter months and that MOD10A1 (Terra) has slightly lower cloudcoverage than MYD10A1 (Aqua). Daily Terra and Aqua combinedproducts (MODISDC) reduce monthly cloud coverage by 5–14%. Theadjacent temporal deduction products (MODISATD) reduce monthlycloud coverage by another 6–9%. Fig. 5B shows that monthly snowretrievals of these four products change in reverse trend. The snowcoverage increases from the standard daily MODIS products(MOD10A1 and MYD10A1), to the Terra/Aqua combined products(MODISDC), and to the adjacent temporal deduction products(MODISATD). Those changes are mostly obvious in the cold season,while almost no change happens from June to September since thereis almost no snow cover in those months. All of these indicate that
daily combination and adjacent temporal deduction are efficient toreduce cloud coverage and reveal the real snow coverage especially incold season.
The three year in situ observations at 244 SNOTEL stations are usedto verify these snow cover products. Table 3 presents the mean IU andIO errors against ground observations at both monthly and annualbasis. Overall, the IU errors of all four products are larger than thecorresponding IO errors except in August and September, whichmeans that all four products tend to underestimate the snow extent.The distribution of IU and IO errors shows a typical seasonal pattern oflow values in snow-covered period (December–March) and snow-free period (July–September) and of high values in transitionalperiods (October−November, snow accumulating period; and April–June, the snow melting period). Overall, the IU and IO values of Terraproducts are less than those of the Aqua products (Table 3), whichindicate that Terra products have less bias than Aqua products. Thecomparison of four different products indicate that IU errors have adecreasing trend from Aqua or Terra products, to daily combinedproducts, and to adjacent temporal deduction products especially intransitional period. For example, in May the mean IU error wasreduced from 34.0%, 30.7% to 28.1%, and to 27.4%, respectively. Thosereductions of misclassification indicate the improvement in snowdetection from single type (Terra or Aqua), to daily combined, and toadjacent temporal deduction products. As compared with the IUerrors, the IO errors are relatively small and almost have no change inthe snow cover period and snow-free period among those products.The major IO errors come from those transitional months.
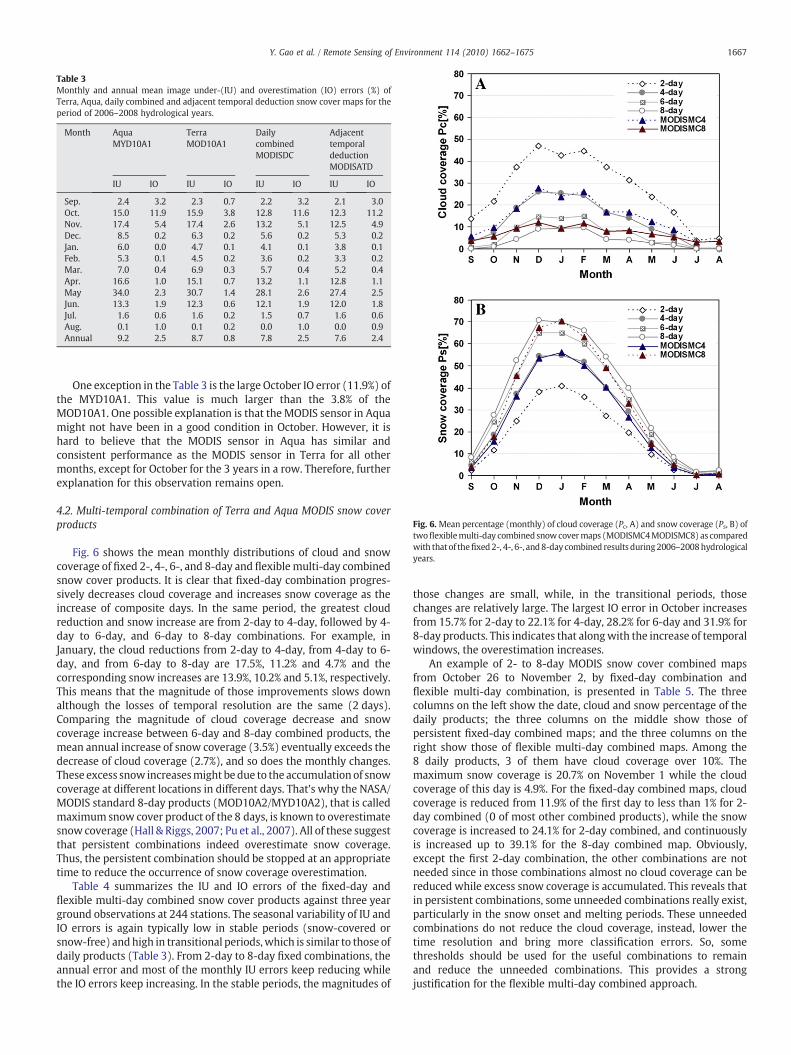
Table 3Monthly and annual mean image under-(IU) and overestimation (IO) errors (%) ofTerra, Aqua, daily combined and adjacent temporal deduction snow cover maps for theperiod of 2006–2008 hydrological years.
Month AquaMYD10A1
TerraMOD10A1
DailycombinedMODISDC
AdjacenttemporaldeductionMODISATD
IU IO IU IO IU IO IU IO
Sep. 2.4 3.2 2.3 0.7 2.2 3.2 2.1 3.0Oct. 15.0 11.9 15.9 3.8 12.8 11.6 12.3 11.2Nov. 17.4 5.4 17.4 2.6 13.2 5.1 12.5 4.9Dec. 8.5 0.2 6.3 0.2 5.6 0.2 5.3 0.2Jan. 6.0 0.0 4.7 0.1 4.1 0.1 3.8 0.1Feb. 5.3 0.1 4.5 0.2 3.6 0.2 3.3 0.2Mar. 7.0 0.4 6.9 0.3 5.7 0.4 5.2 0.4Apr. 16.6 1.0 15.1 0.7 13.2 1.1 12.8 1.1May 34.0 2.3 30.7 1.4 28.1 2.6 27.4 2.5Jun. 13.3 1.9 12.3 0.6 12.1 1.9 12.0 1.8Jul. 1.6 0.6 1.6 0.2 1.5 0.7 1.6 0.6Aug. 0.1 1.0 0.1 0.2 0.0 1.0 0.0 0.9Annual 9.2 2.5 8.7 0.8 7.8 2.5 7.6 2.4
Fig. 6. Mean percentage (monthly) of cloud coverage (Pc, A) and snow coverage (Ps, B) oftwoflexiblemulti-day combinedsnowcovermaps (MODISMC4MODISMC8) as comparedwith thatof thefixed2-, 4-, 6-, and8-day combined results during2006–2008hydrologicalyears.
1667Y. Gao et al. / Remote Sensing of Environment 114 (2010) 1662–1675
One exception in the Table 3 is the large October IO error (11.9%) ofthe MYD10A1. This value is much larger than the 3.8% of theMOD10A1. One possible explanation is that the MODIS sensor in Aquamight not have been in a good condition in October. However, it ishard to believe that the MODIS sensor in Aqua has similar andconsistent performance as the MODIS sensor in Terra for all othermonths, except for October for the 3 years in a row. Therefore, furtherexplanation for this observation remains open.
4.2. Multi-temporal combination of Terra and Aqua MODIS snow coverproducts
Fig. 6 shows the mean monthly distributions of cloud and snowcoverage of fixed 2-, 4-, 6-, and 8-day and flexible multi-day combinedsnow cover products. It is clear that fixed-day combination progres-sively decreases cloud coverage and increases snow coverage as theincrease of composite days. In the same period, the greatest cloudreduction and snow increase are from 2-day to 4-day, followed by 4-day to 6-day, and 6-day to 8-day combinations. For example, inJanuary, the cloud reductions from 2-day to 4-day, from 4-day to 6-day, and from 6-day to 8-day are 17.5%, 11.2% and 4.7% and thecorresponding snow increases are 13.9%, 10.2% and 5.1%, respectively.This means that the magnitude of those improvements slows downalthough the losses of temporal resolution are the same (2 days).Comparing the magnitude of cloud coverage decrease and snowcoverage increase between 6-day and 8-day combined products, themean annual increase of snow coverage (3.5%) eventually exceeds thedecrease of cloud coverage (2.7%), and so does the monthly changes.These excess snow increasesmight be due to the accumulation of snowcoverage at different locations in different days. That's why the NASA/MODIS standard 8-day products (MOD10A2/MYD10A2), that is calledmaximum snow cover product of the 8 days, is known to overestimatesnow coverage (Hall & Riggs, 2007; Pu et al., 2007). All of these suggestthat persistent combinations indeed overestimate snow coverage.Thus, the persistent combination should be stopped at an appropriatetime to reduce the occurrence of snow coverage overestimation.
Table 4 summarizes the IU and IO errors of the fixed-day andflexible multi-day combined snow cover products against three yearground observations at 244 stations. The seasonal variability of IU andIO errors is again typically low in stable periods (snow-covered orsnow-free) andhigh in transitional periods,which is similar to those ofdaily products (Table 3). From 2-day to 8-day fixed combinations, theannual error and most of the monthly IU errors keep reducing whilethe IO errors keep increasing. In the stable periods, the magnitudes of
those changes are small, while, in the transitional periods, thosechanges are relatively large. The largest IO error in October increasesfrom 15.7% for 2-day to 22.1% for 4-day, 28.2% for 6-day and 31.9% for8-day products. This indicates that alongwith the increase of temporalwindows, the overestimation increases.
An example of 2- to 8-day MODIS snow cover combined mapsfrom October 26 to November 2, by fixed-day combination andflexible multi-day combination, is presented in Table 5. The threecolumns on the left show the date, cloud and snow percentage of thedaily products; the three columns on the middle show those ofpersistent fixed-day combined maps; and the three columns on theright show those of flexible multi-day combined maps. Among the8 daily products, 3 of them have cloud coverage over 10%. Themaximum snow coverage is 20.7% on November 1 while the cloudcoverage of this day is 4.9%. For the fixed-day combined maps, cloudcoverage is reduced from 11.9% of the first day to less than 1% for 2-day combined (0 of most other combined products), while the snowcoverage is increased to 24.1% for 2-day combined, and continuouslyis increased up to 39.1% for the 8-day combined map. Obviously,except the first 2-day combination, the other combinations are notneeded since in those combinations almost no cloud coverage can bereduced while excess snow coverage is accumulated. This reveals thatin persistent combinations, some unneeded combinations really exist,particularly in the snow onset and melting periods. These unneededcombinations do not reduce the cloud coverage, instead, lower thetime resolution and bring more classification errors. So, somethresholds should be used for the useful combinations to remainand reduce the unneeded combinations. This provides a strongjustification for the flexible multi-day combined approach.
Table 4Monthly and annual mean image under-(IU) and overestimation (IO) errors (%) of the multi-temporal (fixed-day and flexible multi-day) combined snow cover products for theperiod of 2006–2008 hydrological years.
Month Fixed-day combined Multi-day combined
2-day 4-day 6-day 8-day MODISMC4 MODISMC8
IU IO IU IO IU IO IU IO IU IO IU IO
Sep. 2.1 5.4 2.2 9.8 2.1 13.7 2.0 17.9 2.5 7.1 2.6 8.4Oct. 10.8 15.7 8.6 22.1 7.8 28.2 6.3 31.9 10.2 18.5 10.7 20.4Nov. 10.7 6.0 8.0 7.6 6.3 8.5 4.8 10.2 9.7 6.8 7.3 7.8Dec. 4.5 0.2 3.6 0.3 3.0 0.3 2.2 0.3 3.4 0.3 2.9 0.3Jan. 3.4 0.1 2.4 0.1 2.1 0.2 1.4 0.2 2.4 0.2 1.5 0.2Feb. 3.1 0.2 2.0 0.2 2.0 0.2 1.4 0.2 2.3 0.2 1.9 0.2Mar. 4.6 0.5 3.4 0.6 2.4 0.7 1.9 0.8 3.7 0.6 2.8 0.7Apr. 10.9 1.2 8.0 1.7 6.2 2.1 4.9 2.4 9.3 1.6 8.3 1.8May. 24.4 3.7 19.1 5.6 17.6 7.1 15.0 8.7 23.3 4.6 22.8 5.8Jun. 11.4 3.1 10.5 5.4 9.5 7.6 8.7 9.9 11.9 4.1 11.4 5.2Jul. 1.6 1.2 1.6 2.1 1.6 3.2 1.5 4.4 1.7 1.0 1.7 1.0Aug. 0.0 1.6 0.0 3.0 0.1 4.6 0.0 5.7 0.0 2.0 0.0 2.0Annual 7.0 3.5 5.7 5.3 5.1 6.7 4.2 8.0 6.6 4.1 6.1 4.6
1668 Y. Gao et al. / Remote Sensing of Environment 114 (2010) 1662–1675
For example, ourflexiblemulti-day combinations generated6 imagesover the 8-day period with snow coverage ranging from 11.6% to 24.1%and cloud coverage ranging from 0.4% to 9.2% (Table 5). From them, wecanmapand track two snowmelting andonesnowaccumulating events.The first snow melting event happened between the late afternoon ofOctober 27 and October 28 (raw cloud coverage of those 2 days were1.4% and 6.3%, respectively), that reduced the snow coverage from 24.1%to 11.6%. Then a big snowfall event on October 29 and 30 (raw cloudcoverage were 19.5% and 15.7%, respectively) followed, in which snowcover increased to 20.4% and remained until snow melted again onNovember 2, 2008.
Fig. 6 also shows the mean monthly cloud and snow coverage offlexible multi-day combined snow cover products MODISMC4 andMODISMC8. The cloud coverage of MODISMC4 (MODISMC8) rangesfrom 3.1% (3.1%) in July to 27.7% (11.9%) in December and themonthlysnow percentage ranges from 0.4% (0.4%) in July to 56.2% (70.3%) inJanuary. The curves of cloud and snow coverage for MODISMC4 aresimilar to those of the fixed 4-day combined products (MODIS4DC).The curves of cloud and snow coverage for MODISMC8 are similar tothose of the fixed 6-day combined products (MODIS6DC), while thecloud coverage of these flexible multi-day combined products insnow-covered period is lower than that of MODIS6DC. The IU and IOerrors of flexible multi-day combined products (MODISMC4 andMODISMC8) have a similar pattern as the fixed 4-day combinedproducts, and their seasonal variability is also low in stable periods andhigh in transitional periods (Table 4). MODIS flexible multi-day com-bined snow cover products have more images available during thewhole hydrological year (160 MODISMC4 vs. 91 MODIS4DC and 141MODISMC8 vs. 61 MODIS6DC), also even in the transitional months(68 MODISMC4 vs. 39 MODIS4DC and 61 MODISMC8 vs. 27MODIS6DC; please refer to Table 7). This should enable amore reliableidentification of the onset and ending date of snow cover, and providea better monitoring of the temporal variability of snow coverage.
Table 5Percentage of cloud coverage (Pc) and snow coverage (Ps) of daily MODIS adjacent temporalmaps.
MODISATD Pc (%) Ps (%) Combined Pc (
Oct. 26, 2008 11.9 16.1 1 day 11.Oct. 27, 2008 1.4 19.6 2 days 0.Oct. 28, 2008 6.3 11.6 3 days 0.Oct. 29, 2008 19.5 9.5 4 days 0.Oct. 30, 2008 15.7 18.6 5 days 0.Oct. 31, 2008 8.4 19.6 6 days 0.Nov. 1, 2008 4.9 20.7 7 days 0.Nov. 2, 2008 3.9 15.2 8 days 0.
4.3. Multi-sensor combination of MODIS and AMSR-E
The distributions of mean monthly snow coverage of AMSR-E andmulti-sensor combined snow cover products are presented in Fig. 7.Passive microwave remote sensing has the ability to penetrate clouds,so the AMSR-E product has no cloud obscuration. The mean snowcoverage of daily AMSR-E ranges from 0.9% in July to 75.4% in January.After multi-sensor combinations, the three new products, dailyMODISATD_AE, and multi-day MODISMC4_AE and MODISMC8_AE,remove the annual cloud coverage by 36.2% from MODISATD, 14.3%from MODISMC4, and 7% from MODISMC8, and increase the annualsnow cover retrieval by 13.3%, 5.3%, and 2.3%, respectively.
Table 6 shows the classification errors of AMSR-E andmulti-sensorcombined snow cover products. The direct comparison between thestandard daily AMSR-E products andMODIS products (Table 3) showsthat both have higher IU than IO errors. The degree of monthly andannually underestimation error (IU) of the AMSR-E products is muchhigher than that of the MODIS products since the spatial resolution ofAMSR-E is coarse. The IO errors of both MODIS and AMSR-E are small(less than 2.5%) and similar. The comparison between multi-sensorcombined products and its corresponding MODIS products (MOD-ISATD_AE vs. MODISATD; MODISMC4_AE vs. MODISMC4 and MOD-ISMC8_AE vs. MODISMC8) indicates that the multi-sensorcombination tends to increase the IU errors and decrease IO errors todifferent degrees. The three new products, daily MODISATD_AE, andmulti-day MODISMC4_AE and MODISMC8_AE, increase the annual IUerrors by 11.4% fromMODISATD, 6.1% fromMODISMC4, and 3.7% fromMODISMC8, and decrease the annual IO errors by 0.6%, 0.6%, and 0.4%,respectively. The MODISATD_AE product has the largest cloudreplacement, thus the largest increase of the IU errors. In contrast,MODISMC8_AE product has the smallest cloud replacement, thus thesmallest increase of the IU errors. Therefore, multi-sensor combina-tions do cause more uncertainty due to the coarse spatial resolution of
deduction maps, their fixed-day combined and flexible multi-day combined snow cover
%) Ps (%) MODISMC Pc (%) Ps (%)
9 16.1 Oct. 26–27 0.4 24.14 24.11 25.7 Oct. 28 6.3 11.60 26.6 Oct. 29–30 9.2 20.40 31.90 36.1 Oct. 31, 2008 8.4 19.60 38.7 Nov. 1, 2008 4.9 20.70 39.1 Nov. 2, 2008 3.9 15.2
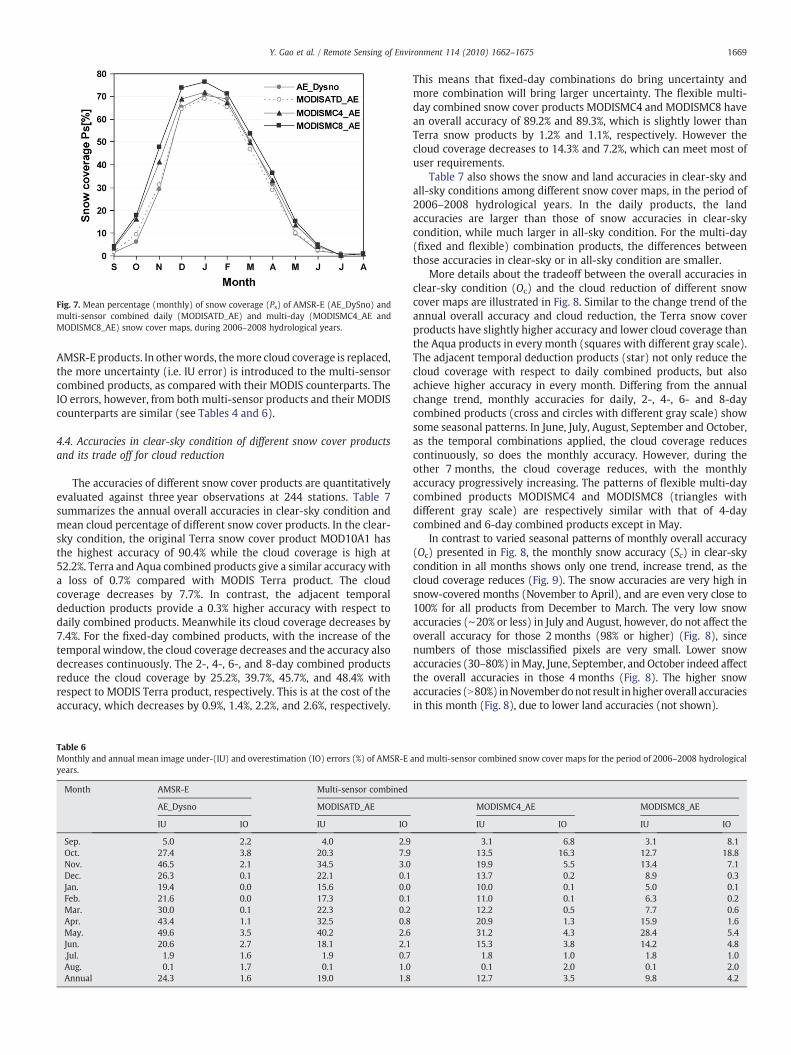
Fig. 7. Mean percentage (monthly) of snow coverage (Ps) of AMSR-E (AE_DySno) andmulti-sensor combined daily (MODISATD_AE) and multi-day (MODISMC4_AE andMODISMC8_AE) snow cover maps, during 2006–2008 hydrological years.
1669Y. Gao et al. / Remote Sensing of Environment 114 (2010) 1662–1675
AMSR-E products. In otherwords, themore cloud coverage is replaced,the more uncertainty (i.e. IU error) is introduced to the multi-sensorcombined products, as compared with their MODIS counterparts. TheIO errors, however, from both multi-sensor products and their MODIScounterparts are similar (see Tables 4 and 6).
4.4. Accuracies in clear-sky condition of different snow cover productsand its trade off for cloud reduction
The accuracies of different snow cover products are quantitativelyevaluated against three year observations at 244 stations. Table 7summarizes the annual overall accuracies in clear-sky condition andmean cloud percentage of different snow cover products. In the clear-sky condition, the original Terra snow cover product MOD10A1 hasthe highest accuracy of 90.4% while the cloud coverage is high at52.2%. Terra and Aqua combined products give a similar accuracy witha loss of 0.7% compared with MODIS Terra product. The cloudcoverage decreases by 7.7%. In contrast, the adjacent temporaldeduction products provide a 0.3% higher accuracy with respect todaily combined products. Meanwhile its cloud coverage decreases by7.4%. For the fixed-day combined products, with the increase of thetemporal window, the cloud coverage decreases and the accuracy alsodecreases continuously. The 2-, 4-, 6-, and 8-day combined productsreduce the cloud coverage by 25.2%, 39.7%, 45.7%, and 48.4% withrespect to MODIS Terra product, respectively. This is at the cost of theaccuracy, which decreases by 0.9%, 1.4%, 2.2%, and 2.6%, respectively.
Table 6Monthly and annual mean image under-(IU) and overestimation (IO) errors (%) of AMSR-Eyears.
Month AMSR-E Multi-sensor combined
AE_Dysno MODISATD_AE
IU IO IU IO
Sep. 5.0 2.2 4.0 2.9Oct. 27.4 3.8 20.3 7.9Nov. 46.5 2.1 34.5 3.0Dec. 26.3 0.1 22.1 0.1Jan. 19.4 0.0 15.6 0.0Feb. 21.6 0.0 17.3 0.1Mar. 30.0 0.1 22.3 0.2Apr. 43.4 1.1 32.5 0.8May. 49.6 3.5 40.2 2.6Jun. 20.6 2.7 18.1 2.1.Jul. 1.9 1.6 1.9 0.7Aug. 0.1 1.7 0.1 1.0Annual 24.3 1.6 19.0 1.8
This means that fixed-day combinations do bring uncertainty andmore combination will bring larger uncertainty. The flexible multi-day combined snow cover products MODISMC4 and MODISMC8 havean overall accuracy of 89.2% and 89.3%, which is slightly lower thanTerra snow products by 1.2% and 1.1%, respectively. However thecloud coverage decreases to 14.3% and 7.2%, which can meet most ofuser requirements.
Table 7 also shows the snow and land accuracies in clear-sky andall-sky conditions among different snow cover maps, in the period of2006–2008 hydrological years. In the daily products, the landaccuracies are larger than those of snow accuracies in clear-skycondition, while much larger in all-sky condition. For the multi-day(fixed and flexible) combination products, the differences betweenthose accuracies in clear-sky or in all-sky condition are smaller.
More details about the tradeoff between the overall accuracies inclear-sky condition (Oc) and the cloud reduction of different snowcover maps are illustrated in Fig. 8. Similar to the change trend of theannual overall accuracy and cloud reduction, the Terra snow coverproducts have slightly higher accuracy and lower cloud coverage thanthe Aqua products in every month (squares with different gray scale).The adjacent temporal deduction products (star) not only reduce thecloud coverage with respect to daily combined products, but alsoachieve higher accuracy in every month. Differing from the annualchange trend, monthly accuracies for daily, 2-, 4-, 6- and 8-daycombined products (cross and circles with different gray scale) showsome seasonal patterns. In June, July, August, September and October,as the temporal combinations applied, the cloud coverage reducescontinuously, so does the monthly accuracy. However, during theother 7 months, the cloud coverage reduces, with the monthlyaccuracy progressively increasing. The patterns of flexible multi-daycombined products MODISMC4 and MODISMC8 (triangles withdifferent gray scale) are respectively similar with that of 4-daycombined and 6-day combined products except in May.
In contrast to varied seasonal patterns of monthly overall accuracy(Oc) presented in Fig. 8, the monthly snow accuracy (Sc) in clear-skycondition in all months shows only one trend, increase trend, as thecloud coverage reduces (Fig. 9). The snow accuracies are very high insnow-covered months (November to April), and are even very close to100% for all products from December to March. The very low snowaccuracies (∼20% or less) in July and August, however, do not affect theoverall accuracy for those 2 months (98% or higher) (Fig. 8), sincenumbers of those misclassified pixels are very small. Lower snowaccuracies (30–80%) inMay, June, September, andOctober indeed affectthe overall accuracies in those 4 months (Fig. 8). The higher snowaccuracies (N80%) inNovemberdonot result inhigher overall accuraciesin this month (Fig. 8), due to lower land accuracies (not shown).
and multi-sensor combined snow cover maps for the period of 2006–2008 hydrological
MODISMC4_AE MODISMC8_AE
IU IO IU IO
3.1 6.8 3.1 8.113.5 16.3 12.7 18.819.9 5.5 13.4 7.113.7 0.2 8.9 0.310.0 0.1 5.0 0.111.0 0.1 6.3 0.212.2 0.5 7.7 0.620.9 1.3 15.9 1.631.2 4.3 28.4 5.415.3 3.8 14.2 4.81.8 1.0 1.8 1.00.1 2.0 0.1 2.0
12.7 3.5 9.8 4.2

Table 7Comparisons of overall accuracies in clear-sky (Oc) and all-sky conditions (Oa), mean cloud percentages (Pc), the number of images in one hydrological year (transition period:October–November and April–June), snow accuracies in clear-sky (Sc) and all-sky conditions (Sa), land accuracies in clear-sky (Lc) and all-sky conditions (La), among different snowcover maps, in the period of 2006–2008 hydrological years.
Oc (%) Pc (%) Oa (%) Total images Sc (%) Sa (%) Lc (%) La (%)
Terra MOD10A1 90.4 52.2 40.0 363 (151) 79.5 25.4 98.5 60.7Aqua MYD10A1 88.3 56.2 34.3 365 (152) 76.7 20.0 95.8 54.8Daily combined MODISDC 89.7 44.5 45.6 365 (152) 82.2 31.1 95.6 66.3Adjacent temporal deduction MODISATD 90.0 37.1 51.5 365 (152) 83.0 36.0 95.8 73.7Fixed-day combination 2 days 89.5 27.0 60.8 183 ( 76) 85.5 47.7 93.2 79.4
4 days 89.0 12.5 73.9 91 ( 39) 89.1 66.4 88.9 84.56 days 88.2 6.5 79.9 61 ( 27) 90.9 77.8 84.8 83.08 days 87.8 3.8 82.6 46 ( 21) 92.6 83.9 81.6 80.9
Multi-day combined MODISMC4 89.2 14.3 72.0 160 ( 68) 87.6 64.3 91.1 83.0MODISMC8 89.3 7.2 79.4 141 ( 61) 89.2 76.5 89.4 83.5
AMSR-E AE_DySno / 0.0 74.1 364 (152) / 58.7 / 96.2Multi-sensor combined MODISATD_AE / 0.0 79.2 365 (152) / 67.6 / 95.6
MODISMC4_AE / 0.0 83.8 160 ( 68) / 78.4 / 91.5MODISMC8_AE / 0.0 86.0 141 ( 61) / 83.4 / 89.9
1670 Y. Gao et al. / Remote Sensing of Environment 114 (2010) 1662–1675
4.5. Regional variability of accuracy in all-sky condition and trade offbetween temporal resolution and spatial resolution
The overall accuracies in all-sky condition can evaluate the realperformance of different snow products in applications such ashydrological modeling. Table 7 also shows the annual overallaccuracies in all-sky conditions and the mean number of imageswithin one hydrological year and in those transitional months(October–November and April–June). For all daily products, themulti-sensor combined snow product (MODISATD_AE), with thepixel size of 500 m, has an highest overall accuracy of 79.2%, which isslightly larger than the 74.1% of the AMSR-E snow product, and muchlarger than accuracies of the other four MODIS products (MOD10A1,MYD10A1, MODISDC, and MODISATD). This is due to the advantagesof the effectiveness of MODIS high spatial resolution and AMSR-Ecloud penetration ability. For the fixed 2-, 4-, 6- and 8-day combined
Fig. 8. Trade off between the monthly overall accuracy in clear-sky condition Oc (Eq. (5)) andyears (S is September, O is October, and etc.).
products with spatial resolution of 500 m, the accuracy increases from60.8%, to 73.9%, to 79.9%, and to 82.6%. This is at the expense ofdecreasing temporal resolution from 2- to 8-day. The flexible multi-day combined products MODISMC4 and MODISMC8, with a spatialresolution of 500 m, give the accuracy of 72.0% and 79.4%, respectivelyat the mean loss of 2.3 to 2.6 days temporal resolution. The multi-daymulti-sensor combined products MODISMC4_AE and MODISMC8_AEalso have higher accuracies of 83.8% and 86.0%, while they lost certainspatial resolution. Fig. 10 shows the variability of monthly overallaccuracies in all-sky condition vs. cloud percentage for different snowmaps. The characteristics of the monthly change are very similar tothe annual situations shown in Table 7, in which the overall accuracyincreases as the cloud coverage decreases.
Fig. 11 shows the regional variability of the overall accuracy in all-sky condition for different daily snow cover products. The accuraciesare calculated separately based on the four elevation zones of SNOTEL
cloud coverage Pc (Eq. (1)) of different snow cover products in 2006–2008 hydrological
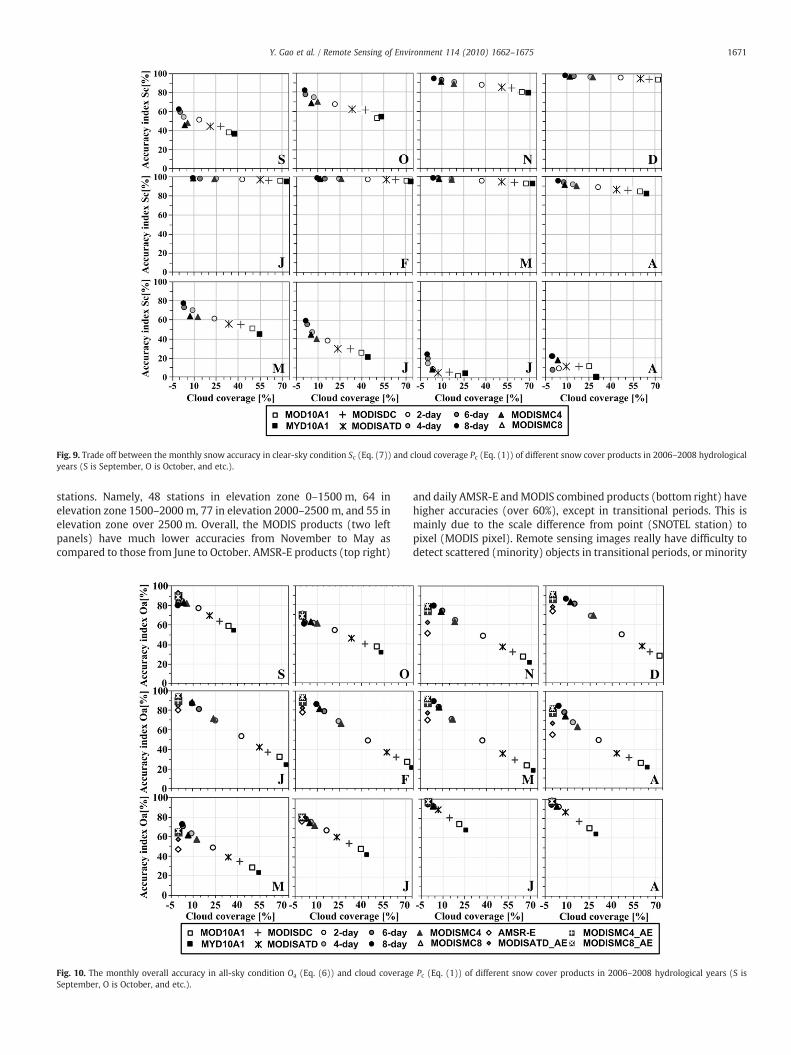
Fig. 9. Trade off between the monthly snow accuracy in clear-sky condition Sc (Eq. (7)) and cloud coverage Pc (Eq. (1)) of different snow cover products in 2006–2008 hydrologicalyears (S is September, O is October, and etc.).
1671Y. Gao et al. / Remote Sensing of Environment 114 (2010) 1662–1675
stations. Namely, 48 stations in elevation zone 0–1500 m, 64 inelevation zone 1500–2000 m, 77 in elevation 2000–2500 m, and 55 inelevation zone over 2500 m. Overall, the MODIS products (two leftpanels) have much lower accuracies from November to May ascompared to those from June to October. AMSR-E products (top right)
Fig. 10. The monthly overall accuracy in all-sky condition Oa (Eq. (6)) and cloud coverageSeptember, O is October, and etc.).
and daily AMSR-E andMODIS combined products (bottom right) havehigher accuracies (over 60%), except in transitional periods. This ismainly due to the scale difference from point (SNOTEL station) topixel (MODIS pixel). Remote sensing images really have difficulty todetect scattered (minority) objects in transitional periods, or minority
Pc (Eq. (1)) of different snow cover products in 2006–2008 hydrological years (S is
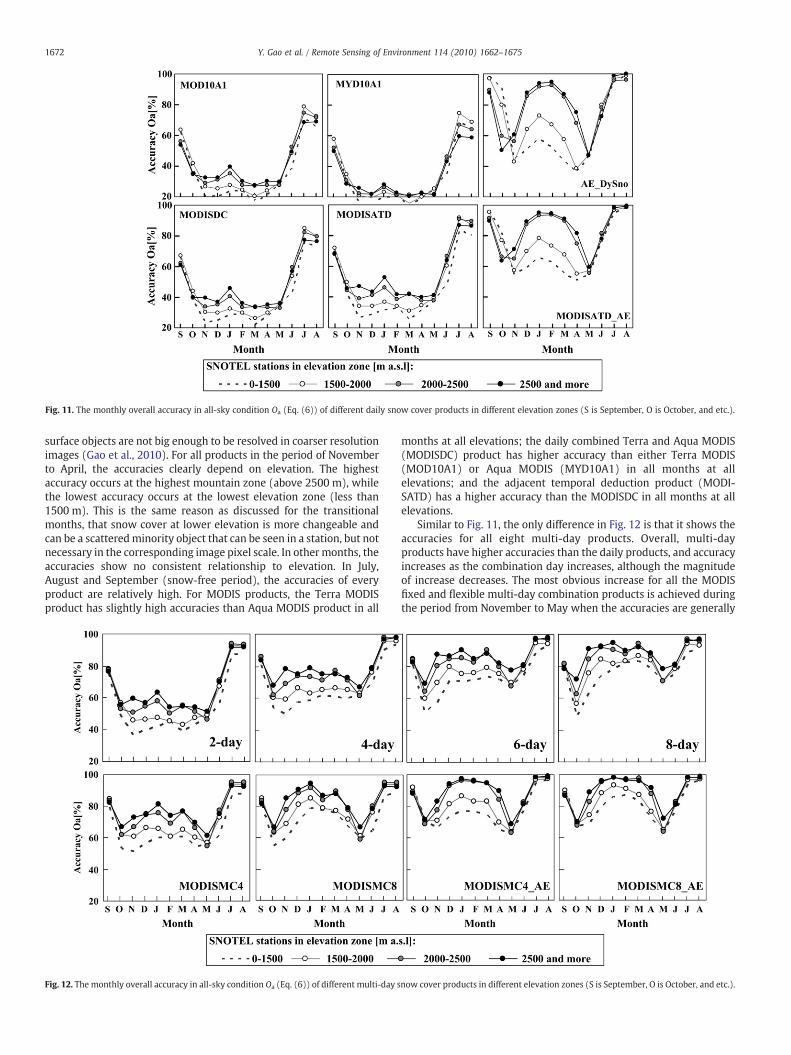
Fig. 11. The monthly overall accuracy in all-sky condition Oa (Eq. (6)) of different daily snow cover products in different elevation zones (S is September, O is October, and etc.).
1672 Y. Gao et al. / Remote Sensing of Environment 114 (2010) 1662–1675
surface objects are not big enough to be resolved in coarser resolutionimages (Gao et al., 2010). For all products in the period of Novemberto April, the accuracies clearly depend on elevation. The highestaccuracy occurs at the highest mountain zone (above 2500 m), whilethe lowest accuracy occurs at the lowest elevation zone (less than1500 m). This is the same reason as discussed for the transitionalmonths, that snow cover at lower elevation is more changeable andcan be a scatteredminority object that can be seen in a station, but notnecessary in the corresponding image pixel scale. In othermonths, theaccuracies show no consistent relationship to elevation. In July,August and September (snow-free period), the accuracies of everyproduct are relatively high. For MODIS products, the Terra MODISproduct has slightly high accuracies than Aqua MODIS product in all
Fig. 12. The monthly overall accuracy in all-sky condition Oa (Eq. (6)) of different multi-day s
months at all elevations; the daily combined Terra and Aqua MODIS(MODISDC) product has higher accuracy than either Terra MODIS(MOD10A1) or Aqua MODIS (MYD10A1) in all months at allelevations; and the adjacent temporal deduction product (MODI-SATD) has a higher accuracy than the MODISDC in all months at allelevations.
Similar to Fig. 11, the only difference in Fig. 12 is that it shows theaccuracies for all eight multi-day products. Overall, multi-dayproducts have higher accuracies than the daily products, and accuracyincreases as the combination day increases, although the magnitudeof increase decreases. The most obvious increase for all the MODISfixed and flexible multi-day combination products is achieved duringthe period from November to May when the accuracies are generally
now cover products in different elevation zones (S is September, O is October, and etc.).

1673Y. Gao et al. / Remote Sensing of Environment 114 (2010) 1662–1675
lower than those of other months in the MODIS daily products(Fig. 11). Also during this period, all products exhibit better accuracyat higher elevation. This is also similar to what is seen for the dailyproducts (Fig. 11). It is very clear that the accuracies in the twotransitional periods (October–November and April–June) are lowerthan other months in all multi-day combination products. This is dueto the larger mapping errors in those months as discussed earlier(Tables 3, 4, and 6).
5. Discussion and conclusions
The overall accuracies in clear-sky condition (88–90%) of dailyTerra and/or Aqua MODIS products in the area of study (Table 7) areslightly lower than the ∼93% from other areas (Hall & Riggs, 2007).This could be attributed to several reasons. One is the differentmapping accuracies and physiographic characteristics of the SNOTELstations. Among the 244 stations, ∼20% of them are located atelevations lower than 1500 m. As shown in Figs. 11 and 12, from thisgroup of elevation/SNOTEL stations, MODIS shows the lowest overallaccuracy since the scale difference from SNOTEL point to MODIS pixel(Gao et al., 2010). This would have contributed in reducing the overallmapping accuracy of the study area. Second, as shown in Fig. 8, thereis a big difference in overall accuracy from month to month or fromseason to season. In particular, the overall accuracy for snow-coveredmonths are actually very high over 95%, while for those transitionalmonths (October, November, April, May, and June), the values aremuch lower. Those low values from the five transitional months havelowered the overall accuracy for the area. Last but not the least, thethreshold value of 0.1 in (or 2.5 mm) of snow depth in this study usedto define snow/no snow from SNOTEL stationwould also contribute tothe lower overall accuracy of MODIS products, since many otherstudies used 1–4 cm of snow depth to define snow or no snow fromin situ measurements (Liang et al., 2008a; Maurer et al., 2003; Tekeliet al., 2005; Wang et al., 2008; Xie et al., 2009; etc.). In the 1–4 cmsnow depth range, remote sensing, of course, would achieve highoverall accuracy, since remote sensing has difficulty to map thin andmarginal snow covers as discussed before.
The primary objective of this study is to examine differentapproaches in reducing cloud obscuration and to generate productsthat satisfy the requirements for different applications. Variousapproaches including daily combination, adjacent temporal deduc-tion, fixed-day combination, flexible multi-day combination andmulti-sensor combination are examined and applied in the PacificNorthwest USA. The overall performances of different snow covermaps are quantitatively evaluated through cloud and snow percen-tages, misclassification error and overall accuracy against three yearobservations at 244 SNOTEL stations.
Daily combination merges two MODIS snow products on a pixelbasis according to the priority principle, i.e. snowNno snow (land)Nclouds. Terra and Aqua MODIS combination reduces the cloudobscuration by 11.7% over MOD10A1 and 7.7% over MYD10A1. Thusthe accuracy in all-sky condition increases from 40%/34.4% to 45.6%.Similar results have been reported in many other researches (Parajka& Blöschl, 2008; Wang et al., 2009; Wang & Xie, 2009; Xie et al., 2009;Yang et al., 2006). The adjacent temporal deduction method uses theinformation of two temporal adjacent images to deduce cloud pixelson the current day image. If one pixel in the current image is cloud,while land (snow) is shown in the corresponding pixel in bothpreceding and following images, this cloud pixel of the current imageis then assigned as land (snow). Application of this method results inan additional 7.4% reduction in cloud coverage, with respect to thedaily combined snow cover map. In addition, this method reduces theIU/IO errors and increases the overall accuracies in all-sky condition to51.5%. Therefore, the adjacent temporal deduction is an efficientmethod to reduce cloud obscuration and improve the overall accuracy.However, it should be noticed that although the adjacent temporal
deduction shows the advantage and improvement on snow mappingaccuracy, it is by no means that one has to use it before any multi-dayor multi-sensor combinations can be performed. In particular, there isno way that the method can be used in operational context. However,an image in a previous day can always been used for this approach.
Fixed-day combined approaches merge 2- to 8-day consecutiveimages to produce maximum snow coverage and minimum cloudcoverage. The results reveal that combination reduces the meanannual cloud coverage over the study area from 37.1% (MODIS dailyadjacent temporal deduction snow cover maps) to 27.0% (2-daycombined), 12.5% (4-day combined), 6.5% (6-day combined), and to3.8% (8-day combined), while the overall accuracy in clear-skycondition slightly decreases from 90.0% to 89.5%, 89.0%, 88.2% and87.8%, respectively. A similar temporal filter was tested by Parajka andBlöschl (2008) over Austria and verifies against daily snow depthobservations at 754 climate stations. Their results demonstratethat 63% cloud coverage of the Aqua images is reduced to 52% forcombined Aqua–Terra images, 46% for the spatial filter, 34% for the 1-day temporal filter, and 4% for the 7-day temporal filter, and thecorresponding overall accuracies are 95.5%, 94.9%, 94.2%, 94.4% and92.1%, respectively. In all months except December, the cloudcoverage decreases, so does the accuracy as progressively more dataare merged. In this study, however, from 2- to 8-day combinations,the variability of monthly overall accuracy (in clear-sky condition)shows a typically seasonal pattern, reduces from June to October (notmuch change in July and August) as cloud decrease, but increasesfromNovember to May (Fig. 8). This suggests that, in the snowfall andmost snow-covered months, the overall accuracies actually increasedue to the progressive combinations to reduce cloud coverage. Thesnow accuracies in clear-sky for all products (Fig. 9), however, arevery similar and very high from November to April, although they aremuch lower in other months or even less than 20% in July and August.
As the temporal window gets larger, the cloud coverage decreasesand the snow coverage increases progressively. Meanwhile, theaccuracy in all-sky condition for the fixed 2-, 4-, 6- and 8-daycombined products increases from 60.8%, to 73.9%, to 79.9%, and to82.6%, respectively. Interestingly, although from 2-day to 4-day, from4-day to 6-day and from 6-day to 8-day, the losses of temporalresolution are all the same 2 days, the magnitude of cloud reductionand accuracy increase slows down, while the excess snow indeedhappens since the accumulation of snow coverage at differentlocations in different days. Our monthly and annual results indicatethat some unneeded combinations really exist in the persistentcombinations, particularly in the snow onset and melting periods(transition periods). Therefore the persistent combination should bestopped at an appropriate time for the useful combinations to remainand reduce the unneeded combinations.
In this study, two thresholds, i.e. maximum cloud percentage (P)and maximum composite days (N), are used to control the flexibletemporal windows and generate flexible multi-day combined snowcover products. These two thresholds are user-defined parametersthat can be changed depending on the application. In our case ofthree year data for the study area, most of the procedures wereterminated by the threshold P (10%). For example, for the thresholdN=4, the procedures were terminated by P for 366 times and by N for114 times; for the threshold N=8, the procedures were terminatedby P for 404 times and by N for 19 times. This means that, in the3 years, there were 19 cases of continuous 8 days or 114 times ofcontinuous 4 days, with mean cloud cover of the area over 10%. Theaccuracy in all-sky condition of flexible 4-day and 8-day combinedproducts is 72.0% and 79.4%, respectively. Its spatial resolution is500 m and its mean temporal resolution is 2.3 and 2.6 days/image,which is consistent with Xie et al. (2009) in cases of Colorado Plateauand in Northern Xinjiang, China. Compared with fixed-day combina-tions, this product should enable a more reliable identification of theonset and ending date of snow cover, and bemore suitable tomap and
1674 Y. Gao et al. / Remote Sensing of Environment 114 (2010) 1662–1675
track the temporal variability of snow coverage. Therefore, it is arguedthat such a flexible combination method is relevant to maintain thebalance of temporal resolution and realistic estimation of the snowcover extent.
Themost interesting outcomes from this study are summarized as:
(1) The primary errors of image underestimation (IU) andoverestimation (IO) occur during transition months. In thesnow-covered months, these errors are actually small, and theIU errors are always slightly larger than IO errors for all fixed-day combined products;
(2) The annual IU errors of fixed 2- and 4-day combined productsare larger than the IO errors, which are similar to the dailyproducts. This indicates an overall underestimation of snowcover from those products (1-, 2-, and 4-day); an overalloverestimation of snow cover only occurs with longercomposite days (6–8 days);
(3) The IU and IO errors of flexible multi-day combined products(MODISMC4 and MODISMC8) have a similar pattern to thefixed 4-day combined products, although the monthly percen-tages of cloud and snow cover change in the MODISMC8(MODISMC4), whichmatch better with the fixed 6-day (4-day)combined products; and
(4) theMODISMC4 andMODISMC8 have the same overall accuracyin clear-sky (89.1%), while overall accuracy of MODISMC4 in allweather conditions is slightly less than that of MODISMC8(72.3% vs. 80.2%), but with more images available (one imageper 2.3 days vs. 2.6 days).
These findings have important implications as indicated below.
1) Although the standard MODIS 8-day product represents themaximum snow cover of the 8-day period, it actually slightlyunderestimates snow cover in those snow-covered months, whilesignificantly overestimates the snow cover in transitional months,especially during snow accumulation period;
2) Among the fixed-day compositions, the fixed 4-day combinationproducts seem to be a good compromise tomaintain the balance oftemporal resolution and a realistic estimation of the snow coverextent; and
3) While flexible multi-day combination is found to outperform thefixed-day combined products in reducing cloud reduction andimproving image accuracy, the flexible 8-day combination canreduce more cloud (less than 10%), but may cause more snowoverestimation in transitional months. Meanwhile, the flexible 4-day combination may leave more cloud cover in the wintermonths (over 10%), but provides more available images. The use of4 and/or 8 days combinations as a threshold remains to bedetermined by the user as required for their specific applicationand/or study area.
The multi-sensor combined approach utilizes the informationfrom AMSR-E to update the remaining cloud pixels in the MODIS dailyor multi-day combined snow cover maps. The assessment shows thatthe overall accuracy of daily AMSR-E snow cover products, with thecoarse spatial resolution of 25 km, is 74.1% with the retrieval rate of100%. This (74.1%) is lower than the overall accuracy (90.4%) in clear-sky condition of daily Terra MODIS snow cover products, whichreflects the effectiveness of the MODIS's high spatial resolution.However, the retrieval rate of Terra MODIS is below 50% due to highcloud coverage. The low retrieval rate depletes the effectiveness of theMODIS's high spatial resolution and decreases the overall accuracy ofMODIS Terra in all-sky condition to only ∼40% (Table 7). Daily MODISand AMSR-E combined products with the pixel size of 500 m have thehighest overall accuracy in all-sky condition of 79.2% among the dailysnow cover products. This is because these blended snow coverproducts utilized advantages of the effectiveness of MODIS highspatial resolution and AMSR-E cloud penetration ability. The overall
accuracy in all-sky condition of multi-day and multi-sensor combinedproducts MODISMC4_AE and MODISMC8_AE is 83.8% and 86.3%,respectively. Its pixel size is 500 m and its mean temporal resolution is2.3 and 2.6 days/image, respectively.
Similar evaluations for multi-sensor combined products have beenperformed in diverse regions and for various sensors, but not ascomprehensive as what we tested here. For example, Liang et al.(2008b) produces new daily snow cover products through combininginformation of Terra MODIS daily snow cover product (MOD10A1) (theAqua MODIS snow cover products not included) and AMSR-E daily SWEproduct (AE_DySno) in Northern Xinjiang, China during the period fromNovember 1 to March 31 of years 2002 to 2005. The combinationsignificantly increases the snow accuracy in all-sky condition from 33.4%(MOD10A1) to 75.4%. Gao et al. (2010) generated new daily snow coverproducts utilizing Terra/Aqua MODIS and AMSR-E snow products inFairbanks and Upper Susitna Valley, Alaska area, but only for onehydrological year (October 2006 to September 2007). Their resultsindicate that the accuracy of multi-sensor combined products has thesnow accuracy in all-sky condition of 86% with respect to 31%(MOD10A1), 45% (MYD10A1) and 85% (AMSR-E). Romanov et al.(2000) develops a method of automated monitoring snow cover overNorthAmericausingGOESandSSM/I andvalidates their products againstin situ land surface observations during the winter season of 1998/1999.They found that snow identification from the combined productsoutperformed the ones based on a single satellite. Simic et al. (2004)validated MODIS MOD10A1 (500 m) and NOAA GOES+SSM/I (4 km)products for the period between January and June 2001 against 2000surface snowdepthmeasurements across Canada. TheMODIS andNOAAproducts show similar monthly agreements ranging from 80% to 100%,while the retrieval rates are40% forMODIS and100% forNOAA. Thereforethe coarser resolution NOAA productmay be sufficient for basin- or sub-basin-scale applications. All of these studies indicate that multi-sensorcombination is a useful method to improve the snow retrieval rate.
Overall, our results demonstrate that flexible multi-day and multi-sensor (i.e., MODIS and AMSR-E) combined approaches are robusttechniques which cannot only reduce the cloud coverage, but alsoremain in good agreement with ground observations. The differencebetween them is that multi-day combined methods sacrifice sometemporal resolution while multi-sensor methods sacrifice somespatial resolution. The multi-day combined map with higher spatialresolution has higher accuracy in clear-sky condition, but retainssome cloud coverage; multi-sensor combined products can eliminatethe effects of cloud obscuration, but lose some spatial resolution,while significantly increasing the overall performance since its 100%retrieval rate. The multi-sensor approach is the practical method thatyields cloud-free snow cover products. The choice of differentapproaches will depend on the requirement of specific applicationsand the meteorological conditions of various regions.
Acknowledgements
This work was in part supported by the U.S. NASA project(#NNX08AQ87G). The first author wants to thank the ChinaScholarship Council for funding her to study for 2 years (2007–2009) at the University of Texas at San Antonio. Provisions of SNOTELdata by US Department of Agriculture's National Resources Conser-vation Service (NRCS) and MODIS and AMSR-E products by NASA EOSand NSIDC are sincerely acknowledged. Critical reviews and con-structional comments from five anonymous reviewers to improve thequality of this manuscript are greatly appreciated.
References
Andreadis, K. M., & Lettenmaier, D. P. (2006). Assimilating remotely sensed snowobservations into a macroscale hydrology model. Advanced Water Resource, 29,872−886.
1675Y. Gao et al. / Remote Sensing of Environment 114 (2010) 1662–1675
Ault, T. W., Czajkowski, K. P., Benko, T., Coss, J., Struble, J., Spongberg, A., et al. (2006).Validation of the MODIS snow product and cloud mask using student and NWScooperative station observations in the Lower Great Lakes Region. Remote Sensingof Environment, 105, 341−353.
Bitner, D., Carroll, T., Cline, D., & Romanov, P. (2002). An assessment of the differencesbetween three satellite snow cover mapping techniques. Hydrological Processes, 16,3723−3733.
Blöschl, G., Kirnbauer, R., & Gutknecht, D. (1991). Distributed snowmelt simulations inan Alpine catchment. 1. Model evaluation on the basis of snow cover patterns.Water Resource Research, 27(12), 3171−3179.
Brown, R., Derksen, C., & Wang, L. (2007). Assessment of spring snow cover durationvariability over northernCanada fromsatellite datasets.Remote Sensing of Environment,111, 367−381.
Foster, J. L., Hall, D. K., Eylander, J., Kim, E. J., Riggs, G. A., Tedesco, M., et al. (2007). Blendedvisible, passivemicrowave and scatterometer global snowproducts. Proceedings of the64th Eastern Snow Conference, 28 May–1 June 2007, St. John's, Newfoundland, Canada.
Foster, J. L., Hall, D. K., Eylander, J., Riggs, G. A., Kim, E. J., Tedesco, M., et al. (2008). A newblended global snow product using visible, passive microwave, and scatterometersatellite data. Proceedings of the American Meteorological Society Annual Meeting,21–24 January 2008, New Orleans, LA.
Gafurov, A., & B'ardossy, A. (2009). Cloud removal methodology from MODIS snowcover product. Hydrology and Earth System Sciences, 13(7), 1361−1373.
Gao, Y., Xie, H., Lu, N., Yao, T. D., & Liang, T. G. (2010). Toward advanced daily cloud-freesnow cover and snowwater equivalent products from Terra–AquaMODIS and AquaAMSR-E measurements. Journal of Hydrology, 385, 23−35.
Grayson, R. B., Blöschl, G., Western, A. W., &McMahon, T. A. (2002). Advances in the useof observed spatial patterns of catchment hydrological response. Advances WaterResource, 25, 1313−1334.
Hall, D. K., Montesano, P. M., Foster, J. L., Riggs, G. A., Kelly, R. E. J., & Czajkowski, K.(2007). Preliminary evaluation of the AFWA-NASA blended snow cover P productover the Lower Great Lakes region. Proceedings of the 64th Eastern Snow Conference,28 May–1 June 2007, St. John's, Newfoundland, Canada.
Hall, D. K., & Riggs, G. A. (2007). Accuracy assessment of the MODIS snow products.Hydrological Processes, 21, 1534−1547.
Hall, D. K., Riggs, G. A., Foster, J. L., & Kumar, S. V. (2010). Development and evaluation ofa cloud-gap-filledMODIS daily snow-cover product. Remote Sensing of Environment,114, 496−503.
Hall, D. K., Riggs, G. A., & Salomonson, V. V. (2007). Updated daily. MODIS/Terra AquaSnow Cover Daily L3 Global 500 m SIN GRID V005, September to August 2005–2008.Boulder, Colorado USA: National Snow and Ice Data Center Digital media.
Houborg, R., Soegaard, H., & Boegh, E. (2007). Combining vegetation index and modelinversion methods for the extraction of key vegetation biophysical parametersusing Terra and Aqua MODIS reflectance data. Remote Sensing of Environment, 106,39−58.
Kawanishi, T., Sezai, T., Ito, Y., Imaoka, K., Takeshima, T., Ishido, Y., et al. (2003). TheAdvanced Microwave Scanning Radiometer for the Earth Observing System(AMSR-E). NASDA's contribution to the EOS for global energy and water cyclestudies. IEEE Transactions on Geoscience and Remote Sensing, 41(2), 184−194.
Kelly, R. E., Chang, A. T. C., & Foster, J. L. (2007). Updated daily AMSR-E/Aqua daily L3global snow water equivalent EASE-Grids V002, September to August 2005–2008.Boulder, Colorado, USA: National Snow and Ice Data Center Digital media.
Kelly, R. E., Chang, A. T., Leung, T., & Foster, J. L. (2003). A prototype AMSR-E global snowarea and snow depth algorithm. IEEE Transactions on Geoscience and Remote Sensing,41(2), 230−242.
Klein, A. G., & Barnett, A. C. (2003). Validation of daily MODIS snow cover maps of theUpper Rio Grande River Basin for the 2000–2001 snow year. Remote Sensing ofEnvironment, 86, 162−176.
Kunkel, K. E., Palecki,M. A., Hubbard,K.G., Robinson,D.A., Redmond, K. T., & Easterling,D.R.(2007). Trend identification in twentieth-centuryU.S. snowfall: The challenges. Journalof Atmosphere and Oceanic Technology, 24, 64−73. doi:10.1175/JTECH2017.1.
Li, B., Zhu, A. X., Zhou, C., Zhang, Y., Pei, T., & Qin, C. (2008). Automatic mapping of snowcover depletion curves using optical remote sensingdata under conditions of frequentcloud cover and temporary snow. Hydrological Processes, 22(16), 2930−2942. doi:10.1002/hyp.6891.
Liang, T. G., Huang, X. D., Wu, C. X., Liu, X. Y., Li, W. L., Guo, Z. G., et al. (2008). Anapplication ofMODIS data to snow covermonitoring in a pastoral area: A case studyin Northern Xinjiang, China. Remote Sensing of Environment, 112, 514−1526.
Liang, T. G., Zhang, X. T., Xie, H., Wu, C. X., Feng, Q. S., Huang, X. D., et al. (2008). Towardimproveddaily snowcovermappingwithadvanced combinationofMODISandAMSR-Emeasurements. Remote Sensing of Environment, 112(10), 3750−3761.
Lobl, E., Spencer, W. R., Shibata, A., Imaoka, K., Sasaki, M., & Kachi, M. (2002). Globalclimate monitoring with the Advanced Microwave Scanning Radiometer (AMSRand AMSR-E). SPIE 3rd Int'l Asia-Pacific Environmental Remote Sensing Symposium,Hangzhou, China, 2002.
Lopez, P., Sirguey, P., Arnaud, Y., Pouyaud, B., & Chevallier, P. (2008). Snowcovermonitoringin the Northern Patagonia Icefield using MODIS satellite images (2000–2006). Globaland Planetary Change, 61(3–4), 103−116.
Maurer, E. P., Rhoads, J. D., Dubayah, R. O., & Lettenmaier, D. P. (2003). Evaluation of thesnow covered area data product from MODIS. Hydrological Processes, 17, 59−71.
MODIS Reprojection Tool (MRT). (2004). Users guide. Release 3.2a.: Department ofMathematics and Computer Science, South Dakota School ofMines and Technology,USGS EROS Data Center 58 pp.
Parajka, J., & Blöschl, G. (2006). Validation of MODIS snow cover images over Austria.Hydrology and Earth System Science, 10, 679−689.
Parajka, J., & Blöschl, G. (2008). Spatio-temporal combination of MODIS images—Potential for snow cover mapping. Water Resource Research, 44, W03406. doi:10.1029/2007WR006204.
Pu, Z. X., Xu, L., & Salomonson, V. (2007). MODIS/Terra observed seasonal variations ofsnow cover over the Tibetan Plateau.Geophysical Research Letters, 34, L06706. doi:10.1029/2007GL029262 6 pp.
Riggs, G. A., & Hall, D. K. (2003). Reduction of cloud obscuration in theMODIS snow dataproduct. Proceedings of the 60th Eastern Snow Conference, Sherbrooke, Québec, 4–6,June, 2003 (pp. 205−212).
Rodell, M., & Houser, P. R. (2004). Updating a land surface model with MODIS derivedsnow cover. Journal of Hydrometeorology, 5(6), 1064−1075.
Romanov, P., Gutman, G., & Csiszar, I. (2000). Automated monitoring of snow coverover North America withmultispectral satellite data. Journal of Applied Meteorology,39(11), 1866−1880.
Simic, A., Fernandes, R., Brown, R., Romanov, P., & Park, W. (2004). Validation ofVEGETATION, MODIS, and GOES+SSM/I snow cover products over Canada basedon surface snow depth observations. Hydrological Processes, 18, 1089−1104.
Sorman, A.Ü., Akyürek, Z., Sorman, A. A., & Tekeli, A. E. (2007). Commentary oncomparison of MODIS snow cover and albedo products with ground observationsover themountainous terrain of Turkey.Hydrology and Earth System Sciences, 11(4),1353−1360.
Taaheri, A., Liu, Y. and Cohen, A. (2007). HDF-EOS to GeoTiff conversion tool (HEG) stand-alone user's guide, V 2.8r5, technical paper, Raytheon Company, Upper Marlboro,Maryland.
Tekeli, A. E., Akyürekb, Z., Sorman, A. A., Sensoyc, A., & Sormana, A. (2005). UsingMODISsnow cover maps in modeling snowmelt runoff process in the eastern part ofTurkey. Remote Sensing of Environment, 97(2), 216−230.
Tong, J., D'ery, S. J., & Jackson, P. L. (2009). Topographic control of snow distribution inan alpine watershed of eestern Canada inferred from spatially-filteredMODIS snowproducts. Hydrology and Earth System Sciences, 13, 319−326.
Udnaes, H. C., Alfnes, E., & Andreassen, L. M. (2007). Improving runoff modeling usingsatellite-derived snow cover area. Nordic Hydrology, 38(1), 21−32.
Wang, X., & Xie, H. (2009). New methods for studying the spatiotemporal variation ofsnow cover based on combination products of MOIDS Terra and Aqua. Journal ofHydrology, 371(1–4), 192−200.
Wang, X., Xie, H., & Liang, T. (2008). Evaluation of MODIS snow cover and cloud maskand its application in Northern Xinjiang, China. Remote Sensing of Environment, 112,1497−1513.
Wang, X., Xie, H., Liang, T., & Huang, X. (2009). Comparison and validation of MODISstandard and new combination of Terra and Aqua snow cover products in NorthernXinjiang, China. Hydrological Processes, 23(3), 419−429.
Xie, H., Wang, X., & Liang, T. (2009). Development and assessment of combined Terraand Aqua snow cover products in Colorado Plateau, USA and northern Xinjiang,China. Journal of Applied Remote Sensing, 3, 033559. doi:10.1117/1.3265996.
Yang, W., Shabanov, N. V., Huang, D., Wang, W., Dickinson, R. E., Nemani, R. R., et al.(2006). Analysis of leaf area index products from combination of MODIS Terra andAqua data. Remote Sensing of Environment, 104(3), 297−312.
Zhao, H., & Fernandes, R. (2009). Daily snow cover estimation from Advanced Very HighResolution Radiometer Polar Pathfinder data over Northern Hemisphere landsurfaces during 1982–2004. Journal of Geophysical Research, 114, D05113. doi:10.1029/2008JD011272.
Zhou, X., Xie, H., & Hendrickx, M. H. J. (2005). Statistical evaluation of remotely sensedsnow-cover products with constraints from streamflow and SNOTEL measure-ments. Remote Sensing of Environment, 94, 214−231. doi:10.1016/j.rse.2004.10.007.


![[REMOTE SENSING] 3-PM Remote Sensing](https://img.dokumen.tips/doc/110x75/61f2bbb282fa78206228d9e2/remote-sensing-3-pm-remote-sensing.jpg)


