Embed Size (px)
Citation preview
ANESTHESIA SERVICES Differences between Private and Medicare Payments Likely Due to Providers’ Strong Negotiating Position Accessible Version
Report to Congressional Committees
October 2020
GAO-21-41
United States Government Accountability Office

United States Government Accountability Office
Highlights of GAO-21-41, a report to congressional committees
October 2020
ANESTHESIA SERVICES Differences between Private and Medicare Payments Likely Due to Providers’ Strong Negotiating Position
What GAO Found Literature GAO reviewed indicated that private insurance payments for anesthesia services on average were more than 3-1/2 times those of Medicare payments. This payment difference increased from what GAO reported in 2007—average private insurance payments for certain anesthesia services in 2004 were about 3 times those of Medicare. While Medicare rates for anesthesia services are set by the Centers for Medicare & Medicaid Services (CMS), private insurance rates are set through negotiations between providers and private insurers.
GAO identified three recent studies with analyses of private insurance and Medicare payments for anesthesia services:
· Researchers from Yale University calculated that private insurance payments were 3.67 times Medicare payments, on average, for services provided by anesthesiologists for one large private insurer in 2015 operating across all 50 states and the District of Columbia.
· The Health Care Cost Institute calculated that in 2017 private insurance payments ranged from 2 to 7 times Medicare payments, on average, across six common services provided by anesthesiologists in 33 states. Wide state-to-state variation within specific services was reported.
· The American Society of Anesthesiologists reported that private insurance payments were 3.46 times Medicare payments, on average, based on a survey of its members in 2019.
According to studies GAO reviewed and stakeholders GAO interviewed, market factors likely enhanced anesthesia providers’ negotiating position and allowed them to secure higher private payments. For example, several studies and stakeholders cited market concentration as a key factor that increased private payments for anesthesia services. In a market with high provider concentration—or relatively few providers in a given market—there is little competition between providers, enabling the providers within that market to negotiate for higher payments from private insurers. Studies also indicated that specialists, including anesthesia providers, could negotiate higher in-network payment rates because they were able to leave an insurer’s network with little risk of losing patients or revenue. In addition, when anesthesia providers are not a part of a private insurer’s network, they are typically able to bill for a higher amount than the insurer would pay for an in-network provider, known as out-of-network billing. This dynamic decreases providers’ incentives to participate in insurer networks because it creates an attractive alternative to network participation.
GAO’s interviews with stakeholders, literature review, and review of agency data generally did not indicate that the supply of anesthesia providers was insufficient for Medicare beneficiaries. CMS data indicate that the number of active anesthesia providers per 100,000 Medicare beneficiaries increased from 2010 through 2018 and that a very small number of anesthesia providers opted out of the Medicare program. Furthermore, researchers and stakeholders GAO interviewed were not aware of any issues with access to anesthesia services for Medicare beneficiaries, including those in traditionally underserved rural areas.
View GAO-21-41. For more information, contact Jessica Farb at (202) 512-7114 or [email protected].
Why GAO Did This Study In 2018, Medicare paid over $2 billion for anesthesia services, such as general anesthesia administered to beneficiaries undergoing surgical or other invasive procedures. The joint explanatory statement for the Further Consolidated Appropriations Act, 2020 included a provision for GAO to update its 2007 report and examine how differences in payment rates for anesthesia services have changed since that time. In 2007, GAO reported that Medicare payments in 2004 for certain anesthesia services provided by anesthesiologists were on average 67 percent lower than private insurance payments in certain geographic areas—indicating that private payments were about 3 times more than Medicare payments at that time.
This report describes what is known about (1) recent trends in differences between Medicare and private payments for anesthesia services, and (2) the sufficiency of the supply of anesthesia providers for Medicare beneficiaries. GAO reviewed literature and available published data on payment differences for anesthesia services, published in the United States since 2010. GAO also reviewed data from CMS on the number of anesthesia providers from 2010, 2018, and 2020. GAO also interviewed a nongeneralizable selection of three research groups, two beneficiary advocacy groups, and five stakeholder groups, including those representing anesthesiologists, nurse anesthetists, and hospitals, to obtain their perspectives on these issues. The Department of Health and Human Services provided no comments on this report.
Page i GAO-21-41 Payment for Anesthesia Services
Contents Letter 1
Background 5 Studies Show Differences between Private and Medicare
Payments, Over 3.5 Times Higher on Average, Likely Due to Providers’ Strong Negotiating Position 11
Data and Research Generally Do Not Indicate an Insufficient Supply of Anesthesia Providers for Medicare Beneficiaries 15
Agency Comments 18
Appendix I: GAO Contacts and Staff Acknowledgments 19
Figure
Figure 1: Example of a Medicare Payment for an Anesthesia Service in the Baltimore, MD Medicare Payment Locality in 2020 7
Abbreviations AANA American Association of Nurse Anesthetists ASA American Society of Anesthesiologists CMS Centers for Medicare & Medicaid Services CRNA certified registered nurse anesthetist HCCI Health Care Cost Institute MedPAC Medicare Payment Advisory Commission
This is a work of the U.S. government and is not subject to copyright protection in the United States. The published product may be reproduced and distributed in its entirety without further permission from GAO. However, because this work may contain copyrighted images or other material, permission from the copyright holder may be necessary if you wish to reproduce this material separately.

Page 1 GAO-21-41 Payment for Anesthesia Services
441 G St. N.W.Washington, DC 20548
Letter
October 26, 2020
The Honorable Roy Blunt Chairman The Honorable Patty Murray Ranking Member Subcommittee on Labor, Health and Human Services, Education, and Related Agencies Committee on Appropriations United States Senate
The Honorable Rosa DeLauro Chairwoman The Honorable Tom Cole Ranking Member Subcommittee on Labor, Health and Human Services, Education, and Related Agencies Committee on Appropriations House of Representatives
In 2018, Medicare paid over $2 billion for anesthesia services, close to 2 percent of the total amount paid to providers under the traditional Medicare program.1 In comparison, according to a Health Care Cost Institute (HCCI) estimate, anesthesia services comprised 6 percent of the total amount paid to providers of care for patients with certain employer-sponsored insurers in that same year.2 These services, such as general anesthesia, are administered to patients undergoing surgical or other
1Centers for Medicare & Medicaid Services, Medicare Physicians/Suppliers: Utilization and Program Payments for Original Medicare Beneficiaries, by Berenson-Eggers Type of Services (BETOS) Classification, Calendar Year 2018, accessed July 23, 2020, https://www.cms.gov/files/document/2018-MDCR-physsupp-7.pdf.
2Health Care Cost Institute, 2018 Health Care Cost and Utilization Report, accessed August 19, 2020, https://healthcostinstitute.org/images/pdfs/HCCI_2018_Health_Care_Cost_and_Utilization_Report.pdf. According to the report, anesthesia services were the second highest priced subcategory of services in 2018.

Letter
Page 2 GAO-21-41 Payment for Anesthesia Services
invasive procedures and are generally provided by anesthesiologists and certified registered nurse anesthetists (CRNA).3
Congress has raised questions about whether the differences between Medicare and private insurance payments for anesthesia services in certain geographic regions may affect the supply of anesthesia providers and adversely affect access to these services for Medicare beneficiaries, and asked us to report on payments for anesthesia services. In 2007, we reported that fee-for-service Medicare payments in 2004 for certain anesthesia services provided by anesthesiologists were on average 67 percent lower than private insurance payments in certain geographic areas—indicating that private payments were about 3 times more than Medicare payments at that time.4 Further, we found the overall supply of anesthesia providers—that is, the total number of both anesthesiologists and CRNAs per 100,000 people—was not associated with differences between Medicare and private insurance payments for anesthesia services or with the concentration of Medicare beneficiaries.5 This is an indicator that payment differences likely did not affect the supply of anesthesia providers—one way to measure beneficiary access to care—at that time.
The joint explanatory statement for the Further Consolidated Appropriations Act, 2020 includes a provision for us to update our 2007 report on Medicare and private insurance payment differences for
3For this report, we will refer to anesthesiologists and CRNAs collectively as anesthesia providers.
4GAO, Medicare Physician Payments: Medicare and Private Payment Differences for Anesthesia Services, GAO-07-463 (Washington, D.C.: July 27, 2007). Beneficiaries have two main options for their Medicare health coverage: Original Medicare, a fee-for-service program, or Medicare Advantage, the private plan alternative. In our 2007 report, we selected a set of seven anesthesia services that were prevalent and well represented across geographic areas.
5In our 2007 report, we also examined the supply of anesthesiologists and CRNAs separately, and we found correlations between practitioner supply and payment differences, as well as practitioner supply and beneficiary concentration. Specifically, we found that in 2004, the supply of CRNAs tended to decrease as the difference between Medicare and private insurance payments for anesthesia services increased in the 41 Medicare payment localities. We also found that the supply of anesthesiologists tended to decrease as the concentration of Medicare beneficiaries increased across 87 Medicare payment localities, while the supply of CRNAs tended to increase as the concentration of Medicare beneficiaries increased across these Medicare payment localities. See GAO-07-463.
Letter
Page 3 GAO-21-41 Payment for Anesthesia Services
anesthesia services and examine how payment rates have changed.6This report describes what is known about
1. recent trends in differences between Medicare and private insurance payments for anesthesia services; and
2. the sufficiency of the supply of anesthesia providers for Medicare beneficiaries.
To address both objectives, we interviewed representatives from a non-generalizable set of five stakeholder groups, two beneficiary advocacy groups, three research groups, and officials from the Centers for Medicare & Medicaid Services (CMS), the agency within the Department of Health and Human Services that administers the Medicare program. Specifically, we interviewed representatives from four stakeholder groups: the American Association of Nurse Anesthetists (AANA), America’s Health Insurance Plans, American Medical Association, and the American Society of Anesthesiologists (ASA) to obtain their perspectives on payment for and access to anesthesia services. We received written responses to questions posed to the American Hospital Association and two beneficiary advocacy groups: the Center for Medicare Advocacy and the Medicare Rights Center. We also spoke to researchers from HCCI, Yale University, and The RAND Corporation who have published work related to Medicare and private insurance payments for anesthesia and physician specialty services. We identified stakeholder groups and researchers through articles relevant to payment for anesthesia services, as well as by asking interviewees for suggested groups and researchers.
In addition, we conducted a literature review and examined publicly available data. We examined peer-reviewed literature, working papers, and industry-sponsored studies published between 2010 and 2020 in the United States. We identified about 270 study abstracts, reviewed 51 full text articles, and determined that 31 contained results that directly informed our objectives.7 Of these 31 studies, three estimated differences 6See Pub. L. No. 116-94, § 4, 133 Stat. 2534, 2536 (2019); Joint Explanatory Statement regarding H.R. 1865, the Further Continuing Appropriations Act, 2020, Congressional Record, 165 Cong. Rec. H11061 (Daily ed., Dec. 17, 2019) (incorporating H.R. Rep. No. 62, 116th Cong., 1st Sess., at 133-34 (2019)).
7We excluded studies that did not specifically include private or Medicare payments for anesthesia services, access to anesthesia services, or the supply of anesthesia providers. We identified nine potentially relevant papers that we were unable to review at the time the time of literature review due to library closures, among other logistical difficulties associated with Coronavirus Disease 2019.
Letter
Page 4 GAO-21-41 Payment for Anesthesia Services
between Medicare and private insurance payments for anesthesia services, while the 28 other studies provided information on factors that influence private insurance payment rates for anesthesia services and the supply of anesthesia providers. For the purposes of our report, we focused on traditional anesthesia services, such as general anesthesia during surgical procedures that are paid under Medicare’s physician fee schedule.8 We excluded non-anesthesia services that may be performed by anesthesia providers, such as office visits and chronic pain management procedures, because Medicare pays for these services differently than traditional anesthesia services.9 We also examined CMS Medicare provider data from 2010, 2018, and 2020; HCCI data on Medicare and private insurance payment rates from 2017; data from 2015 published by researchers at Yale University; and ASA data from 2019. We assessed the reliability of the CMS and other published data we used by reviewing related documentation and comparing it to results from our prior work. We also interviewed knowledgeable representatives about the published data used to identify payment differences. We concluded that the data were sufficiently reliable for the purposes of our reporting objectives.
We conducted this performance audit from February 2020 to October 2020 in accordance with generally accepted government auditing standards. Those standards require that we plan and perform the audit to obtain sufficient, appropriate evidence to provide a reasonable basis for our findings and conclusions based on our audit objectives. We believe that the evidence obtained provides a reasonable basis for our findings and conclusions based on our audit objectives.
8The physician fee schedule is used to pay physicians for services provided under traditional Medicare. We did not examine Medicare Advantage payments for anesthesia services, as these are developed using different payment mechanisms.
9Also, we have previously reported that a significant proportion of Medicare payments for these services are closer to private payment levels because Medicare payments are determined differently. Specifically, those rates are determined based on the relative values of the resources used for each service, adjusted for geographic differences. See GAO-07-463.

Letter
Page 5 GAO-21-41 Payment for Anesthesia Services
Background Anesthesia services, including local or general anesthesia, usually are provided to patients undergoing surgical or other invasive procedures. For these services, patients typically do not choose their anesthesia provider. They may instead choose their surgeon or facility, and the facility assigns the anesthesia providers.
Anesthesia Providers
Anesthesiologists, CRNAs, or anesthesiologists working with CRNAs or other providers can provide anesthesia services.10 All providers must meet certain education, training, certification, and licensure requirements. However, anesthesiologists and CRNAs differ in terms of the education and training they receive:
· Anesthesiologists are physicians who have completed a bachelor’s degree; medical school, typically 4 years in length; and an anesthesiology residency, typically another 4 years in length.
· CRNAs are licensed as registered professional nurses and have completed a bachelor’s degree and an anesthesia graduate program at the master’s or doctoral level, typically 2- or 3-years in length.
CRNAs, like anesthesiologists, can directly bill payers, including Medicare, for the provision of anesthesia services.11 In order for facilities to receive Medicare payment for anesthesia services, CRNAs are required to practice under the supervision of a physician or an anesthesiologist, except in states that obtained an exemption from this
10Anesthesiology assistants are another provider of anesthesia services. They have completed a bachelor’s degree and an anesthesia graduate program around 2 years in length.
11Medicare’s payment rate for anesthesia services depends on the degree of supervision provided. The ability of CRNAs to practice without supervision and bill private insurance for that care is subject to state scope of practice laws.

Letter
Page 6 GAO-21-41 Payment for Anesthesia Services
requirement from CMS.12 As of August 2020, 19 states and Guam had requested and obtained this exemption, which allows CRNAs to practice independently without physician supervision in a variety of inpatient and outpatient settings.13
Anesthesia providers can serve as solo practitioners, can organize into group practices, or can organize through large multi-specialty groups of providers known as physician staffing groups that may be comprised of hundreds or thousands of providers. In general, physician staffing groups buy up smaller physician practices to consolidate large numbers of providers into a single entity, which reduces the volume of provider entities with which insurers can contract. According to the Medicare Payment Advisory Commission (MedPAC), providers primarily choose to join physician staffing groups for higher private insurance rates and the desire of younger physicians for flexible working conditions with fewer managerial and on-call duties.14
Medicare Physician Fee Schedule Payments for Anesthesia Services
Medicare physician fee schedule payments for anesthesia services are calculated based on a service’s relative complexity, measured in base units, and the time it takes to provide the services, measured in time
12To receive payments for providing services under the Medicare program, facilities must comply with Medicare Conditions of Participation. Beginning in 2001, CMS amended Medicare Conditions of Participation, allowing CRNAs to practice without physician supervision in hospitals, critical access hospitals, and ambulatory surgical centers and still receive reimbursement for the anesthesia services they deliver to Medicare beneficiaries. For a state to qualify for this exemption, the governor of the state must submit a letter to CMS, attesting that this exemption is in the best interest of the state’s citizens and that the exemption is consistent with state law. See 42 C.F.R. §§ 416.42 (c); 482.52(c); 485.639(e) (2019).
13The 19 states that have taken this exemption are Alaska, Arizona, California, Colorado, Idaho, Iowa, Kansas, Kentucky, Minnesota, Montana, Nebraska, New Hampshire, New Mexico, North Dakota, Oklahoma, Oregon, South Dakota, Washington, and Wisconsin. However, in these states, hospitals, critical access hospitals, and ambulatory surgical centers may independently require physician supervision for CRNAs.
14See Medicare Payment Advisory Commission, Report to the Congress: Medicare Payment Policy, Congressional Request on Health Care Provider Consolidation (Washington, D.C.: Mar. 13, 2020).
Letter
Page 7 GAO-21-41 Payment for Anesthesia Services
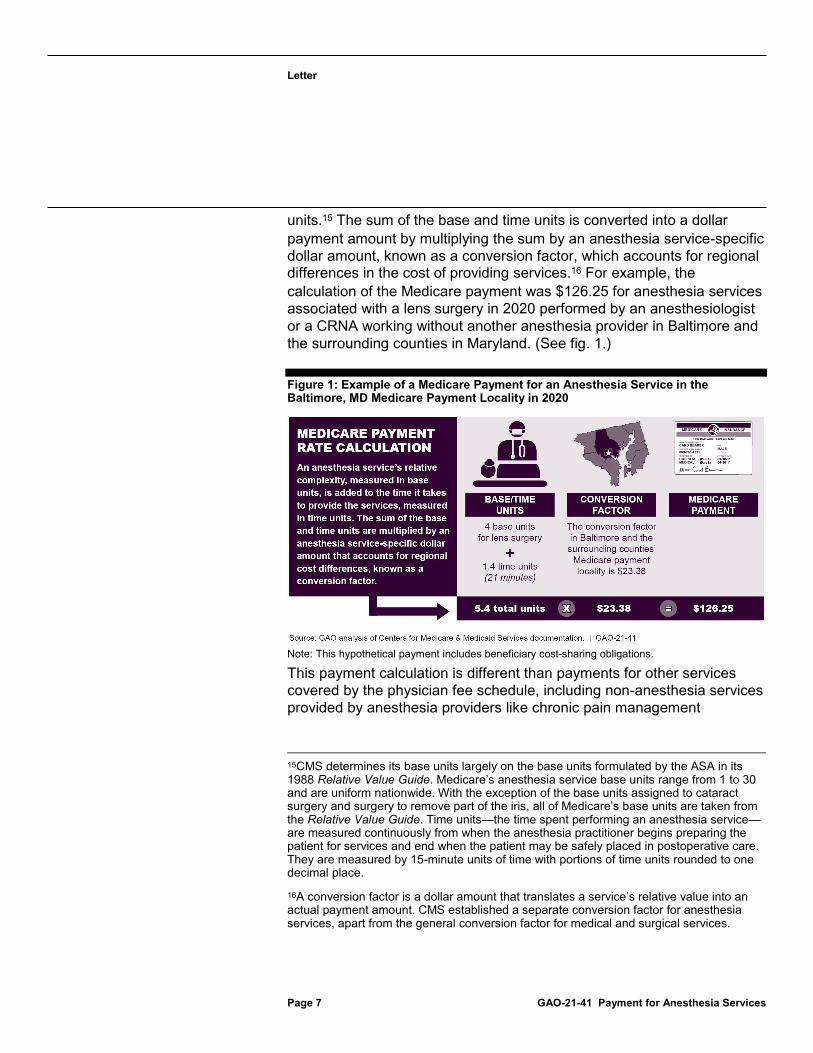
units.15 The sum of the base and time units is converted into a dollar payment amount by multiplying the sum by an anesthesia service-specific dollar amount, known as a conversion factor, which accounts for regional differences in the cost of providing services.16 For example, the calculation of the Medicare payment was $126.25 for anesthesia services associated with a lens surgery in 2020 performed by an anesthesiologist or a CRNA working without another anesthesia provider in Baltimore and the surrounding counties in Maryland. (See fig. 1.)
Figure 1: Example of a Medicare Payment for an Anesthesia Service in the Baltimore, MD Medicare Payment Locality in 2020
Note: This hypothetical payment includes beneficiary cost-sharing obligations.
This payment calculation is different than payments for other services covered by the physician fee schedule, including non-anesthesia services provided by anesthesia providers like chronic pain management
15CMS determines its base units largely on the base units formulated by the ASA in its 1988 Relative Value Guide. Medicare’s anesthesia service base units range from 1 to 30 and are uniform nationwide. With the exception of the base units assigned to cataract surgery and surgery to remove part of the iris, all of Medicare’s base units are taken from the Relative Value Guide. Time units—the time spent performing an anesthesia service—are measured continuously from when the anesthesia practitioner begins preparing the patient for services and end when the patient may be safely placed in postoperative care. They are measured by 15-minute units of time with portions of time units rounded to one decimal place.
16A conversion factor is a dollar amount that translates a service’s relative value into an actual payment amount. CMS established a separate conversion factor for anesthesia services, apart from the general conversion factor for medical and surgical services.

Letter
Page 8 GAO-21-41 Payment for Anesthesia Services
procedures.17 According to AANA and ASA representatives, anesthesia providers play a significant role in the emergency Coronavirus Disease 2019 response, commonly providing non-anesthesia services such as non-surgical intubation for the placement of a ventilator, assisting with complex body positioning of patients, and ensuring critical venous and arterial access, among other things. These procedures are high risk for both the patient and the provider as they potentially expose the provider to the coronavirus.
Private Insurance Payments for Anesthesia Services
Private insurers negotiate payment rates for anesthesia services. Each private insurer sets its fees individually in response to market factors such as the extent of competition among anesthesia providers in the market.
The private market reimburses for anesthesia services in multiple ways:
· Anesthesia providers may be paid for service provision directly through private insurance payment rates or indirectly through payments to networks, hospitals, or physician staffing groups that contract for anesthesia services. Private insurers set different anesthesia payment rates in part due to the variety of ways that anesthesia providers organize and contract with private insurers. Some private insurers may determine payments for anesthesia services using base units, time units, and anesthesia-specific conversion factors, like Medicare, though others may negotiate their payment rates as a percentage of Medicare rates.
· Anesthesia providers also may receive additional payments directly from hospitals. To ensure availability of providers in emergency situations among other reasons, some hospitals may pay anesthesia providers professional fees to work in their facility. Anesthesia providers receive these payments in addition to reimbursement for specific services. A study of non-academic hospitals in California found that 69 percent of hospitals made a direct payment to an anesthesia group, and that these payments—which have increased in
17In contrast, Medicare fee schedule payments for these other physician services are calculated using relative value units that correspond to the different resources required to provide the range of services for all physician specialties.

Letter
Page 9 GAO-21-41 Payment for Anesthesia Services
prevalence and magnitude from 2002 through 2014—averaged over $1 million per year in 2014.18
OutofNetwork Billing
Anesthesia providers may also receive additional payments through out-of-network billing. Private insurers can build networks of contracted health providers, including hospitals, physicians, and other providers. To be part of a private insurance network, providers agree to accept set payment rates when treating patients covered by that insurer. The insured patients are directed to health care providers and hospitals within the private insurer’s network, and providers may receive a higher volume of patients as a benefit of participating in an insurer’s network. In addition, being in network eases providers’ administrative responsibilities, including billing and payments. Private insurers may contract for anesthesia services directly with anesthesia practices or physician staffing groups, or they may contract indirectly through hospitals and other facilities that are under contract to the private insurer.19 The AANA has stated that some private insurers’ negotiation practices can result in providers’ going out of network.20
Out-of-network billing occurs when a patient is treated by a provider who is not in the private insurer’s network. Typically, when a provider is not in a patient’s private insurance network, the provider bills a higher out-of-network rate than they would if they were in network, and the patient is expected to pay the difference between the bill and the insurer’s negotiated payment rate. Because these out-of-network rates are generally higher than in-network rates, providers typically receive higher reimbursements when not part of a private insurance network.
Research indicates that anesthesiologists are among the most likely providers to bill their private insurance patients out of network. For
18C. O’Connell et al., “Trends in Direct Hospital Payments to Anesthesia Groups,” Anesthesiology, vol. 131, no. 3 (2019): pp. 534–542.
19Anesthesia providers can also be employed by the hospitals, among other staffing arrangements, and receive a salary.
20American Association of Nurse Anesthetists, Preventing Surprise Medical Bills, accessed August 26, 2020, https://www.aana.com/docs/default-source/fga-aana-com-web-documents-(all)/1-pager-surprise-billing-2020.pdf?sfvrsn=93c1c509_4.

Letter
Page 10 GAO-21-41 Payment for Anesthesia Services
example, one study reported that anesthesiologists were involved in the highest share (37 percent) of out-of-network billing for a common set of surgical procedures paid for by a large private insurance payer between 2012 and 2017, along with surgical assistants.21 Due to its financial effect on patients, several members of Congress have proposed legislation to limit out-of-network billing, and, in a recent report, the Department of Health and Human Services described out-of-network billing as a costly problem for which federal legislation is the appropriate remedy.22 The AANA and ASA also have indicated that federal legislation may be needed to address out-of-network billing.23 In most cases, Medicare beneficiaries are protected from receiving out-of-network bills.24
21K. R. Chhabra et al., “Out-of-Network Bills for Privately Insured Patients Undergoing Elective Surgery with In-Network Primary Surgeons and Facilities,” Journal of the American Medical Association, vol. 323, no. 6 (2020): pp. 538–547.
22Department of Health and Human Services, Office of the Assistant Secretary of Planning and Evaluation, HHS Secretary’s Report On: Surprise Medical Billing (Washington, D.C.: July 29, 2020).
23See American Society of Anesthesiologists, Surprise Medical Bills / Out-of-Network Payment, accessed August 26, 2020, https://www.asahq.org/advocacy-and-asapac/advocacy-topics/surprise-bills; and American Association of Nurse Anesthetists, Preventing Surprise Medical Bills.
24Participating providers in the Medicare program sign agreements stipulating that the approved Medicare charges shall be the full charges for the services they provide. They, therefore, cannot bill Medicare beneficiaries’ for such services, other than the applicable deductible and coinsurance under Medicare. According to The Commonwealth Fund and Georgetown University, a number of states have laws in place protecting privately insured patients from out-of-network billing, including California, Colorado, Florida, Maryland, New Mexico, New York, and Texas. See Maanasa Kona, State Balance-Billing Protections (New York, N.Y.: The Commonwealth Fund, July 20, 2020).

Letter
Page 11 GAO-21-41 Payment for Anesthesia Services
Studies Show Differences between Private and Medicare Payments, Over 3.5 Times Higher on Average, Likely Due to Providers’ Strong Negotiating Position
Studies Show Average Private Insurance Payments for Anesthesia Services Were More than 3.5 Times Higher than Medicare Payments
According to the three studies that estimated differences in payments for anesthesia services, private insurance payments for anesthesia services were on average more than 3.5 times higher than Medicare, which is an increase in this ratio since we last reported.25 In 2007, we calculated that Medicare payments for a select set of anesthesia services in 2004 were 67 percent lower than private payments, equivalent to a private to Medicare payment ratio of 3.05.26 The three studies are described in more detail below:
· Researchers from Yale University calculated an average private insurance to Medicare payment ratio of 3.67 for services provided by anesthesiologists for one large private insurer in 2015, operating across all 50 states and the District of Columbia.27 This average ratio was calculated from an analysis of over 600,000 claims and did not include services provided by CRNAs.
· HCCI calculated average private insurance to Medicare payment ratios for claims paid in 2017 and found ratios ranged from 2 to 7 across six types of services most commonly billed by
25 Of the 31 studies we reviewed, three estimated the difference between private insurance and Medicare payments for anesthesia services.
26See GAO-07-463.
27Z. Cooper et al., “Out of Network Billing and Negotiated Payments for Hospital-based Physicians,” Health Affairs, vol. 39, no. 1 (2020): pp. 24–32.

Letter
Page 12 GAO-21-41 Payment for Anesthesia Services
anesthesiologists in 33 states.28 The lowest median ratio among these services was estimated for anesthesia for an endoscopic procedure on the lower intestine in Louisiana, while the highest median ratio was for anesthesia for open or endoscopic procedure on the knee in New York. Payments for specific services varied widely by state in this data set. For example, the average private payment for anesthesia for open or endoscopic procedure on the knee was 2.4 times that of Medicare in Louisiana and 7 times that in New York. The analysis was based on claims data from Aetna, Humana, and United Healthcare and did not include services provided by CRNAs.
· ASA reported that the Medicare conversion factor for anesthesia services was 28.9 percent of the average commercial conversion factor for anesthesia services, equivalent to a private to Medicare payment ratio of 3.46 based on a survey of their members in 2019.29
The ASA survey asked member anesthesiology practices to report the conversion factor paid by up to five of their largest contracts with private insurers and compared the average conversion factor to the Medicare conversion factor. The analysis included responses from 270 anesthesiology practices across 43 states. Conversion factors varied widely, between $23.73 and $256.50, with a median of $72.00. Responding practices employed a variety of providers, including anesthesiologists, CRNAs, and anesthesiologist assistants.
The increase in the ratio of private insurance to Medicare payments for anesthesia services is consistent with, but greater than, a 2019 MedPAC analysis of trends in private insurance to Medicare payment ratios across all physician services, excluding anesthesia. According to the MedPAC report, the ratio across all physician services increased in recent years due to a rise in private insurance payment rates, whereas Medicare payment rates remained steady.30 Specifically, MedPAC found the ratio of private insurance to Medicare payments across all physician services, excluding anesthesia, was 1.35 in 2018.
28John Hargraves and Jean Fuglesten Biniek, Comparing Commercial and Medicare Rates for Select Anesthesia, Emergency Room, and Radiology Services by State, (Washington, D.C.: Health Care Cost Institute, July 23, 2019). These data include comparisons of private insurance and Medicare payments for specific services in specific states, rather than a national average. Not all states’ data were reported for each of the anesthesia services. In reporting the ranges, we excluded services related to childbirth because most Medicare beneficiaries are 65 or older.
29S. W. Stead and S. K. Merrick, “ASA Survey Results for Commercial Fees Paid for Anesthesia Services – 2019,” ASA Monitor, vol. 83, no. 10 (2019): pp. 70–77.
30Medicare Payment Advisory Commission, Report to the Congress.

Letter
Page 13 GAO-21-41 Payment for Anesthesia Services
Market Factors Likely Lead to Higher Private Insurance Payment Rates
Research and our interviews indicate that market factors likely enhanced anesthesia providers’ negotiating power and led to higher private insurance payment rates for anesthesia services. These market forces include high provider market concentration and lack of a strong financial incentive to participate in provider networks, including the ability to bill out of network. This negotiating power does not apply to Medicare payment rates as CMS sets Medicare rates for physician services, including anesthesiology.
High provider market concentration. Five of the studies we reviewed discussed the relationship between provider market concentration and private insurance payment rates. In a market with high provider concentration—or relatively few providers in a given market—there is little competition between providers, enabling the providers within that market to negotiate for higher payments from private insurers. Four of these studies reported that high provider market concentration was associated with higher private insurance payment rates for a variety of services. In addition, representatives from one out of five stakeholder groups and all researcher groups cited provider market concentration as a factor that influenced private insurance payment rates for anesthesia services. According to one of the five studies and representatives from one of five stakeholder groups, the increase in physician staffing groups may have played a role to drive up concentration among anesthesia providers.31
According to this stakeholder, as physician staffing groups buy up more physician practices, the number of providers in a given market with whom private insurers can contract decreases. The same study that suggested that the increase in physician staffing groups may drive up provider concentration also found that most anesthesia provider markets were moderately or highly concentrated. However, this study found no correlation between anesthesia provider market concentration and private insurance payment rates in 2010.32
Lack of strong financial incentive to participate in private insurance networks. Two studies we reviewed and a stakeholder group we 31E. C. Sun et al., “No Significant Association between Anesthesia Group Concentration and Private Insurer Payments in the United States,” Anesthesiology, vol. 123, no. 3 (2015): pp. 507–514.
32Sun et al., “No Significant Association,” p. 507.

Letter
Page 14 GAO-21-41 Payment for Anesthesia Services
interviewed also indicated that anesthesia providers’ lack of financial incentive to participate in private insurance networks increased their negotiating power with private insurers, enabling them to secure higher in-network payment rates. One paper published by the Congressional Budget Office indicated that specialist providers, including anesthesia providers, could negotiate higher in-network payment rates because they were able to leave an insurer’s network.33 Another study similarly indicated that private insurance to Medicare payment ratios were higher for specialist providers who did not depend on private insurance network participation for patient volume—a group that would include anesthesiologists—than those for other services in general. This study suggested that specialist providers were able to command higher private insurance payment rates than providers who have incentives to participate in network.34
The ability to charge out-of-network bills is another factor that decreases anesthesia providers’ financial incentive to join private insurance networks. According to one study, this ability was associated with higher in-network payment rates.35 Another study by the same researchers described physician staffing groups as using out-of-network billing as a negotiating tool, and, in a letter to Congress, a physician staffing group cited out-of-network billing as a key source of negotiating leverage.36
When participating in a private insurance network, providers agree to accept set payment rates for treating patients covered by that insurer. When a provider is not in a patient’s private insurance network, the provider can bill a higher out-of-network rate than they would if they were in network, and the patient may be expected to pay the difference between the bill and the insurer’s negotiated payment rate. Because these out-of-network rates are higher than in-network rates, at any given patient volume, providers receive greater reimbursement when not part of a private insurance network. Out-of-network billing also creates additional paperwork for patients and providers. The research we reviewed indicates that anesthesiologists are among the most likely providers to charge their private insurance patients with out-of-network bills. High 33Congressional Budget Office, An Analysis of Private-Sector Prices for Physicians’ Services, Working Paper 2018-01 (Washington, D.C.: Jan. 12, 2018).
34Cooper et al., “Negotiated Payments,” p. 24.
35Cooper et al., “Negotiated Payments,” p. 24.
36Zack Cooper, Fiona Scott Morton, and Nathan Shekita, Surprise! Out-of-Network Billing for Emergency Care in the United States (Cambridge, Mass.: National Bureau of Economic Research, 2017).
Letter
Page 15 GAO-21-41 Payment for Anesthesia Services
rates of out-of-network billing, combined with greater out-of-network reimbursement and the ability to maintain patient volume without participating in private insurance networks, allows anesthesiologists to decline participation in private insurance networks unless insurers agree to pay near what the anesthesiologist could bill when not part of the network.
One study found that in-network payment rates for emergency department physicians, including anesthesia providers, decreased after New York enacted a law limiting out-of-network billing of private insurance patients. According to the researchers, limits on out-of-network billing reduce the payoff of staying out of network, which weakens providers’ negotiating power with insurers; when out-of-network billing is limited, insurers can offer lower payment rates while still being competitive with out-of-network rates.37 Another stakeholder explained that the difference in negotiating power related to out-of-network billing could be compounded when a facility with which an insurer contracts had anesthesiologists from multiple practices. In these cases, insurers would need to have a contract with each anesthesiologist practicing in the hospital to ensure that patients would not receive an out-of-network bill, which would restrict their ability to use provider competition to negotiate low in-network rates.
Data and Research Generally Do Not Indicate an Insufficient Supply of Anesthesia Providers for Medicare Beneficiaries The data and literature we reviewed generally do not indicate any recent insufficiency in the number of anesthesia providers for Medicare beneficiaries; these sources also show that the number of anesthesia providers kept pace with the change in physicians in surgical specialties in recent years.
· CMS has reported an increase in the number of anesthesia providers serving Medicare beneficiaries from about 201 anesthesia providers per 100,000 beneficiaries in 2010 to about 234 anesthesia providers
37Cooper, Morton, and Shekita, Surprise!, pp. 33–35. According to the Commonwealth Fund, 16 states have comprehensive out-of-network billing protections and 14 have partial protections as of July 20, 2020.
Letter
Page 16 GAO-21-41 Payment for Anesthesia Services
per 100,000 beneficiaries in 2018.38 During the same period, CMS data show the number of physicians in surgical specialties serving Medicare beneficiaries decreased from about 299 physicians per 100,000 beneficiaries in 2010 to about 292 physicians per 100,000 beneficiaries in 2018.39
· According to CMS, the total 90,402 anesthesia providers serving Medicare beneficiaries in 2018 was comparable to the number of physician’s assistants or family physicians serving Medicare beneficiaries that same year.40
· Also, according to one study, the number of anesthesiologists and CRNAs increased with the size of the Medicare-eligible population in a given area.41
· Similarly, CMS data show that nearly all anesthesiologists chose to take part in Medicare as of July 2020, and a very small number of anesthesiologists and CRNAs have declined to participate in Medicare.42
· One study we reviewed estimated a national shortage of anesthesia providers in 2007, but a second study in 2013 said that the
38The number of anesthesia providers serving Medicare beneficiaries increased from 37,599 anesthesiologists and 34,911 CRNAs in 2010 to 42,849 anesthesiologists and 47,553 CRNAs in 2018. See Centers for Medicare & Medicaid Services, CMS Program Statistics: Medicare Providers Section, accessed July 23, 2020, https://www.cms.gov/node/1291251.
39The number of physicians in surgical specialties serving Medicare beneficiaries increased from 107,635 physicians in 2010 to 112,839 physicians in 2018. See Centers for Medicare & Medicaid Services, CMS Program Statistics.
40Centers for Medicare & Medicaid Services, CMS Program Statistics.
41C. J. Liao, J. A. Quraishi, and L. M. Jordan, “Geographical Imbalance of Anesthesia Providers and its Impact On the Uninsured and Vulnerable Populations,” Nursing Economic$, vol. 33, no. 5 (2015): pp. 263–270.
42In July 2020, 67 anesthesiologists and two CRNAs had opted out of providing services to Medicare beneficiaries. Centers for Medicare & Medicaid Services, Opt Out Affidavits, accessed July 20, 2020, https://data.cms.gov/Medicare-Enrollment/Opt-Out-Affidavits/7yuw-754z.
Letter
Page 17 GAO-21-41 Payment for Anesthesia Services
anesthesiologist shortage was resolved.43 Both studies stated that certain geographic areas may experience shortages.
In addition, the research we reviewed and interviews we conducted did not indicate an insufficient supply of anesthesia providers for Medicare beneficiaries in rural areas despite increasing rates of hospital closures and a lower supply of anesthesia providers than urban areas. We found in 2018 that rural hospitals were closing at increasing rates.44 Consistent with this previous finding, one study we examined reported that rural counties had fewer than half the number of anesthesia providers per 100,000 people than non-rural counties.45 However, a recent study found that anesthesia services were not reported as a current limitation in providing surgical services in rural hospitals.46 Similarly, two researchers we spoke with indicated that a low supply of anesthesia providers in rural counties was generally related to a low volume of other medical services and did not indicate an issue specific to access to anesthesia services. One researcher we interviewed explained that a low supply of specialty surgeons likely contributes to a low supply of anesthesia providers in rural areas, because fewer elective surgeries would limit the need for anesthesia services. Another researcher noted that rural areas may have gaps in access to emergency services.
The research we reviewed and interviews we conducted indicate that rural areas generally utilize non-physician providers (e.g., CRNAs) to a greater extent than non-rural areas. For example, one study we reviewed noted that the vast majority of anesthesia providers in rural counties were CRNAs, and a large number of rural counties were served exclusively by CRNAs.47 This study also described that average numbers of CRNAs in rural and non-rural areas were much more alike than average numbers of 43Lindsay Daugherty et al., An Analysis of the Labor Markets for Anesthesiology (Santa Monica, Calif.: RAND Corporation, 2010); and Matthew D. Baird et al., The Anesthesiologist Workforce in 2013: A Final Briefing to the American Society of Anesthesiologists (Santa Monica, Calif.: RAND Corporation, 2014).
44See GAO, Rural Hospital Closures: Number and Characteristics of Affected Hospitals and Contributing Factors, GAO-18-634 (Washington, D.C.: Aug. 29, 2018).
45G. R. Martsolf et al., “Relationship Between State Policy and Anesthesia Provider Supply in Rural Communities,” Medical Care, vol. 57, no. 5 (2019): pp. 341–347.
46C. Cohen et al., “The Surgical and Anesthesia Workforce and Provision of Surgical Services in Rural Communities: A Mixed-Methods Examination,” The Journal of Rural Health (2020).
47Martsolf et al., “Relationship Between State Policy,” pp. 346–347.

Letter
Page 18 GAO-21-41 Payment for Anesthesia Services
anesthesiologists in rural and non-rural areas. The reliance on CRNAs in rural areas may be partly due to Medicare rural pass-through payments to eligible small, rural hospitals for anesthesia services provided by CRNAs.48 Furthermore, groups we spoke with did not identify access problems to anesthesia care for Medicare beneficiaries in rural areas. All five stakeholder groups as well as the research groups in our review either said that there were no access issues or were not aware of access problems specific to anesthesia services for Medicare beneficiaries in rural areas. Additionally, representatives from two beneficiary advocacy groups we spoke with did not identify any challenges for Medicare beneficiaries accessing anesthesia services.
Agency Comments We provided a draft of this report to the Department of Health and Human Services for comment, and the department provided no comments.
We are sending copies of this report to the appropriate congressional committees and the Secretary of the Department of Health and Human Services. In addition, this report is available at no charge on the GAO website at http://www.gao.gov. If you or your staffs have any questions about this report, please contact me at (202) 512-7114 or [email protected]. Contact points for our Offices of Congressional Relations and Public Affairs may be found on the last page of this report. GAO staff who made key contributions to this report are listed in appendix I.
Jessica Farb Director, Health Care
48CMS allows some rural hospitals and critical access hospitals to be reimbursed at reasonable cost for anesthesia services and related care provided by a CRNA or anesthesiology assistant. See 42 CFR § 412.113(c).
Appendix I: GAO Contacts and Staff Acknowledgments
Page 19 GAO-21-41 Payment for Anesthesia Services
Appendix I: GAO Contacts and Staff Acknowledgments GAO Contact Jessica Farb at (202) 512-7114, [email protected]
Staff Acknowledgments In addition to the contact named above, Leslie V. Gordon (Assistant Director), Rashmi Agarwal, George Bogart, Sarah Gilliland, Kate Nast Jones, Jamison Koeman, Peter Kramer, Vikki Porter, Caitlin Scoville, and Eric Wedum made key contributions to this report.
(104087)
GAO’s Mission The Government Accountability Office, the audit, evaluation, and investigative arm of Congress, exists to support Congress in meeting its constitutional responsibilities and to help improve the performance and accountability of the federal government for the American people. GAO examines the use of public funds; evaluates federal programs and policies; and provides analyses, recommendations, and other assistance to help Congress make informed oversight, policy, and funding decisions. GAO’s commitment to good government is reflected in its core values of accountability, integrity, and reliability.
Obtaining Copies of GAO Reports and Testimony The fastest and easiest way to obtain copies of GAO documents at no cost is through our website. Each weekday afternoon, GAO posts on its website newly released reports, testimony, and correspondence. You can also subscribe to GAO’s email updates to receive notification of newly posted products.
Order by Phone
The price of each GAO publication reflects GAO’s actual cost of production and distribution and depends on the number of pages in the publication and whether the publication is printed in color or black and white. Pricing and ordering information is posted on GAO’s website, https://www.gao.gov/ordering.htm.
Place orders by calling (202) 512-6000, toll free (866) 801-7077, or TDD (202) 512-2537.
Orders may be paid for using American Express, Discover Card, MasterCard, Visa, check, or money order. Call for additional information.
Connect with GAO Connect with GAO on Facebook, Flickr, Twitter, and YouTube. Subscribe to our RSS Feeds or Email Updates. Listen to our Podcasts. Visit GAO on the web at https://www.gao.gov.
To Report Fraud, Waste, and Abuse in Federal Programs Contact FraudNet:
Website: https://www.gao.gov/fraudnet/fraudnet.htm
Automated answering system: (800) 424-5454 or (202) 512-7700
Congressional Relations Orice Williams Brown, Managing Director, [email protected], (202) 512-4400, U.S. Government Accountability Office, 441 G Street NW, Room 7125, Washington, DC 20548
Public Affairs Chuck Young, Managing Director, [email protected], (202) 512-4800 U.S. Government Accountability Office, 441 G Street NW, Room 7149 Washington, DC 20548
Strategic Planning and External Liaison James-Christian Blockwood, Managing Director, [email protected], (202) 512-4707 U.S. Government Accountability Office, 441 G Street NW, Room 7814, Washington, DC 20548