Embed Size (px)
Citation preview
GAOUnited States Government Accountability Office
Report to Congressional Requesters
April 2005 U.S. POSTAL SERVICE
The Service’s Strategy for Realigning Its Mail Processing Infrastructure Lacks Clarity, Criteria, and Accountability
a
GAO-05-261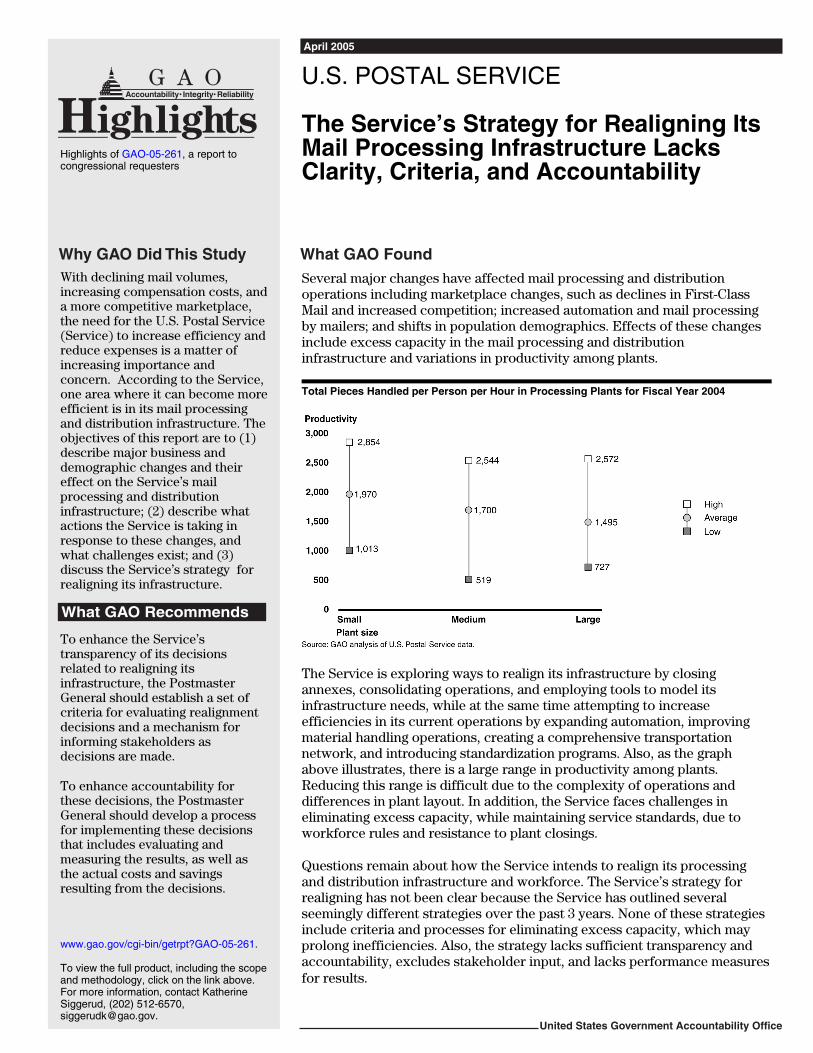
What GAO Found
United States Government Accountability Office
Why GAO Did This Study
HighlightsAccountability Integrity Reliability
www.gao.gov/cgi-bin/getrpt?GAO-05-261. To view the full product, including the scope and methodology, click on the link above. For more information, contact Katherine Siggerud, (202) 512-6570, [email protected].
Highlights of GAO-05-261, a report to congressional requesters
April 2005
U.S. POSTAL SERVICE
The Service’s Strategy for Realigning Its Mail Processing Infrastructure Lacks Clarity, Criteria, and Accountability
Several major changes have affected mail processing and distribution operations including marketplace changes, such as declines in First-Class Mail and increased competition; increased automation and mail processing by mailers; and shifts in population demographics. Effects of these changes include excess capacity in the mail processing and distribution infrastructure and variations in productivity among plants.
Total Pieces Handled per Person per Hour in Processing Plants for Fiscal Year 2004
The Service is exploring ways to realign its infrastructure by closing annexes, consolidating operations, and employing tools to model its infrastructure needs, while at the same time attempting to increase efficiencies in its current operations by expanding automation, improving material handling operations, creating a comprehensive transportation network, and introducing standardization programs. Also, as the graph above illustrates, there is a large range in productivity among plants. Reducing this range is difficult due to the complexity of operations and differences in plant layout. In addition, the Service faces challenges in eliminating excess capacity, while maintaining service standards, due to workforce rules and resistance to plant closings. Questions remain about how the Service intends to realign its processing and distribution infrastructure and workforce. The Service’s strategy for realigning has not been clear because the Service has outlined several seemingly different strategies over the past 3 years. None of these strategies include criteria and processes for eliminating excess capacity, which may prolong inefficiencies. Also, the strategy lacks sufficient transparency and accountability, excludes stakeholder input, and lacks performance measures for results.
With declining mail volumes, increasing compensation costs, and a more competitive marketplace, the need for the U.S. Postal Service (Service) to increase efficiency and reduce expenses is a matter of increasing importance and concern. According to the Service, one area where it can become more efficient is in its mail processing and distribution infrastructure. The objectives of this report are to (1) describe major business and demographic changes and their effect on the Service’s mail processing and distribution infrastructure; (2) describe what actions the Service is taking in response to these changes, and what challenges exist; and (3) discuss the Service’s strategy for realigning its infrastructure.
What GAO Recommends
To enhance the Service’s transparency of its decisions related to realigning its infrastructure, the Postmaster General should establish a set of criteria for evaluating realignment decisions and a mechanism for informing stakeholders as decisions are made.
To enhance accountability for these decisions, the Postmaster General should develop a process for implementing these decisions that includes evaluating and measuring the results, as well as the actual costs and savings resulting from the decisions.

Contents
Letter 1Results in Brief 2Background 5Major Changes Have Impacted the Service’s Mail Processing and
Distribution Infrastructure 14The Service Is Pursuing Several Initiatives in Response to Changes
but Challenges Remain 35The Service’s Strategy for Realigning Its Mail Processing
Infrastructure Lacks Clarity, Criteria, and Accountability 53Conclusion 59Recommendations for Executive Action 59Agency Comments and Our Evaluation 60
AppendixesAppendix I: Objectives, Scope, and Methodology 63
Appendix II: Descriptions of Various Mail Flows with Diagrams 65
Appendix III: Glossary of Postal Terms Used in this Report 74
Appendix IV: Comments from the U.S. Postal Service 82
Appendix V: GAO Contacts and Staff Acknowledgments 84GAO Contact 84Staff Acknowledgments 84
Tables Table 1: Common Types of Mail Preparation Service 6Table 2: Common Types of Mailers 6Table 3: 2004 Major Processing and Distribution Plant Types 7Table 4: Change in Average Rate and Volume for Priority Mail 24Table 5: Factors Contributing to Productivity (Total Pieces
Processed per Hour) in FY 2004 29Table 6: Average Productivity (Total Pieces of Mail Processed per
Hour) of Plants By Number of Employees for Fiscal Year 2004 31
Table 7: Average Productivity (Total Pieces of Mail Processed per Hour) for Selected Operations by Area for Fiscal Year 2004 34
Table 8: Number of Plants and Annexes Owned and Leased by the Service as of September 30, 2004 37
Table 9: Comparison of FY 2004 Productivity for Flat Sorting Operations 39
Page i GAO-05-261 U.S. Postal Service
Contents
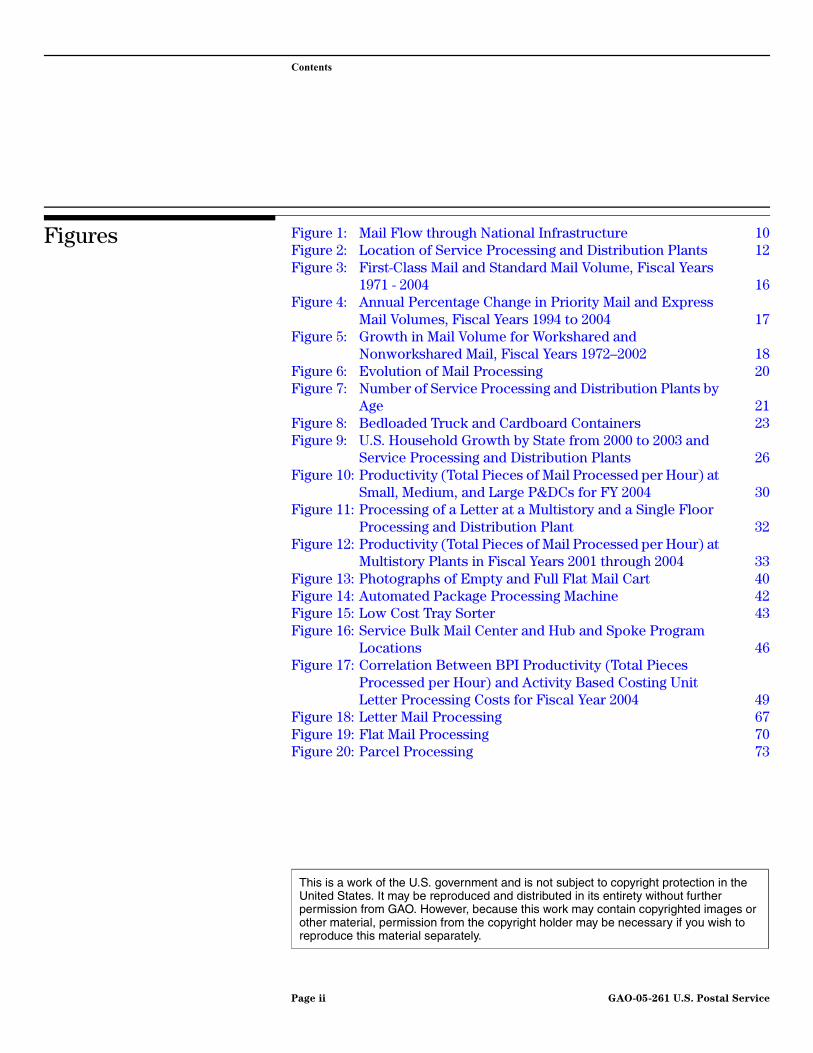
Figures Figure 1: Mail Flow through National Infrastructure 10Figure 2: Location of Service Processing and Distribution Plants 12Figure 3: First-Class Mail and Standard Mail Volume, Fiscal Years
1971 - 2004 16Figure 4: Annual Percentage Change in Priority Mail and Express
Mail Volumes, Fiscal Years 1994 to 2004 17Figure 5: Growth in Mail Volume for Workshared and
Nonworkshared Mail, Fiscal Years 1972–2002 18Figure 6: Evolution of Mail Processing 20Figure 7: Number of Service Processing and Distribution Plants by
Age 21Figure 8: Bedloaded Truck and Cardboard Containers 23Figure 9: U.S. Household Growth by State from 2000 to 2003 and
Service Processing and Distribution Plants 26Figure 10: Productivity (Total Pieces of Mail Processed per Hour) at
Small, Medium, and Large P&DCs for FY 2004 30Figure 11: Processing of a Letter at a Multistory and a Single Floor
Processing and Distribution Plant 32Figure 12: Productivity (Total Pieces of Mail Processed per Hour) at
Multistory Plants in Fiscal Years 2001 through 2004 33Figure 13: Photographs of Empty and Full Flat Mail Cart 40Figure 14: Automated Package Processing Machine 42Figure 15: Low Cost Tray Sorter 43Figure 16: Service Bulk Mail Center and Hub and Spoke Program
Locations 46Figure 17: Correlation Between BPI Productivity (Total Pieces
Processed per Hour) and Activity Based Costing Unit Letter Processing Costs for Fiscal Year 2004 49
Figure 18: Letter Mail Processing 67Figure 19: Flat Mail Processing 70Figure 20: Parcel Processing 73
This is a work of the U.S. government and is not subject to copyright protection in the United States. It may be reproduced and distributed in its entirety without further permission from GAO. However, because this work may contain copyrighted images or other material, permission from the copyright holder may be necessary if you wish to reproduce this material separately.
Page ii GAO-05-261 U.S. Postal Service

United States Government Accountability Office
Washington, D.C. 20548
A
April 8, 2004 Letter
The Honorable John M. McHughThe Honorable Danny K. DavisHouse of Representatives
The United States Postal Service (Service) has developed a highly complex infrastructure that includes about 450 plants that process and distribute an average of 660 million pieces of mail per day. To meet its universal service obligation, which requires it to provide mail delivery services to all people residing in the United States, the Service delivered mail to over 142 million addresses in fiscal year 2004. This represented an increase in addresses over fiscal year 2003 of 1.8 million. Mail processing costs amount to about $20 billion annually, while annual transportation costs are about $5 billion. The Service is subject to a mandate to break even that requires that postal rates and fees shall provide sufficient revenues so that the Service’s total estimated income and appropriations will equal as nearly as practicable its total estimated costs. For the first time in its history, the Service experienced declining First-Class Mail volumes for 3 years in a row. This trend is expected to continue and raises specific concerns, since traditionally First-Class Mail provided high revenue-per-piece, which helps cover the Service’s institutional expenses.1 Another challenge is that compensation costs, which account for over 79 percent of the Service’s total costs, grew 3 percent from fiscal year 2003 to 2004 while the number of full-time employees decreased. This increase in compensation costs is due in part to healthcare benefits that increased 7 percent over the same period. With major changes that affect its mail processing operations, including declining mail volumes, increasing compensation costs, and a more competitive marketplace, the need for the Service to increase efficiency and reduce expenses has become more urgent.
In April 2002, in response to a GAO recommendation, the Service issued a Transformation Plan that outlined the steps it planned to take to address the challenges it faced. One key goal cited in the Transformation Plan was for the Service to become more efficient by standardizing operations and reducing excess capacity in its mail processing and distribution infrastructure. Mailer interest groups and a report by the Presidential Commission on the Postal Service also supported the goal of “rightsizing” the nation’s postal infrastructure; that is, establishing a least-cost network
1Institutional costs are costs that cannot be attributed to any specific class of mail.
Page 1 GAO-05-261 U.S. Postal ServicePage 1 GAO-05-261 U.S. Postal Service

for the Postal Service and the entire mailing industry while improving overall efficiency and service.
To assist Congress in monitoring the Service’s progress in implementing the realignment of its mail processing and distribution infrastructure, this report addresses three key objectives. First, it describes major business and demographic changes and the effect of these changes on the Service’s mail processing and distribution infrastructure. Second, it describes the actions the Service is taking to achieve a more efficient and flexible network in response to these changes, and the challenges associated with implementing these actions. Finally, it discusses the Service’s strategy for realigning its infrastructure.
To address these objectives, we interviewed mailing industry associations, postal officials at Service headquarters, and employee union representatives about their views of the major changes affecting mail processing and distribution operations and infrastructure, as well as the Service’s plans, strategy, and progress to realign its infrastructure. We also visited several Service mail processing plants to observe operations and interviewed plant managers in the Pacific, Southeastern, Eastern, and Capital Metro areas about their efforts to improve efficiency. We analyzed Service productivity data and documentation related to its productivity and efficiency improvement efforts, including plans and implementation schedules. We also reviewed Service documents related to its infrastructure realignment and discussed the direction and progress of its realignment efforts with the Service’s Chief Operating Officer, the area vice presidents, and other senior management officials involved in this effort. We assessed the reliability of the Service’s data used in our assessment of productivity and efficiency and found it reasonable for our purposes. We conducted our review at Service headquarters and field locations between April 2004 and January 2005 in accordance with generally accepted government auditing standards. A more detailed discussion of our objectives, scope, and methodology is included in appendix I. We requested comments on a draft of this report from the Service and its comments are discussed later in this report and reproduced in appendix IV.
Results in Brief Several major changes, such as changes in the marketplace, the evolution of the Service’s processing infrastructure, increased automation and mail processing by mailers, and changes in demographics have affected the Service’s mail processing and distribution operations. The effects of these
Page 2 GAO-05-261 U.S. Postal Service
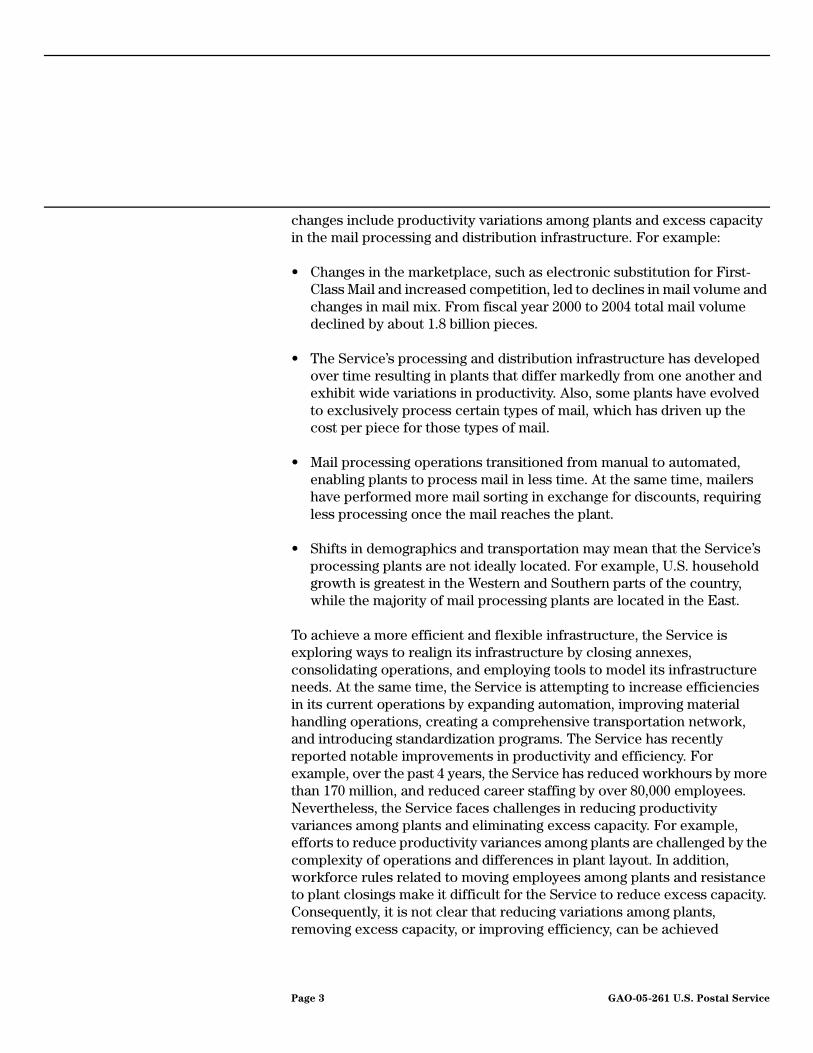
changes include productivity variations among plants and excess capacity in the mail processing and distribution infrastructure. For example:
• Changes in the marketplace, such as electronic substitution for First-Class Mail and increased competition, led to declines in mail volume and changes in mail mix. From fiscal year 2000 to 2004 total mail volume declined by about 1.8 billion pieces.
• The Service’s processing and distribution infrastructure has developed over time resulting in plants that differ markedly from one another and exhibit wide variations in productivity. Also, some plants have evolved to exclusively process certain types of mail, which has driven up the cost per piece for those types of mail.
• Mail processing operations transitioned from manual to automated, enabling plants to process mail in less time. At the same time, mailers have performed more mail sorting in exchange for discounts, requiring less processing once the mail reaches the plant.
• Shifts in demographics and transportation may mean that the Service’s processing plants are not ideally located. For example, U.S. household growth is greatest in the Western and Southern parts of the country, while the majority of mail processing plants are located in the East.
To achieve a more efficient and flexible infrastructure, the Service is exploring ways to realign its infrastructure by closing annexes, consolidating operations, and employing tools to model its infrastructure needs. At the same time, the Service is attempting to increase efficiencies in its current operations by expanding automation, improving material handling operations, creating a comprehensive transportation network, and introducing standardization programs. The Service has recently reported notable improvements in productivity and efficiency. For example, over the past 4 years, the Service has reduced workhours by more than 170 million, and reduced career staffing by over 80,000 employees. Nevertheless, the Service faces challenges in reducing productivity variances among plants and eliminating excess capacity. For example, efforts to reduce productivity variances among plants are challenged by the complexity of operations and differences in plant layout. In addition, workforce rules related to moving employees among plants and resistance to plant closings make it difficult for the Service to reduce excess capacity. Consequently, it is not clear that reducing variations among plants, removing excess capacity, or improving efficiency, can be achieved
Page 3 GAO-05-261 U.S. Postal Service
consistently throughout the current mail processing and distribution infrastructure.
The Service’s strategy for realigning its mail processing and distribution infrastructure has not been clear because the Service has outlined several seemingly different strategies over the past 3 years. While the Service has announced various plans and strategies, including a modeling effort and an attempt to get more uniformity in its infrastructure, it recently announced that it is pursuing an evolutionary strategy—that will respond to opportunities as they arise—and has provided little information about any of these efforts. This evolutionary strategy and the lack of detailed information about it raise many issues, including what the strategy is and whether it will enable the Service to meet the challenge of removing excess capacity in its infrastructure by closing unnecessary facilities. Specific issues related to the Service’s infrastructure realignment strategy include: (1) the Service’s strategy does not include specific criteria and processes for eliminating excess capacity, including the removal of unnecessary facilities and (2) the Service’s strategy is not sufficiently transparent and accountable, excludes stakeholder input, and lacks performance measures for results of decisions. The Service’s limited communication makes it difficult for customers to work with the Service to achieve a least-cost network for the entire mailing industry, for Service employees to understand how they may be affected, for communities to understand how they will be affected, and for Members of Congress to explain to their constituents what the Service is planning to do.
To enhance the Service’s transparency of its decisions related to realigning its infrastructure, the Postmaster General should establish a set of criteria for evaluating realignment decisions and a mechanism for informing stakeholders as decisions are made. To enhance accountability for these decisions, the Postmaster General should develop a process for implementing these decisions that includes evaluating and measuring the results.
In commenting on a draft of this report the Service concurred with our description of its mail processing and distribution infrastructure and the major business and demographic changes that have affected the Service’s operations, but did not respond directly to our conclusions or recommendations.
Page 4 GAO-05-261 U.S. Postal Service
Background The Service’s mail processing and distribution infrastructure, whereby mail is prepared for sorting on automation equipment by applying a barcode, sorted through various processing equipment, and transported between plants, consists of interdependent networks where operations in one part affect operations throughout. For example, if mail processing is delayed in one plant and misses the cut-off time for being loaded onto trucks for distribution, transportation will not be fully used because the trucks will leave without that mail. Subsequent processing will also be affected at plants that will receive this mail. In addition, the Service’s infrastructure is part of a larger economic sector commonly referred to as the mailing industry. According to research conducted by the Mailing Industry Task Force, the Service, and the Direct Marketing Association, the core mailing industry is a $976 billion industry comprised of the Service, its competitors, direct and indirect mailers, and mail intensive business segments such as mail order, publishing, and printing houses.2 This industry accounts for 9 million domestic jobs in all 50 states and the District of Columbia. Mailers generally use one of the four major classes of mail:
• First-Class Mail consists mainly of bills, bill payments, correspondence, and advertising and also includes the expedited product, Priority Mail;
• Periodicals Mail encompasses mainly magazines and local newspapers;
• Standard Mail is primarily bulk advertising and direct mail solicitations; and
• Package Services Mail includes parcels, merchandise, catalogs, media, and books.
Tables 1 and 2 describe the major types of businesses that make up the mailing industry and how they generally interact with the Postal Service.
2Envelope Manufacturing Association Foundation for Paper-Based Communications, Postal
Reform and Jobs, April 2, 2004, pg. 5.
Page 5 GAO-05-261 U.S. Postal Service

Table 1: Common Types of Mail Preparation Service
Source: GAO.
Table 2: Common Types of Mailers
Source: GAO.
The Service processes mail through its nationwide infrastructure according to shape and class of mail. There are three basic mail shapes (1) letters, which are small rectangular pieces no thicker than 1/4 inch; (2) flats, which are rectangular pieces no thicker than 3/4 inch; and (3) parcels, which are three-dimensional pieces weighing up to 70 pounds.
The Service established national service standards over 30 years ago that direct how many days it should take mail to reach its destination,
Mail preparation services Description Where mail enters network
Lettershop Prepares mailings for other organizations and provides services such as personalizing, labeling, sorting, stuffing, and addressing envelopes.
Generally take mail to local processing plant.
Presorter/Consolidator Accepts mailings from multiple sources, consolidates them, and presorts to the finest level that can be achieved. Often consolidates mail from multiple sources to achieve quantity-based discounts.
Generally take mail to local processing plant.
Fulfillment House Receives, packages, and ships customer orders, generally for retail sales companies.
Generally take mail to processing plant close to final destination.
Mailers Description Type of mail
Financial Institutions Primarily banks that use the mail to send financial statements or advertisements. Depending on mailer’s size, it may use lettershops, presorters, or consolidators to prepare mailings.
Primarily First-Class Mail
Government Federal, state, and local governments. Depending on mailer’s size, it may use lettershops, presorters, or consolidators to prepare mailings.
Primarily First-Class Mail
Catalog Companies Companies that sell merchandise through catalogs. Primarily Package Services
Newspapers/Magazines Organizations that produce publications issued at frequent intervals containing news, editorials, advertisements, and other articles of current interest.
Primarily Periodicals or Standard Mail
Commercial Industries Industries that provide services or products. Depending on mailer’s size, it may use lettershops, presorters, or consolidators to prepare mailings.
Primarily Standard Mail
Nonprofit Organizations Organizations that conduct not-for-profit business. Depending on mailer’s size, it may use lettershops, presorters or consolidators to prepare mailings.
Primarily Standard Mail (Nonprofit rate)
Page 6 GAO-05-261 U.S. Postal Service
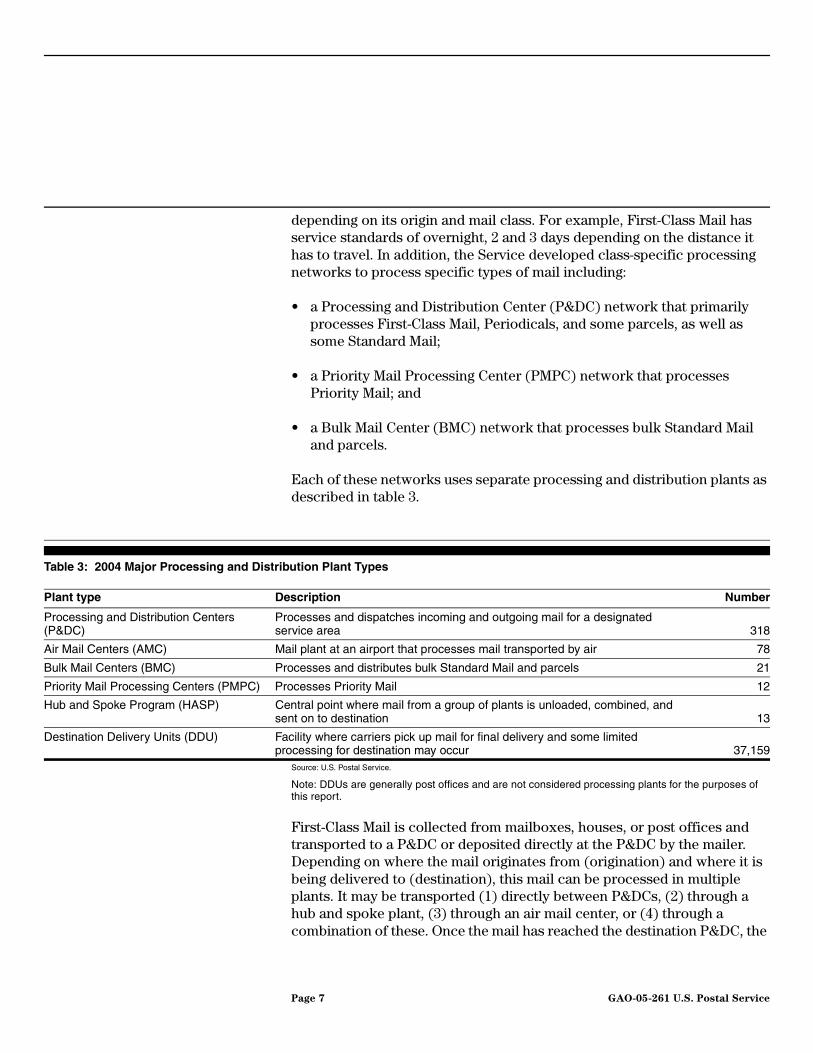
depending on its origin and mail class. For example, First-Class Mail has service standards of overnight, 2 and 3 days depending on the distance it has to travel. In addition, the Service developed class-specific processing networks to process specific types of mail including:
• a Processing and Distribution Center (P&DC) network that primarily processes First-Class Mail, Periodicals, and some parcels, as well as some Standard Mail;
• a Priority Mail Processing Center (PMPC) network that processes Priority Mail; and
• a Bulk Mail Center (BMC) network that processes bulk Standard Mail and parcels.
Each of these networks uses separate processing and distribution plants as described in table 3.
Table 3: 2004 Major Processing and Distribution Plant Types
Source: U.S. Postal Service.
Note: DDUs are generally post offices and are not considered processing plants for the purposes of this report.
First-Class Mail is collected from mailboxes, houses, or post offices and transported to a P&DC or deposited directly at the P&DC by the mailer. Depending on where the mail originates from (origination) and where it is being delivered to (destination), this mail can be processed in multiple plants. It may be transported (1) directly between P&DCs, (2) through a hub and spoke plant, (3) through an air mail center, or (4) through a combination of these. Once the mail has reached the destination P&DC, the
Plant type Description Number
Processing and Distribution Centers (P&DC)
Processes and dispatches incoming and outgoing mail for a designated service area 318
Air Mail Centers (AMC) Mail plant at an airport that processes mail transported by air 78
Bulk Mail Centers (BMC) Processes and distributes bulk Standard Mail and parcels 21
Priority Mail Processing Centers (PMPC) Processes Priority Mail 12
Hub and Spoke Program (HASP) Central point where mail from a group of plants is unloaded, combined, and sent on to destination 13
Destination Delivery Units (DDU) Facility where carriers pick up mail for final delivery and some limited processing for destination may occur 37,159
Page 7 GAO-05-261 U.S. Postal Service

mail is transported to a delivery unit for carrier delivery. For example, a birthday card mailed from Washington, D.C., to Sacramento, CA, would be mailed as First-Class Mail and might follow these steps:
1. picked up from mailbox by carrier and brought to local post office;
2. transported to Suburban Maryland P&DC where the postage stamp is cancelled and a barcode reflecting the proper destination is applied to the mailpiece so it can be sorted according to destination;
3. transported to airport;
4. flown to San Francisco, CA;
5. transported to San Francisco Air Mail Center where it is sorted to the proper destination plant;
6. transported to West Sacramento P&DC where it is sorted into delivery order; and
7. transported to local post office to be picked up by carrier and delivered to addressee.
Priority Mail can either be processed in the Priority Mail network or in the P&DC network similar to First-Class Mail. For example, legal documents sent Priority Mail from Rochester, NY, to Sacramento, CA, might follow these steps:
1. transported from local post office to Rochester Priority Mail Processing Center where it is separated from local Priority Mail and sorted according to destination;
2. transported to Rochester Air Mail Center where it is assigned to a specific flight;
3. flown to San Francisco, CA;
4. transported to San Francisco Air Mail Center where it is sorted to proper destination plant; and
5. transported to West Sacramento P&DC where it is sorted into delivery order; and
Page 8 GAO-05-261 U.S. Postal Service
6. transported to local post office to be picked up by carrier and delivered to addressee.
Discount mailings (Standard Mail, bulk parcels, etc.) can enter the bulk mail network by being weighed and paid for at the mailer’s plant through a detached mail unit, or at a postal plant through a Business Mail Entry Unit. A mailing is initially processed at the bulk mail center where it was entered, and then pieces are transported to the bulk mail center in the area where it will be delivered. To receive additional discounts or achieve faster delivery time, the mailer can enter mail closer to its destination. This is called dropshipping. For example, a Standard Mail advertisement dropshipped from Washington, D.C., to Sacramento, CA, might follow this path:
1. accepted into mailstream through detached mail unit at a mailer’s plant in Washington, D.C.;
2. transported by mailer to the West Sacramento P&DC and sorted into delivery order; and
3. transported to local post office to be picked up by carrier and delivered to addressee.
Figure 1 depicts how mail flows through these networks, while figure 2 maps the location of the Service’s processing and distribution plants.
Page 9 GAO-05-261 U.S. Postal Service
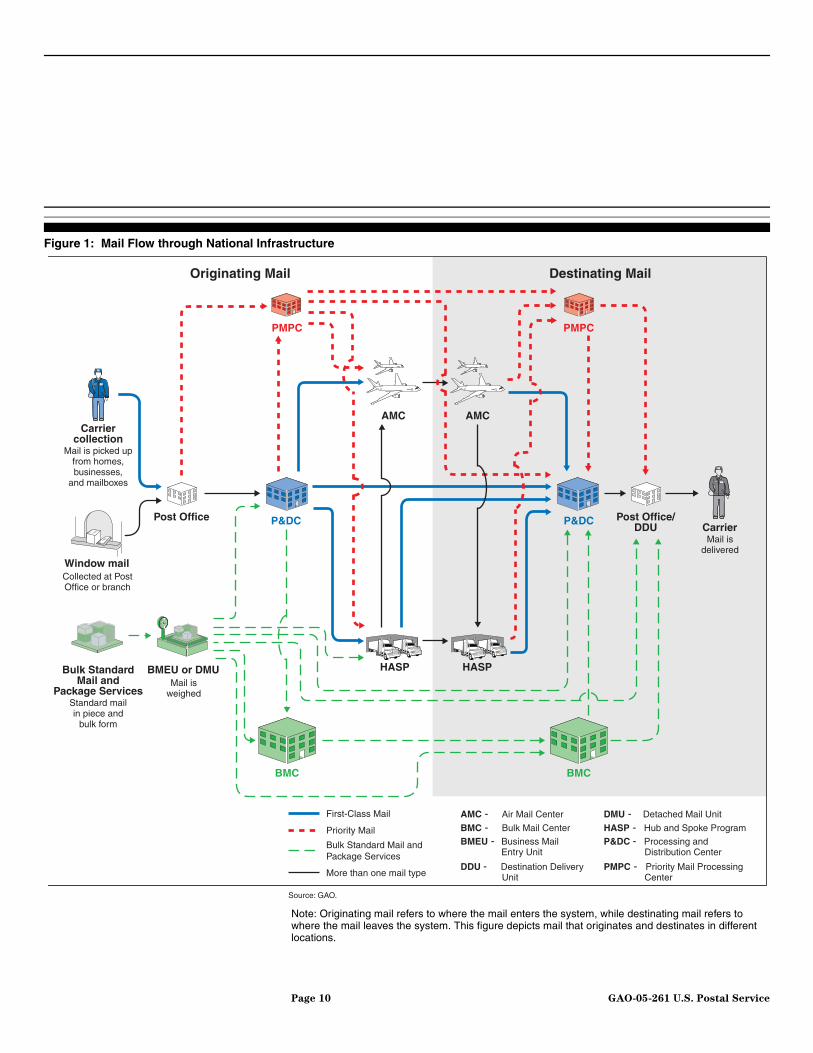
Figure 1: Mail Flow through National Infrastructure
Note: Originating mail refers to where the mail enters the system, while destinating mail refers to where the mail leaves the system. This figure depicts mail that originates and destinates in different locations.
Carriercollection
Mail is picked upfrom homes,businesses,
and mailboxes
Mail isdelivered
Bulk StandardMail and
Package ServicesStandard mailin piece and
bulk form
Mail isweighed
BMEU or DMU
PMPC PMPC
P&DCP&DC Post Office/DDU
AMC AMC
HASP HASP
BMC BMC
Carrier
Originating Mail Destinating Mail
Collected at PostOffice or branch
Window mail
Post Office
First-Class Mail
Priority Mail
More than one mail type
Bulk Standard Mail andPackage Services
Source: GAO.
AMC - Air Mail Center
BMEU - Business Mail Entry Unit
BMC - Bulk Mail Center
DDU - Destination Delivery Unit
DMU - Detached Mail Unit
P&DC - Processing and Distribution Center
HASP - Hub and Spoke Program
PMPC - Priority Mail Processing Center
Page 10 GAO-05-261 U.S. Postal Service

[This page left blank intentionally.]
Page 11 GAO-05-261 U.S. Postal Service

Figure 2: Location of Service Processing and Distribution Plants
��
��
��
����
�
�
�
�
�
�
�
�
�
�
�
���
�
�
�
���
�
�
�
�
��
�
�
�
�
�
Page 12 GAO-05-261 U.S. Postal Service

�
�
�
�
�
��
��
�
�
�
�
�
�
���
�
�
��
�
��
�
�
�
�
�
�
�
�
�
�
��
��
�
�
�
�
�
�
��
�
�
�
�
�
�
�
�
�
�
��
���
���
��
�
�
��
�
�
��
�
� ���
�
�
�
��
�
�
��
�
� ���
�
U.S. Highw ays
Processing and Distribution Plants
Hubs
Bulk Mail Centers
Logistics and Distribution Centers
Air Mail Plants
Source: GAO analysis of U.S. Postal Service data.
Page 13 GAO-05-261 U.S. Postal Service

Major Changes Have Impacted the Service’s Mail Processing and Distribution Infrastructure
Since the U.S. Post Office Department was reorganized into the U.S. Postal Service by the Postal Reorganization Act of 1970, there have been several major changes, the effects of which include excess capacity in the mail processing and distribution infrastructure, as well as productivity differences among plants. These changes include:
• changes in the marketplace and the role of industry that have resulted in declines in mail volume and changes in mail mix;
• the evolution of the Service’s processing and distribution infrastructure, and the advent of processing automation, that has led to an infrastructure consisting of processing and distribution plants that differ markedly from one another; and
• changes in demographics and modes of transportation that affect the optimal location of the Service’s plants.
Changing Marketplace Has Led to Changes in Mail Volume and Mail Mix
Changes in the marketplace, including the substitution of electronic communication for First-Class Mail, shifts in how customers use the mail, increased competition in overnight mail and package services, and the changing role of mailers, have led to changes in mail volume and mix. These changes have intensified the Service’s future financial challenges. Historically, the Service’s business model depended on revenues from increasing mail volumes to cover its expanding infrastructure. This model has proven more difficult to sustain because of the decreasing mail volumes, particularly in First-Class Mail. As the Service’s Chief Financial Officer stated, “this shift in mail mix to lower revenue-per-piece mail classes will result in shrinking margins, which are used to maintain universal service.”3
Electronic Diversion Has Led to Decreases in First-Class Mail Volume
First-Class Mail volume, the class that contributes the majority of revenue to institutional costs, declined 5 percent from fiscal year 2000 to 2004 and this downward trend is expected to continue. The Service has attributed the declining First-Class Mail volume to the impact of electronic diversion as businesses, nonprofit organizations, governments, and households
3Richard Strasser’s presentation to the Service’s Board of Governors year-end meeting on December 7, 2004. Universal service is not defined in law, but is understood to include affordable rates, 6-days per week delivery, and access to postal retail services.
Page 14 GAO-05-261 U.S. Postal Service
increasingly automate their financial transactions and divert correspondence to the Internet. For example, electronic bill payment allows users to pay bills using the Internet rather than sending checks through the mail. In 2003, the majority of noncash payments were made electronically; just 3 years earlier the majority had been made by check. Recent Federal Reserve studies found that the number of checks paid in the United States has continued to decline since it peaked in the mid-1990s. There were nearly 50 billion checks paid in 1995. By 2000, that number had declined to 41.9 billion and by 2003 that number had dropped to 36.7 billion. Between 2000 and 2003, electronic payments increased from 30.6 billion to 44.5 billion, an increase of over 45 percent.4 Further, recent legislation that became effective October 28, 2004, is intended to improve the efficiency of check processing and may reduce reliance on the physical movement of checks through the mail.5 It is likely that this change will accelerate the decline in First-Class Mail volume.
Shift in Mail Usage Has Led to Challenges in Revenue Generation
As a result of declining First-Class Mail volumes and the lower revenue per piece provided by Standard advertising mail volumes, the Service will be challenged to generate sufficient revenue to cover institutional costs. From 1970 to 2000, First-Class Mail accounted for the majority of mail volume. However, as seen in figure 3, Standard Mail volume is on the verge of overtaking First-Class Mail volume. According to postal officials, Standard Mail volume is projected to be greater than First-Class Mail volume by fiscal year 2005.
4The 2004 Federal Reserve Payment Study: Analysis of Noncash Payments Trends in the
United States 2000-2003, Federal Reserve System, 2004.
5The Check Clearing for the 21st Century Act (Check 21) was signed into law on October 28, 2003, and became effective on October 28, 2004.
Page 15 GAO-05-261 U.S. Postal Service

Figure 3: First-Class Mail and Standard Mail Volume, Fiscal Years 1971 - 2004
In fiscal year 2003, combined First-Class Mail and Standard Mail accounted for almost 94 percent of the Service’s total mail volume. It takes approximately 2.5 pieces of Standard Mail to make up for the lost contribution from 1 piece of First-Class Mail. During fiscal year 2003, First-Class Mail declined by 3.3 billion pieces, resulting in a loss in revenue to be contributed toward institutional costs (contribution) of $675 million, while Standard Mail increased by 3.1 billion pieces for a gain in contribution of $256 million. The net loss in contribution from these two classes in fiscal year 2003 was $419 million.
Increased Competition in Packages and Overnight Mail Have Hurt Mail Volume
Competition in the overnight and package business is increasing. In 1971, the Service and United Parcel Service each had roughly a 50 percent share of the national parcel market. FedEx entered the parcel ground delivery market with the acquisition of Caliber in 1998 and, by 2001, the Service’s share of the parcel ground market had slipped to less than 10 percent. In addition, the Service’s market share of overnight and 2 and 3 day air package services decreased between fiscal years 2000 and 2003. As seen in
Source: GAO analysis of U.S. Postal Service data.
0
10
20
30
40
50
60
70
80
90
100
110
Standard Mail
First-Class Mail
2004
2003
2002
2001
2000
1999
1998
1997
1996
1995
1994
1993
1992
1991
1990
1989
1988
1987
1986
1985
1984
1983
1982
1981
1980
1979
1978
1977
1976
1975
1974
1973
1972
1971
Pieces (in billions)
Page 16 GAO-05-261 U.S. Postal Service
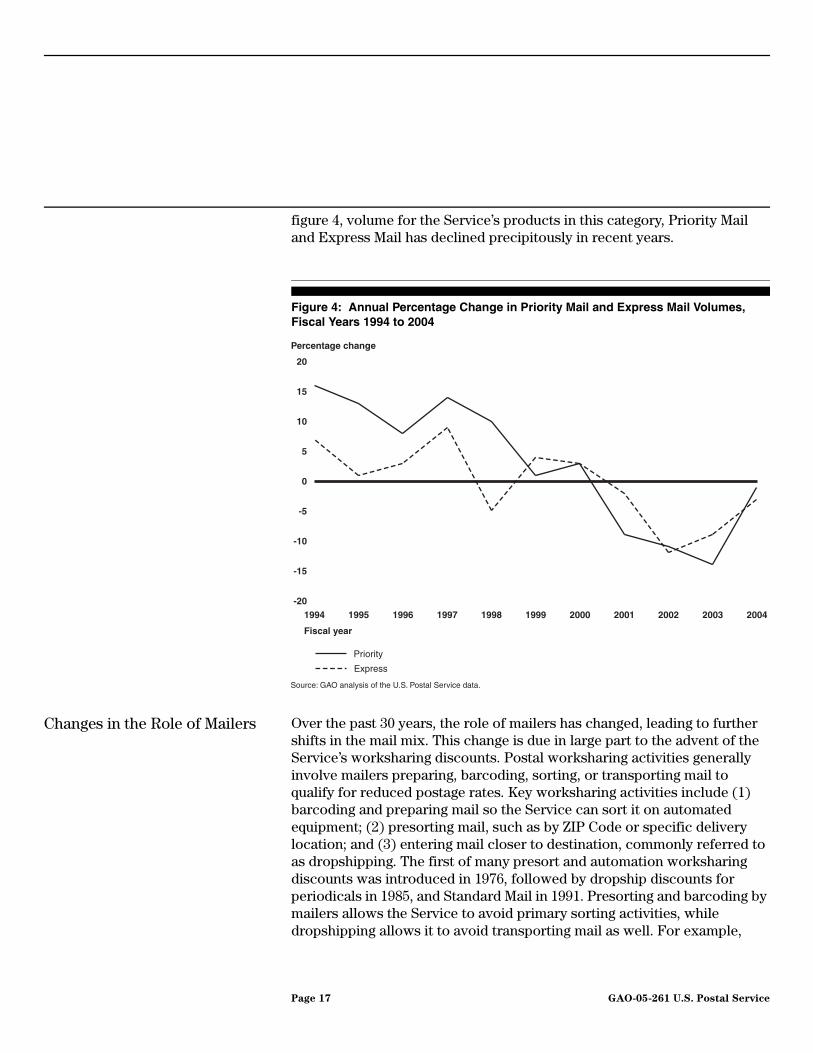
figure 4, volume for the Service’s products in this category, Priority Mail and Express Mail has declined precipitously in recent years.
Figure 4: Annual Percentage Change in Priority Mail and Express Mail Volumes, Fiscal Years 1994 to 2004
Changes in the Role of Mailers Over the past 30 years, the role of mailers has changed, leading to further shifts in the mail mix. This change is due in large part to the advent of the Service’s worksharing discounts. Postal worksharing activities generally involve mailers preparing, barcoding, sorting, or transporting mail to qualify for reduced postage rates. Key worksharing activities include (1) barcoding and preparing mail so the Service can sort it on automated equipment; (2) presorting mail, such as by ZIP Code or specific delivery location; and (3) entering mail closer to destination, commonly referred to as dropshipping. The first of many presort and automation worksharing discounts was introduced in 1976, followed by dropship discounts for periodicals in 1985, and Standard Mail in 1991. Presorting and barcoding by mailers allows the Service to avoid primary sorting activities, while dropshipping allows it to avoid transporting mail as well. For example,
-20
-15
-10
-5
0
5
10
15
20
Express
Priority
20042003200220012000199919981997199619951994
Fiscal year
Percentage change
Source: GAO analysis of the U.S. Postal Service data.
Page 17 GAO-05-261 U.S. Postal Service
prior to dropshipping, mail entered the infrastructure at the point of origin. Dropshipping allows the mailer a discount for bypassing the origination plant and transporting the mail closer to its destination point.
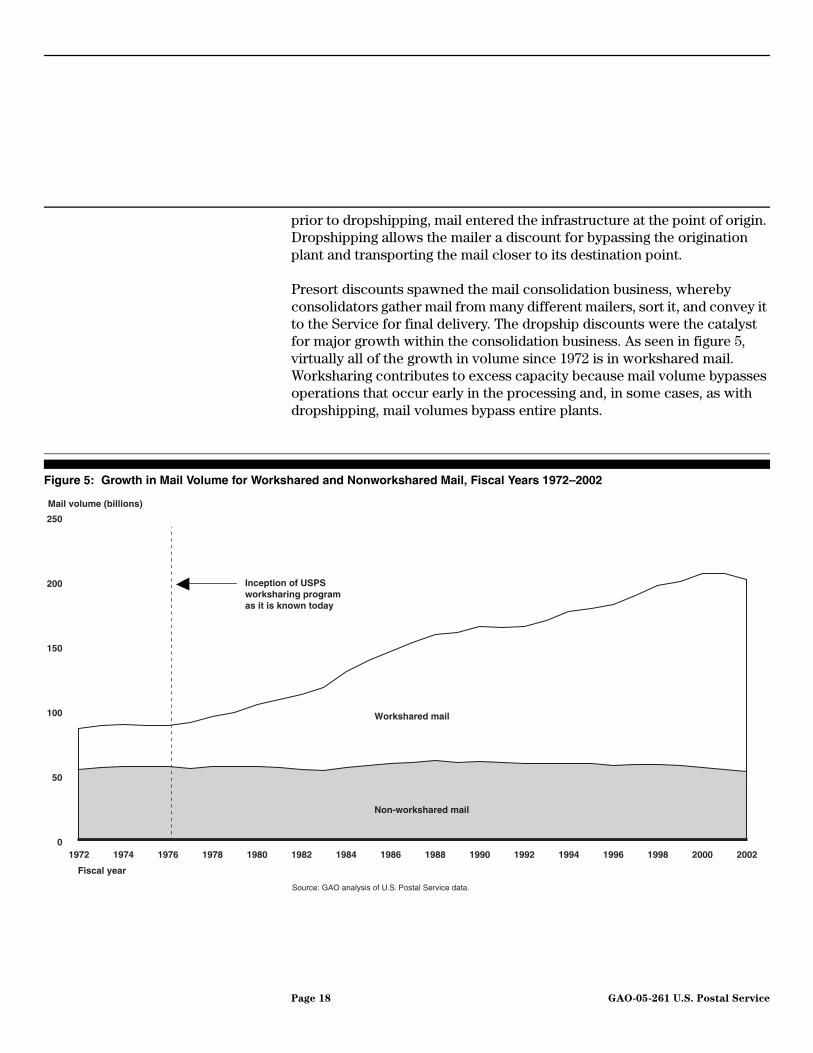
Presort discounts spawned the mail consolidation business, whereby consolidators gather mail from many different mailers, sort it, and convey it to the Service for final delivery. The dropship discounts were the catalyst for major growth within the consolidation business. As seen in figure 5, virtually all of the growth in volume since 1972 is in workshared mail. Worksharing contributes to excess capacity because mail volume bypasses operations that occur early in the processing and, in some cases, as with dropshipping, mail volumes bypass entire plants.
Figure 5: Growth in Mail Volume for Workshared and Nonworkshared Mail, Fiscal Years 1972–2002
0
50
100
150
200
250
Workshared mail
Non-workshared mail
2002200120001999199819971996199519941993199219911990198919881987198619851984198319821981198019791978197719761975197419731972
Fiscal year
Workshared mail
Non-workshared mail
Source: GAO analysis of U.S. Postal Service data.
Mail volume (billions)
Inception of USPS worksharing program as it is known today
Page 18 GAO-05-261 U.S. Postal Service

Evolution of the Service’s Processing and Distribution Infrastructure Has Resulted in Markedly Different Plants
The Service’s mail processing and distribution infrastructure has developed over time resulting in an infrastructure comprised of plants that are markedly different from one another. This evolution has resulted in some plants’ inability to accommodate processing equipment because the floor space requirements differ for manual and automated processing; and the plants were not originally designed to house the advanced technology. Also, some plants exclusively process certain types of mail, which has driven up the cost per piece for those types of mail. Today, the Service’s mail processing and distribution infrastructure includes plants that range in age from 2 to 72 years old, range in square footage from 455 square feet to 1,538,494 square feet, have different layouts, serve different processing functions, and do not share the same amount and type of processing equipment.6
Plants Have Had to Accommodate Equipment in Buildings That Were Not Designed to House the Technology
Originally, the Service developed mail processing and distribution plants to manually sort mail using pigeonhole cases. The Service took major steps toward mechanizing plants in the mid-1950s with the introduction of the letter sorting machine. The letter sorting machine required an operator to read the address on an envelope and key the information into a console. A conveyor belt system then directed the piece to the appropriate receptacle for the address. In the early 1980s, the Service began replacing the mechanized letter sorters with automated systems that used optical character readers rather than manual keying of addresses. The concept of mechanized sorting was expanded to include flats in the 1980s. The Service recently deployed automated flat sorters and has begun deploying automated parcel sorting equipment. Figure 6 depicts the evolution of mail processing operations.
6Post Offices/DDUs are not included.
Page 19 GAO-05-261 U.S. Postal Service
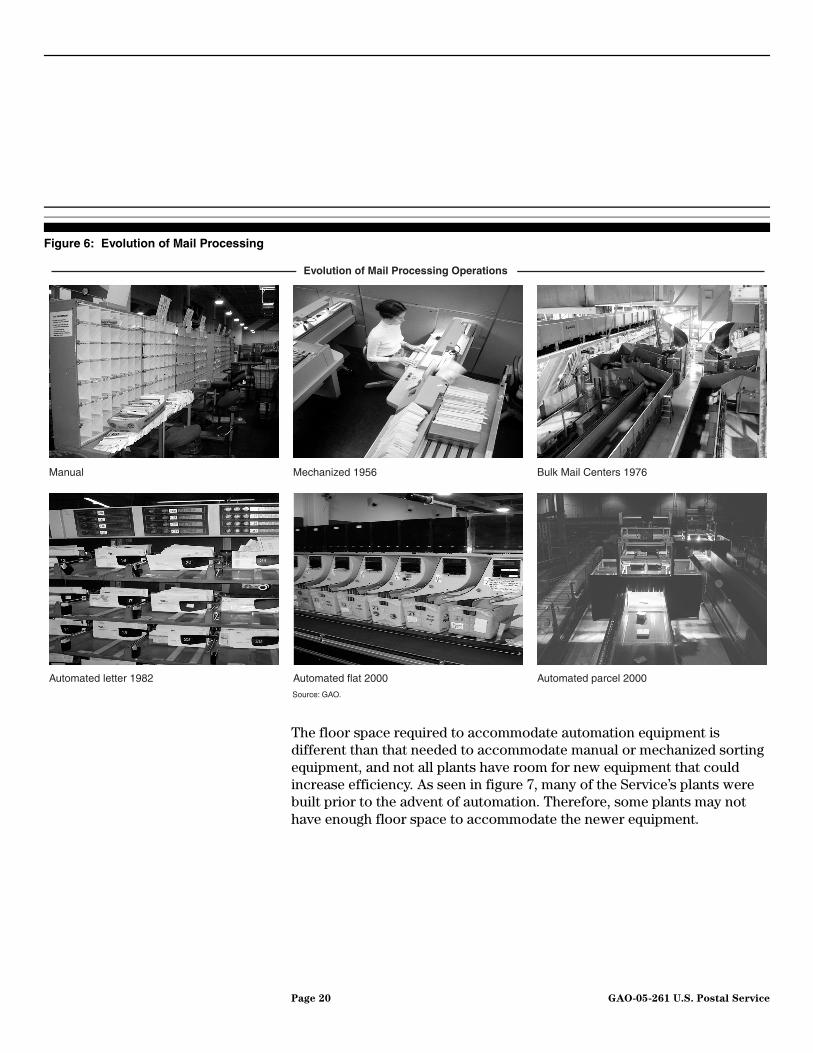
Figure 6: Evolution of Mail Processing
The floor space required to accommodate automation equipment is different than that needed to accommodate manual or mechanized sorting equipment, and not all plants have room for new equipment that could increase efficiency. As seen in figure 7, many of the Service’s plants were built prior to the advent of automation. Therefore, some plants may not have enough floor space to accommodate the newer equipment.
Source: GAO.
Manual Mechanized 1956 Bulk Mail Centers 1976
Automated letter 1982 Automated flat 2000 Automated parcel 2000
Evolution of Mail Processing Operations
Page 20 GAO-05-261 U.S. Postal Service
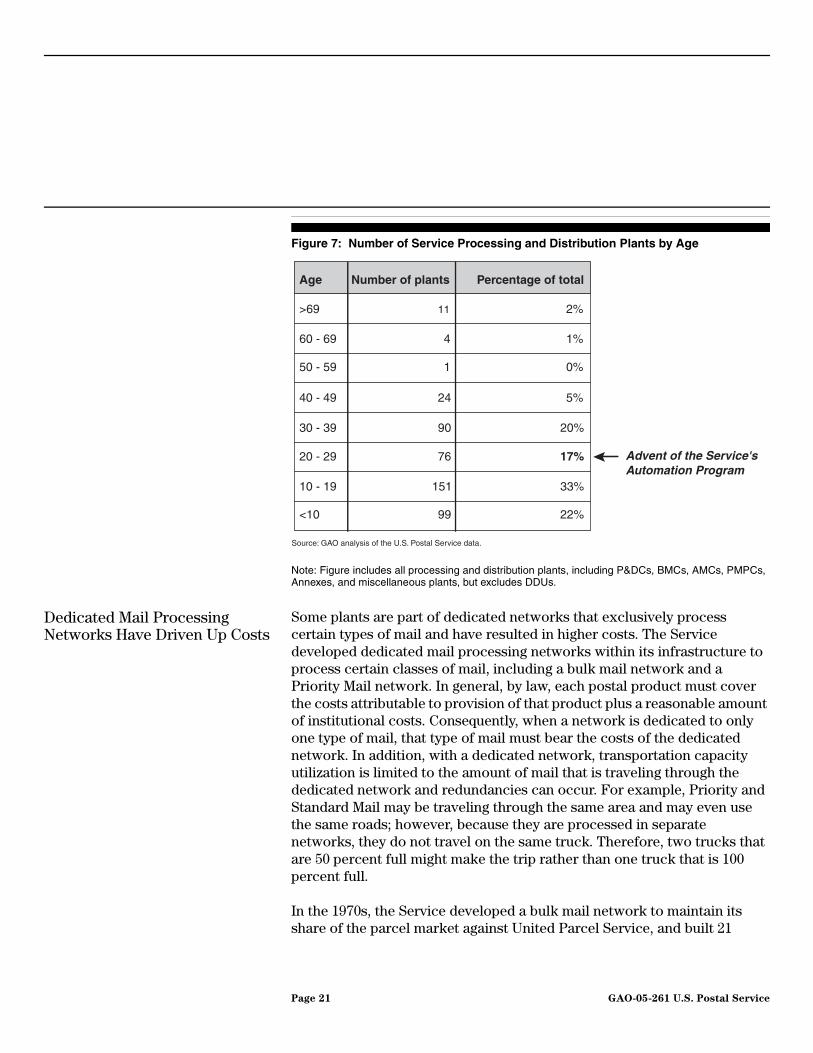
Figure 7: Number of Service Processing and Distribution Plants by Age
Note: Figure includes all processing and distribution plants, including P&DCs, BMCs, AMCs, PMPCs, Annexes, and miscellaneous plants, but excludes DDUs.
Dedicated Mail Processing Networks Have Driven Up Costs
Some plants are part of dedicated networks that exclusively process certain types of mail and have resulted in higher costs. The Service developed dedicated mail processing networks within its infrastructure to process certain classes of mail, including a bulk mail network and a Priority Mail network. In general, by law, each postal product must cover the costs attributable to provision of that product plus a reasonable amount of institutional costs. Consequently, when a network is dedicated to only one type of mail, that type of mail must bear the costs of the dedicated network. In addition, with a dedicated network, transportation capacity utilization is limited to the amount of mail that is traveling through the dedicated network and redundancies can occur. For example, Priority and Standard Mail may be traveling through the same area and may even use the same roads; however, because they are processed in separate networks, they do not travel on the same truck. Therefore, two trucks that are 50 percent full might make the trip rather than one truck that is 100 percent full.
In the 1970s, the Service developed a bulk mail network to maintain its share of the parcel market against United Parcel Service, and built 21
Percentage of totalNumber of plantsAge
Source: GAO analysis of the U.S. Postal Service data.
>69
60 - 69
50 - 59
40 - 49
30 - 39
20 - 29
10 - 19
<10
11
4
1
24
90
76
151
99
2%
1%
0%
5%
20%
17%
33%
22%
Advent of the Service's Automation Program
Page 21 GAO-05-261 U.S. Postal Service
plants to process and distribute parcels. These plants also process sacks of bulk Standard Mail. As operations have evolved over 30 years, the BMCs have encountered a number of difficulties in trying to process the mail efficiently. Furthermore, bulk Standard Mail is increasingly bypassing the BMC network through dropshipping.
Bulk letter mail, which first enters the bulk mail network in sacks or trays, can be processed more efficiently through automated letter sorters when it reaches the processing and distribution plants if it is presented in trays rather than sacks. Consequently, the Service made a concerted effort to move mail out of sacks and into trays. However, this move caused problems for the BMCs, which used sack-sorting machines. During our visits to postal plants, managers told us that sack-sorting machines were not designed to process rectangular trays. Sorting trays on the sack sorters often resulted in trays, which carry an average of 500 pieces of mail, breaking open and spilling mail over the conveyor belt. Consequently, the sack sorter had to be turned off while the individual mail pieces were collected and either sent to a P&DC for processing or processed on equipment that had been brought into the BMC specifically to deal with this problem. The BMCs were told by headquarters to remove all trays from automated equipment beginning in October 2004, and some BMCs are now processing the trays manually, which results in an increase in workhours.
In addition, changes in the way trucks are loaded and unloaded have affected dock space at the BMCs. For example, when trucks were loaded at processing plants by manually stacking packages inside the truck (bedloaded), it took 8 hours to unload a truck filled to capacity. Today, the Service uses automated loading machines that fill containers with packages, which are then loaded by forklift into the trucks. Trucks are unloaded by forklift, and automated equipment dumps the containers directly onto the conveyor belts that lead to the sorting equipment. Using this procedure it only takes 30 minutes to unload the same amount of mail. Figure 8 depicts the difference between bedloaded and container-stacked truckloads. While this has been a great improvement in workhour savings, BMCs now have problems storing all the mail because of limited dock space. We also observed and were told that some of the equipment in the BMCs is so old that it cannot run at full capacity and in some cases was not being used. For example, in one BMC the tow-line—used for transporting mail throughout the building—was shut down 18 years ago because it needed constant repairs. Consequently, mail is moved between operations either manually or using forklifts and tow trucks.
Page 22 GAO-05-261 U.S. Postal Service

Figure 8: Bedloaded Truck and Cardboard Containers
The Service also has a dedicated network for its expedited product, Priority Mail, which has driven up the cost of Priority Mail and led to declines in volume. In 1997, the Service awarded a 5-year contract to Emery to develop a PMPC network on the east coast to improve Priority Mail’s service performance. The Service also contracted with Emery to provide a
Source: GAO.
Page 23 GAO-05-261 U.S. Postal Service

dedicated transportation network for Priority Mail. Because the network only processed Priority Mail, all of the costs were borne by Priority Mail users. Large rate increases in 1999, 2001, and 2002 for Priority Mail, coupled with service problems, contributed to a 31 percent decline in Priority Mail volume from fiscal year 2000 to 2004. Table 4 shows rate increases and mail volumes. Consequently, the Service cancelled its processing and transportation contract with Emery in 2001, absorbed the processing back into its infrastructure, and contracted with FedEx for transportation services. While the Service is still processing Priority Mail in PMPCs, it is moving Priority Mail operations into other processing plants. It has also begun converting some PMPCs to Logistics and Distribution Centers (L&DC), which process multiple types of mail, and according to Service officials, it is the Service’s intent to eventually convert all PMPCs to L&DCs.
Table 4: Change in Average Rate and Volume for Priority Mail
Source: GAO analyses from Postal Rate Commission and U.S. Postal Service Data.
Note: Volume declines are between fiscal years 1999 and 2001, 2001 and 2002, and 2002 and 2004. July 2001 is the implementation date of the Recommended Decision in the R2000-1 rate case, which was modified by the Service’s Board of Governors.
Postal Service Plants May Not Be Optimally Located Due to Changes in Demographics and Transportation
Due to population shifts, household growth, and the changing transportation landscape in the United States, Service plants may not be optimally located. The Service stated in September 2003 that, “population shifts, changes in mail processing technology, and external events that occurred during the last two years, have required dramatic shifts in operating conditions resulting in rising costs to maintain the existing network.”
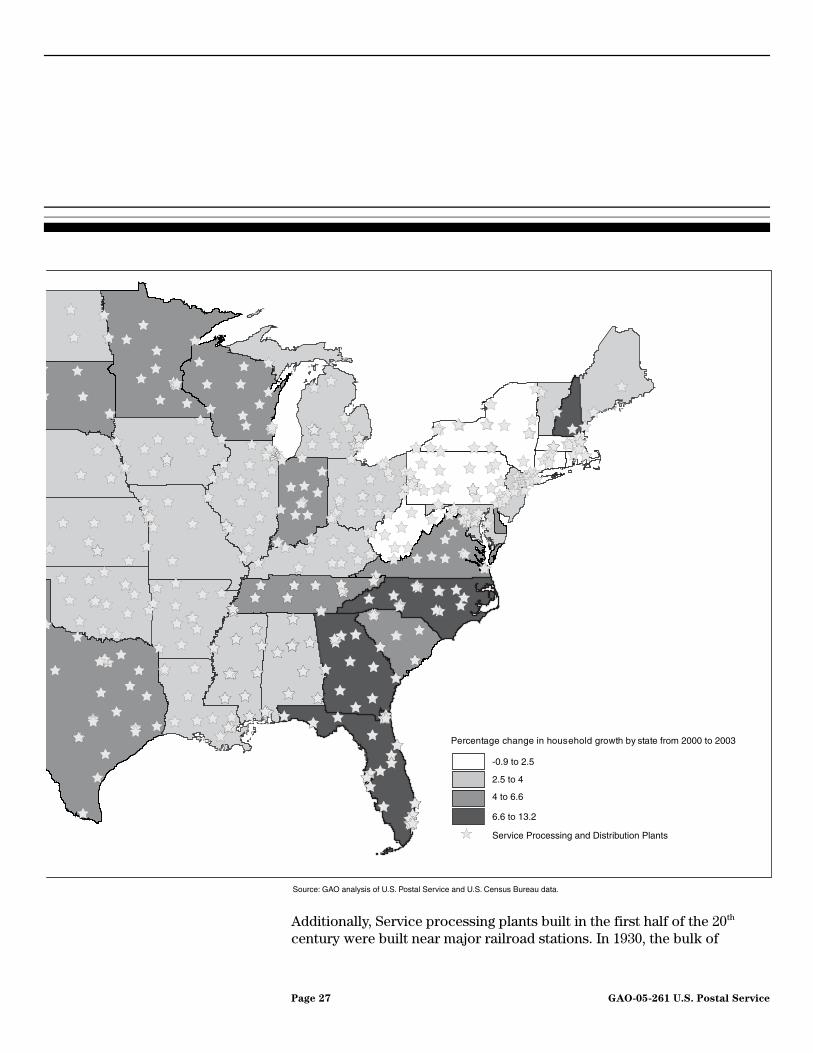
Most Service processing plants are located in eastern states—states that historically have had the highest populations. During the 1990s, U.S. household growth trends began moving west and south, with Nevada and Arizona ranking as the two fastest growing states in the nation. As seen in figure 9, the majority of the Service’s processing plants are located in states whose household growth is not as rapid as others. The Service has said that
Date Percent rate increase Percent volume decline
January 1999 7.2% 6%
July 2001 17.2% 11%
June 2002 13.5% 15%
Page 24 GAO-05-261 U.S. Postal Service
the operational challenge it faces in 2004 and beyond is to locate processing plants and employees within efficient reach of most of the population, while at the same time providing universal service to the rest of the nation at reasonable cost.
Page 25 GAO-05-261 U.S. Postal Service

�
�
�
Figure 9: U.S. Household Growth by State from 2000 to 2003 and Service Processing and Distribution Plants
������
�
������
��
�
��
�
�
����
���
��
��
��
�
�
�
��
����
�
�
�
�
�
�
�
������������
���
�
���
����
�
��
���
��
�
�
�
�
�
��
�
�
�
��
�
��
�
��
�
�
�
�
�
�
�
�
�
�
� �
�
�
�
�
�
�
�
�
�
�
�
�
���
�
�
�
�
��
��
��
�
�
�
�
��
�
�
�
�
��
�
Page 26 GAO-05-261 U.S. Postal Service
�
�
�
�
�
Additionally, Service processing plants built in the first half of the 20th century were built near major railroad stations. In 1930, the bulk of
�
�
�
�
�
�
�
�
�
������
�
�
��
����
�
�
���
�
�
�
�
�
� �
�
��
�
�
�
�
���
���
�
���
�
�
����
��
�
�
�
�
�
�
��
���
������
�
�
�
��
�
�
��
�
�
�
�
�
�
�
�
�
�
���
�
�
����
�
��
�
�
�
�
�
�
��
�
�
���
���
�
��
������
�
�
�
�
�
��
�
�
�
��
�
�
�������������
���
�
���
�
��
�
�
���
�
�
�
�
�
�
���
�
���
���
����
���
��
�
�
�
�����
��
���
��
�
��
����
�
����
��
�
����
�
����
�
�
�
��
��
����
�
���
�
��
�
�
��
�
��
��
�
�
��
��
�
�
�
��
�
��
���
���
����
��
�� ��������
�
���
�
��
�
���
������
��
���
�
� ���
��
�
�
�
�
�
�����
�
��
�
�������� ������
��
���
��
��
�
�
��
�
�����
����
��
��
����
�
�
��
��
�
�
�
����
��
�
�
�
�
�
�
��
���
��
��� �
�
�
�
�
� ��
�
���
�
�
���
�
��
�
�
���
�
�� �
�
�
�
��
�
����
�
� �
�
��
���
�
�
�
�
�
�
�
�
�
�
�
�
�
�
��
��
���
�
�
����
���
�� �������
���
�
�����������������������
Percentage change in household growth by state from 2000 to 2003
6.6 to 13.2
4 to 6.6
2.5 to 4
-0.9 to 2.5
Service Processing and Distribution Plants
Source: GAO analysis of U.S. Postal Service and U.S. Census Bureau data.
Page 27 GAO-05-261 U.S. Postal Service
domestic mail was moved by rail on over 10,000 trains nationwide. In 1965, only 190 passenger trains carried mail, and by 1970, virtually no First-Class Mail was carried by rail. In September 2004, Amtrak announced that it would discontinue transporting mail for the Service. Changes have also taken place in the Service’s use of air transportation. As a result of the September 11, 2001, attacks, new federal aviation security restrictions prohibited the transportation of mail weighing more than 16 ounces on commercial flights. As a result, the majority of the mail previously transported by commercial air has shifted to surface transportation or is flown by FedEx. Ongoing shifts in transportation have created an environment where most mail is now moved by highway and air, and some processing plants would be better located so that major highways and airports are easily accessible.
Changes Have Contributed to Variations in Productivity Among Processing Plants and Excess Capacity
The changing marketplace, evolution of mail processing, and shifts in demographics have contributed to variations in productivity across plants and excess capacity. The growth in infrastructure over time has resulted in differences in processing plants and contributed to variations in productivity and cost among plants. The decline in mail volume and the evolution of mail processing have contributed to excess capacity.
Productivity Varies among Plants Average productivity—total pieces processed per hour—varies among the Service’s mail processing and distribution plants, which indicates that some plants are not processing mail as efficiently as others. Service officials have attributed this variation to several factors, including size of plant as measured by workload, number of employees, layout of plants, and the use of nonstandardized processes. An analysis of productivity data for processing and distribution plants for fiscal year 2004 indicates that none of these factors, in isolation, can explain the variations; rather, as seen in table 5, it seems that plants with low productivity exhibit a number of contributing factors. For example, according to a Western Area Postal Service official, the processing plant in Spokane, WA, is one of the most productive plants because the plant is new, all operations are performed on one floor, and it has an automated system to transport mail among the different operations. The processing plant in Des Moines, IA, on the other hand, has very low productivity. This plant is 50 years old, has multiple floors where processing occurs, does not have enough dock space, and does not have adequate floor space for new processing equipment.
Page 28 GAO-05-261 U.S. Postal Service
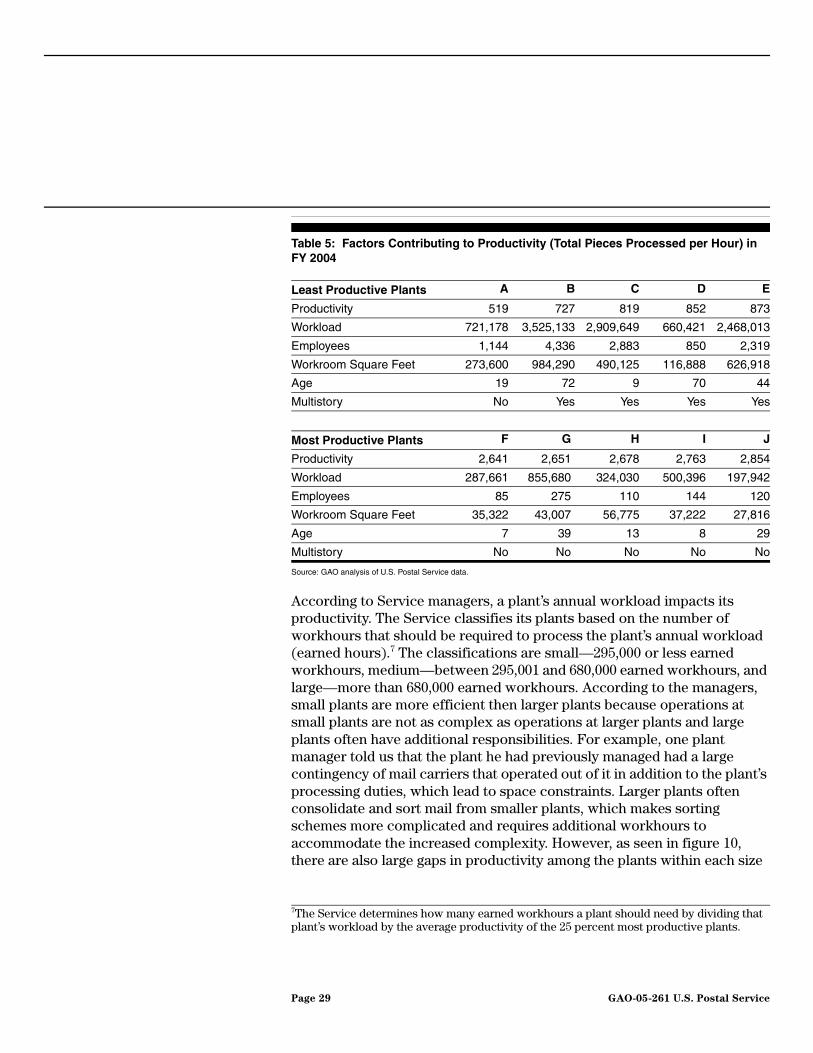
Table 5: Factors Contributing to Productivity (Total Pieces Processed per Hour) in FY 2004
Source: GAO analysis of U.S. Postal Service data.
According to Service managers, a plant’s annual workload impacts its productivity. The Service classifies its plants based on the number of workhours that should be required to process the plant’s annual workload (earned hours).7 The classifications are small—295,000 or less earned workhours, medium—between 295,001 and 680,000 earned workhours, and large—more than 680,000 earned workhours. According to the managers, small plants are more efficient then larger plants because operations at small plants are not as complex as operations at larger plants and large plants often have additional responsibilities. For example, one plant manager told us that the plant he had previously managed had a large contingency of mail carriers that operated out of it in addition to the plant’s processing duties, which lead to space constraints. Larger plants often consolidate and sort mail from smaller plants, which makes sorting schemes more complicated and requires additional workhours to accommodate the increased complexity. However, as seen in figure 10, there are also large gaps in productivity among the plants within each size
Least Productive Plants A B C D E
Productivity 519 727 819 852 873
Workload 721,178 3,525,133 2,909,649 660,421 2,468,013
Employees 1,144 4,336 2,883 850 2,319
Workroom Square Feet 273,600 984,290 490,125 116,888 626,918
Age 19 72 9 70 44
Multistory No Yes Yes Yes Yes
Most Productive Plants F G H I J
Productivity 2,641 2,651 2,678 2,763 2,854
Workload 287,661 855,680 324,030 500,396 197,942
Employees 85 275 110 144 120
Workroom Square Feet 35,322 43,007 56,775 37,222 27,816
Age 7 39 13 8 29
Multistory No No No No No
7The Service determines how many earned workhours a plant should need by dividing that plant’s workload by the average productivity of the 25 percent most productive plants.
Page 29 GAO-05-261 U.S. Postal Service
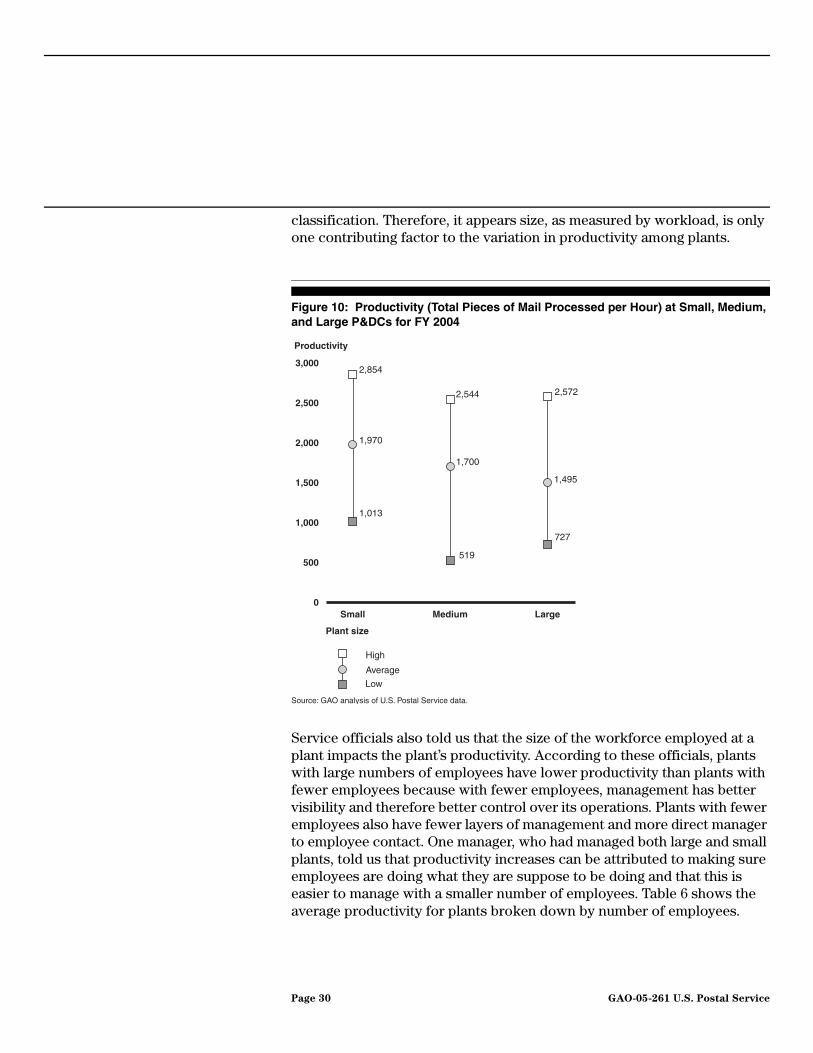
classification. Therefore, it appears size, as measured by workload, is only one contributing factor to the variation in productivity among plants.
Figure 10: Productivity (Total Pieces of Mail Processed per Hour) at Small, Medium, and Large P&DCs for FY 2004
Service officials also told us that the size of the workforce employed at a plant impacts the plant’s productivity. According to these officials, plants with large numbers of employees have lower productivity than plants with fewer employees because with fewer employees, management has better visibility and therefore better control over its operations. Plants with fewer employees also have fewer layers of management and more direct manager to employee contact. One manager, who had managed both large and small plants, told us that productivity increases can be attributed to making sure employees are doing what they are suppose to be doing and that this is easier to manage with a smaller number of employees. Table 6 shows the average productivity for plants broken down by number of employees.
Plant size
Productivity
Source: GAO analysis of U.S. Postal Service data.
0
500
1,000
1,500
2,000
2,500
3,000
High
Average
Low
LargeMediumSmall
1,013
519
727
1,970
1,700
1,495
2,854
2,544 2,572
Page 30 GAO-05-261 U.S. Postal Service

Table 6: Average Productivity (Total Pieces of Mail Processed per Hour) of Plants By Number of Employees for Fiscal Year 2004
Source: U.S. Postal Service.
Another factor, according to Service officials, is the physical layout of plants, particularly when plants are multistoried, because more time is spent moving mail between floors and among operations. For example, one multi-story plant that we visited has a number of difficulties in processing mail. Currently, the plant receives mail on the first floor, transports the mail to the third floor where it is cancelled, then sends the mail to the second floor for processing, and then back to the first floor for outgoing trucks. Due to cost constraints, the plant does not have an automated system to transport mail among the different floors and all mail must be moved among the floors by elevator. Unfortunately, many of the elevators are continually out of service. According to the manager at the plant, there are 13 elevators in the building and on a good day, 8 elevators are working. Consequently, according to the manager, more workhours are used to move mail around and prepare it for operations then would be used in a single-floor plant. This lowers productivity and increases the plant’s processing costs. Figure 11 depicts the processing of a letter at a multistory plant versus a single-floor plant.
Number of employees Average productivity
<500 1,960
500-999 1,614
1,000-1,499 1,463
1,500-1,999 1,443
>2000 1,148
Page 31 GAO-05-261 U.S. Postal Service

Figure 11: Processing of a Letter at a Multistory and a Single Floor Processing and Distribution Plant
Note: The figure depicts letter mail processing at a multistory and single floor plant. Other types of mail, such as flats and small parcels, are also processed at these plants but are not depicted in the figure.
The Service has 40 multistory processing plants across the country. The average productivity at multistory plants in fiscal year 2004 was 1,381 pieces per hour, while in single floor plants it was 1,828 pieces per hour. However, as seen in figure 12, there was a large gap between the productivity at the most productive multistory plant and the productivity at the least productive multistory plant in fiscal years 2001 through 2004. While overall productivity improved for all plants between fiscal years 2001 and 2004, the gap in productivity also increased from 1,395 fewer pieces per hour processed at the least productive plant than the most productive in 2001 to 1,524 fewer pieces in 2004.
Rough Cull
AFCS
DBCS
DBCS
2
1
3
44
5
G
1st
2nd
3rd
4thRough Cull
AFCS
DBCS
DBCS
1
3
4
6
6
7
8
2
57
Single floor plant1 Letter mail is received
2 Letter mail is separated from other types of mail in the Dual Pass Rough Cull
3 Letter mail is canceled in the AFCS
4 Letter mail is sorted on the DBCS to destinating 3 digit ZIP Code
5 Letter mail is transported to destinating facility
Multistory plant1 Letter mail is received
6 Letter mail is sorted on the DBCS to destinating3 digit ZIP Code
8 Letter mail is transported to destinating facility
7 Letter mail is transported by elevator to ground floor
3 Letter mail is separated from other types of mail in the Dual Pass Rough Cull
4 Letter mail is canceled in the AFCS
2 Letter mail is transported by elevator from ground floor to 4th floor
5 Letter mail is transported by elevator from 4th floor to 3rd and 1st floor
Source: GAO.
Page 32 GAO-05-261 U.S. Postal Service

Figure 12: Productivity (Total Pieces of Mail Processed per Hour) at Multistory Plants in Fiscal Years 2001 through 2004
Another factor in the productivity variation between plants is that the Service does not have standardized processes across plants. Consequently, one plant may be using a very efficient method to sort mail while another plant may be using a less efficient method. For example, table 7 shows the productivity of common automated mail processing operations varies by area (the Service has divided its national network into nine geographic areas).
Fiscal year
Productivity
0
500
1,000
1,500
2,000
2,500
Highest productivity
Average productivity
Lowest productivity
2004200320022001
600 655
2,251
727
1,130
577
1,381
1,995
1,165
1,963
2,134
1,277
Source: GAO analysis of the U.S. Postal Service data.
Page 33 GAO-05-261 U.S. Postal Service

Table 7: Average Productivity (Total Pieces of Mail Processed per Hour) for Selected Operations by Area for Fiscal Year 2004
Source: U.S. Postal Service.
The Service Has Excess Capacity According to Service officials, declining mail volume, worksharing, and the evolution of mail processing operations from manual to automation equipment have led to excess capacity. There are different types of excess capacity including:
• excess workhours, which occur when more workhours are used than are necessary for processing the mail;
• excess physical infrastructure, which occurs when more square footage is available for processing mail than is necessary (this may include entire plants);
• excess transportation capacity, which occurs when trucks are run at less than full capacity; and
• excess machine hours, which occur when machines sit idle.
Declines in mail volume have led to excess equipment capacity because less mail is being processed on the same amount of equipment. As stated earlier, worksharing contributes to all types of excess capacity because more mail volume is bypassing Service operations that occur early in the
Area
Preparecollection mail
for sorting(AFCS)
Lettersorting(DBCS)
Flat sorting(AFSM 100)
Smallparcel
sorting(SPBS)
Capital Metro 15,768 6,667 1,944 257
Eastern 15,226 7,809 1,992 262
Great Lakes 17,547 8,003 1,999 260
New York 15,251 8,202 2,095 301
Northeast 16,452 7,868 1,912 215
Pacific 18,982 9,123 2,039 308
Southeast 17,007 8,231 2,063 308
Southwest 15,178 8,066 2,060 274
Western 16,132 8,545 1,976 313
Difference between Mostand Least Productive Area 3,804 2,456 183 98
Page 34 GAO-05-261 U.S. Postal Service

process, such as cancellation and initial sorting. In the case of dropshipping, volumes of mail bypass entire plants. With automation, mail can be sorted faster than with manual processing. This has led to earlier processing completion times and higher productivities. On average, 525 pieces of letter mail can be sorted in 1 hour using manual processing operations, while 8,171 letters can be sorted in 1 hour using automated processes. Consequently, mail no longer needs to be processed on all plant shifts and equipment is being used fewer hours a day. Advancements in technology have also lessened the need for certain types of plants, such as air mail centers and remote encoding centers—which are separate plants established to perform address barcoding on letters that could not be read by the automated equipment in the mail processing plants.
The Service Is Pursuing Several Initiatives in Response to Changes but Challenges Remain
To achieve a more efficient and flexible infrastructure in response to changes in the marketplace, the evolution of the mail processing infrastructure, and shifts in demographics, the Service is exploring broad infrastructure realignment, while at the same time pursuing several initiatives to address inefficiencies in its current infrastructure. In its 2002 Transformation Plan, the Service outlined its network optimization effort, the goal of which was to create a flexible logistics network that reduces mailing industry costs, increases overall operational efficiency, and improves service. The Service has also taken some concrete steps to realign its infrastructure by closing some processing annexes, approving construction on plants in certain locations, and consolidating operations in various plants. In addition, the Service is pursuing several initiatives to improve efficiency in its current infrastructure. It is expanding automation, improving material handling operations, creating a comprehensive transportation network, and introducing standardization programs in an effort to reduce workhours and increase productivity. The Service faces challenges in reducing variations in productivity across plants in part because standardization efforts are hindered by the complexity in operations and the physical differences in plants. The Service also faces challenges in reducing excess capacity while maintaining service standards, including workforce rules, and stakeholder resistance to plant closings.
Page 35 GAO-05-261 U.S. Postal Service

The Service Is Working Toward Realigning Its Infrastructure to Address Changes
To assess its overall infrastructure in relation to changes that have occurred, in November 2001, the Service began developing a modeling tool designed to identify the least-cost network, given current service standards, under several network scenarios. According to the Service, the model will “help the Service determine which plants remain viable and necessary within the future infrastructure, and what distribution and transportation roles [would] be performed by plants that remain as parts of an optimal, fully integrated network.” According to the Service’s Transformation Plan, a plan to implement the results of this modeling tool was to be completed by December 2002. By November 2003, the Service had collected detailed operational and volume data and had developed data-based models. In January 2004, the Service reported that the models were being tested and validated. Since then, there has been little public information on the results of these models or the Service’s implementation plans.
The Service has also begun closing annexes—temporary plants used for mail operations when space is limited— and consolidating mail processing operations in order to address the issue of excess capacity. While new construction is also taking place, some of these projects have been in the planning stages for years. Consequently, it is unclear whether the Service is incorporating its future infrastructure needs into its current projects.
Between fiscal year 2002 and 2004, the Service closed 50 annexes. According to Postal Service officials, decisions to close annexes are based on volume and do not take future network configuration into consideration. Because annexes are usually staffed by temporary employees, for whom the Service does not have the same notification and reassignment requirements as it does for permanent employees, they are easier to close than other plants and the closing can be done relatively quickly and with little controversy. Also, while most processing plants are owned by the Service, most annexes are leased and therefore can be closed without having to dispose of the asset. Table 8 shows the number of plants and annexes owned and leased by the Service.
Page 36 GAO-05-261 U.S. Postal Service

Table 8: Number of Plants and Annexes Owned and Leased by the Service as of September 30, 2004
Source: GAO analysis of U.S. Postal Service data.
However, according to Service officials, closing annexes is a short-term solution. In some cases, the Service is planning on eliminating certain types of plants altogether. For example, the Service’s Chief Operating Officer told us that there is no longer a need for processing mail at air mail centers because, due to technological advances, mail can be assigned to specific flights right at the mail processing and distribution plants. The leases for air mail centers are typically very expensive; and in many areas of the country, the Service is considering closing down the plants as the leases expire. Another example is the reduction and eventual elimination of the separate address barcoding centers, remote encoding centers. Enhancements in the ability of automation equipment to read addresses have now significantly reduced the need for remote encoding centers. Initially, the Service had 55 of these centers and is now down to 17.
In several areas, rather than closing entire plants, the Service has consolidated sorting operations at several plants into one plant. For example, in the Pacific Area, Saturday mail processing has been consolidated from 23 plants to 11 plants. An area official told us that the consolidation effort began a few years ago in response to volume declines. The official pointed out that consolidation of Saturday mail processing reduces processing costs, but may increase transportation costs because the mail has to be rerouted to the plant that is processing the consolidated volumes. The Service is able to consolidate Saturday processing because there is no delivery on Sunday. Therefore, the Service can reroute the mail and still meet its service standards. Officials in other areas told us that they are also consolidating Saturday processing. While efforts to close plants and consolidate operations have taken place, the Service has not provided any public information on its future closings and consolidations, nor does it have a standard procedure in place for closing plants, and instead operates on a case-by-case basis.
The Service has begun constructing, or has approved funding for the construction of new plants because, as stated earlier, some plants cannot
Type Owned Leased Total
Plants 330 60 390
Annexes 20 45 65
Page 37 GAO-05-261 U.S. Postal Service
accommodate necessary equipment, do not have room for current operations, or are not optimally located. For example, in Philadelphia, the Service is building a new processing and distribution center to replace the current one, which was built in 1935 and consists of two four-story buildings connected by a bridge. Mail at this plant is processed on separate floors and is moved between operations using elevators. The new plant will be two stories but will have a tray management system that will assist in moving the trays between the floors. It will also be able to accommodate mail-processing equipment that will not fit in the current plant and will have more dock space. According to the manager at the Philadelphia plant, moving to the new building should increase productivity and decrease the workhours currently needed to move mail between operations. The Postal Service Board of Governors has also approved funding for new plants in Maine and Michigan.
The Service Is Increasing Its Automated Operations to Improve Productivity and Efficiency
The Service is completing the automation of letter mail processing and focusing efforts on automating flats and parcels to increase productivity and reduce costs in response to changes that have occurred in the mailing industry. The Service is automating the processing of undeliverable-as-addressed mail, deploying automated flat sorting equipment and deploying a promising new parcel-sorting machine. However, increased automation contributes to excess capacity and it is not clear how the Service intends to reduce this excess capacity as its operations become more automated.
Letter Processing Automation The Service is continuing its automation of letter mail by focusing on controlling the cost of undeliverable-as-addressed mail, which includes mail that is improperly addressed and change of address mail. Annually, an average 4.3 billion letters are undeliverable-as-addressed and require additional processing steps to verify and sort the mail to the correct address. This mail costs the Service approximately $1.8 billion a year. Currently, undeliverable-as-addressed mail is processed to the delivery unit where the carrier identifies the piece as undeliverable. The mail is then transported to a Computerized Forwarding System site, where the undeliverable-as-addressed mail is manually keyed and redirected for processing to the correct location. This means that each piece is essentially processed twice, resulting in increased costs. To address this expenditure, the Service is deploying software technology called the Postal Automated Redirection System. By scanning each piece of mail and comparing it with a computerized database of change of address forms, the software identifies undeliverable-as-addressed letter mail at the first automation handling and redirects the mail to the current address, thus, reducing the
Page 38 GAO-05-261 U.S. Postal Service

handling and transportation of undeliverable-as-addressed mail. The Service expects to save approximately 5 million workhours annually upon completion of the program. However, upon completion, the Postal Automated Redirection System will only redirect undeliverable-as-addressed letter mail. Flat undeliverable-as-addressed mail will continue to be processed through the Computerized Forwarding System.
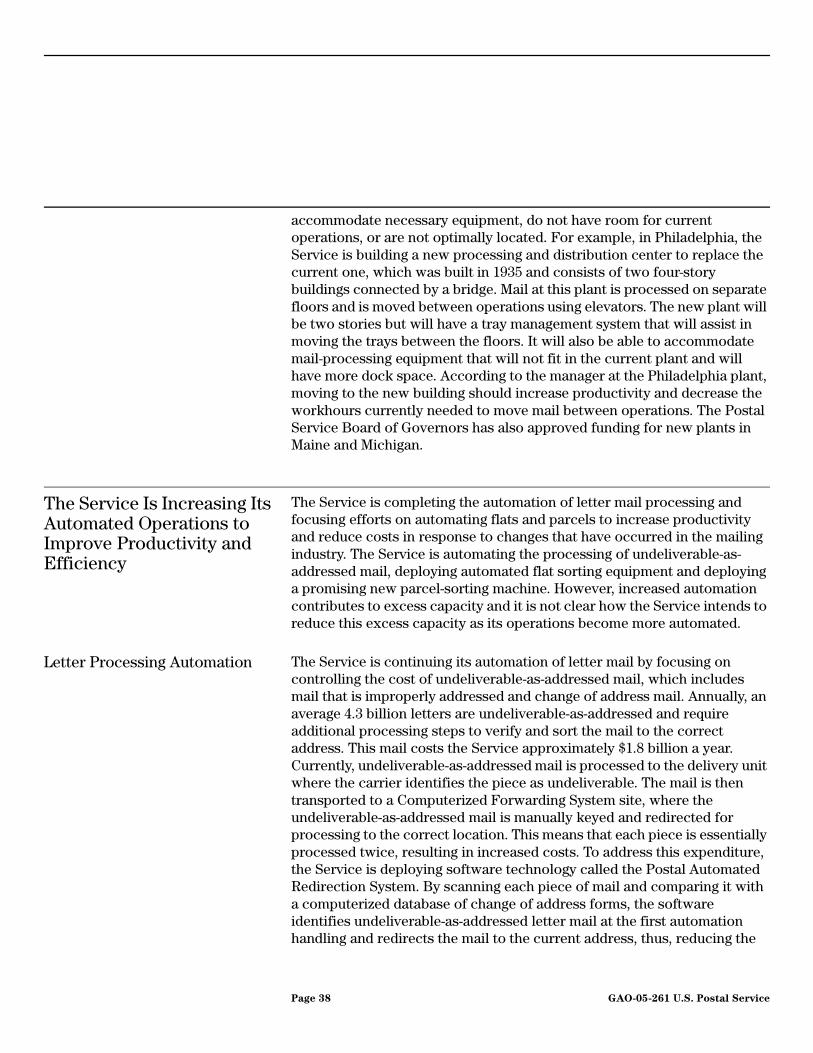
Flat Processing Automation The Service has recently deployed automation equipment for flat mail that is intended to improve productivity and reduce handling costs of over 50 billion flat pieces processed each year. In 1982, the Service began moving flats out of manual processing by introducing mechanized sorting machines. However, the Service experienced problems with the mechanized machines, including frequent jams and high maintenance costs. Many of these problems were due to mail pieces that were wrapped in plastic, or too flimsy to be processed on the equipment, and resulted in an increase in the unit mail processing cost for flat mail, particularly periodicals. In fiscal year 1996, the Service began replacing the older machines with a flat sorting machine (FSM 1000) that, although still not automated, was designed to handle pieces wrapped in plastic and less rigid pieces. In 2000, the Service also introduced an automated flat sorting machine (AFSM 100) that contains an automated flat feeder and optical recognition technology to read addresses. In plants that do not have enough flat volume to justify deployment of the AFSM 100, the Service is modifying the existing FSM 1000 to include scanning capabilities that replace the need for manual keying. The AFSM 100 has a throughput rate of 17,000 or more flat pieces of mail per hour, which is more then twice as fast as the FSM 1000. As seen in table 9, the higher throughput results in higher productivity than manual or mechanized operations.
Table 9: Comparison of FY 2004 Productivity for Flat Sorting Operations
Source: U.S. Postal Service.
While the AFSM 100 has a faster throughput for processing flat mail than its predecessor, when it was first deployed, mailers experienced problems with the feeder system ripping the covers, which generally contain
Flat sorting operation Productivity Pieces Handled per Hour
Manual Flats 427
FSM 1000 433
AFSM 100 2,011
Page 39 GAO-05-261 U.S. Postal Service
addresses, off of magazines. Consequently, subscribers were not receiving their magazines or were receiving just the cover. The Service is currently working to enhance the feeders with upgrades designed to significantly decrease the amount of damage. In addition, the equipment requires many workhours to prepare the mail to be fed through the machine. Therefore, some of the benefit of the increased productivity may be lost. For example, most mail that will be processed on the AFSM 100, must first be stacked into a flat mail cart, which takes 40 minutes for one employee to fill. Due to the speed at which the AFSM 100 can process flats, six carts have to be manually prepared for each hour the AFSM 100 is run, resulting in a significant amount of workhours needed to prepare the flat mail and square footage needed to store the prepared mail waiting to be processed on the equipment. The Service has said that it is exploring ways to automate and standardize the mail preparation process to reduce workhours. Figure 13 shows empty flat mail carts and the space needed to store them and the volume of flat mail in a flat mail cart when it is full.
Figure 13: Photographs of Empty and Full Flat Mail Cart
Unlike letter mail that is sorted on automated sorting machines into the order the mail will be delivered on the carrier route (delivery point sequence), flat mail must be sorted manually by the carrier into delivery order. The Service is exploring automation that would sort flat mail into
Source: GAO.
Page 40 GAO-05-261 U.S. Postal Service

delivery sequence order to reduce the need for the carrier to sort flats in the office and technology that would package flat and letter mail together for delivery operations to eliminate carrier sorting. While this technology is still in the research and development stage, it could eventually have a significant effect on the Service’s infrastructure and on operations and mail processing across the entire postal network including how mailers prepare and present their mail to the Service. This has raised concerns among mailers.
Parcel Processing Automation To increase efficiencies in parcel processing, the Service has developed automation to reduce manual handling and increase processing capacity. The Service has deployed the Singulator Scan Induction Unit (SSIU), which has improved productivity and sort accuracy for processing packages at the BMC by reducing the need to manually key in parcel addresses. The SSIU is capable of scanning over 5,000 parcels per hour, and eliminates 80 percent of all clerk keying operations at 19 of the 21 BMCs. The equipment cannot be installed in the remaining 2 BMCs due to the unique design of the equipment and the layout of the plants.
The Service is also in the process of deploying the next generation of parcel sorting equipment at the processing and distribution plants called Automated Package Processing Systems (APPS), which will process small parcels and bundles of mail. The APPS machine is expected to replace the small parcel and bundle sorters in larger plants and does not require manual keying of each piece, reducing workhours significantly for the Service. The automated package processing machine is expected to increase processing capacity, productivity, and sorting accuracy of parcels and bundles of mail. However, as seen in figure 14, the APPS machine is very large and many plants do not have the floor space to accommodate it. There are several standard configurations for the APPS machine that require between 12,100 sq. ft. and 32,100 sq. ft. Some Service officials expressed concern because they do not have enough room for the new machine in processing plants, and there are only a few plants that will be able to accommodate the equipment.
Page 41 GAO-05-261 U.S. Postal Service

Figure 14: Automated Package Processing Machine
The Service Is Improving Its Material Handling Operations
The Service is working to expand mechanization and improve productivity in order to reduce workhours in the methods employed to move mail between operations, prepare mail for processing, and load and unload mail from trucks, known as material handling. However, cost concerns limit the effectiveness of these initiatives. The Service has deployed various systems to move trays of mail throughout its processing plants, including the low cost tray sorter, the tray management system, and a prototype of the universal transport system. Between fiscal year 2000 and 2003, the Service reduced its material handling workhours in 244 processing plants by 11 million or 11 percent. However, the Service recently announced that it was curtailing the deployment of the universal transport system because of low return on investment.
To reduce material handling workhours and limit the amount of manual labor needed to move mail between operations, the Service has deployed Low Cost Tray Sorters (LCTS), which are essentially conveyor belts used to
Page 42 GAO-05-261 U.S. Postal Service

move trays of mail between various operations. LCTS will replace the current method of loading mail into handcarts, manually moving the handcarts between operations, and unloading the handcarts. According to the Service, LCTSs are configured to the unique needs of each particular processing plant and are only justified and deployed on a site-specific basis. To date, the Service has deployed the LCTS in 160 plants; however, the Service has stated that additional site-by-site justifications are possible resulting in additional LCTS deployments. Figure 15 shows one version of the LCTS.
Figure 15: Low Cost Tray Sorter
The Service has also installed the Tray Management Systems in a number of postal plants. The Tray Management Systems is an automated system that manages and controls mail transport, staging, and retrieval of letter and flat mail trays throughout a plant on a conveyor belt system by scanning barcodes and directing the trays to mail processing equipment. The Service
Source: GAO.
Page 43 GAO-05-261 U.S. Postal Service
initially planned on deploying 42 systems but temporarily suspended deployment because of capacity and reliability problems. In 1998, the number of systems to be deployed was reduced to 23 sites costing $497.3 million. Only three multistory plants have the Tray Management System.
The Service recently abandoned an effort to automate material handling due to low return on investment of its experimental Universal Transport System. This system was designed to expand the processing of product lines beyond that of traditional Tray Management Systems, which only process letter and flat trays. Instead, the Universal Transport System is a system that transports trays, bundles, packages, and sacks throughout a plant to enhance work processes and improve information flow. The Service spent $27.3 million developing this system in a processing plant in Fort Myers, FL, over the past 5 years. However, the Service stated that it has no plans for deploying the system to other processing plants.
The Service Has Made Changes to Its Transportation and Distribution Network to Address Demographic and Transportation Changes
To improve efficiency in its transportation and distribution network, the Service is implementing programs designed to increase utilization of truckload capacity, increase flexibility in transportation contracting, and reduce redundancies.
The Service Has Developed a Tool to Improve Information Used to Optimize Truckload Capacity
The Service has developed a Transportation Visibility Strategy designed to help management increase utilization of truckload capacity. According to Service officials, currently, 35 to 40 percent of truckload capacity is not being used, and without accurate and complete data on mail volume per truck, the Service has been unable to optimize load capacity. One way in which the Transportation Visibility Strategy is intended to increase efficiency is by using actual volume data in network planning and optimization. Instead of relying on estimates to determine truckload volume, the new strategy will incorporate scanning technology and data management software to determine the origin and destination of mail, and to assign it to a specific route. Having more accurate data on how much mail is coming from or going to any given destination will enable the Service to analyze mail density on travel routes, and consolidate mail traveling to the same location, resulting in fuller trucks. The Service has stated that this strategy will be employed at about 130 plants by fall 2005, which will afford it the ability to capture data on 78 percent of the Service’s
Page 44 GAO-05-261 U.S. Postal Service
originating highway volume and automate 70 percent of the data collection activities that are currently performed manually.
The Service Is Working to Increase Flexibility in Its Transportation Planning
The Service has implemented a new contract management system to support the solicitation, award, and administration of its highway contract routes and improve flexibility in the transportation network. Traditionally, the Service has entered into 4-year contracts with its transportation suppliers. According to Service officials, at times, these contracts do not support efforts to create a flexible transportation network. This is because 4-year contracts commit the Service to agreements that may not reflect changing needs such as mail volume fluctuations and changes in processing operations. Also, the Service may not be able to easily add or remove needed trips. Service officials have stated that the use of the new contract management system, in addition to the mail volume data provided through the Transportation Visibility Strategy, will allow the Service to enter into 1 or 2 year transportation contracts that allow it to more accurately plan transportation and routing of mail. The Service is also planning to implement a Transportation Optimization Planning and Scheduling tool that is intended to allow it to conduct long- term planning and dynamic scheduling of its mail transportation. The Service manages over 17,000 highway contract routes and as contracts are renewed, these new systems will allow the Service to assess costs and service performance associated with these contracts.
The Service Intends to Reduce Redundancies in Transportation and Distribution Systems by Expanding Its Hub and Spoke Program
The Service plans on expanding its hub and spoke program (HASP), and modifying its Bulk Mail Center (BMC) networks to address redundancies in its transportation and distribution network. Currently, the Service transports First-Class Mail through its HASP network and Standard Mail through its BMC network, which may create redundancies on routes serviced by both networks. Figure 16 shows the current locations of HASPs and BMCs. By eliminating redundancies across these networks, the Service believes that it will be able to cut its transportation costs and improve its efficiency. HASP creates a consolidation hub within an area, thus eliminating some inter-plant truck trips between different processing centers, and their associated costs. Currently, the Service has 13 HASPs located in 8 of its 9 regional areas. The Western Area, which is the largest of the Service’s 9 geographic areas, covering 1.7 million square miles, does not have HASP. The Service is considering developing two HASPs in this area, attaching them to the Kansas City, MO, and Denver, CO, processing and distribution centers. Another method the Service is considering to reduce redundancies in its transportation network is to modify its BMC network
Page 45 GAO-05-261 U.S. Postal Service
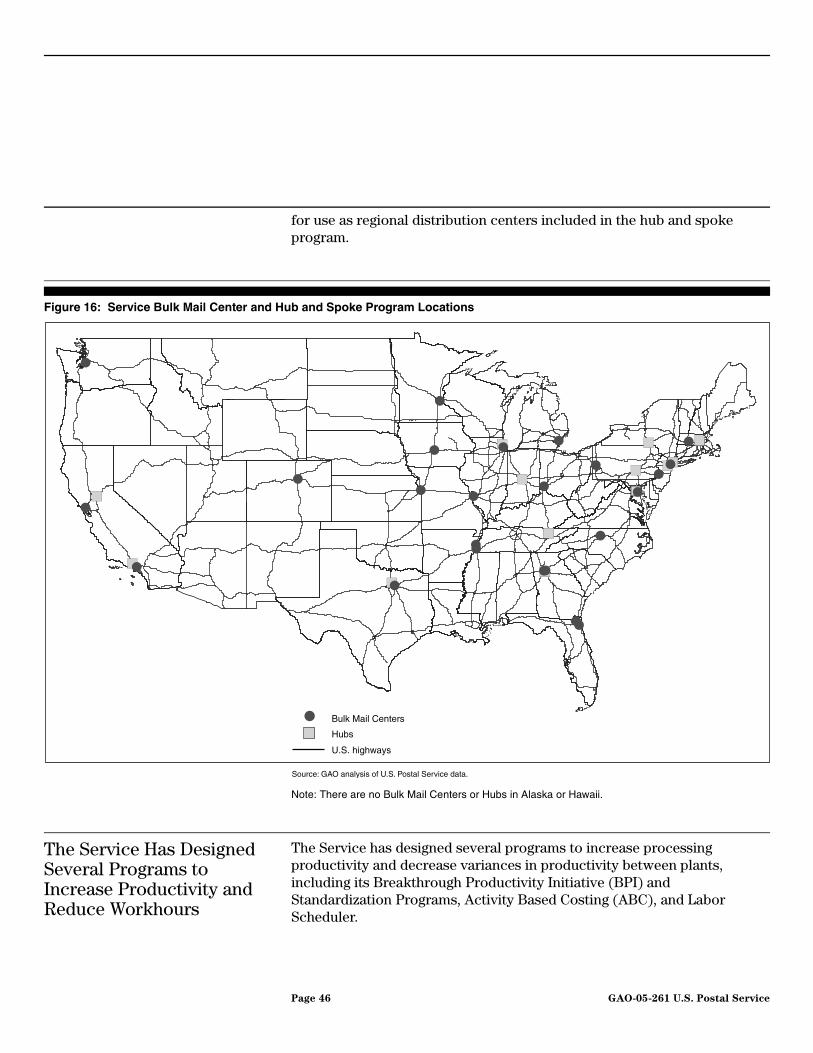
for use as regional distribution centers included in the hub and spoke program.
Figure 16: Service Bulk Mail Center and Hub and Spoke Program Locations
Note: There are no Bulk Mail Centers or Hubs in Alaska or Hawaii.
The Service Has Designed Several Programs to Increase Productivity and Reduce Workhours
The Service has designed several programs to increase processing productivity and decrease variances in productivity between plants, including its Breakthrough Productivity Initiative (BPI) and Standardization Programs, Activity Based Costing (ABC), and Labor Scheduler.
��
�
�
�
�
��
��
�
��
�
�
�
Hubs
Bulk Mail Centers
U.S. highways
Source: GAO analysis of U.S. Postal Service data.
Page 46 GAO-05-261 U.S. Postal Service

Breakthrough Productivity Initiative and Standardization
The Service has developed a Breakthrough Productivity Initiative that measures each plant’s processing performance against nationally established targets to increase processing productivity and decrease variations in productivity between plants. This initiative includes a recognition program that provides plant managers with financial incentives to perform at their target productivity. The Service establishes target groups and productivity targets for each of these groups. Plants are placed in a group and are compared with the other plants in the same group. Postal officials explained that incentives to increase productivity are given in the form of bonuses for managers and reduced budget allocations for plants.8 As part of this initiative, the Service has established a Standardization Program. This program identifies “proven practices” in mail processing that have resulted in high productivity for processing plants and communicates these practices, and the subsequent increases in productivity that result from them, to other processing plants.
The goal of standardization is eventually for all plants to certify that they are reaching set performance targets. Because there may be more than one way to reach a productivity target, a plant does not have to use the proven practice; it only has to meet its productivity target and is provided with a proven way to meet the goal. In addition, targets are reviewed to determine if they need to be adjusted based on demonstrated performance. The first operation to be certified under this program is the Automated Flat Sorting Machine (AFSM 100). The AFSM 100 operations have been standardized, and all plants that use this machine must be certified in them, that is, the operations must all be as productive as their given target. Certification of this operation has resulted in the Service achieving a 6.8 percent increase in performance in fiscal year 2003 with 44 percent of its sites certified. Further, as of August 2004, with 100 percent of its sites certified, the Service achieved record productivity performance of 2,015 pieces per hour being processed, for a 17.7 percent increase in productivity over fiscal year 2003.
Activity Based Costing The Service has begun using an Activity Based Costing program to determine differences in unit operating costs among plants and to identify opportunities for savings in plants. For example, a plant’s mail volume,
8Each area and plant is given a baseline budget, and its budget allocation is subtracted from this baseline. The budget allocation is determined by the amount of unused opportunities for efficiency that an area or plant has. The more unused opportunity it has, the less operating money it gets.
Page 47 GAO-05-261 U.S. Postal Service
maintenance needs, or workforce size may affect the plant’s operating costs. The Activity Based Costing program assigns costs to plants for specific activities and products and provides managers with the ability to identify potential areas where high costs can be reduced. To date, the program is not used in BMCs, but will be piloted in three BMCs in fiscal year 2005.
Using Activity Based Costing in conjunction with BPI would allow plant managers to view the costs associated with different levels of productivity. Managers have an incentive to increase BPI productivity but the costs associated with this productivity may be high. As seen in figure 17, there is a strong correlation between BPI productivity and the cost of processing letter mail. However, not all plants with high productivity have low processing costs. For example, two plants with very similar productivities in fiscal year 2004—2,251 and 2,250 total pieces per hour—had average letter processing unit costs that were about 2 cents apart, with one being about 4.8 cents, and the other about 2.8 cents. Service officials have said that there are plans to expand the Activity Based Costing program. Activity Based Costing was made available to managers in 2003, and officials stated that they are continuously receiving requests from interested employees for training.
Page 48 GAO-05-261 U.S. Postal Service

Figure 17: Correlation Between BPI Productivity (Total Pieces Processed per Hour) and Activity Based Costing Unit Letter Processing Costs for Fiscal Year 2004
The Service Developed a Labor Scheduler to Optimize Employee Scheduling, but Problems with Data Have Limited Its Use
The Service has implemented the Labor Scheduler, a model that will allow managers to optimize the number and type of employees required for each mail processing shift and operation. The Labor Scheduler is designed to allow plant managers to avoid overstaffing or understaffing that can lead to higher mail processing costs or poor service. Several problems have arisen with the use of the Labor Scheduler, including poor data quality and insufficient communication used when implementing it.
In February 2004, the Service’s Office of Inspector General (OIG) found several problems with the Labor Scheduler. The managers we interviewed corroborated these problems. For example, the OIG determined that the model’s input data could not be validated because it was either incomplete or unavailable. Therefore, the model’s output data were not reliable. In one instance, the model identified 112 positions in a plant to be changed or reduced. However, after a significant number of the positions were reduced, the plant’s workhours and overtime increased. A Service official responsible for implementation of the Labor Scheduler program said that the same type of data are used for each plant but acknowledged that some sites might need to improve their data. This official also said that the output
$0 $10 $20 $30 $40 $50 $60 $70 $80 $90 $100
0
500
1,000
1,500
2,000
2,500
3,000
Cost per thousand
Productivity
Source: GAO.
Page 49 GAO-05-261 U.S. Postal Service

of the model is only as good as the data collected and how it is used. For example, a headquarters’ official told us that data can be manipulated to show a desired outcome. During our plant visits, some managers told us that they were unable to use the Labor Scheduler because its outputs were unrealistic and could not be implemented.
The OIG also found that there was ineffective communication between the Labor Scheduler program office and plant management. Management was unclear on how to use the model and how to use and communicate the model’s results. For example, the OIG found that managers were unsure how to manage multiple employee shift start times. This concern was also raised during our site visits, when a plant manager told us that the model’s output recommended the plant shifts should start at 12-14 different times. The plant manager said that it would have been hard for managers and employees to keep track of the schedules.
The Service Faces Challenges in Addressing Productivity Variations among Plants and Excess Capacity
Despite the recent progress the Service has made in improving efficiency and cutting costs, it faces challenges in reducing productivity variances among plants and eliminating excess capacity.
Difficulties in Reducing Variations in Productivity among Plants
The Service has had difficulty reducing variations in productivity across plants, in part, because standardization efforts are hindered by the complexity in operations and the physical differences in plants. In fiscal year 2001, the average productivity at small plants was 446 pieces per hour higher than the average productivity in large plants. This difference shrunk to 405 pieces in fiscal year 2002, then rose again in fiscal year 2003 to 436 pieces per hour, and 474 pieces in fiscal year 2004. According to postal officials, a key effort directed toward reducing this variation in productivity is its standardization program. These officials said that it is difficult to standardize some operations, such as material handling and collection, because these operations are affected by so many variables, such as how many trucks need unloading on any given day and how the mail is prepared on the truck. Thus, it has been difficult to establish a measurement on which to evaluate them. Standardization is also hampered because there are so many different buildings in the Service’s infrastructure that it cannot develop one uniform layout. For example, the automated parcel-sorting machine has standard operating procedures to maximize its output, but it comes in different physical designs to complement different plant layouts.
Page 50 GAO-05-261 U.S. Postal Service

Service officials told us that engineers have been studying processing plant layouts for years, and have ideas as to what the most efficient layouts are, but have not been able to generalize plant layouts because not all plants have the same equipment in them. Another difficulty in achieving standardization, according to these officials, is that because the workforce is primarily decreased through attrition, standardization processes occur incrementally, in tandem with changes in the workforce.
Reducing or Eliminating Excess Capacity Is Difficult
The Service faces challenges in eliminating excess capacity while maintaining service standards, which drive dispatch times at processing plants. For example, one way to reduce excess capacity in the form of workhours and transportation capacity is to consolidate mail-processing operations from many plants into one plant. If some of the plants are then closed and equipment disposed of, then excess physical infrastructure and machine capacity is also reduced. However, according to a Service official, service standards impede consolidation of mail processing because consolidation requires re-routing mail from plants that are closer to collection or delivery points to plants that are farther away. This official said that relaxing service standards could greatly increase the amount of consolidation that could be achieved. The challenge is to reduce excess capacity while maintaining service standards.
The Service and its unions have negotiated workforce rules, which are important in documenting how work in the plant will be performed and in protecting workers’ rights. According to Service managers, contractual workforce rules reduce management’s flexibility to reduce excess capacity because these rules govern reassignments and terminating positions that are no longer needed. For example, several Service managers told us that it is difficult for them to move excess employees to positions where they are needed because of these workforce rules. These workforce rules include steps to be followed when eliminating positions, and rules regarding transferring employees between positions, such as clerks, mailhandlers, and carriers.9 When transferring between positions, employees will often lose their seniority so they elect not to transfer. Therefore, if a plant has too many clerks and not enough mailhandlers, it cannot simply move some clerks to mailhandler positions. In addition, moving employees between plants requires the Service to follow specific steps that often limit managers’ flexibility. One area vice president told us that it is very
9Mail processing clerks perform a variety of duties related to processing mail; mail handlers move mail between operations; and carriers deliver the mail.
Page 51 GAO-05-261 U.S. Postal Service

challenging to move employees from one plant to another. For example, this vice president had worked out an agreement between the regional unions to allow employees to move from a plant that had too many employees to a plant with too few. However, local union representatives wanted part-time employees in their district to be converted to full-time employees and given positions in the plant with openings rather than have current full-time employees from the over-staffed plant move. Therefore, they halted the agreement at the last minute. The workforce contracts also include “no layoff” clauses and procedures that must be followed when plants are closed or tours consolidated, including a formal agreement that requires 60-days notice whenever the Service is going to close a plant.
Another obstacle to eliminating excess capacity is the resistance the Service has historically encountered when it tries to close plants. In each of the three cases we reviewed, the Service encountered resistance to its plans to close plants. For example:
• When the Service wanted to move operations from the Pendleton, OR, plant to nearby Pasco, WA, because of equipment limitations in Pendleton, many people protested. Local congressional representatives made a formal request to the Service not to close the plant. In response, the Service modified the equipment to fit into the existing plant.
• When the Service considered moving the business mail entry unit from St. Paul, MN, to Minneapolis, MN, because of security concerns and cramped plant space, local union members and representatives got involved and urged the Service to reconsider. Although none of the 30 employees at the St. Paul plant would have lost their jobs, their schedules and commutes would have changed. The Service agreed to delay the closing pending further review.
• At the Marina Del Rey, CA, processing and distribution plant, local managers began moving some operations out of the plant and consolidating them with operations at the Los Angeles, CA, plant. Before any decisions were announced at the headquarters level, word got out that the plant was being considered for closing. Local unions contacted local government representatives, and union members picketed the plant. Some of this resistance was due to the Service’s failure to communicate with its employees and unions regarding the Marina Del Rey plant. National union representatives told us that the Service never contacted them about the possible closing, and they only heard about it after the possible closing was discussed in a newspaper article.
Page 52 GAO-05-261 U.S. Postal Service
The Service’s Strategy for Realigning Its Mail Processing Infrastructure Lacks Clarity, Criteria, and Accountability
We developed criteria for evaluating the Service’s strategy, including how effective it would be in eliminating excess capacity and whether the strategy was transparent and accountable. The Service’s strategy raises several issues. First, the Service’s strategy for realigning its mail processing and distribution infrastructure is unclear. Second, it does not include specific criteria and processes for eliminating excess capacity, including the removal of unnecessary facilities. Third, the Service’s strategy excludes stakeholder input, is not sufficiently transparent and accountable, and lacks performance measures for results of decisions.
The Service’s Strategy for Realigning Its Mail Processing and Distribution Infrastructure Is Not Clear
The Service’s strategy for realigning its mail processing and distribution infrastructure has not been clear because the Service has outlined several seemingly different strategies over the past 3 years. In 2002, the Service announced a strategy for realigning its infrastructure that outlined an ambitious effort to “initiate sweeping logistics changes.” According to the Service, a modeling tool referred to as Network Integration and Alignment (NIA) was to be used to determine what specific changes would be made. These changes were to include consolidation of plants, redefined roles for plants, reduced transportation costs, and a streamlined network. An implementation plan for this strategy was to be developed by December 2002. However, to date the Service has not developed an implementation plan. Following a recommendation we made, in November 2003, the chairman of the Senate Committee on Governmental Affairs and a senator asked the Service to provide a plan on how it intended to optimize its infrastructure and workforce that described the criteria, process, and data the Service was using to make decisions, as well as the strategies, timing, and funding necessary.10 In December 2003, the chairmen, and ranking minority members, of the House Committee on Government Reform and the Special Panel on Postal Reform and Oversight also asked the Postal Service to submit a plan on how it intended to fund capital investments needed to ensure the long-term viability of the Postal Service, including how the Service intended to rationalize its infrastructure and workforce. In response, in January 2004, the Service submitted to the House Committee on Government Reform, a report entitled, Infrastructure and Workforce
Rationalization: Funding Key Capital Investments. This report, which
10U.S. Government Accountability Office, Postal Pension Funding Reform: Issues Related
to the Postal Service’s Proposed Use of Pension Savings, GAO-04-238 (Washington, D.C.: Nov. 26, 2003).
Page 53 GAO-05-261 U.S. Postal Service

was not made public by the Postal Service, described a “promising alternative” being considered that the Service called a consolidation hub concept. Under this concept there would be two basic types of facilities, origination and destination facilities, which would be the initial recipients of collection mail and the final plant before delivery, and consolidation hubs where the mail would be consolidated and distributed. According to the report, “the major difference between this concept and the current mail processing environment is that it envisions a single uniform network.”
Since issuance of this report, Postal Service officials told us that nothing is planned across the entire network but rather opportunities will be reviewed as they arise. In a speech before the 2004 National Postal Forum11 the Postmaster General called this strategy the Evolutionary Network Development (END) and explained it in the following manner:
“A couple of years ago there was a lot of fanfare and misunderstanding about a concept known as “NIA” - Network Integration and Alignment. Many saw it as the ultimate plan to consolidate and close facilities. Well, it’s not.
“Why? Because nobody can predict 5, 10, or 15 years from now what mail volume will be, or what type of mail processing equipment we will be using to sort the mail. So we have decided, instead, to do what we’ve done for decades. That is, take the next step in evolving our networks, and that’s our E-N-D game -- short for Evolutionary Network Development.
“It’s an END game that never ends, because rationalizing and optimizing security, plants, processing systems, transportation, and staffing is something we have to continue to do to keep our networks efficient and our systems affordable.”
Neither the Service’s report, the strategy outlined in meetings with Postal Service officials, or the Postmaster General’s speech sets criteria for making realignment decisions, nor do they include a process for making these decisions. In addition, no details about the Service’s vision of how its planned changes will remove excess capacity in the network, minimize productivity variances, maximize overall efficiency, or how much the Service will save in costs has been provided. The Service has procedures that it uses when making decisions to consolidate operations in its mail processing plants, which are outlined in appendix N of the Transformation Plan. These procedures include a feasibility study, preparation of proposal documentation, an approval process, and implementation steps. However, in discussions with Service officials, we were given vague and confusing
11PMG Jack Potter’s speech at the 2004 National Postal Forum.
Page 54 GAO-05-261 U.S. Postal Service
information on the Service’s procedures for closing plants. Consequently, it is not clear how these procedures relate to the Service’s realignment strategy, whether these procedures are used when closing plants, are applicable to all plants, or if these procedures are used consistently. In addition, the procedures outlined in appendix N lack specificity regarding
• who is responsible for initiating proposals,
• who conducts feasibility studies and how,
• what criteria are used to evaluate proposals,
• who is responsible for approving these proposals,
• how these proposals are implemented, and
• who is held accountable for these decisions.
It is also unclear how stakeholders are notified, when they are notified, and by whom.
In Attempting to Evaluate the Service’s Strategy We Developed Criteria
In evaluating the Postal Service’s strategy, we established criteria based on the Service’s stated goals for realignment, our previous work, the Committee on Government Reform report that accompanied House postal reform legislation (House Report), the Committee on Governmental Affairs report that accompanied Senate postal reform legislation (Senate Report), and the President’s Commission on the United States Postal Service (Commission) report.12 In its Transformation Plan the Service stated, “the mail processing network infrastructure will be redesigned to meet volume forecasts, customer requirements, and competitive pressures. Streamlining and simplifying the distribution network will permit consolidation of sorting facilities and elimination of excess resources.” In our previous work, we emphasized the importance of transparency and accountability
12House Report Part 1 - Postal Accountability and Enhancement Act 29-006, Report 108-672, 108th Congress (Washington, D.C.: September 8, 2004). Report of the Committee on
Governmental Affairs, United States Senate, Postal Accountability and Enhancement Act
Report 108-318, 108th Congress (Washington, D.C.: August 25, 2004). President’s Commission on the United States Postal Service, Embracing the Future: Making the Tough Choices to
Preserve Universal Mail Service (Washington, D.C.: July 31, 2003).
Page 55 GAO-05-261 U.S. Postal Service

for government institutions such as the Postal Service.13 Both the House and the Senate Reports also state the importance of transparency to the Service achieving its realignment goals. In previous testimony, we stated that in order to be successful in its realignment the Service will need the input and support of its major stakeholders, such as mailers, employees, communities, and government representatives.14 The Commission has stated that it is important for the Service to ensure that an appropriate process for soliciting and dealing with stakeholder concerns is implemented. The Service identified one of the benefits of realignment as reduced total costs for the Service and mailers. Accordingly, in evaluating the Service’s strategy for realigning its infrastructure, we used the following criteria:
1. Will the Service’s strategy result in a network that is efficient and flexible, and will it lead to the elimination of excess capacity?
2. Does the Service’s strategy include stakeholder input, and is it transparent and accountable under the following guiding principles;
• It is based on a clear, transparent, and consistently applied process.
• It ensures that when decisions are made they are conducted as fairly, effectively, and efficiently as possible.
• It provides for accountability in connection with decisions.
The Service’s Strategy May Not Reduce Excess Capacity and Is Not Transparent and Accountable
It is unclear how the Service’s strategy will result in elimination of excess capacity because it does not include criteria for making realignment decisions that include considering the effect on excess capacity, nor does it include performance measures related to eliminating excess capacity. In addition, the Service’s strategy excludes stakeholder input and is not sufficiently transparent or accountable. The strategy does not include criteria for making decisions or processes for implementing decisions,
13U.S. Government Accountability Office, U.S. Postal Service: Transformation Challenges
Present Significant Risks, GAO-01-598T (Washington, D.C.: April 4, 2001). U.S. Government Accountability Office, U.S. Postal Service: Bold Action Needed to Continue Progress on
Postal Transformation, GAO-04-108T (Washington, D.C.: November 5, 2003).
14GAO-04-108T.
Page 56 GAO-05-261 U.S. Postal Service

which would help ensure fairness and effectiveness, nor does it include performance measures for evaluating decisions.
The Service’s Strategy May Not Result in Elimination of Excess Capacity
In discussions with Service officials, we were told that the closing of the Marina Del Rey processing plant was a good example of the Service’s strategy. The Service will close the Marina Del Rey plant and move operations into its South Los Angeles plant. The Marina Del Rey plant had productivity in fiscal year 2004 of 1,598 pieces per hour, while the Los Angeles plant had productivity of 1,139 pieces per hour. According to Service officials, none of the 900 employees at the Marina Del Rey plant will lose their jobs. Instead they will be relocated. The Service has also stated that it has no immediate plans for the building once the operations are moved out of it. It is not clear how closing this plant will increase efficiency or reduce excess capacity. Criteria for making realignment decisions would help clarify the Service’s decisions.
As stated earlier, the Service has also been consolidating shifts across its infrastructure. These consolidations have contributed to the Service’s impressive reduction in workhours over the past 3 years. However, consolidating shifts may lead to excess capacity in other areas. For example, if mail is no longer processed on certain shifts this means that the processing equipment sits idle during that shift. In addition, if several plants in a particular area have eliminated processing shifts it may be feasible to consolidate these plants and dispose of excess physical infrastructure. Due to the Service’s lack of transparency about the results of its network modeling activities, however, it is difficult to assess the extent of opportunities for eliminating unnecessary plants. The Service’s strategy of taking advantage of opportunities as they arise may not result in consolidations or closings in the areas with the most excess capacity. Having realignment criteria that outlines at what point an area should begin closing plants may result in better alignment of resources with mail volumes.
In addition, the Service’s approach of taking advantage of opportunities as they arise may prolong inefficiencies and may not address the most pressing needs. For example, the Service has been deploying automation equipment throughout its network although some of the plants that are receiving equipment may ultimately be closed, which would necessitate moving or disposing of the equipment. Similarly, equipment and transportation costs will be higher than necessary if the network is not as streamlined and simplified as it could be. Furthermore, maintaining an infrastructure that is larger than necessary requires the Service to spend
Page 57 GAO-05-261 U.S. Postal Service

resources that it could employ elsewhere. In addition, the Service may be forgoing revenue from the sale of excess properties.
The Service’s Strategy Excludes Stakeholder Input and Is Not Sufficiently Transparent or Accountable
The Service strategy excludes stakeholder input and is not sufficiently transparent or accountable because it is not based on a clear, transparent and consistently applied process; it is not clear that when realignment decisions are made they are conducted as fairly, effectively, and efficiently as possible; and it does not have performance measures for results to provide accountability in connection with realignment decisions. To achieve its realignment goals of an efficient and flexible network, the Postal Service will have to have a strategy that is both transparent and accountable. According to the Committee on Governmental Affairs report that accompanied the Senate postal reform legislation in 2004, “it is vitally important that the Postal Service go about its facilities realignment in the most transparent manner possible. Transparency will [sic] make it possible for those affected by the Postal Service’s actions to see the connection between those actions and the need to preserve the vital services the Postal Service provides.”15
The Service’s lack of external communication excludes stakeholder input that could prove valuable in developing a least-cost network for the entire mailing industry. Some stakeholders have complained that the Service does not consult with them during planning, but only communicates when it has already made its decisions. Mailers explained that this approach often leads to uncertainty and lower investment in the mailing industry. For example, one representative of a large mailing company told us that uncertainty about what the Service is planning to do about new discounts, and new processing operations, stifles this mailer’s investment in its own infrastructure. Union representatives also expressed concerns about limited information related to the Service’s realignment plans and how these plans might affect postal employees.
The Service has stated that it is reluctant to publicly disclose information on its realignment strategy because it believes that it will meet with resistance from employees, communities, and government representatives if it tells them what it is planning on doing too far in advance. While employees and communities may resist changes that affect them, congressional staff members have told us that Members of Congress would be better prepared to respond to constituent concerns that arise when the
15Senate Report 108-318, p. 25.
Page 58 GAO-05-261 U.S. Postal Service

Service considers making changes to its infrastructure if the Service provided better information, such as the Service’s criteria for its decisions.
To better inform stakeholders on its infrastructure realignment decisions, the Service needs to make public its decisions and the criteria used to make these decisions. There are various avenues the Service could use to inform the public of changes and limit the burden of disclosure. For example, the Service could include a list of the changes that were made to the Service’s infrastructure during that year and changes that are planned for the coming year in one of its existing reports, such as the Service’s annual Comprehensive Statement.
Conclusion The Service faces future financial challenges due to its declining First-Class Mail volume and has excess capacity in its current infrastructure that impedes efficiency gains. The Service has stated that one way to increase efficiency is to realign its processing and distribution infrastructure. However, important questions remain about how the Service intends to realign its infrastructure to meet its future needs because the Service has not provided clear public information about its planned direction for realigning its infrastructure and workforce. The Service’s currently stated strategy is an evolutionary approach that prolongs inefficiencies related to excess capacity and productivity differences among plants, resulting in higher costs. The Service’s lack of communication often leads to confusion among stakeholders and communities about what the Service is doing and why and excludes input that could prove valuable to developing a least-cost network across the entire mailing industry. Because the Service does not have criteria to be considered, or a process to be followed, when making realignment decisions, it is not clear that these decisions will be made in a manner that is fair to all stakeholders or that is efficient and effective. It is also not clear that the Service’s strategy provides accountability for realignment decisions, because there is no process for evaluating results, no criteria for measuring results, and no stated policy for making managers accountable for decisions.
Recommendations for Executive Action
To enhance the Service’s transparency of its decisions related to realigning its infrastructure and ensure that these decisions advance the Service’s realignment goals, we recommend that the Postmaster General take the following three actions:
Page 59 GAO-05-261 U.S. Postal Service
• establish a set of criteria for evaluating realignment decisions;
• develop a mechanism for informing stakeholders as decisions are made; and
• develop a process for implementing these decisions that includes evaluating and measuring the results, as well as the actual costs and savings resulting from the decisions.
In taking these actions, the Service should reconcile any planned infrastructure realignment changes with the criteria used to make the decisions.
Agency Comments and Our Evaluation
The U.S. Postal Service provided comments on a draft of this report in a letter from the Chief Operating Officer and Executive Vice President dated March 18, 2005. These comments are summarized below and included as appendix IV. The Service concurred with our description of its mail processing and distribution infrastructure and the major business and demographic changes that have effected the Service’s operations. The Service did not comment on our conclusions or recommendations.
With respect to the Service’s statement that one of the key strategies of its Transformation Plan is an initiative called Evolutionary Network Development (END), this initiative was not discussed in the Service’s Transformation Plan. Instead, the Transformation Plan discussed an initiative referred to as Network Integration and Alignment (NIA), which called for analyzing and redesigning the existing network with the goal of creating a flexible logistics network and reducing overall costs for both the Service and the mailing industry as a whole. In addition, NIA was to determine which facilities would be necessary within the future infrastructure. In its January 2004 report to Congress on its infrastructure and workforce rationalization, the Service further discussed the status of NIA and said that it planned to pilot network alternatives in 2005 and if the results of the pilots were favorable, it could have a completely optimized network in place by the end of 2009. The NIA initiative appears to be more comprehensive and integrated in scope than the evolutionary approach referred to as END, which was described to us as a strategy that takes advantage of opportunities as they arise. As stated in the body of this report, the Service’s strategy remains unclear because the Service has outlined seemingly different approaches to realigning its processing and distribution infrastructure.
Page 60 GAO-05-261 U.S. Postal Service
Regarding the Service’s statement that Area Mail Processing (AMP) is one of the tools it uses to implement the goals of END, we remain concerned that these goals may not be realized because it is not clear whether AMP includes criteria for making realignment decisions, and if so, what these criteria are, and that therefore the processes associated with AMP are not responsive to the recommendations we made. Furthermore, the AMP guidelines do not include determining the disposal of facilities or the reduction of excess capacity. Consequently, it is not clear how AMP directly relates to reducing excess capacity, furthers the overall redesign of the mail processing and distribution infrastructure, or relates to the Service’s vision of its future infrastructure.
The Service also stated that the decisions it makes will be made with stakeholder input. However, it is not clear how stakeholder input will be incorporated into realignment decisions. As previously mentioned, congressional staff told us that Members of Congress would be better prepared to respond to constituent concerns if the Service were more transparent regarding its infrastructure decisions. Hence, we continue to believe that a formal mechanism for notifying stakeholders of realignment decisions, as we recommended, is vital.
The Service stated that because it cannot accurately predict future changes in the hard copy communications and package delivery industry, the changes it seeks to make must be incremental. However, the President’s Commission pointed out in its report that regardless of the economic climate, the nation is due the most cost-effective, efficient, high-quality Postal Service that can be provided. To this end the Commission recommended that the Service accelerate its efforts to redesign the postal network. Furthermore, the Service itself stated in its Transformation Plan that this is “the ideal time to initiate sweeping logistics changes.”16 We believe that without clarity, criteria, and accountability in its realignment strategy, the Service risks falling short of achieving the major productivity gains that will be needed to offset rising costs and maintain high-quality, universal postal service at affordable rates.
As agreed, unless you announce the contents of this report earlier, we plan no further distribution until 30 days after the issue date. At that time, we
16U.S. Postal Service Transformation Plan, p. 30.
Page 61 GAO-05-261 U.S. Postal Service

will send copies of this report to the Chairman and Ranking Minority Member of the House Committee on Government Reform; the Chairman and Ranking Minority Member of the Senate Committee on Homeland Security and Governmental Affairs, Senator Thomas R. Carper, the Postmaster General, and other interested parties. We will also provide copies to others on request. This report will also be available on our Web site at no charge at http://www.gao.gov.
If you have any questions regarding this report, please contact me at [email protected] or by telephone at (202) 512-2834. GAO contacts and acknowledgments are listed in appendix V.
Katherine SiggerudDirector, Physical Infrastructure Issues
Page 62 GAO-05-261 U.S. Postal Service
Appendix I
AppendixesObjectives, Scope, and Methodology Appendix I
To describe the impact of major changes on the Service’s mail processing and distribution infrastructure, we discussed with Postal Service officials, mailing associations, mailers, and union representatives their views on changes that have occurred in the mailing industry and the impacts these changes have had on the Postal Service. Through our initial discussions we narrowed the focus of our objective to three major changes, (1) changes in the marketplace, (2) the evolution of mail processing and its related infrastructure, and (3) shifts in demographics and transportation modes. To gain more insight into the first change, we analyzed mail volume trends over the past 30 years and reviewed literature related to these trends, including special reports prepared for the President’s Commission on the United States Postal Service, a special report prepared by Pitney Bowes for the 12th Conference on Postal Delivery and Economics, Postal Service presentations, and articles and studies prepared by mailers and mailing groups. In addition, we discussed the cause and effect of mail volume declines with Service officials. We also reviewed, analyzed, and discussed with Service officials, mailers, mailer associations, and union representatives, articles related to competition in the mailing industry and changes in the role of mailers. To further our understanding of the evolution of mail processing, we reviewed, analyzed, and discussed with Service officials, data related to the age, location, size, ownership, and equipment complement of the Service’s processing and distribution infrastructure. We also reviewed literature on the history of mail processing and changes that have occurred in mail processing operations over the past century. In addition, we conducted site visits to mail processing plants in the Capital Metro, the Eastern, the Southeastern, and the Pacific areas, and discussed mail processing changes with management at these plants. We also discussed related changes with eight area vice presidents and the Manager of Capital Metro Area Operations, as well as Service officials, mailers, mailer associations, and union representatives. To assess the impact of demographic shifts, we reviewed, analyzed, and mapped geo-spatial data from the Postal Service and Census Bureau. We also reviewed related articles and Service documents. To analyze the impact of these changes, we reviewed, analyzed, and discussed with Service officials, data related to productivity and cost variances, as well as excess capacity in the Service’s processing and distribution infrastructure.
To describe the actions the Service is taking to achieve a more efficient and flexible network in response to these changes, and the challenges associated with implementing these actions, we reviewed, analyzed, and discussed with Service officials the Service’s Transformation Plan and related updates. We also reviewed Postal Service documents related to
Page 63 GAO-05-261 U.S. Postal Service
Appendix I
Objectives, Scope, and Methodology
operations, including Annual Reports, Comprehensive Statements, Capital Investment Plans, Investment Highlights, Five-Year Strategic Plans, Corporate Automation Plans, Integrated Plan for Operations, and documentation related to specific programs. We conducted site visits to plants in the Capital Metro, the Eastern, the Southeastern, and the Pacific areas, and discussed initiatives and programs with management at these plants. We also discussed these initiatives and programs and the challenges associated with them with eight area vice presidents and the Manager of Capital Metro Area Operations, as well as Service officials, mailers, mailer associations, and union representatives.
To discuss the issues related to the Service’s strategy for realigning its infrastructure, we discussed with Service officials, including the Service’s Chief Operating Officer, how the Service intended to approach realignment. We also reviewed Postal Service documents, including the Transformation Plan, Infrastructure and Workforce Realignment: Funding Key Capital Investments, and documents related to realignment. In addition, we reviewed postal reform documents, including the Committee on Government Reform report that accompanied House postal reform legislation (House Report), the Committee on Governmental Affairs report that accompanied Senate postal reform legislation (Senate Report), and the President’s Commission on the United States Postal Service (Commission) report. In addition, we discussed the Service’s realignment efforts with mailers, mailing organizations, and union representatives.
We used productivity and cost data provided by the Postal Service to assess the impact of changes on the mailing industry. We did some testing of the data by performing basic logic tests, reviewing all related documentation, and discussing with agency officials any apparent inconsistencies or inaccuracies we found with the data. On the basis of those discussions, we adjusted the data to ensure that the inconsistencies or inaccuracies we found were corrected or clearly explained. Based on our testing, we determined that the required data elements are sufficiently reliable for the purposes of this engagement.
We received written comments on a draft of this report from the United States Postal Service. The comments we received are discussed near the end of the letter and the written comments are included in appendix IV. We conducted our review at Service headquarters and field locations between April 2004 and January 2005 in accordance with generally accepted government auditing standards.
Page 64 GAO-05-261 U.S. Postal Service
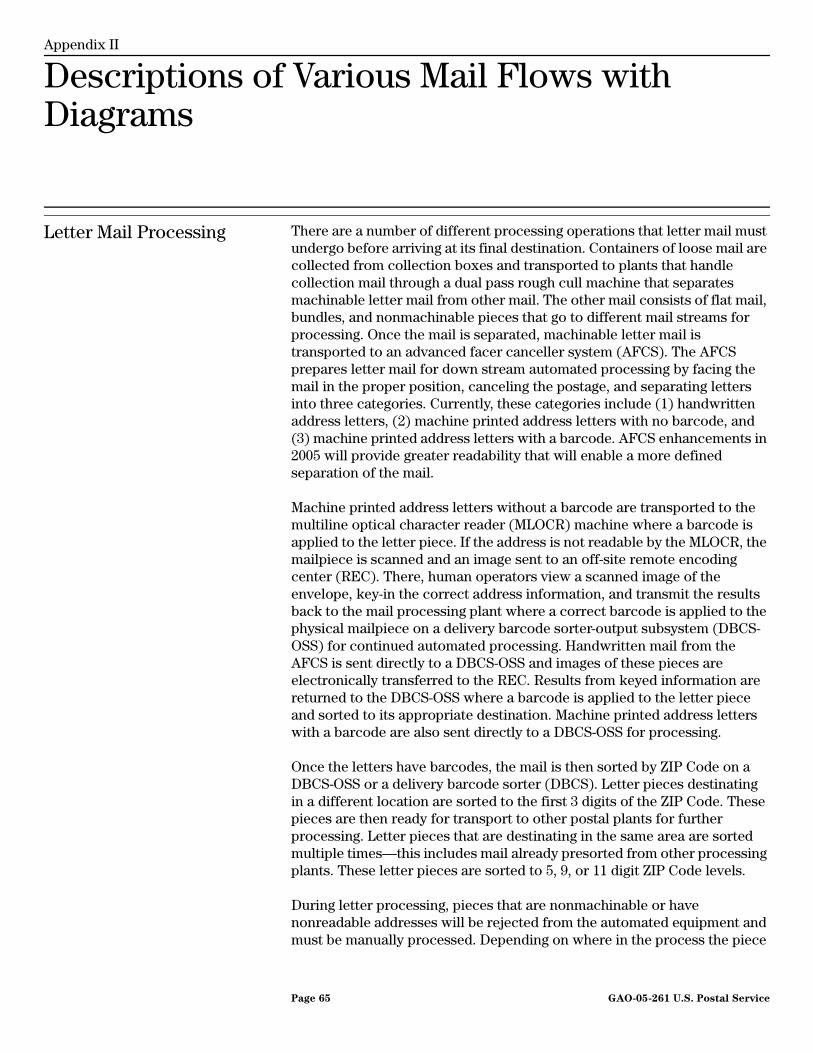
Appendix II
Descriptions of Various Mail Flows with Diagrams Appendix II
Letter Mail Processing There are a number of different processing operations that letter mail must undergo before arriving at its final destination. Containers of loose mail are collected from collection boxes and transported to plants that handle collection mail through a dual pass rough cull machine that separates machinable letter mail from other mail. The other mail consists of flat mail, bundles, and nonmachinable pieces that go to different mail streams for processing. Once the mail is separated, machinable letter mail is transported to an advanced facer canceller system (AFCS). The AFCS prepares letter mail for down stream automated processing by facing the mail in the proper position, canceling the postage, and separating letters into three categories. Currently, these categories include (1) handwritten address letters, (2) machine printed address letters with no barcode, and (3) machine printed address letters with a barcode. AFCS enhancements in 2005 will provide greater readability that will enable a more defined separation of the mail.
Machine printed address letters without a barcode are transported to the multiline optical character reader (MLOCR) machine where a barcode is applied to the letter piece. If the address is not readable by the MLOCR, the mailpiece is scanned and an image sent to an off-site remote encoding center (REC). There, human operators view a scanned image of the envelope, key-in the correct address information, and transmit the results back to the mail processing plant where a correct barcode is applied to the physical mailpiece on a delivery barcode sorter-output subsystem (DBCS-OSS) for continued automated processing. Handwritten mail from the AFCS is sent directly to a DBCS-OSS and images of these pieces are electronically transferred to the REC. Results from keyed information are returned to the DBCS-OSS where a barcode is applied to the letter piece and sorted to its appropriate destination. Machine printed address letters with a barcode are also sent directly to a DBCS-OSS for processing.
Once the letters have barcodes, the mail is then sorted by ZIP Code on a DBCS-OSS or a delivery barcode sorter (DBCS). Letter pieces destinating in a different location are sorted to the first 3 digits of the ZIP Code. These pieces are then ready for transport to other postal plants for further processing. Letter pieces that are destinating in the same area are sorted multiple times—this includes mail already presorted from other processing plants. These letter pieces are sorted to 5, 9, or 11 digit ZIP Code levels.
During letter processing, pieces that are nonmachinable or have nonreadable addresses will be rejected from the automated equipment and must be manually processed. Depending on where in the process the piece
Page 65 GAO-05-261 U.S. Postal Service

Appendix II
Descriptions of Various Mail Flows with
Diagrams
is rejected, employees will try to reintroduce the mail back into automation. If the mail cannot be reintroduced into the automation process, employees will sort the mail by hand to the 3, 5, 9, or 11 digit ZIP Code level.
Besides collection mail, the mailing industry also delivers discount mail or “bulk mail” to plants for processing. To claim the lower postage rates, the mailer must have a minimum quantity and do some additional work that makes it easier for the Postal Service to handle the mail. Based on how efficiently they can be processed, mailings are classified by the way they are prepared, including machinable, nonmachinable, and automation. A single mailing usually includes multiple levels of ZIP Code sortation. Discounted letter mail will be inducted into the mail stream at the appropriate level of distribution based on mail class, preparation, and sort level. Figure 18 shows how letter mail is processed.
Page 66 GAO-05-261 U.S. Postal Service
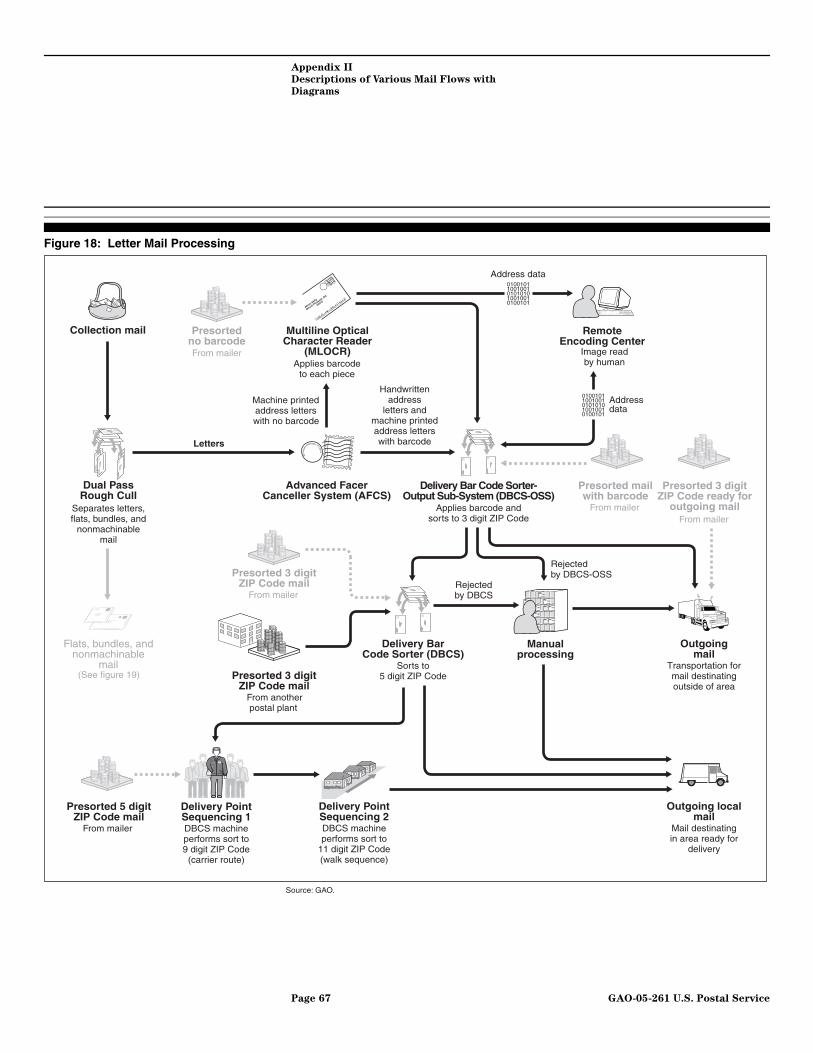
Appendix II
Descriptions of Various Mail Flows with
Diagrams
Figure 18: Letter Mail Processing
Rejectedby DBCS-OSS
Rejectedby DBCS
Machine printedaddress letters with no barcode
Letters
Address data
Addressdata
Handwrittenaddress
letters andmachine printedaddress letterswith barcode
Outgoing localmail
Mail destinatingin area ready for
delivery
Source: GAO.
Delivery PointSequencing 1DBCS machineperforms sort to9 digit ZIP Code
(carrier route)
Collection mail
Delivery Bar Code Sorter-Output Sub-System (DBCS-OSS)
Applies barcode andsorts to 3 digit ZIP Code
Delivery BarCode Sorter (DBCS)
Sorts to5 digit ZIP Code
Advanced FacerCanceller System (AFCS)
Mt.
Ple
asan
t,Washington, DC
20010
RemoteEncoding Center
Image readby human
Manualprocessing
(See figure 19)
Flats, bundles, andnonmachinable
Dual PassRough Cull
Separates letters,flats, bundles, and
nonmachinablemail
Outgoingmail
Transportation formail destinatingoutside of area
Presorted 3 digitZIP Code mail
From mailer
Presorted 3 digitZIP Code mail
From anotherpostal plant
Presortedno barcodeFrom mailer
Presorted 3 digitZIP Code ready for
outgoing mailFrom mailer
Presorted mailwith barcode
From mailer
Presorted 5 digitZIP Code mail
From mailer
Applies barcodeto each piece
Multiline OpticalCharacter Reader
(MLOCR)
01001011001001010101010010010100101
01001011001001010101010010010100101
Delivery PointSequencing 2DBCS machineperforms sort to
11 digit ZIP Code(walk sequence)
Page 67 GAO-05-261 U.S. Postal Service

Appendix II
Descriptions of Various Mail Flows with
Diagrams
Flat Mail Processing There are a number of different operations that flat mail undergoes before arriving at its final destination. Collection mail is loaded into a dual pass rough cull machine that separates flat mail from other mail. The other mail consists of letter mail, bundles, and nonmachinable pieces that go to different mail streams for processing. Once the mail is separated, employees will manually ensure that correct postage is applied and render the postage unusable—cancel—on each flat piece of mail.
Once canceled, the flat pieces are prepped to be placed on a machine for sorting. Currently, there are three different types of flat sorting machines: automated flat sorting machine (AFSM 100), upgraded flat sorting machine (UFSM 1000), and flat sorting machine (FSM 1000). Flat pieces destinating in a different location from where it originates are sorted on one of the three flat sorting machines to the first 3 digits of the ZIP Code. These pieces are then ready for transport to other postal plants for further processing. Flat pieces that are destinating in the same area will be sorted again to the 5 digit ZIP Code on one of the three flat sorting machines—this includes mail already presorted from other processing plants. The AFSM 100 and the UFSM 1000 are also used to sort flat mail to the carrier route level—9 digit ZIP Code. If the address is not readable by the AFSM 100 or the UFSM 1000, then the flat piece is scanned and an image is sent to an off-site remote encoding center (REC). There, human operators view a scanned image of the flat, key-in the correct address information, and transmit the results back to the mail processing plant where a correct barcode is applied to the flat.
Throughout flat processing, there will be mail that is rejected by the flat sorting machines or due to physical characteristics is unable to be processed on flat sorting equipment. Employees will try to reintroduce the flats that were rejected back into the machine for reprocessing. If the mail cannot be processed on the machines, employees will manually sort the mail by hand to 3, 5, or 9 digit ZIP Code levels.
Besides collection mail, the mailing industry also delivers discount mail or “bulk mail” to plants for processing. In order to claim the lower postage rates, the mailer must have a minimum quantity and do some additional work that makes it easier for the Postal Service to handle the mail. Based on how efficiently they can be processed, mailings are classified by the way they are prepared, including machinable, nonmachinable, and automation. A single mailing usually includes multiple levels of ZIP Code sortation. Discounted flat mail will be inducted into the mail stream at the
Page 68 GAO-05-261 U.S. Postal Service
Appendix II
Descriptions of Various Mail Flows with
Diagrams
appropriate level of distribution based on mail class, preparation, and sort level. Figure 19 shows how flat mail is processed.
Page 69 GAO-05-261 U.S. Postal Service
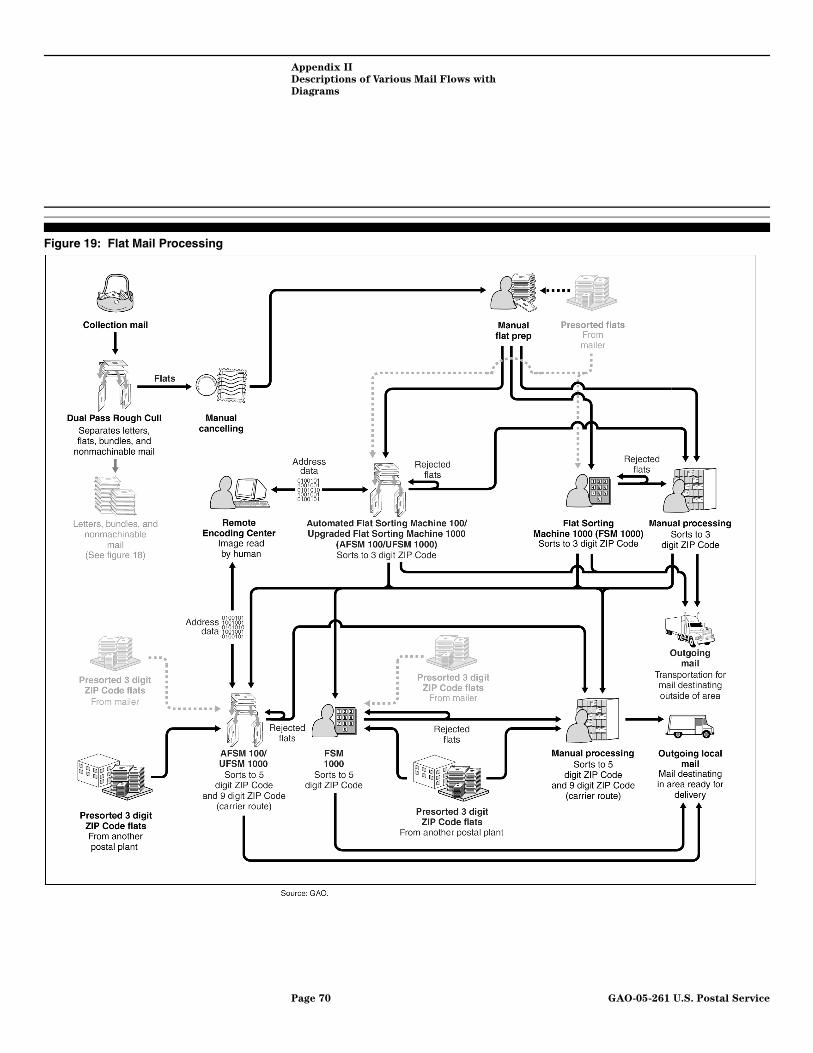
Appendix II
Descriptions of Various Mail Flows with
Diagrams
Figure 19: Flat Mail Processing
Page 70 GAO-05-261 U.S. Postal Service
Appendix II
Descriptions of Various Mail Flows with
Diagrams
Parcel Processing Parcels can be processed a number of different ways depending on the mail class and size. The equipment used and the type of sortation will depend on the origin and destination of the parcel. Automation and mechanization are only available at selected postal plants.
Parcels Any class of parcels can be sorted on a small parcel and bundle sorter (SPBS) machine. If a parcel is destinating in a different location, then a human operator at the SPBS machine manually keys in the first 3 digits of the ZIP Code, which directs the piece to the correct destinating bin. At dispatch time, the parcels are ready for transport to the destinating postal plant for further processing. If the parcel is destinating in the same area, then the human operator at the SPBS machine manually keys in the last 3 digits of the ZIP Code, which directs the piece to the correct destinating bin. At dispatch time, the parcels are ready for transport to a local office for manual sortation to the delivery address.
The Service is also in the process of deploying the next generation of parcel sorting equipment at postal plants called the Automated Package Processing System (APPS), which will replace the SPBS machine in some larger plants. The APPS machine will not require human operators to manually key ZIP Code information for each parcel. APPS automates package processing by providing high-speed throughput, automated package induction, singulation, and optical character reader (OCR)/barcode reader (BCR) address recognition. If the OCR/BCR technology is unsuccessful, an image of the parcel will be transmitted to an off-site remote encoding center (REC), where address information will be keyed in the same matter as letter mail. APPS deployment will continue through FY 2006.
Package Services Package Services and presorted Standard Mail parcels from mailers are processed on a primary and secondary parcel sorter machine (PSM). A human operator will look at each parcel to locate a barcode indicating the piece’s ZIP Code destination. If a parcel has a barcode, the piece will be sent on a conveyor belt through the package bar code scanner (PBCS), which will scan the barcode and directs the piece to the correct destinating location. If the parcel is destinating outside the area, then the mail will be sorted to the first 3 digits of the ZIP Code. If the parcel does not have a barcode, ZIP Code information is read by a human operator who will
Page 71 GAO-05-261 U.S. Postal Service
Appendix II
Descriptions of Various Mail Flows with
Diagrams
manually key in the destination ZIP Code location. The PBCS will then affix a barcode to the parcel and directs it to the correct destinating location.
All parcels that are barcoded and destinating in the area can be sent through a singulate scan induction unit (SSIU) for sorting. Parcels are sent one at a time through a weigh-in-motion scale and then through a scanning tunnel that will read the 5 digit ZIP Code and direct the piece to the correct destinating bin. At dispatch time, the parcels are ready to be transported to a local office for manual sortation to the delivery address.
Nonmachinable Parcels A nonmachinable outside (NMO) parcel cannot be sorted by postal equipment because its size or weight exceeds machine capacity or some other aspect requires the piece to be handled manually. Examples of NMOs include tubes, tires, golf clubs, and plants. If a parcel is destinating in a different location, then the piece will be sorted to the first 3 digits of the ZIP Code. The piece is then ready for transport to other postal plants for further processing. If the piece is destinating in the same area, then it will be sorted to the 3 or 5 digit ZIP Code and transported to a local office for manual sortation to the delivery address.
Throughout parcel processing, some pieces will be rejected — barcodes are unreadable, no barcode is applied, and packages break open. These parcels will be reintroduced into the PSM for processing. If the mail cannot be reintroduced into the PSM for processing, then employees will process the mail manually to the appropriate delivery address. Figure 20 shows how parcels are processed.
Page 72 GAO-05-261 U.S. Postal Service

Appendix II
Descriptions of Various Mail Flows with
Diagrams
Figure 20: Parcel Processing
NonmachinableParcels
Parcels
Presortedparcels
Manual processing
Small Parcel andBundle Sorter (SPBS)
Manual ZIPCode keying
Sorts to 3 digitor 5 digit ZIP Code
Sorts to first 3 digitsof ZIP Code orlast three digits
of ZIP Code
Rejected
Outgoing MailTransportation formail destinating
outside area
OutgoingLocal Mail
Mail destinatingin area readyfor delivery
Source: GAO.
PackageServices
Primary and SecondaryParcel Sorter Machine
(PSM)
PresortedStandard Mail
parcels
Presorted3 digit ZIP Code
parcels
Presorted 3 digitZIP Code parcels
Package Bar CodeScanner (PBCS)
Appliesbarcodesto parcels
PBCSScans barcode
and sorts
Rejected Rejected
Singulate ScanInduction Unit (SSIU)
Scans barcode andsorts to outgoing
destination ZIP Code
From anotherpostal plant From mailer
From anotherpostal plant
From mailer
Manual ZIPCode keying
Parcels withoutbarcodes
Parcelswith
barcodes
ManualProcessing
1 2 3
4 5 6
7 8
0
9
1 2 3
4 5 6
7 8
0
9
Rejectedbarcodeor nobarcode
Page 73 GAO-05-261 U.S. Postal Service

Appendix III
Glossary of Postal Terms Used in this Report Appendix III
Advanced Facer Canceller System (AFCS)
A machine that separates letter mail by address type—script, barcode, and machine imprinted—in support of the automation effort. AFCS has image lifting capability needed to support the Remote Bar Coding System.
Automated Flat Sorting Machine 100 (AFSM 100)
A fully automated flats sorting machine designed to streamline flats mail processing operations and at the same time significantly reduce manual processing. The AFSM 100 receives mail via automatic feeders, acquires images of script and typed mail for video encoding, and processes mail using optical character recognition technology.
Air Mail Center (AMC) A postal plant at an airport that receives, distributes, and dispatches mail transported by air.
Automated Package Processing System (APPS)
The Service’s next generation for sorting parcels and bundles of mail. The APPS will automate package processing by providing greater processing capacity through automatic package induction, singulation, and address recognition. It uses a carousel-type cross belt sorter subsystem that provides high-speed throughput.
Breakthrough Productivity Initiative (BPI)
A program that identifies best processing, retail, and delivery practices and uses this information to standardize operational processes.
Bulk Mail Mail that is rated for postage partly by weight and partly by the number of pieces in the mailing. The term is generally used to refer to Standard Mail (A).
Bulk Mail Center (BMC) A highly mechanized mail processing plant that distributes Standard Mail in piece and bulk form.
Business Mail Entry Unit (BMEU)
The area of a postal plant where mailers present bulk, presorted, and permit mail for acceptance. The BMEU includes dedicated platform space, office space, and a staging area on the workroom floor.
Page 74 GAO-05-261 U.S. Postal Service
Appendix III
Glossary of Postal Terms Used in this Report
Collection Mail Mail deposited into a collection box or lobby drop, as well as mail collected by letter carriers on their delivery rounds.
Computerized Forwarding System
A centralized, computerized address label-generating operation that performs address correction and forwards or returns undeliverable-as-addressed mail to customers.
Delivery The act of taking mail from the post office to the customer. The mail is taken to the customer’s business or residential delivery address or picked up at a post office – whether post office box, window, or dock.
Delivery Bar Code Sorter (DBCS)
This machine is used for processing letters that are already barcoded. DBCSs come in multiple configurations; most machines have between 190 and 220 sortation bins. The DBCS is used for outgoing processing, incoming primary sortation, and Delivery Point Sequencing (DPS).
Delivery Point Sequencing The process of arranging mail in delivery order for a particular carrier route.
Delivery Unit A post office, post office station, or post office branch that has mail delivery functions.
Destinating Mail Incoming mail arriving for its point of final delivery.
Destination Delivery Unit (DDU)
A customer service unit that processes mail for one or multiple ZIP codes within its own associate office. The DDU may contain a limited amount of automation equipment. The DDU generally provides mail delivery, bulk mail acceptance, and performs actions related to all products and services offered.
Page 75 GAO-05-261 U.S. Postal Service
Appendix III
Glossary of Postal Terms Used in this Report
Detached Mail Unit An area in a mailer’s plant where postal employees perform mail verification, acceptance, dispatch, and other postal functions.
Dropshipping Typically the movement of a mailer’s product on private (nonpostal) transportation from the point of production to a postal plant located closer to the destination of that product.
Dull Pass Rough Cull This machine separates machinable mail into different mail streams.
Express Mail A mail class that provides expedited delivery service for mailable matter subject to certain standards. It is available in five basic domestic service offerings (Same Day Airport Service, Custom Designed Service, Next Day Service, Second Day Service, and Military Service). Express Mail International Service is available between the United States and most foreign countries. Express Mail is a Service trademark.
First-Class Mail A class of mail that includes all matter wholly or partly in writing or typewriting, all actual and personal correspondence, all bills and statements of account, and all matter sealed or otherwise closed against inspection. First-Class Mail comprises three subclasses: postcards, letters and sealed parcels, and Priority Mail. Any mailable matter may be sent as First-Class Mail. First-Class Mail is a Postal Service trademark.
Flat A mailpiece that exceeds one of the dimensions for letter-size mail (11-1/2 inches long, 6-1/8 inches high, 1/4 inch thick) but that does not exceed the maximum dimension for the mail processing category (15 inches long, 12 inches high, 3/4 inch thick). Dimensions are different for automation rate flat-size mail eligibility. Flat-size mail may be unwrapped, sleeved, wrapped, or enveloped.
Flat Sorting Machine (FSM) A machine that mechanically sorts flats by ZIP Code.
Page 76 GAO-05-261 U.S. Postal Service

Appendix III
Glossary of Postal Terms Used in this Report
Hub and Spoke Program (HASP)
For surface mail, primarily for 2-day committed mail. HASP includes a central point (“hub”) where mail for a group of offices (“spokes”) can be unloaded from a series of incoming trips, massed according to their intended destination, and then sent on to that destination on another trip. Savings are realized because each trip does not have to drive to each individual office or spoke to drop off just a portion of its total load capacity.
Letter A mail processing category of mailpieces, including cards, that do not exceed any of the dimensions for letter-size mail (that is, 11-1/2 inches long, 6-1/8 inches high, 1/4 inch thick).
Letter Sorting Machine A large mechanized machine that can sort letters into as many as 277 bins. Operators physically read the address and then manually enter an extraction code, via keyboard, based on their memory of the sort scheme loaded into the machine’s computer software.
Low Cost Tray Sorter A tray sorter used for inbound tray sorting operations and outbound dispatch operations to reduce material handling workhours.
Mailer An entity that prepares and/or presents a mailing to the Postal Service. In some cases, a mailer is the agent for the actual owner of the mail.
Mailpiece A single addressed article of mail, usually a letter, flat, card, or parcel.
Multiline Optical Character Reader
An optical character reader that reads and interprets more than one line of the delivery address on a mailpiece.
Nonmachinable Outside A parcel or mailpiece that, because of size, weight, or other characteristic, cannot be sorted by mechanized mail processing equipment and must be handled manually. The parcel is called an outside because it cannot be placed in a sack or other mailing container.
Page 77 GAO-05-261 U.S. Postal Service
Appendix III
Glossary of Postal Terms Used in this Report
Optical Character Reader (OCR)
An automated mail sorting machine that interprets the address information on a letter-size mailpiece and sprays the corresponding ZIP Code information onto the piece as a barcode. The OCR consists of a mail feed unit, transport unit, stacker modules, computer with a control system, video monitor, and printer.
Originating Mail Outgoing mail and local mail that enter the mailstream—that is, the point of origin—for mail processing and delivery.
Outgoing Mail Mail sorted within a mail processing plant that is dispatched to another plant for additional processing or delivery.
Package Services A class of mail that comprises four subclasses: Bound Printed Matter, Library Mail, Parcel Post, and Media Mail. There is no minimum weight limit for Package Services.
Parcel Mail that does not meet the mail processing category of letter-size mail or flat-size mail. It is usually enclosed in a mailing container such as a carton.
Parcel Sorting Machine (PSM)
A large machine with an input station controlled by a computer that sorts and discharges parcels from transport trays to primary and secondary positions.
Periodicals A class of mail consisting of magazines, newspapers, or other publications formed of printed sheets that are issued at least 4 times a year at regular, specified intervals (frequency) from a known office of publication. Periodicals mailers must generally have a legitimate list of subscribers and requesters.
Postal Automated Redirection System
A system designed to intercept and process undeliverable-as-addressed mail using automated techniques.
Page 78 GAO-05-261 U.S. Postal Service
Appendix III
Glossary of Postal Terms Used in this Report
Presorted Mail A form of mail preparation, required to bypass certain postal operations, in which the mailer groups pieces in a mailing by ZIP Code or by carrier route or carrier walk sequence – or other Postal Service recommended separation.
Priority Mail First-Class Mail that weighs more than 13 ounces and, at the mailer’s option, any other mail matter weighing 13 ounces or less. Priority Mail provides expedited delivery. Any mailable matter may be sent as Priority Mail. Priority Mail is a Postal Service trademark.
Priority Mail Processing Center (PMPC)
The core function of a Priority Mail Processing Center is to provide an operational foundation capable of delivering consistent and reliable Priority Mail service.
Processing and Distribution Center (P&DC)
A central mail plant that processes and dispatches part or all of both incoming and outgoing mail for a designated service area. It also provides instructions on the preparation of collection mail, dispatch schedules, and sorting plan requirements to mailers. The plant is usually a sectional center plant or a general mail plant, but it can also be a dedicated mail processing plant without a station or branch.
Remote Encoding Center A Postal Service unit that uses advanced technology to assign barcodes to hand-addressed mailpieces physically located at a general mail plant. After the mailpiece image is displayed on a computer terminal, an operator, who is at the center, keys in the ZIP Code and the street address in order to match this information with that in a database. This allows for the imprinting of the barcode and automated mail processing at the general mail plant.
Sack A container generally used to transport flat-size mail, parcels, and loose pack mail. It is made of sewn fabric (usually nylon, polyester, canvas, or plastic with an opening at one end) and is closed with a draw cord and fastener.
Page 79 GAO-05-261 U.S. Postal Service
Appendix III
Glossary of Postal Terms Used in this Report
Sack Sorting Machine (SSM) A mechanized, operator-controlled machine similar to a parcel sorting machine but of heavier construction, that sorts sacks of mail.
Service Standards A stated goal for service achievement for each mail class.
Small Parcel and Bundle Sorter
A modular machine that sorts small parcels and packages or bundles of letters and flats to 100 specific bins for either delivery or processing.
Singulator Scan Induction Unit (SSIU)
Equipment that automates the entry of barcoded parcels onto the secondary parcel sorting machines at bulk mail centers. Packages first enter a singulator area where they are aligned in single file and spaced, and then sent through a dimensioning unit, which measures external dimensions and weight. Next, parcels pass through an omni scan tunnel where their barcodes are read. Finally, the parcel is inducted onto the parcel sorting machine.
Standard Mail A class of mail consisting of mailable matter that is not required to be mailed as First-Class Mail or is not mailed as Periodicals.
Tray A container used in postal plants to hold letters and First-Class Mail flats. It is used as a basic unit of mail quantity for purposes of preparing mail to qualify for discounted postage rates.
Tray Management System (TMS)
TMS uses tray identification, transport, storage, and process control technologies to automate the movement and staging of trayed letter and flat mail between most mail sortation operations.
Walk Sequence The order in which a carrier delivers mail for a route. This order is required for most carrier route presort mail.
Page 80 GAO-05-261 U.S. Postal Service

Appendix III
Glossary of Postal Terms Used in this Report
Undeliverable-As-Addressed (UAA)
Mail that the Postal Service cannot deliver as addressed and must forward to the addressee, return to the sender, or send to a mail recovery center.
Universal Transport System A system that has the ability to process letter trays, flat tubs, sacks, parcels, and bundles.
Page 81 GAO-05-261 U.S. Postal Service
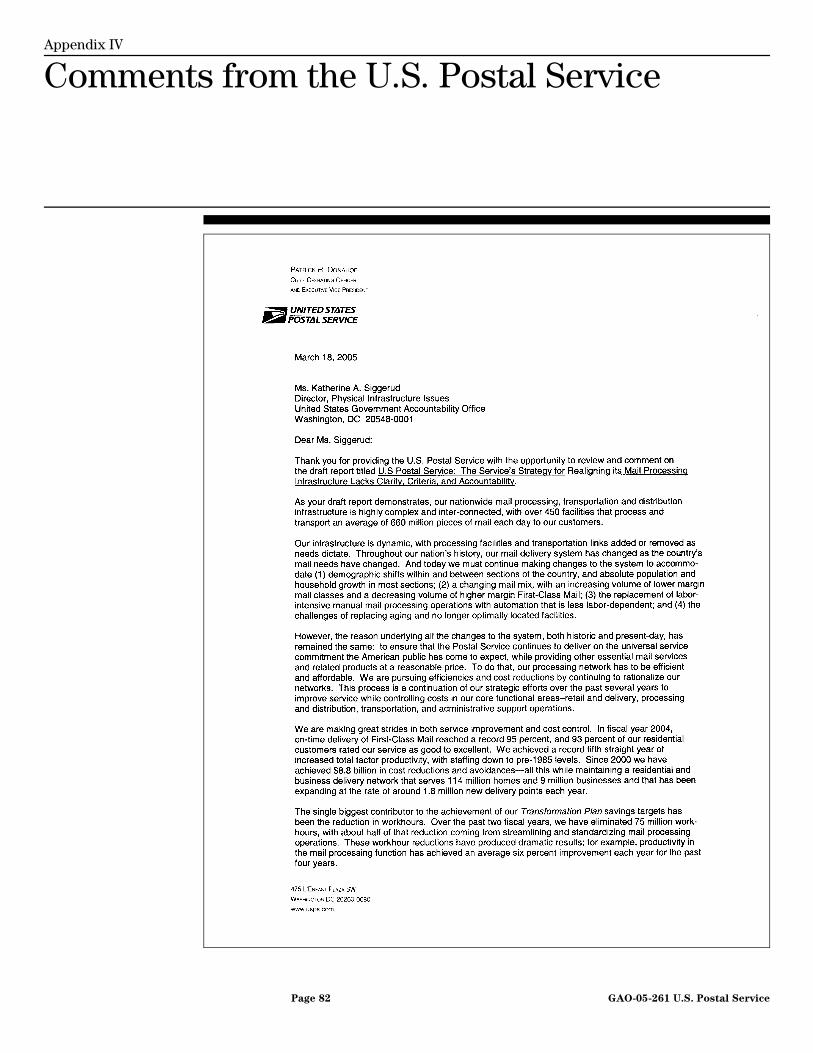
Appendix IV
Comments from the U.S. Postal Service Appendix IV
Page 82 GAO-05-261 U.S. Postal Service

Appendix IV
Comments from the U.S. Postal Service
Page 83 GAO-05-261 U.S. Postal Service
Appendix V
GAO Contact and Staff Acknowledgments Appendix V
GAO Contact Katherine Siggerud (202) 512-6570
Staff Acknowledgments
In addition to the person named above, Teresa Anderson, Tida Barakat, Margaret Cigno, Collin Fallon, Kerry Lipsitz, Kathy Gilhooly, Brandon Haller, and Jason Kelly made key contributions to this report.
Page 84 GAO-05-261 U.S. Postal Service
(543077)
The Government Accountability Office, the audit, evaluation and investigative arm of Congress, exists to support Congress in meeting its constitutional responsibilities and to help improve the performance and accountability of the federal government for the American people. GAO examines the use of public funds; evaluates federal programs and policies; and provides analyses, recommendations, and other assistance to help Congress make informed oversight, policy, and funding decisions. GAO’s commitment to good government is reflected in its core values of accountability, integrity, and reliability.
The fastest and easiest way to obtain copies of GAO documents at no cost is through GAO’s Web site (www.gao.gov). Each weekday, GAO posts newly released reports, testimony, and correspondence on its Web site. To have GAO e-mail you a list of newly posted products every afternoon, go to www.gao.gov and select “Subscribe to Updates.”
The first copy of each printed report is free. Additional copies are $2 each. A check or money order should be made out to the Superintendent of Documents. GAO also accepts VISA and Mastercard. Orders for 100 or more copies mailed to a single address are discounted 25 percent. Orders should be sent to:
U.S. Government Accountability Office 441 G Street NW, Room LM Washington, D.C. 20548
To order by Phone: Voice: (202) 512-6000 TDD: (202) 512-2537 Fax: (202) 512-6061
Contact:
Web site: www.gao.gov/fraudnet/fraudnet.htm E-mail: [email protected] Automated answering system: (800) 424-5454 or (202) 512-7470
Gloria Jarmon, Managing Director, [email protected] (202) 512-4400 U.S. Government Accountability Office, 441 G Street NW, Room 7125 Washington, D.C. 20548
Paul Anderson, Managing Director, [email protected] (202) 512-4800 U.S. Government Accountability Office, 441 G Street NW, Room 7149 Washington, D.C. 20548
GAO’s Mission
Obtaining Copies of GAO Reports and Testimony
Order by Mail or Phone
To Report Fraud, Waste, and Abuse in Federal Programs
Congressional Relations
Public Affairs
PRINTED ON RECYCLED PAPER