Embed Size (px)
Citation preview
Gamelike features might not improve data
Guy E. Hawkins & Babette Rae & Keith V. Nesbitt & Scott D. Brown
Published online: 9 October 2012# Psychonomic Society, Inc. 2012
Abstract Many psychological experiments require partici-pants to complete lots of trials in a monotonous task, whichoften induces boredom. An increasingly popular approach toalleviate such boredom is to incorporate gamelike features intostandard experimental tasks. Games are assumed to be interest-ing and, hence, motivating, and better motivated participantsmight produce better data (with fewer lapses in attention andgreater accuracy). Despite its apparent prevalence, the assump-tion that gamelike features improve data is almost completelyuntested. We test this assumption by presenting a choice taskand a change detection task in both gamelike and standardforms. Response latency, accuracy, and overall task perfor-mance were unchanged by gamelike features in both experi-ments. We present a novel cognitive model for the choice task,based on particle filtering, to decorrelate the dependent varia-bles andmeasure performance in amore psychologicallymean-ingful manner. The model-based analyses are consistent withthe hypothesis that gamelike features did not alter cognition. Apostexperimental questionnaire indicated that the gamelike ver-sion provided a more positive and enjoyable experience forparticipants than the standard task, even though this subjectiveexperience did not translate into data effects. Although ourresults hold only for the two experiments examined, thegamelike features we incorporated into both tasks were typicalof—and at least as salient and interesting as those usually usedby—experimental psychologists. Our results suggest thatmodifying an experiment to include gamelike features, whileleaving the basic task unchanged, may not improve the quality
of the data collected, but it may provide participants with abetter experimental experience.
Keywords Computer game . Gamelike features . Responsetime . Multialternative choice . Change detection .
Speed-accuracy trade-off . Particle filter
Introduction
The potential for computer games in various streams of psy-chological research is substantial. In applied contexts, com-puter games and simulations have been used to promotelearning in such varied areas as the military, business, healthcare, and aviation (for reviews, see Salas & Cannon-Bowers,2001; Wilson et al., 2009). Computer games have also beenincreasingly utilized to explore human performance in thelaboratory. In particular, games and tasks incorporating thevisual, auditory, and/or game play aspects of computer games(i.e., gamelike features) present ways of complementing stan-dard methodological approaches in experimental psychology.
Psychology experiments often require participants tocomplete many trials in a monotonous task. Such boredommight reduce the engagement of participants, leading topoorer task performance and, perhaps, also more variabledata (assuming that the effects of boredom are different fordifferent participants or at different times throughout theexperiment). Since many people find computer games en-gaging and motivating (Wood, Griffiths, Chappell, & Davies,2004), it might be possible to improve participants’ engage-ment in an experiment by incorporating some gamelikefeatures. Recent decades have seen this approach taken inmany areas of psychology, and using many different gamelikefeatures. In some cases, the gamelike features are essentialelements of the central task of the participant. For example,testing children requires special consideration, and experi-mental tasks must be specially designed to suit younger
G. E. Hawkins (*) : B. Rae : S. D. BrownSchool of Psychology, University of Newcastle,Callaghan NSW 2308, Australiae-mail: [email protected]
K. V. NesbittSchool of Design, Communication & Information Technology,University of Newcastle,Callaghan NSW 2308, Australia
Behav Res (2013) 45:301–318DOI 10.3758/s13428-012-0264-3

minds, most often by having them play games. There aremany quite sophisticated examples of gamelike experimentsfor children, including “Dragon Master” (Metcalfe, Kornell,& Finn, 2009), “Frog Game” (Dunbar, Hill, & Lewis, 2001),and spaceships (Spencer & Hund, 2002, 2003; for moreexamples, see Berger, Jones, Rothbart, & Posner, 2000;Droit-Volet, Tourret, & Wearden, 2004; Kujala, Richardson,& Lyytinen, 2010; Ploog, Banerjee, & Brooks, 2009;Stevenson, Sundqvist, &Mahmut, 2007; Yildirim, Narayanan,& Potamianos, 2011). Other researchers working with childrenhave simply presented an unaltered experimental task to thechild as if it were a game. For example, “We are going to play agame now. Would you like to play a game?” (see, e.g.,Andrews & Halford, 2002; Carneiro, Fernandez, & Dias,2009; Hanauer & Brooks, 2003; Price & Connolly, 2006;Raijmakers, Dolan, & Molenaar, 2001; Thibaut, French, &Vezneva, 2010; Toppino, Fearnow-Kenney, Kiepert, &Teremula, 2009; Yuzawa, 2001).
Another situation in which the game is fundamental iswhen existing video games (such as Tetris and Madden) areused to explore cognition (Hansberger, Schunn, & Holt,2006; Kirsh & Maglio, 1994; Maglio, Wenger, & Copeland,2008). Some researchers extend this approach by using thedevelopment engines of various games to create gamelikeenvironments for the exploration of spatial cognition andsocial behavior (Alloway, Corley, & Ramscar, 2006; Druryet al., 2009; Frey, Hartig, Ketzel, Zinkernagel, &Moosbrugger,2007; Gunzelmann & Anderson, 2006; Hutcheson & Wedell,2009; Radvansky & Copeland, 2006). This type of experimentis less common in cognitive psychology than other gamelikeexperiments. A much more popular way of using gamelikefeatures in cognitive psychology experiments is to modify anexperiment’s appearance without changing the fundamentalproperties of the stimuli or the experimental design and proce-dure. Colors, animations, and sound effects may be added tothe standard display. Gamelike features can also be introducedthrough the creation of a back story and a performance-basedpoint system.
We refer to the introduction of cosmetic modifications,which do not change the fundamental stimuli, design, orprocedure, as “gaming up” an experiment. One assumptionmade when gaming up an experiment is that the gamelikeadditions improve the participants’ experience. This as-sumption is uncontroversial, because gamelike features arealmost certainly more interesting and fun than the plainfeatures of standard experiments. A less certain, and oftenimplicit, assumption about participants’ underlying cognitionsis that the improved experience of participants will manifest asgreater engagement with the task and better motivation. Inturn, it is assumed that this greater engagement and motivationwill manifest in the data as improved performance or, perhaps,reduced between-subject variability that may arise due to var-iable boredom or motivation between subjects. While this
assumption appears to be endorsed (at least implicitly) amongexperimental psychologists, conventional wisdom in computergame design suggests the opposite. One maxim of computergame design is that the fundamental repeated task determinesenjoyment level, not the superficial gamelike features (e.g.,Schonfeld, 2010); if the underlying task is not interesting andengaging, as in the majority of psychological experiments,then no amount of gamelike features can improve perfor-mance. We investigate these two competing notions by exam-ining whether gamelike features increase the engagement andmotivation of participants and, therefore, improve performanceon experimental psychology tasks.
Gaming-up experiments
Gamed-up experiments have become popular in almost allareas of experimental psychology. We briefly review someexamples in order to give an idea of how prevalent thispractice is and also to illustrate the typical kinds of gamelikefeatures that are introduced. A particularly common appli-cation of gamelike features has been in learning experi-ments. For instance, participants learn to navigate througha three-dimensional space while interacting with “charac-ters” later used for identification tests (Wade & Holt, 2005).Arcediano, Ortega, and Matute (1996) developed the“Martians” game to explore classical conditioning usingMartians and explosions as stimuli (see also Baeyens et al.,2005; Blanco, Matute, & Vadillo, 2010; Franssen, Clarysse,Beckers, van Vooren, & Baeyens, 2010). Gamelike tasks havebeen used to study instrumental learning with stimuli pre-sented as balloons that must be shot from the sky (Krageloh,Zapanta, Shepherd, & Landon, 2010), minefields to be navi-gated (Baker, Mercier, Vallee-Tourangeau, Frank, & Pan,1993), or a host of similar examples (Lie, Harper, & Hunt,2009; Molet, Jozefowiez, & Miller, 2010; Paredes-Olay,Abad, Gamez, & Rosas, 2002; Stokes & Balsam, 2001;Stokes & Harrison, 2002). Discrimination and generalizationlearning have been presented as melodies that participantsmust classify as belonging to different composers (Artigas,Chamizio, & Peris, 2001) or as torpedoes to be launched atcertain flying objects but not others (Nelson & Sanjuan, 2008;Nelson, Sanjuan, Vadillo-Ruiz, & Perez, 2011). The gameapproach has also been extended to spatial learning, such asremembering the location of a previously displayed spaceship(Spencer &Hund, 2002), and the popular approach of creatinga three-dimensional town where participants play the role of ataxi driver and must learn landmark, spatial, and temporalrelations that are later tested for recall (Newman et al., 2007),sometimes with neurophysiological recordings (Ekstrom &Bookheimer, 2007; Weidemann, Mollison, & Kahana, 2009).
Causal reasoning and categorization experiments have alsobeen gamed up. For instance, explicit categorization tasks canbe presented as “diagnoses” (Castro & Wasserman, 2007;
302 Behav Res (2013) 45:301–318
Wasserman & Castro, 2005), and implicit categorization taskscan be presented as the detection of “secret code words”embedded in artificial grammars (Sallas, Mathews, Lane, &Sun, 2007). Causal reasoning has been presented as a scientistuncovering the workings of a “black box” with light rays andatoms (Johnson & Krems, 2001), or using electrical circuits(Johnson & Mayer, 2010), or many other back stories (Dixon& Banghert, 2004; Dixon &Dohn, 2003; Ozubko & Joordens,2008; Stephen, Boncoddo, Magnuson, & Dixon, 2009). Thedetection and prediction of change has been investigated in a“tomato processing factory” (Brown & Steyvers, 2009).Experiments investigating meta-cognition and executive func-tion have been variously presented to participants as drivingsimulations or spaceship wars (Finke, Lenhardt, & Ritter,2009; Lien, Ruthruff, Remington, & Johnston, 2005; Mather,Gorlick, & Lighthall, 2009). Minimally gamed-up experimentsin the same vein have used performance based points systems(e.g., Buchner, Mehl, Rothermund, & Wentura, 2006; van derLinden & Eling, 2006), and simple gamelike reward structureshave been utilized in studies of comparative psychology (e.g.,Artigas et al., 2001; Washburn & Gulledge, 1995). Socialpsychologists also have gamed up their experiments—for ex-ample, to study ostracism (Williams & Jarvis, 2006), conflictand cooperation strategies (Aidman & Shmelyov, 2002), atti-tude generalization (Fazio, Eiser, & Shook, 2004), and evenalcohol consumption during drinking games (such as “beerpong”; Correia & Cameron, 2010).
The longest running approach to using games in psycho-logical experimentation has been the application of arcade stylegames to assess skill acquisition, usually by having the partic-ipant pilot a spaceship (McPherson & Burns, 2007, 2008),shoot alien spaceships (Williams, Nesbitt, Eidels, & Elliott,2011), or control space weapons (Jackson, Vernon, & Jackson,1993; Salthouse & Prill, 1983; Talvitie & Singh, 2009). Thelongest running game specifically designed for experimentalpsychology research has been “Space Fortress” (Mane& Donchin, 1989). Space Fortress includes many gamelikequalities, including sound effects, visual explosions, and aperformance-contingent points system. Many studies haveutilized Space Fortress—for example, to study IQ (Rabbitt,Banerji, & Szymanski, 1989), skill acquisition (Arthur et al.,1995; Logie, Baddeley, Mane, Donchin, & Sheptak, 1989),and different training schedules and methods (Day, Arthur, &Shebilske, 1997; Fabiani, Buckley, Gratton, Coles, & Donchin,1989; Mane, Adams, & Donchin, 1989; Shebilske, Goettl,Corrington, & Day, 1999).
Does it help?
Although it is not usually stated explicitly, one goal ofincluding gamelike features in an otherwise standard exper-iment is to improve data quality by increasing participantmotivation. We could find very little research testing this
assumption, and the one study we did find provided equiv-ocal results: Washburn (2003) demonstrated that providing aback story to an otherwise standard task resulted in pooreraccuracy but faster response times.
Experiment 1
We aimed to directly test the assumption that gamelikefeatures can improve data quality by randomly assigningparticipants to either a gamelike or a standard version of asimple cognitive experiment. Our task required participantsto make judgments about a number of choice alternatives(displayed as squares) that dynamically collected dots overthe course of a trial. On each trial, one square would accu-mulate dots slightly faster than the remaining squares, andthe participants’ goal was to select this target square asquickly and accurately as possible (a demonstration versionof the standard task can be viewed online at http://psych.newcastle.edu.au/~sdb231/buckets/vanillaR.html). To ensurethat our gamelike condition had the best chance of improvingdata quality relative to the standard condition, we included allof the gamelike elements that have been standardly incorpo-rated in the experiments reviewed above: a detailed back story,animations related to stimulus presentation and also responsefeedback, audio feedback on responses, and a points-basedscoring system.
Method
Participants
Two hundred first-year psychology students from the Uni-versity of Newcastle participated online for course credit.Participants were randomly allocated to the gamelike ornongame version of the experiment. The gamelike andnongame versions of the task were statistically identical,with the only difference being the “gamed-up” appearanceof the gamelike task.
Properties common to gamelike and nongame versionsof the task
In both tasks, decision latency and accuracy were measuredas functions of the number of choice alternatives present in adisplay, which we denote with K. Each decision trial beganwith K empty squares randomly placed into 20 locations ona 4 × 5 grid, with each square measuring 100 pixels × 100pixels (plus a 2-pixel border). A difficulty factor was intro-duced to the design where participants were randomly allo-cated to one of three levels defined by the number of squaresdisplayed on any trial: an easy condition, where the number
Behav Res (2013) 45:301–318 303
of squares displayed on any trial was randomly chosen fromK ∈ {2, 4, 6, 8, 10}; a medium condition, where the numberof squares displayed on any trial was randomly chosen fromK ∈ {2, 4, 6, 8, 10, 12, 14, 16, 18}; and a hard condition,where the number of squares displayed on any trial wasrandomly chosen from K ∈{10, 12, 14, 16, 18}. The diffi-culty factor was designed to examine behavior across agreater range of experimental conditions and, hence, givethe gamelike features the best chance of improving data,without interfering with the critical gamelike versus non-game comparison. The three difficulty levels were crossedwith the game version factor to create a 2 (game version:gamelike vs. nongame) × 3 (difficulty level: easy vs. medi-um vs. hard) between-subjects factorial design.
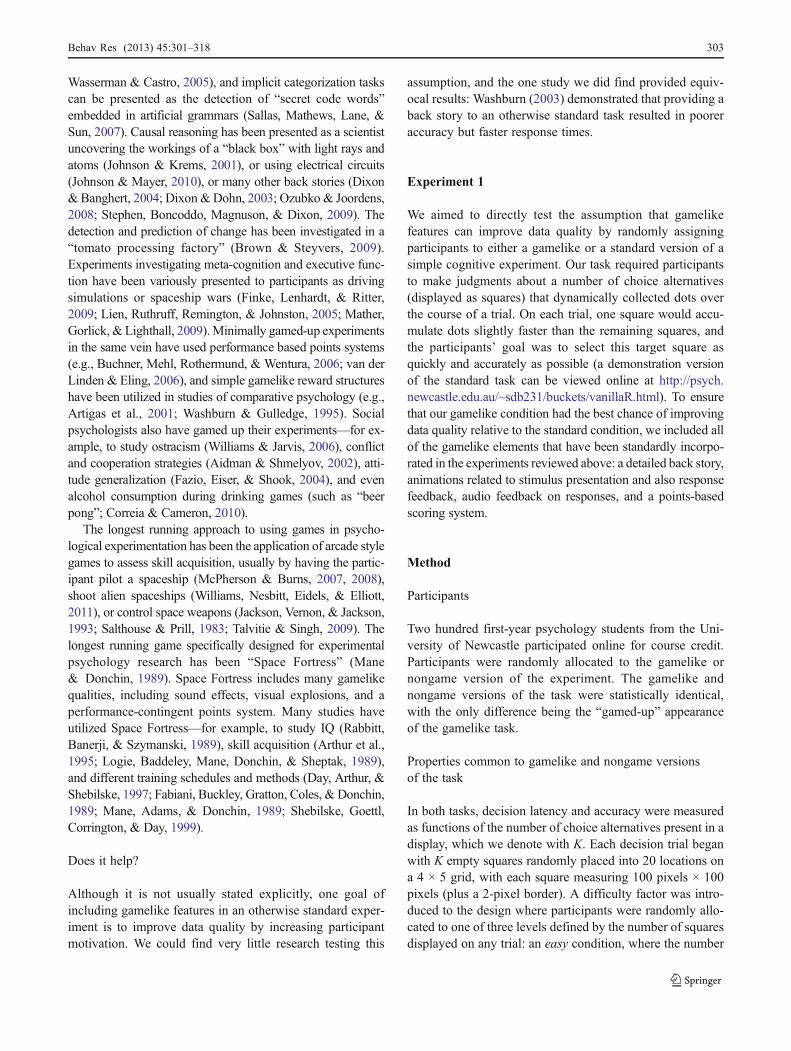
Over the course of a trial, each square dynamically accu-mulated small “dots.” One square (chosen at random oneach trial) accumulated dots slightly more rapidly than allthe others, and it was the participant’s task to identify thistarget square from distractor squares. During each trial,time proceeded in discrete steps of 15 events per second.On each step, each square either accumulated a new dot ornot. The chance of each square accumulating a new dot wasindependent of all the other squares at .4, except the targetsquare, which had a higher probability than all the others, at.5. This means that, on average, the target square accumu-lated 7.5 dots per second, while distractor squares eachcollected an average of 6 dots every second. The left panelof Fig. 1 shows an example of a trial with six choicealternatives in the nongame condition.
Squares began with a completely white background(unfilled), and each time a new dot was accumulated, a 2 ×2 pixel area within the square changed to a dark blue color.The position of the new dot was chosen randomly from the
remaining unfilled area of the square. Participants were freeto sample information from the environment until they feltconfident with their decision. Nongame participants weresimply informed that they should aim to identify the targetas quickly and accurately as possible, but if they respondedtoo early, they might incorrectly select a distractor squarethat had by chance accumulated the most dots thus far inthe trial.
After the participant chose a target square, a very fastanimation illustrated many more time steps very quickly.This provided feedback on whether the participant’s choicewas the true target (which always ended up accumulatingmore dots than did the other squares) or not. When the targetsquare was correctly identified, its border was turned green.If an incorrect selection was made, the incorrect square’sborder was turned red, and the true target square’s borderwas turned green.
Properties specific to the gamelike version of the task
The gamelike task operated on the same principles as thenongame task, except with a more interesting “gamed-up”facade. We tried to make the gamelike features of this task atleast as salient and interesting as those included in theexperiments reviewed above, to maximize any game-driven effects in the data. The gamelike features did notinfluence the physical properties of the stimulus display,with stimuli appearing on screen in the same color, size,shape, and location as in the nongame task.
The nongame task began with a single, plain text instruc-tion screen. In contrast, although the gamelike task instruc-tions conveyed the same message as the nongame ones, thisinformation was displayed through a detailed series of screens
(a) (b)Fig. 1 Illustrative example of the display in Experiment 1 during a typical trial for the nongame task (a) and the gamelike task (b)
304 Behav Res (2013) 45:301–318
to create a gamelike environment (a demonstration version ofthe gamelike task can be viewed online at http://psych.newcastle.edu.au/~sdb231/buckets/emf.html).
At the beginning of the gamelike task, participants wereintroduced to “EMFants: Last Light,” a simple game set in aspace environment. Participants were provided with a backstory describing the EMFants species, which eat all forms ofelectromagnetic radiation (ElectroMagnetic Feeding ants—i.e., EMFants), that have escaped from a twin universe.EMFants have been detected in numerous galaxies and mustbe stopped before they rapidly spread to all known galaxies.
Participants viewed a mission brief instructing them thatthey were commander of “Dark-Stealth-6,” a spaceship witha “shadow-scope” to detect alien EMFants, “blue-ray” ar-mament to destroy EMFant colonies, and “time-hop” pro-pulsion. Various aspects of standard experimental tasks wereaugmented to be more akin to a game. For example, whenbeginning a new block of trials, participants were requiredto manually engage Dark-Stealth-6’s time-hop capabilitiesto navigate from one galaxy to another, initiating a shortanimation and sound effect. Observing the standard evi-dence accumulation of the nongame task was also mademore interesting in the gamelike task. Participants were toldthat they used their shadow-scope to detect EMFant colo-nies (i.e., squares, the choice alternatives). The EMFantcolony growing at the fastest rate indicated the home ofthe EMFant queen (the target square; see Fig. 1 for compar-ison of the nongame and gamelike displays during a trial).By clicking a target, participants fired their blue-ray, de-scribed as an intense pulse of long-wavelength radiation, todestroy the EMFant colony. When a square was selected, theentire display quickly flashed blue as the blue-ray fired,followed by an outline of green (for a correct answer) orred (for an incorrect answer) on the selected EMFant colony.A correct answer was accompanied by the sound of a cheer-ing crowd. An incorrect answer produced a disappointed“urrrgghh” sound. Importantly, the statistical properties andthe physical appearance of the stimuli were identical in thegamelike and nongame conditions.
The goal of the game was identified as locating anddestroying EMFants. Participants were informed that speedwas essential to prevent EMFants spreading to other galaxies.Participants were also instructed that accuracy was essential,since they had only one chance in each mission to fire theblue-ray, and if they did not destroy the colony of the queen,the EMFants would multiply and invade other galaxies.
Trials in the gamelike task took longer than nongametrials due to untimed events such as charging the blue-ray,postshot animations, sound effects, and so on. Accordingly,to match total experiment time, participants in the gamelikeconditions completed fewer trials: 140 (game) versus 180(nongame) in the easy condition; 126 versus 162 in themedium condition; and 100 versus 140 in the hard
condition. Each K appeared equally often in each block forall conditions.
Results
Due to the different number of total trials across the sixconditions, each K was completed a different number of timesby each group. To balance trials per K between conditions,only the first 14 trials per K for each participant were ana-lyzed.1 Data from participants with fewer than 33 % correctresponses or whose computers displayed fewer than an aver-age of 13 time steps per second were excluded, leaving datafrom 80 gamelike and 86 nongame participants for analysis.The proportion of participants excluded from analysis due tolow accuracy rates did not differ between gamelike and non-game conditions, c2ð1Þ ¼ 0:08, p 0 .77. Remaining data were
screened for outlying trials with responses faster than 1 s orslower than 150 s or individual trials where the host computerdisplayed fewer than 13 time steps per second, which wereremoved from analysis, resulting in the exclusion of data from369 trials (2.46 % of total trials).
The upper panel of Fig. 2 shows mean response time forthe nongame and gamelike conditions represented as a func-tion of difficulty level. As was expected, a 2 (game version:gamelike vs. nongame) × 3 (difficulty level: easy vs. medi-um vs. hard) between-subjects analysis of variance indicateda highly significant main effect of difficulty level on re-sponse latency, F(2, 160) 0 17.04, p < .001, where thefastest responses were provided by the easy groups, fol-lowed by the medium and then hard conditions. Of keyinterest, however, there was no main effect of game versionor interaction between difficulty level and game version onresponse time, p 0 .98 and p 0 .28, respectively.
The lower panel of Fig. 2 displays mean accuracy fornongame and gamelike conditions as a function of difficultylevel. Unlike the response time data, there was no significantmain effect of difficulty level on accuracy, p 0 .16, and neitherthe game version or the interaction between difficulty leveland game version effect was statistically reliable, p 0 .56and p 0 .49, respectively.
Do gamelike features have any effect on data?
Our analyses identified no significant differences betweengamelike and standard versions of the experiment, but thisdoes not imply that data from the two conditions wereidentically distributed. That is, the tests reported above do
1 Fourteen trials per K was chosen, since this was the lowest number oftrials per K completed by one of the conditions (gamelike mediumdifficulty). A similar pattern of results was obtained when analyseswere conducted using all data.
Behav Res (2013) 45:301–318 305

not confirm the null hypothesis, because they do not differ-entiate between null effects and low statistical power. Weaddressed this problem using the Bayesian t-test developedby Rouder, Speckman, Sun, Morey, and Iverson (2009).Rouder et al.’s method estimates a Bayes factor for thecomparison of the null hypothesis and a well-specifiedalternative. We conducted two-sample Bayesian t-tests, as-suming the uninformative JZS prior,2 to compare thegamelike and nongame conditions within each difficultylevel, for both mean response time and accuracy data. Table 2shows the Bayes factors from each test, where values greaterthan one indicate support for the null hypothesis, and follow-ing the conventions described in Table 1. In all comparisons,the direction of support was in favor of the null hypothesis.Although the evidence did not always strongly favor the null,there is no evidence in favor of the alternative hypothesis—that is, that gamelike features alter measurable aspects ofperformance.
Stronger evidence for the null is obtained when a com-bined Bayes factor was considered. There are numerous
possible approaches to aggregate Bayes factors across con-ditions or experiments. For example, one could take theproduct of independent Bayes factors, but this method doesnot respect the resolution of the data (i.e., the fact that thereis increasing sample size with increasing number of condi-tions; Rouder & Morey, 2011). Instead, we use the Bayesianmeta-analysis approach of Rouder and Morey, conductedseparately on response time and accuracy data. This analysisassumes that each comparison (e.g., gamelike easy condi-tion vs. nongame easy condition) and the samples of partic-ipants on which they are based are independent, which wastrue in our design. These meta-analytic Bayes factors indi-cated strong evidence in favor of the null hypothesis (noeffect of gamelike features) for both response time andaccuracy, as indicated by the Overall row in Table 2.
Decorrelating response time and accuracy data to assesseffort and riskiness
Our analyses of the Experiment 1 data indicate that addinggamelike features to an experimental task does not alterperformance to a measurably noticeable level, even acrossa range of difficulty settings. However, the previous analy-ses assumed that response time and accuracy are indepen-dent, which is almost never true in data. For instance, theabsence of a main effect of difficulty level on accuracyillustrates a common pitfall in analyzing accuracy and re-sponse time data separately, since one would expect harderdifficulty levels to produce higher error rates. To maintainan acceptable accuracy rate, participants instead made in-creasingly slower responses as difficulty level increased
0
5
10
15
20
25
Mea
n R
espo
nse
Tim
e (s
econ
ds)
Non
−ga
me
Gam
e
Non
−ga
me
Gam
e
Non
−ga
me
Gam
e
Easy Medium Hard0
.2
.4
.6
.8
1
Mea
n A
ccur
acy
Non
−ga
me
Gam
e
Non
−ga
me
Gam
e
Non
−ga
me
Gam
e
Fig. 2 Experiment 1 mean response times (upper panel) and accuracy(lower panel) for nongame (white bars) and gamelike (black bars)conditions represented as a function of difficulty level. The error barsrepresent ±1 standard errors of the means. Gray crosses show predic-tions of the particle filter model (described in the main text andAppendix)
2 We report only JZS Bayes factors, but note that the direction of allreported Bayes factors did not change when a unit-information priorwas assumed.
Table 1 Interpretation of Bayes factors (BF; adapted from Raftery,1995)
Null hypothesis (H0) Strength ofevidence
Alternative hypothesis (HA)
1 ≤ BF ≤ 3 Slight .33 ≤ BF ≤ 1
3 ≤ BF ≤ 10 Positive .1 ≤ BF ≤ .33
10 ≤ BF ≤ 100 Strong .01 ≤ BF ≤ .1
BF>100 Decisive BF<.01
Table 2 Bayes factors for response time and accuracy data inExperiment 1
Difficulty level Response time Accuracy
Easy 3.94 3.94
Medium 2.75 3.48
Hard 3.83 3.99
Overall 14.95 24.80
306 Behav Res (2013) 45:301–318

(which manifested as a main effect of difficulty on choicelatency). Indeed, the correlation between response time andaccuracy was very strong for all difficulty levels, all rs > .8.The dependence of response time and accuracy is clear inscatterplots shown in the left column of Fig. 3. The threescatterplots show individual participant mean response timeand accuracy in each of the easy, medium, and hard groups.In each scatterplot, the shape of the response-time–accuracyrelationship is typical of the speed–accuracy trade-off com-mon in choice experiments. Some people make fast anderror-prone responses, seen in the lower left regions of theplots in Fig. 3, and others make slow and careful decisions,as in the upper right of each panel.
The strong correlation between accuracy and responsetime weakens the results described above, because our find-ing of a null result in one measure (say, response time)makes it almost unnecessary to even check the other mea-sure (accuracy), because a corresponding finding is almostcertain to be observed. To decorrelate response time and
accuracy, we apply a process model based on particle filter-ing to the data. Particle filters are sequential Monte Carlomethods that approximate Bayesian posterior distributionswithout some of the computational difficulties that burdenother integration methods (see, e.g., Doucet, de Freitas, &Gordon, 2001). Particle filters provide useful frameworksfor describing cognition, particularly in tasks where evi-dence accumulates over time, as is assumed in almost alldecision-making paradigms. The distributions of particlescan approximate posterior distributions arbitrarily closely ifthere is a sufficient number of particles, but also quite poorlyif there are few particles; it is this property that allows themodels to smoothly move between statistically optimal be-havior and flawed, human-like behavior. Models based onparticle filtering have been applied to problems, includingcategorization (Sanborn, Griffiths, & Navarro, 2006), lan-guage comprehension (Levy, Reali, & Griffiths, 2009),change detection (Brown & Steyvers, 2009), multiple objecttracking (Vul, Frank, Alvarez, & Tenenbaum, 2010),
.3
.4
.5
.6
.7
.8
.9
1 Easy
R2 == .68
Game
Non−game
.3
.4
.5
.6
.7
.8
.9
1
Mea
n A
ccur
acy
Medium
R2 == .67
0 10 20 30 40 50 60 70
Mean Response Time (seconds)
.3
.4
.5
.6
.7
.8
.9
1 Hard
R2 == .69
.3
.4
.5
.6
.7
.8
.9
1
R2 == .14
.3
.4
.5
.6
.7
.8
.9
1
Dec
isio
n C
riter
ion
(c)
R2 == .03
100 200 400 1000 3000
Number of Particles (P)
.3
.4
.5
.6
.7
.8
.9
1
R2 == .03
Fig. 3 Scatterplots ofindividual participant data fromExperiment 1 (left column) andparticle filter parameterestimates (right column) for theeasy, medium, and hardconditions (upper, middle, andlower rows, respectively). Theleft column shows that fasterresponses were generally lessaccurate in all conditions forgame and nongame participants(filled and unfilled symbols,respectively). A particle filtermodeled the data by varyingdecision criterion and thenumber of particles, P 0 200and P 0 2,500, provided to themodel (lower and upper graylines, respectively, in all plots).The right column showsindividual participant parameterestimates for the number ofparticles and decision criterion,which did not reliably varyacross game version ordifficulty level
Behav Res (2013) 45:301–318 307

determining reward rate payoffs (Yi, Steyvers, & Lee,2009), and animal learning (Daw & Courville, 2008; Gersh-man, Blei, & Niv, 2010). We focus here on the output of theparticle filter and its psychological implications. For a fullexplanation of the model and general goodness of fit to data,see the Appendix.
The particle filter we implemented has two simple andpsychologically plausible parameters: number of particles(P) and decision criterion (c). A low or high decision crite-rion captures the way some people were risky in theirchoices, while others were more cautious. The number ofparticles can be interpreted as a limit in cognitive resources,where some individuals have a greater task capacity thanothers. We interpret the number of particles here as anindicator of a participant’s ability (and perhaps their effort).To determine whether task effort or decision riskiness wasdifferentially influenced by game version, we used individ-ual participant mean response time and accuracy data toestimate the parameters of the particle filter model separate-ly for each person. This was accomplished by a grid searchthat effectively transformed each participant’s mean accura-cy and response time into estimates of the parameters P andc. This transformation was one-to-one: Any given accuracyand mean response time pair could be predicted by only oneparameter pair. These parameter estimates provided a goodfit to mean response time and accuracy data, shown as graycrosses in Fig. 2, and to the full distribution of responsetimes, shown in Fig. 7 of the Appendix.
The right column of Fig. 3 redraws the scatterplots interms of parameter estimates (P and c) rather than raw datameans (response time and accuracy). The parameter esti-mates confirm that the addition of gamelike features did notalter the latent variables—the amount of effort applied to thetask or the level of riskiness adopted in making the noisyjudgments. Comparison of the left and right columns inFig. 3 also confirms that the model-based analysis wassuccessful in decorrelating response latency and accuracymeasures. For the medium and hard difficulty levels, therewas no longer any statistically reliable correlation betweenthe number of particles and decision criterion, both ps > .05.There was a significant correlation between particle filterparameter estimates in the easy condition, p < .01; however,this was much weaker than the correlation coefficient ob-served between response time and accuracy for this group(see Fig. 3).
With the decorrelated parameter estimates, we conducteda 2 (game version: gamelike vs. nongame) × 3 (difficultylevel: easy vs. medium vs. hard) between-subjects analysisof variance separately on the number of particles and deci-sion criterion (log- and inverse-normal-transformed, respec-tively, to correct for nonnormality). There were no reliableeffects of game version or difficulty level on the number ofparticles, all ps > .05. The only significant effect was that of
difficulty level on decision criterion, F(2, 160) 0 5.31,p < .01, where the medium difficulty condition demonstrateda lower mean decision criterion than did the easy and hardgroups. Bayes factor comparisons confirmed that thegamelike features had no effect on the latent variables (shownin Table 3). When combined across difficulty levels (Rouder& Morey, 2011), there was once again strong evidence infavor of the null hypotheses, that both the number of particlesand the decision criterion were unaffected by the addition ofgamelike features to the task.
Experiment 2
In Experiment 1, we found no evidence that gamelike fea-tures had any effect on the raw dependent measures or thelatent variables predicted by the particle filter. We aimed toreplicate the findings of Experiment 1 in a separate cogni-tive task in Experiment 2. We required participants to detectchanges in an underlying data-generating process based onnoisy outputs. In each block, there were two choice alter-natives, and on each trial, an object would independentlyappear for these alternatives according to a prespecifiedunderlying probability (unknown to participant). The prob-abilities were specified such that no alternative “paid out”objects more often, on average, across the experiment but,during most points throughout the task, one alternative paidout objects more often on average than did the other. Theprespecified probabilities switched at a random point oncein each block. The participants task was to accurately trackchanges in the underlying probability, on the basis of theobserved object payouts, to succeed in the task.
As in Experiment 1, we aimed to ensure that thegamelike condition had the best chance of improving dataquality, relative to the nongame condition, by including allof the gamelike elements traditionally invoked in gameliketasks: colorful displays, animations related to stimulus presen-tation and response feedback, a detailed back story, and apoints-based scoring system shown to participants at all times.In contrast to Experiment 1, where we failed to query subjec-tive experiences, in Experiment 2 we surveyed participantexperiences of the gamelike and nongame versions of the task.It could be that participants completing the gamelike version
Table 3 Bayes factors for particle filter parameter estimates inExperiment 1
Difficulty level Number of particles (P) Decision criterion (c)
Easy 1.48 4.90
Medium 4.40 4.05
Hard 4.21 2.34
Overall 19.98 13.95
308 Behav Res (2013) 45:301–318

have a more enjoyable experience of the experiment than dothose in the nongame task, even if gamelike features produceno measurable change to response data.
Method
Participants
One hundred twenty-seven first-year psychology studentsfrom the University of Newcastle participated either in thelaboratory (N 0 31) or online (N 0 96) for course credit.Participants were randomly allocated to the gamelike ornongame version of the task. As in Experiment 1, thegamelike and nongame versions of the task were statisticallyidentical, with the only difference being the “gamed-up”appearance of the gamelike task. At the conclusion ofExperiment 2, participants completed a brief questionnaireregarding their experiences in the experiment.
Properties common to gamelike and nongame versionsof the task
In this section, we describe the change detection task as itappeared to participants in the nongame condition, and inthe following section, we describe the gamelike features weimplemented to “game up” the task. The task involvedmaking repeated binary decisions about noisy outputs basedon unknown (to the participants) payoff distributions. Thepayoff distributions across the two alternatives changedthroughout the experiment. To perform well, the participantshad to detect the changes in the underlying payoff distribu-tions on the basis of changes in the observed payouts and
adjust their behavior accordingly. By appropriately adjust-ing their behavior to observed changes in payoffs, the par-ticipants could optimize their performance in the task.
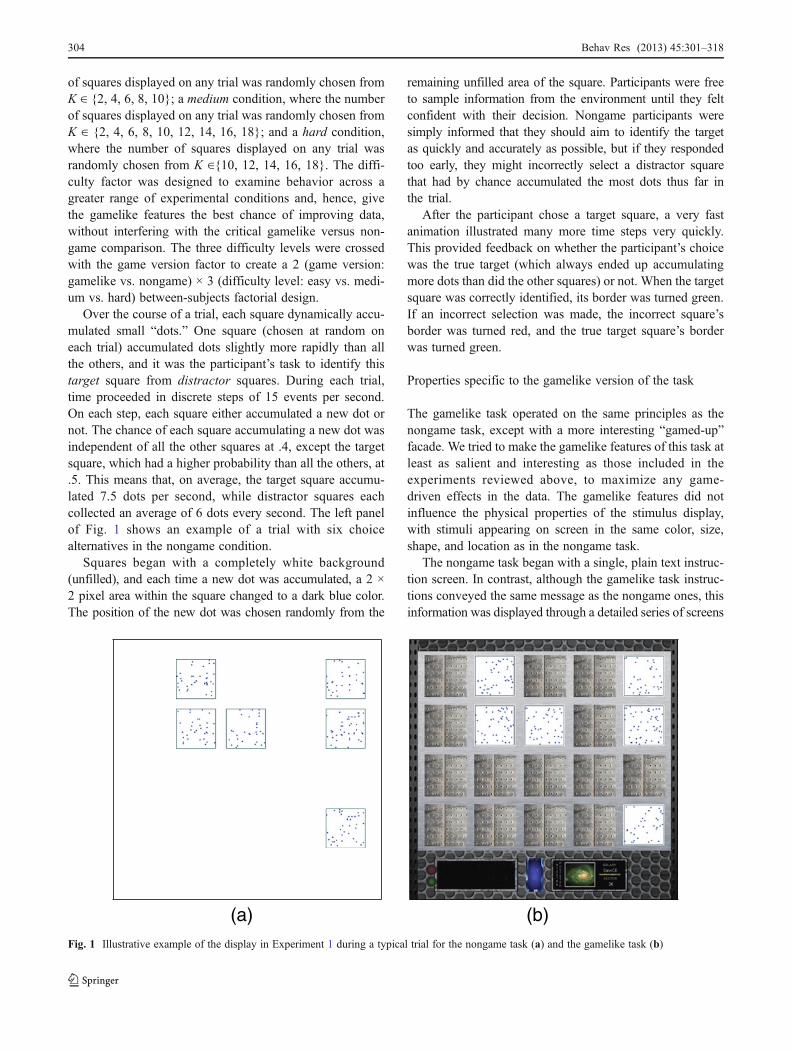
At the beginning of the task, participants were introduced tothe “Spots Experiment,” where they were given the objectiveof finding spotted squares. A demonstration version of thestandard task can be viewed online at http://psych.newcastle.edu.au/~sdb231/changeDet/nongame/nongame.html. A briefset of plain text instructions explained that a sequence ofspotted and plain squares would move down two rows (de-scribed as the left and right rows), from the top of the screen tothe bottom. Spotted squares could be collected only when theyreached a collection square at the bottom of each of the left andright rows. On each trial, the sequence of spotted and plainsquares would move down one position in its respective row.When a spotted square hit the collection square, it remainedthere until the participant collected it. Each collection squarecould hold only one spotted square at a time. Therefore, if asecond spotted square passed onto an already occupied collec-tion square, the participant was unable to collect the secondspotted square. Participants were instructed that they couldchoose only one collection square on each trial: the left orright. A response for the left collection square was made bypressing the “Z” key, and for the right collection square bypressing the “/” (i.e., question mark) key. If the responsecollected a spotted square, a green tick was displayed. If theresponse missed a spotted square (i.e., was a plain square), ared cross was shown. The green tick and red cross were eachshown for 250 ms.
An example screenshot of the nongame task is shown in theleft panel of Fig. 4. All squares were 100 pixels (wide) × 80pixels (tall). The plain squares were completely white, exceptfor a 4-pixel black border. The spotted squares contained
(a) (b)
Fig. 4 Illustrative example of the display in Experiment 2 during practice trials for the nongame task (a), where participants were asked to keeptrack of spotted squares; and the gamelike task (b), where participants were asked to capture ghosts in an abandoned building
Behav Res (2013) 45:301–318 309

approximately 48 circular black spots, each 37 pixels in size,evenly spread out on a white background with a 4-pixel blackborder. The left and right rows were made up of a collectionsquare at the base and five squares placed on top (vertically) ofthe collection square. The left and right rows were separatedby a vertically oriented plain colored middle section (78 × 480pixels). Therefore, with the left and right rows and middlesection, the test display was 278 × 480 pixels. The overallexperiment window was 620 × 560 pixels. Below each of theleft and right collection squares were text boxes that stated theresponse keys for each row at all times: “Left row (press ‘Z’)”;“Right row (press ‘/’).”
Progress information was displayed to the right of the testwindow at all times. This information indicated progressthrough the experiment (current block of total blocks) andinstructions for the current stage of the experiment. Therewere three experiment stages: visible and hidden portions ofthe practice blocks and test blocks. Participants completed36 test blocks and 2 practice blocks. The first 20 (of 40)trials in the practice blocks were described as the “visibleportion” of the block. In this visible phase the participantcould observe the sequence of spotted and plain squaresmoving down the left and right rows, demonstrating to theparticipant that whether a spotted square appeared or not ona particular trial was relatively unpredictable but that, at anygiven time, one row tended to have more spotted squaresthan did the other. On each practice trial in the visible phase.the participant was shown the outcome of the collectionsquare (spotted or plain square) for both the chosen andforegone alternatives. The left panel of Fig. 4 shows anexample of the visible portion of the practice blocks.
In the second half of each practice block, the sequence ofspotted and plain squares was “hidden” from the participant.All squares, including the collection square (and the middlesection), were instead displayed in gray (but still with ablack border), and on each trial, the participant was shownonly the outcome of the chosen collection square (i.e., theywere not shown the outcome of the foregone alternative).All data from practice trials were discarded from analyses.The test phase of the experiment appeared the same as the“hidden phase” of the practice blocks, but without an initial“visible phase,” for the 36 test blocks of 60 trials each.
There was one change point in each block of the exper-iment. The trial of the change point was randomly sampledfrom an exponential distribution (M 0 10), constrained notto fall within the first or last 10 trials of the block. That is,the change point would occur between the 11th and 50thtrials in the test blocks (between the 11th and 30th trials inthe practice blocks). When a change point occurred, theunderlying probabilities for the left and right rows wererandomly resampled, subject to the constraint that the prob-ability ratios must change (i.e., not resample the currentprobability ratio, which would produce no apparent change
to the participant). We used three probability ratios through-out the experiment, given as the probability that a spottedsquare would appear in the left versus right row on any trial:.5 versus .5 (both rows provide equal average payoff), .75versus .25 (left row pays off approximately three times asoften as the right row), and .25 versus .75. (right row paysoff approximately three times as often as the left row). Therewas continuity across blocks such that the probability ratioat the end of one block was the same ratio that began thefollowing block.
Participants were instructed that spotted squares wouldcome down the left and right rows in batches and that,sometimes, more spotted squares would appear in the leftrow and, at other times, more spotted squares would appearin the right row. They were told that within each block, onerow might have more spotted squares appear at the begin-ning of the block and fewer spotted squares by the end of theblock. In order to collect the most spotted squares, partic-ipants were reminded that the spotted squares might changewhich row they traveled down (but participants were neverexplicitly instructed that there would be a change point ineach block).
Our primary dependent measures on each trial were whethera spotted square was collected and the latency to make aresponse (in milliseconds). We recorded a cumulative countof the number of spotted squares collected throughout the task,but at no point was the participant made aware of their cumu-lative total. Participants who achieved the best scores (greatestnumber of collected spotted squares) were thosewho accuratelytracked changes in the underlying data-generating process. Thatis, people who were aware of changes in the observed payoffsof spotted squares changed their response patterns accordinglyso as to collect the maximal number of spotted squares.
Properties specific to the gamelike version of the task
As in Experiment 1, the gamelike task operated on the sameprinciples as the nongame task, except for the “gamed-up”facade, and did not alter any of the physical properties of thestimulus display (e.g., size, shape, location). We again attemp-ted to include many “standard” gamelike features typicallyincorporated in gamelike tasks to give the gamelike versionthe best chance of affecting participant engagement and mo-tivation and, consequently, observable performance. A dem-onstration version of the gamelike task can be viewed onlineat http://psych.newcastle.edu.au/~sdb231/changeDet/game/ghostGame.html.
The gamelike version of the task required participants totrap ghosts that were on the loose in an abandoned warehouseas efficiently as possible. At the beginning of the task, partic-ipants were introduced to the “Ghost Trap Experiment” (thename “Ghostbusters” seemed apt, but we refrained for fear ofcopyright infringement). The task instructions described the
310 Behav Res (2013) 45:301–318

same underlying task as the nongame version, except thatthere was a detailed back story and animations that explainedhow the task worked.
Ghosts traveled through two rows of rooms set across ahallway (i.e., the left and right rows, the middle section). Ghosttraps were set up in the two rooms at the end of the hallway(i.e., collection squares). Participants were told that when aghost entered a room with an empty trap, the ghost would becaught. Each ghost trap could hold only one ghost at a time, soif a second ghost entered a room with a full trap, the ghostwould pass through without capture. The capture (and evadingcapture) processes were illustrated with a short animation ofthe capture process that we expected would aid understandingof the task. Participants were instructed that they could check aroom containing a full trap to collect the ghost (as in thenongame task: left trap, “Z” key; right trap, “/” key). Unlikethe nongame task, participants were given explicit instructionabout the points-based scoring system and were told that theywould receive one point for every ghost caught. The currentscore was displayed at all times on the right side of theexperiment display in the form: “You’ve caught # ghosts!,”where # was the cumulative score across the experiment up tothe current trial (see right panel of Fig. 4). At the end of eachblock, a reminder of the number of ghosts caught was alsodisplayed. Participants were instructed that they could checkonly one ghost trap at a time and, thus, that they should changewhich side of the hallway they observed wisely.
The gamelike version also contained three experimentphases of the same length and type as the nongame task:visible and hidden practice trials and test blocks. In thevisible practice trials, the hallway and rooms were lit soghosts could be seen moving down the hallway. During thevisible phase, there were animations on each trial showingthe process by which ghosts could become stuck in emptytraps, how ghosts could be retrieved and captured from a fulltrap, and how ghosts that approached a currently full trapwould freely pass through the capture room (animations oneach trial took approximately half a second). In this phase,the animations showed the outcome for both chosen andforegone alternatives, demonstrating how the task func-tioned. The hidden practice trials and test blocks no longershowed the hallways or lit the trap rooms, due to a “poweroutage.” On each trial, participants observed only the out-come of the chosen trap room (left or right; i.e., they werenot shown the status of the unchosen trap room).
As with the nongame task, participants were instructedthat ghosts would move down the left and right hallways inbatches—sometimes, more ghosts would be in the left hall-way, and at other times, more ghosts would appear in theright hallway—and that within each block, one row mighthave more ghosts appear at the beginning than at the end ofthe block. Importantly, the gamelike version of the taskhad a far more consistent “story” than the nongame
version: There were ghosts wandering an abandonedbuilding (why objects moved down the left and rightrows); traps could hold only one ghost at a time, so asecond ghost could not be caught if a trap was currentlyoccupied (why a collection square could hold only oneobject at a time); and there was a power outage (whythere were visible and hidden phases). We believed thatthese back-story elements would aid understanding of thetask and increase participant engagement.
Questionnaire
We administered an 11-item questionnaire about subjectiveexperiences in the experiment at the conclusion of the task.The questions generally related to understanding of the task,effort applied, task interest, motivation, enjoyment, andboredom (shown in Table 4). Each question was rated on a7-point Likert scale, with 8 of the 11 items worded positive-ly and 3 negatively. We calculated a Bayes factor for eachquestionnaire item individually and then created a combinedscore that was calculated separately for each participant byadding the scores of the positively worded questions (Qs. 1–6, 10, 11) and subtracting the scores of the negativelyworded questions (Qs. 7–9; giving a possible range from13 to 53). We provide a separate Bayes factor for thiscombined score (i.e., not a meta-analytic Bayes factor).
Results
Experimental task
Our primary focus in Experiment 2 was on overall perfor-mance as measured by the total number of objects collected(ghosts in the gamelike version; spotted squares in thenongame version) separately for game version (gamelike,nongame) and testing location (laboratory, online). As withExperiment 1, we supplement ANOVA analyses with Bayesfactors to provide direct evidence for the null hypothesis(denoted in text with BFH0 ).
Consistent with the results of Experiment 1, gamelike fea-tures had no reliable effects on the data (see Table 5). Therewere no reliable differences in the number of objects collectedbetween the gamelike and nongame versions, F(1, 123) 0
0.06,p ¼ :80 BFH0 ¼ 7:00ð Þ, or between laboratory and onlineparticipants, F(1, 123) 0 1.27, p ¼ :26 BFH0 ¼ 3:52ð Þ . Theinteraction between the two was also not reliable, F(1, 123) 01.15, p 0 .29. We also examined whether there were anydifferences in mean choice latency on each trial. Again, wefound no differences between game versions onmean responsetime, F(1, 123) 0 0.53, p ¼ :47 BFH0 ¼ 5:57ð Þ, or an interac-tion between game version and testing location, F(1, 123) 00.39, p 0 .53. There was, however, a marginally significant
Behav Res (2013) 45:301–318 311

main effect of testing location on response latency, with onlineparticipants exhibiting faster responses (M 0 209.42 ms, SD 0
138.34) than laboratory participants (M 0 263.52 ms, SD 0135.20) according to an ANOVA, F(1, 123) 0 3.59, p 0 .06,but this effect would not be considered reliable according to aBayes factor BFH0 ¼ 1:13ð Þ.
There were also no differences in task engagement asindirectly measured by the proportion of outliers in thenumber of total objects collected. We examined outliersin each condition, defined as participants who scoredbelow two standard deviations (pooled across the fourconditions) in the number of objects collected. Wefound that the proportion of participants judged as out-liers varied very little between conditions—from a highof 6.8 % (in the nongame and online condition) to alow of 5.8 % (nongame in lab).
Questionnaire
In addition to analyzing performance in the experimentaltask, our secondary focus was to analyze participants’ self-reported experiences. This was to investigate whethergamelike features (or testing location) influenced partici-pants’ subjective experience in the experiment, even thoughthe dependent measures from the experimental task wereunchanged. Table 5 shows the total mean scores for thequestionnaire in each of the conditions, while Table 4 showsBayes factors for separate comparisons between thegamelike versus nongame and laboratory versus online con-ditions. Bayes factors greater than 1 indicate support for thenull hypothesis (no difference between conditions).
Unlike the raw data measures from the experiment,there were some reliable differences in questionnairescores between the gamelike and nongame conditions.The gamelike version had a greater total score than thenongame condition, indicating a more positive experience.In particular, participants in the gamelike version rated thegraphics of the experimental task more interesting and hada more enjoyable experience than did those in the non-game version. Interestingly, even though the experience inthe gamelike version was more positive overall, the gamelikefeatures did not appear to be sufficiently motivating orinteresting enough to reduce the repetitiveness and boredomexperienced during the task, as evidenced by scores on thenegative items.
Table 4 The 11 items in the questionnaire given to participants aftercompleting Experiment 2. Answers were provided on a 7-point Likertscale (1 0 lowest; 7 0 highest). The bottom entry shows a total scoreobtained by combining across questionnaire items. For all question-naire items, and separately for gamelike versus nongame and
laboratory versus online, the two left columns show means (Ms) andstandard deviations (SDs) followed by the Bayes factor indicatingsupport for the null hypothesis BFH0 . Bayes factors greater than onesupport the null hypothesis, and those less than one support thealternative hypothesis
Question Gamelike vs. Nongame Laboratory vs. Online
Game – M(SD) Nongame –M(SD)
BFH0 Lab – M(SD) Online – M(SD) BFH0
1 How easily did you understand the instructions givenat the beginning of the task?
4.14 (1.95) 3.72 (1.70) 3.24 4.63 (1.68) 3.73 (1.85) 0.32
2 How much effort did you put in throughout the task? 4.53 (1.76) 4.41 (1.60) 6.77 5.34 (1.49) 4.20 (1.65) 0.01
3 How interesting would you rate the graphics? 4.20 (1.75) 2.75 (1.51) 9.1 × 10⁻⁵ 4.09 (1.94) 3.35 (1.71) 1.12
4 How mentally stimulating did you find this task? 3.18 (1.73) 2.75 (1.57) 2.57 3.56 (1.81) 2.80 (1.58) 0.78
5 How worthwhile did you find the task to be? 3.01 (1.63) 2.75 (1.58) 4.90 3.84 (1.69) 2.59 (1.46) 0.01
6 How much did you enjoy participating in this task? 3.59 (1.96) 2.82 (1.65) 0.44 4.16 (1.89) 2.94 (1.76) 0.06
7a How boring did you find the task to be? 4.10 (1.97) 4.52 (1.95) 3.54 3.84 (1.72) 4.44 (2.02) 1.86
8a How repetitive did you find this task to be? 5.87 (1.64) 5.75 (1.89) 6.88 5.97 (1.33) 5.77 (1.87) 5.22
9a How much were you looking forward to the task finishing? 5.55 (1.62) 5.85 (1.28) 3.72 4.97 (1.62) 5.92 (1.35) 0.10
10 How willing would you be to complete this task again? 3.73 (1.90) 3.23 (1.75) 2.26 4.59 (2.00) 3.15 (1.66) 0.01
11 How well do you think you performed, compared toother people who have participated in this experiment?
3.94 (1.38) 3.63 (1.39) 3.35 4.14 (1.17) 3.69 (1.44) 1.46
Total score 14.82 (12.82) 9.94 (11.04) 0.56 19.58 (12.09) 10.32 (11.45) 9.3 × 10⁻³
a Negatively worded questions
Table 5 Experiment 2 mean items collected (ghosts in the gamelikeversion; spots in the nongame version) and total questionnaire scores,separately for game version and testing location
Version Location Mean itemscollected (SD)
Mean questionnairescore (SD)
Gamelike Laboratory 1,413.19 (106.70) 22.94 (12.63)
Online 1,411.17 (98.79) 12.26 (11.87)
Nongame Laboratory 1,452.73 (102.92) 15.77 (10.59)
Online 1,404.55 (109.43) 8.04 (10.61)
312 Behav Res (2013) 45:301–318
Our questionnaire item #2—self-reported effort applied tothe task—provided an alternative approach to examining thecriterion validity of our argument that the data do not differacross game versions. Any reasonable hypothesis about per-formance would state that task effort and task performance arepositively associated, which was the case in Experiment 2(using number of objects collected as the measure of perfor-mance), r 0 .33, t(120) 0 3.80, p < .001. If the nongame taskproduced data of similar quality to the gamelike version, boththe amount of effort applied and the strength of the effort–performance relationship should not differ between these twogroups. As can be seen above (Table 4), the amount of effortapplied did not differ between conditions. Furthermore, wefound significant correlations between effort and performancein both the gamelike task, r 0 .34, t(62) 0 2.86, p < .01, and thenongame task, r = .33, t(56) 0 2.61, p 0 .01, and these twocorrelations were not significantly different: Z 0 .07, p 0 .94.This suggests that the data from both game versions were ofequal quality and is consistent with the particle filter modelingof Experiment 1 data. In our modeling, we found no differencein the effort applied to the task between gamelike andnongame conditions (i.e., number of particles), whichprovides convergent validity for the parameter estimates ofthe particle filter, as well as our interpretation of those param-eter estimates.
As compared with the game version, there were somereliable differences across testing locations. Again, there wasa strong effect on the total score, with laboratory participantsreporting a more positive experience of the experiment. Therewere also many strong effects on individual items. As com-pared with online participants, those who participated in thelaboratory understood task instructions more easily, exertedmore effort throughout the task, found the task to be more
worthwhile and enjoyable, and were more willing to completethe task again.
General discussion
A common practice in psychological research is to incorporatefeatures from computer games into standard psychologicalexperiments. The effect of gamelike features on data qualityis assumed to be positive, because of plausible hypothesesabout their effects on underlying cognitions—particularly,motivation and attention. However, the effect that gamelikefeatures have on data is almost never tested empirically. Wefound that, on average, there were no differences in outcomemeasures (response latency, decision accuracy, points scored)between gamelike and nongame versions of statistically iden-tical tasks. We also demonstrated the data from both versionsof the choice task were consistent with a single quantitativemodel whose parameters did not vary between conditions.Furthermore, despite the lack of an effect of gamelike featureson observed data, the gamelike version of a change detectiontask was subjectively perceived as more interesting and en-joyable than the nongame version.
Gamelike featuresmay alter task performance, asWashburn(2003) observed, but evidence fromExperiment 1 suggests thisis likely the result of a speed–accuracy trade-off. In keepingwith this hypothesis, Green and Bavelier (2006) found thatcomputer game players set a much faster speed–accuracytrade-off than did other participants in a perceptual attentionexperiment, making much faster responses with very smallchanges in accuracy. In our Experiment 1 data (left columnof Fig. 3), both gamelike and nongame tasks naturally pro-duced largewithin-group variability in the preference for speed
(a) (b)
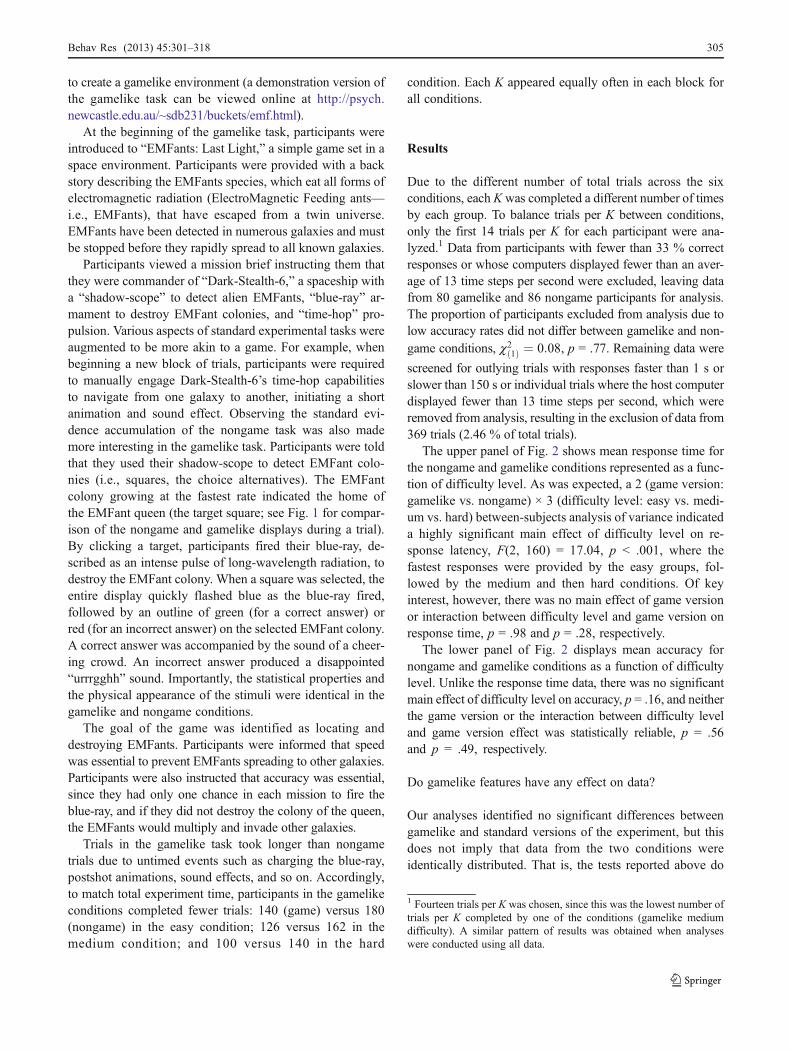
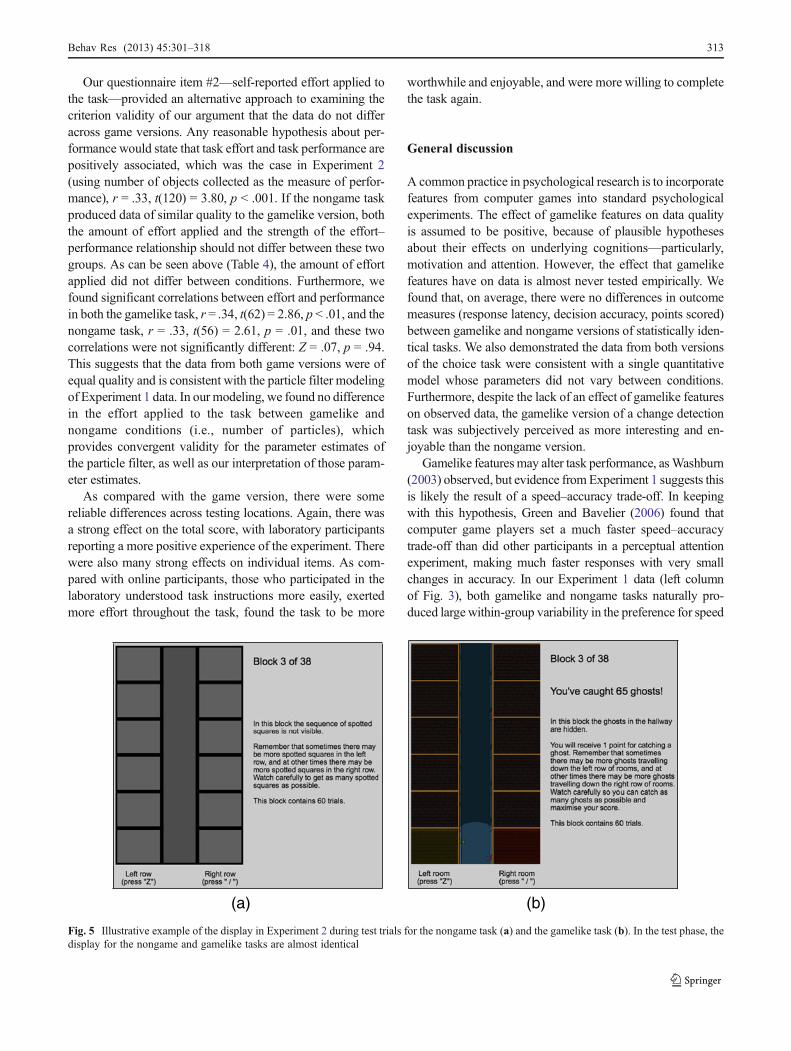
Fig. 5 Illustrative example of the display in Experiment 2 during test trials for the nongame task (a) and the gamelike task (b). In the test phase, thedisplay for the nongame and gamelike tasks are almost identical
Behav Res (2013) 45:301–318 313

or accuracy, but there was no systematic effect of gamelikefeatures. It seems that, if an experimenter really wanted tomanipulate the speed–accuracy trade-off, there are simplerand more controlled ways than by utilizing gamelike features.For instance, simply asking participants to respond quicklyor to respond carefully usually works well (e.g., Brown &Heathcote, 2005, 2008; Ratcliff & Rouder, 1998; Usher &McClelland, 2001).
There are several ways to interpret the null results from ourtwo experiments. It is possible that our gamelike features werenot sufficiently salient to have any effect. However, thegamelike features we introduced in each experiment weretypical of those used in psychology experiments, and theimplementation details (e.g. graphical, auditory, and animationquality) were at least as good as most other examples. Thus, ifour gamelike features produced no effects on data, it is likelythat other standard gamelike features will also have no effect.Also, in Experiment 2, we found that the very strong contex-tual difference between taking part in the experiment onlineversus in the laboratory made a strong impact on participants’experience (as reported in the questionnaire). Even this verystrong effect—which is surely a larger context effect than couldever be induced by changing computer animations and othergamelike features—had no reliable effects on data. Thisspeaks against the notion that gaming-up experiments, nomatter how well executed, will ever improve data.
Another possibility is that a drawback of our tasks cur-tailed the potential benefits from gamelike features. That is,while the gamelike features may have worked to enhanceperformance, the more complicated stimulus display of thegamed-up task may have simultaneously worsened perfor-mance. If these effects were in balance, it could explain ourobservation of no difference in performance between theversions. This interpretation is possible for Experiment 1,but it seems very unlikely for Experiment 2. In Experiment2, although the introductory phases of the experiment werevery different between the nongame and gamelike tasks, thedisplay during the data collection phase was very similarbetween versions (see Fig. 5). This makes it difficult to seehow any putative improvement due to gamelike featuresmay have been suppressed by irrelevant task elements.Nevertheless, future research could address this more care-fully by using identical visual displays in the nongame andgamelike versions.
Nevertheless, and at a minimum, our results, combinedwith those of Washburn (2003), suggest that researchersshould not simply assume that adding gamelike features toa task confers any benefits on performance. It may be thatimproved data will result from computer games only whenthe underlying game play has been altered, as computerprogrammers suggest, since the fundamental task is oftenrated as one of the most important components of a game(Wood et al., 2004). In the present study and most existing
research using gamelike tasks, the game play (i.e., the ex-perimental task) is deliberately unaltered, with gamelikefeatures added only to superficial aspects.
Alternatively, our null results from experimental data,combined with the results of our Experiment 2 question-naire, could be interpreted as positive news, implying thatexperiments can be “gamed up” without worrying that thedata will be negatively influenced. Gaming up an experimentmight be viewed as intrinsically worthwhile to the experi-menter, or beneficial because it makes the participants’ per-ception of the experiment more positive and enjoyable.
Acknowledgements We thank Mike Yi and Mark Steyvers forassistance in the development of the materials for Experiment 2. Thisresearch was supported by the Keats Endowment Research Fund andby an Australian Research Council Discovery Project (0878858).
Appendix
Particle filter details
The general idea of a particle filter is to take a set of Pparticles, each of which is treated as a sample from theposterior distribution of interest (e.g., they may be “hypothe-ses” about which of the K choice alternatives is the target).Before any data are observed, these particles are samples froma prior distribution. Each time a new datum is observed, theentire set of P particles is “evolved.” This evolution step cantake many forms but usually involves resampling the particlesaccording to their likelihood. Conditionally likely particles(those consistent with the datum) have a higher probabilityof being resampled than conditionally unlikely particles (thoseinconsistent with the datum), which become rarer. If theresampling algorithm meets certain conditions, the distribu-tion across particles approximates the full posterior distribu-tion—that is, based on the entire history of observations—even though this history is not explicitly stored.
Different particle filters can be developed to approximatedifferent posterior distributions, by employing likelihoodcalculations based on particular assumptions about whichenvironmental quantities are known and which are estimat-ed. We set up a particle filter to model individual participantdata from both game versions of Experiment 1, illustratedconceptually in Fig. 6. Each particle is a number from 1, …,K corresponding to a belief about which square is the target.At the beginning of a decision, particles are randomly sam-pled from a uniform prior. An initial set of P 0 10 particlesfor a decision between K 0 4 choice alternatives is shown inthe top row of the right-hand side of Fig. 6. In this example,three particles hypothesize that square 1 is the target (whichit actually is), four particles that the target is 2, and so on. Inour task, on each time step, a dot either appeared or did notappear in each square, and these are represented by the
314 Behav Res (2013) 45:301–318

square “evidence increments” in the shaded rectangle on theleft of Fig. 6. The uppermost row of evidence tokens illus-trates the first time step: A dot appeared in both of squares 3and 4, but not in squares 1 or 2. The probability of thispattern of dots across the squares can easily be calculatedunder each particle’s hypothesis, if we assume that targetand distractor probability rates are perfectly known. Forexample, the probability of observing the first time step’soutcomes (new dots for squares 3 and 4, no new dots for 1and 2) is 4.8 % if square 1 is really the target, 7.2 % if square4 is the target, and so on. These probabilities are used toresample a new set of P particles for the next time step, withreplacement. The outcome of this resampling is shown bythe second row of particles.
After each step, the posterior probability that each square isthe target can be estimated by calculating the proportion ofparticles representing that square, illustrated by the histogramson the far right side of Fig. 6. We assumed that a decision was
triggered whenever the largest posterior probability exceededa criterion threshold c. In our example, if c 0 .8, the particlefilter would incorrectly respond (with square 4) after thefourth time step, since eight out of ten particles representedsquare 4 at that time. This demonstrates the difficult speed–accuracy trade-off in the present experiment: Respondingtoo early may result in incorrectly selecting a distractor thathas by chance accumulated the most evidence thus far inthe trial. In the time steps that follow, the true target(square 1) gathers more evidence tokens and, hence, isconditionally more likely so particles begin to resampletoward square 1.
By varying both the number of particles and decisioncriterion, the particle filter predicts the speed–accuracytrade-off seen in our data. For a large number of particles,P 0 2,500, sweeping the decision criterion from c 0 .3 − 1naturally produces the negatively accelerated upper grayline in each of the scatterplots in the left column of Fig. 3.
TimeSteps
1 2 3 4
Evidence Increments
2
2
2
2
4
4
4
4
4
4
4
2
4
4
4
4
4
4
1
4
4
4
4
4
4
4
1
3
1
4
4
4
4
4
4
1
2
3
1
1
4
4
1
1
1
2
1
1
1
4
4
1
1
1
1
1
4
1
1
4
1
1
1
1
1
4
4
1
1
1
1
1
2
4
4
4
4
1
1
1
1
4
4
4
4
4
1
1
1
1
Particles
2
2
2
2
4
4
4
4
4
4
4
2
4
4
4
4
4
4
1
4
4
4
4
4
4
4
1
3
1
4
4
4
4
4
4
1
2
3
1
1
4
4
1
1
1
2
1
1
1
4
4
1
1
1
1
1
4
1
1
4
1
1
1
1
1
4
4
1
1
1
1
1
2
4
4
4
4
1
1
1
1
4
4
4
4
4
1
1
1
1Hypothesized
TargetFig. 6 Illustrative example of the particle filter algorithm (see the Appendix text for details)
Behav Res (2013) 45:301–318 315

This P 0 2,500 line represents an approximate upper boundon performance. That is, on average, people did not respondmore quickly or accurately than this model.
Simply reducing the number of particles qualitativelychanges model predictions. With fewer particles, the modelpredicts faster responses with lower accuracy. For a P 0 200model and decision criterion swept from c 0 .5 − 1, theparticle filter predicts an approximate lower bound on per-formance, whereby most people perform as accurately or asquickly, or better, than this model, depicted by the lowergray lines in the left column of Fig. 3.
To make the model respond as slowly as the humanparticipants, we had to scale response time predictions (thisis why the upper and lower “bounds” are only approximate).We assume that it took participants just under 15 ms toinspect each square in the display, so this means that theresponse time predictions of the particle filter must be mul-tiplied by 1.2 in the easy conditions, 2.3 in the mediumgroups, and 3.1 in the hard conditions. In other words, theentire set of particles was updated, on average, every 80,153, and 207 ms in the easy, medium, and hard difficultylevels, respectively. It is this scaling factor that makes thesame P 0 200 and P 0 2,500 model predictions differ in theleft column of Fig. 3. The majority of data fall betweenthe P 0 200 and P 0 2,500 model predictions shown in Fig. 3,indicating that the particle filter provides a good account of thedata across both game versions. The particle filter also pro-vides a good fit to the distribution of response times, even
though the model was not fit to these data, as is shown inFig. 7.
References
Aidman, E. V., & Shmelyov, A. G. (2002). Mimics: A symbolic conflict/cooperation simulation program, with embedded protocol recordingand automatic psychometric assessment. Behavior ResearchMethods, Instruments, & Computers, 34, 83–89.
Alloway, T. P., Corley, M., & Ramscar, M. (2006). Seeing ahead: Expe-rience and language in spatial perspective.Memory&Cognition, 34,380–386.
Andrews, G., & Halford, G. S. (2002). A cognitive complexity metricapplied to cognitive development. Cognitive Psychology, 45,153–219.
Arcediano, F., Ortega, N., & Matute, H. (1996). A behavioural prep-aration for the study of human Pavlovian conditioning. QuarterlyJournal of Experimental Psychology, 49, 270–283.
Arthur, W., Jr., Strong, M. H., Jordan, J. A., Williamson, J. E., Shebilske,W. L., & Regian, J. W. (1995). Visual attention: Individual differ-ences in training and predicting complex task performance. ActaPsychologica, 88, 3–23.
Artigas, A. A., Chamizo, V. D., & Peris, J. M. (2001). Inhibitoryassociations between neutral stimuli: A comparative approach.Animal Learning & Behavior, 29, 46–65.
Baeyens, F., Vansteenwegen, D., Beckers, T., Hermans, D., Kerkhof, I.,& de Ceulaer, A. (2005). Extinction and renewal of Pavlovianmodulation in human sequential feature positive discriminationlearning. Learning & Memory, 12, 178–192.
Baker, A. G., Mercier, P., Vallee-Tourangeau, V., Frank, R., & Pan, M.(1993). Selective associations and causality judgments: Presenceof a strong causal factor may reduce judgments of a weaker one.Journal of Experimental Psychology: Learning, Memory, andCognition, 19, 414–432.
Berger, A., Jones, L., Rothbart, M. K., & Posner, M. I. (2000).Computerized games to study the development of attention inchildhood. Behavior Research Methods, Instruments, & Com-puters, 32, 297–303.
Blanco, F., Matute, H., & Vadillo, M. A. (2010). Contingency is usedto prepare for outcomes: Implications for a functional analysis oflearning. Psychonomic Bulletin & Review, 17, 117–121.
Brown, S., & Heathcote, A. (2005). A ballistic model of choiceresponse time. Psychological Review, 112, 117–128.
Brown, S., & Heathcote, A. J. (2008). The simplest complete model ofchoice reaction time: Linear ballistic accumulation. CognitivePsychology, 57, 153–178.
Brown, S. D., & Steyvers, M. (2009). Detecting and predictingchanges. Cognitive Psychology, 58, 49–67.
Buchner, A., Mehl, B., Rothermund, K., & Wentura, D. (2006). Arti-ficially induced valence of distractor words increases the effectsof irrelevant speech on serial recall. Memory & Cognition, 34,1055–1062.
Carneiro, P., Fernandez, A., & Dias, A. R. (2009). The influence oftheme identifiability on false memories: Evidence for age–depen-dent opposite effects. Memory & Cognition, 37, 115–129.
Castro, L., & Wasserman, E. A. (2007). Discrimination blocking:Acquisition versus performance deficits in human contingencylearning. Learning & Behavior, 35, 149–162.
Correia, C. J., & Cameron, J. M. (2010). Development of a simulateddrinking game procedure to study risky alcohol use. Experimentaland Clinical Psychopharmacology, 18, 322–328.
Daw, N. D., & Courville, A. C. (2008). The rat as particle filter. In J. Platt,D. Koller, Y. Singer, & S. Roweis (Eds.), Advances in Neural
Easy Medium Hard
0
10
20
30
40
Res
pons
e T
ime
Qua
ntile
s (s
econ
ds)
Data: Non−GameData: GameParticle Filter
Fig. 7 Fit of the particle filter model to response time distributions.Data from the nongame and gamelike conditions are shown as openand filled symbols, respectively. Predictions of the particle filter areshown with gray crosses. Symbols represent, from bottom to top, the10 %, 30 %, 50 % (i.e., median), 70 %, and 90 % quantiles of theresponse time distribution
316 Behav Res (2013) 45:301–318

Information Processing Systems 20 (pp. 369–376). Cambridge,MA:MIT Press.
Day, E. A., Arthur, W., Jr., & Shebilske, W. L. (1997). Ability deter-minants of complex skill acquisition: Effects of training protocol.Acta Psychologica, 97, 145–165.
Dixon, J. A., & Banghert, A. S. (2004). On the spontaneous discoveryof a mathematical relation during problem solving. CognitiveScience, 28, 433–449.
Dixon, J. A., & Dohn, M. C. (2003). Redescription disembeds rela-tions: Evidence from relational transfer and use in problem solv-ing. Memory & Cognition, 31, 1082–1093.
Doucet, A., de Freitas, N., & Gordon, N. (2001). Sequential MonteCarlo methods in practice. New York: Springer.
Droit-Volet, S., Tourret, S., & Wearden, J. (2004). Perception of theduration of auditory and visual stimuli in children and adults.Quarterly Journal of Experimental Psychology, 57, 797–818.
Drury, J., Cocking, C., Reicher, S., Burton, A., Schofield, D., Hardwick,A., …, Langston, P. (2009). Cooperation versus competition in amass emergency evacuation: A new laboratory simulation and a newtheoretical model. Behavior Research Methods, 41, 957–970.
Dunbar, G., Hill, R., & Lewis, V. (2001). Children’s attentional skillsand road behavior. Journal of Experimental Psychology: Applied,7, 227–234.
Ekstrom, A. D., & Bookheimer, S. Y. (2007). Spatial and temporalepisodic memory retrieval recruit dissociable functional networksin the human brain. Learning & Memory, 14, 645–654.
Fabiani, M., Buckley, J., Gratton, G., Coles, M. G. H., & Donchin, E.(1989). The training of complex task performance. Acta Psycho-logica, 71, 259–299.
Fazio, R. H., Eiser, J. R., & Shook, N. J. (2004). Attitude formationthrough exploration: Valence asymmetries. Journal of Personalityand Social Psychology, 87, 293–311.
Finke, A., Lenhardt, A., & Ritter, H. (2009). The MindGame: A P300–based brain–computer interface game. Neural Networks, 22,1329–1333.
Franssen, M., Clarysse, J., Beckers, T., van Vooren, P. R., & Baeyens,F. (2010). A free software package for a human online–condi-tioned suppression preparation. Behaviour Research Methods, 42,311–317.
Frey, A., Hartig, J., Ketzel, A., Zinkernagel, A., & Moosbrugger, H.(2007). The use of virtual environments based on a modificationof the computer game Quake III Arena in psychological exper-imenting. Computers in Human Behavior, 23, 2026–2039.
Gershman, S. J., Blei, D. M., & Niv, Y. (2010). Context, learning, andextinction. Psychological Review, 117, 197–209.
Green, C. S., & Bavelier, D. (2006). Effect of action video games onthe spatial distribution of visuospatial attention. Journal of Exper-imental Psychology: Human Perception and Performance, 32,1465–1478.
Gunzelmann, G., & Anderson, J. R. (2006). Location matters: Whytarget location impacts performance in orientation tasks. Memory& Cognition, 34, 41–59.
Hanauer, J. B., & Brooks, P. J. (2003). Developmental change in thecross–modal Stroop effect. Perception & Psychophysics, 65, 359–366.
Hansberger, J. T., Schunn, C. D., & Holt, R. W. (2006). Strategyvariability: How too much of a good thing can hurt performance.Memory & Cognition, 34, 1652–1666.
Hutcheson, A. T., & Wedell, D. H. (2009). Moderating the routeangularity effect in a virtual environment: Support for a dualmemory representation. Memory & Cognition, 37, 514–521.
Jackson, D. N., III, Vernon, P. A., & Jackson, D. N. (1993). Dynamicspatial performance and general intelligence. Intelligence, 17,451–460.
Johnson, T. R., & Krems, J. F. (2001). Use of current explanations inmulticausal abductive reasoning. Cognitive Science, 25, 903–939.
Johnson, C. I., & Mayer, R. E. (2010). Applying the self–explanationprinciple to multimedia learning in a computer–based game–likeenvironment. Computers in Human Behavior, 26, 1246–1252.
Kirsh, D., & Maglio, P. (1994). On distinguishing epistemic frompragmatic action. Cognitive Science, 18, 513–549.
Krageloh, C. U., Zapanta, A. E., Shepherd, D., & Landon, J. (2010).Human choice behaviour in a frequently changing environment.Behavioural Processes, 83, 119–126.
Kujala, J. V., Richardson, U., & Lyytinen, H. (2010). Estimation andvisualizaion of confusability matrices from adaptive measurementdata. Journal of Mathematical Psychology, 54, 196–207.
Levy, R., Reali, F. Griffiths, T. L. (2009). Modeling the effects ofmemory on human online sentence processing with particle fil-ters. Advances in Neural Information Processing Systems, 22.
Lie, C., Harper, D. N., & Hunt, M. (2009). Human performance on atwo–alternative rapid–acquisition choice task. Behavioural Pro-cesses, 81, 244–249.
Lien, M.-C., Ruthruff, E., Remington, R. W., & Johnston, J. C. (2005).On the limits of advance preparation for a task switch: Do peopleprepare all the task some of the time or some of the task all thetime? Journal of Experimental Psychology: Human Perceptionand Performance, 31, 299–315.
Logie, R., Baddeley, A., Mane, A., Donchin, E., & Sheptak, R. (1989).Working memory in the acquisition of complex cognitive skills.Acta Psychologica, 71, 53–87.
Maglio, P. P., Wenger, M. J., & Copeland, A. M. (2008). Evidence forthe role of self–priming in epistemic action: Expertise and theeffective use of memory. Acta Psychologica, 127, 72–88.
Mane, A. M., Adams, J. A., & Donchin, E. (1989). Adaptive and part–whole training in the acquisition of a complex perceptual–motorskill. Acta Psychologica, 71, 179–196.
Mane, A., & Donchin, E. (1989). The space fortress game. ActaPsychologica, 71, 17–22.
Mather, M., Gorlick, M. A., & Lighthall, N. R. (2009). To brake oraccelerate when the light turns yellow? Stress reduces older adults’risk taking in a driving game. Psychological Science, 20, 174–176.
McPherson, J., & Burns, N. R. (2007). Gs invaders: Assessing acomputer game-like test of processing speed. Behavior ResearchMethods, 39, 876–883.
McPherson, J., & Burns, N. R. (2008). Assessing the validity ofcomputer game-like tests of processing speed and working mem-ory. Behavior Research Methods, 40, 969–981.
Metcalfe, J., Kornell, N., & Finn, B. (2009). Delayed versus immediatefeedback in children’s and adults’ vocabulary learning.Memory &Cognition, 37, 1077–1087.
Molet, M., Jozefowiez, J., & Miller, R. R. (2010). Integration of spatialrelationships and temporal relationships in humans. Learning &Behavior, 38, 27–34.
Nelson, J. B., & Sanjuan, M. C. (2008). Flattening generalizationgradients, context, and perceptual learning. Learning & Behavior,36, 279–289.
Nelson, J. B., Sanjuan, M. C., Vadillo-Ruiz, S., & Perez, J. (2011).Experimental renewal in human participants. Journal of Experi-mental Psychology: Animal Behavior Processes, 37, 58–70.
Newman, E. L., Caplan, J. B., Kirschen, M. P., Korolev, I. O., Sekuler,R., & Kahana, M. J. (2007). Learning your way around town:How virtual taxicab drivers learn to use both layout and landmarkinformation. Cognition, 104, 231–253.
Ozubko, J. D., & Joordens, S. (2008). Super memory bros.: Goingfrom mirror patterns to concordant patterns via similarityenhancements. Memory & Cognition, 36, 1391–1402.
Paredes-Olay, C., Abad, M. J., Gamez, M., & Rosas, J. M. (2002).Transfer of control between causal predictive judgments and instru-mental responding. Animal Learning & Behavior, 30, 239–248.
Ploog, B. O., Banerjee, S., & Brooks, P. J. (2009). Attention to prosody(intonation) and content in children with autism and in typical
Behav Res (2013) 45:301–318 317

children using spoken sentences in a computer game. Research inAutism Spectrum Disorders, 3, 743–758.
Price, H. L., & Connolly, D. A. (2006). BatMon II: Children’s categorynorms for 33 categories. Behavior Research Methods, 38, 529–531.
Rabbitt, P., Banerji, N., & Szymanski, A. (1989). Space Fortress as an IQtest? Predictions of learning and of practised performance in acomplex interactive video–game. Acta Psychologica, 71, 243–257.
Radvansky, G. A., & Copeland, D. E. (2006). Walking through door-ways causes forgetting: Situation models and experienced space.Memory & Cognition, 34, 1150–1156.
Raftery, A. E. (1995). Bayesian model selection in social research. In P.V. Marsden (Ed.), Sociological methodology (pp. 111–196). Cam-bridge: Blackwells.
Raijmakers, M. E. J., Dolan, C. V., & Molenaar, P. C. M. (2001). Finitemixture distribution models of simple discrimination learning.Memory & Cognition, 29, 659–677.
Ratcliff, R., & Rouder, J. N. (1998). Modeling response times for two–choice decisions. Psychological Science, 9, 347–356.
Rouder, J. N., & Morey, R. D. (2011). A Bayes factor meta–analysis ofBem’s ESP claim. Psychonomic Bulletin & Review, 18, 682–689.
Rouder, J. N., Speckman, P. L., Sun, D., Morey, R. D., & Iverson, G.(2009). Bayesian t–tests for accepting and rejecting the nullhypothesis. Psychonomic Bulletin & Review, 16, 225–237.
Salas, E., & Cannon-Bowers, J. A. (2001). The science of training: Adecade of progress. Annual Review of Psychology, 52, 471–499.
Sallas, B., Mathews, R. C., Lane, S. M., & Sun, R. (2007). Developingrich and quickly accessed knowledge of an artificial grammar.Memory & Cognition, 35, 2118–2133.
Salthouse, T. A., & Prill, K. (1983). Analysis of a perceptual skill.Journal of Experimental Psychology: Human Perception andPerformance, 9, 607–621.
Sanborn, A. N., Griffiths, T. L., Navarro, D. J. (2006). A more rationalmodel of categorisation. In R. Sun, N. Miyake (eds), Proceedingsof the 28th Annual Conference of the Cognitive Science Society.
Schonfeld, E. (2010). SCVNGR’s secret game mechanics playdeck.Tech Crunch, Retrieved August 14, 2012, from http://techcrunch.com/2010/08/25/scvngr-game-mechanics/
Shebilske, W. L., Goettl, B. P., Corrington, K., & Day, E. A. (1999).Interlesson spacing and task-related processing during complex skillacquisition. Journal of Experimental Psychology: Applied, 5, 413–437.
Spencer, J. P., & Hund, A. M. (2002). Prototypes and particulars:Geometric and experience–dependent spatial categories. Journalof Experimental Psychology: General, 131, 16–37.
Spencer, J. P., & Hund, A. M. (2003). Developmental continuity in theprocesses that underlie spatial recall. Cognitive Psychology, 47,432–480.
Stephen, D. G., Boncoddo, R. A., Magnuson, J. S., & Dixon, J. A.(2009). The dynamics of insight: Mathematical discovery as aphase transition. Memory & Cognition, 37, 1132–1149.
Stevenson, R. J., Sundqvist, N., & Mahmut, M. (2007). Age–relatedchanges in discrimination of unfamiliar odors. Perception &Psychophysics, 69, 185–192.
Stokes, P. D., & Balsam, P. (2001). An optimal period for settingsustained variability levels. Psychonomic Bulletin & Review, 8,177–184.
Stokes, P. D., & Harrison, H. M. (2002). Constraints have differentconcurrent effects and aftereffects on variability. Journal of Ex-perimental Psychology: General, 131, 552–566.
Talvitie, E., Singh, S. (2009). Simple local models for complex dy-namical systems. In D. Koller, D. Schuurmans, Y. Bengio, L.Bottou (eds), Advances in Neural Information Processing Systems21 (1617–1624).
Thibaut, J.-P., French, R., & Vezneva, M. (2010). Cognitive load andsemantic analogies: Searching semantic space. Psychonomic Bul-letin & Review, 17, 569–574.
Toppino, T. C., Fearnow-Kenney, M. D., Kiepert, M. H., & Teremula,A. C. (2009). The spacing effect in intentional and incidental freerecall by children and adults: Limits on the automaticity hypoth-esis. Memory & Cognition, 37, 316–325.
Usher, M., & McClelland, J. L. (2001). On the time course of percep-tual choice: The leaky competing accumulator model. Psycholog-ical Review, 108, 550–592.
van der Linden, D., & Eling, P. (2006). Mental fatigue disturbs localprocessing more than global processing. Psychological Research,70, 395–402.
Vul, E., Frank, M. C., Alvarez, G. A., Tenenbaum, J. B. (2010). Explain-ing human multiple object tracking as resource-constrained approx-imate inference in a dynamic probabilistic model. In Y. Bengio, D.Schuurmans, J. Lafferty, C. K. I. Williams, A. Culotta (eds), Advan-ces in Neural Information Processing Systems 22 (1955–1963).
Wade, T., & Holt, L. L. (2005). Incidental categorization of spectrallycomplex non–invariant auditory stimuli in a computer game task.Journal of the Acoustical Society of America, 118, 2618–2633.
Washburn, D. A. (2003). The games psychologists play (and the datathey provide). Behavior Research Methods, Instruments, & Com-puters, 35, 185–193.
Washburn, D. A., & Gulledge, J. P. (1995). Game–like tasks forcomparative research: Leveling the playing field. Behavior Re-search Methods, Instruments, & Computers, 27, 235–238.
Wasserman, E. A., & Castro, L. (2005). Surprise and change: Varia-tions in the strength of present and absent cues in causal learning.Learning & Behavior, 33, 131–146.
Weidemann, C. T., Mollison, M. V., & Kahana, M. J. (2009). Electro-physiological correlates of high–level perception during spatialnavigation. Psychonomic Bulletin & Review, 16, 313–319.
Williams, K. D., & Jarvis, B. (2006). Cyberball: A program for use inresearch on interpersonal ostracism and acceptance. BehaviorResearch Methods, 38, 174–180.
Williams, P., Nesbitt, K., Eidels, A., Elliott, D. (2011). Balancing riskand reward to develop an optimal hot hand game. Game Studies,11, online.
Wilson, K. A., Bedwell, W. L., Lazzara, E. H., Salas, E., Burke, C. S.,Estock, J. L.,…, Conkey, C. (2009). Relationships between gameattributes and learning outcomes. Simulation & Gaming, 40, 217–266.
Wood, R. T. A., Griffiths, M. D., Chappell, D., & Davies, M. N. O.(2004). The structural characteristics of video games: A psycho-structural analysis. Cyberpsychology & Behavior, 7, 1–10.
Yi, S. K. M., Steyvers, M., & Lee, M. (2009). Modeling humanperformance in restless bandits with particle filters. Journal ofProblem Solving, 2, 81–101.
Yildirim, S., Narayanan, S., & Potamianos, A. (2011). Detecting emo-tional state of a child in a conversational computer game. Com-puter Speech and Language, 25, 29–44.
Yuzawa, M. (2001). Effects of word length on young children’s mem-ory performance. Memory & Cognition, 29, 557–564.
318 Behav Res (2013) 45:301–318