Embed Size (px)
Citation preview

Gambia’s Second National Communication
2
The Gambia’s Second National
Communication under the United
Nations Framework Convention on
Climate Change
Banjul
November 2012

Gambia’s Second National Communication
3
CONTENTS
ACRONYMS ................................................................................................................................. 7
LIST OF TABLES AND FIGURES .................................................................................................. 9
FOREWORD .............................................................................................................................. 11
EXECUTIVE SUMMARY ………………………………………………………………………………………………………. 11
1. INTRODUCTION AND CONTEXT............................................................................................ 30
2. NATIONAL CIRCUMSTANCES ............................................................................................... 32
2.1. Geography, climate and demography ................................................................................ 32
2.1.1. Location ................................................................................................................... 32
2.1.2. Climate .................................................................................................................... 32
2.1.3. Population ................................................................................................................ 33
2.2. Government .................................................................................................................... 33
2.3. Economy ......................................................................................................................... 33
2.3.1. Analysis of General Country Situation ......................................................................... 33
2.3.2. Sectoral performance ................................................................................................ 34
2.3.3. Economic policies and trends ..................................................................................... 35
2.4. Social development .......................................................................................................... 36
2.4.1. Human development and poverty ............................................................................... 36
2.5. Sectoral trends, policies and initiatives ............................................................................... 38
2.5.1. Agriculture ................................................................................................................ 38
2.5.2. Health ...................................................................................................................... 38
2.5.3. Education ................................................................................................................. 39
2.5.4. Energy ..................................................................................................................... 39
2.5.5. Tourism .................................................................................................................... 40
2.5.6. Fisheries .................................................................................................................. 40
2.5.7. Industry .................................................................................................................... 40
2.5.8. Trade ....................................................................................................................... 41
2.5.9. Forests and Forestry ................................................................................................. 41
2.5.10. Water Resources .................................................................................................... 41
2.5.11. Biodiversity and Wildlife ........................................................................................... 41
2.5.12. Waste Management ................................................................................................ 42
2.5.13. Land Transport ....................................................................................................... 42

Gambia’s Second National Communication
4
2.5.14. Maritime Transport .................................................................................................. 42
2.5.15. Air Transport ........................................................................................................... 42
3. NATIONAL GREENHOUSE GAS INVENTORY ......................................................................... 43
3.1 Sectoral Contribution by Gas .............................................................................................. 43
3.2 Sectoral emissions of greenhouse gases ............................................................................. 43
3.2.1. Energy ..................................................................................................................... 43
3.2.2. Industrial Processes .................................................................................................. 44
3.2.3. Agriculture ................................................................................................................ 44
3.2.4. Land use change and forestry .................................................................................... 44
3.2.5. Waste ...................................................................................................................... 44
4. GREENHOUSE GAS MITIGATION ASSESSMENT ................................................................... 48
4.1. Energy sector .................................................................................................................. 48
4.1.1. Mitigation Scenario 1 : energy efficiency ...................................................................... 48
4.1.2. Mitigation Scenario 2 : improved cooking stoves .......................................................... 48
4.1.3. Mitigation Scenario 3 : LPG ........................................................................................ 48
4.1.4. Results: Mitigation Scenarios vs. Reference Scenario .................................................. 48
4.1.5. Energy balance ......................................................................................................... 49
4.1.6. Emissions ................................................................................................................. 50
5. VULNERABILITY AND ADAPTATION ASSESSMENT ............................................................... 52
5.1. Past and current climate ................................................................................................... 52
5.2. Climate change scenarios ................................................................................................. 53
5.2.1. Temperature ............................................................................................................. 53
5.2.2. Rainfall ..................................................................................................................... 57
5.2.3. Potential Evapotranspiration ....................................................................................... 59
5.3. Impacts on natural resources ............................................................................................. 61
5.3.1. Forests ..................................................................................................................... 61
5.3.2. Rangelands ............................................................................................................... 63
5.4. Impacts on vulnerable sectors and regions .......................................................................... 67
5.4.1. Health ....................................................................................................................... 67
5.4.2. Agriculture ................................................................................................................. 68
5.4.3. Fisheries .................................................................................................................. 72
5.4.4. Coastal zone ............................................................................................................ 77
5.5. Adaptation to climate change ............................................................................................. 80
5.5.1. Forestry ................................................................................................................... 80

Gambia’s Second National Communication
5
5.5.2. Rangelands .............................................................................................................. 81
5.5.3. Health ...................................................................................................................... 81
5.5.4. Agriculture ................................................................................................................. 82
5.5.5. Fisheries ................................................................................................................. 83
5.5.6. Coastal Zone ............................................................................................................. 84
6. TECHNOLOGY TRANSFER ................................................................................................... 86
6.1. Existing Technologies ...................................................................................................... 86
6.1.1. Energy ...................................................................................................................... 86
6.1.2. Agriculture and Natural Resources ............................................................................. 86
6.1.3. Waste Management .................................................................................................. 86
6.1.4. Coastal Zone ............................................................................................................ 87
6.2. Priority mitigation technologies .......................................................................................... 87
6.2.1. Energy sector ........................................................................................................... 87
6.3. Priority adaptation technologies ......................................................................................... 88
6.3.1. Agriculture and food security ...................................................................................... 88
6.3.2. Food processing and preservation techniques and technologies .................................... 88
6.3.3. Fisheries .................................................................................................................. 88
6.3.4. Coastal protection ..................................................................................................... 89
7. RESEARCH AND SYSTEMATIC OBSERVATIONS ................................................................... 90
7.1. National framework for research and systematic observations .............................................. 90
7.2. Research ........................................................................................................................ 90
7.2.1. Focal areas ............................................................................................................... 90
7.2.2. Capacity .................................................................................................................... 90
7.2.3. International cooperation ............................................................................................ 91
7.3. Systematic observations .................................................................................................... 91
7.3.1 Networks .................................................................................................................... 91
7.3.2. Data exchange with global partners ............................................................................. 92
7.3.3. Dissemination and impact of information ...................................................................... 93
7.4. Needs and priorities .......................................................................................................... 93
7.4.1. Critical infrastructure .................................................................................................. 93
7.4.2. Human resources ....................................................................................................... 95
7.4.3. Investments ............................................................................................................... 95
7.4.4. Strategic framework ................................................................................................... 95
8. EDUCATION TRAINING AND PUBLIC AWARENESS ............................................................... 96

Gambia’s Second National Communication
6
8.1. Education ......................................................................................................................... 96
8.1.1. Formal education ....................................................................................................... 96
8.1.2. Non-formal education ................................................................................................. 96
8.2. Training ........................................................................................................................... 96
8.3. Public awareness ............................................................................................................. 97
9. CAPACITY BUILDING ............................................................................................................ 98
9.1. Stock-taking ..................................................................................................................... 98
9.2. Capacity building needs .................................................................................................... 99
9.2.1. Implementation of the UNFCCC in The Gambia ........................................................... 99
9.2.2. Education, training and public awareness ................................................................... 100
9.2.3. Synergies at different capacity building levels ............................................................ 100
10. NETWORKING, KNOWLEDGE AND INFORMATION-SHARING ............................................ 102
10.1. Introduction ................................................................................................................. 102
10.2. Climate Change knowledge and information sharing in The Gambia ................................. 102
10.3. Climate Change Networks ............................................................................................ 104
10.3.1. AfricaAdapt‟s knowledge sharing Network ............................................................... 104
10.3.2. GenderCC platform and GenderCC – Women for Climate Justice .............................. 104
10.3.3. Community Based Adaptation Network and Sharing ................................................. 104
10.3.4. Volunteer Communities & ICTs ............................................................................... 105
10.3.5. The Southeast Asia Climate Change Network (SEAN-CC) ........................................ 105
10.3.6. The Communication for Development (C4D) Network ............................................... 105
10.3.7. Climate Change Information Network - CC:iNet ........................................................ 105
11. CONSTRAINTS AND GAPS RELATED TO FINANCIAL AND TECHNICAL CAPACITY NEEDS 106
11.1. Data capture, analysis and modelling ............................................................................. 106
11.1.1. Research and systematic observations.................................................................... 106
11.1.2. Greenhouse gas inventory ..................................................................................... 106
11.1.3. Mitigation assessment ............................................................................................ 106
11.1.4. Vulnerability and adaptation assessment .................................................................. 107
11.2. Climate change management ........................................................................................ 107
11.2.1. Networking ............................................................................................................ 107
11.2.2. Capacity building ................................................................................................... 107
11.2.3. Education and public awareness ............................................................................. 108
12. CONCLUSIONS AND RECOMMENDATIONS ...................................................................... 109
BIBLIOGRAPHY ....................................................................................................................... 111

Gambia’s Second National Communication
7
ACRONYMS
ACMAD African Centre for Meteorological Applications and Development
AfDB African Development Bank
CBG Central Bank of The Gambia
CFLs Compact fluorescent lamps
CILSS Comité Inter-état de Lutte contre la Sécheresse au Sahel
DOA Department of Agriculture
DOP Department of Planning
DWR Department of Water Resources
ECBI European Capacity Building Initiative
EDF European Development Fund
EEZ Exclusive economic zone
ERP Economic recovery programme
EU European Union
FAO Food and Agriculture Organisation
GBoS Gambia Bureau of Statistics
GCM General circulation model
GDP Gross domestic product
GEF Global Environment Facility
IDA International Development Agency
IEA International Energy Agency
IMF International Monetary Fund
IMO international Maritime Organisation
IPCC Intergovernmental Panel on Climate Change
LDCs Least Developed Countries
LPG Liquefied petroleum gas
MOA Ministry of Agriculture
MOFEN Ministry of Forestry and the Environment
MOFWRNAM Ministry of Fisheries, Water Resources and National Assembly Matters

Gambia’s Second National Communication
8
MOHSW Ministry of Health and Social Welfare
MSY Maximum sustainable yield
NAMAs Nationally Appropriate Mitigation Actions
NARI National Agricultural Research Institute
NATCOMs National Communications
NEA National Environment Agency
NMHS National Meteorological and Hydrological Services
NORAD Norwegian Agency for Development Cooperation
OECD Organisation for Economic Cooperation and Development
OMVG Organisation pour la Mise en Valeur du fleuve Gambie
PAGE Programme for Accelerated Growth and Employment
PRSP Poverty Reduction Strategy Paper
RAC Regional Agrhymet Centre
SRFC Sub-regional fisheries commission
TOE Tonnes of oil equivalent
UNCDF United Nations Capital Development Fund
UNDP United Nations Development Programme
UNFCCC United Nations Framework Convention on Climate Change
UNICEF United Nations Children‟s Fund
WMO World Meteorological Organisation

Gambia’s Second National Communication
9
LIST OF TABLES AND FIGURES
TABLES
Table 2.1: Gambia‟s human development index in 2011 ................................................................ 36
Table 3.1: Greenhouse gas emissions inventory of The Gambia for the year 2000 ........................... 45
Table 3.2: Greenhouse gas removals inventory for the year 2000 ................................................... 46
Table 4.1: Cumulative impact of mitigation measures on GHG emissions ........................................ 51
Table 5.1: Selection of historical climate statistics of The Gambia ................................................... 52
Table 5.2: Comparison of model performance ............................................................................... 53
Table 5.3: Projected change in mean temperature (ΔT) – CCC199 ................................................. 54
Table 5.4: Baseline and CCC199 projections of mean temperature of The Gambia .......................... 54
Table 5.5: Projected change in mean temperature (ΔT) - BMRC98 GCM ......................................... 55
Table 5.6: Baseline and BMRC98 GCM projections of mean temperature of The Gambia ................. 55
Table 5.7: Projected change in temperature (ΔT) - GFDL90 GCM ................................................... 56
Table 5.8: Baseline and GFDL90 GCM projections of mean temperature of The Gambia .................. 56
Table 5.9: Absolute and percentage difference between CCC199, BMRC98 and GFDL90 GCM projections and
historical rainfall .......................................................................................................................... 57
Table 5.10: Percentage difference between CCC199, BMRC98 and GFDL90 GCM projections and historical
potential evapotranspiration ......................................................................................................... 59
Table 5.11: Annual productivity (kg/km) of the River Gambia and variation (%) with respect to productivity of 18.9
* 106 kg/km under current climate ................................................................................................. 73
Table 5.12: CCC199 simulations of MSY in relation to temperature, total dissolved solids (TDS), concentration
(CON) and alkalinity (ALK) of waters of the River Gambia averaging 15 metres deep. ....................... 74
Table 5.13: BMRC98 simulations of MSY in relation to temperature, total dissolved solids (TDS), concentration
(CON) and alkalinity (ALK) of waters of the River Gambia averaging 15 metres deep. ....................... 74
Table 5.14: GDFL90 simulations of MSY in relation to temperature, total dissolved solids (TDS), concentration
(CON) and alkalinity (ALK) of waters of the River Gambia averaging 15 metres deep. ....................... 75
Table 5.15: SCSY computations for different GCMs and percentage variation with respect to SCSY under
current conditions ........................................................................................................................ 76
Table 5.16: Evolution of shoreline at selected locations along the Gambian coastline, between 2003 and 2010.
All distances are measured from established reference points to the high water mark (Source: NEA archives)
................................................................................................................................................. 78
Table 9.1: Characterisation and prioritisation of capacity constraints ............................................... 97
Table 9.2: Action required under thematic areas of the UNFCCC .................................................... 98
Table 9.3: Identifying Capacity Constraints and Opportunities for Integrated Capacity Building ........ 100

Gambia’s Second National Communication
10
FIGURES
Figure 2.1: Location map of The Gambia ............................................................................................. 32
Figure 2.2: Contribution to the GDP by: a) main economic sectors ........................................................ 35
Figure 2.3: Trends in Gambia‟s human development index from 1975 to 2011 ....................................... 37
Figure 2.4: Component HDI indices for The Gambia ............................................................................ 37
Figure 4.1: Reductions in primary energy consumption under different mitigation scenarios ..................... 49
Figure 4.2: Energy Balance by 2030 under the Reference Scenario ....................................................... 50
Figure 4.3: CO2 emissions from biogenic sources for all energy activities ............................................... 50
Figure 4.4: Non biogenic CO2 emissions from all energy activities ......................................................... 51
Figure 5.1: Mean temperature projections for The Gambia using three GCMs ......................................... 57
Figure 5. 2: Trends of CCC199 projected mean monthly rainfall............................................................. 58
Figure 5.3: Trends of BMRC98 projected mean monthly rainfall. ............................................................ 58
Figure 5.4: Trends of GDFL90 projected mean monthly rainfall. ............................................................. 59
Figure 5.5: Potential evapotranspiration projections from three GCMs. ................................................... 59
Figure 5.6: The Holdridge Life Zone Classification model. ..................................................................... 61
Figure 5.7: Simulated biomass production in forest stand. ..................................................................... 62
Figure 5.8: Simulations of basal area of forest stand ............................................................................. 62
Figure 5.9: Projected above-ground biomass production in the Dankunku rangelands............................. 64
Figure 5.10: Projected below-ground biomass production in the Dankunku rangelands ........................... 64
Figure 5.11: Projected biomass litter production in the Dankunku rangelands. ........................................ 65
Figure 5.12: Projections of total biomass production in the Dankunku rangelands ................................... 65
Figure 5.13: Projections of organic matter content in soil at the Dankunku rangelands ............................. 66
Figure 5.14: Effect of moisture decomposition index in soil the Dankunku rangelands .............................. 66
Figure 5.15: Contribution of individual crops to total food crop production in 2010.................................... 68
Figure 5.16: Food crop production from 2007 to 2010 .......................................................................... 68
Figure 5.17: Simulated grain dry weight of irrigated rice at Kuntaur (The Gambia) ................................... 69
Figure 5.18: Simulated leaf dry weight of irrigated rice at Kuntaur (The Gambia) ..................................... 71
Figure 5.19: Simulated stem dry weight of irrigated rice at Kuntaur (The Gambia) ................................... 71
Figure 5.20: Simulated cumulative nitrogen uptake of irrigated rice at Kuntaur (The Gambia) ................... 72
Figure 5.21: Maximum sustainable fisheries yield in River Gambia ......................................................... 73
Figure 5.22: Projection of maximum sustainable yield relative to changes in selected environmental variables for an
average water depth of 15 metres. ....................................................................................................... 75
Figure 5. 23: Projections of natural fish mortality due to temperature changes ......................................... 76
Figure 5.24: Projections of stabilised commercial shrimp yield under different GCMs .............................. 77
Figure 5.25: Seafront of Kairaba and Senegambia hotels ...................................................................... 78
Figure 5.26: Aerial view of Kairaba and Senegambia seafront after completion of beach nourishment project78
Figure 5.27: Seafront of Kairaba and Senegambia hotels. ..................................................................... 78
Figure 5.28: Tilapia, a commonly farmed fish due to its adaptability ....................................................... 84
Figure 7.1: Existing meteorological network and proposed location of new stations ................................ 93
Figure 7.2: Existing surface water level network with significant to dominant fluvial component during part of the year
and proposed location of new stations ................................................................................................. 93
Figure 7.3: Existing groundwater level network and proposed location of new stations ............................ 93
Figure 7.4: Existing tidal water level network and proposed location of new stations ............................... 94

Gambia’s Second National Communication
11
On behalf of the Government of the Republic of The
Gambia, it is an honour and privilege to present The
Gambia's Second National Communication to the
Conference of the Parties to the United Nations
Framework Convention on Climate Change.
The Gambia ratified the United Nations Framework
Convention on Climate Change (UNFCCC) in 1994 and
became obligated to submit national communications
as per requirement of the UNFCCC.
The Initial National Communication (INC) of The
Gambia was presented to the UNFCCC in 2003.
FOREWORD
The Second National Communication (SNC) is a follow up to the INC. Thus, the SNC built on and continued the
work under the Convention. Since the submission of the INC, much has happened. The Gambia has completed
its National Adaptation Programme of Action (NAPA), Nationally Appropriate Mitigation Actions (NAMA)
document and established a National Designated Authority (DNA) Office for Clean Development Mechanism
(CDM) projects. The Gambia has conducted and completed assessments on investment and financial flows
(I&FF) to address climate change in the water, energy, forestry and agriculture sectors. Apart from financial
aspects, these assessments also helped spotlight national policy implications for addressing climate change in
the country.
The Second National Communications of The Gambia under the UNFCCC provides a quantitative assessment
of greenhouse gas emissions from the major economic sectors and activities of the country, develops plausible
climate change scenarios for assessment of the potential impacts of the projected climate change on some key
sectors of the national economy. The potential impacts of climate change on crop production, forestry, fisheries,
and rangelands and livestock have been assessed in great detail. As was the case however with the INC,
detailed cost-benefit analyses of mitigation and adaptation measures are omitted due to inadequate capacity.
Notwithstanding, adaptation is not an option but is a necessity for The Gambia in view of its economic and social
vulnerability to climate change. There is also an urgent need to strengthen institutional and the human resources
base of the country to bring about effective implementation of adaptation policies and measures. The Gambia
has mitigation potential in some sectors like energy and waste but funding remains the limiting factor for
exploring such opportunities. Despite these limiting constraints, the Gambia is committed more than ever to
participating in different regional and international activities on climate change.
Hon. Fatou Ndeye Gaye, Minister
Ministry of Forestry and the Environment
Banjul, The Gambia
Gambia’s Second National Communication
12
ACKNOWLEDGEMENT
facilitate adequate adaptation to climate change (general description of steps taken or envisaged by the Party to implement the Convention); and any other information that the Party considers relevant to the achievement of the objective of the Convention.
The structure of the Communication is based on the Guidelines for preparation of National Communications from Parties not included in Annex I to the Convention (Decision 17/CP.8).
This Second National Communication (SNC) is presented by the SNC Project Team, managed and supervised by Mr. Pa Ousman Jarju (UNFCCC Focal Point), in the Department of Water Resources of the Ministry of Fisheries and Water Resources (MoFWR) and Mr. Lamin Nyabally and Kebba Sonko former Permanent Secretaries of the Ministry of Forestry and the Environment. It is based on contributions from the NCC Technical Working Groups.
The consolidation of the various Thematic Working Groups reports and language editing was done by Dr. Momdou Njie in close collaboration with the UNFCCC Focal Point. Valuable inputs were provided by stakeholders consulted through workshops and meetings and they are acknowledged as well. The SNC Project was financed through the Global Environmental Fund (GEF), the financial Entity of the UNFCCC. The United Nations Environment Programme (UNEP), as the GEF financial agent, through their Nairobi Office provided oversight management of the project while the implementation was through the Ministry of Forestry and the Environment. The Department of Water Resources (DWR) under the Ministry of Fisheries and Water Resources (MoFWR) was the executing agency.
Special appreciation goes to Mrs Amie Jarra former Coordinator of SNC, Mr. Lamin Mai Touray current SNC Coordinator, the Technical Working Groups, development partners as well as everyone who contributed in one way or another in the preparation of the Second National Communication.
------------------------------------------------------------------------ Pa Ousman Jarju
Director and UNFCCC Focal Point Department of Water Resource
Banjul, The Gambia
Gambia‟s Second National Communication to the United Nations Framework Convention on Climate Change has been prepared in accordance with Article 4, paragraph 1, and Article 12, paragraph 1, of the United Nations Framework Convention on Climate Change (UNFCCC), which calls for each Party to report to the Conference of Parties (COP) information on its emissions by sources and removals by sinks of all greenhouse gases not controlled by the Montreal Protocol (Greenhouse Gas Inventories); national or, where appropriate, regional programmes containing measures to mitigate, and to

Gambia’s Second National Communication
13
Executive Summary
Background and context The Republic of The Gambia ratified the United Nations Framework Convention on Climate Change (UNFCCC) in 1994 committing the country to the adoption and implementation of policies and measures mitigating the causes of climate change and adapting to its adverse effects. This Second National Communication (SNC), prepared and submitted in fulfilment of Articles 4 and 12 of the UNFCCC follows and builds on the Initial National Communication (INC) submitted in 2003. Similarly, its preparation follows the UNFCCC guidelines and includes information on The Gambia‟s greenhouse gas inventory for the year 2000, a discussion of measures to mitigate emissions in the energy sector, vulnerability and promising adaptation measures in key socioeconomic sectors as well as other activities contributing to building resilience to climate change.
National circumstances
Geography, climate, demography
The Gambia is the smallest country on the African continent. It has a total area of about 11,300 km2 of which 10,000 km2 is land and 1,300 km2 is open water. Maritime claims include a contiguous zone of 18 nautical miles and an exclusive economic zone (EEZ) of 200 nautical miles. The country has a total land boundary of 740 km, all of which is shared with the Republic of Senegal. On its western boundary, the country has an open coastline 80 km long measured across the 11 km-wide mouth of the River Gambia estuary. The Gambia sits on the flood plain of the Gambia River and is flanked by savannah and low hills. The highest elevation is 53 metres above sea level.
The country has a Sahelian climate, characterised by a long dry season (November to May the following year) and a short wet season (June to October). Average temperatures of The Gambia range from 18° to 30°C during the dry season and 23° to 33°C during the wet season. Temperature measurements since the 1940s reveal a rising trend in the order of 0.5°C/decade.
The Gambia‟s population in 2011 was estimated at 1.8 million and projected to increase by 2.7% per annum between 2010 and 2015 (UNDP, 2011). About 59% of the total population lives in urban and periurban areas of the country. The challenge lies in the fact that the population of the country would double every 16 years, exerting enormous pressure on the country‟s environment and natural resources, resulting in commonplace environmental problems such as soil degradation, poor sanitation, loss of forest cover and biodiversity.
Economic profile
The Gambia has a liberal, market-based economy characterised by traditional subsistence agriculture, a historic reliance on groundnuts (peanuts) for export earnings, a re-export trade built around Banjul port, low import duties, minimal administrative procedures, a fluctuating exchange rate with no exchange controls, and a vibrant tourism industry. However, the real economy‟s heavy reliance on agriculture, dominated by groundnut production, exposes the economy to extreme weather and price volatility in international commodity markets trading in these products.
In 2010, GDP was estimated at US$1,040 billion with a real GDP growth rate of 6.1%. Per capita GDP and GNP in the same year were US$556 and US$605, respectively (CBG Annual Report 2010, CBG MPC Press Release May 2012).

Gambia’s Second National Communication
14
Major exportable items include fish, peanuts, and cotton. Major export destinations include Hong Kong, France, Spain and the United Kingdom. Key imports comprise of food, fuel and machinery. For imports, The Gambia depends upon the countries such as France, Senegal, China and Netherlands (Economy Watch, 2010 Export and Import of Gambia, Gambia Foreign Trade. www.economywatch.com/world_economy/gambia/). The country has experienced both balance of trade and balance of payment deficits for several years. The provisional balance of payments in 2010 indicate an overall deficit of US$25.27 million compared to the revised surplus of US$54.6 million recorded in 2009. As at end-March 2012, the Gambia‟s gross international reserves totaled US$182.0 million, equivalent to 5.0 months of import cover. The volume of transactions in the foreign exchange market, measured by aggregate purchases and sales, dropped to US$1.45 billion at the end of April 2012, down from US$1.59 billion, a year earlier. The services sector, accounting for 58% of economic output, continues to drive the economy, followed by agriculture (30%) and industry (12%) respectively. Between 2008 and 2010, agricultural production improved significantly with growth averaging 18.1%. Crop production, the main driver of agricultural activity with 62% of sectoral output, recorded an increase of 14.3% in 2010. The livestock sub-sector, contributing 30.7% to agricultural output, also grew by 10.9%. Growth in industrial output was supported by expansion in mining and quarrying (14.2%) and utilities (7.8%). Output from the manufacturing sector increased slightly by 0.5% in the context of two consecutive years of negative growth, and structural constraints such as inadequate electricity supplies, weak technology and infrastructure, small domestic markets and a small skilled labour force.
The services sector recorded significantly lower growth of 2.4% in 2010 compared to 6.6% in 2009. This turn of events reflects contractions in output from trade and hotels of in the order of 0.4% and 35.7% respectively, lower growth in financial services (10.5% in 2010 compared to 27.9% in 2009) and public administration (7.3% in 2010 compared to 15.0% in 2009).
Social development
The Gambia is classified as one of the Least Developed Countries (LDCs) in the world. According to the UNDP‟s Human Development Report for the year 2011, the country‟s Human Development Index (HDI) score of 0.420 ranks it at 168 out of 187 countries. This is a significant improvement compared to a decade earlier (HDI = 0.343 in 2000). Over the same period however, the average annual improvement in the HDI score was lower than the average for sub-Saharan Africa. A reverse is also noted in increasing life expectancy trends between 2003 and 2011. The 2011 HDR also finds that one in three Gambians subsist on a purchasing power parity-adjusted per capita income of less than US$1.25/day. Overall index computations put population below the national poverty line at 61% in 2010 and 58% in 2011. For both years, the proportion of people considered multi-dimensionally poor is higher in rural areas. Regarding gender-disaggregated statistics, the gender development index (GHDR) was 0.610, conferring a ranking of 127 out of 187 countries.
Sectoral trends, policies and initiatives
The government of The Gambia is committed to reducing poverty and improving the well-being of citizens. This commitment is set out in its long-term strategy, Vision 2020, implemented through a series of medium-term development plans. The most recent among these, dubbed the Programme for Accelerated Growth and Employment (PAGE), sets out the country‟s development strategy and investment programme for 2012 to 2015. The PAGE (2012-2015) which draws on lessons learnt from previous poverty reduction strategies and is fully aligned with the Millennium Development Goals (MDGs) and climate change issues and risks have been fully integrated in it.

Gambia’s Second National Communication
15
Agriculture Agriculture, the second largest sector in the economy, accounts for about 30.0% of the country‟s GDP. It employs 44% of the work force, provides an estimated two-thirds of households‟ income and dominates exports of primary products. The government‟s vision for the agriculture sector is to transform The Gambia into a major supplier of agricultural products to local and international markets between 2012 and 2015. To achieve this vision, the Government intends to pursue three courses of action:
(i) increase food security and boost the income-generating capacity and nutritional status of farmers, especially women and youth;
(ii) transform the agricultural sector from a traditional subsistence economy to a modern market-oriented commercial sector; and
(iii) Increase and sustain agricultural production and productivity through year-round irrigation.
The Gambia‟s Agriculture and Natural Resources (ANR) Policy and National Agricultural Investment Programme (GNAIP) combine policy, institutional, infrastructure and technology-related measures to address the multiplicity of supply-side constraints holding back Gambian agriculture. The overall objective of the ANR/GNAIP is to increase the agricultural sector‟s contribution to the national economy by increasing productivity through commercialisation and greater private sector participation predicated on a sound macroeconomic framework aimed at enhanced growth and employment creation.
Health The Gambia has a comprehensive policy framework for addressing development issues in the social sectors of health, among others. Access to basic health services is generally good, although there are still some pockets with poor access in rural areas. Childhood immunisation coverage was higher than 90% in 2010. Under-five and infant mortality rates have also declined over the past 30 years from 320 and 217 per thousand live births respectively, to recent estimates of 109 and 81 per 1000 live births respectively. These gains in reducing infant mortality and concomitant increase in immunisation rates are attributed to the expansion and improvement of primary healthcare and social services, including the provision of safe drinking water.
Education Over the years, the government has adopted policies that provide the backdrop for the education sector development programme (2006 – 2015). The basic aims of national education policy inter alia, are as follows:
1. promote a broad-based education curriculum at the basic level for lifelong learning and training; 2. mainstream gender in the creation of opportunities for all to acquire literacy, livelihood skills
and the utilisation of these skills in order to earn a living and become economically self-reliant members of the community; and
3. develop the physical and mental skills which will contribute to nation-building – economically, socially and culturally in a sustainable environment.
Pursuant to the objectives of the education sector policy, The Gambia is on course to meet its national target of a 50% reduction in illiteracy rates by 2015. Current trends also suggest that The Gambia will attain primary school enrolment targets, although completion rates need to be increased. Primary enrolment increased from 60% in 2001/02 to 77% in 2008/09. The reasons for increases in enrolment, especially for girls, include full scholarships, interventions by NGOs and the fact that over 200 schools have been built around the country over the past 10 years.
Gambia’s Second National Communication
16
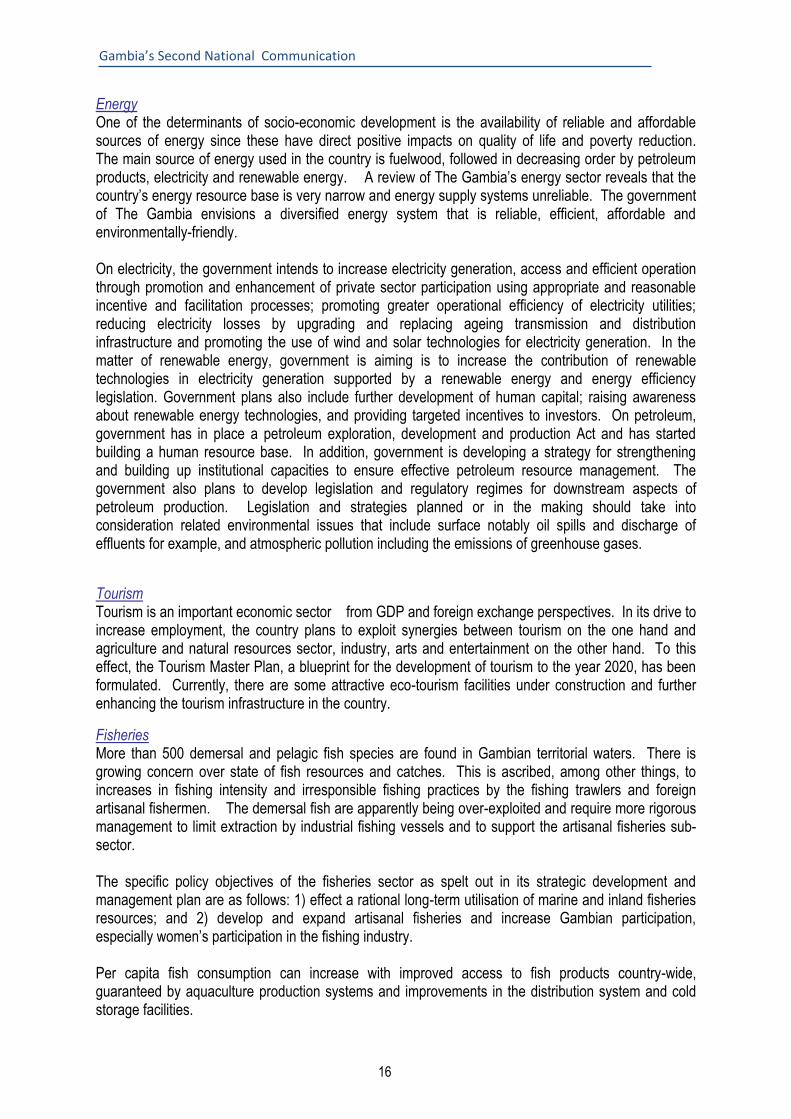
Energy One of the determinants of socio-economic development is the availability of reliable and affordable sources of energy since these have direct positive impacts on quality of life and poverty reduction. The main source of energy used in the country is fuelwood, followed in decreasing order by petroleum products, electricity and renewable energy. A review of The Gambia‟s energy sector reveals that the country‟s energy resource base is very narrow and energy supply systems unreliable. The government of The Gambia envisions a diversified energy system that is reliable, efficient, affordable and environmentally-friendly. On electricity, the government intends to increase electricity generation, access and efficient operation through promotion and enhancement of private sector participation using appropriate and reasonable incentive and facilitation processes; promoting greater operational efficiency of electricity utilities; reducing electricity losses by upgrading and replacing ageing transmission and distribution infrastructure and promoting the use of wind and solar technologies for electricity generation. In the matter of renewable energy, government is aiming is to increase the contribution of renewable technologies in electricity generation supported by a renewable energy and energy efficiency legislation. Government plans also include further development of human capital; raising awareness about renewable energy technologies, and providing targeted incentives to investors. On petroleum, government has in place a petroleum exploration, development and production Act and has started building a human resource base. In addition, government is developing a strategy for strengthening and building up institutional capacities to ensure effective petroleum resource management. The government also plans to develop legislation and regulatory regimes for downstream aspects of petroleum production. Legislation and strategies planned or in the making should take into consideration related environmental issues that include surface notably oil spills and discharge of effluents for example, and atmospheric pollution including the emissions of greenhouse gases.
Tourism Tourism is an important economic sector from GDP and foreign exchange perspectives. In its drive to increase employment, the country plans to exploit synergies between tourism on the one hand and agriculture and natural resources sector, industry, arts and entertainment on the other hand. To this effect, the Tourism Master Plan, a blueprint for the development of tourism to the year 2020, has been formulated. Currently, there are some attractive eco-tourism facilities under construction and further enhancing the tourism infrastructure in the country.
Fisheries More than 500 demersal and pelagic fish species are found in Gambian territorial waters. There is growing concern over state of fish resources and catches. This is ascribed, among other things, to increases in fishing intensity and irresponsible fishing practices by the fishing trawlers and foreign artisanal fishermen. The demersal fish are apparently being over-exploited and require more rigorous management to limit extraction by industrial fishing vessels and to support the artisanal fisheries sub-sector. The specific policy objectives of the fisheries sector as spelt out in its strategic development and management plan are as follows: 1) effect a rational long-term utilisation of marine and inland fisheries resources; and 2) develop and expand artisanal fisheries and increase Gambian participation, especially women‟s participation in the fishing industry. Per capita fish consumption can increase with improved access to fish products country-wide, guaranteed by aquaculture production systems and improvements in the distribution system and cold storage facilities.

Gambia’s Second National Communication
17
Industry The Gambia‟s manufacturing sector is small in size and has little diversity. Processing and transformation industries rely almost entirely on imported inputs. Small-scale manufacturing firms are mainly in the informal sector. The primary objective of the National Industrial Policy is to establish conditions required by the private sector to create gainful employment opportunities at ever increasing levels of productivity within the framework of a sustainable environment, social justice and equity. Adequate and reliable power supplies remain the most pressing issue facing the industrial sector. Indeed, there is considerable loss of productivity due to frequent and unpredictable power outages. But improvements are on the horizon in light of additional generating capacity deployed by the national power utility, NAWEC.
Trade Through its liberal trade regime, the country has over the years established and consolidated its trade links with the EU, USA, Asian countries and those within the ECOWAS sub-region. As a small country that by nature must trade to meet its needs, The Gambia needs to pursue an export-oriented strategy. In this regard, The Gambia will seek to adopt the implementation of the economic partnership agreement (EPA) as a strategy to expand its link with the EU, while finding ways and means to mitigate adverse impacts of the EPA.
Forests and Forestry Forests classified into four broad categories: closed forest (26, 800 ha), open forest (62,600 ha), tree and shrub savannah (347,000 ha) and mangroves (68,000 ha), are estimated to cover about 44% of the land area of The Gambia. Forests provide more than 85% of the domestic energy needs of the country in the form of wood fuel and about 17% of the domestic timber needs. The natural forest cover continually changes through the action of forest fires, which remain the single most important cause of forest degradation. Apart from killing young trees and shrubs, forest fires also kill mature ones depending on bushfire characteristics and timing. The main objectives of the national forest policy are to: 1) preserve, maintain and develop forest land resources covering at least 30% of total land area; 2) ensure that 75% of forest lands are managed and protected; and 3) ensure sustainable flow of forest products to needy urban and rural populations.
Water Resources Current policies have not been able to keep up with increased demand and roles assigned to agencies responsible for the management of the water resources of the country. However, the Ministry of Fisheries, Water Resources (MOFWR) through its line Department of Water Resources (DWR), and in collaboration of donor partners (EC/EDF, UNDP, UNCDF and UNICEF), is working towards updating key policies, management strategies and regulations driving the water resources sector forward. Undoubtedly, there is a continuing need to increase access to basic water supplies in expanding urban and underserved rural areas, using well-tested technologies. As a matter of policy, 1.6-metre diameter concrete-lined well and the Mark II (Improve Type) hand pump have been adopted, as the standard well and hand pump in rural parts of the country. As alternatives to well and handpump technologies, boreholes connected to solar and wind energy-powered pumps and diesel generators are installed in villages with large populations.

Gambia’s Second National Communication
18
Biodiversity and Wildlife In The Gambia, the development of a strategy and policy concept for biological diversity conservation started with the promulgation of the Banjul Declaration and the Wildlife Conservation Act of 1977 laying foundations for the conservation and sustainable use of biological resources in The Gambia. Over the last three decades, the government of The Gambia has taken various legal, policy and institutional measures to promote the conservation and sustainable use of the country‟s biodiversity. A biodiversity/wildlife policy and a bio-safety and biotechnology framework were adopted in 2003. Recent efforts focus on developing a policy framework, which includes institutional strengthening, public education on biodiversity issues, conservation and research.
Waste Management The present policy direction on waste management is to relocate old dump sites to more appropriate locations and create landfills to better manage the ever increasing solid waste generated countrywide. Supporting policies and legislation include the NEMA, 1994; Public Health Act 1990; Public Health Regulations, 1990; Banjul Market Slaughter House Regulations and Banjul and Kombo St. Mary‟s Slaughter House (Licensing and Management) Regulations Local Government Act (1963) CAP. 33:0130. The overall waste management policy objective is to safeguard public health and improve the quality of life of all Gambians. Problems addressed in the policy include poor sanitation, waste generation and handling. The policy targets the minimisation of biological impacts on humans, fauna, flora, and physical and aesthetic impacts on the natural environment. The dominant theme of the waste management policy is the prevention of avoidable waste production, waste utilisation and recycling and controlled disposal of waste residues after biological, thermal or chemical-physical treatment.
Land Transport The Gambia has a road network 2,700 km long of which 956 km are paved. The road transport policy stipulates the development and maintenance of road infrastructure in support of the long-run expansion of the productive capacity of the economy and the improvement of the living standards of The Gambian population. The major goals of the national road transport plan include: 1) improvement of the overall quality of the road system; and 2) facilitation of economic and social development potentials. Despite recent improvements in the road network, the poor quality of feeder roads linking farms to markets constitutes a bottleneck for moment of people and goods. Continued improvements to transport infrastructure will undoubtedly make peoples‟ lives better as a result of improved access to education and health facilities and markets.
Maritime Transport The Gambia Ports Authority (GPA) has made a number of interventions towards its objective of transforming Banjul Port into a leading maritime centre for trade, logistics and distribution, and achieving the status of a regional hub for the Europe-West Africa trade. The Port of Banjul is the main seaport that serves The Gambia‟s seaborne trade, and handles almost 90% of the total volume of the country‟s foreign trade.
Air Transport Transforming Banjul International Airport into a hub of regional and trans-oceanic air transport network is one of the fundamental goals of The Gambia Civil Aviation Authority (GCAA). Considering the
Gambia’s Second National Communication
19
demographic size of The Gambia – a population of approximately 1.8 million people – the success of air transportation and viability of airlines depend a great deal on tapping the potential on offer within the West African Region.
Greenhouse gas emissions
The national greenhouse gas (GHG) inventory presented in SNC covers major GHGs; carbon dioxide (CO2), methane (CH4), nitrous oxide (N2O), fluorinated greenhouse gases (HFCs and SF6), indirect greenhouse gases; carbon monoxide (CO), oxides of nitrogen (NOX), non-methane volatile organic compounds (NMVOCs and sulphur dioxide (SO2), emitted across source categories endorsed in the 1996 Revised IPCC Guidelines.
Sectoral contributions to national GHG emissions in the year 2000 are discussed below:
Energy With the exclusion of SO2, 70% of emissions from the energy sector, in 2000, were in the form of carbon dioxide (218 Gg CO2). Forty here percent of CO2 emissions came from the transport (TRAN) source category, 40% from energy industries (ENI), 7% from commercial and industrial (COIN), 6% from residential (RES), 3% from manufacturing and construction (MACO) and 1% from the agriculture, forestry and fisheries (AFF) categories. There was a marked increase in the emissions between 1999 and 2000.
Industrial Processes In 2000, about 43% (1.39Gg) of greenhouse gas emissions came from industrial processes comprised of HFCs, 34% (1.07Gg) represented carbon dioxide, 22% (0.71 Gg) NMVOCs and 1% (0.04Gg) SF6 emissions. Between 1994 and 2000, emissions of greenhouse gases from industrial processes exhibit an increasing trend..
Agriculture Of the total emissions from agriculture, 51% were methane emissions from animal husbandry, rice cultivation, burning of savannah land and crop residues. Emissions of carbon monoxide from burning of savannahs and crop residues constituted 38% of emissions from agriculture.
Emissions of nitrous oxide (N2O) were mostly generated from agricultural soils, burning of savannahs and crop residues, and account for 10% of emissions from agriculture. About 0.5Gg or 1% of the total emissions from the sector were in the form of nitrous N2O emissions. Animal production generated 12.3Gg CH4 or 64% of emissions from agriculture. Rice cultivation produced 6.4Gg CH4 or 33% of methane emissions, crop residue burning resulted in 0.39Gg CH4 or 2% emissions, and 0.25Gg CH4 or 1% came from savannah burning. About 83% of the total methane emissions (10.2Gg CH4) from animal production were produced from cattle rearing operations. Emissions from other animal species (sheep, goats, donkeys, horses, mules, swine and poultry) add up to 2.1Gg CH4 (17%).
Between 1994 and 2000, emission trends in the agriculture sector reveal methane emissions, principally from animal husbandry, as rising the fastest. This is followed by carbon monoxide, which comes mainly from burning of savannah and crop residues.
It is worth noting that improved quantification of emissions from waste, agriculture and industrial processes, as well as the reduction of uncertainties in emission factors would significantly increase the reliability of greenhouse gas emission computations.

Gambia’s Second National Communication
20
Land use change and forestry (LUCF) In 2000 the forestry sector emitted about 519Gg of carbon dioxide into the atmosphere. Non-CO2 greenhouse gases (CH4, N2O, NOx and CO) were also emitted into the atmosphere but these are relatively insignificant, except for carbon monoxide (105,4Gg CO). Net emissions from this category were 519.1 Gg.
For emission and removals of CO2 by the LUCF category during the period 1994 to 2000, indications are that the forestry sector served as a sink of carbon dioxide from 1994 to 1998, whilst in 1999 and 2000 the sector changed to an emitter of carbon dioxide.
Waste Emissions from the waste sector in 2000 were mainly composed of methane amounting to 8.27Gg, of which 79% came from the solid waste management source category. Other gases emitted were nitrous oxides amounting to about 0.00085Gg N2O. Emission of methane from waste management shows a rising trend from about 6.4Gg in 1994 to about 8.3Gg in 2000. This is mainly due to an increase in solid waste generated and quantities dumped at disposal sites. On the other hand, emissions of N2O decreased between 1994 and 2000.
Greenhouse gas mitigation assessment
Even though Gambia‟s contribution to global GHG emissions is negligible, the country is nevertheless committed to reducing its GHG emissions where this is financially and environmentally feasible. Thus, the SNC makes a partial investigation of measures planned to mitigate climate change through a reduction in GHG emissions at the sectoral level.
Energy sector
The scope of emission reductions was studied under three mitigation scenarios compared to the reference (i.e. business as usual scenario) scenario: 1) butanisation (i.e. widespread use of LPG), 2) improved cooking stoves and 4) increased energy efficiency. All three mitigation scenarios indicate reductions in energy consumption compared to the reference scenario. The LPG and improved cooking stoves scenarios offer the biggest reductions, demonstrating that household energy consumption plays and will continue to play a major role in the energy balance of The Gambia. The sharpest reduction in energy is observed under the improved cooking stove scenario.
By 2030, use of fuelwood will only account for 62.68% of the total energy consumption under the reference scenario while consumption of petroleum products and electricity (in 2009) will increase from 25.5% to 30.32%, and from 3.58% 6.94%, respectively. Over the same period, charcoal use increases from 5.91% to 26.72% of energy consumed.
Compared to the energy consumption outlook under the reference scenario, demand of energy from fuelwood sources will drop by 12.86% while demand on petroleum products is expected to increase by 12.13% under the LPG scenario by the year 2030. Under this scenario, shares of fuelwood, petroleum products and electricity out of total energy consumption will be 49.82%, 42.45% and 7.66% respectively.
All three mitigation scenarios (i.e., LPG, improved cooking stoves and energy efficiency) show a net reduction in GHG emissions when compared to the reference scenario. Although the LPG scenario shows an increase for non-biogenic carbon dioxide emissions, the savings made in the biogenic carbon dioxide emissions outweigh the increase for non-biogenic carbon dioxide emissions.
Gambia’s Second National Communication
21
Climate change impacts and vulnerability For the purposes of the impacts and vulnerability assessment, emphasis was placed on key socio-economic sectors and geographic areas of the country. Particular attention was given to the forestry, rangeland, health, agriculture, fisheries and coastal zone. It is predicted with a high degree of certainty that the Gambia will experience an increase in temperatures of ranging between 1.1°C and 3.9°C during the period 2030 - 2100.
Impacts on natural resources Forests Results obtained from the Holdridge Life Zone Classification (HLZC) model suggest that The Gambia‟s forest cover will fit less into a tropical dry forest categorisation and more into a dry forest and tropical very dry forest categories. As the temperature becomes warmer, rainfall decreases and potential evapotranspiration increases, forest cover will be approximately sub-divide into tropical very dry forest (35 - 40%) and tropical dry forest (45 - 60%), the warmest climate scenario giving rise to the highest percentage of tropical very dry forest. Rangelands The Dankunku Rangelands used as a representative unit of analysis will be degraded under warmer and drier climate projections. It is also projected that lower average soil moisture will affect the nitrogen up-take of plants and their palatability to grazing animals, but of significantly greater importance is the sharp drop in biomass production under projected natural growing conditions. Long-term loss of ecosystem productivity is likely to adversely affect biodiversity in rangelands, even though soil carbon stocks look likely to increase as a consequence of biomass production failures.
Impacts on vulnerable sectors and regions
Health
Healthcare in The Gambia is based on a three-tier system: primary, secondary and tertiary levels. The primary level is built on village health services and community clinics; the secondary around minor and major health centres whilst the tertiary encompasses treatment and services offered at general hospitals. Private clinics operating on the secondary level also offer out-patient and hospitalisation services.
Despite the paucity of research, there are well-founded health concerns regarding weather and climate-mediated illnesses. Malaria, for instance, is an endemic disease peaking in the rainy season (July-October).
For illustrative purposes, climate change forcing and impacts on the environment could alter breeding habitats of disease vectors and vector-borne transmission pathways, and endanger the survival of floristic species essential to traditional/alternative medicine. Agriculture Elevated atmospheric CO2 concentrations are expected to increase crop yields, but higher temperatures and water shortage may act to counterbalance this beneficial effect. Recent experiments have shown that crop response to elevated CO2 is relatively greater when water is a limiting factor. The opposite is true for nitrogen applications. Indeed, well fertilised crops respond more positively to CO2 than less fertilised ones.

Gambia’s Second National Communication
22
Fisheries Baseline productivity of the River Gambia based on a temperature of 27.8OC is estimated at 18.9 * 106 kg/km. Results from a riverine production model indicate that productivity will increase above current values by 4% by 2030, 6 to 7% by 2050 and 10 to 12% by 2100. Concurrently, maximum sustainable yield (MSY) increases throughout the simulation period, reaching 85 and 96 thousand tonnes by 2100, reflecting an increase of 35 – 39% with reference to the current estimate. TEMPERATURE EFFECTS ON SHRIMP YIELD ARE ASSESSED USING AN EMPIRICAL RELATIONSHIP. RESULTS of stabilised commercial shrimp yield (SCSY) projections indicate a 5% increase over the baseline scenario in 2010, steadily increasing to 46% by 2100. This is due to the preference and adaptability of shrimps to warm waters. Shrimps are also capable of living during the cold season in cool waters not dropping below 18OC. Exceptionally, the fisheries is the only sector that shows improvements in production potential under climate change.
Coastal zone The Gambia has 81 km of open coastline bordering the Atlantic Ocean and more than 200 km of sheltered coast along the Gambia River. The open coast is characterised by low-gradient sandy beaches. These open beaches are continually subjected to morphological changes driven by wave action and coastal retreat. Beach nourishment in 2004 offered some hope, but a resurgence in erosive activity has caused rapid shoreline retreat around Senegambia/Kairaba Beach Hotels and seaside of the NAWEC elevated water tank at Mile 2 (in Banjul).
Measures and Opportunities for building Resilience to climate Change
Sectoral adaptation
Forestry With a view to attenuate adverse climate change impacts on forest cover and the forestry sector, specific adaptation measures to be undertaken by the Gambian forestry sector include:
1. Establishment and expansion of community natural forests, plantations, national parks and protected areas
2. Expansion and intensification of agro-forestry and re-forestation activities 3. Mainstreaming climate change in forest policies and plans Rangelands Policy measures with immediate and mid-term objectives in place that are likely to counteract rangeland ecosystem degradation include:
1. Rangeland restoration in three sites through the Regional Project on Sustainable Management of Endemic Ruminant Livestock (PROGEBE), involving introduction and popularisation of new grass and plant species co-managed by local stakeholders.
2. The Gambia National Agricultural Investment Programme (GNIAP) through active selection of plant species and controlled animal stocking rates as adaptive management practices. Other management practices employed are transhumance, promotion of crop and livestock integration and intensive feed gardens.

Gambia’s Second National Communication
23
In order to deal with the challenges that lie ahead, it will be necessary to utilise a combination of efforts to reduce land degradation and foster sustainable management of rangelands. Suggested adaptation options include:
Development and implementation of effective policies on integrated natural resources management
Restoration of rangeland landscape
New management strategies Health Since changes in global climate are already taking place and will continue into the future, the need for adaptation policies is imperative. In order for health sector adaptation measures to succeed however, they must be supported by policies and measures in transport, urban planning, industry, agriculture, fisheries, and water and energy sectors. That said, specific adaptation measures for the health sector are as follows:
Vector control programme
Continuous public health education and awareness creation programme
Integrated disease surveillance and response
Research and modelling
Nutritional support to vulnerable groups
Public health infrastructure
Vaccination programme Agriculture In cognisance of adverse impacts of climate on agriculture; the sector has formulated projects such as the Participatory Integrated Watershed Management Project (PIWAMP), Farmer-Managed Rice Irrigation Project (FMRIP), Participatory Integrated Management of Invasive Aquatic Weeds Project, Irrigated Rice Development Project amongst others. Coping strategies and potential adaptation measures with regard to irrigated rice production can be distinguished as technical and regulatory.
Examples of technical measures include:
i. Selection of drought-, pest- disease-, and salinity-resistant, high-yield crop varieties under local conditions. For this purpose the genetic potential of local crop species must be investigated and specimens stored in seed banks;
ii. Change in planting dates and replacement of long-duration upland and lowland rice varieties with short-duration varieties; and
iii. Demonstration, promotion and diffusion of improved post harvest technologies. This will have the long-term effect of reducing extensive cultivation of marginal lands.
Promising regulatory measures consist of:
i. Discouraging cultivation on marginal areas; ii. Cooked food waste reduction; and iii. Diversification of eating habits (using other cereals different from rice as staple food).

Gambia’s Second National Communication
24
From animal husbandry perspectives, measures complementary to those geared towards rangeland regeneration/restoration would most likely be needed to buttress traditional livestock production systems and minimise farmer-herder conflicts. Apart from those explicitly mentioned under rangelands it would be appropriate to:
1. Increase fodder production from intensive feed gardens; 2. Promote crop/livestock integration; 3. Improve feed conservation techniques and access to supplements; 4. Engage with other institutions, for example, the International Trypanotolerance Centre (ITC), to
explore the possibilities intensive livestock production systems in different areas in the Gambia; and
5. Further explore opportunities for selective/cross-breeding of Ndama cows with higher milk-producing breeds.
Fisheries The 2007 Fisheries Policy and Strategic Action Plan (2012 – 2016) are designed to address challenges to sustainable use of the country‟s marine biological resources. In this regard, integrated fisheries management through application of the broader principles of ecosystem-based management and ecologically sustainable development (ESD) approaches are heavily favoured.
Aquaculture
Stricter control and protection of marine biological resources
Conservation of fish food and fish products
Mainstreaming climate change issues in the fisheries policy and plans
Coastal Zone Adaptation measures to protect the coastal zone and associated wetland ecosystem will centre on improving integrated coastal zone management practice, with special emphasis on the protection of physical infrastructure, economic and ecological assets located within the coastal zone through the following:
Beach nourishment and stabilisation
Establishment and rehabilitation of protected wetlands
Education, training and public awareness As a contribution towards the goal of developing and disseminating relevant information on climate change the first step taken by the government was the condensation and dissemination of the Gambia‟s First National Communication. Subsequent in-country workshops held at eight strategic locations have also been instrumental for climate change information and knowledge-sharing.
In collaboration with the Gambia Radio and Television Services (GRTS), the Ministry of Forestry and the Environment (MOFEN) occasionally arranges televised programmes with phone-in segments on climate change and related issues, as a means of creating greater public awareness and updating the general public on international processes. On the contribution of the print media, the Gambia Environmental Newsletter published by the National Environment Agency (NEA) also contributes to awareness-building on climate change related issues. The Observer Newspaper was at one point serving as the media outlet of the WMO Public Awareness Programme and frequently carries stories on weather, climate and climate change. The Point Newspaper and the Gambia Info paper also carry stories on climate and climate change. Similar to radio and television broadcasts however, inadequate

Gambia’s Second National Communication
25
expertise and financial resources remain limiting constraints for the diffusion of climate change information.
Training in climate change themes is primarily targeted at members of government institutions and a few NGO representatives who are members of the national climate change committee (NCC). In general, training workshops are project-driven. Training is usually for a period between two and five days and in the form of hands–on exercises. Human resources development constraints stem from the fact that persons trained may not be in position to continue to utilise the skills and expertise gained.
The Ministry of Basic and Secondary Education (MOBSE) and that of Higher Education, Research, Science and Technology (MOHERST) have directional and oversight responsibility for teaching of earth and allied sciences from elementary school through university levels. However, no specific courses on global change are taught in the school curricula or as part of undergraduate degree courses. The simplified version of the Gambia‟s FNC was produced as a booklet in A5 format and is also available to the Ministry of Basic and Secondary Education (MOBSE) as a teaching aid to educational institutions countrywide.
Technology transfer Most of the priority GHG mitigation technologies identified are already deployed in relevant socio-economic sectors in the Gambia. What remains to be done is acquisition of latest, higher-performance models and their integration in household economies and other production systems. Other new technologies need careful consideration that is, testing for, economic advantages and cultural compatibility, before widespread adoption. Similarly, adaptation technologies and techniques are scattered and often lack a supportive diffusion mechanism. A first purposive step in this direction is setting up an appropriate mechanism entrusted with oversight of scaling-up good practices and diffusion of proven technologies in crop production, food processing and conservation and coastal engineering, amongst others. Networking, knowledge and information sharing Climate change knowledge- and information-sharing in The Gambia is limited to training activities for targeted audience and the use of public consultation and media outlets for public sensitisation and awareness-raising. In preparation for development of national climate change reports such as the National Communication and the National Adaptation Programme of Action (NAPA), continuous and refresher training on the development of national greenhouse gas inventories, and mitigation and vulnerability assessments is provided for constituted Task Force members of the NCC. Such training is usually for a period of to two weeks and is based on a combination of class-room type lectures and hands-on exercises on the tools and methodologies to be utilised. The NCC having the broadest possible representation from across central and local government ministries/departments/offices, non-governmental organisations, academia, and the business community, is the locus of networking on climate change issues. Under ideal conditions, the NCC meets on a quarterly basis to discuss topical issues and share experiences.
Research and Systematic Observations

Gambia’s Second National Communication
26
Systematic observations The National Meteorological and Hydrological Service (NMHS), legally constituted as the Department of Water Resources (DWR) operates a network of 15 surface meteorological stations which include two automatic weather stations. All surface stations are equipped to measure ambient air temperature, humidity, sunshine duration, wind run, and precipitation. Atmospheric pressure is measured at the principal meteorological station in Yundum, close to the runway at the Banjul International Airport. The NMHS also benefits from collaboration with international flights providing a selected number of meteorological variables, to partially offset the absence of an upper air network. The Department of Agricultural Services (DAS) under the Ministry of Agriculture (MOA) complements the NMHS network with 22 additional rain gauges mostly under the care of extension agents.
Constraints and Gaps A stocktaking exercise at the inception of the Gambia‟s SNC project, stakeholder consultation events, and practical experience putting the SNC together reveal several constraints in the following areas:
Data capture, archiving and analysis; and
Climate change management.
Data Capture, Analysis and Modelling Research and systematic observations There is no common research agenda on the multiple dimensions of global change or platform for sharing research findings. Major constraints on systematic observations include inadequate financing, limited human and technical capacity. Specific needs and concerns related to systematic observations, data analysis and modelling include:
Upgrading and substitution of conventional equipment with digital ones to minimise the impact of observer/instrument technician failings and to also provide continuous recording of selected atmospheric, terrestrial and oceanographic state variables;
Rehabilitation and expansion of the existing monitoring networks for more representative monitoring of atmospheric, terrestrial and oceanographic state variables;
Upgrading information technologies installed in key institutions and deployment of appropriate productivity software; and
Strengthening human resources capacities in traditional and new areas of knowledge.
Greenhouse gas inventory Similar to other least developed countries (LDCs), the time lag of The Gambia‟s greenhouse inventory for the year 2000 is symptomatic of organisational constraints impeding timely collection and synthesis of greenhouse gas data and information. Improved quantification of emissions from industrial processes, waste and agriculture sectors as well as uncertainty reduction in emission factors would significantly increase the reliability of greenhouse gas emission computations.
Mitigation Assessment Although some Gambian professionals received training on this subject, its inadequate treatment in the SNC indicates that training of a larger pool of professionals in developing sector-specific scenarios, conducting economic assessments of climate change mitigation, and integrating NAMAs within an economy-wide mitigation strategy, is imperative.
Gambia’s Second National Communication
27
Vulnerability and adaptation assessment Several omissions from the task of vulnerability assessment has drawn government‟s attention to inadequate institutional capacity for carrying out comprehensive vulnerability and adaptation assessments in some key sectors of the economy. Part of the problem lies in data availability, but professional competencies remain an important aspect of the problem. More people should be trained and collaborative arrangements devised to fill knowledge gaps. Community engagement in vulnerability and adaptation assessments could also add-value to mostly favoured top-down approaches.
Climate Change Management Networking For effective implementation of the UNFCCC, other Rio Conventions and their associated protocols, it would be necessary to foster an enabling environment by:
Institutional embedding of climate change management;
Strengthening of the administrative and technical capacities of the Gambia‟s Climate Change Secretariat;
Strengthening of systematic observation and monitoring networks and negotiating resource-sharing arrangements with national, regional, global centres and institutions working in fields related to climate change.
Capacity building In-country evaluations (i.e. stocktaking) and consultations have revealed to stakeholders, several constraints critical to effective climate change management.
At the level of individual actors, capacity constraints are reflected by a lack of appropriate skills and expertise which unfailingly frustrate effective participation in and conduct of the following processes:
Assessment of mitigation and adaptation options; and
Knowledge-sharing across professional networks
These constraints filter down to the institutional level where human resources with inadequate scientific education and training, sub-optimal investments on technical assets and tight operational budgets, turn out to be serious impediments to timely elaboration of situation, diagnostic, and strategic planning reports, and broad participation in the work of the UNFCCC and its negotiations process.
Capacity constraints at the system level are exemplified by a slow-response policy environment. In effect, national institutional arrangements, policies and regulatory measures are still lagging behind global change challenges. To reverse this state of affairs, the government will therefore need to overcome institutional and individual actors‟ capacity constraints.
Education and public awareness
The interested public can access meteorological, climatological and climate change information at from these websites: URL www.mofwrnam.gm and www.climatechange.gm. But, considering literacy levels and access to computers, most Gambians rely on radio and to a lesser extent on TV for climate-related information. As a general rule, radio and/or TV broadcasts are event-driven and rarely cover issues in depth. Because of the Gambia‟s geographical configuration, installation of repeater stations along the country is essential for full radio coverage. Journalists/reporters (proficient in local languages) need opportunities and encouragement to develop programmes with climate change as a central theme.

Gambia’s Second National Communication
28
Financial needs in the basic education cycle often exceed resources available. Thus, expenses related to extramural activities with instructional value such as field trips/study tours are often covered by parents. Similarly, a few internet service providers make generous donations of computers and free-internet access to some schools to augment student‟s learning resources and opportunities.

Gambia’s Second National Communication
29

Gambia’s Second National Communication
30
1. INTRODUCTION AND CONTEXT
According to Articles 4 and 12 of the United Nations Framework Convention on Climate Change (UNFCCC), all
country Parties must report on the steps they are taking or envisage undertaking in order to implement the
Convention. During the eight meeting of the Conference of Parties (COP 8) held in New Delhi in 2002, Parties
adopted the revised guidelines for the preparation of National Communications (NATCOMs) from non-Annex I
Parties. In accordance with the principle of "common but differentiated responsibilities" enshrined in the
UNFCCC, the content NATCOMs and the timetable for their submission are different for Annex I and non-
Annex I Parties.
In this context, The Gambia which is one the Least Developed Countries (LDCs) is entitled to appropriate
financial and technical support to prepare and submit its National Communications (NC) at convenient intervals.
In the circumstances, the Global Environment Facility (GEF) provided requisite financial support through UNEP
which served as implementing agency. Some Gambian specialists and a few international consultants provided
technical assistance to The Gambia in carrying out its national greenhouse gas inventory, mitigation
assessment and vulnerability and adaptation assessments which constitute essential parts of The Gambia‟s
Second National Communication (SNC) under the UNFCCC. The preparation of he SNC is based on the
revised guidelines adopted during COP 8.
To this effect, the current report outlined the emissions of greenhouse gases from major economic sectors and
activities of the country, developed plausible climate change scenarios for assessment of their potential impacts
on natural resources, key sectors of the national economy and sensitive geographical areas. Potential impacts
of climate change on crop production, forestry, fisheries, and rangelands and livestock have been assessed in
great detail. Most of the impacts are negative and the populace vulnerable.
This Second National Communication comprises twelve chapters as follows:
1. Introduction and Context;
2. National Circumstances;
3. National Greenhouse Gas Inventory;
4. Greenhouse Gas Mitigation Assessment;
5. Vulnerability and Adaptation Assessment;
6. Technology transfer;
7. Research and systematic observations;
8. Education, training and public awareness;
9. Capacity building
10. Networking, knowledge and information sharing;
11. Constraints and gaps related to financial and technical capacity needs; and
12. Conclusions and recommendations.
In chapter 2 which follows this introduction, the SNC provides an account of national circumstances relevant to
the implementation of the UNFCCC. This is followed by a detailed national inventory of greenhouse gases in
chapter 3, and partial assessment of mitigation measures and strategies aligned with The Gambia‟s document on
nationally appropriate mitigation actions (NAMAs), in chapter 4. Impacts of projected climate change and
measures of attenuating adverse impacts are addressed under chapter 5. As was the case with the Initial
National Communications, no detailed cost-benefit analysis was conducted on the mitigation and adaptation
measures due to inadequate capacity to cost the effects of climate change. The technology chapter presents
existing technologies and other promising technologies that can be applied in the implementation of mitigation
and adaptation activities identified in the National Communications. The chapter on research and systematic
Gambia’s Second National Communication
31
observation discussed the national framework for research and systematic observations; describing existing
systematic observations (meteorological, atmospheric, oceanographic and terrestrial) and programmes, and
spotlighting data needs and priorities. The chapter on education, training and public awareness presents formal
and non-formal education in The Gambia and climate change mass media activities conducted in The Gambia.
Chapter 9 which addresses capacity building provides information on the capacity assessment with emphasis on
critical capacity needs for implementation of the UNFCCC and maximising synergies with other multilateral
environmental agreements. Issues on networking, knowledge- and information-sharing relevant to the
implementation of the UNFCCC in The Gambia are presented in chapter 10 of the SNC. The chapter includes
both national and international knowledge and information networks. Climate change implementation constraints
and gaps with particularly reference to finance, technology and capacity building are articulated and discussed in
chapter 11. The final chapter of the SNC enunciates key recommendations for improving climate change
management processes in the country.
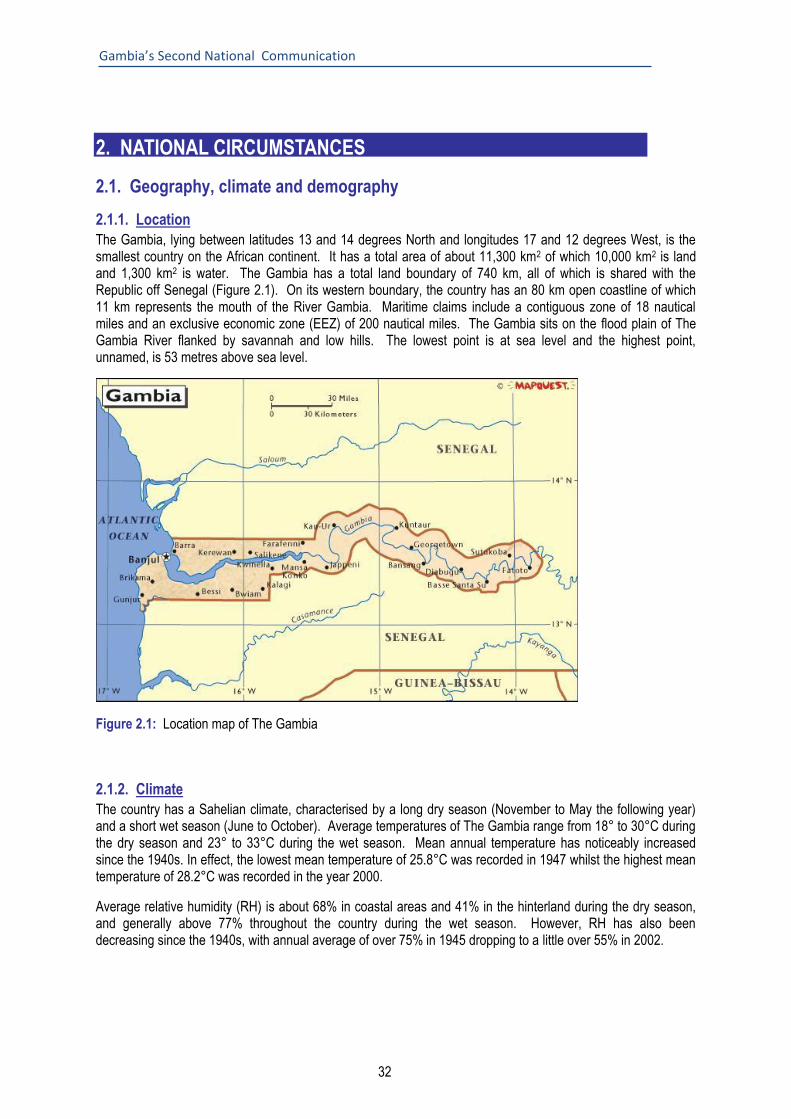
Gambia’s Second National Communication
32
2. NATIONAL CIRCUMSTANCES
2.1. Geography, climate and demography
2.1.1. Location
The Gambia, lying between latitudes 13 and 14 degrees North and longitudes 17 and 12 degrees West, is the smallest country on the African continent. It has a total area of about 11,300 km2 of which 10,000 km2 is land and 1,300 km2 is water. The Gambia has a total land boundary of 740 km, all of which is shared with the Republic off Senegal (Figure 2.1). On its western boundary, the country has an 80 km open coastline of which 11 km represents the mouth of the River Gambia. Maritime claims include a contiguous zone of 18 nautical miles and an exclusive economic zone (EEZ) of 200 nautical miles. The Gambia sits on the flood plain of The Gambia River flanked by savannah and low hills. The lowest point is at sea level and the highest point, unnamed, is 53 metres above sea level.
Figure 2.1: Location map of The Gambia
2.1.2. Climate
The country has a Sahelian climate, characterised by a long dry season (November to May the following year) and a short wet season (June to October). Average temperatures of The Gambia range from 18° to 30°C during the dry season and 23° to 33°C during the wet season. Mean annual temperature has noticeably increased since the 1940s. In effect, the lowest mean temperature of 25.8°C was recorded in 1947 whilst the highest mean temperature of 28.2°C was recorded in the year 2000.
Average relative humidity (RH) is about 68% in coastal areas and 41% in the hinterland during the dry season, and generally above 77% throughout the country during the wet season. However, RH has also been decreasing since the 1940s, with annual average of over 75% in 1945 dropping to a little over 55% in 2002.

Gambia’s Second National Communication
33
2.1.3. Population
The Gambia‟s population in 2011 was estimated at 1.8 million and projected to increase by 2.7% per annum between 2010 and 2015 (UNDP, 2011). About 59% of the total population lives in urban and periurban areas of the country. The challenge lies in the fact that the population of the country would double every 16 years, carrying the possibility of undermining the country‟s goals of poverty reduction and slowing down economic growth.
2.2. Government The Gambia is a Constitutional Republic. It has five administrative regions (Central River, Lower River, North Bank, Upper River and West Coast), and two large municipalities; Kanifing Municipal Area and the capital, Banjul. Government is divided into three branches: executive, legislative and judicial. The Executive Branch of Government consists of The Head of State and Government and a Cabinet of Ministers. Cabinet members are appointed by the President who is elected by popular vote for a five-year term.1
In the Legislative Branch, a unicameral National Assembly consists of 53 members, 48 of whom are elected by popular vote and the remaining 5 appointed by The President of The Republic. National Assembly elections are held every five-years with the most recent one held in March 2012
The third major division of Government is the Judicial Branch which houses the Supreme Court.
Local Governments play a critical role in overall governance in The Gambia and are key players in economic development, growth and employment. The government‟s overarching objective is to accelerate decentralisation and increase the autonomy of local governments, helping them provide more effective and efficient social services and make greater contributions to economic growth and employment in local communities. The Gambia adopted a policy on the decentralisation of government in response to sections 193 and 194 of the Constitution of the Republic of The Gambia. Current local government legislation in The Gambia provides for the self-administration of local governments by elected councils working to create and sustain viable frameworks for good governance, and an enabling environment for poverty alleviation in The Gambia. To achieve this objective, the central government will pursue four actions:
1. assist local government authorities, technical line departments, and community institutions to coordinate, inspect, implement, manage, monitor and evaluate decentralised development programmes in a democratic and transparent manner;
2. ensure that land is used rationally and equitably for different purposes that promote socioeconomic development;
3. promote people‟s participation in determining the country‟s destiny through a participatory development process; and
4. administer land judiciously and make access more equitable through comprehensive surveying and mapping.
It will be valuable to transfer competences to Local Government Authorities, and ensure judicious administration of land and enhance its equitable access through comprehensive surveying and mapping processes.
2.3. Economy
2.3.1. Analysis of General Country Situation
The Gambia has a liberal, market-based economy characterised by traditional subsistence agriculture, a historic reliance on groundnuts (peanuts) for export earnings, a re-export trade built up around its ocean port, low import duties, minimal administrative procedures, a fluctuating exchange rate with no exchange controls, and a
1 The most recent elections held in November 2011 were won by the incumbent, HE Alhagi Dr. Yayha AJJ Jammeh.

Gambia’s Second National Communication
34
significant tourism industry. Heavy reliance on agriculture, dominated by groundnut production, exposes the economy to the vagaries of the climate and to volatility of prices in international commodity markets trading in these products.
In the late 1970‟s and early 1980‟s, the country experienced a significant decline in economic growth. To address this situation, The Gambia embarked on a series of structural adjustment programmes included the Economic Recovery Programme (ERP) and its successor programme, the Programme for Sustained Development (PSD). These two adjustment programmes were subsumed into a long-term development strategy, known as Vision 2020. Despite the gains recorded under these programmes, the economy remains weak and highly vulnerable to external shocks due mainly to the volatile nature of the major sources of revenue, namely groundnut export, tourism and the re-export trade. Exported commodities include peanut products, fish, cotton lint, palm kernels, whereas imports comprise of foodstuffs, manufactured goods, fuel, machinery and transport equipment.
In 2010, GDP was estimated at US$1,040 billion with a real GDP growth rate of 6.1% and a per capita GDP of US$556. In the same year, GNP per capita was estimated as US$605 (CBG Annual Report 2010, CBG MPC Press Release May 2012). The country has experienced both balance of trade and balance of payment deficits for several years. Major exportable items include fish, peanuts, and cotton. Its exports partners are Hong Kong, United Kingdom, France and Spain. Key imports comprise of food, fuel and machinery. For imports, The Gambia depends upon the countries such as France, Senegal, China and Netherlands (Economy Watch, 2010 Export and Import of Gambia, Gambia Foreign Trade. www.economywatch.com/wprld_economy/gambia/). Provisional balance of payments estimates indicate an overall deficit of US$25.27 million in 2010 compared to the revised surplus of US$54.6 million recorded in 2009, and are reflected in the reduction of capital and financial account surpluses and widening of the current account deficit. As at end-March 2012, gross international reserves totaled US$182.0 million, equivalent to 5.0 months of import cover. The volume of transactions in the foreign exchange market, measured by aggregate purchases and sales, dropped to US$1.45 billion at the end of April 2012, down from US$1.59 billion, a year earlier.
2.3.2. Sectoral performance
As a share of GDP (Figure 2.2a), the services sector continues to drive the economy, accounting for 58% of total output followed by agriculture (30%) and industry (12%) respectively. Figure 2.2b below shows the share of the different sub-sectors of the services sector.
Between 2008 and 2010, agricultural production improved significantly with growth averaging 18.1%. Crop production, the main driver of agricultural activity and accounting for 62% of its output, recorded an increase of 14.3% in 2010. The livestock sub-sector, accounting for 30.7% of agricultural output, also grew by 10.9%. The growth in industry was supported by expansion in mining and quarrying (14.2%) and electricity, gas and water supply (7.8%). GDP share of the construction sector rose to 5.0% compared with 3.0% in 2009. Output from the manufacturing sector increased slightly by 0.5% in the context of two consecutive years of negative growth, and structural constraints such as inadequate electricity supplies, weak technology and infrastructure, small domestic markets and a small skilled labour force.
a) b)

Gambia’s Second National Communication
35
Figure 2.2: Contribution to the GDP by: a) main economic sectors, b) sub-division GDP contribution by economic activities under the services sector (Source: Central Bank of The Gambia Annual Report 2010)
The services sector, the leading sector of the economy (53% of total economic output in 2010), recorded a moderate growth of 2.4% in 2010 compared to 6.6% in 2009. This is reflective of contractions in output from trade and hotels of in the order of 0.4% 35.7% respectively, lower growth in financial services (10.5% in 2010 compared to 27.9% in 2009) and public administration (7.3% in 2010 compared to 15.0% in 2009). However, the communications sub‐sector of the economy grew by 9.2% in 2010 compared with 7.7% in 2009.
In 2010, the trade sub‐sector contributed 39.1% to aggregate output from the services sector. Transport and
communications sub‐sectors contributed an additional 20.9% . Finance and insurance and real estates and
business accounted for 18.4% and 6.2% respectively during the same period.
Economic activities within the tourism sector which started to slow down since the global economic crises began, continue to remain weak. The tourism sector‟s contribution to GDP has since fallen by 1.3 percentage points to 2.0% in 2010. Tourist arrivals fell by 35.7% during this period.
2.3.3. Economic policies and trends
The government of The Gambia is committed to reducing poverty and improving the well-being of citizens. This commitment is driven by the government‟s long-term strategy, Vision 2020, which is being pursued through a series of medium-term development plans. The most recent, the Programme for Accelerated Growth and Employment (PAGE) is The Gambia‟s development strategy and investment programme for 2012 to 2015. PAGE comes on the heels of the Poverty Reduction Strategy Paper II, PRSP II (2007 - 2011). In terms of poverty reduction and improvements in social welfare, successful achievement of the first and second poverty reduction strategies was attenuated because of external shocks and the lack of financial resources. Overall, significant progress was registered in the social and infrastructure sectors but income poverty remains a challenge. The PAGE (2012-2015) draws on lessons learnt from previous poverty reduction strategies. The PAGE is thus aligned with Vision 2020 and sectoral strategies, and epitomises the execution template for The Gambia government‟s long-term vision. Consistent with the Paris Declaration on aid efficiency and the ownership of development, the PAGE acts as the main interface between The Gambia and its development partners. PAGE is fully aligned with the Millennium Development Goals (MDGs) and climate change issues and risks have been fully integrated in it. Implementation of the PAGE will be through the Priority Action Plan (PAP) that will require private sector participation and heavy financial support from development partners. The Climate Change Priority Action Plan

Gambia’s Second National Communication
36
(CC PAP) indentified twenty-four cross-sectoral activities/projects that should lead to mainstreaming of climate change into the national development process, integration of climate change into education curricula from basic to higher education, and addressing climate data and information needs of the country. The CC PAP will also lead to the development of Low Emissions Carbon Development Strategy that will allow The Gambia to continue to follow a green economic development pathway. According to UNDP (2011), at least 16.9% of females and 31.4% of males in the population have attained secondary education. Gross enrollment ratios are 84.7%, 56.7% and 4.6% for primary, secondary and tertiary education levels, respectively. Between 2005 and 2009, pupil-teacher ratio was 36.6. Adult (≥ 15 years) literacy rate was 46.5%. Total fertility rate among women of child-bearing age was 4.7 in 2011 (UNDP, 2011). Between 2005 and 2009, nearly all expectant mothers made at least one antenatal visit to a health facility and 57% of births were attended by skilled health personnel. In 2009, under-five mortality was 103 per 1000 live births.
2.4. Social development
2.4.1. Human development and poverty
The Gambia is classified as one of the Least Developed Countries (LDCs) in the world. The Gambia‟s Gross National Income (GNI) per capita is US$1,282 in constant 2005 PPP US$) also positioning the 173 out of 187 countries. National GDP per capita in 2009 was US$1,415 in PPP US$. According to the country‟s Human Development Index (HDI) score, the UNDP Human Development Report 2011 (UNDP, 2011) ranks The Gambia at 168 out of 187 countries (see Table 2.1 below).
Table 2.1: Gambia‟s human development index in 2011
HDI value Life expectancy at birth
(years)
Combined primary,
secondary and tertiary
gross enrolment ratio (%)
GDP per capita
(PPP US$)
168 – Gambia (0.420) Gambia (58.5) Gambia 48.3 173 Gambia 1,282
Selected indicators of human poverty for Gambia (UNDP, 2011
Human Poverty Index
(HPI-1) 2011
Probability of not
surviving past age 40 (%)
2011
People without access to
an improved water
source (%) 2011
Children underweight for
age (% ages 0-5) 2011
0.324 215 per 1000 births 20.8 15.8 (2000-2009)
In 2011, The Gambia‟s HDI score of 0.420 was considerably higher than it was a decade earlier (HDI=0.343 in 2000). Over the same period however average annual increase was lower than the average for sub-Saharan Africa. Average life expectancy increased from 59.3 years in 1993 to 63.4 years between 1993 and 2003 population censuses, but has decreased to 58.5 years in 2011.
For 2011 the Poverty index is 0.324, Life Expectancy Index (LEI) is 0.585 and Educational Attainment Index (EAI) is 0.483 (Figure 2.4). In terms of gender disaggregated statistics, The Gambia development index (GHDR) is 0.610 conferring a ranking of 127 out of 187 countries. The proportion of the population living below income poverty line of US$1.25 PPP a day over the period 2000 to 2009 was about 34.3% (UNDP, 2011), and is
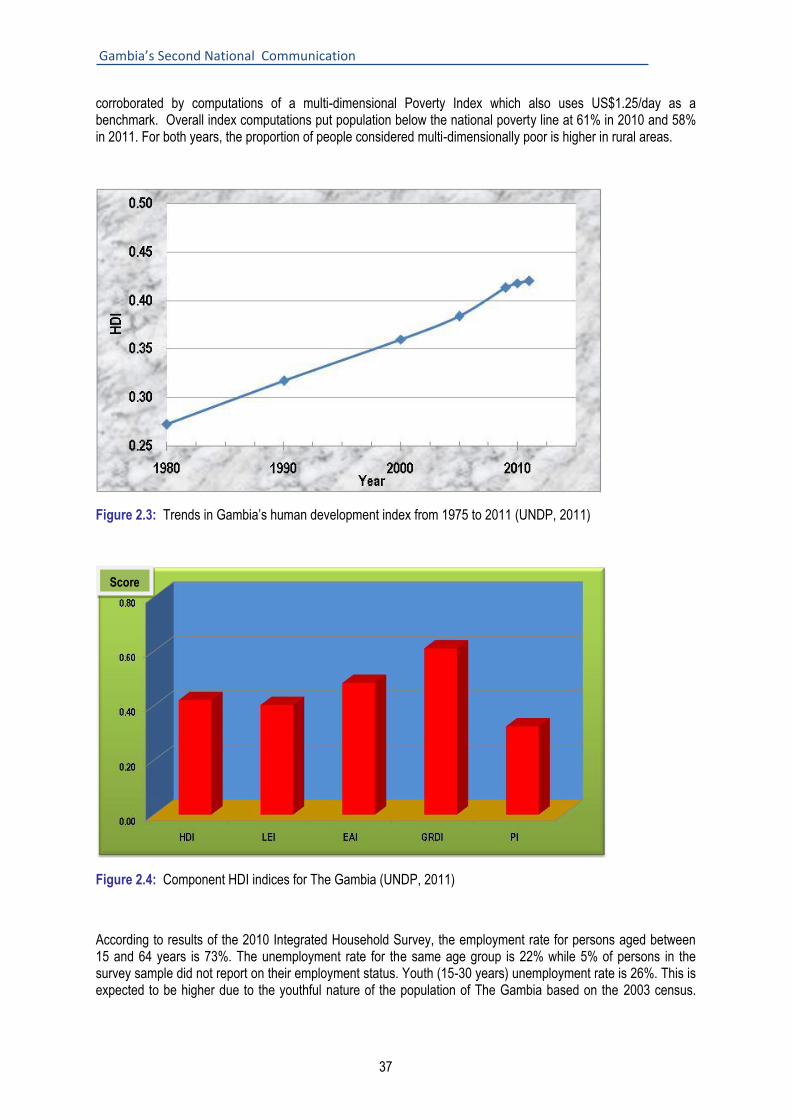
Gambia’s Second National Communication
37
corroborated by computations of a multi-dimensional Poverty Index which also uses US$1.25/day as a benchmark. Overall index computations put population below the national poverty line at 61% in 2010 and 58% in 2011. For both years, the proportion of people considered multi-dimensionally poor is higher in rural areas.
Figure 2.3: Trends in Gambia‟s human development index from 1975 to 2011 (UNDP, 2011)
1
2
Score
Figure 2.4: Component HDI indices for The Gambia (UNDP, 2011)
According to results of the 2010 Integrated Household Survey, the employment rate for persons aged between 15 and 64 years is 73%. The unemployment rate for the same age group is 22% while 5% of persons in the survey sample did not report on their employment status. Youth (15-30 years) unemployment rate is 26%. This is expected to be higher due to the youthful nature of the population of The Gambia based on the 2003 census.

Gambia’s Second National Communication
38
The high employment rate could be attributed to the high proportion of own-account workers and contributing family workers (vulnerable employment rate) which is 79% of the total employment figures.
2.5. Sectoral trends, policies and initiatives
2.5.1. Agriculture
Agriculture, the second largest sector in the economy, accounts for about 30.0% of the country‟s GDP. It employs 44% of the work force, provides an estimated two-thirds of households‟ income, and dominates exports of domestically produced goods. The government‟s vision for the agriculture sector is to transform The Gambia into a major supplier of agricultural products to local and international markets between 2012 and 2015. To achieve this vision, the Government intends to pursue three courses of action:
(iv) increase food security and boost the income-generating capacity and the nutritional status of farmers, especially women and youth;
(v) transform the agricultural sector from a traditional subsistence economy to a modern market-oriented commercial sector; and
(vi) increase and sustain agricultural production and productivity through year-round irrigation. The Agriculture and Natural Resources (ANR) Policy and The Gambia National Agricultural Investment Programme (GNAIP) combine policy, institutional, infrastructure and technology related measures to address the multiplicity of supply-side constraints of Gambian agriculture. The overall objective of the ANR/GNAIP is to increase the agriculture sector‟s contribution to the national economy by increasing productivity through commercialisation and greater private sector participation predicated on a sound macroeconomic framework aimed at enhanced growth and employment creation. Policies and seven programmes listed below:
1. Improvement of Agricultural Land and Water Management: 2. Improved Management of the Other Shared Resources: 3. Development of Agricultural Chains and Market Promotion: 4. National Food and Nutritional Security. 5. Prevention and Management of Food Crises and Other Natural Disasters: 6. Sustainable Farm Capacity Management: 7. Institutional Building for Programme Implementation:
are expected to strengthen the productive capacities of small and medium-scale farmers desirably leading to large-scale farming and the further development of agribusiness. The government has identified other policies that might improve the productivity of the agriculture and natural resources sector and maximise farmers‟ earnings from agriculture. These include:
(i) increasing the share of farms using irrigation , (ii) restructuring the land tenure and inheritance system to correct gender bias, (iii) improving the supply of farm inputs and promoting pest and disease control programmes; (iv) Exploiting new opportunities in fisheries, forestry and groundwater resources; and (v) enhancing climate risk management.
Conservation agriculture is most effective in increasing agricultural productivity and at the same time contributing to the sector‟s adaptation to climate change and promoting environmental sustainability.
2.5.2. Health
The Gambia has a comprehensive policy framework for addressing development issues in the social sectors of health, among others. Access to basic health services is generally good, although there are still some pockets with poor access, in rural areas. Childhood immunisation coverage was higher than 90% in 2010. Under-five and infant mortality rates have also declined over the past 30 years from 320 and 217 per thousand live births respectively, to the most recent estimates of 109 and 81 per 1000 live births respectively. The gains made in
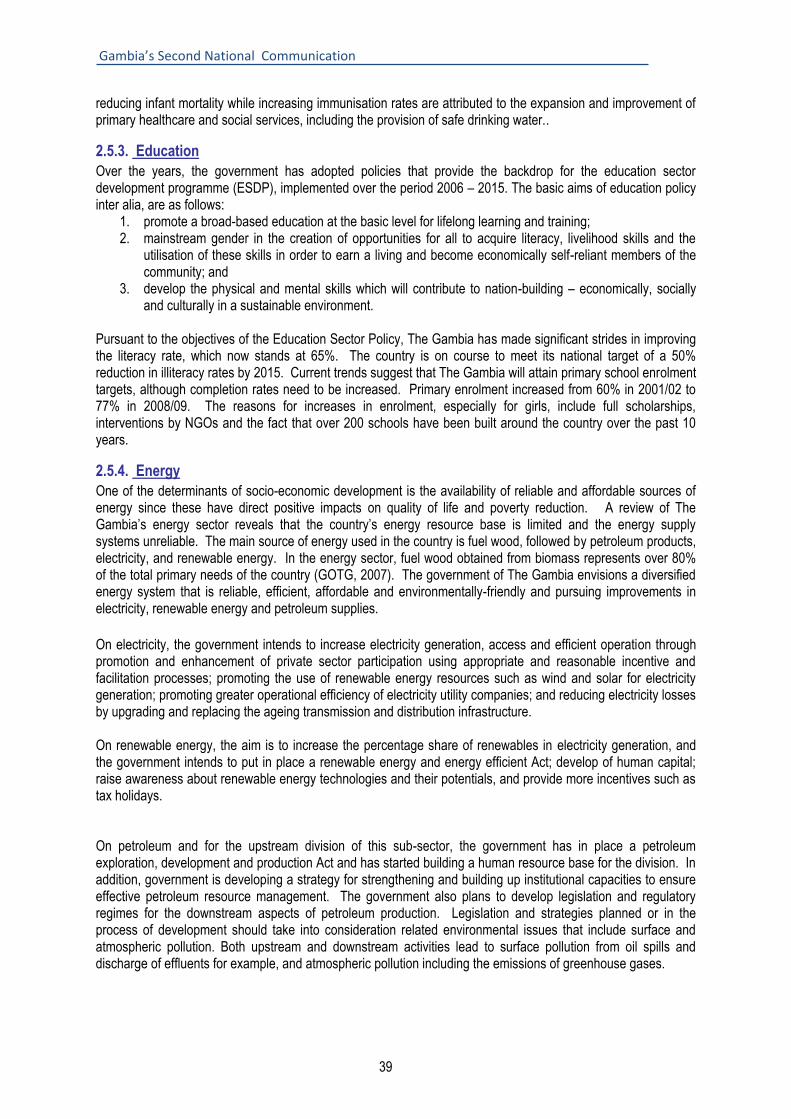
Gambia’s Second National Communication
39
reducing infant mortality while increasing immunisation rates are attributed to the expansion and improvement of primary healthcare and social services, including the provision of safe drinking water..
2.5.3. Education
Over the years, the government has adopted policies that provide the backdrop for the education sector development programme (ESDP), implemented over the period 2006 – 2015. The basic aims of education policy inter alia, are as follows:
1. promote a broad-based education at the basic level for lifelong learning and training; 2. mainstream gender in the creation of opportunities for all to acquire literacy, livelihood skills and the
utilisation of these skills in order to earn a living and become economically self-reliant members of the community; and
3. develop the physical and mental skills which will contribute to nation-building – economically, socially and culturally in a sustainable environment.
Pursuant to the objectives of the Education Sector Policy, The Gambia has made significant strides in improving the literacy rate, which now stands at 65%. The country is on course to meet its national target of a 50% reduction in illiteracy rates by 2015. Current trends suggest that The Gambia will attain primary school enrolment targets, although completion rates need to be increased. Primary enrolment increased from 60% in 2001/02 to 77% in 2008/09. The reasons for increases in enrolment, especially for girls, include full scholarships, interventions by NGOs and the fact that over 200 schools have been built around the country over the past 10 years.
2.5.4. Energy
One of the determinants of socio-economic development is the availability of reliable and affordable sources of energy since these have direct positive impacts on quality of life and poverty reduction. A review of The Gambia‟s energy sector reveals that the country‟s energy resource base is limited and the energy supply systems unreliable. The main source of energy used in the country is fuel wood, followed by petroleum products, electricity, and renewable energy. In the energy sector, fuel wood obtained from biomass represents over 80% of the total primary needs of the country (GOTG, 2007). The government of The Gambia envisions a diversified energy system that is reliable, efficient, affordable and environmentally-friendly and pursuing improvements in electricity, renewable energy and petroleum supplies.
On electricity, the government intends to increase electricity generation, access and efficient operation through promotion and enhancement of private sector participation using appropriate and reasonable incentive and facilitation processes; promoting the use of renewable energy resources such as wind and solar for electricity generation; promoting greater operational efficiency of electricity utility companies; and reducing electricity losses by upgrading and replacing the ageing transmission and distribution infrastructure. On renewable energy, the aim is to increase the percentage share of renewables in electricity generation, and the government intends to put in place a renewable energy and energy efficient Act; develop of human capital; raise awareness about renewable energy technologies and their potentials, and provide more incentives such as tax holidays. On petroleum and for the upstream division of this sub-sector, the government has in place a petroleum exploration, development and production Act and has started building a human resource base for the division. In addition, government is developing a strategy for strengthening and building up institutional capacities to ensure effective petroleum resource management. The government also plans to develop legislation and regulatory regimes for the downstream aspects of petroleum production. Legislation and strategies planned or in the process of development should take into consideration related environmental issues that include surface and atmospheric pollution. Both upstream and downstream activities lead to surface pollution from oil spills and discharge of effluents for example, and atmospheric pollution including the emissions of greenhouse gases.

Gambia’s Second National Communication
40
2.5.5. Tourism
Tourism is a key driver of the economy (contributing 14.7% of GDP in 2009) and the country‟s most significant earner of foreign currency. In its drive to increase employment, the country plans to exploit synergies between tourism on the one hand and agriculture and natural resources sector, industry and arts on the other hand. To this effect, the Tourism Master Plan, a blueprint for the development of tourism to the year 2020, has been formulated. Currently, there are some attractive additions including hotels and eco-tourism facilities to the tourism infrastructure in the country.
2.5.6. Fisheries
There is growing concern over the declining state of fish resources and catches. This is ascribed, among other things, to increases in fishing intensity and irresponsible fishing practices by the fishing trawlers and foreign artisanal fishermen. There are over 500 marine fish species in The Gambia‟s fisheries waters which are usually classed as demersals and pelagics. The demersal fish are apparently being over-exploited and require more rigorous management to limit extraction particularly by industrial vessels and to support the artisanal fisheries sub-sector sustain and increase its contribution to the economy. Commercial opportunities lie in the domestic and export markets have room to absorb additional quantities/volumes. Per capita fish consumption can increase with improved access to fish products country-wide, guaranteed by appropriate facilities and services such as aquaculture production systems and improvements in the distribution system and cold storage facilities, the latter to preserve fish and reduce spoilage. The fisheries sector needs to reconsider its approach and strategy in order to increase its contribution to national wealth and reduce poverty among its beneficiaries, strengthen and support information services to facilitate distribution and movement of fish products. Non-fisheries related income generating activities should be included in integrated fisheries projects/programmes to offer alternative income possibilities in situations where fish resources are on the decline. The specific policy objectives of the fisheries sector as spelt out in its strategic development and management plan are as follows:
i. effect a rational long-term utilisation of marine and inland fisheries resources; and ii. develop and expand artisanal fisheries and increase Gambian participation, especially women‟s
participation in the fishing industry Government priority actions during this PAGE period (2012-2015) will focus particular attention on an effective and efficient monitoring, control and surveillance system to safeguard the fisheries and marine resources as well as training of Gambian fishermen to enable them adopt responsible fishing practices. In addition, the government will put in place and implement appropriate measures to adapt to the negative impacts of climate change on the fisheries sector as already identified in Gambia‟s First and Second National Communications and the National Adaptation Programme of Action.
2.5.7. Industry
The Gambia‟s manufacturing sector is small in size and has little diversity. Processing and transformation industries rely almost entirely on imported inputs. Small-scale manufacturing firms are mainly in the informal sector. The primary objective of the National Industrial Policy is to establish conditions required by the private sector to create gainful employment opportunities at ever increasing levels of productivity within the framework of a sustainable environment, social justice and equity. The industrial sector of the economy accounts for 11% of GDP. Electricity supply continues to be the most pressing need of the industrial sector. Indeed, there is considerable loss of productivity due to frequent and unpredictable power outages. But improvements are on the horizon in light of additional generating capacity deployed by the national power utility, NAWEC. The on-going Rural Electrification Project currently implemented by NAWEC also provides some much needed power supplies in the rural areas.
Gambia’s Second National Communication
41
2.5.8. Trade
Through its liberal trade regime, the government has over the years established and consolidated its trade links with the EU, USA, Asian countries and those within the ECOWAS sub-region. As a small country that by nature must trade to meet its needs, The Gambia needs to pursue an export-oriented strategy. There is also a need to improve trade related services in order to complement this development strategy. In this regard, The Gambia will seek to adopt the implementation of the economic partnership agreement (EPA) as a strategy to expand its link with the EU, while finding ways and means to mitigate adverse impacts of the EPA.
2.5.9. Forests and Forestry
Forests are estimated to cover about 44% of the land area of The Gambia and the forest cover is classified into four broad categories: closed forest (26, 800 ha), open forest (62,600 ha), tree and shrub savannah (347,000 ha) and mangroves (68,000 ha). Although the forestry sector‟s share of GDP is estimated at less than 1%, this does not take into consideration the countrywide informal trade in timber and non-timber forest products (fuel wood, fencing posts, wood carvings, honey, wild fruits and palm oil). Forests provide more than 85% of the domestic energy needs of the country in the form of wood fuel and about 17% of the domestic saw timber needs. The natural forest cover continually changes through the action of forest fires, which remain the single most important cause of forest degradation. Apart from wiping out regenerating trees and shrubs, forest fires also kill mature tree especially when forest fires occur at the peak of the dry season when most of the vegetation is under severe water stress. The main objectives of the national forest policy are to:
(i) preserve, maintain and develop forest land resources covering at least 30% of total land area; (ii) ensure that 75% of forest lands are managed and protected; and (iii) ensure sustainable flow of forest products to needy urban and rural populations.
2.5.10. Water Resources
Current policies have not been able to keep up with increased demand and roles assigned to agencies responsible for the management of the water resources of the country. However, the Ministry of Fisheries, Water Resources and National Assembly Matters (MOFWRNAM) through its line Department of Water Resources (DWR), and in collaboration of donor partners (EC/EDF, UNDP, UNCDF and UNICEF), is working towards updating key policies, management strategies and regulations driving the water resources sector forward. There is undoubtedly a continuing need to increase access to basic water supplies in expanding urban and underserved rural areas, using well-tested technologies. As a matter of policy, 1.6-metre diameter concrete-lined well and the Mark II (improve type) hand pump have been adopted, as the standard well and hand pump in rural parts of the country. Solar and wind energy-powered pumps and diesel generators are also installed in villages with large populations.
2.5.11. Biodiversity and Wildlife
In The Gambia, the development of a strategy and policy concept for biological diversity conservation started with the promulgation of the Banjul Declaration and the Wildlife Conservation Act of 1977. In particular, the Banjul Declaration provides the basis for the conservation and sustainable use of biological resources in The Gambia. Over the last two decades, the government of The Gambia has taken various legal, policy and institutional measures to promote the conservation and sustainable use of the country‟s biodiversity. A comprehensive biodiversity/wildlife policy and a bio-safety and biotechnology framework were adopted in 2003.

Gambia’s Second National Communication
42
The most recent effort focuses on developing a comprehensive policy framework, which includes institutional strengthening, public education on biodiversity issues, conservation and research.
2.5.12. Waste Management
The present policy direction on waste management is to relocate old solid waste dump sites to more appropriate sites and create landfills to better manage the ever increasing solid waste generated countrywide. Supporting policies and legislation include the NEMA, 1994; Public Health Act 1990; Public Health Regulations, 1990; Banjul Market Slaughter House Regulations and Banjul and Kombo St. Mary‟s Slaughter House (Licensing and Management) Regulations Local Government Act (1963) CAP. 33:0130. The overall waste management policy objective is to safeguard public health and improve the quality of life of all Gambians. Problems addressed in the policy include poor sanitation, waste generation and handling. The policy targets the minimisation of biological impacts on humans, fauna, flora, and physical and aesthetic impacts on the natural environment. The dominant theme of the waste management policy is the prevention of avoidable waste production, waste utilisation and recycling, and controlled disposal of waste, which cannot be utilised after biological, thermal or chemical-physical treatment.
2.5.13. Land Transport
The Gambia has a road network 2,700 km long of which 956 km are paved. The road transport policy stipulates the development and maintenance of the road infrastructure in support of the long-run expansion of the productive capacity of the economy and the improvement of the living standards of The Gambian population. The major goals of the national road transport plan include:
i) improvement of the overall quality of the road system; and ii) facilitation of economic and social development potentials.
Despite recent improvements in the road network, the network of feeder roads linking farms to markets still needs work. Continued improvements to transport infrastructure will go a long way towards improving peoples‟ lives, especially the lives of the poor. It will make direct improvements by enabling people to meet their basic needs by accessing schools, health centres, hospitals, and entertainment centres, and will make indirect improvements by accelerating economic growth by enhancing the free movement of people, goods and services to and from the urban and rural communities and to local and regional markets. It will also create jobs, especially for the youth and for women. Other challenges facing the transport sector include the low level of private sector participation and high construction and maintenance costs. Transport costs continue to be a significant barrier to trade and lowering the cost of doing business in The Gambia.
2.5.14. Maritime Transport
The Gambia Ports Authority (GPA) has made a number of interventions towards its objective of transforming Banjul Port into a leading maritime centre for trade, logistics and distribution, and achieving the status of a regional hub for the Europe-West Africa trade. The Port of Banjul is the main seaport that serves The Gambia‟s seaborne trade, and handles almost 90% of the total volume of the country‟s foreign trade.
2.5.15. Air Transport
Transforming Banjul International Airport into a hub of regional and trans-oceanic air transport network is one of the fundamental goals of The Gambia Civil Aviation Authority (GCAA). Considering the demographic size of The Gambia – a population of approximately 1.8 million people – the success of air transportation and viability of airlines depend a great deal on tapping the potential on offer within the West African Region. Essentially the „hub and spoke‟ will be configured in such a way that Banjul will become both a collection and distribution point for passengers and freight moving between Africa, Europe and North America.

Gambia’s Second National Communication
43
3. NATIONAL GREENHOUSE GAS INVENTORY
Nationally, 3,623 Gigagrammes of various greenhouse gases were emitted within The Gambia‟s jurisdiction in 2000. About 84% of emissions were sulphur dioxide emissions primarily from energy sector activities. About 9% of these were made up of carbon-dioxide, 5% carbon-monoxide and methane emissions approximately 1%. All other greenhouse gases contributed less than 2% of the total national emissions.
3.1 Sectoral Contribution by Gas In terms of sectoral contribution to the national emissions:
1. Carbon Dioxide (CO2) emissions came mainly from the energy sector which generated 66% of emissions (218 Gg CO2). Land Use Change and Forestry (LUCF) is the other major source accounting for 34% of emissions (110 Gg CO2).
2. 44% of methane (CH4) emissions came from agriculture sector (19 Gg), 27% (12Gg) from the LUCF sector, 19% (8 Gg) from the waste sector and 10% (4 Gg) (8Gg) from the energy sector.
3. Nitrous Oxides (N2O) emissions standing at 3,777 Gg originated almost exclusively (96%) from agricultural sources. LUCF and energy sectors each account for 2% of N2O emissions.
4. Emissions of nitrogen oxides (NOx) were generated within three major sectors. The energy with the highest emission, 3.309 Gg, was responsible for 48% of emissions. LUCF emission sources produced another 2.992 Gg (44%) and agriculture 0.532 Gg (8%).
5. Carbon Monoxide (CO) emissions came from LUCF (105.4 Gg), energy (75.6 Gg) and agriculture-related sources (14.7 Gg), representing 54%, 39% and 7% of total CO emissions in 2000, respectively.
6. Non-methane Volatile Organic Compounds (NMVOCs) totalling 10.196 Gg were mainly generated within the energy sector (93%). The remaining 7% (0.712 Gg) came from industrial processes.
3.2 Sectoral emissions of greenhouse gases
3.2.1. Energy
With the exclusion of SO2, 70% of emissions from the energy sector, in 2000, were in the form of carbon dioxide (218 Gg CO2). 43% of the CO2 emissions came from the transport (TRAN) source category, 40% from energy industries (ENI), 7% from commercial and industrial (COIN), 6% from residential (RES), 3% from manufacturing and construction (MACO) and 1% from the agriculture, forestry and fisheries (AFF) categories.
For methane, the residential category generated a little over 97% (4.93 Gg CH4) of total emissions. The commercial and industrial category emitted a little over 2% and the other categories produced about 1% of the total methane emission.
Almost all emissions of nitrous oxides N2O emanated from the residential category (0.054 Gg N2O).
A total of 3.31 Gg NOx (nitrogen oxides) was emitted from the energy sector of The Gambia in the year 2000. The transport source category emitted about 50% (1.68 Gg NOx), the residential category about 41% (1.36 Gg NOx) and energy industries 7% (0.22 Gg NOx). The combined emissions from Manufacturing and Construction, Commercial and Industrial, and from the agriculture, forestry and fishing source categories was about 2% of the aggregate NOx emissions.
Carbon monoxide emissions originated principally from the residential sources category. Indeed, 90% (67.94 Gg CO) of emissions came from this category, followed in distant second place by the transport category which accounted for 8% of emissions (5.8 Gg CO). The remaining 2% (1.79 Gg CO) came from the Commercial and Industrial Category.
The residential category was the single major source of non-methane volatile organic compounds (NMVOCs) of which it emitted 8.15 Gg NMVOCs (86% of total). The transport category emitted about 12% (1.10Gg NMVOC)

Gambia’s Second National Communication
44
and another 2% (0.21 Gg NMVOC) came from the Commercial and Industrial category. The bulk of the SO2 emissions, that is, 3,032 Gg SO2, also emanated from the residential category.
SO2 emissions varied from 2,005 Gg in 1995 to over 3,000 Gg in 2000. There was a marked increase in the emissions between 1999 and 2000.
3.2.2. Industrial Processes
In 2000, about 43% (1.39Gg) of greenhouse gas emissions from industrial processes comprised of HFCs, 34% (1.07Gg) represented carbon dioxide, 22% (0.71 Gg) NMVOCs and 1% (0.04Gg) SF6 emissions.
HFC emissions were generated from consumption in refrigeration and air-conditioning equipment (9%), closed-cell foam blowing (41%), fire extinguishers (26%), aerosols (0.04%) and solvents (24%). The trend in the emissions of greenhouse gases from industrial processes from 1994 to 2000 shows a general increase.
3.2.3. Agriculture
Of the total emissions from agriculture, 51% were methane emissions from animal husbandry, rice cultivation, savannah burning and burnings of crop residues. Emissions of carbon monoxide from burning of savannahs and crop residues constituted 38% of the emissions from agriculture. Emissions of nitrous oxides mostly came from agricultural soils, burning of savannahs and crop residues, and constitute 10% of the total emission from agriculture. About 0.5Gg or 1% of the total emissions from agriculture were nitrogen oxide emissions.
Animal production generated 12.3Gg CH4 or 64% of emissions from agriculture. Rice cultivation produced 6.4Gg CH4 or 33% of methane emissions, crop residue burning resulted in 0.39Gg CH4 or 2% emissions, and 0.25Gg CH4 or 1% came from savannah burning.
About 83% (10.2Gg CH4) of the total methane emissions from animal production (12.3Gg CH4) was produced from cattle rearing operations. Emissions from other animal species (sheep, goats, donkeys, horses, mules, swine and poultry) add up to 2.1Gg CH4 (17%).
Emission trends in the agriculture sector, from 1994 to 2000, reveal methane emissions, principally from animal husbandry, as rising the fastest. This is followed by carbon monoxide, which comes mainly from burning of savannah and crop residues.
3.2.4. Land use change and forestry
In 2000 the Forestry Sector of The Gambia emitted about 519Gg of carbon dioxide into the atmosphere. Non-CO2 greenhouse gases (CH4, N2O, NOx and CO) were also emitted into the atmosphere by the sector but these are relatively insignificant, except for carbon monoxide (105,4Gg CO). Net emissions from this category were 519.1 Gg.
For emission and removals of CO2 by the LUCF category during the period 1994 to 2000, indications are that the forestry sector served as a sink of carbon dioxide from 1994 to 1998, whilst in 1999 and 2000 the sector changed to an emitter of carbon dioxide.
3.2.5. Waste
Emissions from the waste sector in 2000 were mainly composed of methane amounting to 8.27Gg, of which 79% came from the solid waste management source category. Other gases emitted were nitrous oxides amounting to about 0.00085Gg N2O. Emission of methane from waste management shows a rising trend from about 6.4Gg in 1994 to about 8.3Gg in 2000. This is mainly due to an increase in solid waste generated and dumping at disposal sites. On the other hand, emissions of N2O decreased between 1994 and 2000.

Gambia’s Second National Communication
45
Table 3.Error! Reference source not found.: Greenhouse gas emissions inventory of The Gambia for the year 2000
Greenhouse gas emissions (Gg)
Sectors/Sub-sectors/Activities CO2 CH4 N2O HFCs SF6 NOx CO NMVOC SO2
1: ENERGY 217.699 4.206 0.058 0.000 0.000 3.309 75.558 9.484 3031.941
Energy Industries 81.378 0.003 0.001 0.216 0.016 0.0054 0.132
Manufacturing Industries and Construction 5.552 0.019 0.001 0.0005 0.007
Transport 99.044 0.019 0.001 1.680 5.812 1.1113 0.129
Commercial/Residential/Agriculture/Forestry 31.725 4.184 0.056 1.395 69.728 8.3674 3031.673
2: INDUSTRIAL PROCESSES AND SOLVENTS 1.069 0.000 0.000 1.392 0.041 0.000 0.000 0.712 0.000
Mineral Products 1.069 0.224
Chemical Industry
Metal Production 0.041
Other Production (Paper &Pulp/Food & Drink) 0.488
Production of Halocarbons and Sulphur Hexafluoride
Consumption of Halocarbons and Sulphur Hexafluoride
1.392
3: AGRICULTURE 0.000 19.336 3.641 0.000 0.000 0.532 14.707 0.000 0.000
Enteric Fermentation 11.794
Manure Management 0.504
Rice Cultivation 6.400
Agricultural Soils 3.627
Prescribed Burning of Savannas 0.248 0.003 0.111 6.517
Field Burning of Agricultural Residues (1) 0.390 0.012 0.421 8.190
4: LAND USE CHANGE & FORESTRY 7377.213 12.041 0.083 0.000 0.000 2.992 105.360 0.000 0.000
Changes in Forest and Other Woody Biomass Stocks
Forest and Grassland Conversion 7377.2 12.041 0.083 2.992 105.360
Abandonment of Managed Lands
CO2 emissions from Soil 0.013
5: WASTE 0.000 8.267 0.001 0.000 0.000 0.000 0.000 0.000 0.000
Solid Waste Disposal on Land 6.506
Wastewater Handling 1.761 0.001
Waste Incineration
ALL SECTORS 329.023 43.850 3.783 1.392 0.041 6.832 195.624 10.196 3031.941
Global Warming Potential (GWP), 100 years integration
1 25 298 11,700 23,900 n/s n/s n/s n/s
MtCO2-e 0.329 1.096 1.127 16.3 0.989
Percentage of Total Emissions (MtCo2-e) 28.0 4.0 4.2 60.1 3.6

Gambia’s Second National Communication
46
CO2 CH4 N2O HFCs SF6 NOx CO NMVOC SO2
Table 3.1: Greenhouse gas removals inventory for the year 2000
Greenhouse gas removals (Gg)
Sectors/Sub-sectors/Activities CO2 CH4 N2O HFCs SF6 NOx CO NMVOC SO2
1: ENERGY 0.000
Energy Industries
Manufacturing Industries and Construction
Transport
Commercial/Residential/Agriculture/Forestry
2: INDUSTRIAL PROCESSES AND SOLVENTS 0.000
Mineral Products
Chemical Industry
Metal Production
Other Production (Paper &Pulp/Food & Drink)
Production of Halocarbons and Sulphur Hexafluoride
Consumption of Halocarbons and Sulphur Hexafluoride
3: AGRICULTURE 0.000
Enteric Fermentation
Manure Management
Rice Cultivation
Agricultural Soils
Prescribed Burning of Savannas
Field Burning of Agricultural Residues (1)
4: LAND USE CHANGE & FORESTRY 7266.900
Changes in Forest and Other Woody Biomass Stocks 6509.300
Forest and Grassland Conversion
Abandonment of Managed Lands 757.600
CO2 emissions from Soil

Gambia’s Second National Communication
47
5: WASTE 0.000
Solid Waste Disposal on Land
Wastewater Handling
Waste Incineration
ALL SECTORS 7266.900
Global Warming Potential (GWP), 100 years integration 1
MtCO2-e 7.267
Percentage of Total Emissions (MtCo2-e) 100

Gambia’s Second National Communication
48
4. GREENHOUSE GAS MITIGATION ASSESSMENT
4.1. Energy sector For this assessment, the long-range energy alternatives planning (LEAP) system was used as a
modelling tool. LEAP is an integrated modelling tool to analyse how energy is both consumed and
generated including the conversion processes.
Under LEAP, the energy sector was divided into demand and transformation units. Energy demand is
further sub-divided into branches such as households, industry, transport, central and local government
and street lighting. . The branches are further divided into smaller branches as far as configuration data
available allows.
IPCC Tier 1 default emissions factors for energy fuels were used to derive GHG emissions. In the
absence of emission factors for stoves rooted in the African experience, default emission factors were
borrowed from India. It is assumed that India being a developing country it will have the same stove
types as in The Gambia.
The economic data input has been correlated with the actual values from 2000 to 2010 and then
projected in the Reference Scenario progressively. The economy is assumed to grow continuously
between 2000 and 2030. Household sizes are also assumed to decrease as income increases.
Growth rates of key variables are based on current trends and projections aligned as closely as possible
with objectives and targets of national policies and programmes, such as Vision 2020, the national
population policy amongst others. Population growth was estimated to grow from 2.7 in 2000 to
3.5% in 2004 before gradually dropping to 3% by 2030. Regarding climate change, there are no
mitigation policy initiatives and the consumption pattern continues as normal growing at specified rates.
4.1.1. Mitigation Scenario 1 : energy efficiency
This scenario was compared with the reference scenario to measure the impact of energy efficiency
targeting households and institutions (including commercial enterprises). It studies the impact of
replacing incandescent light bulbs in hotels and homes with more energy-saving bulbs such as compact
florescent lamps (CFLs). Additionally, a switch from sodium light used for street lighting to LEDs is
assessed.
4.1.2. Mitigation Scenario 2 : improved cooking stoves
Currently, about 80% of household energy consumption is derived from forest-based solid fuels
(charcoal, firewood). This scenario assesses the impact of large-scale introduction and wide spread use
of improved wood and charcoal cooking stoves.
4.1.3. Mitigation Scenario 3 : LPG
This scenario looks at the mass introduction of liquefied petroleum gas (LPG) in Gambian households.
The aim of the policy is to have at least 80% of urban households and 10% of rural households to use
LPG for cooking by 2030.
4.1.4. Results: Mitigation Scenarios vs. Reference Scenario
As can be seen in Figure 4.1, all the mitigation scenarios indicate reductions in energy consumption compared to the reference scenario. The LPG and improved cooking stoves scenarios offer the biggest reductions, demonstrating that household energy consumption plays and will continue to play a major
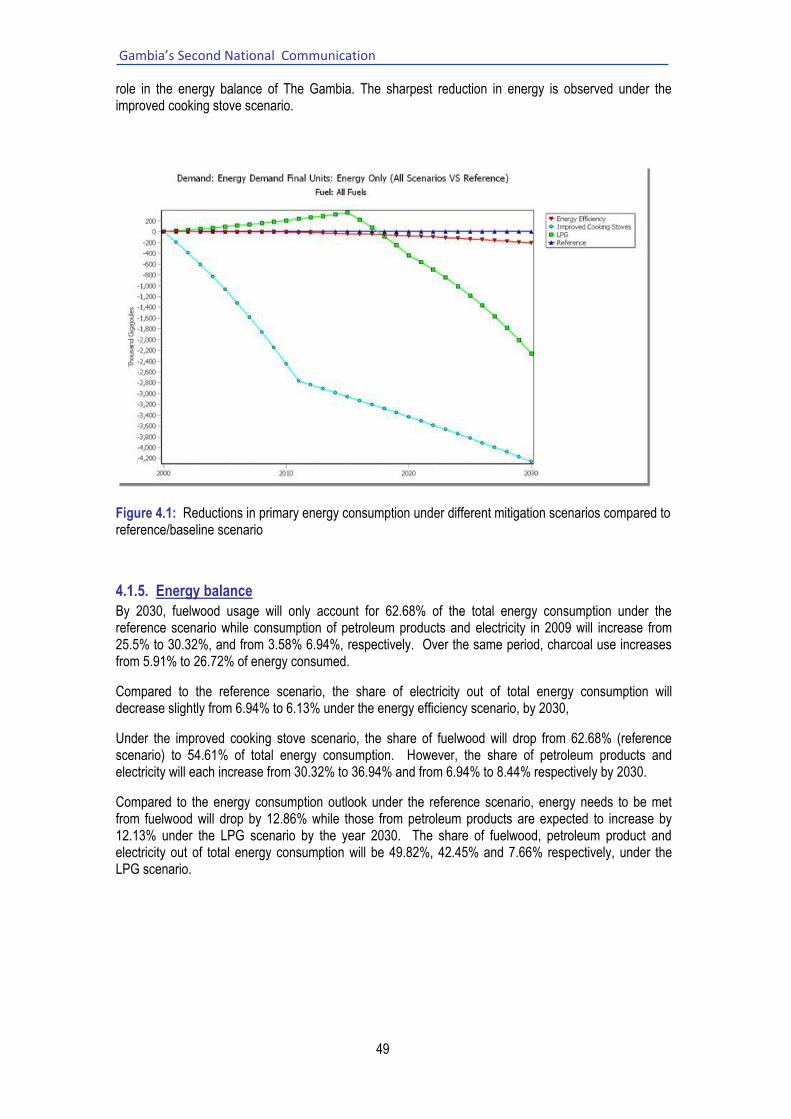
Gambia’s Second National Communication
49
role in the energy balance of The Gambia. The sharpest reduction in energy is observed under the improved cooking stove scenario.
Figure 4.1: Reductions in primary energy consumption under different mitigation scenarios compared to reference/baseline scenario
4.1.5. Energy balance
By 2030, fuelwood usage will only account for 62.68% of the total energy consumption under the reference scenario while consumption of petroleum products and electricity in 2009 will increase from 25.5% to 30.32%, and from 3.58% 6.94%, respectively. Over the same period, charcoal use increases from 5.91% to 26.72% of energy consumed.
Compared to the reference scenario, the share of electricity out of total energy consumption will decrease slightly from 6.94% to 6.13% under the energy efficiency scenario, by 2030,
Under the improved cooking stove scenario, the share of fuelwood will drop from 62.68% (reference scenario) to 54.61% of total energy consumption. However, the share of petroleum products and electricity will each increase from 30.32% to 36.94% and from 6.94% to 8.44% respectively by 2030.
Compared to the energy consumption outlook under the reference scenario, energy needs to be met from fuelwood will drop by 12.86% while those from petroleum products are expected to increase by 12.13% under the LPG scenario by the year 2030. The share of fuelwood, petroleum product and electricity out of total energy consumption will be 49.82%, 42.45% and 7.66% respectively, under the LPG scenario.
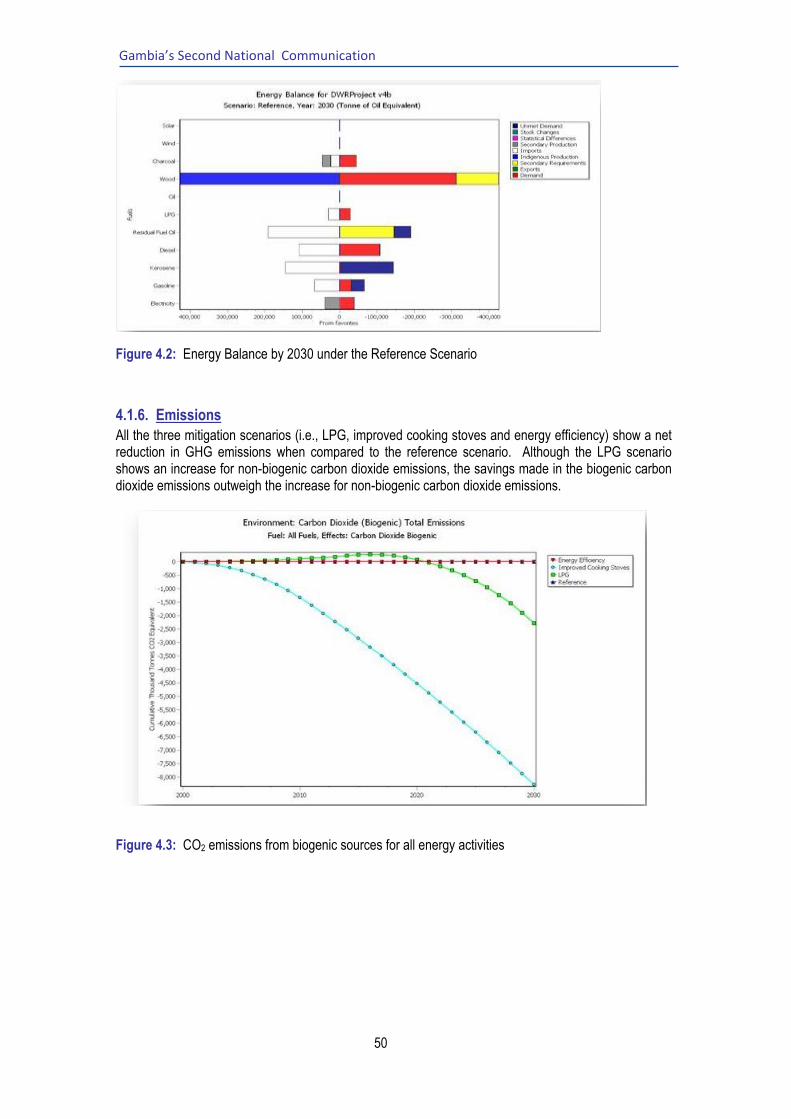
Gambia’s Second National Communication
50
Figure 4.2: Energy Balance by 2030 under the Reference Scenario
4.1.6. Emissions
All the three mitigation scenarios (i.e., LPG, improved cooking stoves and energy efficiency) show a net reduction in GHG emissions when compared to the reference scenario. Although the LPG scenario shows an increase for non-biogenic carbon dioxide emissions, the savings made in the biogenic carbon dioxide emissions outweigh the increase for non-biogenic carbon dioxide emissions.
Figure 4.3: CO2 emissions from biogenic sources for all energy activities

Gambia’s Second National Communication
51
Figure 4.4: Non biogenic CO2 emissions from all energy activities compared to the Reference Scenario
Table 4.1: Cumulative impact of mitigation measures on GHG emissions
Reference scenario GHG Emission (Mt) deviations under different mitigation scenarios
Scenario CO2 CH4 N2O NOX CO NMVOCs SO2
Reference 56,130,313.4 105,250 1,829.9 86,757.5 1,859,593 237,366.8 18,256.6
Energy efficiency -510,100.0 -28.1 0.0 -13,327.2 -2,460.7 0.0 0.0
Improved cooking stove -8,424,600.0 -37,108.8 -309.2 -7,156.1 -506,807.5 -95,223.2 0.0
LPG -1,339,600.0 -19,511.0 -39.1 344.9 -216,823.3 -51,972.0 1.1
Apart from N2O and SO2 emissions, Table 4.1 shows significant reductions of GHG emissions in all three
mitigation scenarios when compared to the reference scenario.

Gambia’s Second National Communication
52
5. VULNERABILITY AND ADAPTATION ASSESSMENT
5.1. Past and current climate Table 5.1 shows statistics of selected climate variables from archives of the National Meteorological and Hydrological Service (NMHS). From the table entries, it is observed that the mean annual temperature of The Gambia is around 28°C. Annual maxima and minima are on average 35°C and 22°C, respectively. Significant rainfall is recorded between June and October, and the long-term mean annual rainfall of 860mm is largely determined by July-August-September rainfall. Average monthly humidity is low during the dry season and reaches about 80% in August and September. Solar radiation is highest in the months of March through June.
Table 5.1: Selection of historical climate statistics of The Gambia
JAN FEB MAR APR MAY JUN JUL AUG SEPT OCT NOV DEC ANNUAL
Mean temperature (°C)
1951 - 2005 24.9 26.7 28.4 29.5 30.1 29.7 28.2 27.6 27.7 28.5 27.4 25.3 27.8
Minimum temperature (°C)
1951 - 2005 16.1 18.4 21.3 23.9 25.6 25.1 23.9 23.4 23.0 23.2 19.0 16.0 21.6
Maximum temperature (°C)
1951 - 2005 33.9 36.1 37.9 38.6 38.1 35.8 32.8 31.8 32.3 34.0 35.4 34.1 35.1
Rainfall (mm)
1951 - 2005 0.34 0.37 0.03 0.13 7.44 77.06 202.6 290.5 212.5 65.06 3.30 0.53 859.9
SOLAR RADIATION (W/m2)
SOLAR RADIATION(Langley/day)
1971 - 1984 492 597 625 624 607 550 483 481 503 545 516 461 540
Solar radiation (Joules)
1972 - 2002 4539 5433 5781 6132 6004 5180 4704 4648 4973 4868 4351 4185 5,066
Relative humidity (%)
1951 - 2005 38 36 38 42 50 63 75 80 80 75 58 44 56.8
Wind speed (Knots)
1951 - 2005 5 5 5 5 5 5 4 4 3 3 3 4 4.3
Potential evapotranspiration (mm)
1951 - 2005 109.2 106.4 107.5 105.8 102.0 119.9 129.1 124.9 121.3 112.5 106.7 96.2 1,341

Gambia’s Second National Communication
53
5.2. Climate change scenarios To develop the climate change scenarios for The Gambia, entries in Table 5.1 were combined with outputs from General Circulation Models extracted from the MAGGICC-SENGEN Model. To recapitulate, MAGICC/SCENGEN is a coupled gas-cycle/climate model (MAGICC) that drives a spatial climate-change scenario generator (Wigley and Raper;1992, 2001, 2002, Raper et al. 1996,, Wigley; 1993, 2000 and Wigley et al. 2002). SCENGEN uses the scaling method of Santer et al. (1990) to produce spatial patterns of change from an extensive database of atmosphere-ocean global circulation models (AOGCMs). The scaling method is based on the separation of the global-mean and spatial-pattern components of future climate change, and the further separation of the latter into greenhouse-gas and aerosol components. Spatial patterns in the database are „then normalised‟ and expressed as changes per 1°C change in global-mean temperature. These normalised greenhouse-gas and aerosol components are appropriately weighted, added, and scaled up to the global-mean temperature defined by MAGICC for a given year to arrive at the most appropriate GCM output for climate of The Gambia. Table 5.2 shows mean monthly temperatures extracted from SCENGEN for each general circulation model (GCM). Three GCMs which record the highest correlation coefficients (r) with baseline/historical climate of The Gambia are adopted for use in the impacts assessment. In Table 5.2, these GCMs are identified as the Canadian Climate Centre Model (CCC199), Australian GCM (BMRC98) and Global Fluid Dynamic Laboratory GCM (GFDL90). Table 5.2: Comparison of model performance
MODELS JAN FEB MAR APR MAY JUN JUL AUG SEP OCT NOV DEC Correlatio
n Coefficient 1951 -
2005 24.9 26.7 28.4 29.5 30.1 29.7 28.2 27.6 27.7 28.5 27.4 25.3
BMRC 98 28.8 30.6 33.2 35.7 36.3 35.3 33.3 31.6 30.8 32.0 31.2 29.1 0.96
CCC199 21.3 23.9 27.5 30.2 30.6 30.2 28.3 27.3 27.5 26.9 24.3 22.0 0.97
CCSR96 29.8 31.4 33.3 33.8 32.6 31.9 28.6 26.2 27.9 29.5 29.8 29.2 0.47
CERF98 26.1 29.2 32.9 33.7 32.7 29.8 28.8 28.1 28.4 28.9 27.5 25.2 0.82
CSI296 20.6 22.1 24.2 25.6 26.2 26.6 26.0 25.3 26.0 25.7 23.5 21.2 0.89
CSM_98 21.5 23.3 26.0 27.0 25.9 24.5 23.7 23.6 24.1 24.1 22.9 21.6 0.88
ECH395 24.8 26.4 29.3 31.8 31.6 30.1 27.6 26.7 26.8 27.5 27.0 25.5 0.92
ECH498 26.4 28.3 30.7 31.9 30.9 28.5 26.2 25.3 25.4 26.4 27.7 26.6 0.58
GFDL90 23.6 25.9 27.3 28.4 28.8 28.5 27.7 26.9 27.6 28.6 27.0 24.2 0.96
GISS95 29.8 31.4 32.2 31.8 31.0 29.8 28.3 27.1 26.8 27.1 28.5 29.4 0.18
HAD295 26.1 27.3 29.1 30.0 29.6 28.8 28.0 27.0 27.8 28.9 27.7 26.2 0.93
HAD300 23.9 26.6 28.9 29.6 29.2 28.2 26.6 26.2 27.1 27.8 26.4 23.9 0.93
IAP_97 22.0 23.5 26.2 27.6 28.2 28.4 27.9 27.2 27.1 27.2 25.7 23.3 0.91
IMD_98 24.8 28.6 30.9 31.3 30.9 28.7 25.8 23.9 24.9 27.4 26.9 25.4 0.67
5.2.1. Temperature
Table 5.3 shows projected changes in mean monthly temperatures, at 10-year intervals, from 2010 to 2100. These changes are added to the mean monthly temperature of The Gambia (first row of Table 5.4) to obtain the projected mean monthly temperatures of The Gambia for the corresponding period (Table
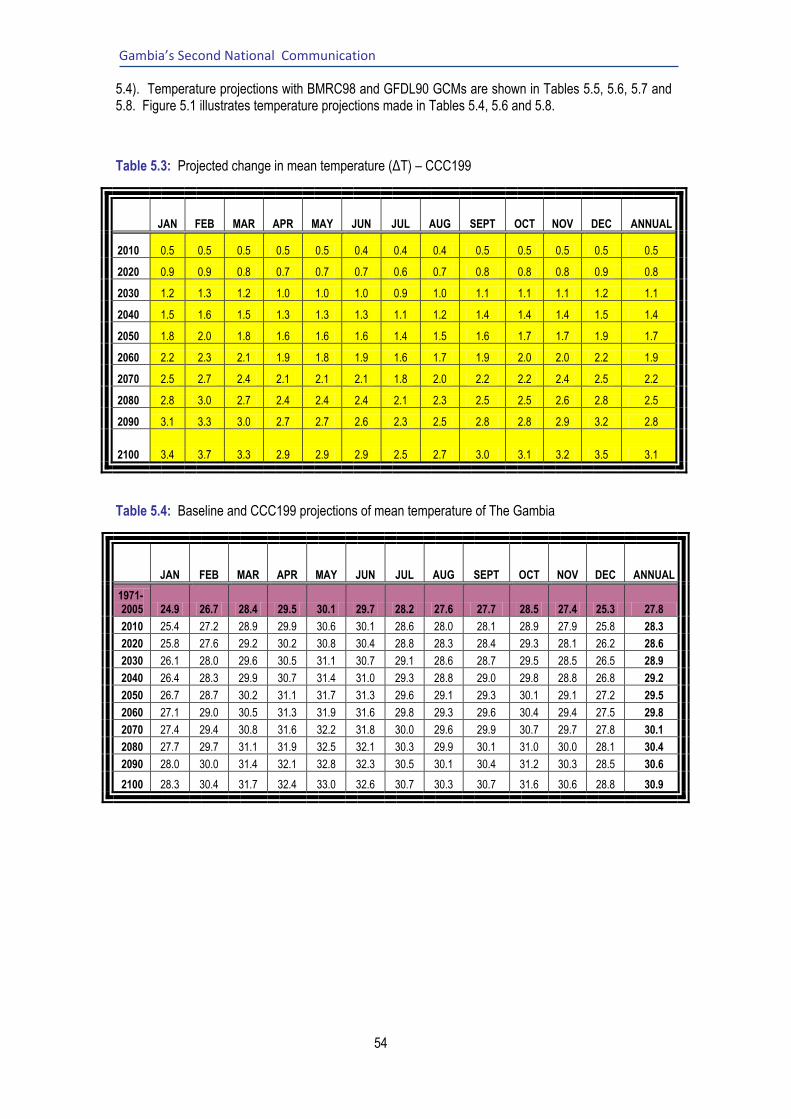
Gambia’s Second National Communication
54
5.4). Temperature projections with BMRC98 and GFDL90 GCMs are shown in Tables 5.5, 5.6, 5.7 and 5.8. Figure 5.1 illustrates temperature projections made in Tables 5.4, 5.6 and 5.8.
Table 5.3: Projected change in mean temperature (ΔT) – CCC199
JAN FEB MAR APR MAY JUN JUL AUG SEPT OCT NOV DEC ANNUAL
2010 0.5 0.5 0.5 0.5 0.5 0.4 0.4 0.4 0.5 0.5 0.5 0.5 0.5
2020 0.9 0.9 0.8 0.7 0.7 0.7 0.6 0.7 0.8 0.8 0.8 0.9 0.8
2030 1.2 1.3 1.2 1.0 1.0 1.0 0.9 1.0 1.1 1.1 1.1 1.2 1.1
2040 1.5 1.6 1.5 1.3 1.3 1.3 1.1 1.2 1.4 1.4 1.4 1.5 1.4
2050 1.8 2.0 1.8 1.6 1.6 1.6 1.4 1.5 1.6 1.7 1.7 1.9 1.7
2060 2.2 2.3 2.1 1.9 1.8 1.9 1.6 1.7 1.9 2.0 2.0 2.2 1.9
2070 2.5 2.7 2.4 2.1 2.1 2.1 1.8 2.0 2.2 2.2 2.4 2.5 2.2
2080 2.8 3.0 2.7 2.4 2.4 2.4 2.1 2.3 2.5 2.5 2.6 2.8 2.5
2090 3.1 3.3 3.0 2.7 2.7 2.6 2.3 2.5 2.8 2.8 2.9 3.2 2.8
2100 3.4 3.7 3.3 2.9 2.9 2.9 2.5 2.7 3.0 3.1 3.2 3.5 3.1
Table 5.4: Baseline and CCC199 projections of mean temperature of The Gambia
JAN FEB MAR APR MAY JUN JUL AUG SEPT OCT NOV DEC ANNUAL
1971-2005 24.9 26.7 28.4 29.5 30.1 29.7 28.2 27.6 27.7 28.5 27.4 25.3 27.8
2010 25.4 27.2 28.9 29.9 30.6 30.1 28.6 28.0 28.1 28.9 27.9 25.8 28.3
2020 25.8 27.6 29.2 30.2 30.8 30.4 28.8 28.3 28.4 29.3 28.1 26.2 28.6
2030 26.1 28.0 29.6 30.5 31.1 30.7 29.1 28.6 28.7 29.5 28.5 26.5 28.9
2040 26.4 28.3 29.9 30.7 31.4 31.0 29.3 28.8 29.0 29.8 28.8 26.8 29.2
2050 26.7 28.7 30.2 31.1 31.7 31.3 29.6 29.1 29.3 30.1 29.1 27.2 29.5
2060 27.1 29.0 30.5 31.3 31.9 31.6 29.8 29.3 29.6 30.4 29.4 27.5 29.8
2070 27.4 29.4 30.8 31.6 32.2 31.8 30.0 29.6 29.9 30.7 29.7 27.8 30.1
2080 27.7 29.7 31.1 31.9 32.5 32.1 30.3 29.9 30.1 31.0 30.0 28.1 30.4
2090 28.0 30.0 31.4 32.1 32.8 32.3 30.5 30.1 30.4 31.2 30.3 28.5 30.6
2100 28.3 30.4 31.7 32.4 33.0 32.6 30.7 30.3 30.7 31.6 30.6 28.8 30.9

Gambia’s Second National Communication
55
Table 5.5: Projected change in mean temperature (ΔT) - BMRC98 GCM
JAN FEB MAR APR MAY JUN
JUL AUG SEPT OCT NOV DEC ANNUAL
2010 0.4 0.4 0.4 0.4 0.4 0.4 0.5 0.5 0.5 0.4 0.4 0.4 0.4
2020 0.7 0.7 0.7 1.1 0.6 0.6 0.8 0.8 0.8 0.6 0.7 0.7 0.7
2030 1.2 1.1 1.2 1.1 1.0 1.0 1.2 1.4 1.2 1.2 1.1 1.2 1.1
2040 1.7 1.6 1.7 1.7 1.5 1.5 1.8 2.0 1.8 1.7 1.7 1.7 1.7
2050 2.1 2.0 2.1 2.1 1.9 1.9 2.2 2.6 2.3 2.1 2.1 2.2 2.1
2060 2.7 2.6 2.6 2.6 2.3 2.3 2.8 3.1 2.9 2.6 2.6 2.7 2.6
2070 3.1 3.0 3.1 3.0 2.8 2.7 3.2 3.7 3.3 3.1 3.0 3.2 3.1
2080 3.5 3.3 3.4 3.3 3.0 3.0 3.6 4.1 3.7 3.4 3.4 3.5 3.4
2090 3.7 3.6 3.7 3.6 3.3 3.2 3.9 4.5 4.1 3.7 3.7 3.8 3.7
2100 4.0 3.8 3.9 3.9 3.5 3.5
4.1 4.7 4.3 3.9 3.9 4.0 3.9
Table 5.6: Baseline and BMRC98 GCM projections of mean temperature of The Gambia
JAN FEB MAR APR MAY JUN JUL AUG SEPT OCT NOV DEC ANNUAL
1971-2005 24.9 26.7 28.4 29.5 30.1 29.7 28.2 27.6 27.7 28.5 27.4 25.3 27.8
2010 25.3 27.1 28.8 29.9 30.5 30.1 28.7 28.1 28.1 28.8 27.8 25.7 28.2
2020 25.6 27.4 29.1 30.6 30.7 30.3 29.0 28.4 28.4 29.1 28.0 26.0 28.6
2030 26.1 27.8 29.6 30.6 31.1 30.7 29.4 29.0 28.9 29.6 28.5 26.5 29.0
2040 26.6 28.3 30.1 31.1 31.6 31.2 30.0 29.6 29.5 30.1 29.0 27.0 29.5
2050 27.0 28.7 30.5 31.5 32.0 31.6 30.4 30.2 30.0 30.6 29.5 27.5 30.0
2060 27.6 29.3 31.0 32.0 32.4 32.0 31.0 30.7 30.5 31.1 29.9 28.0 30.4
2070 28.0 29.7 31.5 32.5 32.9 32.4 31.4 31.3 31.0 31.5 30.4 28.5 30.9
2075 28.2 29.8 31.7 32.7 33.0 32.6 31.7 31.5 31.2 31.7 30.6 28.7 31.1
2080 28.4 30.0 31.8 32.8 33.1 32.7 31.8 31.7 31.4 31.9 30.7 28.8 31.3
2090 28.6 30.3 32.1 33.1 33.4 32.9 32.1 32.1 31.7 32.2 31.0 29.1 31.6
2100 28.9 30.5 32.3 33.3 33.6 33.2 32.3 32.3 31.9 32.4 31.3 29.3 31.8
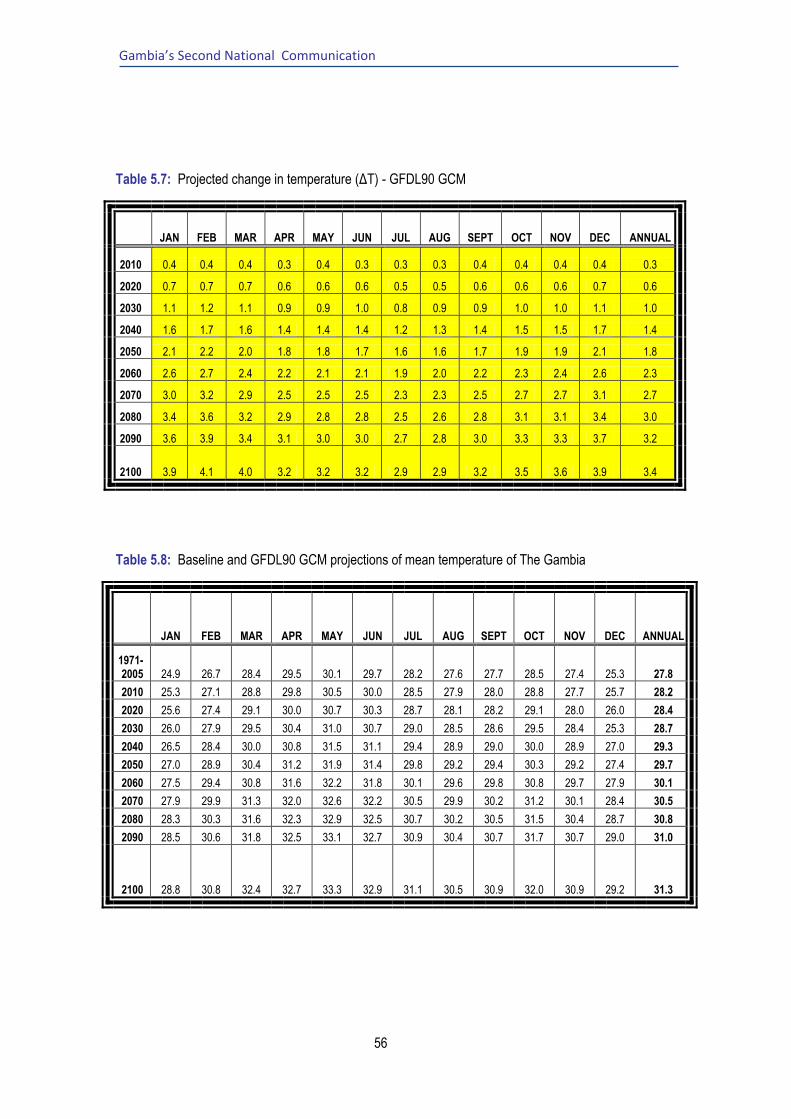
Gambia’s Second National Communication
56
Table 5.7: Projected change in temperature (ΔT) - GFDL90 GCM
JAN FEB MAR APR MAY JUN JUL AUG SEPT OCT NOV DEC ANNUAL
2010 0.4 0.4 0.4 0.3 0.4 0.3 0.3 0.3 0.4 0.4 0.4 0.4 0.3
2020 0.7 0.7 0.7 0.6 0.6 0.6 0.5 0.5 0.6 0.6 0.6 0.7 0.6
2030 1.1 1.2 1.1 0.9 0.9 1.0 0.8 0.9 0.9 1.0 1.0 1.1 1.0
2040 1.6 1.7 1.6 1.4 1.4 1.4 1.2 1.3 1.4 1.5 1.5 1.7 1.4
2050 2.1 2.2 2.0 1.8 1.8 1.7 1.6 1.6 1.7 1.9 1.9 2.1 1.8
2060 2.6 2.7 2.4 2.2 2.1 2.1 1.9 2.0 2.2 2.3 2.4 2.6 2.3
2070 3.0 3.2 2.9 2.5 2.5 2.5 2.3 2.3 2.5 2.7 2.7 3.1 2.7
2080 3.4 3.6 3.2 2.9 2.8 2.8 2.5 2.6 2.8 3.1 3.1 3.4 3.0
2090 3.6 3.9 3.4 3.1 3.0 3.0 2.7 2.8 3.0 3.3 3.3 3.7 3.2
2100 3.9 4.1 4.0 3.2 3.2 3.2 2.9 2.9 3.2 3.5 3.6 3.9 3.4
Table 5.8: Baseline and GFDL90 GCM projections of mean temperature of The Gambia
JAN FEB MAR APR MAY JUN JUL AUG SEPT OCT NOV DEC ANNUAL
1971-2005 24.9 26.7 28.4 29.5 30.1 29.7 28.2 27.6 27.7 28.5 27.4 25.3 27.8
2010 25.3 27.1 28.8 29.8 30.5 30.0 28.5 27.9 28.0 28.8 27.7 25.7 28.2
2020 25.6 27.4 29.1 30.0 30.7 30.3 28.7 28.1 28.2 29.1 28.0 26.0 28.4
2030 26.0 27.9 29.5 30.4 31.0 30.7 29.0 28.5 28.6 29.5 28.4 25.3 28.7
2040 26.5 28.4 30.0 30.8 31.5 31.1 29.4 28.9 29.0 30.0 28.9 27.0 29.3
2050 27.0 28.9 30.4 31.2 31.9 31.4 29.8 29.2 29.4 30.3 29.2 27.4 29.7
2060 27.5 29.4 30.8 31.6 32.2 31.8 30.1 29.6 29.8 30.8 29.7 27.9 30.1
2070 27.9 29.9 31.3 32.0 32.6 32.2 30.5 29.9 30.2 31.2 30.1 28.4 30.5
2080 28.3 30.3 31.6 32.3 32.9 32.5 30.7 30.2 30.5 31.5 30.4 28.7 30.8
2090 28.5 30.6 31.8 32.5 33.1 32.7 30.9 30.4 30.7 31.7 30.7 29.0 31.0
2100 28.8 30.8 32.4 32.7 33.3 32.9 31.1 30.5 30.9 32.0 30.9 29.2 31.3

Gambia’s Second National Communication
57
1
27.8
28.9
29.5
30.1
30.6
27.8
29.0
29.9
30.9
31.5
27.8
28.7
29.7
30.5
31.0
28.0
29.0
30.0
31.0
32.0
2000 2010 2020 2030 2040 2050 2060 2070 2080 2090 2100
Tem
per
atu
re (
deg
Cel
siu
s)
CCC199 BMRC98 GFDL90
Figure 5.1: Mean temperature projections for The Gambia using three GCMs
5.2.2. Rainfall
Table 5.2 and Figures 5.2, 5.3.and 5.4 show projections of rainfall distributions obtained from the CCC199, BMRC98 and GFDL90 GCMs.
CCC199 projections indicate a change of 2% either side of the mean, whilst the other two GCMs indicate changes ranging between -1 and -54%. BMRC98 projections in particular, point to at least 20% decrease in rainfall by mid-century.
Table 5.9: Absolute and percentage difference between CCC199, BMRC98 and GFDL90 GCM projections and historical rainfall
CCC199 BMRC98 GFDL90 2010 - 2.0mm (0.24%) - 30.4mm (-4%) - 6.8mm (-1%)
2030 - 4.5mm (0.12%) - 85.9mm (-4%) -19.7mm (-1%)
2050 - 6.9mm (-1%) -161.7mm (-23%) -37.1mm (-5%)
2075 - 9.6mm (-1%) -244.0mm (-40%) -57.0mm (-7%)
2100 -13.0mm (-2%) -300.7mm (-54%) -69.1mm (-9%)

Gambia’s Second National Communication
58
From Figures 5.2, 5.3 and 5.4, the overall projected decreases in rainfall are most evident during the months of July, August and September, the wettest months in the year. 1
2
0
50
100
150
200
250.
300
JAN FEB MAR APR MAY JUN JUL AUG SEPT OCT NOV DEC
Rai
nfa
ll (m
m)
1971-2005 2010 2020 2030 2040 2050 2060 2070 2075 2080 2090 2100
Figure 5. 2: Trends of CCC199 projected mean monthly rainfall
1
0
50
100
150
200
250
300
350
JAN FEB MAR APR MAY JUN JUL AUG SEPT OCT NOV DEC
Rai
nfa
ll (m
m)
1971-2005 2010 2020 2030 2040 2050 2060 2070 2075 2080 2090 2100
Figure 5.3: Trends of BMRC98 projected mean monthly rainfall.
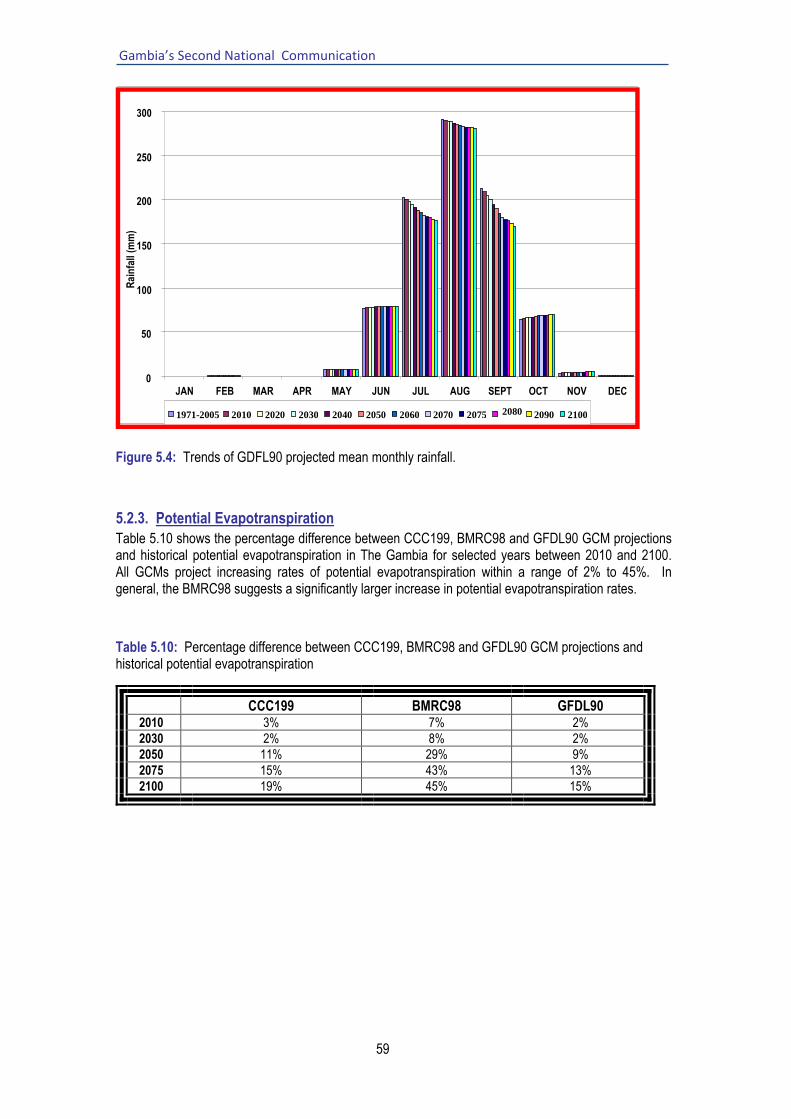
Gambia’s Second National Communication
59
1
2
0
50
100
150
200
250
300
JAN FEB MAR APR MAY JUN JUL AUG SEPT OCT NOV DEC
Rai
nfa
ll (m
m)
1971-2005 2010 2020 2030 2040 2050 2060 2070 2075 2080 2090 2100
Figure 5.4: Trends of GDFL90 projected mean monthly rainfall.
5.2.3. Potential Evapotranspiration
Table 5.10 shows the percentage difference between CCC199, BMRC98 and GFDL90 GCM projections and historical potential evapotranspiration in The Gambia for selected years between 2010 and 2100. All GCMs project increasing rates of potential evapotranspiration within a range of 2% to 45%. In general, the BMRC98 suggests a significantly larger increase in potential evapotranspiration rates.
Table 5.10: Percentage difference between CCC199, BMRC98 and GFDL90 GCM projections and historical potential evapotranspiration
CCC199 BMRC98 GFDL90 2010 3% 7% 2%
2030 2% 8% 2%
2050 11% 29% 9%
2075 15% 43% 13%
2100 19% 45% 15%
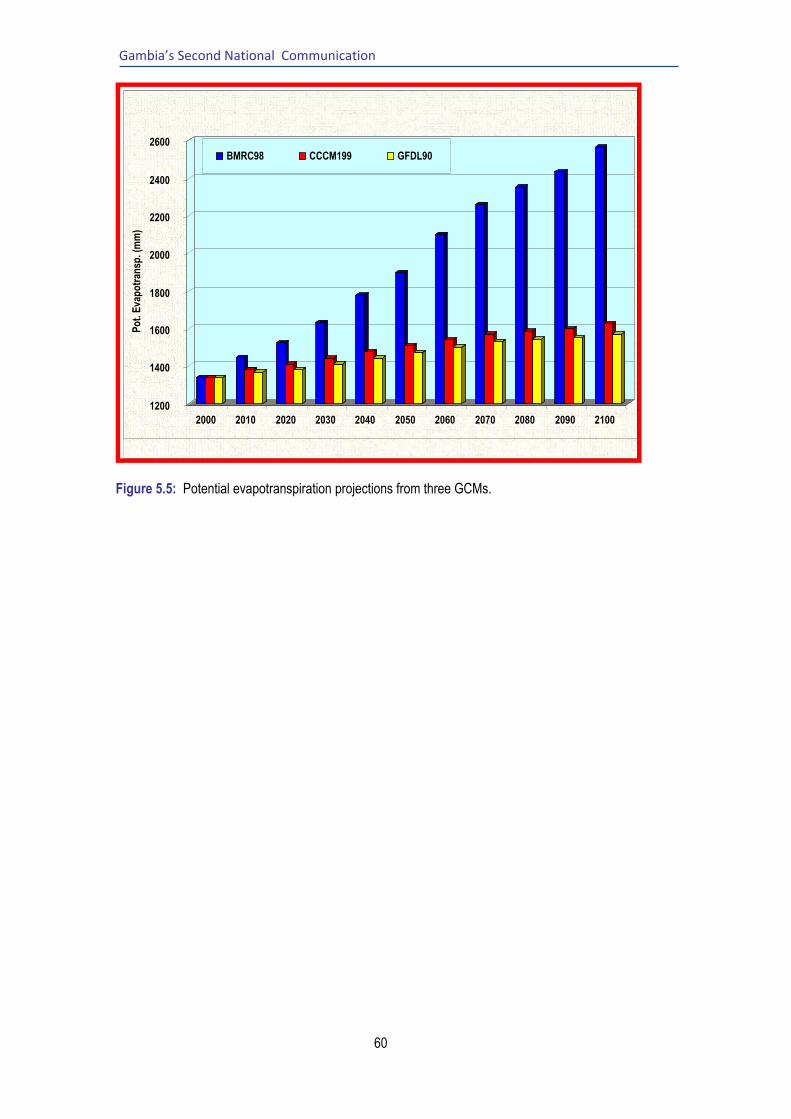
Gambia’s Second National Communication
60
1
2
1200
1400
1600
1800
2000
2200
2400
2600 P
ot.
Eva
po
tran
sp. (
mm
)
2000 2010 2020 2030 2040 2050 2060 2070 2080 2090 2100
BMRC98 CCCM199 GFDL90
Figure 5.5: Potential evapotranspiration projections from three GCMs.
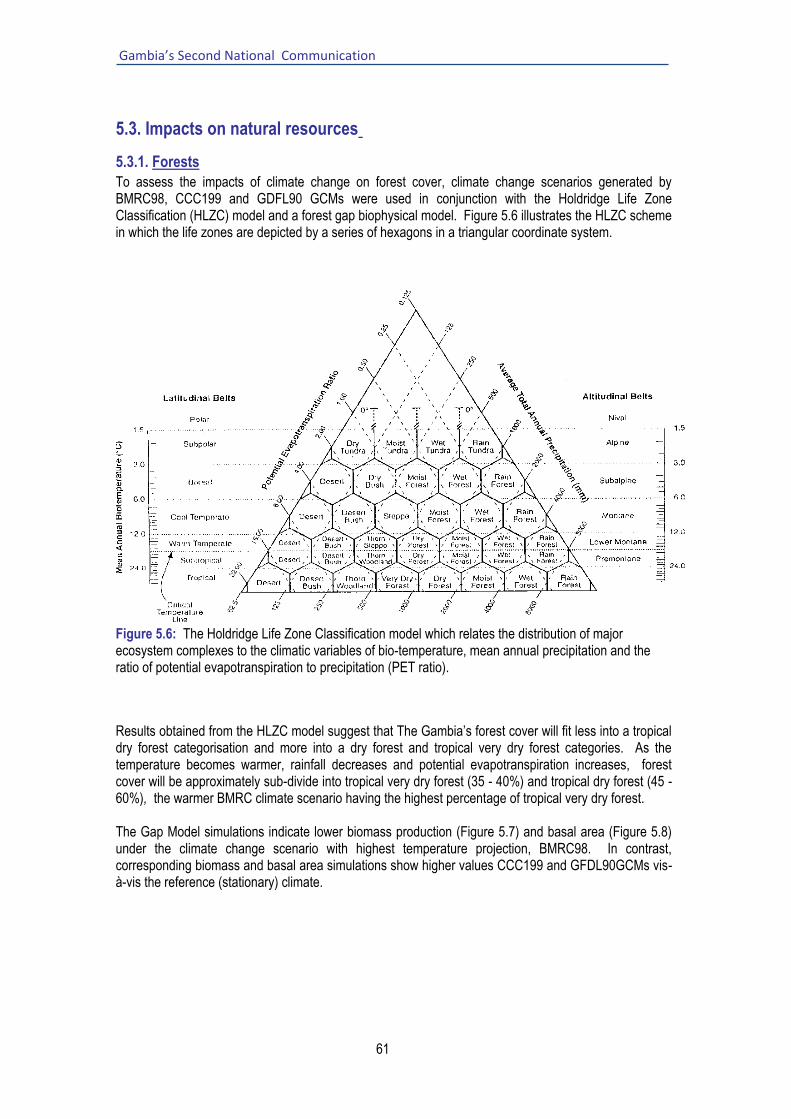
Gambia’s Second National Communication
61
5.3. Impacts on natural resources
5.3.1. Forests
To assess the impacts of climate change on forest cover, climate change scenarios generated by BMRC98, CCC199 and GDFL90 GCMs were used in conjunction with the Holdridge Life Zone Classification (HLZC) model and a forest gap biophysical model. Figure 5.6 illustrates the HLZC scheme in which the life zones are depicted by a series of hexagons in a triangular coordinate system.
Figure 5.6: The Holdridge Life Zone Classification model which relates the distribution of major ecosystem complexes to the climatic variables of bio-temperature, mean annual precipitation and the ratio of potential evapotranspiration to precipitation (PET ratio).
Results obtained from the HLZC model suggest that The Gambia‟s forest cover will fit less into a tropical dry forest categorisation and more into a dry forest and tropical very dry forest categories. As the temperature becomes warmer, rainfall decreases and potential evapotranspiration increases, forest cover will be approximately sub-divide into tropical very dry forest (35 - 40%) and tropical dry forest (45 - 60%), the warmer BMRC climate scenario having the highest percentage of tropical very dry forest. The Gap Model simulations indicate lower biomass production (Figure 5.7) and basal area (Figure 5.8) under the climate change scenario with highest temperature projection, BMRC98. In contrast, corresponding biomass and basal area simulations show higher values CCC199 and GFDL90GCMs vis-à-vis the reference (stationary) climate.

Gambia’s Second National Communication
62
Figure 5.7: Simulated biomass production in forest stand. “CURR‟ in this depiction of simulation results refers to the Reference/Baseline Climate Scenario.
Figure 5.8: Simulations of basal area of forest stand. “CURRENT‟ in this depiction of simulation results refers to the Reference/Baseline Climate Scenario.

Gambia’s Second National Communication
63
5.3.2. Rangelands
Gambian rangeland systems cover an area 400,000 hectares, that is, approximately 40% of The Gambia‟s total area. The Gambia‟s rangeland system consists of natural vegetation cover (grasses, shrubs and woody plants)
and agricultural lands. Crops are cultivated on the agricultural lands during the wet season and animals graze on crop residue left behind after harvesting. The natural vegetation cover is used for grazing throughout the year. Outside of agricultural lands, rangelands are characterised by poor drainage, rugged topography and often, low soil fertility.
The rangeland ecosystem model, SPUR2 2 , developed by the USDA-ARS Great Plain Systems Research Unit and Colorado State University was used to assess vulnerability of rangelands to climate change in The Gambia.
Essentially, the SPUR2 model consists of five basic components: hydrology, plant growth, animals (domestic and wildlife) and economics. The model simulates nutrient cycling through several compartments, including standing green and dead vegetation and soil organic matter. It also simulates competition between plant species and the impact of grazing on vegetation.3 The plant component of the model is a deterministic set of equations and relationships that can simulate the dynamics of both cool-season (C3) and warm-season (C4) plants.
The Dankunku Rangelands, an important are for stock ranching4 for which data to implement SPUR2 is available was used to assess the impacts of climate change.
Temperature and rainfall specifications under the BMRC98, CCC199 and GDFL90 GCMs as well as the reference climate, integrated with other environmental variables in the SPUR2 computation environment provide information on future conditions and productivity of rangeland ecosystems. To this effect, figures 5.9 through 5.13 strongly suggest a rapid decline in biomass production of warm-season grasses, warm-season forbs and shrubs in the Dankunku Rangelands from 2015 onwards.
The rate of decrease in biomass is also noticeably scenario dependent, with production decreasing fastest, in general, underBMRC98 signifying that as temperatures become warmer the temperature envelope of rangeland vegetation species is exceeded. Figs. 5.9, 5.10 and 5.11 suggest that biomass production under natural conditions could be close to zero by the middle of the century. Even though projected soil orgnaic matter continues to rise (figure 5.13) because nutrient mobilisation from dead above-ground biomass, is constrained by water deficits.
2 Second version of the Simulation of Production and Utilization of Rangelands (SPUR) model 3 In the Gambian context, where intensive feeding of ruminants is practised on small scale, extensive grazing
habits of livestock are equated with those of wildlife in the SPUR2 model. 4 covering 8,000ha and providing quasi-permanent residence for 6% cattle population and 20% sheep population

Gambia’s Second National Communication
64
Figure 5.9: Projected above-ground biomass production (g/m2) in the Dankunku rangelands. “CURRENT‟ in this depiction of simulation results refers to the Reference/Baseline Climate Scenario. Green and Black lines that closely track the Baseline Scenario results are associated with the CCC199 and GDFL90 scenarios respectively.
Figure 5.10: Projected below-ground biomass production (g/m2) in the Dankunku rangelands. “CURRENT‟ in this depiction of simulation results refers to the Reference/Baseline Climate Scenario. Green and Black lines that closely track the Baseline Scenario results are associated with the CCC199 and GDFL90 scenarios respectively.

Gambia’s Second National Communication
65
Figure 5.11: Projected biomass litter production (g/m2) from warm season grasses in the Dankunku rangelands. “CURRENT‟ in this depiction of simulation results refers to the Reference/Baseline Climate Scenario.
Figure 5.12: Projections of total biomass production (g/m2) in the Dankunku rangelands. “CURRENT‟ in this depiction of simulation results refers to the Reference/Baseline Climate Scenario.
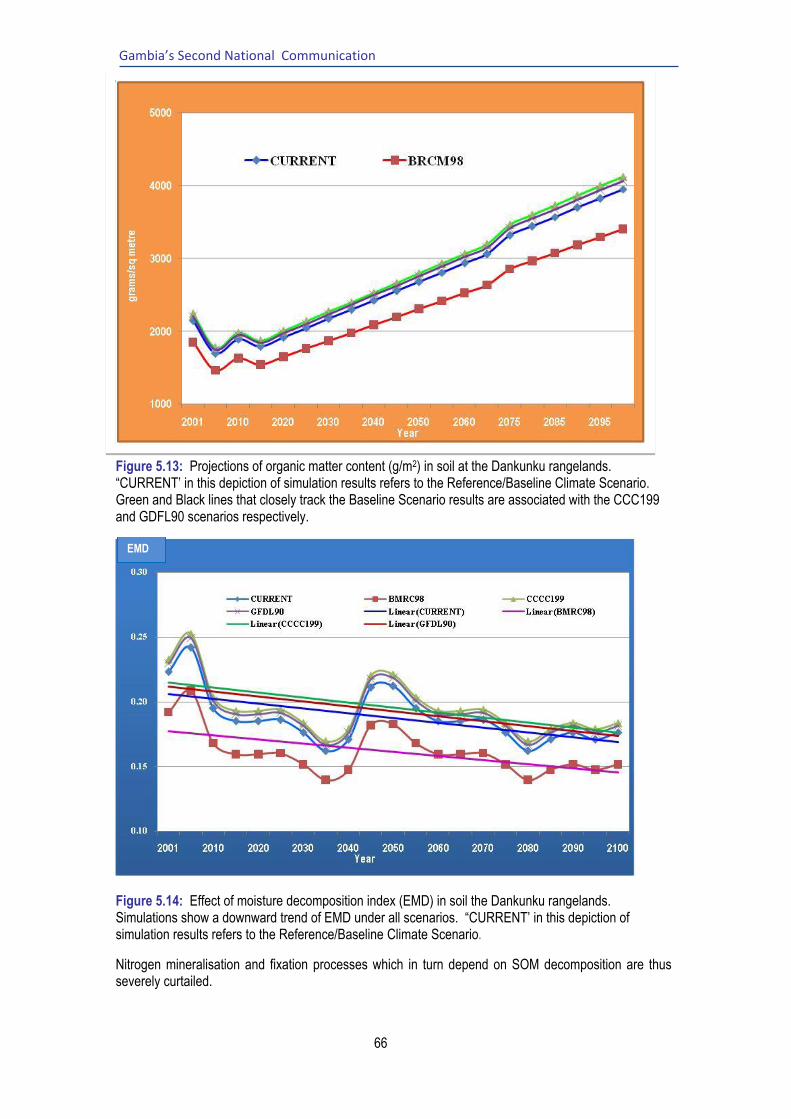
Gambia’s Second National Communication
66
Figure 5.13: Projections of organic matter content (g/m2) in soil at the Dankunku rangelands. “CURRENT‟ in this depiction of simulation results refers to the Reference/Baseline Climate Scenario. Green and Black lines that closely track the Baseline Scenario results are associated with the CCC199 and GDFL90 scenarios respectively. 1
2
EMD
Figure 5.14: Effect of moisture decomposition index (EMD) in soil the Dankunku rangelands. Simulations show a downward trend of EMD under all scenarios. “CURRENT‟ in this depiction of simulation results refers to the Reference/Baseline Climate Scenario.
Nitrogen mineralisation and fixation processes which in turn depend on SOM decomposition are thus severely curtailed.

Gambia’s Second National Communication
67
It can thus be concluded that the Dankunku Rangelands will be degraded under warmer and drier climate due to the projected increase in temperature under all scenarios and decrease in precipitation. It is also projected that reduced moisture will affect the nitrogen up-take of plants and their palatability to grazing animals, but of significantly greater importance is the sharp drop in biomass production under projected natural growing conditions. Long-term loss of ecosystem productivity is likely to adversely affect biodiversity in rangelands, even though soil carbon stocks look likely to increase as a consequence of biomass production failures.
5.4. Impacts on vulnerable sectors and regions
5.4.1. Health
Healthcare in The Gambia is based on a three-tier system: primary, secondary and the tertiary levels. The primary level is built on village health services and community clinics; the secondary around minor and major health centres whilst the tertiary encompasses treatment and services offered at general hospitals. Private clinics operating on the secondary level also offer out-patient and hospitalisation services.
Three technical directorates under the parent Ministry of Health and Social Welfare (MOHSW) are assigned missions for basic health services, planning and information, quality, hygiene and enforcement, and food standards. For management at regional levels, the country is divided into six health regions, each headed by a Regional Director of Health Services (RDHS). Regional Health Teams are responsible for primary and secondary health care facilities and their staff.
The effects of weather and climate inclusive of extremes (droughts, floods, storms) on human health are difficult to quantify because of poor reporting and paucity of research into secondary and delayed impacts. However, no one disputes that natural disasters caused by extreme weather adversely affect human health in many ways. Climate-related hazards faced by children, elderly people and other vulnerable socio-economic groups living in specific localities within The Gambia include droughts, flooding and sea level rise.5
Despite the paucity of research, there are well-founded health concerns regarding weather and climate-mediated illnesses. Malaria, for instance, is an endemic disease peaking in the rainy season (July-October). Around 1,000 children die every year from the direct effects of malaria which also accounts for 20% of medical consultations at out-patient departments of government health facilities2. Malaria is estimated to account for four percent (4%) of deaths in infants and a quarter of deaths in children aged five years and below.
Diarrhoeal diseases also exhibit seasonal patterns. Whereas 84% of the population have access to safe drinking water and 86% live in households with excreta disposal facilities6, the incidence of diarrhoea remains high due to inadequate water handling practices and environmental sanitation exacerbated by uncontrolled runoff and flooding.
Acute respiratory infections (including pneumonia) are second to malaria as the leading cause of morbidity and mortality especially among infants and young children. The British Medical Research Council (MRC) studies on infant mortality found out that 14% of under-five deaths in the central part of the country were attributable to acute respiratory tract infections. The Gambia lies within the meningitis belt in Africa and is episodically exposed to epidemics of meningococcal meningitis. Cases of cerebrospinal meningitis occurring during such episodes are often fatal.
5 Approximately, 20% of The Gambia‟s land area is covered by swamps and wet lands. Populations living along flood-prone areas in the Greater Banjul Area and parts of Basse are subjected to life-threatening floods and property damage each year following heavy rains
6 Mixed Indicator Cluster Survey ( MICS) conducted in 2006

Gambia’s Second National Communication
68
According to periodic surveys on causes of blindness, eye cataracts are the leading cause of blindness accounting for 47% in 1986 and 46% in 1996. Lately, health practitioners working with the National Eye Care Programme identified eye cataracts as one of the adverse health impacts of climate change.
There is an increasing body of evidence that climate patterns are changing globally with profound effects on the health and well being of citizens in countries throughout the world. Direct effects observed are related to thermal extremes, and more frequent occurrences of natural disasters. Indirect effects on the other hand include those arising from altered distribution of parasites and infectious disease vectors, reduced agricultural productivity, demographic shifts and social disruptions.
Temperature and rainfall trends would most probably allow malaria vectors to survive and extend to areas immediately surrounding their current habitats. The lengthening or shortening of the vector-breeding season may lead to shifts in malaria incidence and prevalence.
The frequency and intensity of storm-strength winds is expected to increase with climate change causing destruction of property, displacement of people and disruption of the socio-economic activities. Geographic location will be a key determinant of vulnerability. For instance populations living near coastal areas, rivers/streams and other waterways could be at a higher risk of flooding and diseases like cholera, distress and psychological trauma.
On top of population pressures, climate change forcing and impacts on environmental resources could alter breeding habitats of disease vectors and vector-borne transmission pathways. Indeed, dramatic climatic changes hold the potential to create environmental refugees as populations are forced to migrate from areas where livelihood support systems are under severe stress or have broken down to other areas or regions where new opportunities beckon. However, a sudden influx of refugees could spell trouble for high population areas when contagious diseases are at issue.
Climate change can impact heavily on natural ecosystems. Therefore, it is quite likely that some floristic species essential to traditional/alternative medicine will be become rarer not to say extinct.
5.4.2. Agriculture
The agriculture sector is characterised by small-scale, subsistence rainfed crop production (mainly groundnuts, coarse grains and rice) 7 , small-scale horticultural production and traditional livestock rearing. Agricultural output is generated by roughly 70,000 farming households on 57% of arable land. Livestock production is carried out nationwide by practically all rural households, but ownership of large ruminants is more concentrated. Cattle totalling about 300,000 head are the most valuable assets in the livestock sub-sector, closely followed by small ruminants comprising sheep (160,000) and goats (230,000). It is estimated that small-scale producers raise some 700,000 birds, representing 90% of the national poultry flock.
7 Other valuable crops include cotton cultivated on 3,000 hectares

Gambia’s Second National Communication
69
Figure 5.15: Contribution (%) of individual crops to total food crop production in 2010 (Source: Pre-Harvest, 2010/2011)
Figure 5.16: Food crop production (Mt) from 2007 to 2010 (Source: Pre-Harvest, 2010/2011)
On the side of government, agricultural matters are handled by the Ministry of Agriculture (MOA),
buttressed by Department of Agriculture (DOA) and National Agricultural Research Institute (NARI). In
the current set-up NARI conducts and provides research solutions on diverse agronomic aspects of crop
production and is complemented by the DOA which provides extension, technology and business
development and support services to farmers and livestock owners, and planning advice to higher
echelons of government. Six regional directorates distributed nationwide are directly responsible for
implementation of DOA programmes.
Key government policies/strategies in the agriculture sector over the past two decades include: (i) the
Strategy for Poverty Alleviation (SPA) (ii) Poverty Reduction Strategy Papers I &II, the latter notably
relevant for achieving the UN Millennium Development Goals (MDGs) on poverty and hunger; and (iii)

Gambia’s Second National Communication
70
the agriculture and natural resources (ANR) policy assigned an objective of improving and sustaining
measurable levels of food and nutrition security for vulnerable populations in particular.
Elevated atmospheric CO2 concentrations are expected to increase crop yields, but higher temperatures and water shortage may act to counterbalance this beneficial effect. Recent experiments have shown that crop response to elevated CO2 is relatively greater when water is a limiting factor. The contrary is true for nitrogen applications. Indeed, well fertilised crops respond more positively to CO2 than less fertilised ones.
The impact of climate change on irrigated production was assessed with a crop growth model using BMRC98, CCC199 and GDFL90 climate scenarios as driving inputs. Site-specific data were taken from Kuntaur, lying in the heart of the major rice-growing area of the country. Suffice to recall that production is an essential pillar of The Gambia‟s drive for food self-sufficiency. Four major aspects of rice production were assessed, namely; grain dry weight (kg/ha), leaf dry weight (kg/ha), stem dry weight (kg/ha), and cumulative nitrogen uptake (kg N/ha).
Figure 5.17 below illustrate the time course of grain dry weight (kg/ha) of rice crop and its final value, that is crop yield, under different climate scenarios. It shows a yield increases in the order of 0.2 to 0.3 tonnes/ha under the CCC199 and GDFL90 climate change scenarios. Additionally, it shows a drop in yield from 7,365 kg/ha under the reference scenario to 6,342 kg/ha under the BMRC98 scenario; a drop of approximately 16% so to speak.
Figure 5.17: Simulated grain dry weight (kg/ha) of irrigated rice at Kuntaur (The Gambia). “CURR‟ in this depiction of simulation results refers to the Reference/Baseline Climate Scenario.

Gambia’s Second National Communication
71
Figure 5.18: Simulated leaf dry weight (kg/ha) of irrigated rice at Kuntaur (The Gambia). Under the reference climate change scenario, simulated leaf dry weight at the end of the crop cycle lies between 2250 kg/ha (BMRC98) and 2700 kg/ha (CCC199). “CURR‟ in this depiction of simulation results refers to the Reference/Baseline Climate Scenario.
.
Figure 5.19: Simulated stem dry weight (kg/ha) of irrigated rice at Kuntaur (The Gambia). “CURR‟ in this depiction of simulation results refers to the Reference/Baseline Climate Scenario.
Similar to leaf dry weight, stem dry weight of irrigated rice peaks before the crop reaches maturity, dropping precipitously to 1,000 kg/ha at the time of harvest in all climate change scenarios.
Simulation results in Figure 5.20 show small differences between time courses and total uptake (kg N/ha) at the end of rice crop cycle, under three climate scenarios investigated. Nitrogen uptake under BMRC98 occurs at a lower rate in all development phases of the rice crop, and is lower by 17.5% compared to the corresponding CCC199 value at the end of the crop cycle.

Gambia’s Second National Communication
72
1
2
Nit
rog
en u
pta
ke (
kg N
/ha)
1
2
Nit
rog
en u
pta
ke (
kg N
/ha)
Figure 5.20: Simulated cumulative nitrogen uptake (kg N/ha) of irrigated rice at Kuntaur (The Gambia). “CURR‟ in this depiction of simulation results refers to the Reference/Baseline Climate Scenario.
5.4.3. Fisheries
The Gambia has diverse aquatic habitats that include the River Gambia, its tributaries and floodplain systems, coastal habitats such as mangrove ecosystems. It has an even greater variety of ecologically and economically important species occupying these habitats. The combined fisheries catch from industrial and artisanal fishery operations lies between 22,000 and 30,00 tonnes, compared to an estimated maximum sustainable yield (MSY) potential of 80,000 metric tons per annum. Fish and fish products account for approximately 15 % of the country‟s exports. The fisheries sector accounts for 12% of GDP and its artisanal sub-division provides direct and indirect employment to 25,000 and livelihood support to 200,000 people. In general, fisheries policy seeks to safeguard the economic, social and environmental viability of the fisheries sector and increase the benefits for present and future generations. In this regard, the guiding principles for fisheries management are, in no particular order of priority, conservation and sustainable resource use, global responsibility, responsible fisheries management, and collective decision-making. The effects of global warming on riverine fish production was assessed using the following empirical formula
Q = B * W * (K1 * K2 * K3)
where Q = annual productivity (kg/km of river) W = average width of the river (m) B = the biogenic capacity. B = 1 – 3 for waters with little food for fish; B = 4 – 6 for
moderate richness in fish food; and B = 7 – 10 for waters that are rich in fish food.. K1 = annual average water temperature K2 = water salinity K3 = type of fish population present in river. The value for K3 can be approximated on
the basis of the percentage of fish found in rheophilic (fast flowing waters, and limnophilic (slow moving waters, from the relationship
K3 = ( 2L + R ) / 100 where L = the percentage of the fish comprised of limnophilic species and R = the percentage of fish comprised of rheophilic species. In this study L is assumed to be 5% and R is assumed to be 95% (Jallow 1997).

Gambia’s Second National Communication
73
Table 5.11 shows annual productivity as estimated for mean annual water temperatures. In contrast to the effects of GCMs (BMRC98, CCC199, GDFL90), productivity simulated under the reference (i.e. baseline scenario) is based on 1951 – 2005 temperature data. The baseline productivity of the River Gambia based on a temperature of 27.8OC is estimated at 18.9 * 106 kg/km. Results in Table 5.11 shows that productivity will increase above current values by 4% by 2030, 6 to 7% by 2050 and 10 to 12% by 2100.
Table 5.11: Annual productivity (kg/km) of the River Gambia and variation (%) with respect to productivity of 18.9 * 106 kg/km under current climate
Year CCC199 GDFL90 BMRC98
Productivity 106 kg/km
Variation %
Productivity 106 kg/km
Variation %
Productivity 106 kg/km
Variation %
18.9 0 18.9 0 18.9 0
2010 19.2 2 19.1 1 19.1 1
2020 19.4 3 19.3 2 19.4 3
2030 19.6 4 19.5 3 19.6 4
2040 19.8 5 19.8 5 20.0 6
2050 20.0 6 20.1 6 20.3 7
2060 20.2 7 20.4 8 20.6 9
2070 20.4 7 20.7 9 20.9 10
2080 20.5 8 20.9 10 21.2 11
2090 20.8 9 21.0 10 21.4 12
2100 21.0 10 21.2 11 21.5 12
Figure 5.21 shows the evolution of maximum sustainable yield (MSY) of the River Gambia as temperature increases over time in the GCMs previously mentioned. MSY increases throughout the simulation period, reaching 85 and 96 thousand tonnes by 2100, reflecting an increase of 35 – 39% 1
2
3
MS
Y (
x1,0
00 t
on
ne)
Figure 5.21: Maximum sustainable fisheries yield (thousand tonnes) in River Gambia with reference to the current estimate. The largest increase is associated with the BMRC98 scenario which features highest degree of warming among the three GCMs.

Gambia’s Second National Communication
74
Changes in MSY (computed for an average depth of 15 meters) with variations in total dissolved solids (TDS, concentration (CON) and alkalinity (ALK) of the River is shown for CCC199, BMRC and GDFL90 scenarios in Tables 5.12, 5.13 and 5.14. The Morphoedaphic Index for TDS is 4.00, for CON is 4.93 and for ALK is 0.47. Figure 5.22 shows the simulation results from the CCC199 Model for 15-metre depth for all the parameters. Table 5.12: CCC199 simulations of MSY in relation to temperature, total dissolved solids (TDS), concentration (CON) and alkalinity (ALK) of waters of the River Gambia averaging 15 metres deep.
Study variables Baseline CCC199
2010 2020 2030 2040 2050 2060 2070 2080 2090 2100
TEMP 27.8 28.3 28.6 28.9 29.2 29.5 29.8 30.1 30.4 30.6 30.9
YIELD= f(TEMP) 54.8 58.8 61.3 64 66.7 69.6 72.6 75.7 79 81.2 84.7
% VAR 0 7 11 14 18 21 25 28 31 33 35
YIELD=f(TDS) 62.3 66 68.3 70.7 73.2 75.8 78.4 81.2 84.1 86 89
% VAR 0 6 9 12 15 18 21 23 26 28 30
YIELD=f(CON) 66.1 70 72.5 75 77.6 80.4 83.2 86.1 89.1 91.2 94.4
% VAR 0 6 9 12 15 18 21 23 26 28 30
YIELD=f(ALK) 34.1 36.2 37.4 38.8 40.1 41.5 43 44.5 46.1 47.1 48.8
% VAR 0 6 9 12 15 18 21 23 26 28 30
Table 5.13: BMRC98 simulations of MSY in relation to temperature, total dissolved solids (TDS), concentration (CON) and alkalinity (ALK) of waters of the River Gambia averaging 15 metres deep.
Study variables Baseline BMRC98
2010 2020 2030 2040 2050 2060 2070 2080 2090 2100
TEMP 27.8 28.2 28.6 29 29.5 29.9 30.5 30.9 31.3 31.5 31.8
YIELD= f(TEMP) 54.8 58.8 61.3 64.9 69.6 73.6 80.1 84.7 89.6 92.2 96.1
% VAR 0 6 11 16 21 26 32 35 39 41 43
YIELD=f(TDS) 62.3 65.2 68.3 71.5 75.8 79.4 85 89 93.2 95.4 98.8
% VAR 0 4 9 13 18 22 27 30 33 35 37
YIELD=f(CON) 66.1 69.2 72.5 75.9 80.4 84.2 90.2 94.4 98.9 101.2 104.7
% VAR 0 4 9 13 18 21 27 30 33 35 37
YIELD=f(ALK) 34.1 35.8 37.4 39.2 41.5 43.5 46.6 48.8 51.1 52.3 54.1
% VAR 0 5 9 13 18 22 27 30 33 35 37

Gambia’s Second National Communication
75
Table 5.14: GDFL90 simulations of MSY in relation to temperature, total dissolved solids (TDS), concentration (CON) and alkalinity (ALK) of waters of the River Gambia averaging 15 metres deep.
Study variables Baseline GDFL90
2010 2020 2030 2040 2050 2060 2070 2080 2090 2100
TEMP 27.8 28.2 28.4 28.7 29.3 29.7 30.1 30.5 30.8 31 31.3
YIELD= f(TEMP) 54.8 58.8 59.6 62.2 67.7 71.6 75.7 80.1 83.5 85.9 89.6
% VAR 0 6 8 12 19 23 28 32 34 36 39
YIELD=f(TDS) 62.3 65.2 66.8 69.1 74.1 77.5 81.2 85 88 90.1 93.2
% VAR 0 4 7 10 16 20 23 27 29 31 33
YIELD=f(CON) 66.1 69.2 70.8 73.3 78.5 82.2 86.1 90.2 93.3 95.5 98.9
% VAR 0 4 7 10 16 20 23 27 29 31 33
YIELD=f(ALK) 34.1 35.8 36.6 37.9 40.6 42.5 44.5 46.6 48.2 49.4 51.1
% VAR 0 5 7 10 16 20 23 27 29 31 33
Results in Tables 5.12, 5.13 and 5.14 above indicate that MSY will increase under a future warmer climate (i.e. all GCMs) with the projected increase largest under the BMRC98 GCM, but projections of MSY with respect to TDS, CON and ALK exhibit slightly different rates of increase for all the models (CCC199 illustrated in Figure 5.22) 1
2 Year
Figure 5.22: Projection of maximum sustainable yield (tonnes) relative to changes in selected environmental variables for an average water depth of 15 metres.

Gambia’s Second National Communication
76
Figure 5.23 shows results of simulations of natural mortality based on temperature. In this figure, mortality projections increase from 1.15% under current climate to about to between 1.20% (CCC199) and 1.22% (BMRC98), by 2100. 1
2
3
Nat
ual
mo
rtal
ity
rate
Figure 5. 23: Projections of natural fish mortality due to temperature changes
Temperature effects on shrimp yield are assessed using the empirical relationship
Loge SCSY = a – b/T where,
SCSY = Stabilised Commercial Shrimp Yield (kg/hectare of inter-tidal vegetation) T = Annual air temperature (K), and a and b are coefficients estimated by regression analysis
Results of SCSY projections shown in Table 5.15 and Figure 5.24 indicate a 5% increase over the baseline scenario in 2010, steadily increasing to 46% by 2100. This is due to the preference and adaptability of shrimps to warm waters. Shrimps are also capable of living during the cold season in cool waters not dropping below 18OC. The feeding activity is mainly diurnal and migration is conditioned by temperature variations of its habitats. The minimum temperature for the adult upstream migration is at 180C. The spawning period for this species is during the rainy season. The post larvae stage of shrimps drifts into the river through tides into the mangroves during the rainy season and the juvenile shrimp migrates to the main channel of the river where it develops into sub-adults and migrates to the estuary where salinity is low. Table 5.15: SCSY computations for different GCMs and percentage variation with respect to SCSY under current conditions
GCM Year 2010 2020 2030 2040 2050 2060 2070 2080 2090 2100
CCC199 SCSY 92.0 96.4 101.2 105.8 111.1 116.2 121 124.2 132.5 138.5
% var 7 11 15 19 23 26 30 31 31 38
BMRC98 SCSY 91.1 95.8 102.4 111.3 119.2 129.1 138.3 146.2 152.8 158.3
% var 6 11 16 23 28 34 38 41 40 46
GFDL90 SCSY 90.4 94.0 98.4 107.4 114.2 122.1 129.9 136.4 141.3 146.6
% var 5 9 13 20 25 30 34 37 36 42
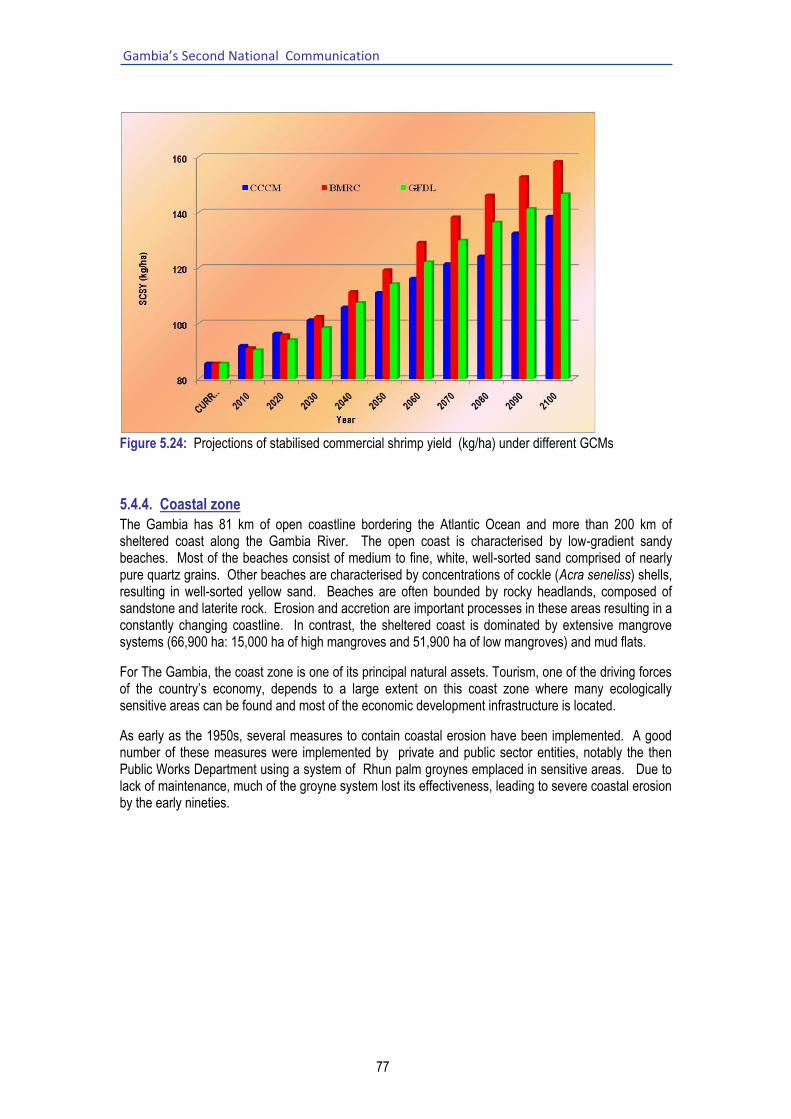
Gambia’s Second National Communication
77
Figure 5.24: Projections of stabilised commercial shrimp yield (kg/ha) under different GCMs
5.4.4. Coastal zone
The Gambia has 81 km of open coastline bordering the Atlantic Ocean and more than 200 km of sheltered coast along the Gambia River. The open coast is characterised by low-gradient sandy beaches. Most of the beaches consist of medium to fine, white, well-sorted sand comprised of nearly pure quartz grains. Other beaches are characterised by concentrations of cockle (Acra seneliss) shells, resulting in well-sorted yellow sand. Beaches are often bounded by rocky headlands, composed of sandstone and laterite rock. Erosion and accretion are important processes in these areas resulting in a constantly changing coastline. In contrast, the sheltered coast is dominated by extensive mangrove systems (66,900 ha: 15,000 ha of high mangroves and 51,900 ha of low mangroves) and mud flats.
For The Gambia, the coast zone is one of its principal natural assets. Tourism, one of the driving forces of the country‟s economy, depends to a large extent on this coast zone where many ecologically sensitive areas can be found and most of the economic development infrastructure is located.
As early as the 1950s, several measures to contain coastal erosion have been implemented. A good number of these measures were implemented by private and public sector entities, notably the then Public Works Department using a system of Rhun palm groynes emplaced in sensitive areas. Due to lack of maintenance, much of the groyne system lost its effectiveness, leading to severe coastal erosion by the early nineties.
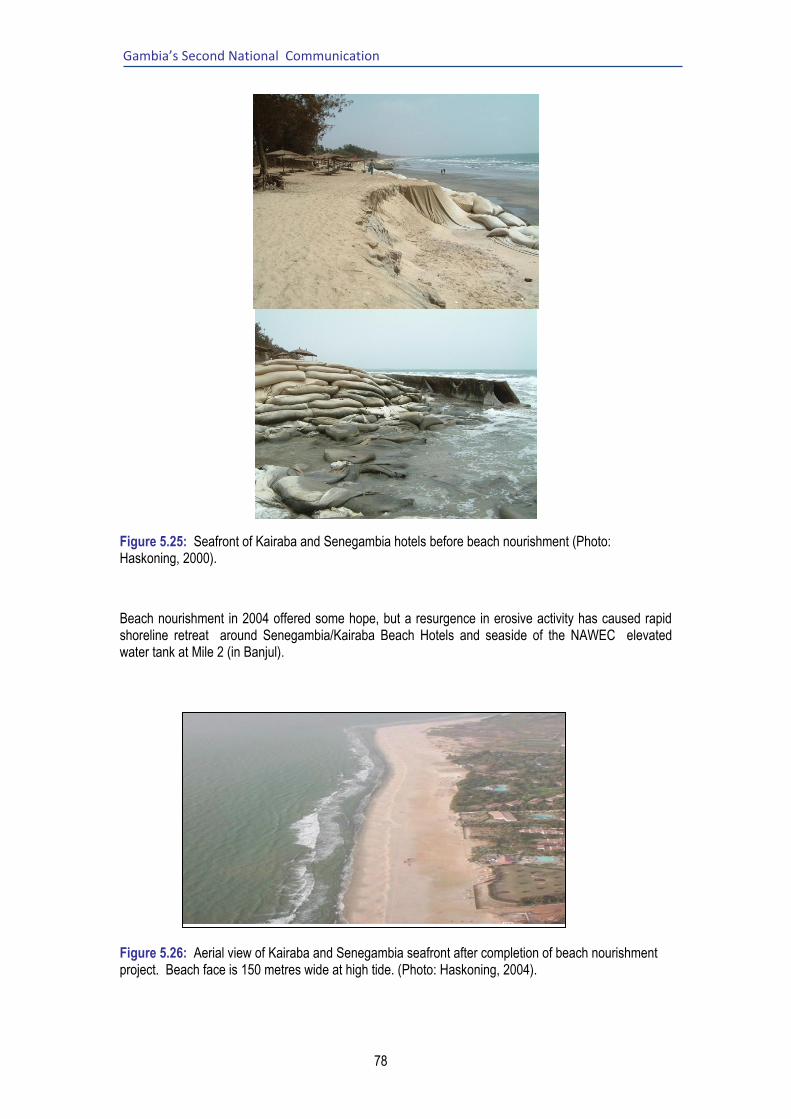
Gambia’s Second National Communication
78
Figure 5.25: Seafront of Kairaba and Senegambia hotels before beach nourishment (Photo: Haskoning, 2000).
Beach nourishment in 2004 offered some hope, but a resurgence in erosive activity has caused rapid shoreline retreat around Senegambia/Kairaba Beach Hotels and seaside of the NAWEC elevated water tank at Mile 2 (in Banjul).
Figure 5.26: Aerial view of Kairaba and Senegambia seafront after completion of beach nourishment project. Beach face is 150 metres wide at high tide. (Photo: Haskoning, 2004).

Gambia’s Second National Communication
79
Figure 5.27: Seafront of Kairaba and Senegambia hotels respectively showing severe degradation and contraction of beach from 150 meters down to 16 meters in some places. Notice the construction of a seawall at Senegambia in an effort to halt further erosion of beach space (Photos: NEA, July, 2010).
Table 5.16: Evolution of shoreline at selected locations along the Gambian coastline, between 2003 and 2010. All distances are measured from established reference points to the high water mark (Source: NEA archives)
No. Measurement Site
Width (m) of
beachplain
Measured
width (m)
Reduction in size of
beachplain
2003 2010 (m) (%)
1 Senegambia Beach Hotel bar terrace 155.5 16.7 138.8 89.3
2 Kairaba Beach Hotel 149.2 16.7 132.5 88.8
3 Holiday Beach Bar club 140.1 16.6 123.5 88.2
4 State House perimeter fence 120 51.6 68.4 57.0
5 Old Banjul Muslim cemetery 120 86.7 33.3 27.8
6 Radio Syd 120 78.4 41.6 34.7
7 Cape Point (Ocean Bay Hotel East fence) 120 90.3 29.7 24.8
There is some concern that continued expansion of the lagoon could threaten the integrity of the dual carriage-way linking the capital, Banjul, and the whole South bank of the country. It has also been observed that the current rate of erosion near the Bakau fish landing harbour will lead to the disappearance of fisheries activities in that area. This will particularly affect the income and employment of women that work in that area. This area needs to be protected to support the poverty reduction strategy of the country and also promote gender equity and women empowerment.

Gambia’s Second National Communication
80
Ecological impacts of beach erosion include the loss of nesting grounds for green turtles, and
submergence of diverse habitats and ecosystems. Under continued sea level rise, present-day coastal
wetlands will be gradually inundated resulting in the loss of mangrove and salt marsh vegetation.
Absolute numbers and species of fauna associated with mangroves are expected to drop.
5.5. Adaptation to climate change
5.5.1. Forestry
With a view to attenuate adverse climate change impacts presented in section 5.3.1, specific adaptation measures to be undertaken by the Gambian forestry sector include:
Establishment and expansion of community natural forests, plantations, national parks and forest parks
As an adaptation measure with mitigation co-benefits, the proposed action should enhance the resilience of forest ecosystems including provisioning functions in support of sustainable livelihood of direct beneficiaries. The activity will empower communities with the legal security, skills and knowledge necessary to rationally utilise their natural resources and conserve the remaining biodiversity. Project- and programme-based activities in this context are expected to:
1) maintain and improve productive functions of forest and woodland ecosystems;
2) improve and maintain biological diversity in forest and woodland ecosystems;
3) minimise soil desiccation and soil movement caused by water and wind erosion;
4) empower communities over/in their forest resource management; and 5) enhance capacity of local communities in forest management.
Expansion and intensification of agro-forestry and re-forestation activities
This adaptation measure which targets specific areas across the country will enhance the contributions of restored forest ecosystems to forest-based poverty alleviation, and, more broadly, to other national economic goals. The measure is expected to achieve the following:
1) increase area of forest under management; 2) enhance utilitarian functions of plantations and natural forest (food,
fodder and fuel production, protection and improvement of the soils);
3) improve and maintain biological diversity in forest and woodland ecosystems; and
4) return significant amounts of nutrients to the soil and thus help improve fertility of nutrient-poor soils in the northern part of the country.
Mainstreaming climate change in forest policies and plans In order to be fully responsive to the challenges of climate change, forestry sector policies and programmes need to incorporate the realities of climate change.

Gambia’s Second National Communication
81
5.5.2. Rangelands
Policy measures with immediate and mid-term objectives in place likely to counteract rangeland ecosystem degradation include:
1. Rangeland restoration in three sites through PROGEBE, involving introduction and popularisation of new grass and plant species co-managed by local stakeholders.
2. The Gambia National Agricultural Investment Programme (GNAIP) through active selection of plant species and controlled animal stocking rates as adaptive management practices. Other management practices employed are transhumance, promotion of crop & livestock integration and intensive feed gardens.
In order to deal with the challenges that lie ahead, it will be necessary to utilise a combination of efforts to reduce land degradation and foster sustainable management of rangelands. Suggested adaptation options include:
Development and implementation of effective policies on integrated natural resources management
The negative impacts of climate change on rangelands can be attenuated through formulation and implementation of effective policies that seek to improve production and also take into consideration the needs of other natural resources-based sectors of the economy.
Restoration of rangeland landscape
This adaptation option includes the manipulation and monitoring of animal stocking rates, institutionalisation of strict grazing controls and management of the vegetation and soils.
New management strategies New strategies consist of a combination of measures including active selection of plant species, and stimulation of livestock economy to encourage owners to supply livestock and meat products on local/regional markets. .
5.5.3. Health
Since changes in global climate are already taking place and will continue into the future, the need for adaptation policies is imperative. In order for health sector adaptation measures to succeed however, they must be supported by policies and measures in transport, urban planning, industry, agriculture, fisheries, water resources and energy sectors. That said, specific adaptation measures for the health sector are as follows:
Vector control programme
Health impacts from malaria will need investment in social mobilisation and education, prevention techniques such as mosquito repellents, insecticide treated nets, (ITN) low-cost anti-malarial drugs. Use of ITNs in particular has been shown to reduce malarial morbidity and mortality in The Gambia.
Continuous public health education and awareness creation programme
Health education and awareness-raising are conducted at community level to help audiences in their decision-making on thematic issues. Health education and

Gambia’s Second National Communication
82
promotion programs should therefore incorporate elements of climate science and impacts of climate change on infectious and non-infectious diseases.
Integrated disease surveillance and response
Disease surveillance is a fundamental building block of infectious disease control programme. In this regard, there is a clear need to create or improve on the design of health databases, and strengthening of the integrated disease surveillance programme of MOHSW.
Research and modelling
Up to the present, disease surveillance studies only indicate trends in disease patterns. There is need to carry out studies that are able to establish factors favourable to disease transmission. For instance, malaria epidemic could be due inter alia to drug resistance, poor health infrastructure, changes in land use, etc. In this context, one key question worth pursuing is by what mechanism and extent to which climate change explains disease trends. Answers will help identify highly focused control strategies.
Modelling provides a powerful tool for investigating current disease patterns and probable spread patterns in the future. Practical application of model outputs include strategic and disaster preparedness planning.
Nutritional support to vulnerable groups The National AIDS Secretariat with support from the global fund assists the ministry by providing nutritional support to vulnerable groups and their family members
Public health infrastructure
Proper waste disposal should be promoted to prevent pathogenic and toxic contamination during floods.
There are numerous tools and technologies that can be used to reduce the impacts of climate variability on the health of vulnerable human populations. In Kanifing Municipal Council (KMC), these include promotion of healthy housing environment and enforcement of building regulations.
In areas where people depend on untreated water, reliable and safe drinking water as well as the use of simple measures such as proper storage of drinking water in narrow-mouthed vessels, filtering drinking water and use of use of chlorine tablets.
Vaccination programme
Under its Expanded Programme of Immunisation, The Gambia has one of the highest coverage of immunisation in the West Africa sub region. Vaccination campaigns for all possible diseases need to be supported. Yellow fever vaccine is administered at the age of 9 months in all RCH clinics throughout the country. Meningitis vaccine is given only to Muslim pilgrims prior to the annual hajj and when an outbreak of the disease threatens
5.5.4. Agriculture
In cognisance of adverse impacts of climate on agriculture; the sector has formulated projects such as PIWAMP, FMRIP, Participatory Integrated Management of Invasive Aquatic Weeds Project, and Irrigated Rice Development Project (IRRIDEP) among others. Coping strategies and potential adaptation measures with regard to irrigated rice production can be distinguished as technical and regulatory.

Gambia’s Second National Communication
83
Examples of technical measures include:
i. selection of drought-, pest- disease-, and salinity-resistant, high-yield crop varieties under local conditions. For this purpose the genetic potential of local crop species must be investigated and specimens stored in seed banks;
ii. change in planting dates and replacement of long-duration upland and lowland rice varieties with short-duration varieties; and
iii. demonstration, promotion and diffusion of improved post harvest technologies. This will have the long-term effect of reducing extensive cultivation of marginal lands.
Promising regulatory measures consist of:
i. discouraging cultivation on marginal areas; ii. cooked food waste reduction; and iii. diversification of eating habit (change from rice to other cereals.
From animal husbandry perspectives, measures complementary to those geared towards rangeland regeneration/restoration would most likely be needed to buttress traditional livestock production systems and minimise farmer-herder conflicts. Apart from those explicitly mentioned under section 5.5.2, it would be appropriate to:
1. increase fodder production from intensive feed gardens; 2. promote crop/livestock integration; 3. improve feed conservation techniques and access to supplements; 4. engage with other institutions, for example, the International Trypanotolerance Centre (ITC), to
explore the potential of intensive livestock production systems in different areas in The Gambia; and
5. further explore opportunities for selective/cross-breeding of Ndama cows with higher milk-producing breeds.
5.5.5. Fisheries
The 2007 Fisheries Policy and Strategic Action Plan (2012 – 2016) are designed to address challenges to sustainable use of the country‟s marine biological resources. In this regard, integrated fisheries management through application of the broader principles of ecosystem-based management and ecologically sustainable development (ESD) approaches are heavily favoured.
Aquaculture As an alternative to capture fisheries and by way of alleviating poverty and facilitating improvement of the nutritional standards of the population, viable aquaculture development will be facilitated in keeping with the recently adopted strategic framework for sustainable aquaculture development in The Gambia. Specific forms of aquaculture envisioned include fish farming, shrimp and oyster farming at community level.
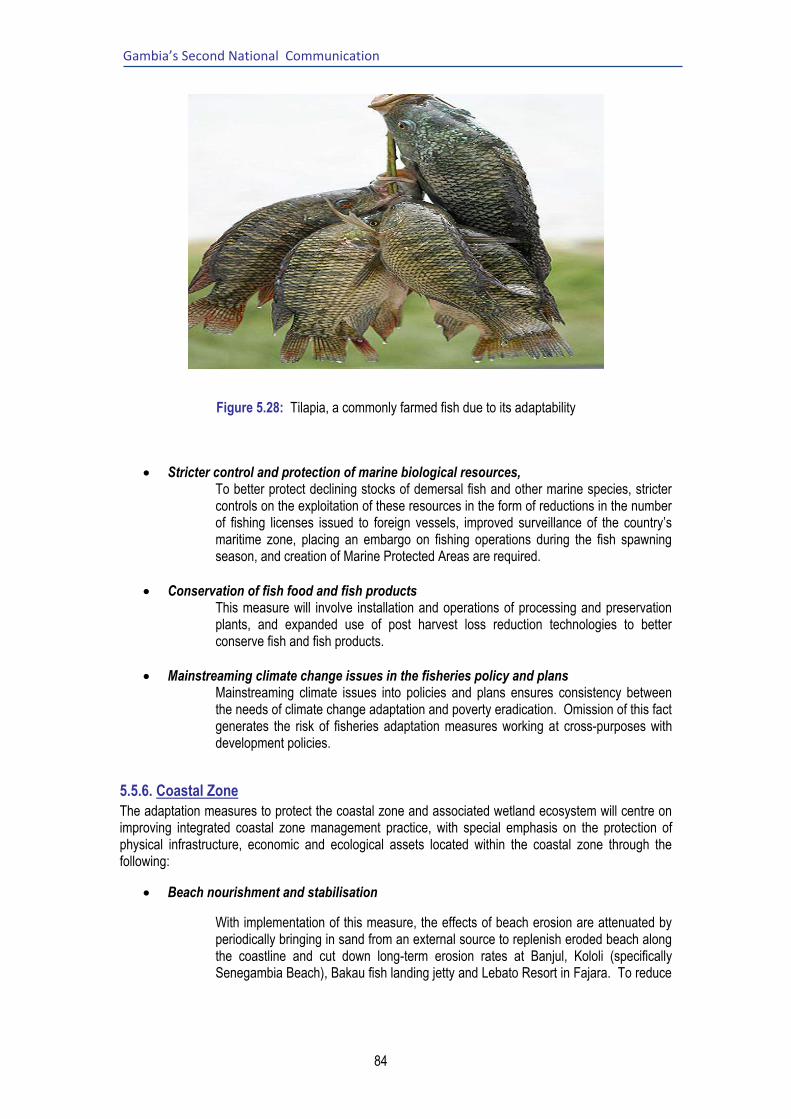
Gambia’s Second National Communication
84
Figure 5.28: Tilapia, a commonly farmed fish due to its adaptability
Stricter control and protection of marine biological resources, To better protect declining stocks of demersal fish and other marine species, stricter controls on the exploitation of these resources in the form of reductions in the number of fishing licenses issued to foreign vessels, improved surveillance of the country‟s maritime zone, placing an embargo on fishing operations during the fish spawning season, and creation of Marine Protected Areas are required.
Conservation of fish food and fish products This measure will involve installation and operations of processing and preservation plants, and expanded use of post harvest loss reduction technologies to better conserve fish and fish products.
Mainstreaming climate change issues in the fisheries policy and plans Mainstreaming climate issues into policies and plans ensures consistency between the needs of climate change adaptation and poverty eradication. Omission of this fact generates the risk of fisheries adaptation measures working at cross-purposes with development policies.
5.5.6. Coastal Zone
The adaptation measures to protect the coastal zone and associated wetland ecosystem will centre on improving integrated coastal zone management practice, with special emphasis on the protection of physical infrastructure, economic and ecological assets located within the coastal zone through the following:
Beach nourishment and stabilisation
With implementation of this measure, the effects of beach erosion are attenuated by periodically bringing in sand from an external source to replenish eroded beach along the coastline and cut down long-term erosion rates at Banjul, Kololi (specifically Senegambia Beach), Bakau fish landing jetty and Lebato Resort in Fajara. To reduce

Gambia’s Second National Communication
85
the rate of retreat of the nourished beach, a stabilisation mechanism such as groyne systems will need to be put in place.
Establishment and rehabilitation of protected wetlands
This adaptation measure/project targets rehabilitation of certain portions of the Tanbi wetland complex8 and the Kotu creek9 wetland area to restore and preserve critical ecosystem functions.
For implementation purposes, adaptation measures are further distinguished as short-term and long-term measures as follows:
Short-term adaptation measures
(i) Protection of the Bakau fish landing site and jetty to ensure continuity of the livelihood activities carried out in that area.
(ii) Rehabilitation of the Kotu creek will prevent flooding of homes and property in the area (iii) Minimisation of dredging frequency at the ports and Banjul ferry terminal areas
Potential long-term adaptation measures
(i) Develop a proper legislative and institutional framework to implement the coastal zone management approach together with regulatory system for enforcement and control.
(ii) Implement an integrated coastal management plan with the full participation of all stakeholders.
(iii) Explore viable alternatives to coastal sand mining for construction purposes
8 The Tanbi wetland complex is a 6,304 hectare estuarine and inter-tidal forested wetland primarily of low mangrove forest and complex vegetation types. The wetland functions include coastal stabilisation, fish breeding and recreation. Fifteen communities in the West Coast region, Kanifing and Banjul municipalities use the wetland for fishing, oyster harvesting, wood supplies, ecotourism and other activities. Protection of this area against the possible impacts of climate change directly affects the livelihood of these communities. 9 The Kotu creek flows through the Kanifing municipality and into the Atlantic Ocean. It is a major drainage for a large watershed covering most of the municipality and part of West Coast region. This creek is currently encroached upon by residential settlements. Illegal waste dumping in the streambed ofen leads to blockage of flow contributing to local flooding problems.

Gambia’s Second National Communication
86
6. TECHNOLOGY TRANSFER Technology transfer is a broad set of processes covering the flow of knowhow, experience and equipment from geographic areas and entities with relatively high endowments to others including governments, private and public institutions and non-governmental organisation (NGOs) which share specific objectives. Thus, the term “transfer” encompasses diffusion of technologies and technology cooperation across and within countries. It further comprises the process of learning to utilise, customise and improve received technology to suit local conditions (Metz et al., 2001). . The priority sectors reviewed were: energy, agriculture and natural Resources, industry and commerce and waste management.
6.1. Existing Technologies
6.1.1. Energy
The main energy resources in the country are fuelwood, petroleum products including liquefied petroleum gas (LPG), electricity and renewable energy (http://www.gambia.gm/EnergySector.htm). The key technologies in this sector are woodstoves, electricity generation sets and solar photovoltaic and wind mill installations. Stoves are the most ubiquitous technology used for domestic cooking. Solid fuels (i.e. fuelwood and charcoal) are the predominant fuel types used with the technology. Continued and widespread use of inefficient stoves puts significant pressure on forest resources and contributes to forest degradation in the country. LPG remains unaffordable for most Gambian households because of the high costs (http://www.gambia.gm/Pm.htm). Heavy fuel and diesel generating sets are used for electricity generation in the Greater Banjul Area and the principal provincial centres.
Renewable energy technologies in current use in The Gambia include solar photovoltaic (PV) and wind mills that provide energy for household lighting, water pumping and rural healthcare facilities and communications systems. Solar PV technology seems to be the most promising considering the average solar radiation of 5 to 7 kWh/m2 available countrywide on a daily basis. Indeed, renewable energy technology installations in the water, health and communication sectors have already shown high social, economic and environmental benefits. They could also play an important role in the on-going rural electrification programme.
6.1.2. Agriculture and Natural Resources
The agriculture sector still relies on rudimentary technologies and techniques for production even though the sector provides employment for about half the country‟s workforce. Techniques used in the crop sub-sector include bush fallowing/crop rotation and mixed cropping. In the water supply sub-sector, technologies currently being used include the modern concrete-lined well and Mark II handpump. Diesel motor driven pumps as well as renewable (solar and wind) energy-powered pumps have been used to provide water for towns and large villages with populations larger than 3,000 and cattle herds over 500 head. Solar pumps have high capital but low operational and maintenance costs and are suitable for small to medium size villages with piped water systems. However, they are not suitable for large agricultural projects.
6.1.3. Waste Management
Traditional techniques comprise the use of wheelbarrows to collect solid waste which is carried by donkey carts, motorised carts, tipper trucks and tractors fitted with trailers to dump sites where the waste, once tipped over, is levelled out by manual workers using rakes. A sewerage system, which pumps untreated sewage and domestic wastewater into the River Gambia estuary via a 950-meter long diffuser pipe, is operational in the city of Banjul. Outside of Banjul, septic tanks and soakaway technologies of sewage treatment are still prevalent. In the Tourism Development Area (TDA), where several hotels are located, wastewater generated is conveyed to oxidation ponds at Kotu from where it is discharged into the Kotu stream.

Gambia’s Second National Communication
87
6.1.4. Coastal Zone
Various technologies have been used to manage the coastal zone of The Gambia. These include sea wall groynes, revetments and beach nourishment.
6.2. Priority mitigation technologies
6.2.1. Energy sector
The following technologies have been identified: energy efficient technologies; solar PV- technology; wind; biomass for domestic energy; and bio-diesel for transport. 6.2.1.1. Energy efficient technologies Energy efficient technologies are employed to cut down energy consumption, safeguard environmental quality, and generate economic benefits for users. The technologies available include electrical fittings such as compact fluorescent light (CFL) bulbs and light emitting diodes (LED) appliances which generate significant energy savings in residential, commercial and industrial installations. 6.2.1.2. Industrial energy-efficient technologies Energy efficiency improvements technologies in the industrial sector have a lot of potential in terms of increasing competitiveness and growth. An assessment of emerging energy-efficient industrial technologies in The Gambia (Martin et al.., 2000) has shown varying degrees of energy savings:
Food cooling and storage technologies have medium energy savings and average pay-back period of 2.6 years.
Advanced lighting technologies, including their design have high energy savings and 1.3 to 3.0 years pay back period and medium to high likelihood of success.
Motor system optimisation and motor diagnostics have high energy savings about 1.5 years pay back period with high to medium likelihood of success.
Anaerobic waste water treatment has medium energy savings with less than 1 year pay back period and high likelihood of success (Martin et al.., 2000; Gelen, 2010).
6.2.1.3 Solar photovoltaic technology Solar PV technology is used to power various equipment and appliances. Solar photovoltaic technology is used for domestic water, livestock watering and irrigation and telecommunications particularly in remote sites. Because solar modules only produce electric energy during the daytime, they are used in conjunction with battery storage systems. As there are no moving parts, solar PV systems‟ lifetime can be very long and they are virtually maintenance-free. Other solar related technologies are the solar cookers which use a technology that harnesses solar radiation and transforms it into heat energy. Solar cookers can be built in a short time using readily available materials or purchased from vendors. 6.2.1.4 Wind energy technologies This is another energy source which has experienced major developments in recent years and today is found to be cheaper than other new forms of energy resources except natural gas. Switching from fossil fuel to wind generators is feasible along the coastal zone of The Gambia where wind speeds are above minimum operating speed of rotors. Wind turbines produce no emissions and have the effect of offsetting greenhouse gases emitted from thermal power stations operated by power utilities.. 6.2.1.5 Biomass energy sources and technologies The technologies in this category that can be used by Gambian households include improved cooking stoves which reduce the quantity of fuel used and also vents smoke out of cooking areas through a chimney, thus reducing health risks to women and infants. There are various types of improved cooking

Gambia’s Second National Communication
88
stoves employed in The Gambia which include The 'Greenie' Cook and The Lorena Cook Stove. The latter is the latest generation of improved cooking stove technologies. In the transport sector, bio-energy technology can improve public transport systems through improved engine and transmission technology and switching from fossil to biomass based fuels. Some of the plants used in the production of bio-fuel include corn, soybean and jatropha. However, jatropha yields much more fuel per hectare than either soybean or corn.10). 6.2.1.6. Waste management technologies Solid waste management continues to pose a big challenge for Banjul and Kanifing municipalities and other provincial growth centers. Waste management practices and technologies that have been recommended for application in The Gambia include land-filling, recycling, gasification and composting. In agriculture the compost itself is beneficial for the land in many ways, such as soil conditioning, soil fertilisation, and serving as a natural pesticide.
6.3. Priority adaptation technologies
6.3.1. Agriculture and food security
Agriculture is a major sector of the Gambian economy. However, its output is highly sensitive to weather and climate prompting public authorities to identify and implement relevant adaptation measures and technologies in the areas of irrigation, crop selection, food processing and preservation. In irrigation the principal techniques and technologies considered are tidal/flood irrigation. Other irrigation techniques considered are sprinkler and drip Irrigation. The latter technology can be considered to be the most water-efficient method of irrigation, if managed properly, since evaporation and runoff are minimised. Other adaptation technologies proposed include the adoption of deep-rooted, salt-tolerant tree/grass species and flood tolerant crop species and amendments to improve soil nutrient content and water holding capacity.
6.3.2. Food processing and preservation techniques and technologies
The food processing methods and techniques transform raw ingredients into food or transform food into more refined (higher processed) forms for consumption by households or use by the food processing industry. This category includes a processing line used to produce fruit and vegetable chips from a variety of fresh fruits and vegetables. The fruit juice extractor is a simple technology for extracting juice from tomato, fruits and vegetables. Food preservation technologies considered include drying, freezing and vacuum packing and canning and bottling.
6.3.3. Fisheries
The impacts of climate change on the fisheries sector are positive in the short- to medium-term. It is proposed to take these opportunities and supplement them with fish farming as a buffer against future deteriorations in the stock. Currently fish species raised by fish farms include salmon, tilapia, catfish and shrimps.
10 A hectare of jatropha produces 1,892 liters of fuel (about 6.5 barrels per acre
Gambia’s Second National Communication
89
6.3.4. Coastal protection
The coastal zone and its adjacent land area are very vulnerable to climate change induced sea level rise. Both soft and hard engineering techniques and technologies have been put forward to serve as adaptation measures in this dynamic zone. Such technologies include groynes which have been extensively used in the past in Banjul. But, lack of Rhun palm for groyne construction has opened the way for the use of alternative building materials such as concrete. Other hard engineering technologies include the construction of sea walls to protect settlements against erosion or flooding and revetments to protect structures and property along the coast. Finally there is beach nourishment which involves importing sand meeting certain quality standards from ex-situ and emplacing it on degraded beachplain. This and other technologies have been used in the African Development Bank funded coastal protection project in The Gambia.
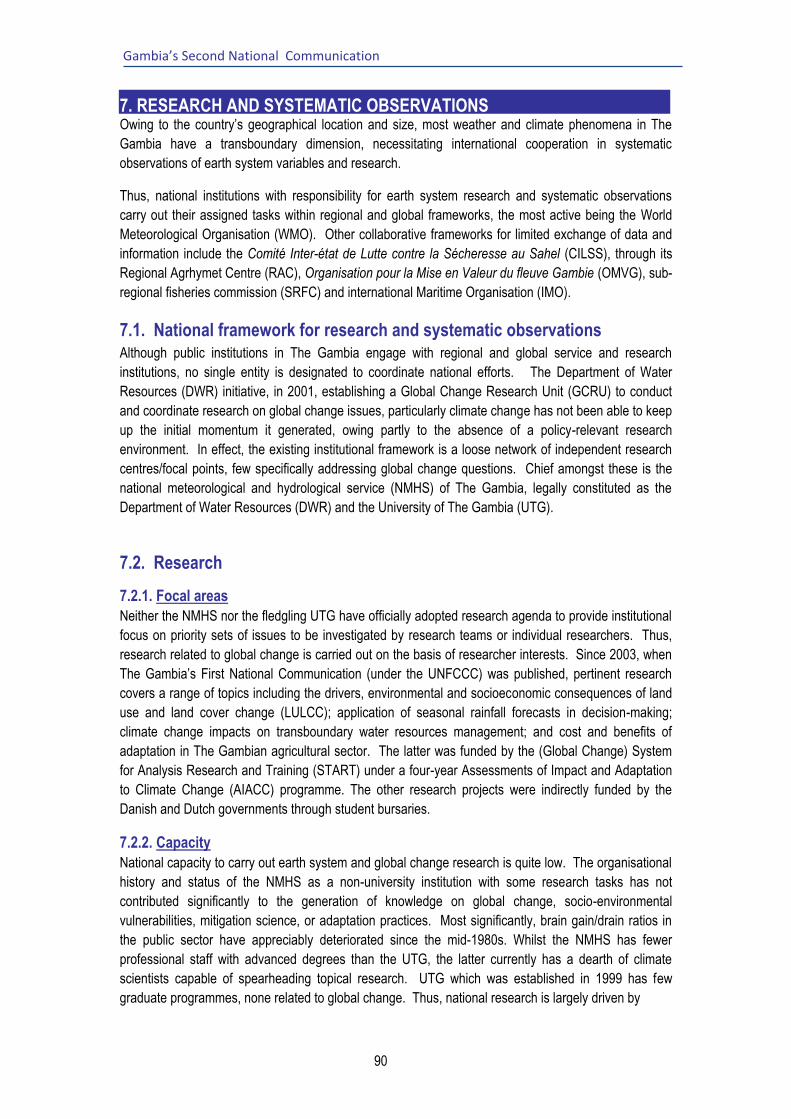
Gambia’s Second National Communication
90
7. RESEARCH AND SYSTEMATIC OBSERVATIONS
Owing to the country‟s geographical location and size, most weather and climate phenomena in The
Gambia have a transboundary dimension, necessitating international cooperation in systematic
observations of earth system variables and research.
Thus, national institutions with responsibility for earth system research and systematic observations
carry out their assigned tasks within regional and global frameworks, the most active being the World
Meteorological Organisation (WMO). Other collaborative frameworks for limited exchange of data and
information include the Comité Inter-état de Lutte contre la Sécheresse au Sahel (CILSS), through its
Regional Agrhymet Centre (RAC), Organisation pour la Mise en Valeur du fleuve Gambie (OMVG), sub-
regional fisheries commission (SRFC) and international Maritime Organisation (IMO).
7.1. National framework for research and systematic observations Although public institutions in The Gambia engage with regional and global service and research
institutions, no single entity is designated to coordinate national efforts. The Department of Water
Resources (DWR) initiative, in 2001, establishing a Global Change Research Unit (GCRU) to conduct
and coordinate research on global change issues, particularly climate change has not been able to keep
up the initial momentum it generated, owing partly to the absence of a policy-relevant research
environment. In effect, the existing institutional framework is a loose network of independent research
centres/focal points, few specifically addressing global change questions. Chief amongst these is the
national meteorological and hydrological service (NMHS) of The Gambia, legally constituted as the
Department of Water Resources (DWR) and the University of The Gambia (UTG).
7.2. Research
7.2.1. Focal areas
Neither the NMHS nor the fledgling UTG have officially adopted research agenda to provide institutional
focus on priority sets of issues to be investigated by research teams or individual researchers. Thus,
research related to global change is carried out on the basis of researcher interests. Since 2003, when
The Gambia‟s First National Communication (under the UNFCCC) was published, pertinent research
covers a range of topics including the drivers, environmental and socioeconomic consequences of land
use and land cover change (LULCC); application of seasonal rainfall forecasts in decision-making;
climate change impacts on transboundary water resources management; and cost and benefits of
adaptation in The Gambian agricultural sector. The latter was funded by the (Global Change) System
for Analysis Research and Training (START) under a four-year Assessments of Impact and Adaptation
to Climate Change (AIACC) programme. The other research projects were indirectly funded by the
Danish and Dutch governments through student bursaries.
7.2.2. Capacity
National capacity to carry out earth system and global change research is quite low. The organisational
history and status of the NMHS as a non-university institution with some research tasks has not
contributed significantly to the generation of knowledge on global change, socio-environmental
vulnerabilities, mitigation science, or adaptation practices. Most significantly, brain gain/drain ratios in
the public sector have appreciably deteriorated since the mid-1980s. Whilst the NMHS has fewer
professional staff with advanced degrees than the UTG, the latter currently has a dearth of climate
scientists capable of spearheading topical research. UTG which was established in 1999 has few
graduate programmes, none related to global change. Thus, national research is largely driven by

Gambia’s Second National Communication
91
individual efforts and interests in the wide universe of issues related to global change. Great hope is
being placed therefore on UTG‟s human development and recruitment plans in the next 10 to 15
years.11
Quite understandably, research endeavours rely on a body of data collected with the aid of specialised
instrumentation. Although a significant proportion of these is owned and operated by the NMHS, the
situation is far from ideal as discussed in sections below. 1Mbs internet access provides UTG faculty
with some access to some library services and information from wider research community. The
NMHS uses lower bandwidth internet and has no privileged access to on-line scholarly journals or
libraries.
7.2.3. International cooperation
Following its inauguration in 2001, the global change research unit (GCRU) under the NMHS struck up
a fruitful collaborative project with the Energy and Development Research Centre (EDRC) of the
University of Cape Town, South Africa and the UNEP Collaborating Centre on Energy and Environment
(UCCEE) in Risoe, Denmark, on capacity building in analytical tools for estimating and comparing costs
and benefits of adaptation projects in Africa. NMHS personnel regularly participate in training
workshops organised by the Regional Agrhyment Centre (RAC) and African Centre for Meteorological
Applications and Development (ACMAD) both headquartered in Niamey, Niger.
Strong collaborative ties forged with the Earth Institute, Columbia University, allow the UTG students
and faculty access to programmatic support. Under the German Climate Change initiative, the Max
Plank Institute and other German Universities offer formal academic training, internships and E-learning
opportunities to young Gambian scientists.
7.3. Systematic observations Basic data is gathered from a network of sensors monitoring changes in atmospheric, oceanographic
and terrestrial variables over The Gambia‟s territorial jurisdiction.
7.3.1 Networks
7.3.1.1. Meteorological and Atmospheric Observations
The NMHS operates a network of 15 surface meteorological stations which include two automatic
weather stations. All surface stations are equipped to measure ambient air temperature, humidity,
sunshine duration, wind run, and precipitation. Atmospheric pressure is measured at the principal
meteorological station in Yundum, close to the runway at the Banjul International Airport. The NMHS
also benefits from collaboration with international flights providing a selected number of meteorological
variables, to partially offset the absence of an upper air network. The Department of Agricultural
Services (DAS) under the Ministry of Agriculture (MOA) complements the NMHS network with 22
additional rain gauges mostly under the care of extension agents.
Under a global ozone monitoring programme, the University of the Gambia (UTG) operates the only
station in the country that measures ground and stratospheric ozone and ultraviolet-B (UV-B) radiation.
Hourly and sub-hourly manual observations, supplemented in some cases by analogue recorders and
digital data capture technologies, are carried out on atmospheric pressure, air temperature, humidity,
11 Kah et al. (2010). University research, doctorate training and engineering training in The Gambia.

Gambia’s Second National Communication
92
wind run, and ozone concentrations, but most variables including precipitation are measured at multi-
hourly or daily intervals.
7.3.1.2. Terrestrial Observations
The NMHS also operates several terrestrial observation networks. Among these are 10 Class A pans
for evaporation measurements, 32 piezometers/observation boreholes and five non-tidal surface water
level gauges. Its other networks are comprised of two soil moisture and 10 soil temperature measuring
stations, co-located with meteorological stations. However, it is worth noting that land resources
management institutions‟ uptake of services offered by operators of space-based observation platforms
such as Landsat 5-TM is low, and land cover information obtained from previous surveys is quite old.
Surface water levels are tracked and recorded in four places using autographic instruments designed to
capture high frequency tidal components of water levels. Flow gauging is carried out in five places (now
only one) with propeller-system instruments on a daily to monthly frequency depending on the need
validate or extrapolate station rating curves. Groundwater levels, which evolve more slowly than most
other variables, are measured manually from observation boreholes with a dipping instrument once
every month.
7.3.1.3. Oceanographic Observations
Tidal water levels are measured at six locations between Banjul (river km 0) and Janjanbureh (river km
304) on the River Gambia estuary. Salinity and water temperature are measured by spot sampling
procedure in 10 locations over the same stretch of river. Detailed surveys in the past three decades
show near-zero vertical temperature and salinity gradients in the estuary.
7.3.2. Data exchange with global partners
Regular outward flow of data to regional and global partners is modulated by the functionality of
networks and national institutions‟ active participation in partner organisations‟ on-going programmes.
To this effect, meteorological and atmospheric observations are most actively exchanged and
oceanographic observations the least.
In accordance with WMO Resolutions 40 Cg-XII and 25 Cg-XIII, meteorological and aviation related
messages are transmitted tri-hourly to the regional telecommunication hub in Dakar by satellite and
aeronautical fixed telecommunications network (AFTN) line. Other meteorological/atmospheric
observations are shared on a dekadal frequency with the ACMAD and RAC using web-based
technology. However, the latter‟s potential is not fully harnessed due to architectural shortcomings in
computer networks and unavailability of file transfer protocol (ftp) services.
Occasionally, the NMHS shares flow and tidal hydrology data from its terrestrial and oceanographic
observation programme with the RAC and river basin organisations; OMVG and NBA (Niger Basin
Authority). Internet and courier services are used, as appropriate, for these non real-time data
transfers.
In turn The Gambia receives satellite images, numerical model outputs and forecast from the European
Centre for Medium-Range Weather Forecasting (ECMWF) and other global centres through Atlantic
Bird-3, a satellite owned and operated by EUTELSAT. Unlike in pervious decades, when copies of
hydrological yearbooks were routinely posted to the NMHS, flow data is obtained upon request from the
Mnistère de l’Habitat, la Construction et l’Hydraulique (MHCH, Senegal). Seasonal rainfall and flow
forecasts emanating from the ACMAD and NBA respectively, a month or two before the July-August-

Gambia’s Second National Communication
93
September forecast window, are received through internet or Gambian participants in consensus-
building seasonal forecasting fora hosted by these institutions.
7.3.3. Dissemination and impact of information
NHMS daily weather forecasts/alerts are broadcast on TV and radio to reach the widest possible
audience. Ten-day agrometeorological bulletins, statistical summaries and time series data are also
compiled at the end of relevant time periods for dissemination to several ministries and a selection of
international and non-governmental organisations. Distribution of data from terrestrial and
oceanographic observation programmes in the form of statistical summaries and time series data is
more restricted and demand-driven.
Hard copies and CD-ROM are used to distribute/disseminate/share time series, bulletins, and statistical
summaries to users. Alternatively, information is shared with users through electronic mail attachment
where expediency is paramount. The University of The Gambia (UTG) uses traditional knowledge-
sharing mechanisms like seminars and workshops to discuss some aspects of its on-going research on
heat transfer, solar UV radiation, ozone and aerosols.
In a 2009 survey commissioned by the Climate Change Secretariat, more than half the general public
partly attribute their security, welfare, and comfort to weather forecasts, which are reportedly used to
organise mundane and business activities such as shopping, travelling/commuting, holding outdoor
events, and financial risk assessments. Despite the lack of sufficiently detailed institutional responses
to survey questions, it is reasonable to assume that weather information has significant socio-economic
benefits and beneficial effects, judging from its criticality to the air transport and fishing industries which
account for 6% of GDP (Gross Domestic Product). Another strong pointer to the value of earth system
information encompassing climate information is the stable demand for data/information products from
professional services. Without exception, institutions which solicit time series data report cost-savings
in data collection and product development.
7.4. Needs and priorities Taking existing capacity and knowledge gaps as a point of departure, this section outlines key
considerations central to producing high quality datasets from sustained monitoring programmes that
are responsive to research needs and contributing to increased scientific understanding of the earth
system, security, health and well-being of Gambians.
7.4.1. Critical infrastructure
In the immediate term, that is between 2012 (Rio + 20) and 2015 (MDG Horizon), strong emphasis is
placed on the expansion of meteorological, terrestrial and oceanographic observation networks and
consolidation of monitoring programmes. Up to 20 new stations in carefully selected locations would be
needed to fill in important data gaps in the NMHS terrestrial and coastal marine networks. In addition to
these, special stations measuring specific pollutants and key meteorological parameters are also
needed in economically and demographically important areas. The relocation of some water level
stations would also increase the value of data presently collected. The importance of integrating data
from Senegalese border stations cannot be overemphasised. Deployment of automatic weather
stations/data collection platforms are key to future improvements in monitoring, but civic education and
responsibility issues related to vandalism would need looking into before full scale deployment. Indeed,
automation of observations is the solution par excellence for: 1) monitoring unsteady flow in the River
Gambia, 2) monitoring sea states and meteorological conditions at sea, and 3) converting „daylight‟
meteorological stations to 24-hour stations.

Gambia’s Second National Communication
94
Figure 7.1: Existing meteorological network (closed circles) and proposed location of new stations (open circles)
Figure 7.2: Existing surface water level network with significant to dominant fluvial component during part of the year (closed circles) and proposed location of new stations (open circles)
Figure 7.3: Existing groundwater level network (closed circles) and proposed location of new stations (open circles)
-17.0 -16.5 -16.0 -15.5 -15.0 -14.5 -14.0 1 3 . 0
1 3 . 2
1 3 . 4
1 3 . 6
1 3 . 8
1 4 . 0
-17.0 -16.5 -16.0 -15.5 -15.0 -14.5 -14.0 1 3 . 0
1 3 . 2
1 3 . 4
1 3 . 6
1 3 . 8
1 4 . 0
-17.0 -16.5 -16.0 -15.5 -15.0 -14.5 -14.0 1 3 . 0
1 3 . 2
1 3 . 4
1 3 . 6
1 3 . 8
1 4 . 0
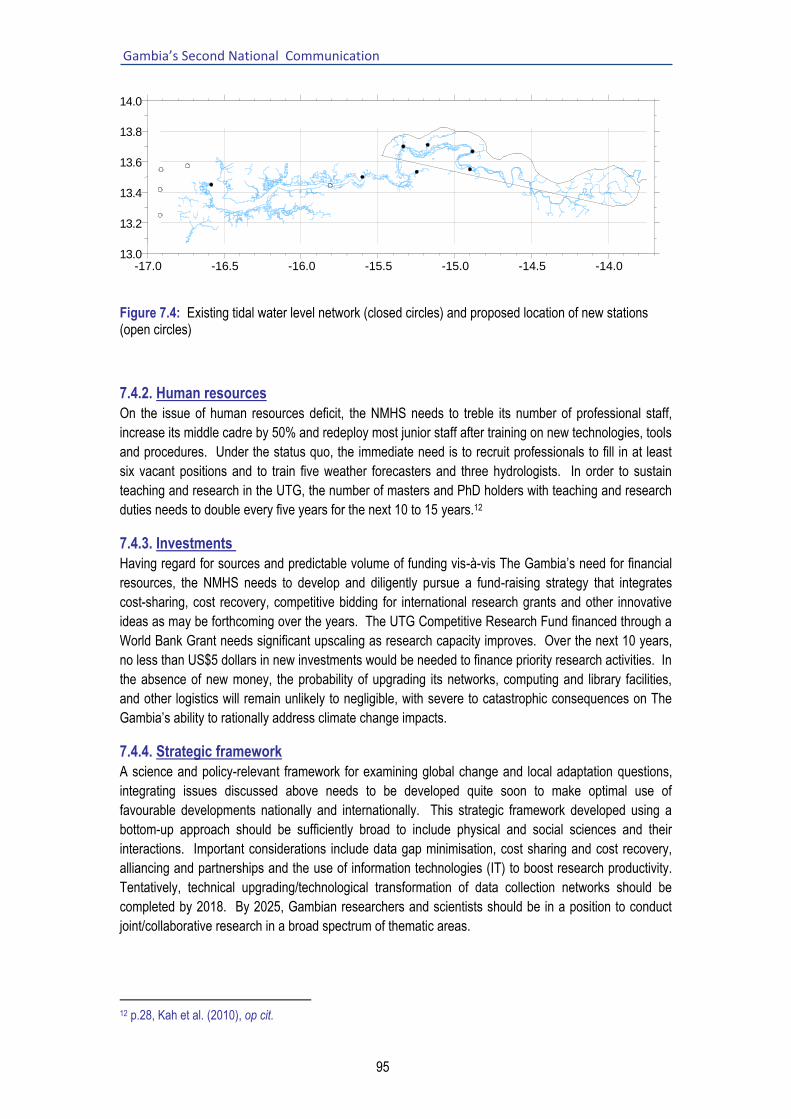
Gambia’s Second National Communication
95
Figure 7.4: Existing tidal water level network (closed circles) and proposed location of new stations (open circles)
7.4.2. Human resources
On the issue of human resources deficit, the NMHS needs to treble its number of professional staff,
increase its middle cadre by 50% and redeploy most junior staff after training on new technologies, tools
and procedures. Under the status quo, the immediate need is to recruit professionals to fill in at least
six vacant positions and to train five weather forecasters and three hydrologists. In order to sustain
teaching and research in the UTG, the number of masters and PhD holders with teaching and research
duties needs to double every five years for the next 10 to 15 years.12
7.4.3. Investments
Having regard for sources and predictable volume of funding vis-à-vis The Gambia‟s need for financial
resources, the NMHS needs to develop and diligently pursue a fund-raising strategy that integrates
cost-sharing, cost recovery, competitive bidding for international research grants and other innovative
ideas as may be forthcoming over the years. The UTG Competitive Research Fund financed through a
World Bank Grant needs significant upscaling as research capacity improves. Over the next 10 years,
no less than US$5 dollars in new investments would be needed to finance priority research activities. In
the absence of new money, the probability of upgrading its networks, computing and library facilities,
and other logistics will remain unlikely to negligible, with severe to catastrophic consequences on The
Gambia‟s ability to rationally address climate change impacts.
7.4.4. Strategic framework
A science and policy-relevant framework for examining global change and local adaptation questions,
integrating issues discussed above needs to be developed quite soon to make optimal use of
favourable developments nationally and internationally. This strategic framework developed using a
bottom-up approach should be sufficiently broad to include physical and social sciences and their
interactions. Important considerations include data gap minimisation, cost sharing and cost recovery,
alliancing and partnerships and the use of information technologies (IT) to boost research productivity.
Tentatively, technical upgrading/technological transformation of data collection networks should be
completed by 2018. By 2025, Gambian researchers and scientists should be in a position to conduct
joint/collaborative research in a broad spectrum of thematic areas.
12 p.28, Kah et al. (2010), op cit.
-17.0 -16.5 -16.0 -15.5 -15.0 -14.5 -14.0 1 3 . 0
1 3 . 2
1 3 . 4
1 3 . 6
1 3 . 8
1 4 . 0

Gambia’s Second National Communication
96
8. EDUCATION TRAINING AND PUBLIC AWARENESS
8.1. Education
8.1.1. Formal education
The Ministry of Basic and Secondary Education (MOBSE) and that of Higher Education, Research, Science and Technology (MOHERST) have directional and oversight responsibility for teaching of earth and allied sciences from elementary school through university levels. However, no specific courses on global change are taught in the school curricula or as part of undergraduate degree courses.
The education policy (2004 – 2015) identifies a number of priorities that contribute, in particular, to the quality of teaching science and technology. Still, it is worth noting that climate change issues are not explicitly reflected in the government‟s education policy. But, with funding from the Norwegian government through UNEP in 2006, a simplified version of The Gambia‟s FNC was produced in an A5 booklet format with colour illustrations, and distributed for use as a teaching aid to educational institutions countrywide.
The principles and methods of teaching including non-formal methods are now widely employed by many teachers who have been trained during the first and second phases of the Training of Information Programme on the Environment (TIPE) project,13 NSGA-CIDA, EE Projects, World Bank Capacity 21 project implemented by the National Environment Agency (NEA). The main objective of TIPE, substantially achieved, was to foster attitudinal and behavioural change towards the environment among children by integrating environmental education in primary education.
8.1.2. Non-formal education
Adult literacy/non-formal education is primarily provided by the adult and non-formal education unit (ANFEU) under the MOBSE and some non-governmental organisations. Other public agencies provide skills development and knowledge transfer to beneficiary publics do so through project frameworks.
8.2. Training
A series of training programmes on the Kyoto process were carried out between 2004 to date and a Designated National Authority (DNA) was established in 2007, in addition to selecting two DNA focal persons to the UNFCCC. To date however, CDM projects designed by The Gambia are yet to elicit by-in from interested parties.
A three-year Greenhouse Gas Inventory (GHGI) project implemented in The Gambia provided training to 12 professionals working in the land use change and forestry (LUCF) and agriculture sectors.
In 2004, the Regional Agrhymet Centre (RAC) in Niamey (Niger) conducted a two-week sub-regional capacity building training for adaptation to climate change in the nine Sahel countries. The training was funded by the Government of Canada; through the Canadian International Development Agency (CIDA). A step-down training subsequently organised in Banjul attracted over 50 public and private sector media practitioners, extension agents, and other stakeholders.
The community skills improvement project (CSIP) in all the regions of the Country to provide beneficiaries with literacy in local languages and skills training in micro-finance activities.
13 TIPE I and TIPE II were regional CILSS (Permanent Inter-State Committee for Drought Control in the Sahel) projects financed by the European Union, implemented by the Sahel Institute based in Bamako, Mali.
Gambia’s Second National Communication
97
8.3. Public awareness
The TIPE project mentioned above conducted communications and sensitisation activities in rural communities. Communication media included radio and television broadcasts. Sensitisation and interactive discussions with local government leadership, traditional and opinion leaders, youth and women representatives were also used to share information and knowledge on climate change issues.
In 2006, some Article 6 activities of the New Delhi work programme were implemented in The Gambia. As a contribution towards the goal of developing and disseminating relevant information on climate change a first step was the condensation and dissemination of The Gambia‟s First National Communication (as discussed above). In-country workshops at eight strategic locations have also been instrumental for climate change information and knowledge-sharing.
In collaboration with The Gambia Radio and Television Services (GRTS), the Ministry of forestry and the environment (MOFEN) arranged for three televised programmes with phone-in segments on climate change and related issues, as a means of creating greater public awareness and bringing the general public up-to-date on international processes. A panel of experts including the UNFCCC focal point, NAPA Coordinator, Article 6 focal point and some other representatives of the National Climate Committee made presentations and answered questions from the audience in local languages. The Gambia Environmental Newsletter published by the NEA also contributes to awareness building on climate change related issues.
The environmental education and communication strategy of the NEA advocates and supports integration of environmental education in the formal education system. Education materials are produced for teaching sustainable development issues such as climate change. In this regard, the NEA has built and nurtured partnerships, over the years, with teachers associations in the UK. The Gambia Environmental Newsletter published by the National Environment Agency also contributes to awareness building on climate change related issues.
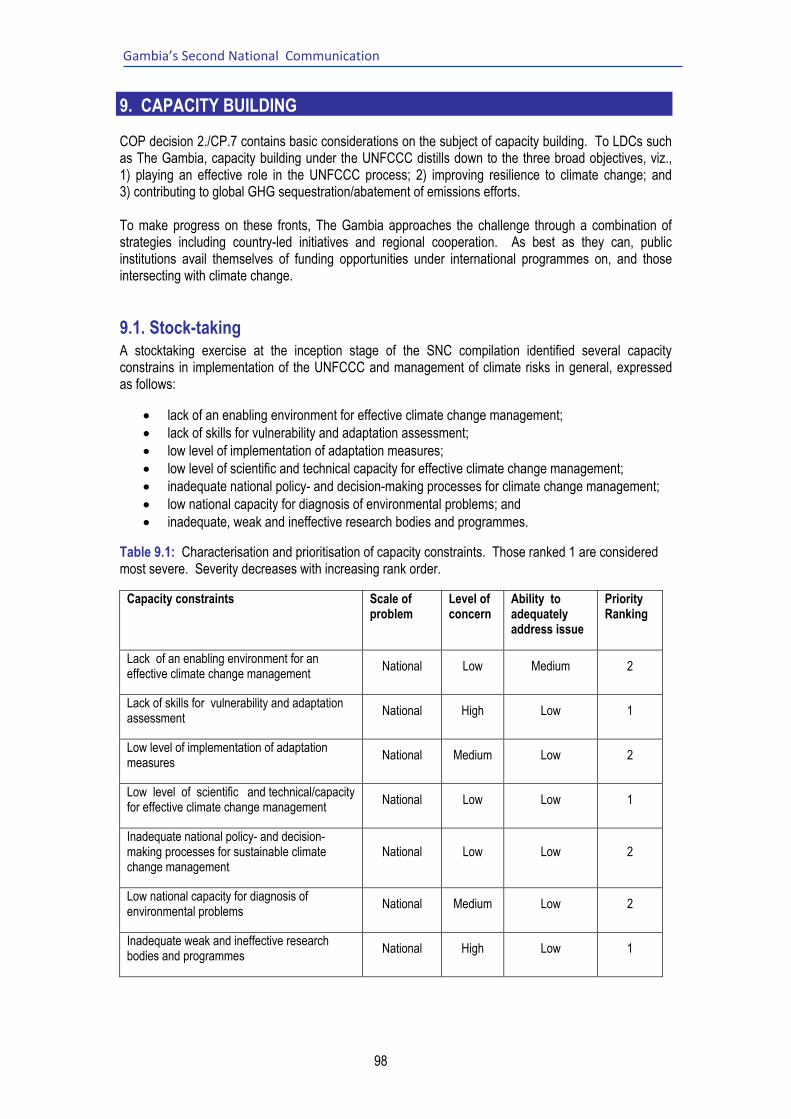
Gambia’s Second National Communication
98
9. CAPACITY BUILDING
COP decision 2./CP.7 contains basic considerations on the subject of capacity building. To LDCs such as The Gambia, capacity building under the UNFCCC distills down to the three broad objectives, viz., 1) playing an effective role in the UNFCCC process; 2) improving resilience to climate change; and 3) contributing to global GHG sequestration/abatement of emissions efforts. To make progress on these fronts, The Gambia approaches the challenge through a combination of strategies including country-led initiatives and regional cooperation. As best as they can, public institutions avail themselves of funding opportunities under international programmes on, and those intersecting with climate change.
9.1. Stock-taking A stocktaking exercise at the inception stage of the SNC compilation identified several capacity constrains in implementation of the UNFCCC and management of climate risks in general, expressed as follows:
lack of an enabling environment for effective climate change management;
lack of skills for vulnerability and adaptation assessment;
low level of implementation of adaptation measures;
low level of scientific and technical capacity for effective climate change management;
inadequate national policy- and decision-making processes for climate change management;
low national capacity for diagnosis of environmental problems; and
inadequate, weak and ineffective research bodies and programmes.
Table 9.1: Characterisation and prioritisation of capacity constraints. Those ranked 1 are considered most severe. Severity decreases with increasing rank order.
Capacity constraints Scale of problem
Level of concern
Ability to adequately address issue
Priority Ranking
Lack of an enabling environment for an effective climate change management
National Low Medium 2
Lack of skills for vulnerability and adaptation assessment
National High Low 1
Low level of implementation of adaptation measures
National Medium Low 2
Low level of scientific and technical/capacity for effective climate change management
National Low Low 1
Inadequate national policy- and decision-making processes for sustainable climate change management
National Low Low 2
Low national capacity for diagnosis of environmental problems
National Medium Low 2
Inadequate weak and ineffective research bodies and programmes
National High Low 1

Gambia’s Second National Communication
99
Notwithstanding, stakeholders discern some differences in the scale of problems consequential to each issue. Table 9.1 shows capacity constraints ranked according to severity.
Deliberations as part of the GEF supported NSCA Project in 2003 and SNC inception on capacity building needs for implementation of the UNFCCC and other Rio Conventions also concur on the need to capacities in cross-cutting issues enumerated as:
public sensitization and awareness
citizen, community and private sector engagement;
poor database for planning and monitoring;
technology transfer;
negotiation skill; and
networking.
9.2. Capacity building needs
9.2.1. Implementation of the UNFCCC in The Gambia
The capacity constraints identified and ranked in Table 9.1 solicit capacity building needs indicated in Table 9.2
Table 9.2: Action required under thematic areas of the UNFCCC
Capacity constraints Priority Ranking
Actions required
Lack of an enabling environment for an effective climate change management
2 capacity building need would require creation of appropriate legal and institutional frameworks.
Lack of skills for vulnerability and adaptation assessment
1
capacity building needs include the ability to conduct in-depth assessments of climate variability and future climate change impacts on the national economy
Low level of implementation of adaptation/mitigation measures
2
capacity building needs include the integration of energy-efficient systems in industry, agriculture and transport; acquisition of appropriate technologies and strengthening of endogenous scientific and technical capacities
Low level of scientific and technical/capacity for effective climate change management
1
capacity building needs include training of Gambian scientists in specific aspects of environment and management
Inadequate national policy- and decision-making processes for sustainable climate change management
2 capacity building needs good information and decision-support tools
Low national capacity for the diagnosis of environmental problems
2 capacity building needs include capacity building for environmental management and greenhouse gas emissions assessments
Inadequate weak and ineffective research bodies and programmes
1 capacity building needs include strengthening of the Global Change Research Unit of the UNFCCC Focal Point

Gambia’s Second National Communication
100
9.2.2. Education, training and public awareness
Training in the area of climate change is mainly limited to national climate committee (NCC) members of government institutions and a few NGO representatives. In general, training workshops are project-driven. Training is usually for a period between two and five days and in the form of hands–on exercises. Human resources development constraints stem from the fact that persons trained may not be in position to continue to utilise the skills and expertise gained.
Capacity building needs include, as a point of departure, the enhancement of curricula for lower and upper basic cycles and the tertiary level of education and strengthening of national functional literacy programmes. Furthermore, NCC members need additional capacity building to develop sensitisation materials to enhance public awareness on climate change.
9.2.3. Synergies at different capacity building levels
Following identification of opportunities for capacity building across the three Rio conventions for maximum synergistic effects, these opportunities have been further disaggregated into priority capacity needs for synergies at the three capacity building levels of individual, institutional and systematic. These disaggregated capacity building needs are presented in Table 9.3.
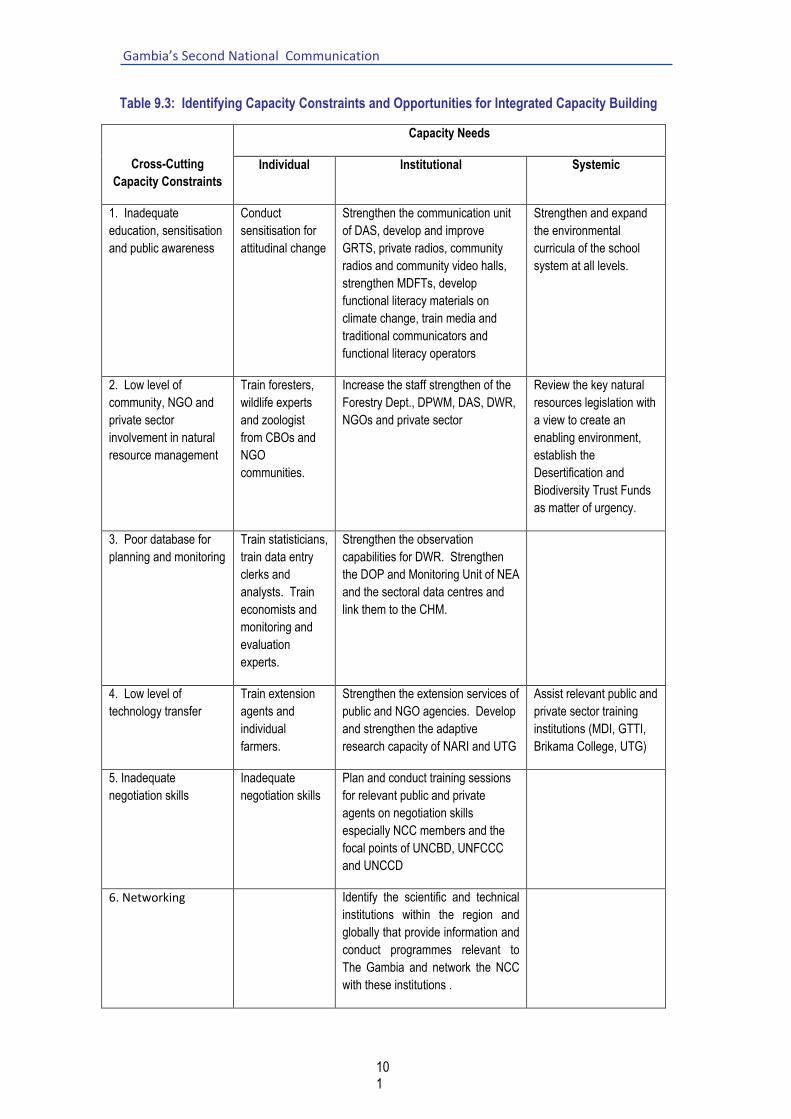
Gambia’s Second National Communication
10
1
Table 9.3: Identifying Capacity Constraints and Opportunities for Integrated Capacity Building
Cross-Cutting
Capacity Constraints
Capacity Needs
Individual Institutional Systemic
1. Inadequate
education, sensitisation
and public awareness
Conduct
sensitisation for
attitudinal change
Strengthen the communication unit
of DAS, develop and improve
GRTS, private radios, community
radios and community video halls,
strengthen MDFTs, develop
functional literacy materials on
climate change, train media and
traditional communicators and
functional literacy operators
Strengthen and expand
the environmental
curricula of the school
system at all levels.
2. Low level of
community, NGO and
private sector
involvement in natural
resource management
Train foresters,
wildlife experts
and zoologist
from CBOs and
NGO
communities.
Increase the staff strengthen of the
Forestry Dept., DPWM, DAS, DWR,
NGOs and private sector
Review the key natural
resources legislation with
a view to create an
enabling environment,
establish the
Desertification and
Biodiversity Trust Funds
as matter of urgency.
3. Poor database for
planning and monitoring
Train statisticians,
train data entry
clerks and
analysts. Train
economists and
monitoring and
evaluation
experts.
Strengthen the observation
capabilities for DWR. Strengthen
the DOP and Monitoring Unit of NEA
and the sectoral data centres and
link them to the CHM.
4. Low level of
technology transfer
Train extension
agents and
individual
farmers.
Strengthen the extension services of
public and NGO agencies. Develop
and strengthen the adaptive
research capacity of NARI and UTG
Assist relevant public and
private sector training
institutions (MDI, GTTI,
Brikama College, UTG)
5. Inadequate
negotiation skills
Inadequate
negotiation skills
Plan and conduct training sessions
for relevant public and private
agents on negotiation skills
especially NCC members and the
focal points of UNCBD, UNFCCC
and UNCCD
6. Networking Identify the scientific and technical
institutions within the region and
globally that provide information and
conduct programmes relevant to
The Gambia and network the NCC
with these institutions .

Gambia’s Second National Communication
102
10. NETWORKING, KNOWLEDGE AND INFORMATION-SHARING
10.1. Introduction Climate change is now universally recognised as a major global threat, but moreso for the Least Developed
Countries including The Gambia. Building and strengthening the resilience of impacted and vulnerable
communities requires access to knowledge and information on the risks of climate change and appropriate
adaptive practices.
Climate change knowledge is shared through national and global media outlets and networks by channelling
messages between knowledge producers and target audience. The art of channelling messages between
knowledge producers and target audiences is referred to as information sharing.
10.2. Climate Change knowledge and information sharing in The Gambia Climate change knowledge- and information-sharing in The Gambia is limited to training activities for targeted
audience and the use of public consultations for and media outlets for public sensitisation and awareness-raising.
In preparation for development of national climate change reports such as the National Communication and the
National Adaptation Programme of Action (NAPA), continuous and refresher training on the development of
national greenhouse gas inventories, and mitigation and vulnerability assessments is provided for constituted
Task Force members of the National Climate Change Committee (NCC). Such training is usually for a period of
to two weeks and is based on a combination of class-room type lectures and hands-on exercises on the tools
and methodologies to be utilised.
In 2004, members of the NCC were trained on the Clean Development Mechanism, with great emphasis placed
on project development. The training and accompanying exercises produced some CDM-type mitigation projects
that are yet to attract funding. Also in the same year, the Regional Agrhymet Centre (RAC) in Niamey, Niger,
conducted a two-week sub-regional capacity building training on adaptation to climate change in the nine Sahel
countries. A step-down training subsequently organised in Banjul attracted over 50 public and private sector
media practitioners, extension agents, and other stakeholders (see section 8.2 of Chapter 8 of this SNC).
In its efforts to disseminate the findings of studies that contributed to the development of the First National
Communication (FNC) of The Gambia, the NCC with financial support from the United National Environment
Programme (UNEP) produced a condensed version of the FNC which was disseminated widely to schools
through the Ministry of Basic and Secondary Education and through in-country workshops at eight strategic
locations. This has been instrumental for climate change information and knowledge-sharing.
In its capacity as the Lead Agency in the Cross-cutting Issues Task Force of the NCC, The Gambia Radio and
Television Services (GRTS) works closely with the UNFCCC Focal Point and the Ministry of Forestry and the
Environment (MOFEN) to conduct radio and television programmes on climate change. These include three
televised programmes with phone-in segments on climate change and related issues, as a means of creating
greater public-awareness and bringing the general public up-to-date on international processes. A panel of
experts including the UNFCCC Focal Point, NAPA Coordinator, Article 6 Focal Point and some other
representatives of the NCC made presentations and answered questions from the audience in local languages.
Frequency and extent of such joint programmes are limited by the lack of resources.
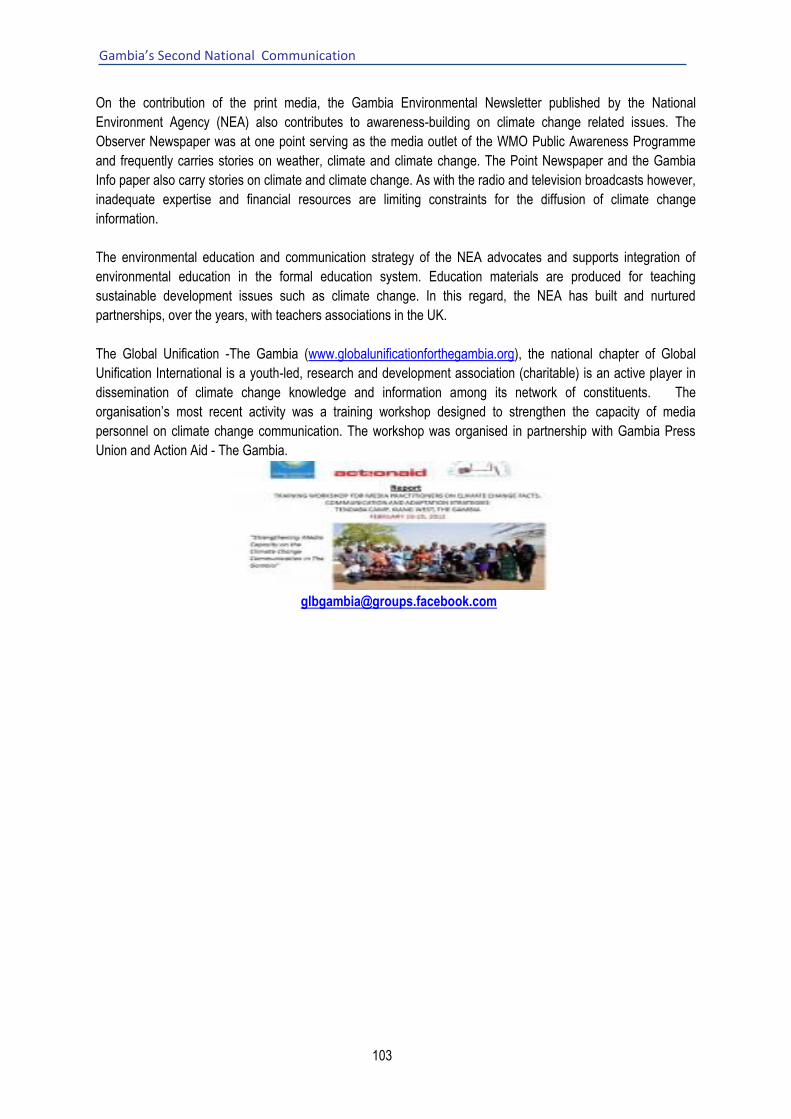
Gambia’s Second National Communication
103
On the contribution of the print media, the Gambia Environmental Newsletter published by the National
Environment Agency (NEA) also contributes to awareness-building on climate change related issues. The
Observer Newspaper was at one point serving as the media outlet of the WMO Public Awareness Programme
and frequently carries stories on weather, climate and climate change. The Point Newspaper and the Gambia
Info paper also carry stories on climate and climate change. As with the radio and television broadcasts however,
inadequate expertise and financial resources are limiting constraints for the diffusion of climate change
information.
The environmental education and communication strategy of the NEA advocates and supports integration of
environmental education in the formal education system. Education materials are produced for teaching
sustainable development issues such as climate change. In this regard, the NEA has built and nurtured
partnerships, over the years, with teachers associations in the UK.
The Global Unification -The Gambia (www.globalunificationforthegambia.org), the national chapter of Global
Unification International is a youth-led, research and development association (charitable) is an active player in
dissemination of climate change knowledge and information among its network of constituents. The
organisation‟s most recent activity was a training workshop designed to strengthen the capacity of media
personnel on climate change communication. The workshop was organised in partnership with Gambia Press
Union and Action Aid - The Gambia.

Gambia’s Second National Communication
104
10.3. Climate Change Networks The following is a list of some of the regional and international climate change knowledge and information
sharing networks that institutions in The Gambia can link with to access climate change knowledge and
information.
10.3.1. AfricaAdapt’s knowledge sharing Network
AfricaAdapt is a network co-hosted by four institutions that is dedicated to sharing African adaptation knowledge
within a community of practice. In addressing the need for tailored approaches to knowledge sharing, the
network uses both online and offline forms of engagement in both French and English to reach adaptation
stakeholders. The AfricaAdapt website serves as an online hub for sharing knowledge among researchers,
policy makers, and development practitioners in particular. It features user-generated profiles of adaptation
projects where members can host documents, discussions and blog-style news. The site also hosts thematic
resources on adaptation and a dedicated space for sharing community contributions on the site. The network‟s
engagement with African communities and community-based organisations, however, occurs primarily offline and
on the ground. It produces print-based summaries of pertinent information and hosts forums for diverse
stakeholder groups to exchange perspectives. The network also collaborates with community radio stations to
increase and deepen discussion on climate change and also encourages local innovation on knowledge sharing
with small grants to initiatives that engage hard-to-reach communities.
10.3.2. GenderCC platform and GenderCC – Women for Climate Justice
Women for Climate Justice at www.gendercc.net is internet address of the global network of women and gender
activists and experts working for gender and climate justice from all the world‟s regions. It was created in
response to the growing public attention to climate change, and increasing need for information about women‟s
perspectives and gender aspects in climate change policies and measures. The website of the network is based
on the knowledge available through the Gendercc network, and is one element of an envisaged International
Competence Centre Gender & Climate Change (CCGCC).
Information accessible on the network includes research on gender and climate change and related areas, case
studies that clarify and illustrate the gender aspects, activities and campaigns to make women's contributions to
climate protection visible and further the integration of the gender dimension in climate policy, and mechanisms
and tools to put the integration of gender dimensions in climate change policies and measures into practice. This
website illustrates that a number of organisations and institutions already stand up for a gender perspective in
climate policy. It serves as a networking platform for these organisations and gender and climate experts,
bringing together those who want to become acquainted with the issue as well as those who wish to enlarge
upon it. The knowledge base and information platform is work in progress and the Group is always interested in
ongoing and future research projects and publications and welcome new information and publications through
the Gendercc platform. The platform also runs the Gender_cc-listserve that is accessible to everybody
committed to gender equality in climate change debates and policies. Discussion themes are related to gender
and climate change, women's rights, gender relations and gender justice in the context of climate change and
climate related policy making.
10.3.3. Community Based Adaptation Network and Sharing
At the 2nd International Workshop on Community Based Adaptation in Dhaka, Bangladesh, in February 2007
(www.bcas.net/2nd.cba/index.html), delegates heard about communities adapting to heat waves in
mountainous areas of India; floods in Bangladesh and Nepal; drought in Kenya; soil salinity in Sri Lanka; and

Gambia’s Second National Communication
105
health problems in Zimbabwe. Those present decided to also form the CBA Network to promote the sharing of
knowledge on CBA activities from across the world.
10.3.4. Volunteer Communities & ICTs
The increasing role of local communities in the response to climate change-related events reminds us of the
importance of self-organisation, volunteerism, and ultimately, of community engagement in building more resilient
and adaptable systems. This is an area in which the supportive role of ICTs and Web 2.0 tools specifically are
likely gain in strength; enabling more effective networking and information sharing, and empowering local actors
through access to new information and skills, and supporting novel mechanisms of participation that enhance
resilience at the local, national and international levels.
10.3.5. The Southeast Asia Climate Change Network (SEAN-CC)
Initiated by UNEP and funded by the Government of Finland, the Southeast Asia Climate Change Network
(SEAN-CC), which works primarily through the UNFCCC National Climate Change Focal Points and other key
actors, aims to guide ASEAN countries in making sound policy, technology and investment choices that lead to a
reduction in greenhouse gas emissions and increase in potential co-benefits with a specific focus on promoting
clean and renewable energy, energy efficiency and energy conservation (EE&C). In line with the priorities
identified and agreed with national climate change focal points or responding to direct country requests, SEAN-
CC activities cover technical assistance (including policy advice), capacity building, and knowledge-generation
and information-sharing.
10.3.6. The Communication for Development (C4D) Network
The Communication for Development (C4D) network is open to individuals and organisations interested in
enhancing the role of communication within international development. Joining the network is quite
straightforward and on requires signing-up on the social networking platform www.c4dnetwork.ning.com. The
central belief in the C4D network is that communicating and sharing knowledge and learning around the human
dimensions of climate change contribute to a better understanding of this complex issue and success in finding
ways of mitigating the worst effects of climate change impacts on peoples‟ lives and livelihoods.
10.3.7. Climate Change Information Network - CC:iNet
The Climate Change Information Network, a web portal known as CC:iNet, serves as a clearinghouse for
information sources in support of Article 6 of the Convention and its implementation. It was launched in October
2010 and enables visitors and registered users to make use of enhanced features.
Climate Change Information Network

Gambia’s Second National Communication
106
11. CONSTRAINTS AND GAPS RELATED TO FINANCIAL AND TECHNICAL CAPACITY NEEDS In carrying out its programme of work and activities related to implementation of the UNFCCC over the past
two decades, The Gambia has benefited from training, technical support and financial assistance from the
USA, Norway, multilateral agencies; the World Bank, UNDP, UNEP, GEF, and intellectual NGOs; ECBI,
Notably, training of designated professionals on assessment of vulnerability to climate change, greenhouse
gas inventorying, development and evaluation of CDM projects and process management amongst others,
have been instrumental in publication of national communications (NCs), greenhouse gas inventory, national
adaptation programme of action (NAPA), adaptation/mitigation project formulation and impactful contributions
to the work of the COP and its subsidiary bodies through the LDC and Africa group of countries.
A stocktaking exercise at the inception of the Gambia‟s SNC project, stakeholder consultation events, and
practical experience putting the SNC together reveal several constraints in the following areas:
data capture, archiving and analysis; and
climate change management.
11.1. Data capture, analysis and modelling
11.1.1. Research and systematic observations
There is no common research agenda on the multiple dimensions of global change or platform for sharing
research findings. Major constraints on systematic observations include inadequate financing, limited human
and technical capacity. Specific needs and concerns related to systematic observations, data analysis and
modelling include:
upgrading and substitution of conventional equipment with digital ones to minimise the impact of
observer/instrument technician failings and to also provide continuous recording of selected
atmospheric, terrestrial and oceanographic state variables;
rehabilitation and expansion of the existing monitoring networks for more representative monitoring
of atmospheric, terrestrial and oceanographic state variables;
upgrading information technologies installed in key institutions and deployment of appropriate
productivity software; and
strengthening human resources capacities in traditional and new areas of knowledge.
11.1.2. Greenhouse gas inventory
Similar to other least developed countries (LDCs), the time lag of The Gambia‟s greenhouse inventory for the
year 2000 is symptomatic of organisational constraints impeding timely collection and synthesis of
greenhouse data. Improved quantification of emissions from industrial processes, waste and agriculture
sectors as well as uncertainty reduction in emission factors would significantly increase the reliability of
greenhouse gas emission computations.
11.1.3. Mitigation assessment
Although some Gambian professionals received training on this subject, its inadequate treatment in Chapter 4
indicates that training of a larger pool of professionals in developing sector-specific scenarios, conducting
economic assessments of climate change mitigation, and integrating NAMAs within an economy-wide
mitigation strategy, is imperative.
Gambia’s Second National Communication
107
11.1.4. Vulnerability and adaptation assessment
Several omissions from chapter 5 has drawn government‟s attention to inadequate institutional capacity for
carrying out comprehensive vulnerability and adaptation assessments in some key sectors of the economy.
Part of the problem lies in data availability, but professional competencies remain an important aspect of the
problem. More people should be trained and collaborative arrangements devised to fill knowledge gaps.
Community engagement in vulnerability and adaptation assessments could also add-value to mostly favoured
top-down approaches.
11.2. Climate change management
11.2.1. Networking
For effective implementation of the UNFCCC, other Rio Conventions and their associated protocols, it would be necessary to foster an enabling environment by:
institutional embedding of climate change management;
strengthening of the administrative and technical capacities of the Gambia‟s Climate Change Secretariat14;
strengthening of systematic observation and monitoring networks and negotiating resource-sharing arrangements with national, regional, global centres and institutions working in fields related to climate change.
The training of 12 agriculture and forestry professionals in 2008 on greenhouse inventorying had a positive
impact on compilation of chapter 3 of this SNC, but national arrangements for compiling and managing
greenhouse gas inventories are yet to be concretised.
11.2.2. Capacity building
In-country evaluations (i.e. stocktaking) and consultations have revealed to stakeholders, a number of
constraints critical to effective climate change management.
At the level of individual actors, capacity constraints are reflected by a lack of appropriate skills and expertise
which unfailingly frustrate effective participation in and conduct of the following processes:
assessment of mitigation and adaptation options; and
knowledge-sharing across professional networks
These constraints filter down to the institutional level where human resources with inadequate scientific
education and training, sub-optimal investments on technical assets and tight operational budgets, turn out to
be serious impediments to timely elaboration of situation, diagnostic, and strategic planning reports, and broad
participation in the work of the UNFCCC and its negotiations process.
Capacity constraints at the system level are exemplified by a slow-response policy environment. In effect,
national institutional arrangements, policies and regulatory measures are still lagging behind global change
challenges. To reverse this state of affairs, the government will therefore need to overcome institutional and
individual actors‟ capacity constraints.
14 Under a GOTG/UNEP/UCCEE project for the analysis and evaluation of activities and projects related to the Clean Development Mechanism, the Gambia established a Climate Change Secretariat within the Department of Water Resources. The operational budget of this secretariat is financed through government‟s regular budget and contributions from projects.
Gambia’s Second National Communication
108
11.2.3. Education and public awareness
The interested public can access meteorological, climatological and climate change information at from these
websites: URL www.mofwrnam.gm and www.climatechange.gm. But, considering literacy levels and access
to computers, most Gambians rely on radio and to a lesser extent on TV for climate-related information. As a
general rule, radio and/or TV broadcasts are event-driven and rarely cover issues in depth. Because of the
Gambia‟s geographical configuration, installation of repeater stations along the country is essential for full
radio coverage. Journalists/reporters (proficient in local languages) need opportunities and encouragement to
develop programmes with climate change as a central theme.
Financial needs in the basic education cycle often exceed resources available. Thus, expenses related to
extramural activities with instructional value such as field trips are often covered by parents. Similarly, a few
internet service providers make generous donations of computers and free-internet access to some schools to
augment student‟s learning resources and opportunities.

Gambia’s Second National Communication
109
12. CONCLUSIONS AND RECOMMENDATIONS 12.1 Conclusions
At more than twice the CO2-equivalent of emissions from the LUCF sector, emissions from industrial
processes and solvents account for an important portion of The Gambia‟s GHG inventory. Additionally, CO2
removals by carbon sequestration in the LUCF sector, estimated at 7,266.9 Gg, were not sufficient to offset
emissions, resulting in net emissions of 330 Gg of CO2 and moving The Gambia from its previous position of
net sink in 1994 to a net emitter in 2000. Notwithstanding, national emissions in 2000 stood at 15.7 t CO2-e
per capita. It is worth noting that improved quantification of emissions from industrial processes, waste and
agriculture sectors, as well as the reduction of uncertainties in emission factors would significantly increase
the reliability of greenhouse gas emission computations.
The mitigation scenarios studied point to significant potential to reduce energy consumption compared to the
reference scenario. In particular, the butanisation (i.e., widespread use of LPG) and improved cooking stoves
scenarios offer the biggest reductions, demonstrating that household energy consumption plays and will
continue to play a major role in the energy balance of The Gambia.
It is hardly surprising that sectors and areas put through vulnerability assessments are those expected to be at
the receiving end of adverse biophysical and socioeconomic impacts arising from climate change. For
illustrative purposes, climate change forcing and impacts on environmental resources could alter breeding
habitats of disease vectors and vector-borne transmission pathways, endanger the survival of floristic species
essential to traditional/alternative medicine, accelerate rangeland degradation, and cause loss of natural and
economic assets located in The Gambia‟s coastal zone. Yet, some uncertainties still remain. In particular,
terrestrial biomass production is influenced by subtle differences in climate change scenarios with higher
temperatures (BMRC98) and water shortage counteracting beneficial effects of atmospheric CO2
concentrations. Exceptionally, fisheries is the only sector that shows improvements in production potential
under climate change.
Most of the priority GHG mitigation technologies identified are already deployed in relevant socio-economic
sectors in The Gambia. What remains to be done is acquisition of latest, higher-performance models and
their integration in household economies and other production systems. Other new technologies need careful
consideration, i.e., testing for economic advantages and cultural compatibility, before widespread adoption.
Similarly, adaptation technologies and techniques are scattered and often lack a supportive diffusion
mechanism. A first purposive step in the direction of effective mitigation and technology transfer is setting up
an appropriate mechanism entrusted with oversight of scaling-up good practices, accessing and diffusing
proven technologies in social, economic and environmental sectors of interest.
Owing to the country‟s geographical location and size, most weather and climate phenomena in The Gambia
have a transboundary dimension, necessitating international cooperation in systematic observations of earth
system variables and research. The national capacity to carry out earth system and global change research is
quite low. And neither the NMHS nor the fledgling UTG have officially adopted research agenda to provide
institutional focus on priority sets of issues to be investigated by research teams or individual researchers.
Taking existing capacity and knowledge gaps highlighted in the report, The Gambia needs investments in
critical infrastructure, human resources development and a strategic framework for producing high quality
datasets from sustained monitoring programmes that are responsive to research needs and contributing to
greater scientific understanding of the earth system, security, health and well-being of Gambians.
Gambia’s Second National Communication
110
The impact of radio and television broadcasts on public awareness building activities has not been measured,
but would certainly benefit from regular programming and effective participation of communication specialists.
Climate change knowledge- and information-sharing in The Gambia is limited to training activities for targeted
audience and the use of public consultations and media outlets for public sensitisation and awareness-raising.
Greater efforts are required to strengthen the National Climate Committee (NCC) and to establish strategic
working relations with other international groups/networks with shared interests.
In spite of capacity building activities implemented during the past nine years, notable capacity gaps in relation
to data capture, archiving and analysis, as well as climate change management were self-evident during the
preparation of the SNC. Capacity building therefore remains as much a central issue as it was a decade ago.
12.1 Recommendations
The COP and UN specialised agencies are urged to take notice of constraints and capacity gaps outlined
above to provide requisite financial and technical assistance including short-term technical missions to The
Gambia.

Gambia’s Second National Communication
111
BIBLIOGRAPHY Caswell, H. 2001. Matrix population models: Construction, analysis and interpretation, 2nd Edition. Sinauer Associates, Sunderland, Massachusetts. ISBN: 0-87893-096-5.
Department of State for Finance and Economic Affairs (DoSFEA), 2008. Estimates of revenue and expenditure. GoTG. Banjul, pp7-68.
Department of Water Resources (DWR), 1983. Groundwater Resources of The Gambia. Preliminary Report, MWRE, Banjul, 92p.
DHI, 1982. Banjul second port project: Studies of the effect of a barrage on sedimentation, Consultancy Report prepared for the GOTG/GPA, Banjul.
Gielen, G., 2010. UNIDO Industrial Energy Efficiency and Technology Programme, BEE-IEA Seminar, 27-28
January 2010, New Delhi, India)
Gibba, P., 2007. L’utilisation des images satellitaires pour évaluer l’occupation des sols autour de Brikama,
Gambie. Mémoire de fin d’étude, Diplômé de Mastère en gestion concertée des ressources naturelles.
Centre Regional Agrhymet, Niamey, 58 page + Appendices.
Global Environment Facility (2002): A Guide for Self-Assessment of Country Capacity Needs for Global Environmental Management, Washington D.C., U.S.A.
Government of The Gambia (GOTG), 2003, The Gambia‟s First national communication to the UNFCCC. Department of State for Fisheries, Water Resources and the Environment, Banjul, 144p.
Government of The Gambia (GOTG), 2007. Gambian National Adaptation Programme of Action on Climate Change. Banjul, 97p.
Gulland, J.A.,1969. Manual of Methods for fish stock assessment. Part 1. Fish population analysis. FAO Man.Fish. Sci., (4):154.
Jaiteh, M., and Saho, A., 2006.The Gambia Atlas of 2003 Population and Housing Census. Gambia Bureau of Statistics, Banjul, The Gambia, 78p + Appendices
Jallow, B. P., M. K. A. Barrow, and S. P. Leatherman, 1996. Vulnerability of the Coastal Zone of The Gambia to Sea Level Rise and Development of Response Options: Climate Res. Vol. 6: 165-177. Jallow B.P and Bernard Gomez, 2003. Stock Taking in Capacity Building Climate Change in The Gambia, Department of Water Resources, Banjul, The Gambia.
Kah, M.O., Kah, J.M.L and Sowe, M, 2010. Case study: University research, doctorate and engineering training in The Gambia. University of The Gambia, Banjul, 29p
Kapur V, Troy D and Oris J., 1997. A Sustainable fishing simulation using mathematical modeling Crossroads.
Lebel, T and A. Amani, 1999: Rainfall estimation in the Sahel: what is the ground truth? Journal of Applied Meteorology, 38, 555-568.
Martin, N., Worrell, .E, Ruth, M., Price, L., Elliott, R.N., Shipley, A.M. and Thorne, J. 2000: Emerging Energy-
Efficient Industrial Technologies.

Gambia’s Second National Communication
112
Metz, B, Davidson, O., Martens, J.W., Van Rooijen, S.M.N. and McGrory, L.V.M. 2001. Methodological and
Technological Issues in Technology Transfer. Cambridge, UK: Cambridge University Press for the IPCC.
National Environment Agency (2004): National capacity self-assessment (NCSA): Strategy/Action Plan for
capacity building to protect the global environment, Banjul, The Gambia
National Research Council (NRC),1998. Improving fish stock assessments. National Academy Press, Washington, D.C.
Njie, M., Gomez, B.E., Hellmuth, M.E., Droogers, P., Callaway, J.M., Jallow, B.P., 2008. Making economic sense of adaptation in upland cereal productions systems in The Gambia, in Leary et al. (eds.). Climate Change and Adaptation, Earthscan Publications, pp131-146.
Njie, M., 2009. IWRM roadmap for The Gambia. Consultancy Report prepared for the UCC-Water/DHI, Banjul, 39p + appendices.
Open University, 1995. Ocean circulation. Pergammon Press, Oxford. 237p.
Raper, S.C.B., Wigley, T.M.L. and Warrick, R.A., 1996: Global sea level rise: past and future. (In) Sea-Level Rise and Coastal Subsidence: Causes, Consequences and Strategies (eds. J. Milliman and B.U. Haq), Kluwer Academic Publishers, Dordrecht, The Netherlands, 11–45. Sima, F., 2007. Interpretation et utilisation des prevision saisonnières de precipitations pour l’amélioration de la production de mil en Gambie. Mémoire de fin d’étude. Diplôme d’Ingénieur en agrométéorologie. Centre Regional Agrhymet, Niamey, 46 page + Appendices.
Sparre, P.; Ursin E.and Venema S. C.,1989. Introduction to tropical fish stock assessment. Part 1- Manual. FAO Fisheries Technical Paper No. 3061. Rome, FAO. p. 337.
TAMS Consultants, 1998: Coastal Protection Study, Technical Proposal.
UNDP (2000): Capacity Building for Environmental Management and Planning, Project of the Government of The Gambia, Project Document, Banjul, The Gambia.
UNDP, 2008. Fighting Climate Change: Human solidarity in a divided world. Human Development Report 2007/8. Palgrave Macmillan Ltd., UNDP, New York, 384p.
UNDP, 2011: Human Development Report 2011, Sustainability and Equity: A Better Future for All..
Verkerk, M.P., and van Rens, C.P.M, 2005. Saline intrusion in Gambia River after dam construction: Solutions to control saline intrusion while accounting for irrigation development and climate change. Research Report, University of Twente (The Netherlands), 64p (downloadable at http://homeoud.student.utwente.nl/m.p.verkerk/ and http://www.bgs.gm/resources.html).
WHO, 1990. Potential health effects of climate change. report of WHO Task Group (pp 8-33). WHO, Geneva.
Whyte W.J. and Russel T.S, 1988: Geology and Mineral Resources of the Gambia. Wigley, T.M.L., 1991: A simple inverse carbon cycle model. Global Biogeochemical Cycles 5, 373–382. Wigley, T.M.L., 1993: Balancing the carbon budget. Implications for projections of future carbon dioxide concentration changes. Tellus 45B, 409–425.

Gambia’s Second National Communication
113
Wigley, T.M.L., 2000: Stabilization of CO2 concentration levels. (In) The Carbon Cycle, (eds. T.M.L.
Wigley and D.S. Schimel). Cambridge University Press, Cambridge, U.K., 258–276.
Wigley, T.M.L. and Raper, S.C.B., 1992: Implications for climate and sea level of revised IPCC emissions scenarios. Nature 357, 293–300. Wigley, T.M.L. and Raper, S.C.B., 2001: Interpretation of high projections for global-mean warming. Science 293, 451–454. Wigley, T.M.L. and Raper, S.C.B., 2002: Reasons for larger warming projections in the IPCC Third Assessment Report. Journal of Climate 15, 2945–2952. Wigley, T.M.L., Smith, S.J. and Prather, M.J., 2002: Radiative forcing due to reactive gas emissions. Journal of Climate 15, 2690–2696.
Zabel, R.W., Harvey, C.J. Katz, S.L., Good, T.P and Levin, P.S. 2003. Ecologically sustainable yield. American Scientist, March–April 2003.