Embed Size (px)
Citation preview
GALVESTON COUNTY, TEXAS, AND INCORPORATED AREAS
VOLUME 1 OF 4
Community Name Community Number
BAYOU VISTA, VILLAGE OF 481589 CLEAR LAKE SHORES, CITY OF 485461 DICKINSON, CITY OF 481569 FRIENDSWOOD, CITY OF 485468 GALVESTON, CITY OF 485469 HITCHCOCK, CITY OF 485479 JAMAICA BEACH, VILLAGE OF 481271 KEMAH, CITY OF 485481 LA MARQUE, CITY OF 485486 LEAGUE CITY, CITY OF 485488 SANTA FE, CITY OF 481562 SEABROOK, CITY OF 485507 TEXAS CITY, CITY OF 485514 TIKI ISLAND, VILLAGE OF 481585 GALVESTON COUNTY (UNINCORPORATED AREAS)
485470
REVISED: PRELIMINARY
Federal Emergency Management Agency FLOOD INSURANCE STUDY NUMBER
xxxxxx
GALVESTON COUNTY
i
NOTICE TO
FLOOD INSURANCE STUDY USERS
Communities participating in the National Flood Insurance Program have established repositories of flood
hazard data for floodplain management and flood insurance purposes. This Flood Insurance Study (FIS)
may not contain all data available within the repository. It is advisable to contact the community
repository for any additional data.
The Federal Emergency Management Agency (FEMA) may revise and republish part or all of this FIS
report at any time. In addition, part of this FIS may be revised by the Letter of Map Revision process,
which does not involve republication or redistribution of the FIS. It is, therefore, the responsibility of the
user to consult with community officials and to check the Community Map Repository to obtain the most
current FIS components.
Selected Flood Insurance Rate Map panels for this community contain information that was previously
shown separately on the corresponding Flood Boundary and Floodway Map panels (e.g., floodways, cross
sections). In addition, former flood hazard zone designations have been changed as follows:
Old Zone(s)
New Zone
A1 through A30
AE
V1 through V30
VE
B
X
C
X
Part or all of the Flood Insurance Study may be revised and republished at any time. In addition, part of
this Flood Insurance Study may be revised by the Letter of Map Revision process, which does not involve
republication or redistribution of the Flood Insurance Study. It is, therefore, the responsibility of the user
to consult with community officials and to check the community repository to obtain the most current
Flood Insurance Study components.
Initial Countywide FIS Effective Date:
ii
TABLE OF CONTENTS
Volume 1 of 4
Page
1.0 INTRODUCTION.......................................................................................................................... 1
1.1 Purpose of Study ................................................................................................................. 1
1.2 Authority and Acknowledgements ..................................................................................... 1
1.3 Coordination ....................................................................................................................... 4
2.0 AREA STUDIED ........................................................................................................................... 5
2.1 Scope of Study .................................................................................................................... 5
2.2 Community Description ...................................................................................................... 6
2.3 Principal Flood Problems .................................................................................................... 7
2.4 Flood Protection Measures ............................................................................................... 11
3.0 ENGINEERING METHODS ..................................................................................................... 12
3.1 Hydrologic Analyses ......................................................................................................... 12
3.2 Hydraulic Analyses ........................................................................................................... 18
3.3 Coastal Analysis ............................................................................................................... 23
3.3.1 Storm Surge Analysis and Modeling ................................................................................ 24
3.3.2 Statistical Analysis ............................................................................................................ 25
3.3.3 Stillwater Elevations ......................................................................................................... 26
3.3.4 Wave Height Analysis ............................................................................................ . ........ 26
3.4 Vertical Datum .................................................................................................................. 41
4.0 FLOODPLAIN MANAGEMENT APPLICATIONS ............................................................... 41
4.1 Floodplain Boundaries ...................................................................................................... 42
4.2 Floodways ......................................................................................................................... 42
5.0 INSURANCE APPLICATIONS ................................................................................................. 61
6.0 FLOOD INSURANCE RATE MAP .......................................................................................... 61
7.0 OTHER STUDIES ....................................................................................................................... 66
8.0 LOCATION OF DATA ............................................................................................................... 66
9.0 BIBLIOGRAPHY AND REFERENCES................................................................................... 66
iii
TABLE OF CONTENTS (Continued)
Page
FIGURES
Figure 1 – Transect Schematic .......................................................................................................................... 26
Figure 2 – Transect Location Map .................................................................................................................... 40
Figure 3 – Floodway Schematic ........................................................................................................................ 43
TABLES
Table 1 – Initial and Final CCO Meetings ......................................................................................................... 4
Table 2 – Scope of Study .................................................................................................................................... 5
Table 3 – Summary of Discharges .................................................................................................................... 15
Table 4 – Coastal Transect Data ........................................................................................................................ 29
Table 5 – Floodway Data Table ........................................................................................................................ 44
Table 6 – Community Map History................................................................................................................... 63
EXHIBITS
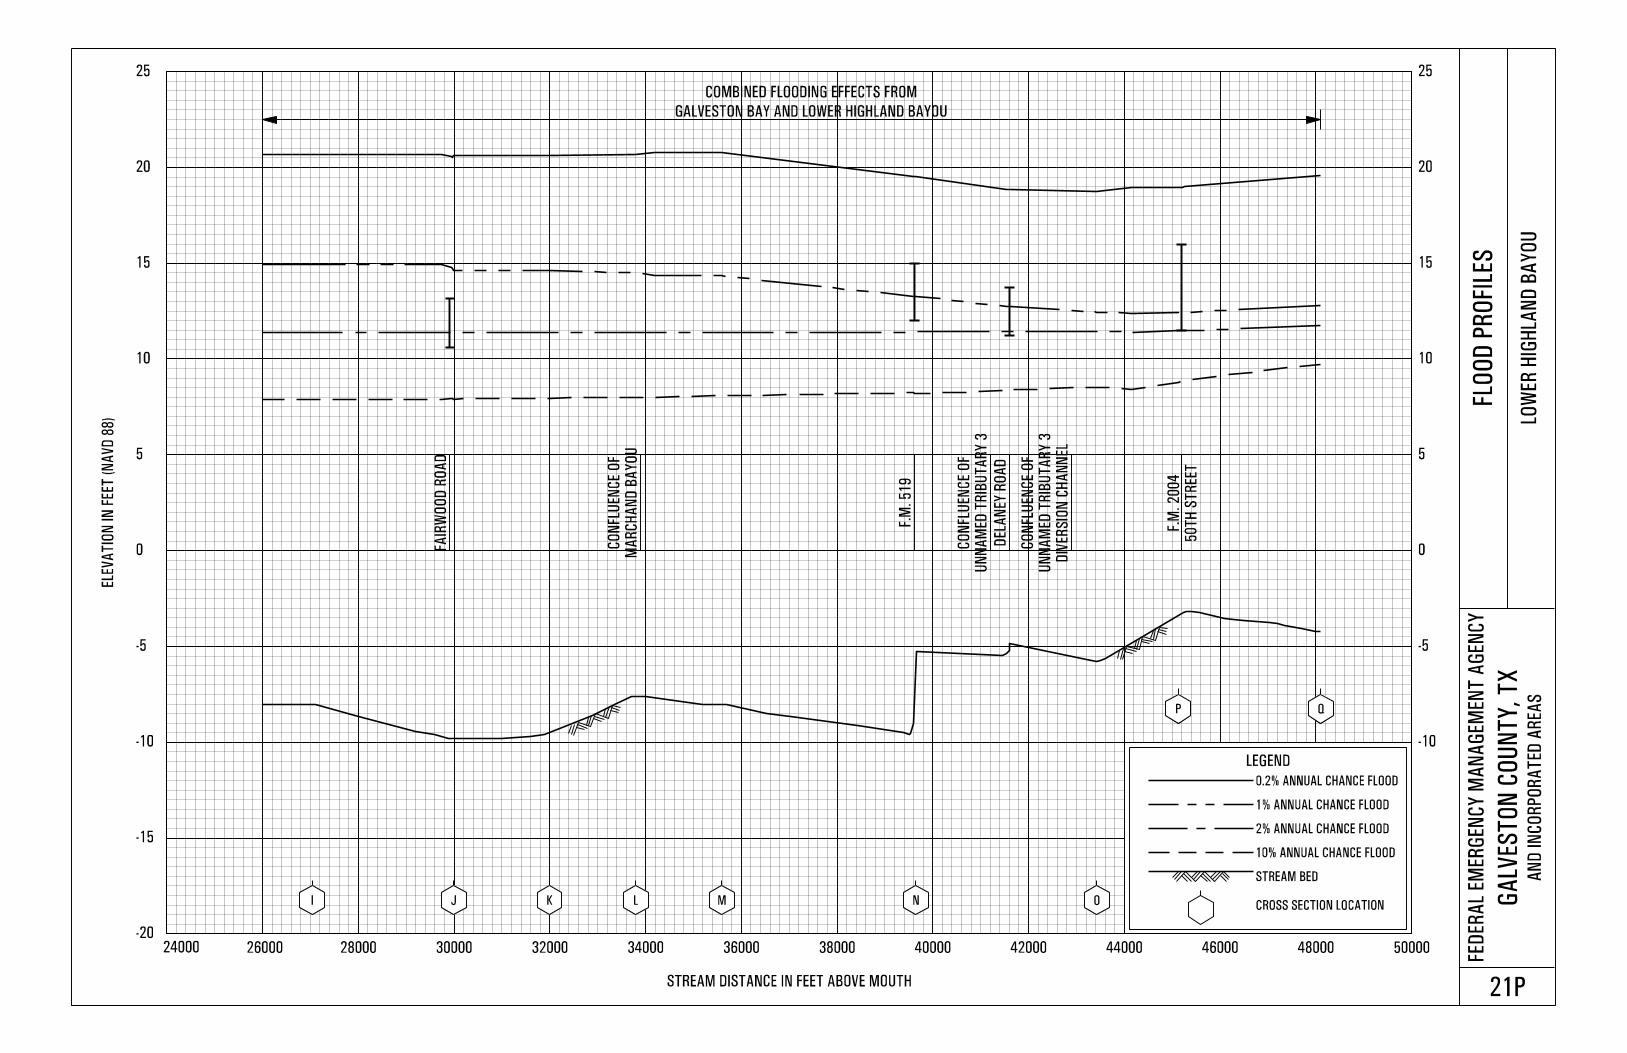
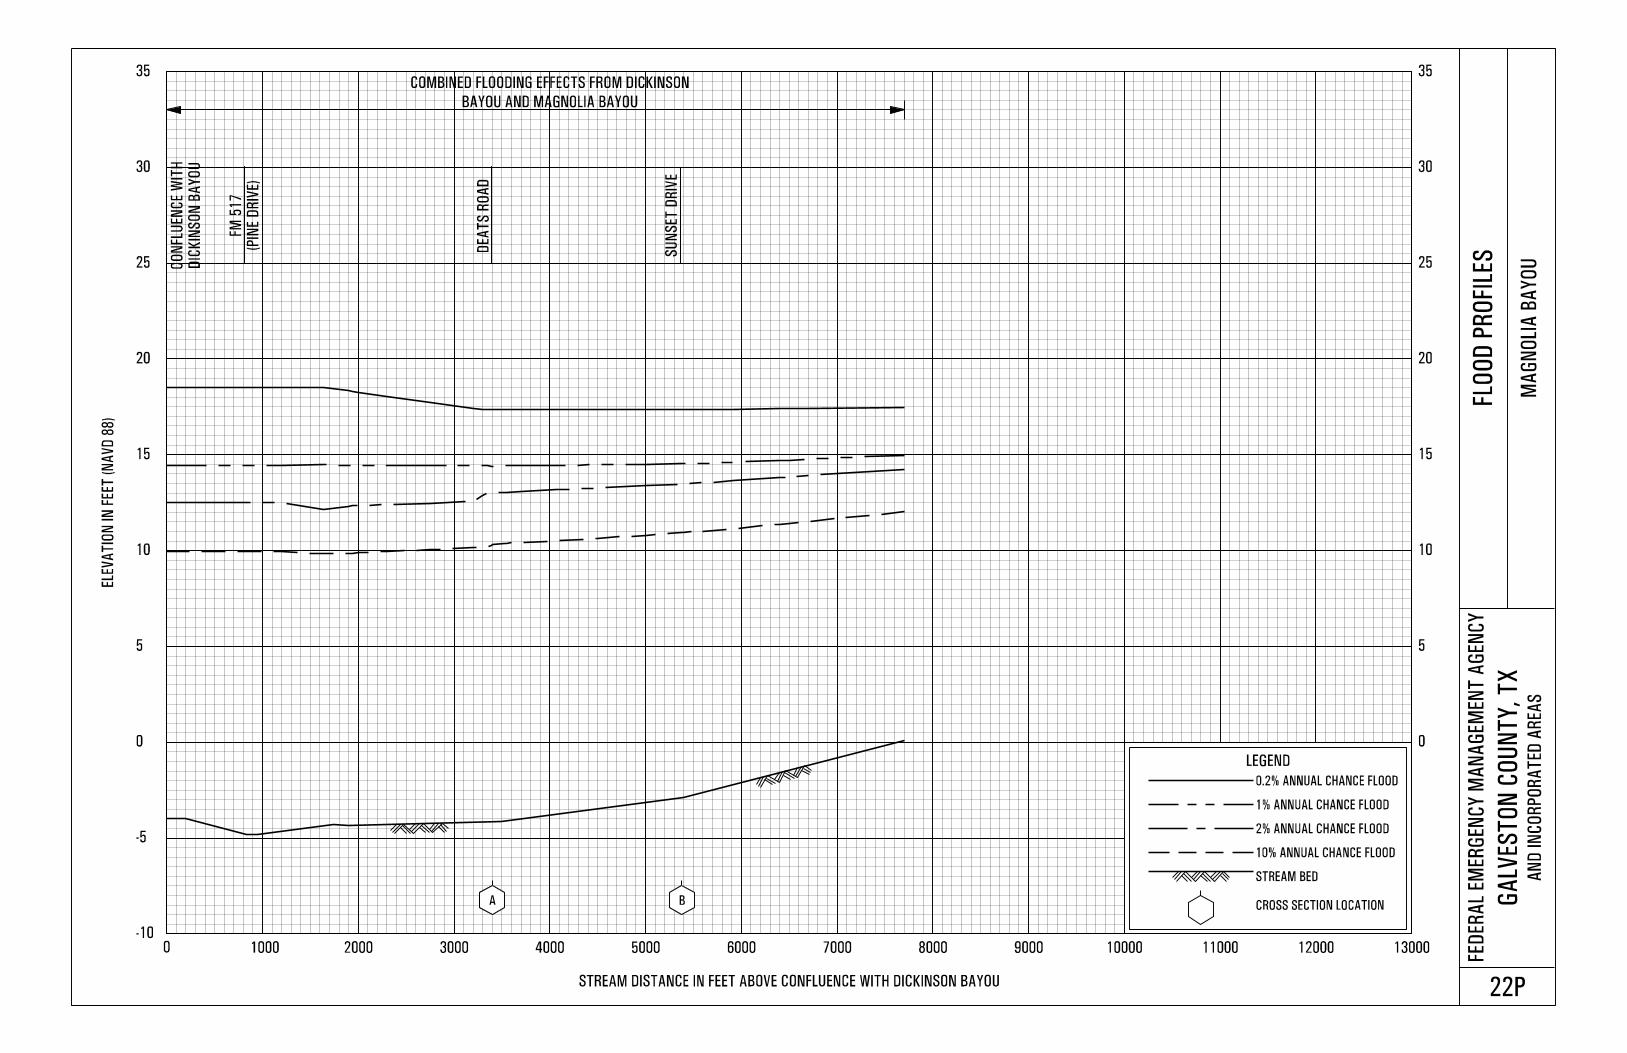
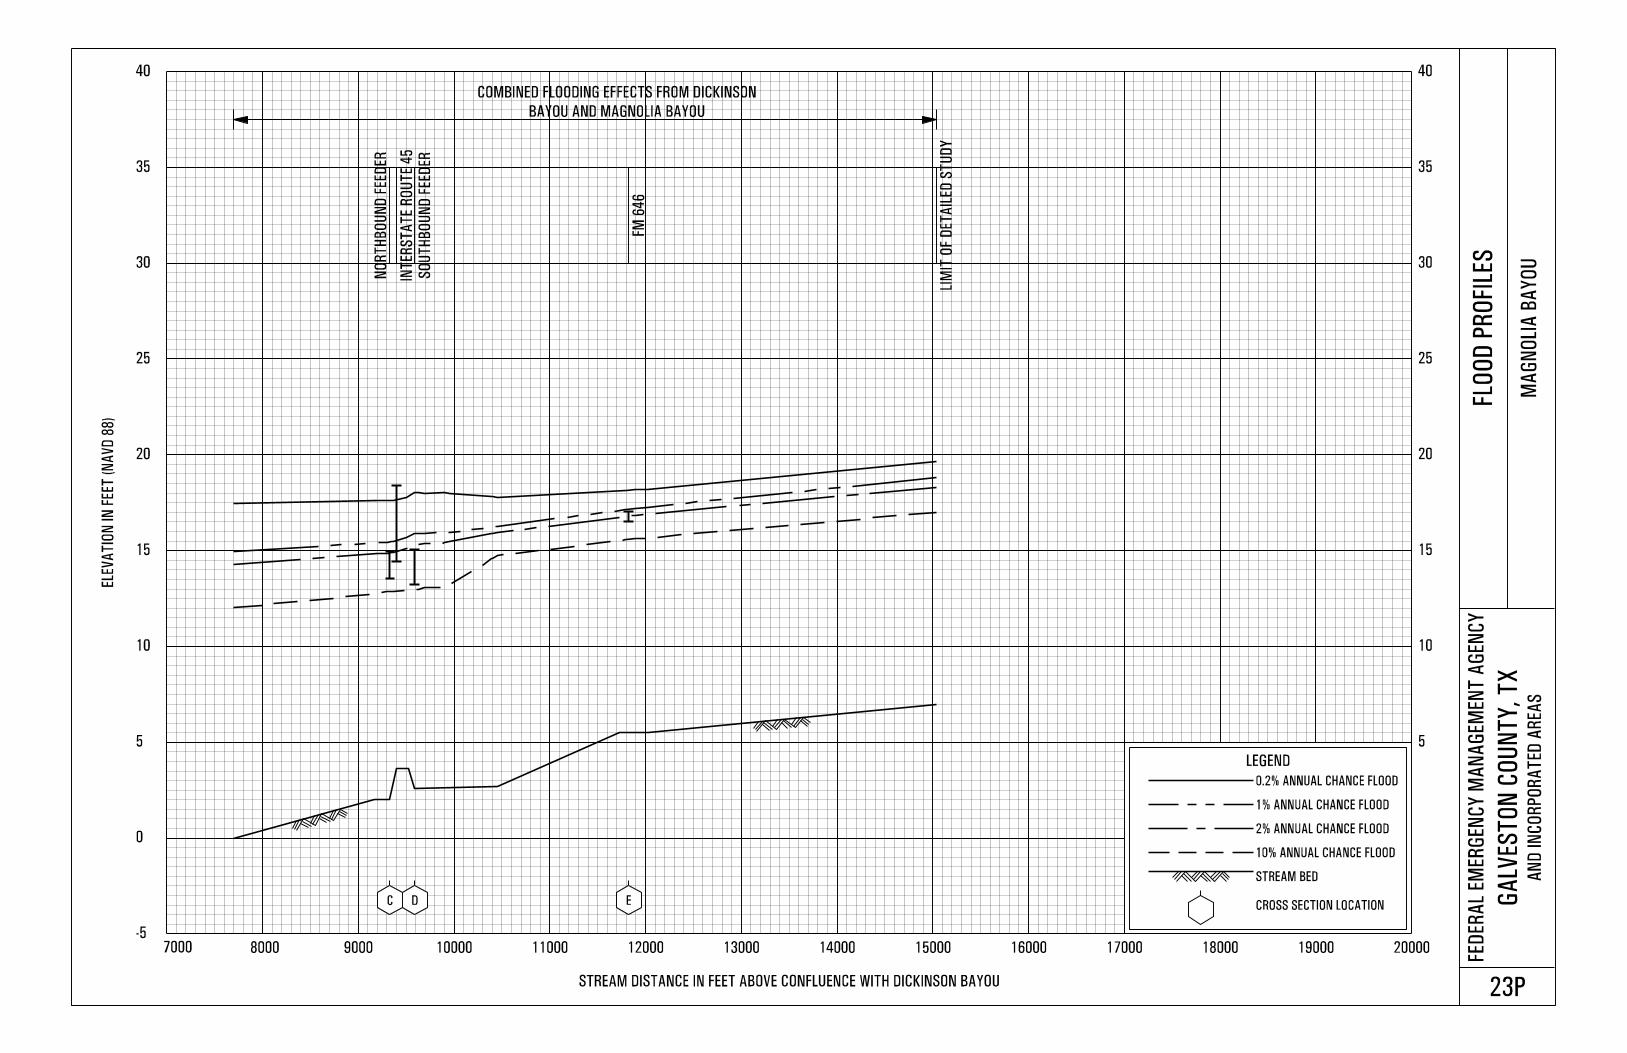
Exhibit 1 – Flood Profiles
Benson Bayou Panel 01P
Borden's Gully Panels 02P-03P
Cedar Gully Panel 04P
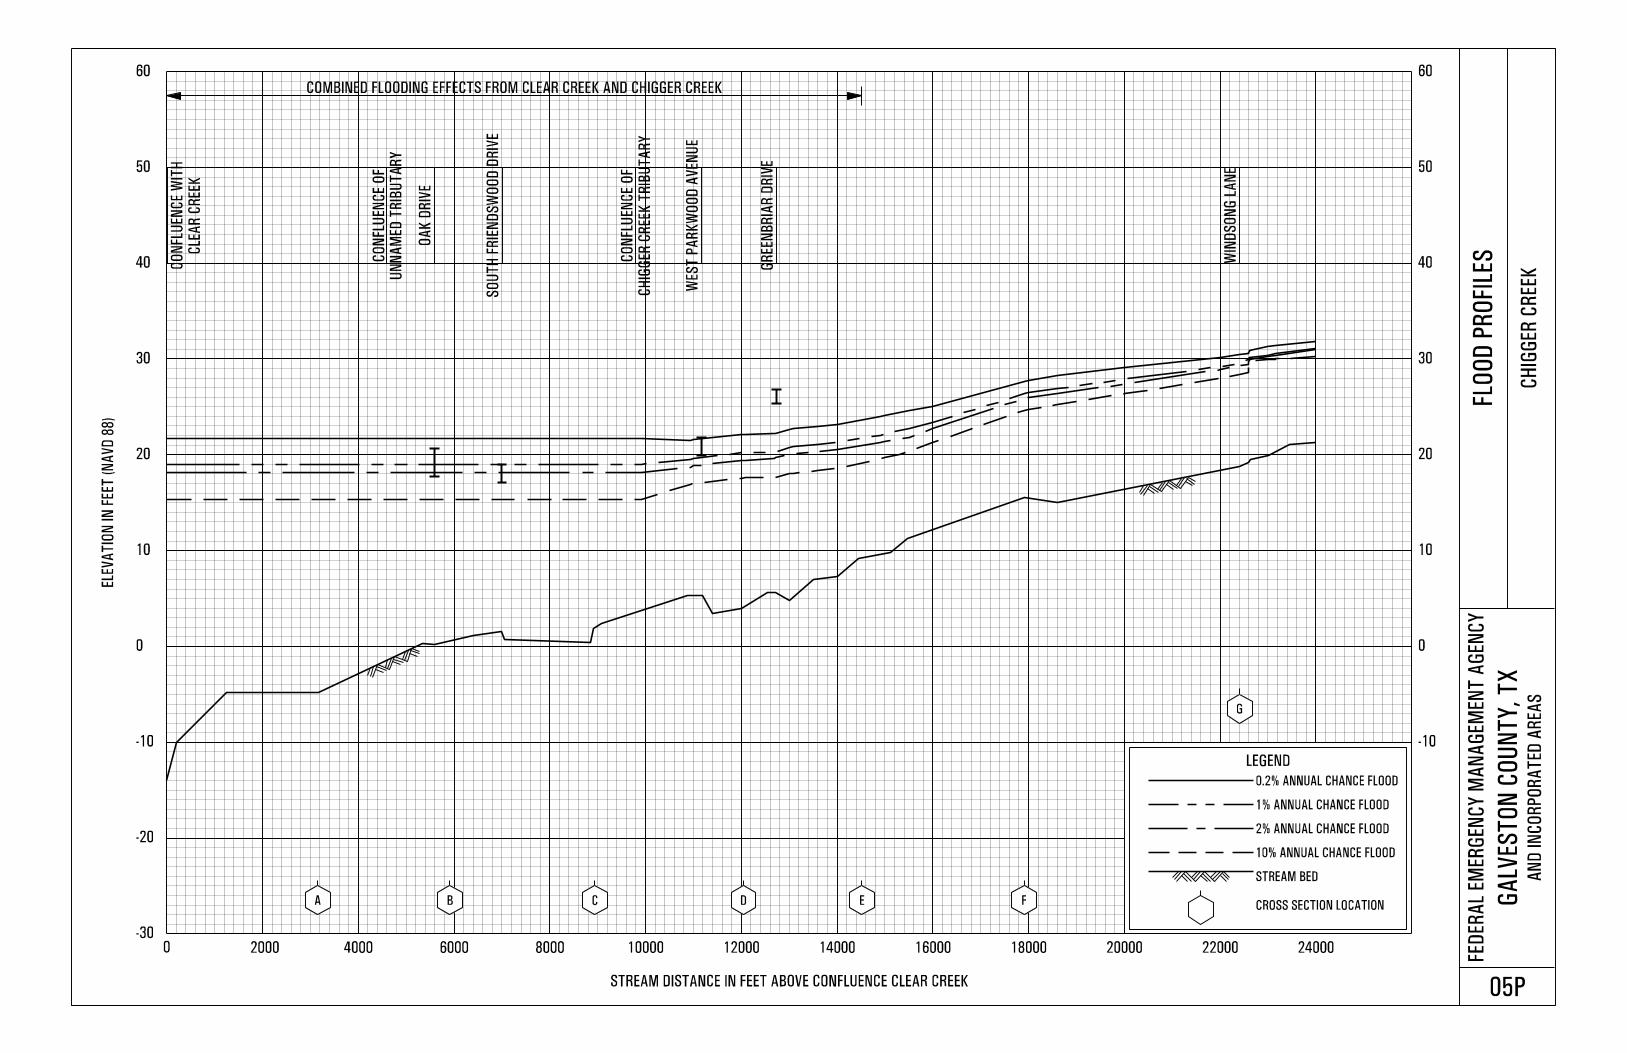
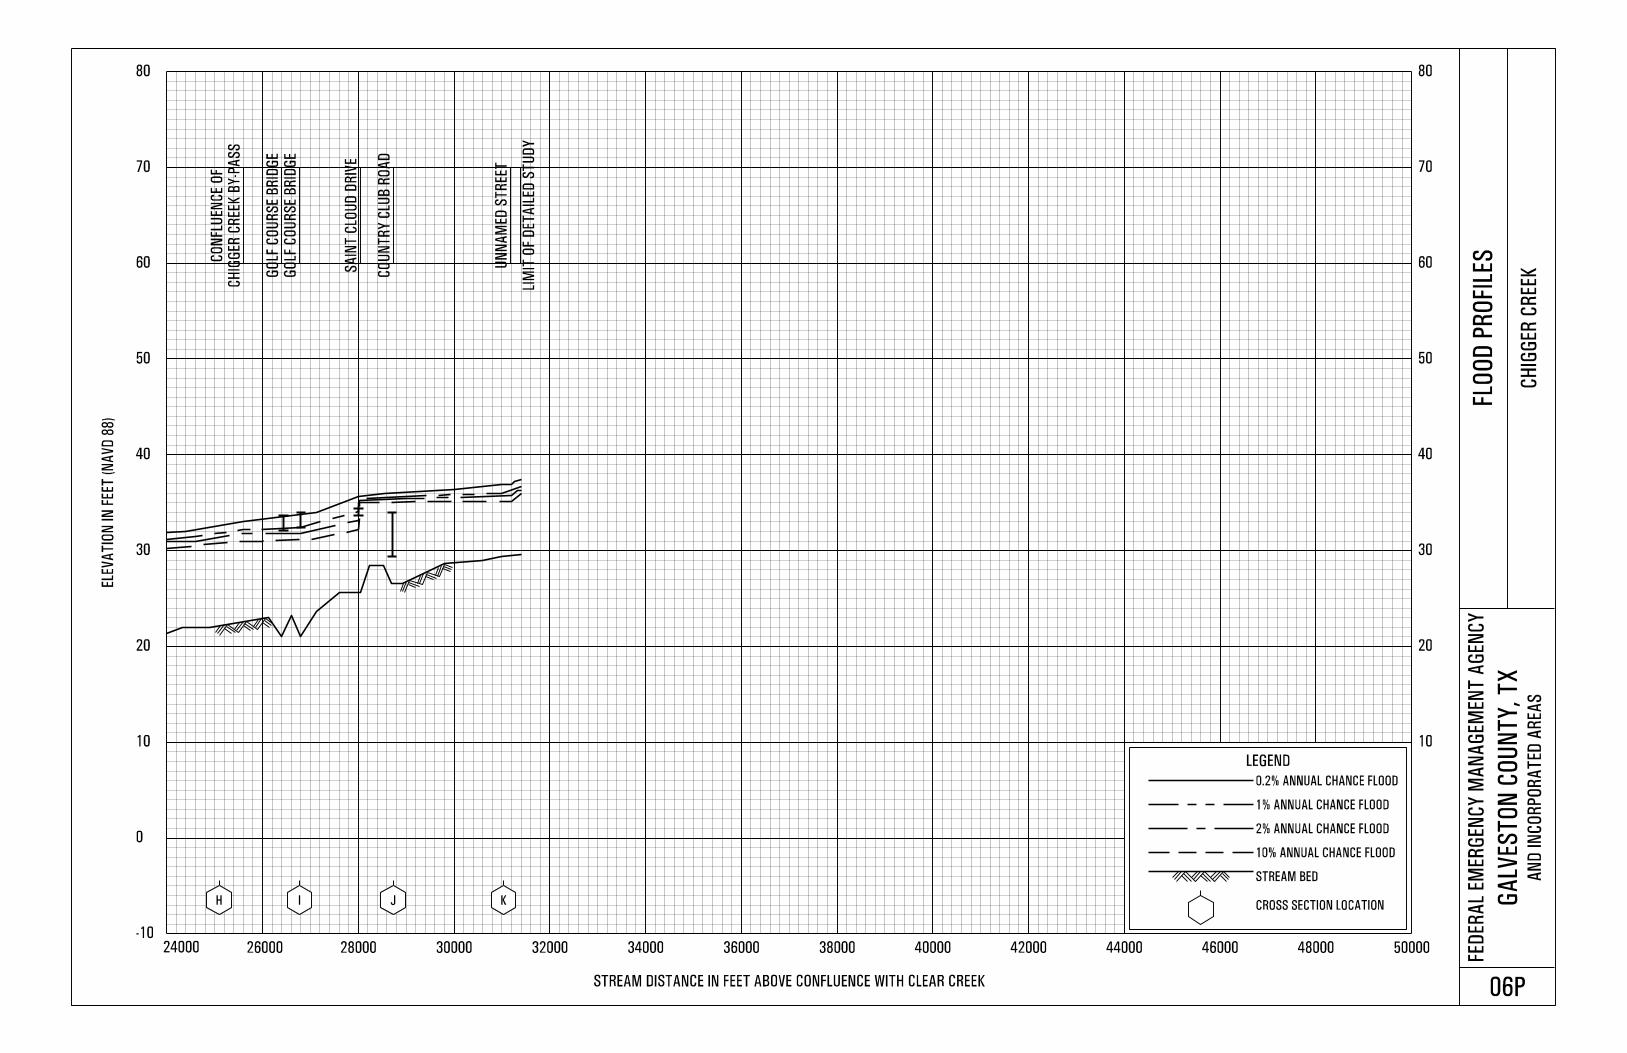
Chigger Creek Panels 05P-06P
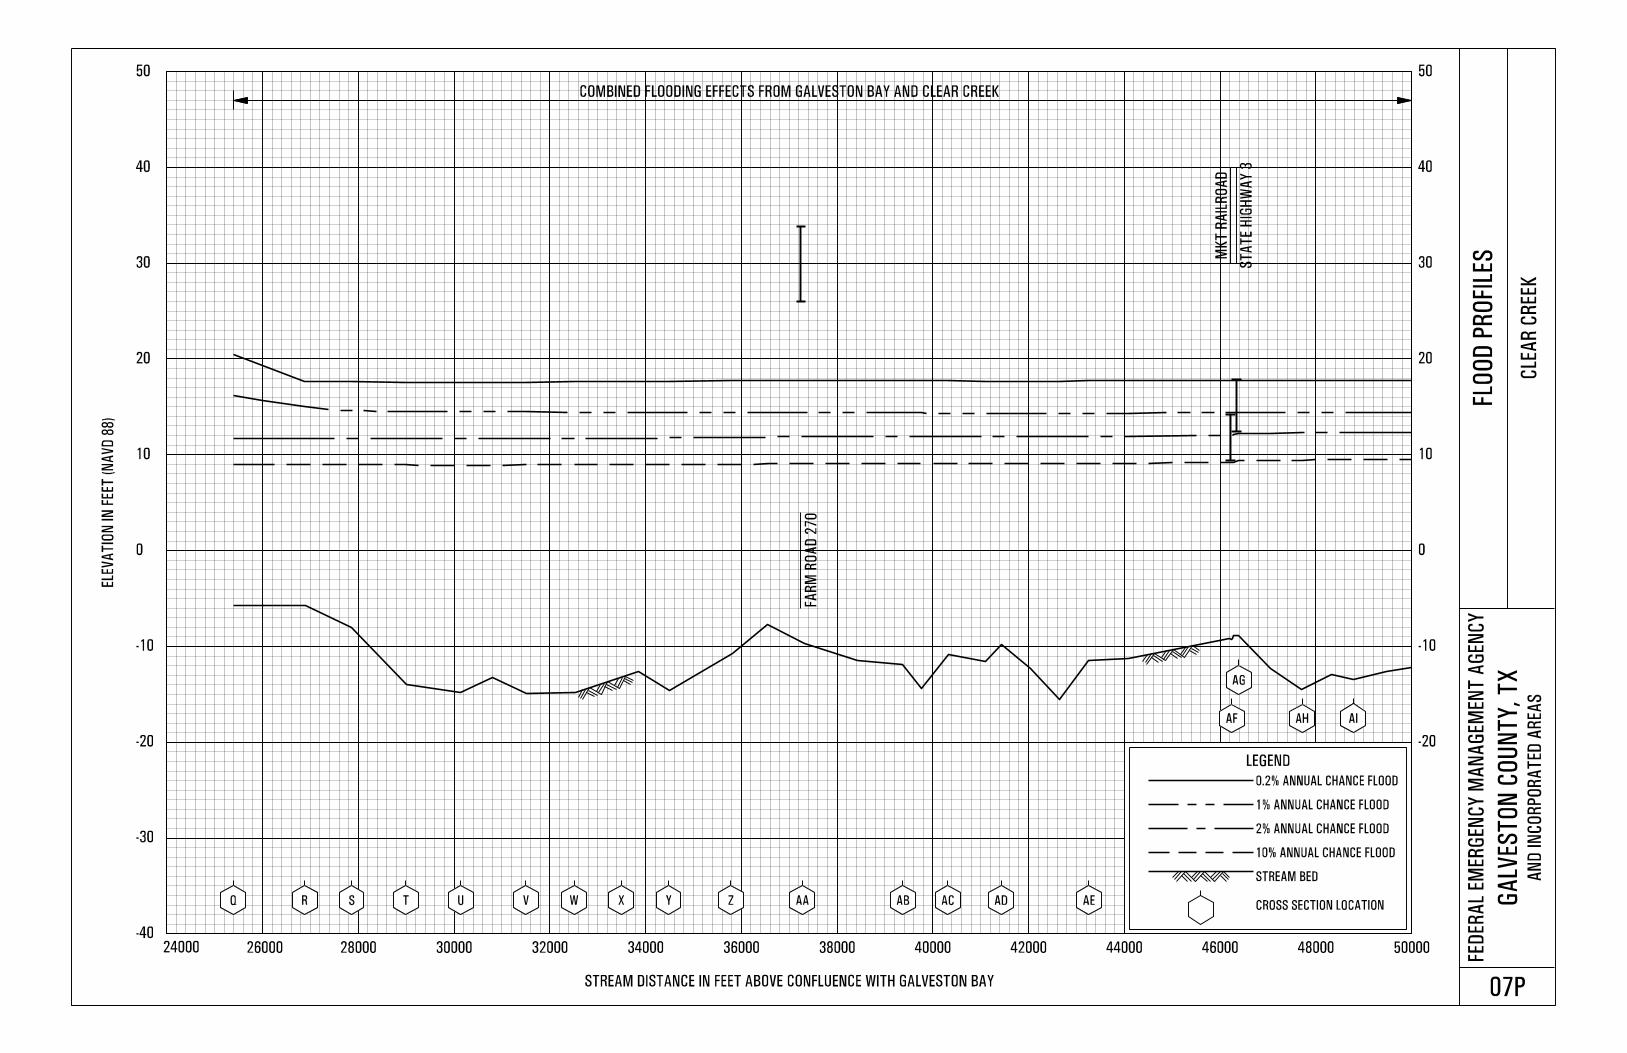
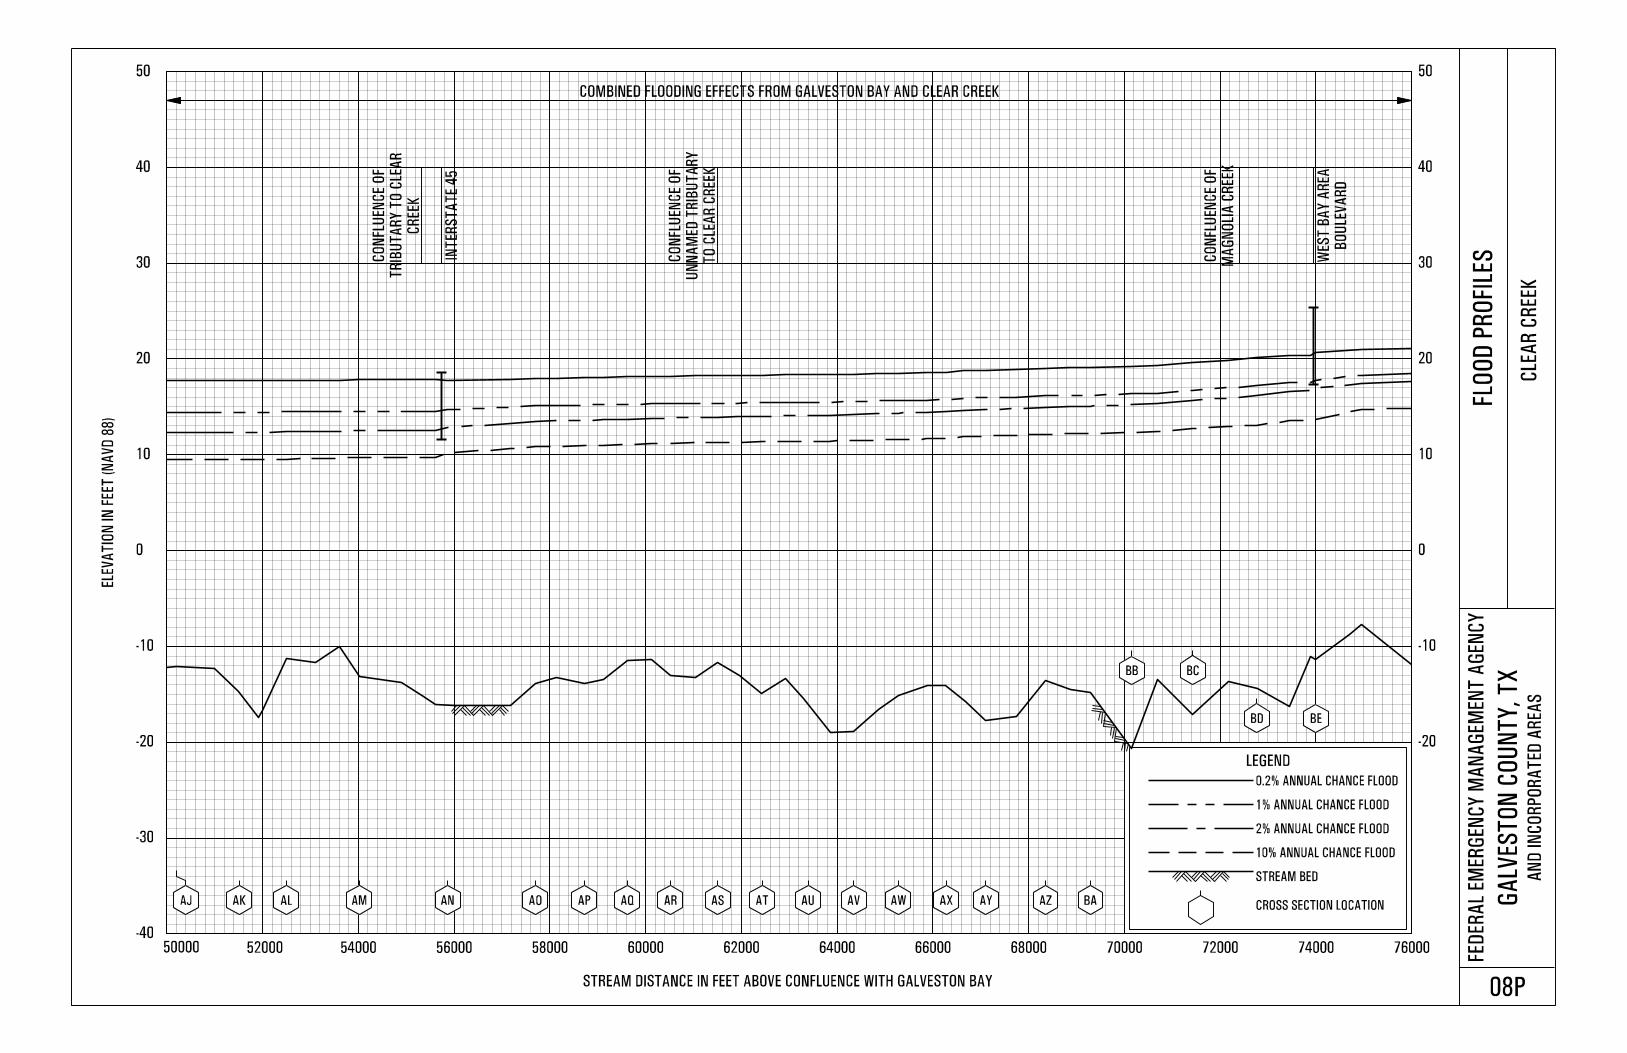
Clear Creek Panels 07P-11P
Cowart Creek Panel 12P
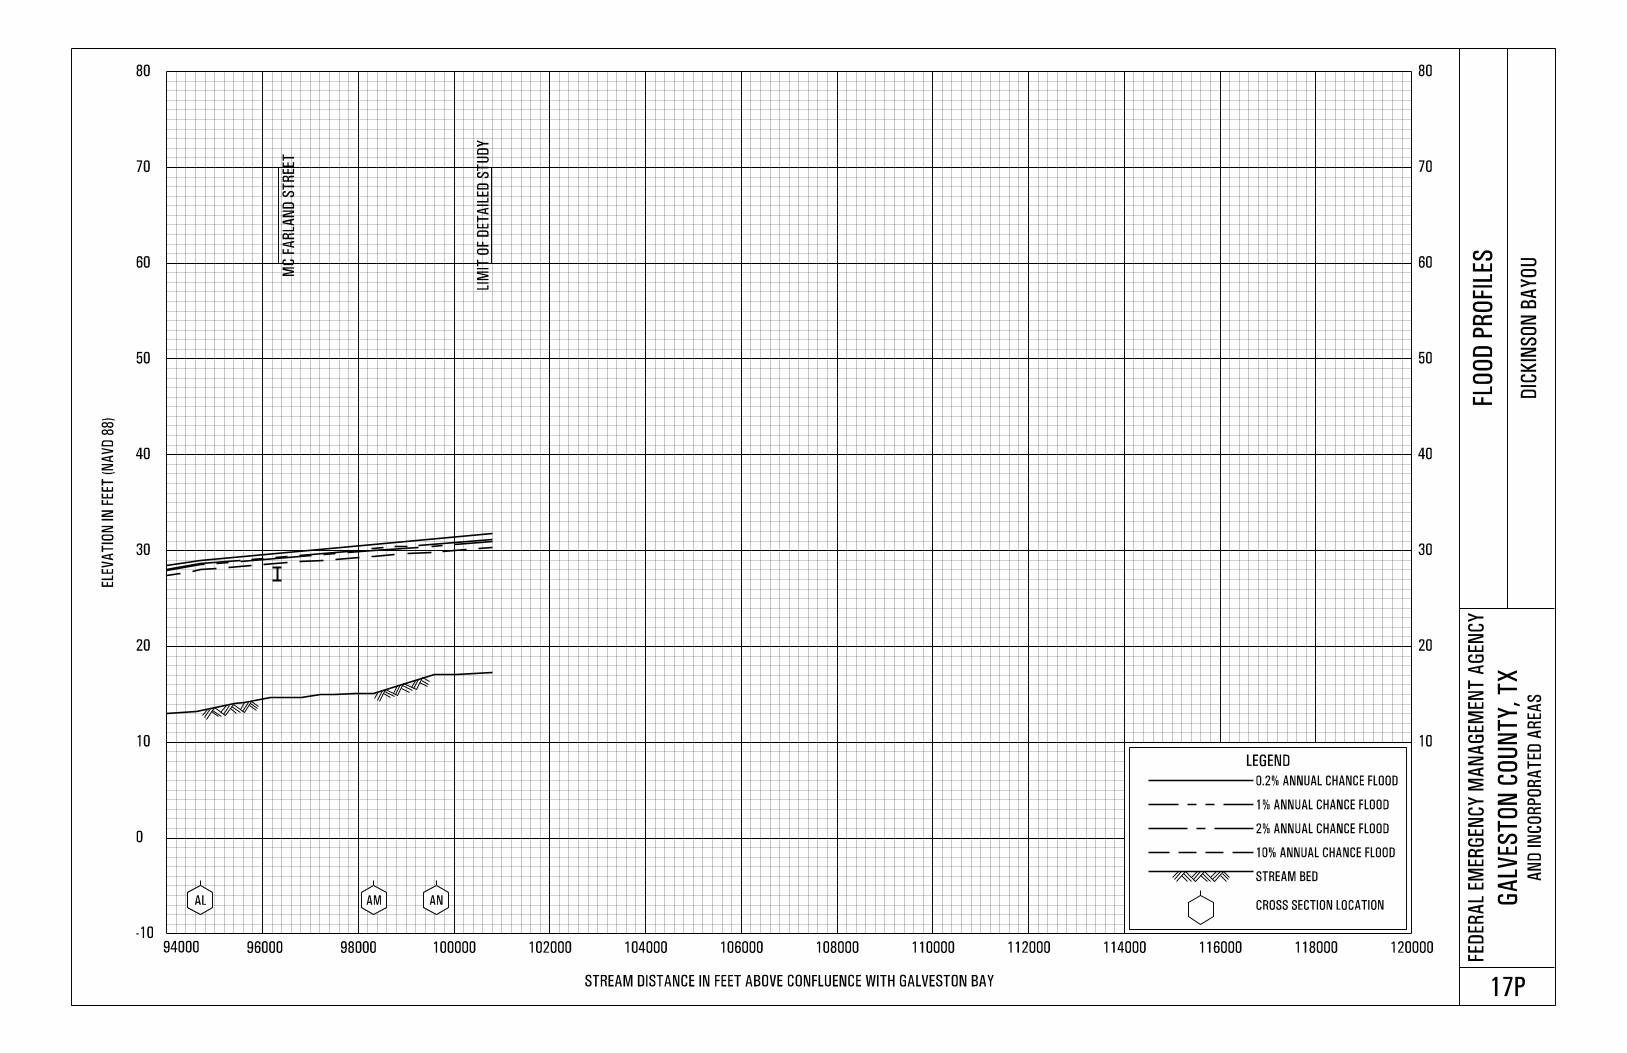
Dickinson Bayou Panels 13P-17P
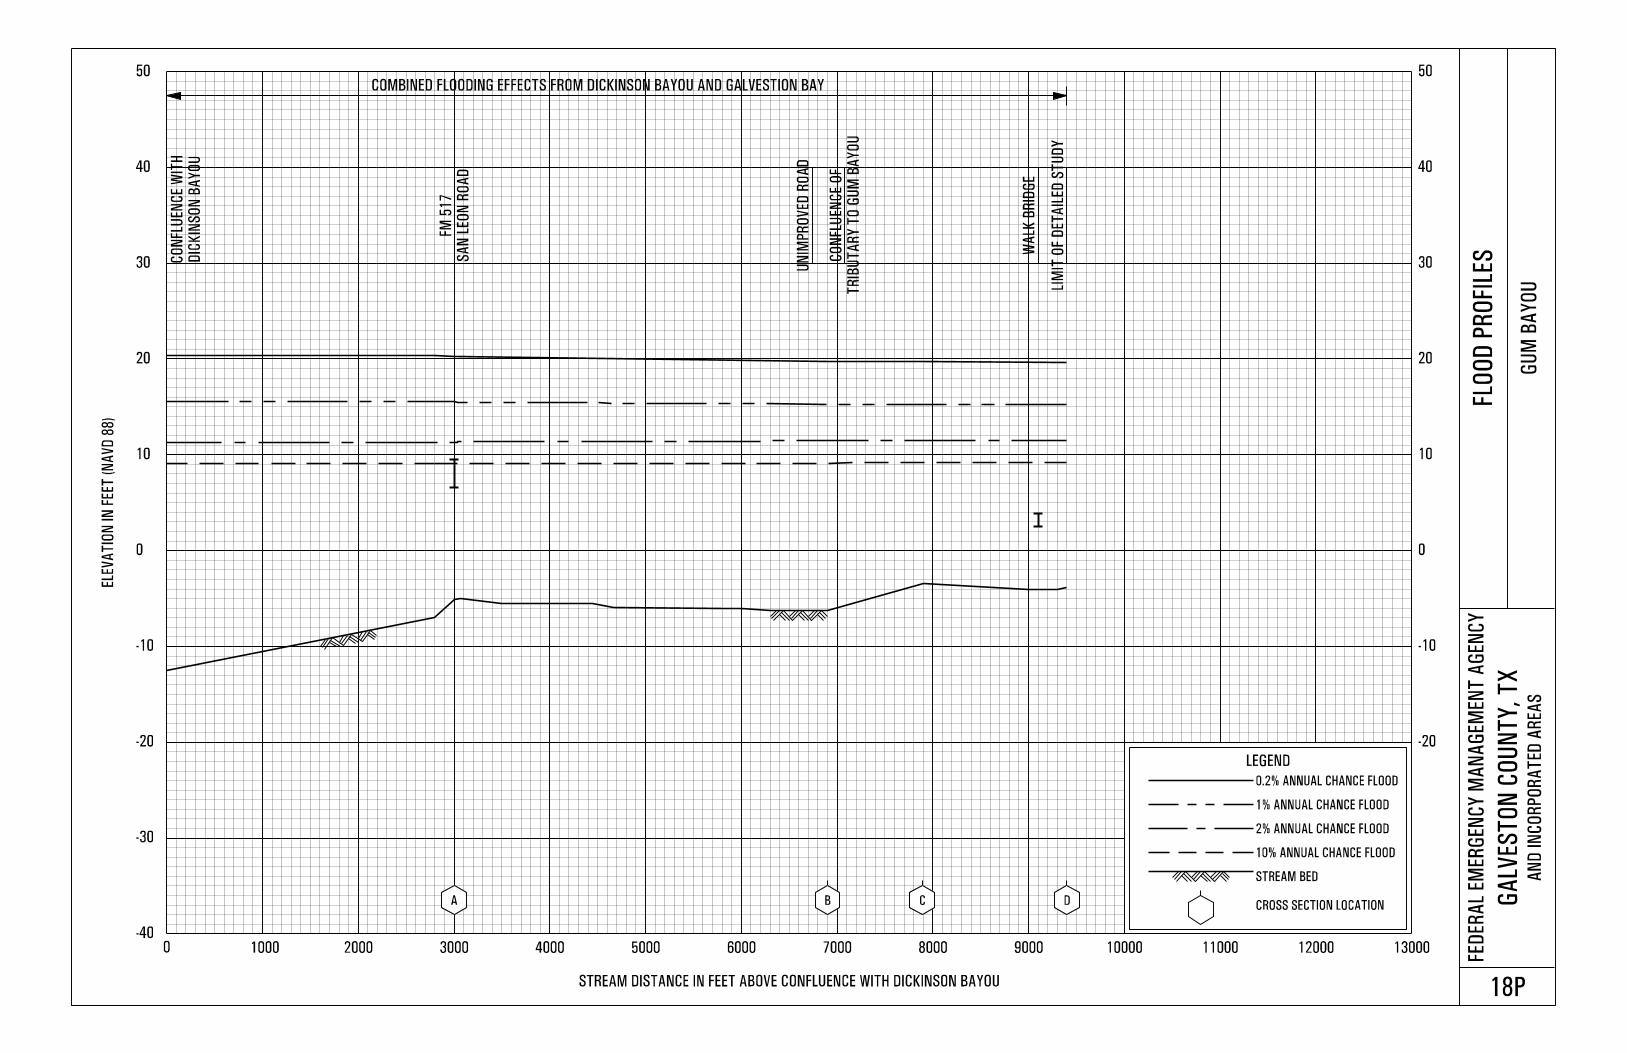
Gum Bayou Panel 18P
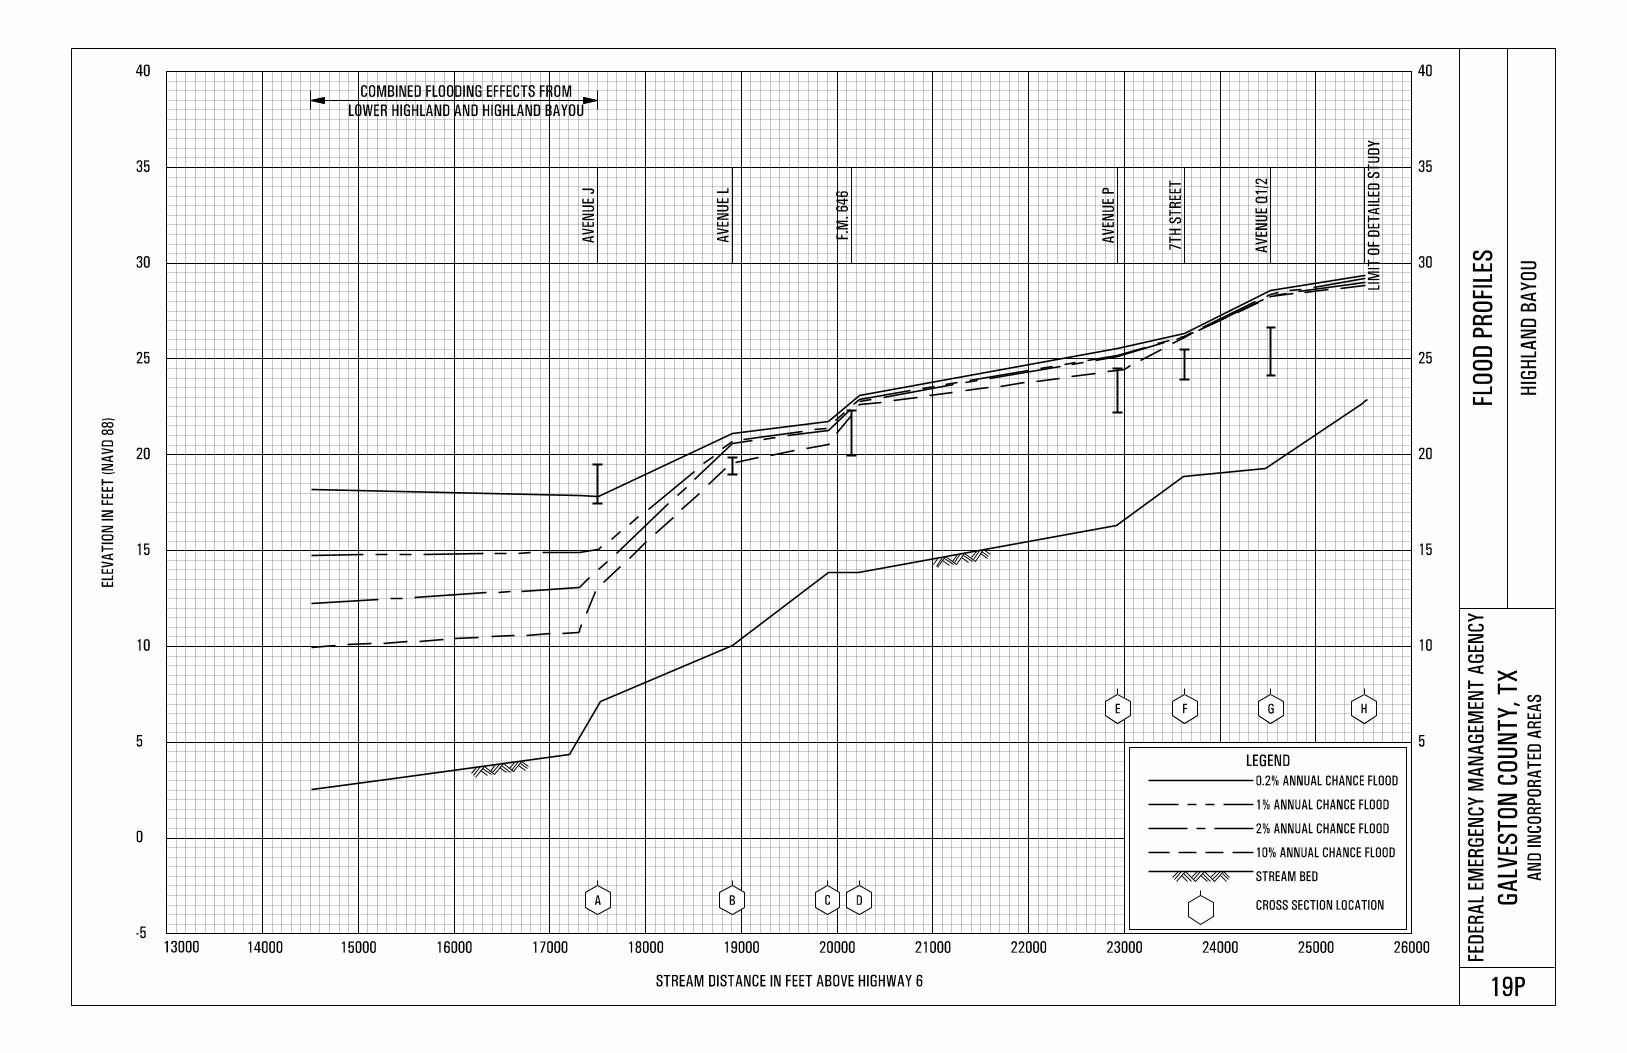
Highland Bayou Panel 19P
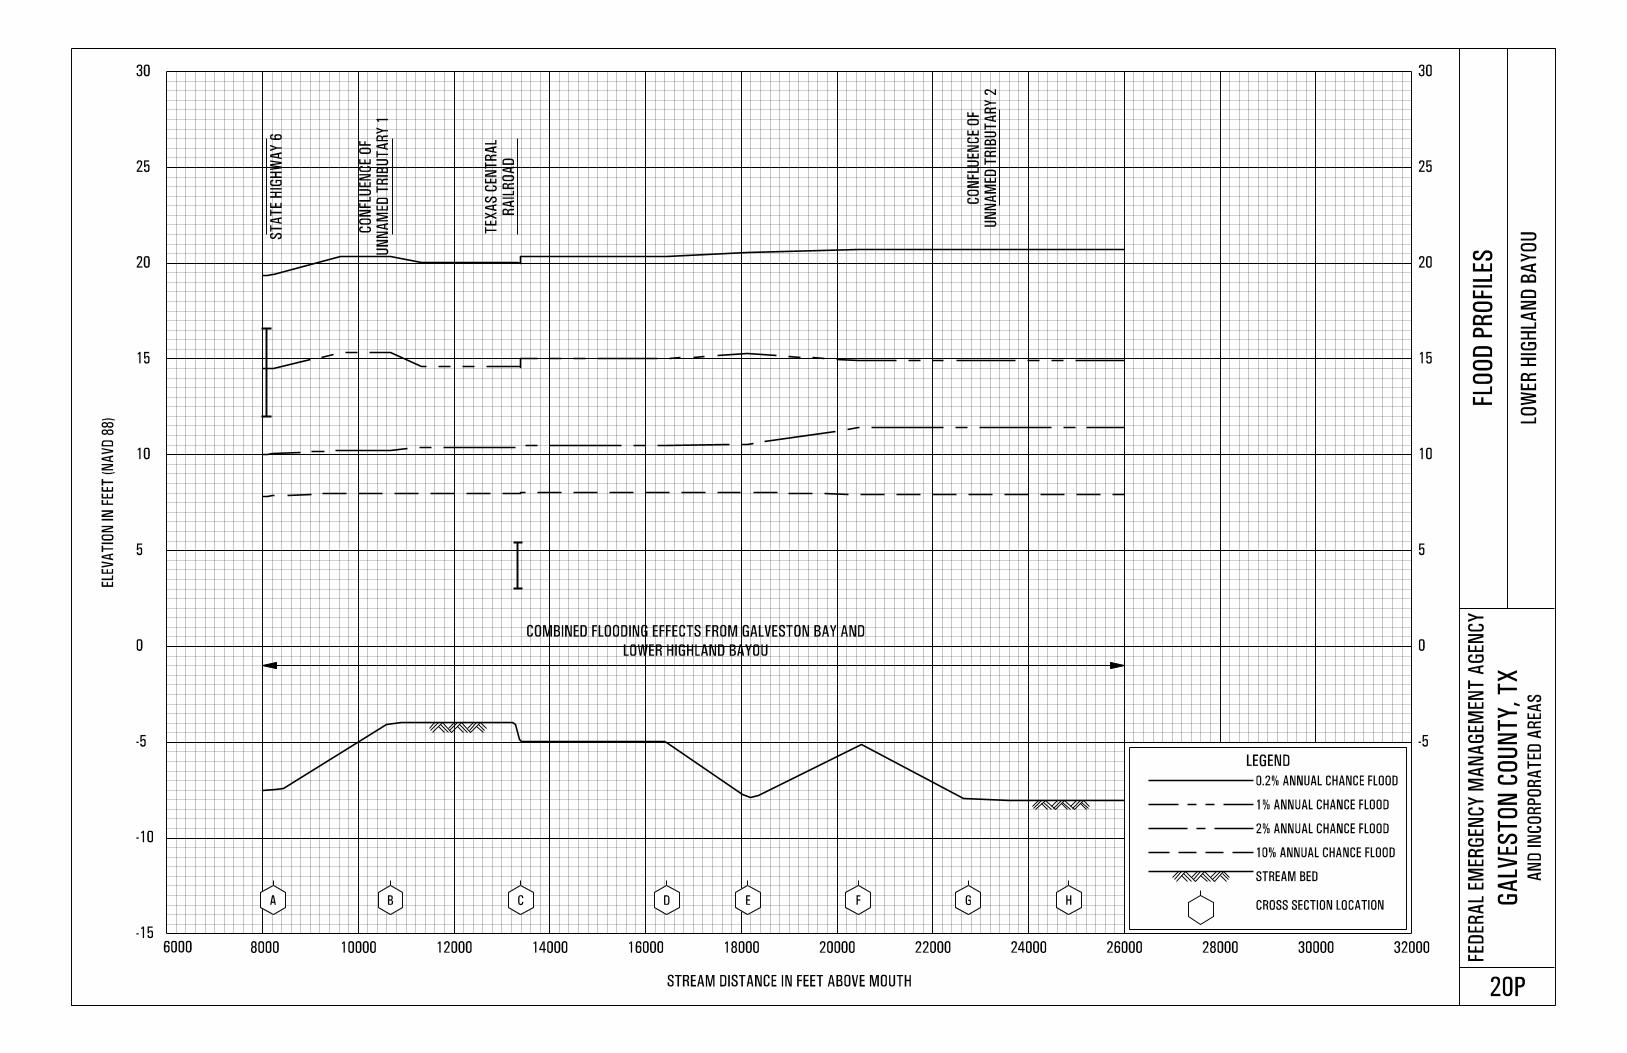
Lower Highland Bayou Panels 20P-21P
Magnolia Bayou Panels 22P-23P
iv
EXHIBITS Volume 2 of 4
Magnolia Creek Panel 24P
Marchand Bayou Panels 25P-26P
Marys Creek Panel 27P
Tributary to Gum Bayou Panel 28P
Unnamed Tributary 1 (to Lower Highland
Bayou)
Panel 29P
Unnamed Tributary 2 (to Lower Highland
Bayou)
Panel 30P
Unnamed Tributary 3 (to Lower Highland
Bayou)
Panel 31P
Unnamed Tributary 3 Diversion Channel
to Lower Highland Bayou
Panel 32P
Unnamed Tributary of Clear Creek Panel 33P
Unnamed Tributary to Dickinson Bayou
(East Branch)
Panel 34P
Unnamed Tributary to Dickinson Bayou
(West Branch)
Panel 35P
Upper Highland Bayou and Diversion
Channel
Panel 36P
Exhibit 2 – 0.2-Percent-Annual-Chance Wave Envelopes
Transect 1 Panel 01P
Transect 2 Panel 02P
Transect 3 Panel 03P
Transect 4 Panel 04P
Transect 5 Panel 05P
Transect 6 Panel 06P
Transect 7 Panels 07P-08P
Transect 8 Panels 9P-10P
Transect 9 Panels 11P-12P
Transect 10 Panels 13P-14P
Transect 11 Panels 15P-16P
Transect 12 Panels 17P-19P
Transect 13 Panels 20P-22P
Transect 14 Panels 23P-25P
Transect 15 Panels 26P-28P
Transect 16 Panels 29P-31P
Transect 17 Panels 32P-34P
Transect 18 Panels 35P-37P
Transect 19 Panels 38P-40P
Transect 20 Panels 41P-43P
Transect 21 Panels 44P-47P
Transect 22 Panels 48P-51P
Transect 23 Panels 52P-55P
v
EXHIBITS Volume 2 of 4 (Continued)
Transect 24 Panels 56P-59P
Transect 25 Panels 60P-63P
Transect 26 Panels 64P-67P
Transect 27 Panels 68P-70P
Transect 28 Panels 71P-73P
Transect 29 Panels 74P-76P
Transect 30 Panels 77P-79P
Transect 31 Panels 80P-83P
vi
EXHIBITS Volume 3 of 4
Transect 32 Panels 84P-87P
Transect 33 Panels 88P-91P
Transect 34 Panels 92P-94P
Transect 35 Panels 95P-98P
Transect 36 Panels 99P-102P
Transect 37 Panels 103P-104P
Transect 38 Panels 105P-108P
Transect 39 Panels 109P-112P
Transect 40 Panels 113P-116P
Transect 41 Panels 117P-120P
Transect 42 Panels 121P-124P
Transect 43 Panels 125P-127P
Transect 44 Panels 128P-132P
Transect 45 Panels 133P-136P
Transect 46 Panels 137P-139P
Transect 47 Panels 140P-142P
Transect 48 Panels 143P-145P
Transect 49 Panels 146P-148P
Transect 50 Panels 149P-150P
Transect 51 Panels 151P-152P
Transect 52 Panels 153P-154P
Transect 53 Panels 155P-157P
Transect 54 Panels 158P-160P
Transect 55 Panels 161P-163P
Transect 56 Panels 164P-166P
Transect 57 Panels 167P-169P
Transect 58 Panels 170P-172P
Transect 59 Panels 173P-175P
Transect 60 Panels 176P-178P
Transect 61 Panels 179P-180P
Transect 62 Panels 181P-182P
Transect 63 Panel 183P
vii
EXHIBITS Volume 4 of 4
Transect 64 Panels 184P-185P
Transect 65 Panels 186P-187P
Transect 66 Panel 188P
Transect 67 Panel 189P
Transect 68 Panel 190P
Transect 69 Panels 191P-192P
Transect 70 Panels 193P-194P
Transect 71 Panels 195P-196P
Transect 72 Panels 197P-198P
Transect 73 Panels 199P-201P
Transect 74 Panels 202P-204P
Transect 75 Panels 205P-207P
Transect 76 Panels 208P-210P
Transect 77 Panels 211P-213P
Transect 78 Panels 214P-215P
Transect 79 Panels 216P-217P
Transect 80 Panels 218P-219P
Transect 81 Panels 220P-221P
Transect 82 Panels 222P-223P
Transect 83 Panels 224P-225P
Transect 84 Panels 226P-227P
Transect 85 Panels 228P-229P
Transect 86 Panels 230P-232P
Transect 87 Panels 233P-234P
Transect 88 Panels 235P-236P
Transect 89 Panel 237P
Transect 90 Panels 238P-239P
Transect 91 Panels 240P-241P
Transect 92 Panels 242P-243P
Transect 93 Panels 244P-245P
Transect 94 Panels 246P-247P
Transect 95 Panels 248P-249P
Transect 96 Panels 250P-251P
Transect 97 Panels 252P-253P
Transect 98 Panels 254P-255P
Transect 99 Panels 256P-257P
Exhibit 3 – Flood Insurance Rate Map Index
Flood Insurance Rate Maps
1
FLOOD INSURANCE STUDY
GALVESTON COUNTY, TEXAS AND INCORPORATED AREAS
1.0 INTRODUCTION
1.1 Purpose of Study
This Flood Insurance Study (FIS) revises and updates information on the existence and
severity of flood hazards in the geographic area of Galveston County, including Cities of
Clear Lake Shores, Dickinson, Friendswood, Galveston, Hitchcock, Kemah, La Marque,
League City, Santa Fe, Seabrook, and Texas City; Villages of Bayou Vista, Jamaica
Beach, and Tiki Island, and the unincorporated areas of Galveston County (referred to
collectively herein as Galveston County) and aids in the administration of National Flood
Insurance Act of 1968 and the Flood Disaster Protection Act of 1973. This study has
developed flood risk data for various area of the community that will be used to establish
actuarial flood insurance rates and assist the community in their efforts to promote sound
floodplain management. Minimum floodplain management requirements for participation
in the National Flood Program are set forth in the Code of Federal Regulations at 44
CFR, 60.3.
The City of Seabrook is located in Harris, Chambers and Galveston Counties, and the
Cities of Friendswood and League City are located in Harris and Galveston Counties.
Only the portions that are within Galveston County are shown in this FIS report.
In some States or communities, floodplain management criteria or regulations may exist
that are more restrictive or comprehensive than the minimum Federal requirements. In
such cases, the more restrictive criteria take precedence and the State (or other
jurisdictional agency) will be able to explain them.
1.2 Authority and Acknowledgements
The sources of authority for this Flood Insurance Study are the National Flood Insurance
Act of 1968 and the Flood Disaster Protection Act of 1973.
This FIS was prepared to include the unincorporated areas of, and incorporated
communities within Galveston County into a countywide FIS. Information on the
authority and acknowledgments for all of the incorporated communities within, and the
unincorporated areas of, Galveston County, as compiled from their previously printed
FIS reports, is shown below.
Galveston County
(Unincorporated Areas): The hydrologic and hydraulic analyses for the FIS report
dated November 2, 1982, and the Flood Insurance Rate
Map dated May 2, 1983 were prepared by Tetra Tech,
Inc., for the Federal Emergency Management Agency
(FEMA) under Contract No. H-4788. The work for the
1983 revision was completed in December 1979. For the
November 16, 1990 revision, the hydrologic and
hydraulic analyses for Magnolia Bayou were prepared
by Van Sickle, Michelson & Klein, Inc. That work was
2
completed in June 1988. For the August 18, 1992
revision, Dewberry & Davis prepared revised and
hydraulic and erosion analyses for the Gulf of Mexico.
That work was prepared for FEMA under Contract No.
EMW-89-C-2906 and was completed in January 1991.
For the July 5, 1993 revision, Dewberry & Davis
prepared the revised hydraulic and erosion analyses for
the Gulf of Mexico based on improved topographic
information. That work was prepared for FEMA, under
Contract No. EMW-89-C-2906 and was completed
August 1992.
Clear Lake Shores, City of The hydrologic and hydraulic analyses for the FIS report
dated October 4, 1982 were performed by Tetra Tech,
Inc. for the FEMA, under Contract No. H-4788. This
study was completed in April 1981.
Dickinson, City of The hydrologic and hydraulic analyses for the FIS report
dated March 4, 1991 represented a revision of the
original analyses prepared by Tetra Tech Inc., for the
FEMA, under Contract No. H-4788. The work for the
original study was completed in December 1979. The
hydrologic and hydraulic analyses for Borden’s Gully
and Magnolia Bayou in the March 4, 1991 revision were
prepared by Van Sickle, Mickelson & Klein, Inc. This
work was completed in June 1988.
Friendswood, City of The hydrologic and hydraulic analyses for the FIS report
dated September 22, 1999 were based on work prepared
by Tetra Tech, Inc., for the FEMA, under Contract No.
H-4788. This work was completed in July 1981. This
work was updated by the Galveston District of the U.S.
Army Corps of Engineers (USACE) for FEMA, under
Inter-Agency Agreement No. H-10-77, Project No. 1 and
amendments thereto; the Harris County Flood Control
District (HCFCD); and Bernard Johnson, Inc. (BJI).
These revisions took into account rapid development and
improvements that were made to the watersheds since
the completion of the original study. The tidal flooding
analysis was prepared by Tetra Tech, Inc., under
Contract No. H-4788 and amendments thereto. The
USACE and Tetra Tech, Inc. completed their work in
June 1982; the HCFCD completed their work in
December 1984; and BJI completed their work in April
1986.
Galveston, City of The hydrology and hydraulic analyses for the FIS report
dated February 15, 1983, were performed by Tetra Tech,
Inc., for the FEMA under Contract No. H-4788. The
work for the 1983 revision was completed in December
1979. For the December 6, 2002 restudy, Taylor
3
Engineering, Inc. prepared revised coastal hydrologic
and hydraulic analyses for FEMA under Contract No.
EMT-1999-RP-0004. In support of the study
contractor’s technical analyses, Continental Aerial
Surveyors, Inc, was contracted to perform surveying of
coastal profiles. The work for this restudy was
completed in July 2001.
Hitchcock, City of The hydrologic and hydraulic analyses for the FIS report
dated October 4, 1982 were performed by Tetra Tech,
Inc., for the FEMA, under Contract No. H-4788. This
study was completed in December 1979.
Jamaica Beach, Village of The hydrology and hydraulic analyses for the FIS report
dated October 4, 1982, were performed by Tetra Tech,
Inc., for the FEMA under Contract No. H-4788. This
work was completed in December 1979. For the
December 6, 2002 revision, Taylor Engineering, Inc.
prepared revised coastal hydrologic and hydraulic
analyses for FEMA under Contract No. EMT-1999-RP-
0004. In support of the study contractor's technical
analyses, Continental Aerial Surveyors, Inc., was
contracted to perform surveying of coastal profiles. The
work for this restudy was completed in July 2001.
Kemah, City of The hydrologic and hydraulic analyses for the FIS report
dated October 4, 1982 were performed by Tetra Tech,
Inc. for the FEMA, under Contract No. H-4788. This
study was completed in December 1979.
La Marque, City of The hydrologic and hydraulic analyses for the FIS report
dated August 16, 1982 were performed by Tetra Tech,
Inc. for the FEMA, under Contract No. H-4788. This
study was completed in December 1979.
League City, City of The hydrologic and hydraulic analyses for the FIS report
dated September 22, 1999 represented a revision of the
original analyses prepared by Tetra Tech, Inc., for the
FEMA, under Contract Ne. 8-4788. The work for the
original study was completed in July 1981. The
hydrologic and hydraulic analyses for Borden’s Gully
and Magnolia Bayou in that revision were prepared by
Van Sickle, Michelson & Klein, Inc. The work for this
revision was completed in July 1988.
Santa Fe, City of The hydrologic and hydraulic analyses for the FIS study
dated April 18, 1983 were performed by Tetra Tech Inc.,
for the FEMA, under Contract No. H-4788. This study
was completed in December 1979.
4
Texas City, City of The hydrologic and hydraulic analyses for this study
were performed by Tetra Tech, Inc. for the FEMA,
under Contract No. H-4788. This study was completed
in December 1979.
Tiki Island, Village of The hydrologic and hydraulic analyses for the FIS study
dated November 1, 1985 were performed by Tetra Tech,
Inc., during the course of the FIS for Galveston County,
Texas. The Galveston County study was completed in
December 1979.
Taylor Engineering, as a part of FTN/Taylor Joint Venture, completed the work for this
countywide revision in April 2012 under contract EMT-2002-CO-0050 J021.
1.3 Coordination
An initial Consultation Coordination Officer’s (CCO) meeting is held typically with
representatives of the communities, FEMA, and the study contractors to explain the
nature and purpose of the FIS, and to identify the streams to be studied by detailed
methods.
The initial and final meeting dates for previous FIS reports for Galveston County and its
communities are listed in Table 1, “Initial and Final CCO Meetings”.
Table 1 – Initial and Final CCO Meetings
Community Initial Meeting Final Meeting
CLEAR LAKE SHORES, CITY OF * April 27, 1982
DICKINSON, CITY OF * March 18, 1982
FRIENDSWOOD, CITY OF May 1, 1978 April 16, 1982
GALVESTON, CITY OF July 28, 1999 December 6, 2001
HITCHCOCK, CITY OF * April 27, 1982
JAMAICA BEACH, VILLAGE OF July 28, 1999 December 6, 2001
KEMAH, CITY OF * April 27, 1982
LA MARQUE, CITY OF * March 17, 1982
LEAGUE CITY, CITY OF * June 3, 1982
SANTA FE, CITY OF * March 18, 1982
TEXAS CITY, CITY OF * June 3, 1982
TIKI ISLAND, VILLAGE OF * November 15, 1984
GALVESTON COUNTY
(UNINCORPORATED AREAS)
February 27, 1989 April 9, 1991
*Data not available
A final CCO meeting is held with representatives of the communities, FEMA, and the
study contractors to review the results of the study.
For this countywide study, an initial CCO meeting was held on April 13, 2005 and
attended by representatives of the community, the study contractor, and FEMA.

5
The results of the study were reviewed at the final CCO meeting held on XXXX XX,
XXXX and attended by representatives of the community, the study contractor, and
FEMA. All problems raised at that meeting have been addressed.
2.0 AREA STUDIED
2.1 Scope of Study
This FIS report covers the geographic area of Galveston County, Texas, including the
incorporated communities listed in Section 1.1. The areas studied by detailed methods
were selected with priority given to all known flood hazards and areas of projected
development or proposed construction through.
Limits of detailed study are indicated on the Flood Profiles (Exhibit 1) and/or on the
FIRM (Exhibit 3).
The flooding sources previously studied by detailed riverine methods are shown in Table
2.
Table 2 - Flooding Sources Studied by Detailed Methods
Benson Bayou Magnolia Bayou
Borden’s Gully Magnolia Creek
Cedar Gully Marchand Bayou
Chigger Creek Marys Creek
Clear Creek Unnamed Tributary 1 to Lower Highland Bayou
Cowart Creek Unnamed Tributary 2 to Lower Highland Bayou
Dickinson Bayou Unnamed Tributary 3 to Lower Highland Bayou
Gum Bayou Unnamed Tributary 3 Diversion Channel to LHB
Tributary to Gum Bayou Unnamed Tributary to Clear Creek
Highland Bayou Unnamed Tributary (East Branch)
Lower Highland Bayou Unnamed Tributary (West Branch)
Upper Highland Bayou & Diversion Channel
No new detailed riverine hydrologic or hydraulic modeling was performed or incorporated as
part of this study. LOMC (Letters of Map Change) were incorporated for Magnolia Creek,
Borden’s Gully, and Unnamed Tributary 3 to Lower Highland Bayou and Unnamed Tributary
3 Diversion Channel to LHB, LOMR (Letter of Map Revision) numbers 01-06-673P, 05-06-
1666P, and 06-06-BK83P, respectively. Tropical Storm Allison Recovery Project (TSARP)
completed the 2004 Harris County FIS, which included a detailed study of Clear Creek, which
was incorporated into this FIS.
The following flooding sources were mapped using digital conversion of the effective special
flood hazard areas: Magnolia Bayou, Unnamed Tributary to Dickinson Bayou (East Branch),
Unnamed Tributary to Dickinson Bayou (West Branch), and Upper Highland Bayou.
In all other cases, effective water surface elevations were redelineated on updated terrain. The
following flooding sources were studied by approximate methods: Chigger Creek Tributary 1,
Chigger Creek Tributary 2, Clear Creek Tributary 4, Clear Creek Tributary 5, Dickinson
Bayou, Dickinson Bayou Tributary 2, Magnolia Bayou, and Magnolia Bayou Tributary 1.
6
All coastal areas were studied by new detailed methods. Computations for flood levels along
the rivers resulting from either coastal surges or rainfall were independently performed.
Revised coastal surge elevations were combined statistically to obtain flood levels for each
return period.
2.2 Community Description
Galveston County occupies a land area of approximately 399 square miles in southeastern
Texas. It is bordered by the incorporated areas of Harris and the unincorporated areas of
Chambers Counties to the north, Galveston Bay to the east, the Gulf of Mexico to the
south, and the unincorporated areas of Brazoria County to the west. The City of
Galveston, the county seat, is located approximately 50 miles southeast of the City of
Houston.
The 2010 population of Galveston County was 291,309 (Reference 1). The population
has increased 16.5% since 2000. During the decade from 2000-2010, League City
surpassed the City of Galveston as the most populous municipality with 83,560 compared
to 47,743.
The economy of the county is based primarily on petrochemical manufacturing,
petroleum exploration and mining, shipbuilding, shipping, public administration,
agriculture, and tourism, with its attendant commercial and service-type employment.
The major streams within the county are Highland Bayou, Dickinson Bayou, and Clear
Creek. Highland Bayou flows generally towards the southeast through Galveston County
from the vicinity of Arcadia/Alts Loma into Jones Bay, an arm of West (Galveston) Bay.
It is approximately 14 miles long, has a watershed area of approximately 38 square miles,
and is tidal for approximately 8.5 miles in its lower reaches. Dickinson Bayou,
approximately 23 miles long, flows towards the east from the Galveston County
boundary and empties into Dickinson Bay on the west side of Galveston Bay. It drains
approximately 99 square miles of land in north-central Galveston County. Clear Creek,
45 miles long, flows through the northern portion of Galveston County eastward into
Clear Lake/Galveston Bay, and drains a total of approximately 250 square miles. Along
with their tributaries, these streams provide a fairly extensive drainage system.
Galveston County is located in the humid-subtropical climatic zone, which is
characterized by mild winters and warm summers. Rainfall is abundant and quite evenly
distributed throughout the year. The heaviest rains usually occur during the hurricane
season, which extends from approximately June through October. In the City of
Galveston, which is located in the southern portion of the county, the average annual
precipitation is approximately 43 inches, and the average annual temperature is
approximately 70 degrees Fahrenheit (Reference 2). Soils in Galveston County are clayey
and loamy, and are categorized in five soil associations that have similar characteristics:
low infiltration rates and high runoff potential. All the soils are classified in SCS Group
D for hydrologic purposes.
Coastal short grass prairie is the dominant vegetation in the county. Much of this prairie
grassland is cultivated and used for agriculture, and much of the higher coastal land in the
southern portion of the county is range-pasture land. Fluvial woodland is found along the
lower reaches of the major streams. There are extensive areas of tidal marsh along the
bays and bayous (Moses Lake, Dollar Bay, Swan Lake, Jones Bay, and West Bay).
7
Vegetated barrier flats on Galveston Island and Bolivar Peninsula support a growth of
salt-tolerant weeds and grasses.
Physiographically, Galveston County lies within the Gulf Coastal Plain and is
characterized by relatively flat terrain with level or nearly level areas in the northeastern
portions of the county. The elevation in the study area ranges from sea level along most
of the coast to approximately 50 feet. On the east, the coastal area of Galveston Bay near
Bacliff, extending north from Dickinson Bay to approximately Kemah, is characterized
by cliffed bay margins at an elevation of 10 feet or more. In the south, Galveston Island
and part of Bolivar Peninsula form a barrier to the mainland.
2.3 Principal Flood Problems
Flooding in Galveston County results primarily from overflow of the streams (caused by
rainfall runoff), ponding, and sheet flow, and from tidal surge and associated wave action
(caused by hurricanes and tropical storms). Wave action that accompanies wind-
generated tides can cause flood, erosion, and structural damage, particularly on the
offshore islands. Rainfall that usually accompanies hurricanes can aggravate the tidal
flood situation. Because of the flatness of the terrain, many inland areas experience
shallow flooding during heavy rainfalls. Additionally, land surface subsidence in
mainland Galveston County is causing many areas that were previously non-floodprone
to be subject to inundation by high tides, and further lowering land already in the
floodplain (Reference 3).
Not all storms that pass close to the county produce extremely high tides. Similarly,
storms that produce extreme conditions in one area may not necessarily produce critical
conditions in other portions of the county. Storms passing Texas in the vicinity of
Galveston County have produced severe floods as well as structural damage. Brief
descriptions of several significant tropical storms follow; these provide historical
information to which flood hazards and the projected flood depths can be compared
(References 4, 5, 6, 7, 8, 9, 10, and 11).
September 7-10, 1900
This severe hurricane, which had a radius of approximately 16 miles, crossed the Texas
coastline near San Luis Pass, approximately 20 miles south of the City of Galveston.
Storm surge generated by this hurricane was estimated to be between 14.2 feet and 14.5
feet mean sea level (msl). Maximum wind velocity was estimated to be between 110 and
120 miles per hour (mph). The beachfront at the City of Galveston was badly eroded to
300 feet inland, and the first two to five blocks of the eastern, southern, and western
sections of the city were swept by the storm surge and shorn of buildings. Water in the
Kinkhead addition just beyond the corporate limits was reported to be ten feet deep. At
Bolivar Point, wharves were gone and buildings were crushed. All of the Gulf, Colorado,
and Santa Fe Railway bridges across Galveston Bay were destroyed. On the mainland, all
houses at Virginia Point were reported washed and blown away; Dickinson was reported
to be almost completely demolished. This storm killed an estimated 6,000 of Galveston
Island's inhabitants, and destroyed 3,600 homes. Property damages were estimated to be
30 million dollars. In 1902, Galveston County began construction of a seawall to protect
the city against future tropical storms.
8
August 16-17, 1915
The hurricane, which had a radius of 32 miles, made landfall near Matagorda,
approximately 40 miles southwest of the City of Galveston. Tides at Galveston were
estimated to be 12.7 feet msl, with 16.1 feet at the causeway, and storm tides inundated
the area for more than 40 hours. It was estimated that crests of breaking waves reached
21 feet at the seawall, which protected the city. Great quantities of water were thrown
over the wall and scour of pavement and building foundations caused extensive damage.
In the area of the City of Texas City, many houses were swept away from their
foundations, docks were damaged, and brick structures caved in. The area from La
Marque to Galveston was flooded. Clear Creek was reported to be 1.5 miles wide, and the
Kemah area was seriously damaged. This storm caused 275 fatalities and a total of $56
million in damages.
September 14, 1919
This hurricane, which practically paralleled the coast, passed approximately 140 miles
south of the City of Galveston. Maximum winds of 53 mph and tides of 8.8 feet above
normal were recorded in Galveston, whose downtown area was flooded by three feet of
water. In the northern portion of Galveston Bay, water was reported to be five feet deep
in the area between Clear Lake and Seabrook.
August 30-31, 1942
Although this hurricane passed 120 miles west of Galveston, it caused wind speeds of 50
mph and tides of 5.3 feet at Galveston. The southwestern portion of Galveston Island was
inundated, and some residential and business sections of the City of Galveston were
flooded.
October 2-3, 1949
This storm originated in the Pacific Ocean near El Salvador, crossed Guatemala, moved
northward across the Gulf of Mexico, and made landfall near Freeport. Storm surge
reached 11.5 feet at Freeport and Velasco, 9 feet at Anahuac, 7 feet at Galveston, and 8.5
feet at Kemah. The Weather Bureau reported highest sustained wind at 67 mph with gusts
between 80 and 90 mph at Galveston. State Route 75 at Wye was reported to be under
four feet of water. In the area of the City of Texas City, the golf course area between the
bay and the seawall was covered with water. Total property damage in Texas was $1
million, of which $800,000 was in damage to oil rigs off the Texas coast.
June 27, 1957 (Hurricane Audrey)
This first hurricane of the season crossed the coast near the Texas Louisiana border,
approximately 60 miles east of Galveston. Tides of 6.0 feet were reported at Galveston
Island two to three hours before the center of the hurricane passed inland and almost all
downtown streets were flooded. In the Offatt's Bayou area, winds of 70 mph and tides of
8 feet were reported. Tides of 6.6 feet were observed at Texas City and did considerable
damage. The San Leon area reported winds of 45 to 50 mph and tides of 4 feet above
normal. State Route 146 along Galveston Bay between Texas City and Seabrook was
flooded, and a 54-foot tug sank in Galveston Bay near Dickinson Bayou.
9
September 11, 1961 (Hurricane Carla)
The 30- to 40-mile-diameter eye of this large, slow-moving hurricane crossed the Texas
shoreline more than 100 miles below Galveston, near Port O’Connor. Minimum
barometric pressure in Galveston was recorded at 29.24 inches and at Texas City was
recorded at 29.26 inches. Maximum winds were an estimated 80 mph at Galveston,
where the four-day rainfall was 15.32 inches and maximum tide recorded in the Gulf at
Galveston was 9.3 feet msl. The entire western two thirds of Galveston Island was
inundated with still high water elevations ranging from 10.5 to 12.1 feet msl. This
hurricane also spawned a rash of 26 tornadoes that caused several fatalities in Texas and
caused dramatic damage. At least three of these tornadoes crossed the City of Galveston.
Water surface elevations along the western shore of Galveston Bay reached
approximately 14 feet msl. Areas around Kemah, La Marque, Hitchcock, and Texas City
were hard-hit and heavily damaged. This hurricane flooded approximately 2 16 square
miles of Galveston County (approximately 50 percent of the county's total land area). The
total damages to the county were estimated to be $84,499,000, of which $61,860,000
were due to tidal overflow.
September 5-22, 1967 (Hurricane Beulah)
This hurricane flooded the bay side of Galveston Island and Bolivar Peninsula, the
mainland side of West Bay, and areas along Highland Bayou to approximately the Texas
City Terminal Railroad. High-water marks recorded were 4.4 feet at Seabrook, 3.2 feet at
the Texas City dike, 3.7 feet gulfside at Galveston, and 3.8 feet in West Bay, 3.3 feet
bayside off Bolivar Peninsula, and 3.0 feet at Marsh Point.
August 2-5, 1970 (Hurricane Celia)
Hurricane Celia originated in the Caribbean Sea near Cuba struck the Texas coast and
moved inland at Corpus Christi. Highest tide at Galveston was recorded at 3.0 feet msl.
There was minor damage to piers and small boats, and Stewart Road was closed from the
corporate limits to San Luis Pass. In the northern portion of the county, residents left the
low-lying areas. This storm destroyed an estimated $500 million worth of property in
Texas. However, nearly all of the damage was from wind, not flooding or storm surge.
July 25, 1979 (Tropical Storm Claudette)
Tropical Storm Claudette, an upper air low pressure cell, originated in the Atlantic Ocean
near Puerto Rico and moved towards the west, into the Gulf of Mexico. It brought gale-
force winds and heavy rainfall to many parts of southeastern Texas, causing severe
flooding along streams and coastal areas. Estimated tides were between four and five feet
in Galveston Bay and its upper reaches, and approximately three feet along Galveston
Island and Bolivar Peninsula. Rainfall ranged from 14 to 24 inches in some areas of
Galveston County. Winds of 25 to 30 mph were reported, with gusts clocked as high as
55 mph. Low-lying areas between the Gulf Freeway and Galveston Bay were evacuated.
Flooding was reported also in the southwestern portion of the county along State Route 6
just north of West Bay in Hitchcock, Algoa, Arcadia, and Alta Loma. The Gulf Freeway
at Clear Creek was flooded, as were State Routes 6 and 146 along Upper Galveston Bay.
Dickinson Bayou and Clear Creek, as well as the smaller creeks, were out of their banks
and flooded large portions of nearby communities. On Galveston Island, many streets
10
were closed because of high water, and the highway to West Galveston Island was
closed. Bolivar Peninsula was evacuated. In Galveston County, an estimated 2,500 homes
suffered major damage, and 500 homes suffered minor damage from this storm. An
estimated 85-percent of northern Galveston County was affected by flooding.
September 19, 1979
This storm brought torrential rainfall to the Galveston County area. Officials at Texas
City reported 19 inches of rain in 72 hours. The areas around Dickinson Bayou, Clear
Creek, and Highland Bayou were inundated, and streets and homes were flooded.
October 15, 1989 (Hurricane Jerry)
Hurricane Jerry hit the Texas coast at Jamaica Beach. The flood elevations experienced
along the Gulf Coast at the Galveston Point Pleasant gage (No. 877 15 10) were
comparable to a 10-year flood. The elevations observed on the bayside of the barrier
island at the Galveston gage (No. 8771450) and Sabine Pass, North gage (No. 8770570)
were comparable with 5-year and 2-year flood elevations, respectively.
July 30-31, 1995 (Tropical Storm Dean)
This storm formed in the north-central Gulf of Mexico, made landfall near San Luis Pass
around 8:30 pm Central Daylight Time on July 30, and moved inland. Peak winds
recorded on Galveston Island were 51 mph, and the lowest barometric pressure recorded
was 1003.4 mb. Tides were 3 to 3.5 feet (NAVD88) above normal, and ranged from 3.3
feet above mean lower low water (MLLW) at Morgans Point to 4.8 feet at Pleasure Pier.
Minor storm-surge flooding of Highway 87 occurred. Tropical Storm Dean caused about
$450,000 in damage, mainly due to rainfall-related flooding in inland counties (Reference
12).
August 21-22, 1998 (Tropical Storm Charley)
Tropical Storm Charley made landfall on the middle Texas coast with peak recorded
gusts of 69 mph in Matagorda County. Most locations along the coast experienced winds
of less than 46 mph. Tidal surge was between 2 and 3 feet (NAVD88) and caused
significant beach erosion (Reference 12).
September 7-12, 1998 (Tropical Storm Frances)
This tropical storm formed slowly about 250 miles south of Galveston Island and moved
inland over a period of 5 days. As the storm made landfall near Port O’Connor,
approximately 120 miles southwest of Galveston, it stalled and remained on the coast for
most of a day. Peak wind gusts of 54 mph, with sustained winds of 30 to 40 mph, were
recorded in Galveston. Storm surge and high tides persisted for 2 days and caused major
damage in the Galveston area. More than 10 inches of rainfall was measured in most
coastal counties, exacerbating surge-related coastal flooding. The water level gage at the
Galveston Pleasure Pier measured tides of more than 4 feet above MLLW for 36 to 48
hours, and a peak of 7 feet above MLLW, equivalent to a storm surge of about 4.5 feet
(NAVD88) above predicted tides. Storm surge combined with sustained winds to create
significant wave action and cause extensive property damage. More than 100 single-
11
family homes were completely destroyed, and estimated property damage in Galveston
and surrounding counties totaled $286 million. Three deaths were attributed to the storm,
with all three people drowning while swimming or surfing off of Galveston Island
(Reference 12).
September 13-14, 2008 (Hurricane Ike)
Hurricane Ike was the ninth named storm, fifth hurricane, and third major hurricane of
the 2008 Atlantic hurricane season. Ike made its final landfall near Galveston, Texas as a
strong Category 2 hurricane, on September 13, 2008. Hurricane-force winds extended
120 miles (195 km) from the center and tropical storm-force winds extended far beyond
that. Ike was blamed for 112 people deaths in the United. Damages from Ike in U.S.
coastal and inland areas are estimated at $29.6 billion (2008 USD). Ike was the second
costliest Atlantic hurricane of all time, only surpassed by Hurricane Katrina of 2005. The
hurricane also resulted in the largest evacuation of Texans in that state's history.
2.4 Flood Protection Measures
There are many existing and planned structural flood protection measures in the county.
In the vicinity of the City of Texas City on Galveston Bay, there is an elaborate flood
protection system that consists of earthen levees, concrete floodwalls, drainage and
closure structures, tidal control and navigation structures, and pump stations. In the
Hitchcock-La Marque area, a diversion dam has been placed in Highland Bayou to divert
flood flows through the Basford Bayou watershed (a poorly defined drainage course
south of Highland Bayou) to Jones Bay via a diversion channel. Also, Highland Bayou
will be enlarged and rectified from the diversion dam upstream of Avenue J. Throughout
the county, local and private interests have constructed levees and other structures to
protect limited areas. Nonstructural flood protection measures in the unincorporated areas
of Galveston County consist of building regulations.
Following the massive devastation of the September 1900 hurricane, the City of
Galveston constructed a 17-foot high, 10-mile long seawall that protects over one-third of
the island’s area, principally the highly developed central business district. It is a gravity-
type, pile-supported concrete wall, extending westward from the foot of the South Jetty
on the east end of the island to approximately 3 miles west of 61st Street.
The seawall has been extended and redesigned numerous times, but the western two-
thirds of the island remains unprotected from storm surges and waves from the Gulf of
Mexico. The city and county have enforced flood damage prevention by requiring
buildings to be elevated to or above an elevation of 13 feet (NAVD88). The county has
followed building regulations required by the National Flood Insurance Act, Title 42,
since December 31, 1971.
The City of Kemah has built a tide barrier with a barrier crest about 7 feet MSL in the
Highway 146 drainage ditch west of 2nd Street, and installed pumps to pump out rainfall
runoff which backs up behind the barrier. This measure is effective for protecting the
low-lying downtown area against the more frequent tidal floods, such as the 100-year
event, but would be inconsequential for the 100-year event.
12
The City of La Marque has a diversion channel along Highland and Basford Bayous,
through the Basford Bayou watershed to Jones Bay, and a diversion dam across Highland
Bayou at mile 8.56. A 255,000 gallons per minute (gpm) pumping station at La Marque
(Palm Street outfall) and 2.6 miles of earthen levee extending up to 15- 19 feet
(NAVD88) provide protection from hurricane surges up to the 500-year return interval.
The City of Texas City includes an elaborate system of flood measures. On Galveston
Bay there are 13.6 miles of earthen levees varying in elevation from 15 to 23 feet, 1.3
miles of concrete floodways with elevations from 2 1 to 23 feet; drainage and closure
structures to direct drainage into ponding areas, tide control and navigation structures
across the entrance to Moses Lake and Dollar Point, interior drainage pumping stations
with a combined capacity of 1,000,000 gallons per minute. These systems protect the
eastern and southwestern portions of Texas City from interior drainage problems and
hurricane surge up to the 500-year recurrence interval.
3.0 ENGINEERING METHODS
For the flooding sources studied in detail in the county, standard hydrologic and hydraulic study
methods were used to determine the flood hazard data required for this study. Flood events of a
magnitude that are expected to be equaled or exceeded once on the average during any 10-, 50-,
100-, or 500-year period (recurrence interval) have been selected as having special significance
for floodplain management and for flood insurance rates. These events, commonly termed the
10-, 50-, 100-, and 500-year floods, have a 10-, 2-, 1-, and 0.2-percent-annual-chance flood,
respectively, of being equaled or exceeded during any year. Although the recurrence interval
represents the long-term, average period between floods of a specific magnitude, rare floods
could occur at short intervals or even within the same year. The risk of experiencing a rare flood
increases when periods greater than 1 year are considered. For example, the risk of having a
flood that equals or exceeds the 1-percent-annual-chance flood in any 50-year period is
approximately 40 percent (4 in 10); for any 90-year period, the risk increases to approximately 60
percent (6 in 10). The analyses reported herein reflect flooding potentials based on conditions
existing in the community at the time of completion of this study. Maps and flood elevations will
be amended periodically to reflect future changes.
3.1 Hydrologic Analyses
Hydrologic analyses were carried out to establish peak discharge-frequency relationship
for each flooding source studied by detailed methods affecting the community.
The following descriptions of riverine hydrology analysis have been sourced from each
community’s effective FIS report when applicable. These analyses have been carried
forth and applied to this countywide study. While no new study was completed for this
countywide FIS, the new detailed study on Clear Creek (The Harris County TSARP
developed data) was incorporated. Also, updated USACE Hydrologic Engineering Center
Flood Hydrograph Package HEC-1 models for Borden’s Gully, Magnolia Creek,
Unnamed Tributary 3 to Lower Highland Bayou and Unnamed Tributary 3 Diversion
Channel to Lower Highland Bayou from 2006, 2001, and 2007 LOMR’s, respectively,
were incorporated (Reference 13).
13
City of Dickinson
Flood magnitude and frequency values for Benson Bayou, Dickinson Bayou, Gum
Bayou, Magnolia Bayou, Tributary to Gum Bayou, Unnamed Tributary to Dickinson
Bayou (East Branch), and Unnamed Tributary to Dickinson Bayou (West Branch), were
estimated using HEC-1 (Reference 13). Regionalized unit hydrograph and rainfall loss
rate parameters were developed by hydrograph reconstitution studies using 30 storms in
six gaged basins. The transposition of the HEC-1 model parameter from gaged to
ungaged basins was based on hydrologic similarity as assessed from soil maps, US
Geological Survey (USGS) topographic maps, recent aerial photographs, and field
reconnaissance (References 14, 15, 16, and 17). Urbanized watersheds were studied using
methodology developed by Beard (References 18 and 19). Rainfall data were developed
from hourly rainfall records from the National Climatic Center and from Technical Paper
40 (References 20 and 21). The storms used to generate peak discharges of selected
frequency have depth-area- duration characteristics consistent with the Texas Gulf Coast
area.
City of Friendswood
Flood magnitude and frequency values for Chigger Creek, Cowart Creek, and Marys
Creek were obtained from the USACE publication, Clear Creek Flood Control Study,
Development of Existing Watershed Conditions, Hydrology, and Hydraulics (Reference
22). Peak discharges for Marys Creek at the corporate limits were obtained from
Woodward-Clyde Consultants in conjunction with the Flood Insurance Study for the
unincorporated areas of Brazoria County (Reference 23). Flood magnitude and frequency
values for Chigger Creek, Cowart Creek, and Marys Creek were updated by BJI in 1986
using a revised hydrologic analysis for Clear Creek developed by the HCFCD in 1984.
The 0.2-percent-annual-chance discharge values were determined by extrapolation of the
discharge-frequency curves as described in the HCFCD analysis.
HCFCD developed revised methodologies for Cedar Gully to reflect rapid development
that has occurred in the area since 1979 (Reference 13). The Clark's unit hydrograph
parameters of time of concentration (Tc) and attenuation constant (R) were optimized
from a regression analysis evaluating the storm events obtained at various gages. Percent
of urbanization was taken into account by separating the above data into three categories:
(1) undeveloped, (2) partially developed, and (3) developed conditions.
The above regression analysis showed the equation for Tc to be a function of overbank
slope, length to centroid of area, urbanization, and weighted channel slope; while, the
equation for T+R was found to be a function of the length of the watershed to the divide,
the weighted channel slope, urbanization, and channel conveyance. Ponding, caused by
extensive rice farming in the southern and western portions of the county, was taken into
account by developing a relationship between percent ponding and R. This relationship
was obtained from the SCS publication Technical Release 55, Urban Hydrology for
Small Watersheds (Reference 24). The SCS methodology that incorporates the use of
runoff curve numbers and soil type was used to estimate loss rates (Reference 25).
14
City of Hitchcock
HEC-1 was used to estimate the flood magnitude and frequency for areas subject to
flooding from Highland Bayou (Reference 13). Regionalized unit hydrograph and rainfall
loss rate parameters were developed by hydrograph reconstitution studies using 30 storms
in six gaged basins. The transposition of the HEC- 1 model parameter from gaged to
ungaged basins is based on hydrologic similarity as assessed from soil maps (References
21 and 22), USGS topographic maps (Reference 16), recent air photos (Reference 26)
and field reconnaissance. Urbanized watersheds were studied using methodology
developed by Beard (References 27 and 19). Rainfall data were developed from hourly
rainfall records from the National Climatic Center (Reference 16) and from TP-40
(Reference 21). The storms used to generate peak discharges of selected frequency have
depth area duration characteristics consistent with the Texas Gulf Coast area.
City of La Marque
HEC-1 was used to estimate the flood magnitude and frequency for areas subject to
freshwater flooding from Highland Bayou and its tributaries (Reference 13).
Regionalized unit hydrograph and rainfall loss rate parameters were developed by
hydrograph reconstitution studies using 30 storms in six gaged basins. The transposition
of the HEC-1 model parameter from gaged to ungaged basins is based on hydrologic
similarity as assessed from soil maps (Reference 14 and 15), U. S. Geological Survey
topographic maps (Reference 16), recent air photos (Reference 22) and field
reconnaissance. Urbanized watersheds were studied using methodology developed by
Beard (Reference 27 and 19). Rainfall data was developed from hourly rainfall records
from the National Climatic Center (Reference 28) and from TP-40 (Reference 21). The
storms used to generate peak discharges of selected frequency have depth area duration
characteristics consistent with the Texas Gulf Coast area.
City of League City
For Magnolia Bayou in the September 22, 1999 revision, flood-frequency discharge
values were determined using the USACE HEC-1 computer program (Reference 13).
City of Texas City
Flood magnitude and frequency for areas subject to flooding from Dickinson Bayou,
Gum Bayou, and Moses Lake were estimated using the HEC-1 Flood Hydrograph
Package (Reference 13). Regionalized unit hydrograph and rainfall loss rate parameters
were developed by hydrograph reconstitution studies using 30 storms in six gaged basins.
The transposition of the HEC-1 model parameters from gaged to ungaged basins is based
on hydrologic similarity as assessed from soil maps (Reference 14), USGS topographic
maps (Reference 16), air photos (Reference 17) and field reconnaissance. Urbanized
watersheds were studied using methodology developed by Beard (References 27 and 19).
Rainfall data were developed from hourly rainfall records from the National Climatic
Center (Reference 20) and from TP- 40 (Reference 21). Ponding elevations in Moses
Lake were estimated using the modified Puls reservoir routing capability of the HEC-I
computer program. The storms used to generate peak discharges of selected frequency
have depth area duration characteristics consistent with the Texas Gulf Coast area.
15
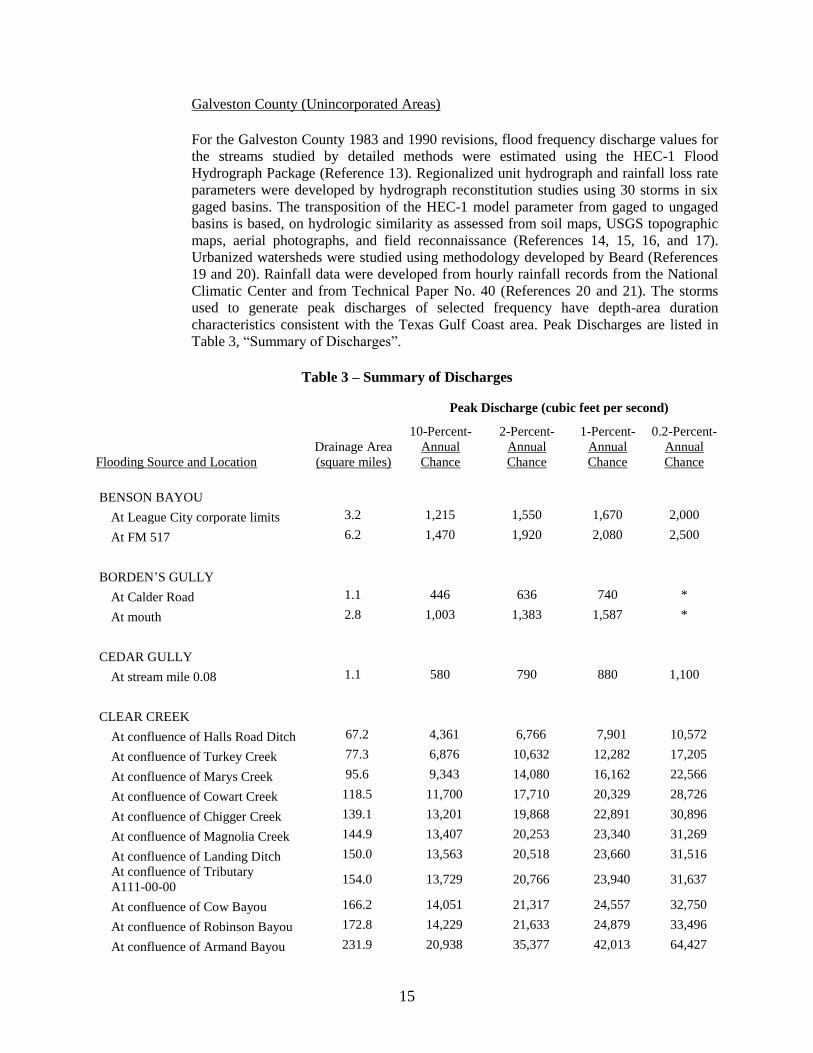
Galveston County (Unincorporated Areas)
For the Galveston County 1983 and 1990 revisions, flood frequency discharge values for
the streams studied by detailed methods were estimated using the HEC-1 Flood
Hydrograph Package (Reference 13). Regionalized unit hydrograph and rainfall loss rate
parameters were developed by hydrograph reconstitution studies using 30 storms in six
gaged basins. The transposition of the HEC-1 model parameter from gaged to ungaged
basins is based, on hydrologic similarity as assessed from soil maps, USGS topographic
maps, aerial photographs, and field reconnaissance (References 14, 15, 16, and 17).
Urbanized watersheds were studied using methodology developed by Beard (References
19 and 20). Rainfall data were developed from hourly rainfall records from the National
Climatic Center and from Technical Paper No. 40 (References 20 and 21). The storms
used to generate peak discharges of selected frequency have depth-area duration
characteristics consistent with the Texas Gulf Coast area. Peak Discharges are listed in
Table 3, “Summary of Discharges”.
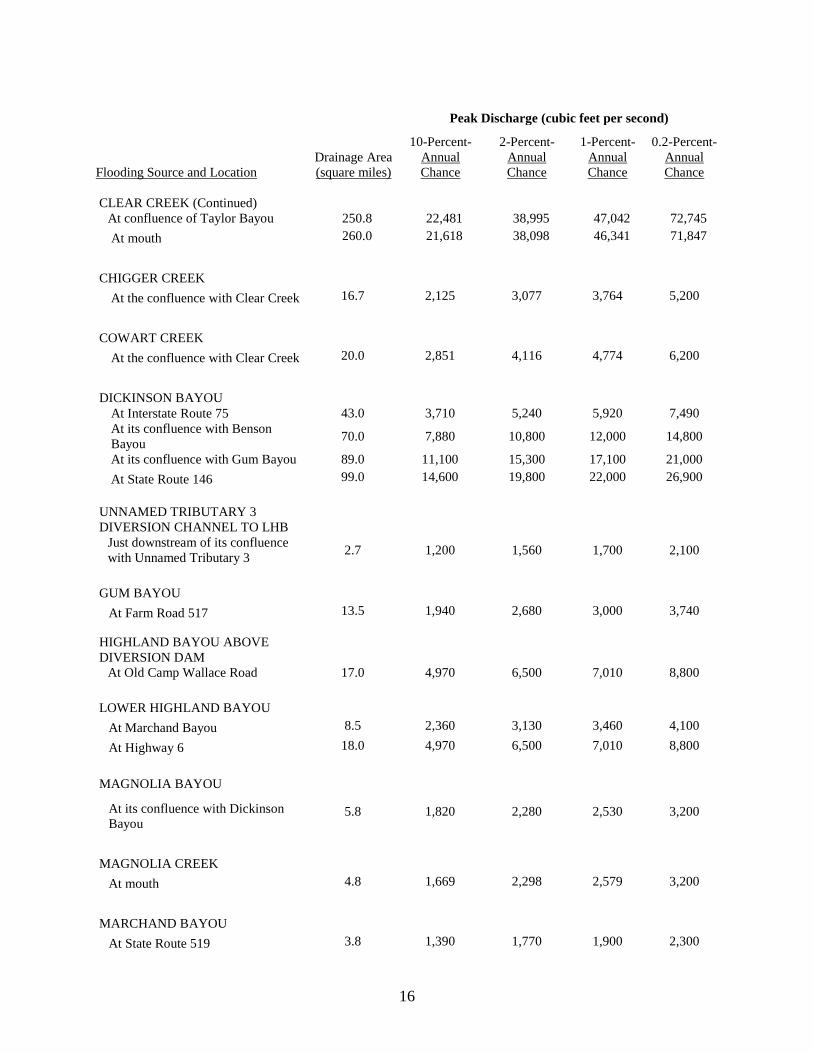
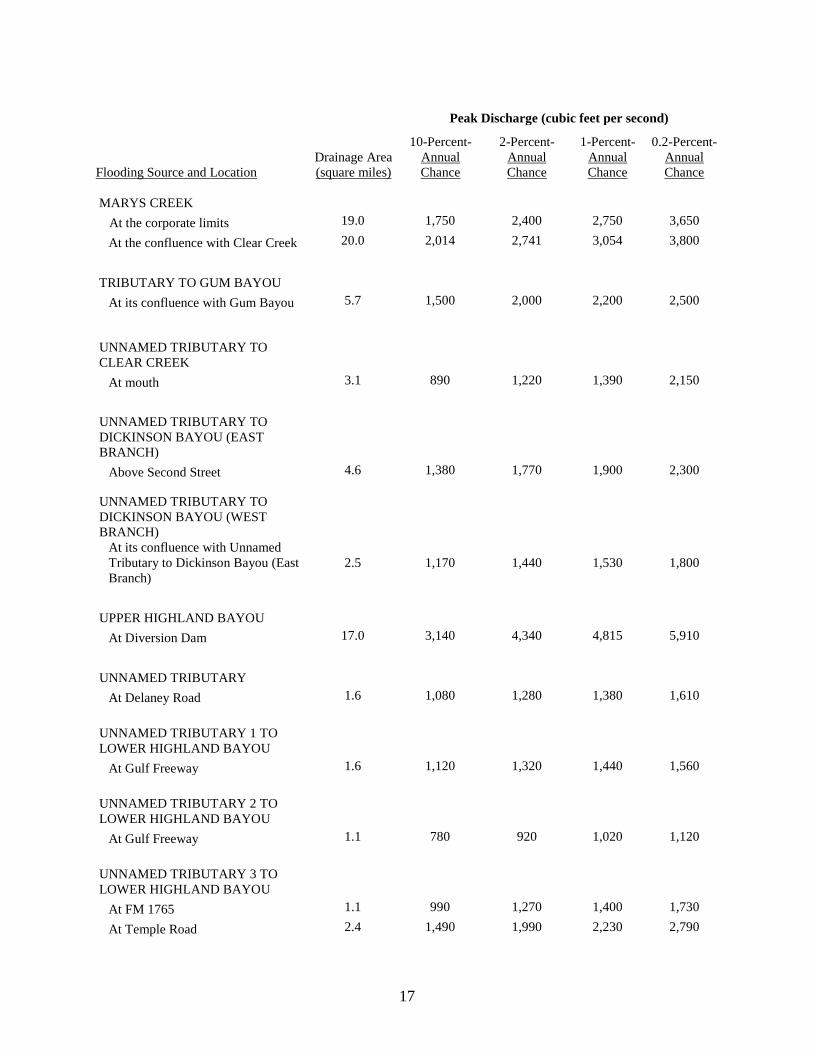
Table 3 – Summary of Discharges
Peak Discharge (cubic feet per second)
Flooding Source and Location
Drainage Area
(square miles)
10-Percent- 2-Percent- 1-Percent- 0.2-Percent-
Annual
Chance
Annual
Chance
Annual
Chance
Annual
Chance
BENSON BAYOU
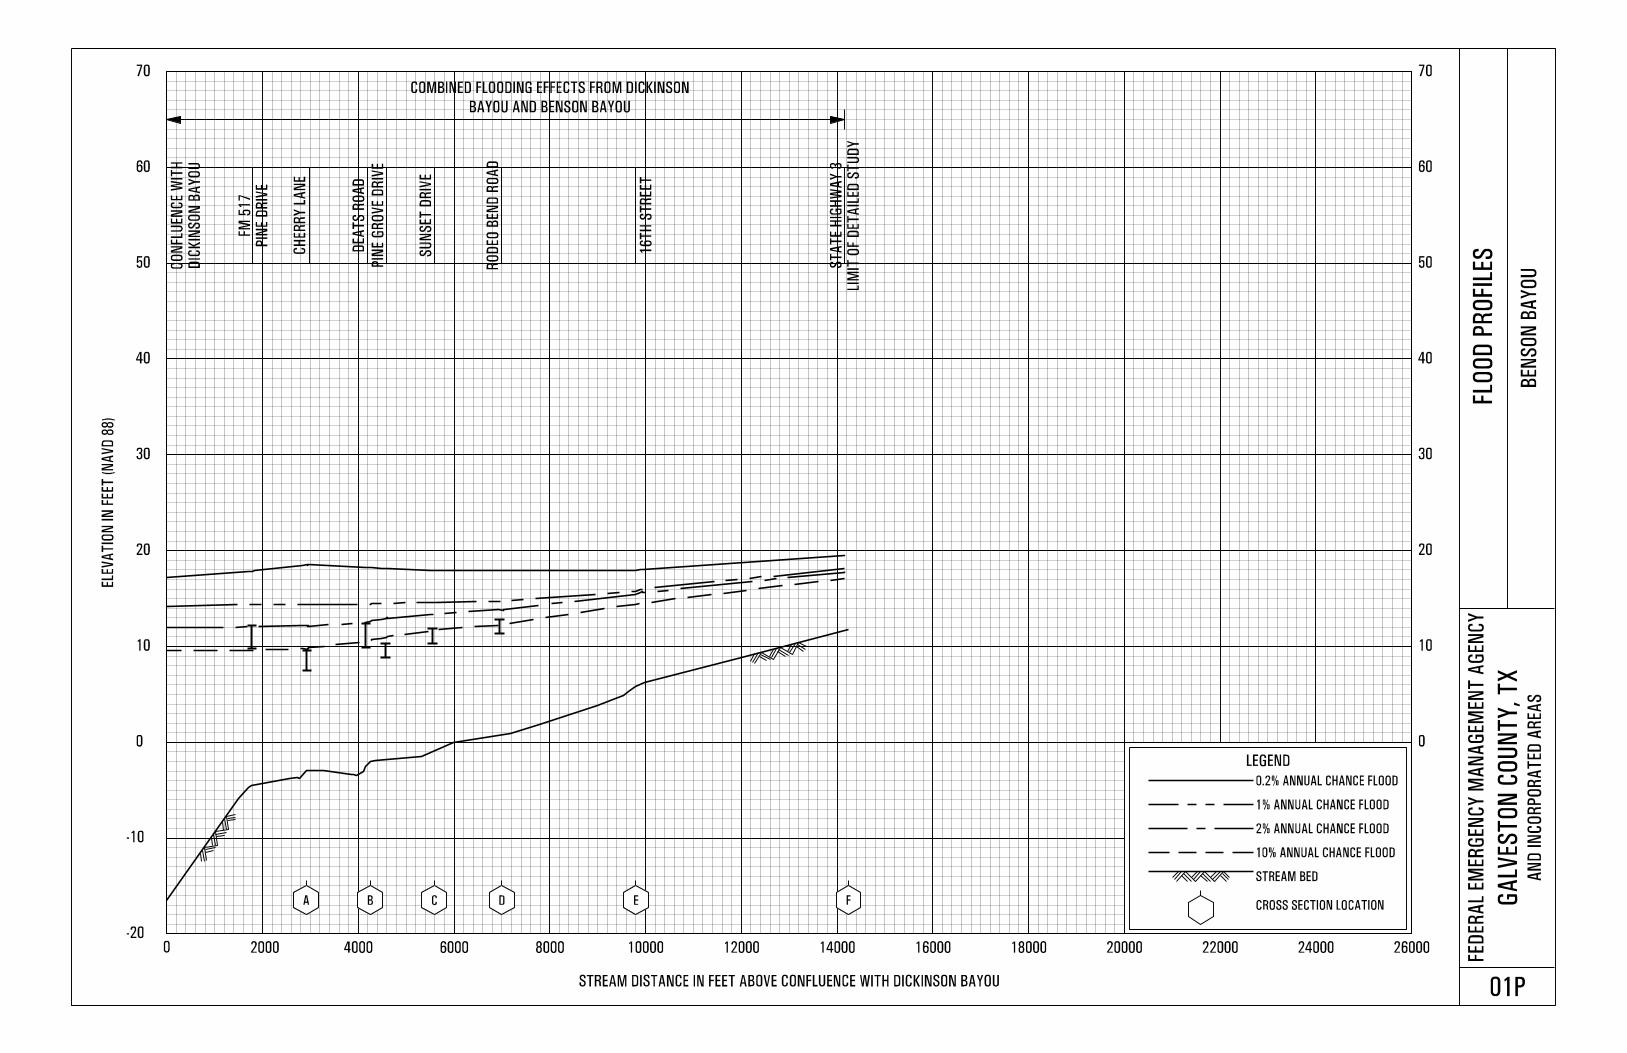
At League City corporate limits 3.2 1,215 1,550 1,670 2,000
At FM 517 6.2 1,470 1,920 2,080 2,500
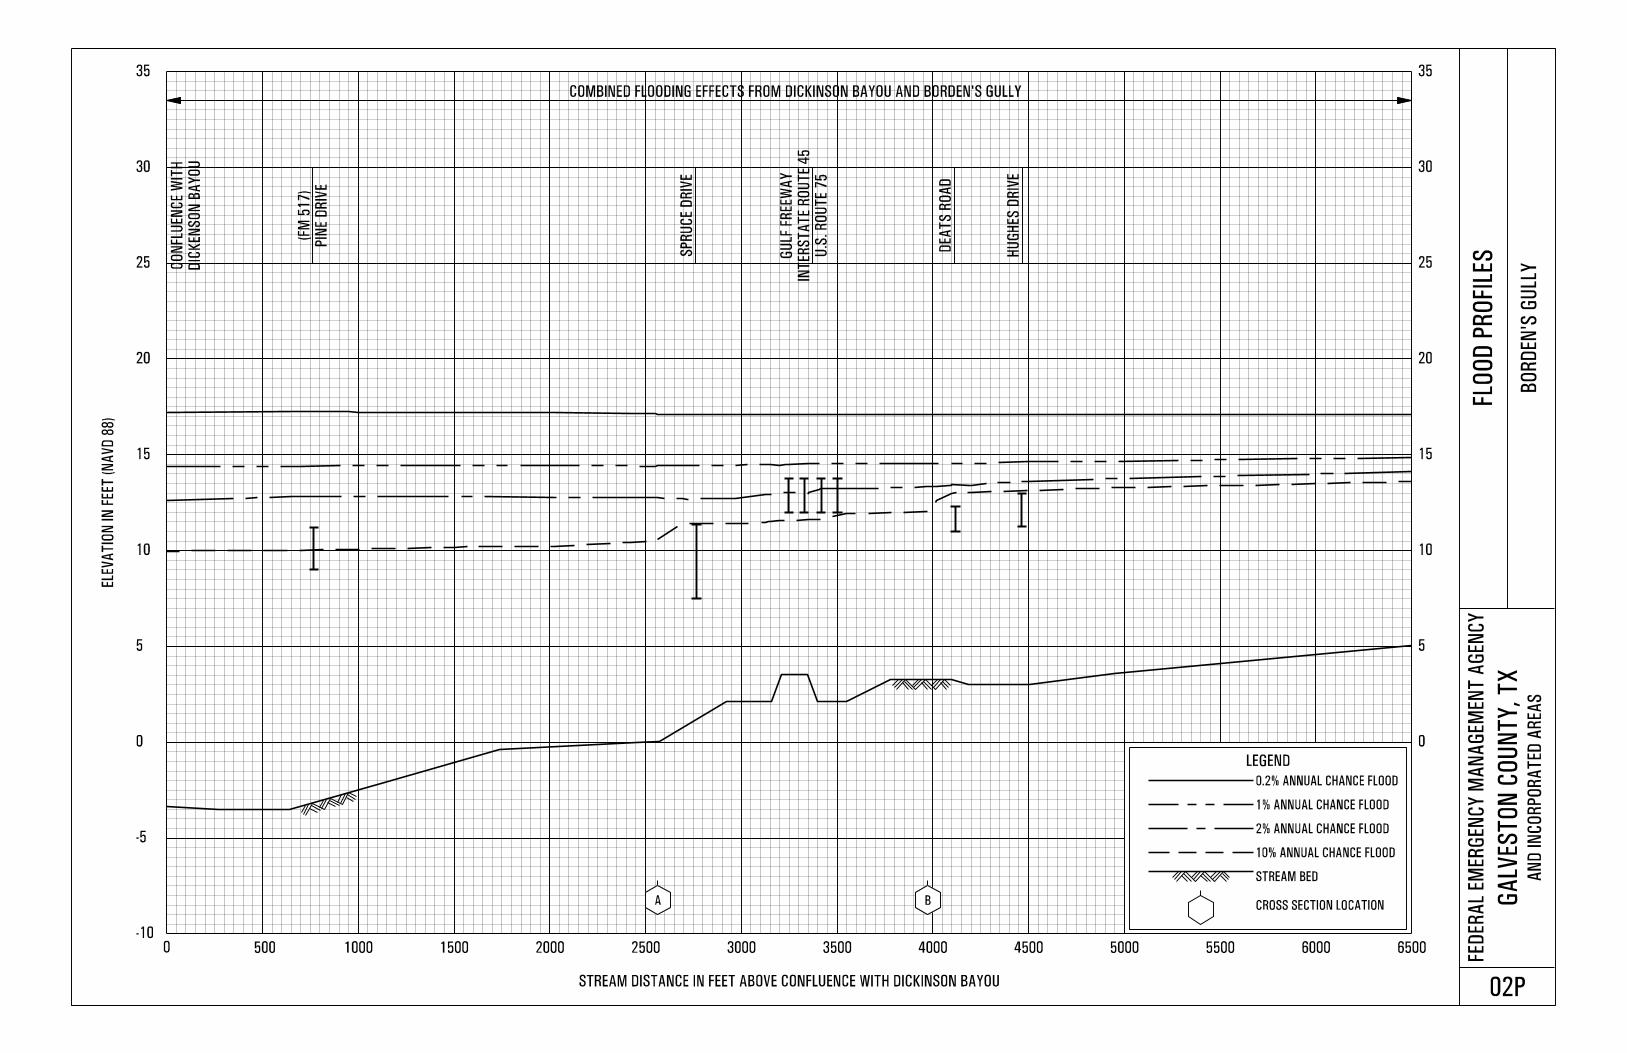
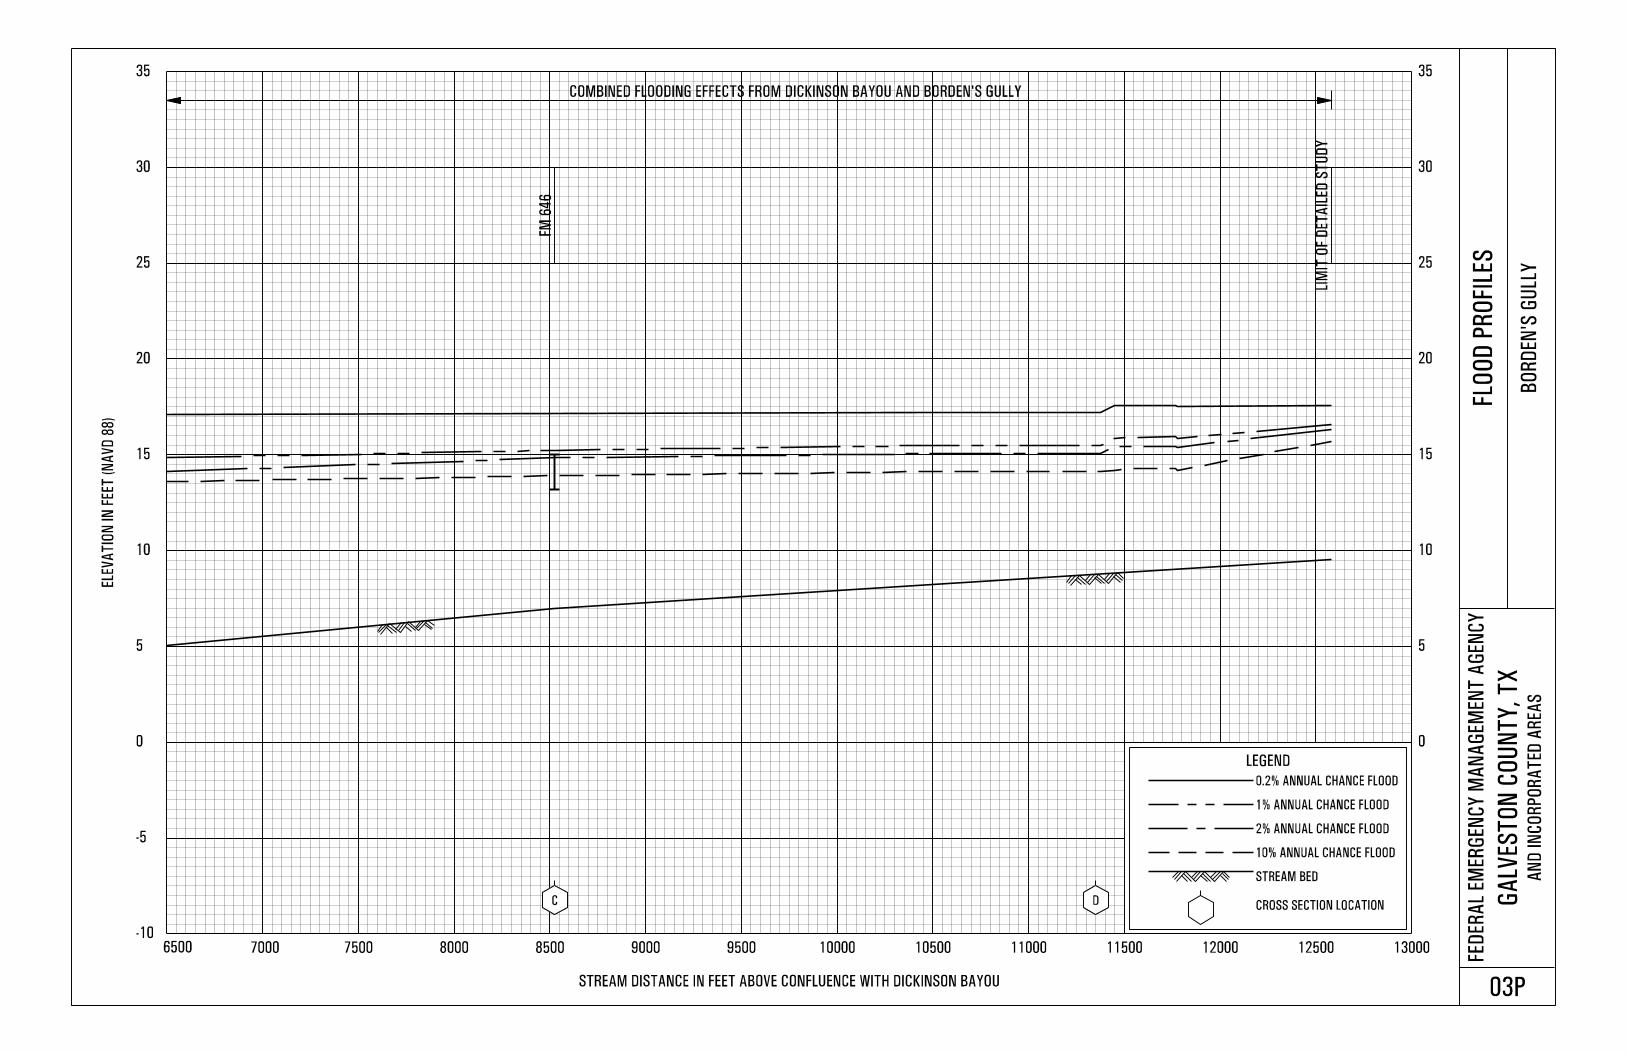
BORDEN’S GULLY At Calder Road 1.1 446 636 740 *
At mouth 2.8 1,003 1,383 1,587 *
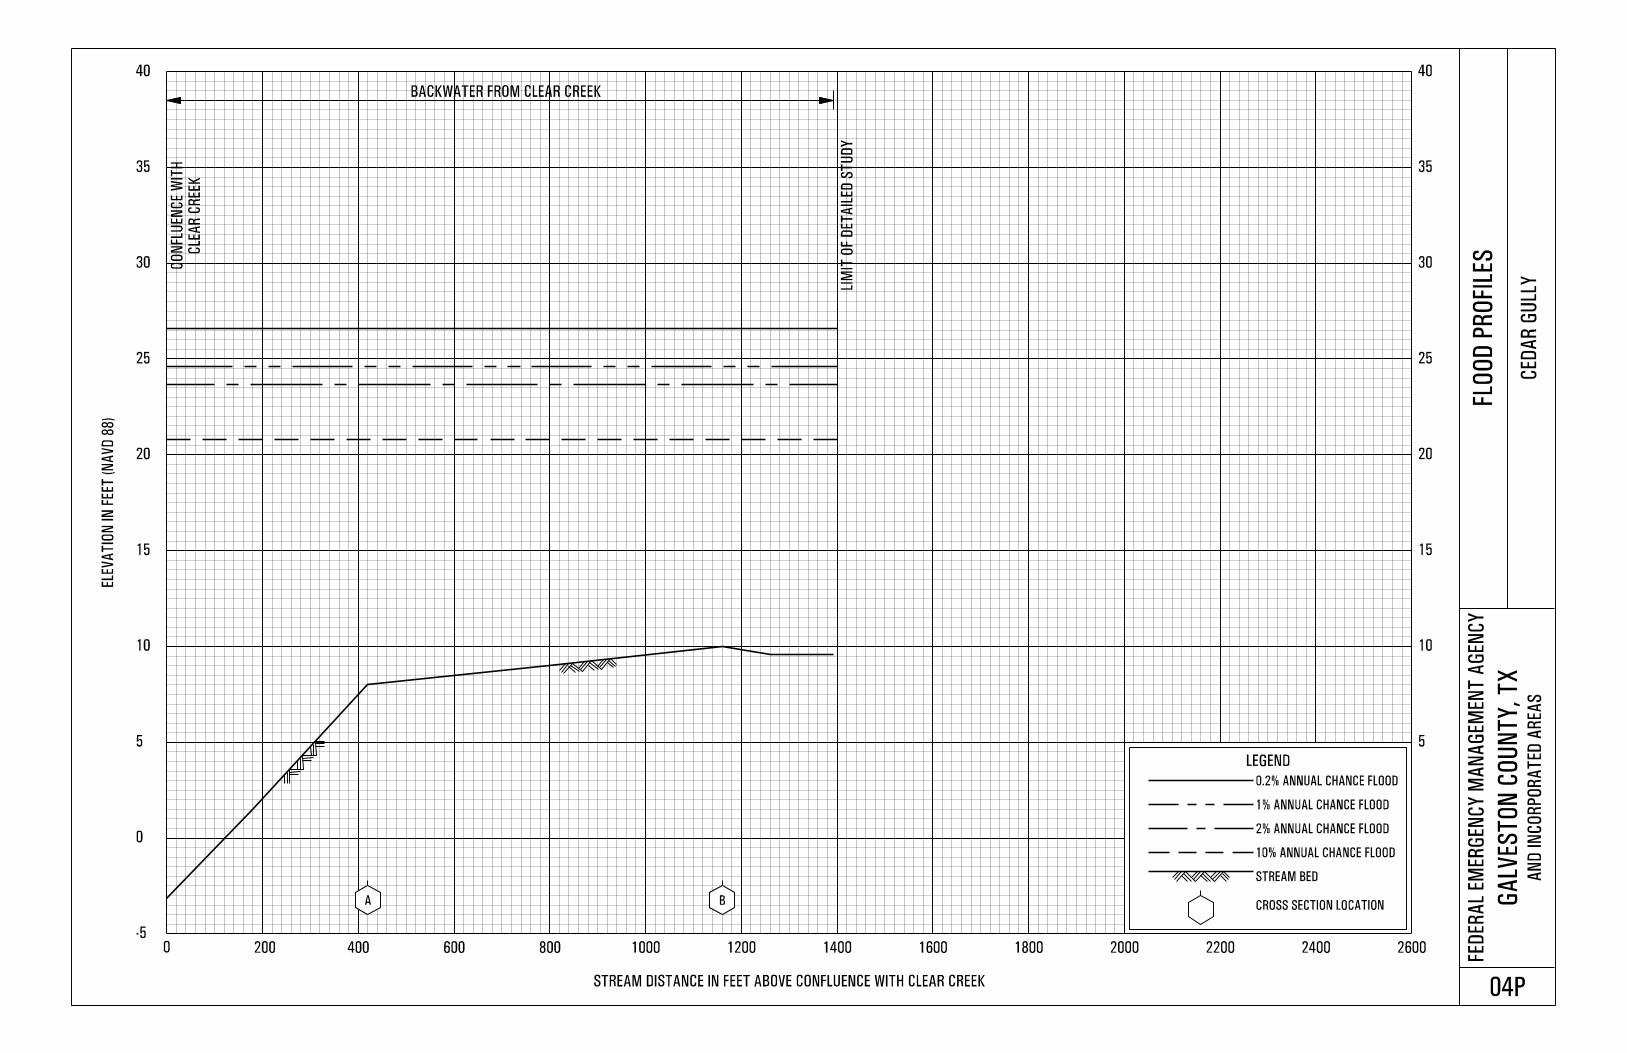
CEDAR GULLY At stream mile 0.08 1.1 580 790 880 1,100
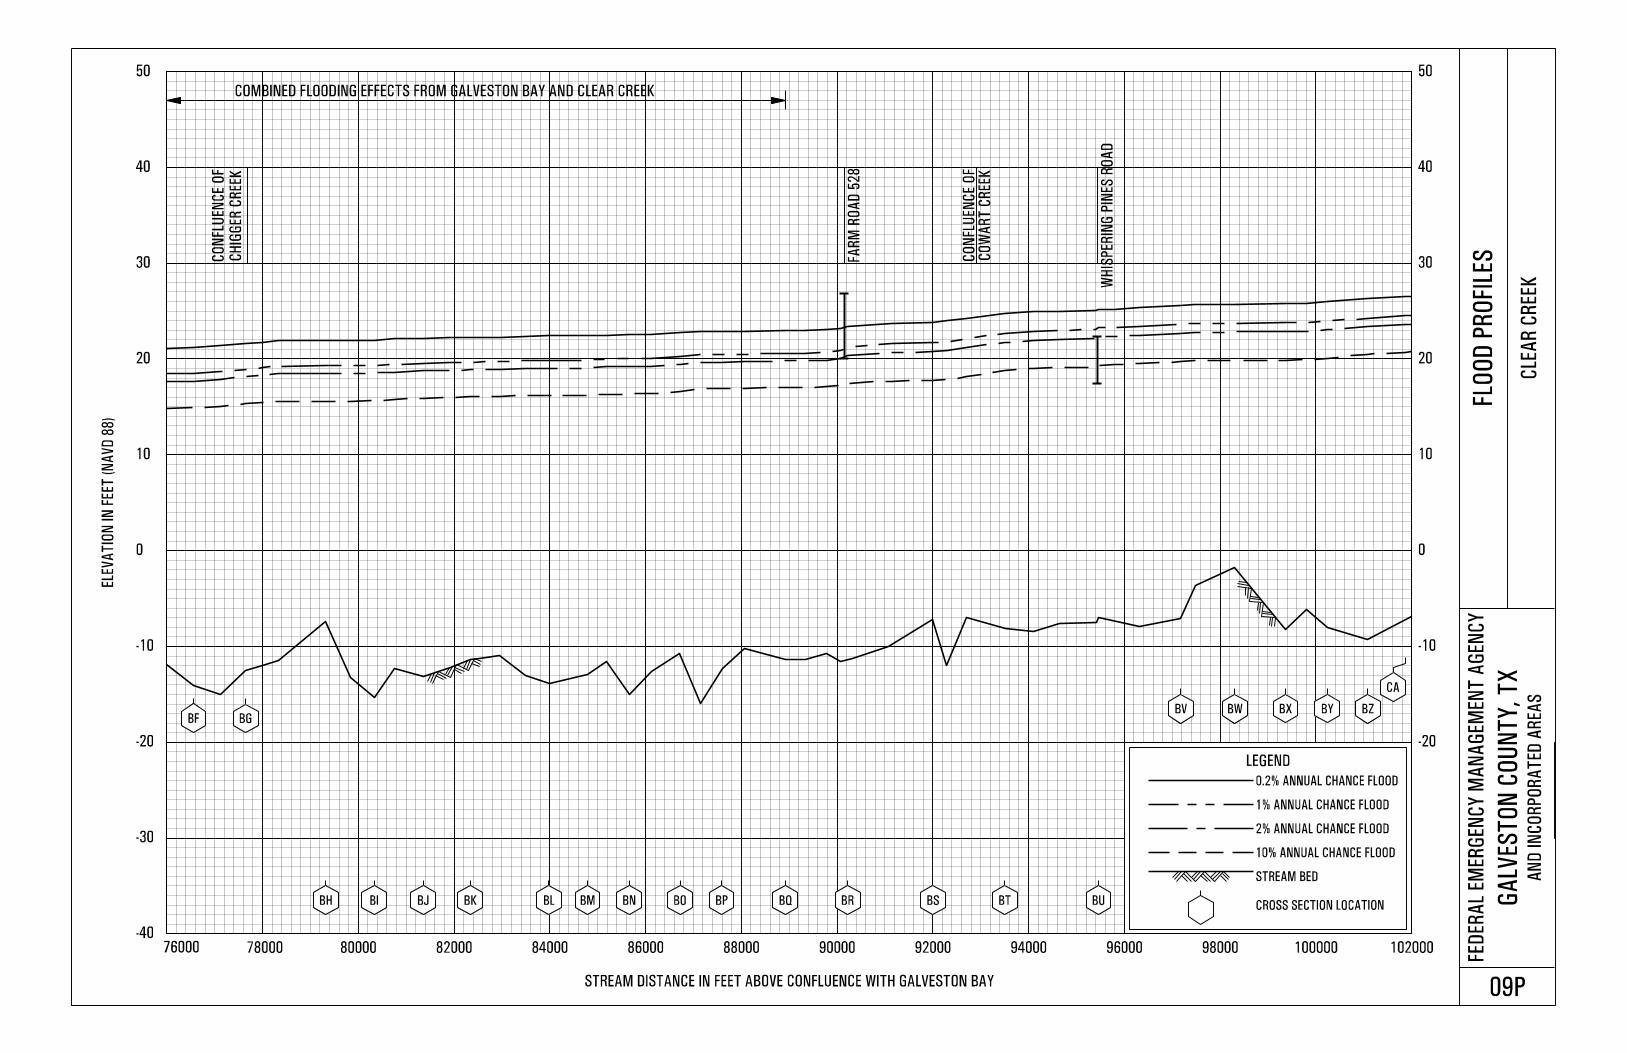
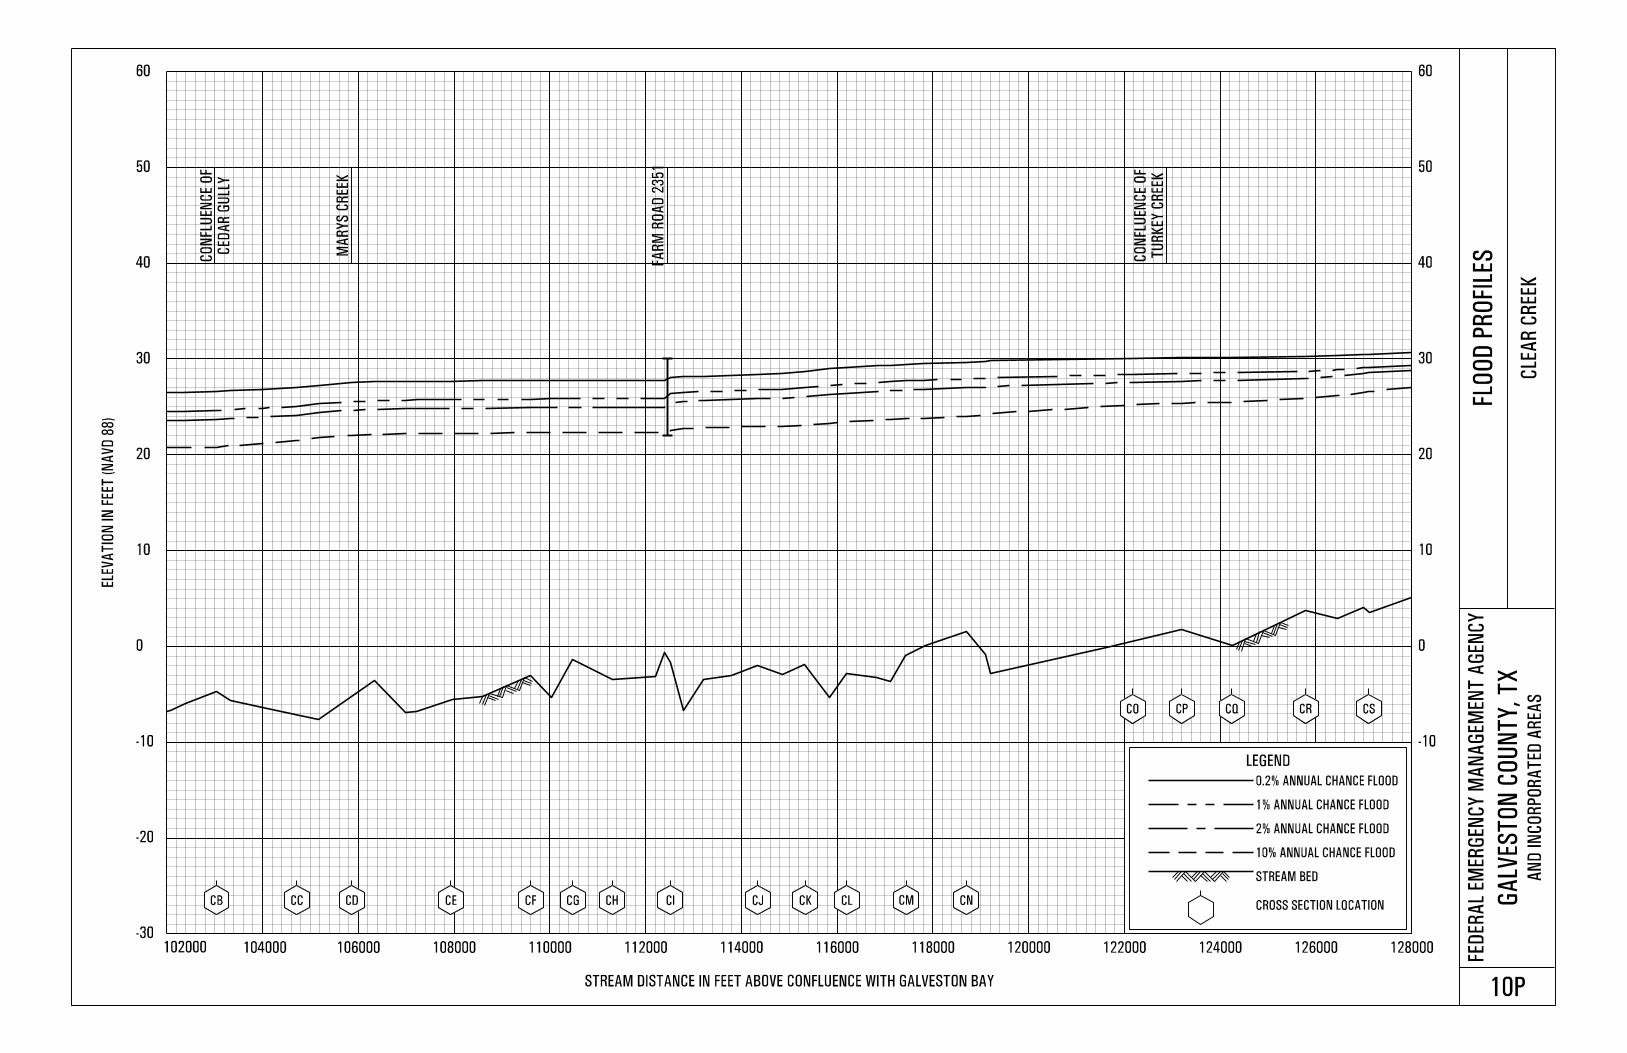
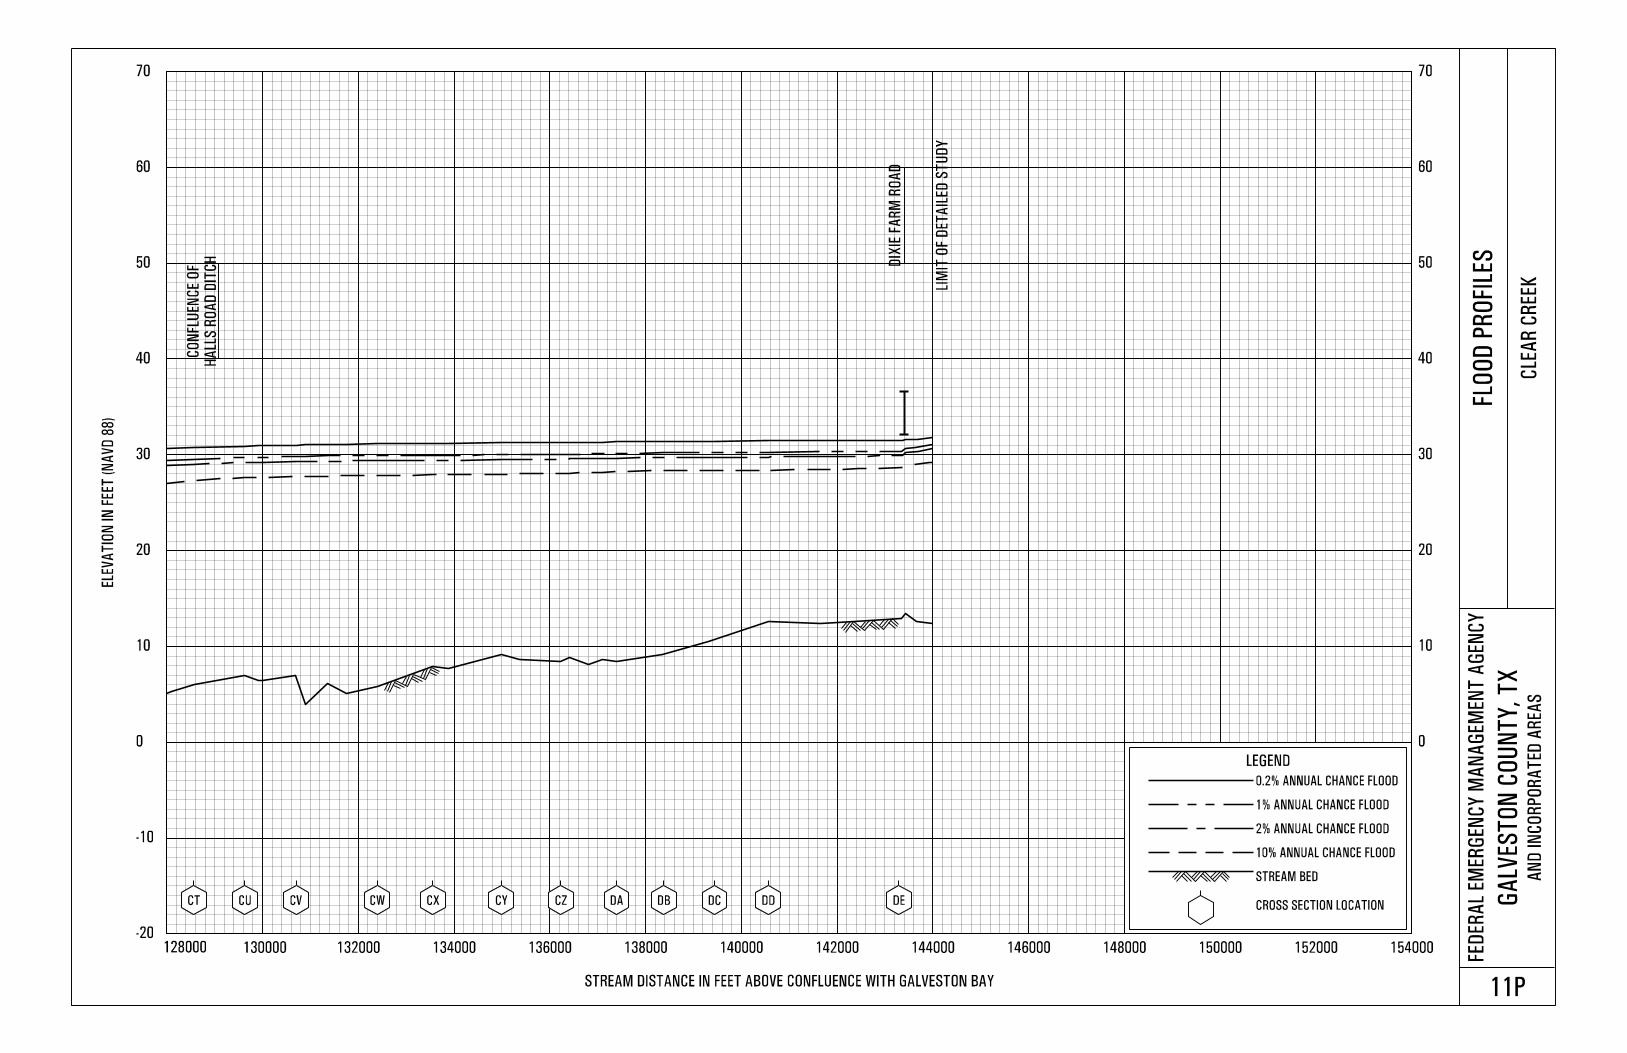
CLEAR CREEK At confluence of Halls Road Ditch 67.2 4,361 6,766 7,901 10,572
At confluence of Turkey Creek 77.3 6,876 10,632 12,282 17,205
At confluence of Marys Creek 95.6 9,343 14,080 16,162 22,566
At confluence of Cowart Creek 118.5 11,700 17,710 20,329 28,726
At confluence of Chigger Creek 139.1 13,201 19,868 22,891 30,896
At confluence of Magnolia Creek 144.9 13,407 20,253 23,340 31,269
At confluence of Landing Ditch 150.0 13,563 20,518 23,660 31,516
At confluence of Tributary
A111-00-00 154.0 13,729 20,766 23,940 31,637
At confluence of Cow Bayou 166.2 14,051 21,317 24,557 32,750
At confluence of Robinson Bayou 172.8 14,229 21,633 24,879 33,496
At confluence of Armand Bayou 231.9 20,938 35,377 42,013 64,427
16
Peak Discharge (cubic feet per second)
Flooding Source and Location
Drainage Area
(square miles)
10-Percent- 2-Percent- 1-Percent- 0.2-Percent-
Annual
Chance
Annual
Chance
Annual
Chance
Annual
Chance
CLEAR CREEK (Continued)
At confluence of Taylor Bayou
250.8
22,481
38,995
47,042
72,745
At mouth 260.0 21,618 38,098 46,341 71,847
CHIGGER CREEK At the confluence with Clear Creek 16.7 2,125 3,077 3,764 5,200
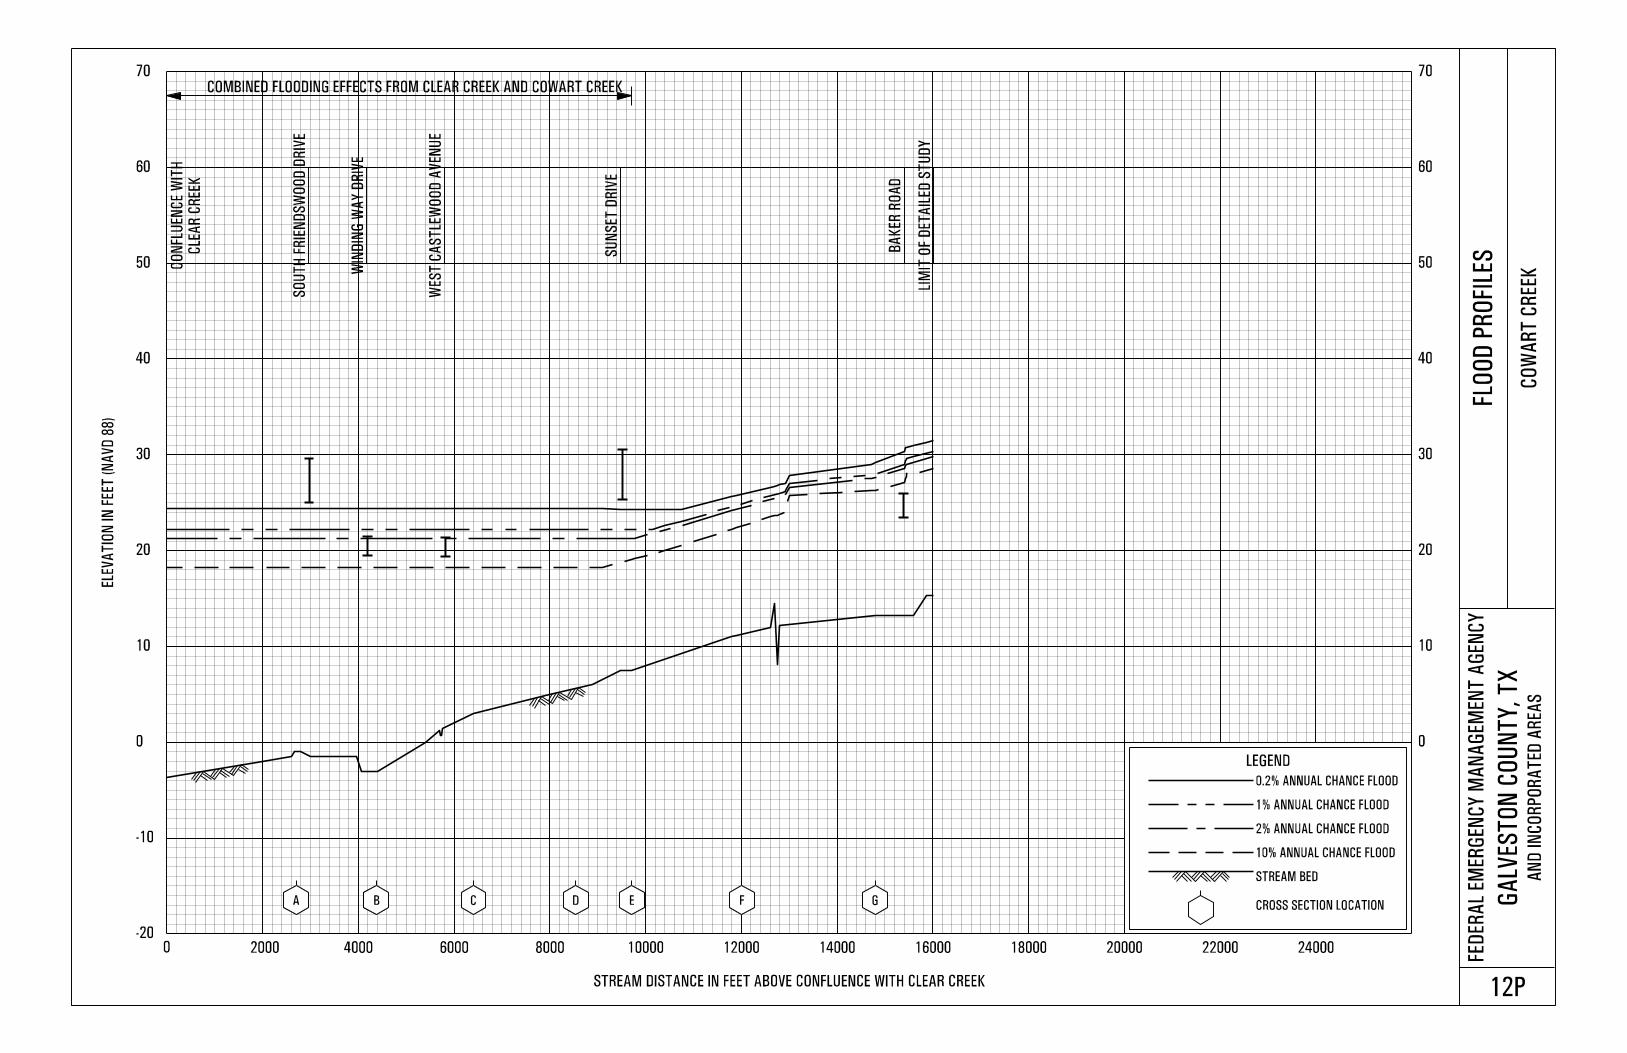
COWART CREEK At the confluence with Clear Creek 20.0 2,851 4,116 4,774 6,200
DICKINSON BAYOU At Interstate Route 75 43.0 3,710 5,240 5,920 7,490
At its confluence with Benson
Bayou 70.0 7,880 10,800 12,000 14,800
At its confluence with Gum Bayou 89.0 11,100 15,300 17,100 21,000
At State Route 146 99.0 14,600 19,800 22,000 26,900
UNNAMED TRIBUTARY 3
DIVERSION CHANNEL TO LHB
Just downstream of its confluence
with Unnamed Tributary 3 2.7 1,200 1,560 1,700 2,100
GUM BAYOU At Farm Road 517 13.5 1,940 2,680 3,000 3,740
HIGHLAND BAYOU ABOVE
DIVERSION DAM
At Old Camp Wallace Road 17.0 4,970 6,500 7,010 8,800
LOWER HIGHLAND BAYOU At Marchand Bayou 8.5 2,360 3,130 3,460 4,100
At Highway 6 18.0 4,970 6,500 7,010 8,800
MAGNOLIA BAYOU
At its confluence with Dickinson
Bayou 5.8 1,820 2,280 2,530 3,200
MAGNOLIA CREEK At mouth 4.8 1,669 2,298 2,579 3,200
MARCHAND BAYOU At State Route 519 3.8 1,390 1,770 1,900 2,300
17
Peak Discharge (cubic feet per second)
Flooding Source and Location
Drainage Area
(square miles)
10-Percent- 2-Percent- 1-Percent- 0.2-Percent-
Annual
Chance
Annual
Chance
Annual
Chance
Annual
Chance
MARYS CREEK
At the corporate limits 19.0 1,750 2,400 2,750 3,650
At the confluence with Clear Creek 20.0 2,014 2,741 3,054 3,800
TRIBUTARY TO GUM BAYOU At its confluence with Gum Bayou 5.7 1,500 2,000 2,200 2,500
UNNAMED TRIBUTARY TO
CLEAR CREEK
At mouth 3.1 890 1,220 1,390 2,150
UNNAMED TRIBUTARY TO
DICKINSON BAYOU (EAST
BRANCH)
Above Second Street 4.6 1,380 1,770 1,900 2,300
UNNAMED TRIBUTARY TO
DICKINSON BAYOU (WEST
BRANCH)
At its confluence with Unnamed
Tributary to Dickinson Bayou (East
Branch)
2.5 1,170 1,440 1,530 1,800
UPPER HIGHLAND BAYOU At Diversion Dam 17.0 3,140 4,340 4,815 5,910
UNNAMED TRIBUTARY At Delaney Road 1.6 1,080 1,280 1,380 1,610
UNNAMED TRIBUTARY 1 TO
LOWER HIGHLAND BAYOU
At Gulf Freeway 1.6 1,120 1,320 1,440 1,560
UNNAMED TRIBUTARY 2 TO
LOWER HIGHLAND BAYOU
At Gulf Freeway 1.1 780 920 1,020 1,120
UNNAMED TRIBUTARY 3 TO
LOWER HIGHLAND BAYOU
At FM 1765 1.1 990 1,270 1,400 1,730
At Temple Road 2.4 1,490 1,990 2,230 2,790
18
Peak Discharge (cubic feet per second)
Flooding Source and Location
Drainage Area
(square miles)
10-Percent- 2-Percent- 1-Percent- 0.2-Percent-
Annual
Chance
Annual
Chance
Annual
Chance
Annual
Chance
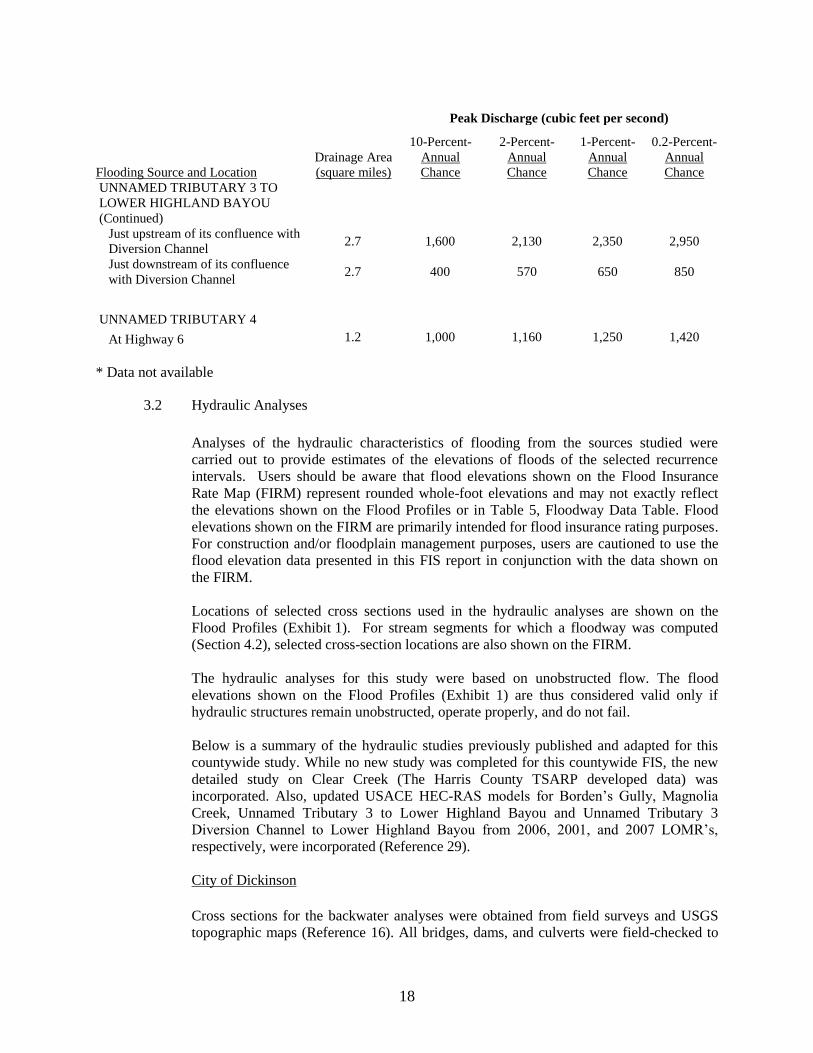
UNNAMED TRIBUTARY 3 TO
LOWER HIGHLAND BAYOU
(Continued)
Just upstream of its confluence with
Diversion Channel 2.7 1,600 2,130 2,350 2,950
Just downstream of its confluence
with Diversion Channel 2.7 400 570 650 850
UNNAMED TRIBUTARY 4 At Highway 6 1.2 1,000 1,160 1,250 1,420
* Data not available
3.2 Hydraulic Analyses
Analyses of the hydraulic characteristics of flooding from the sources studied were
carried out to provide estimates of the elevations of floods of the selected recurrence
intervals. Users should be aware that flood elevations shown on the Flood Insurance
Rate Map (FIRM) represent rounded whole-foot elevations and may not exactly reflect
the elevations shown on the Flood Profiles or in Table 5, Floodway Data Table. Flood
elevations shown on the FIRM are primarily intended for flood insurance rating purposes.
For construction and/or floodplain management purposes, users are cautioned to use the
flood elevation data presented in this FIS report in conjunction with the data shown on
the FIRM.
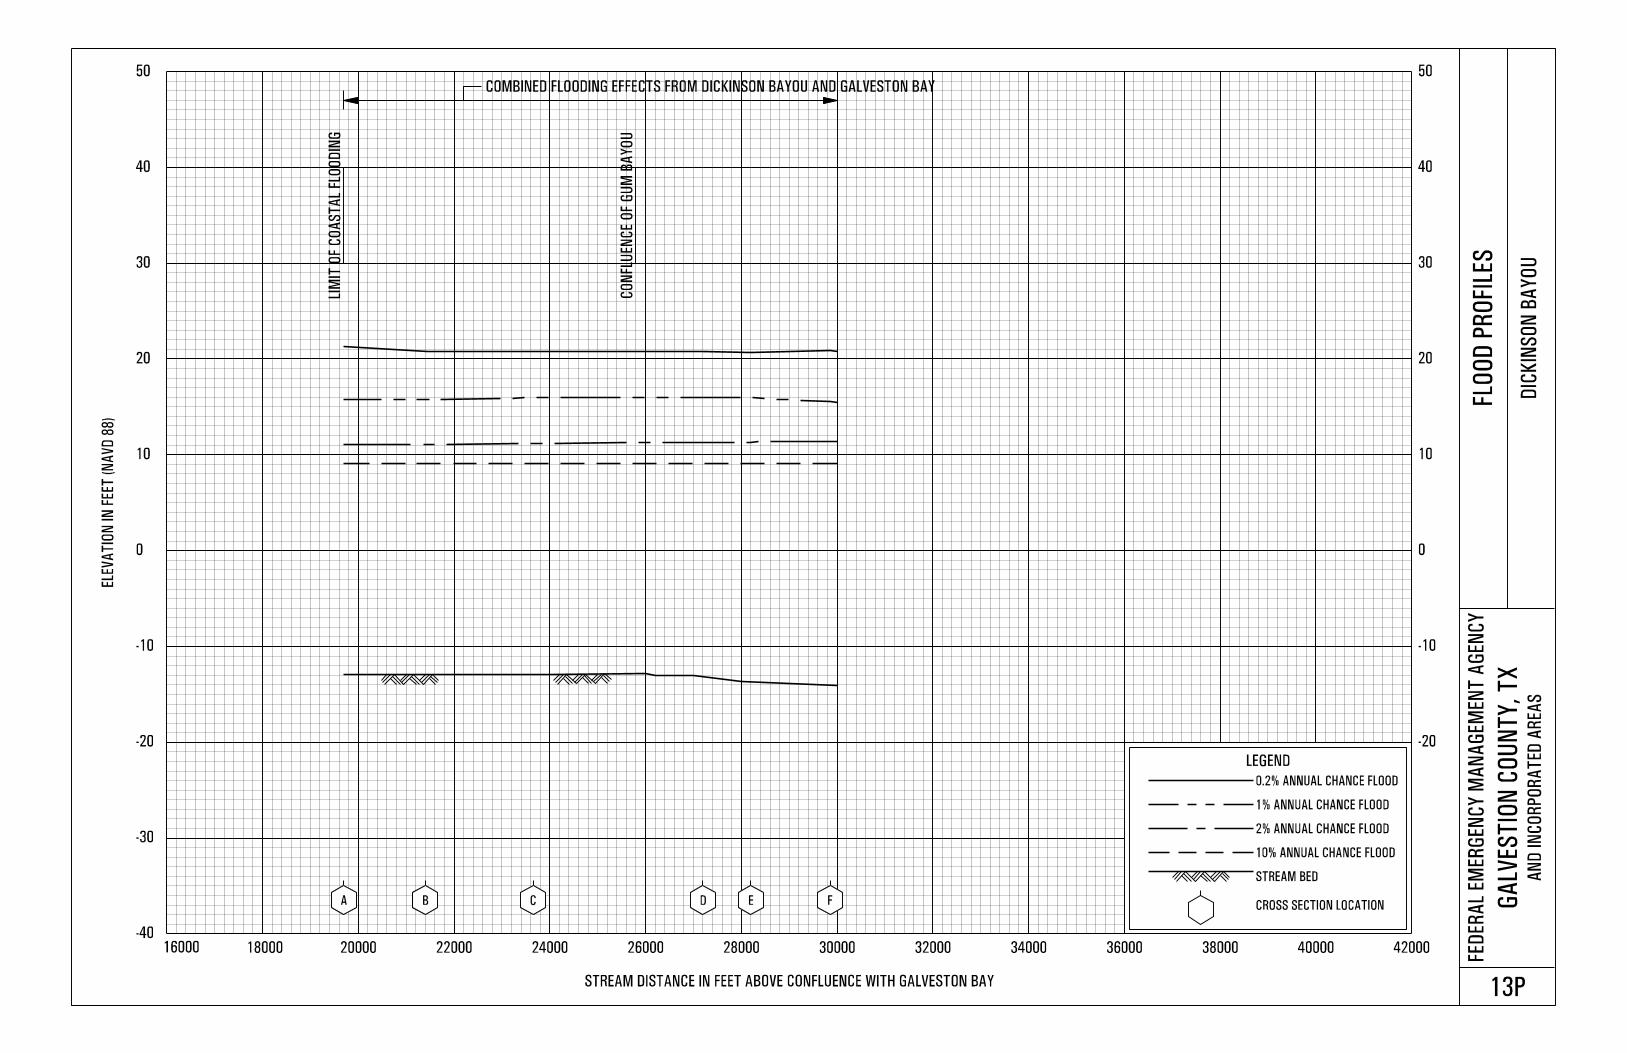
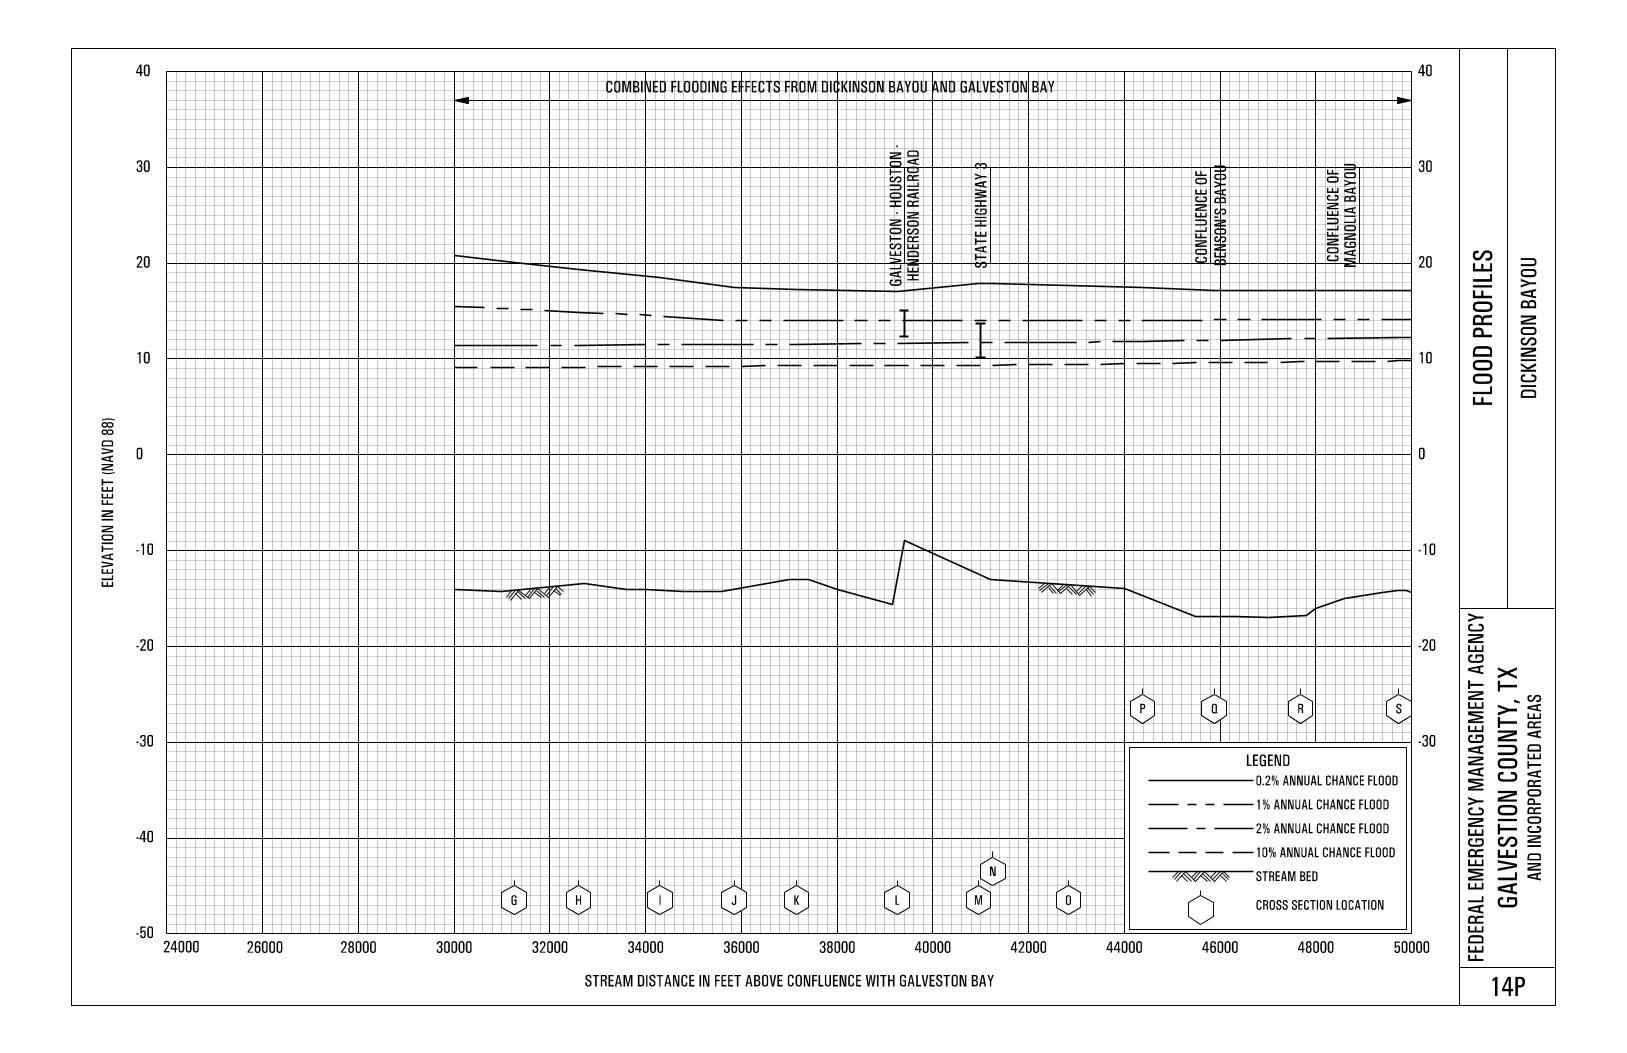
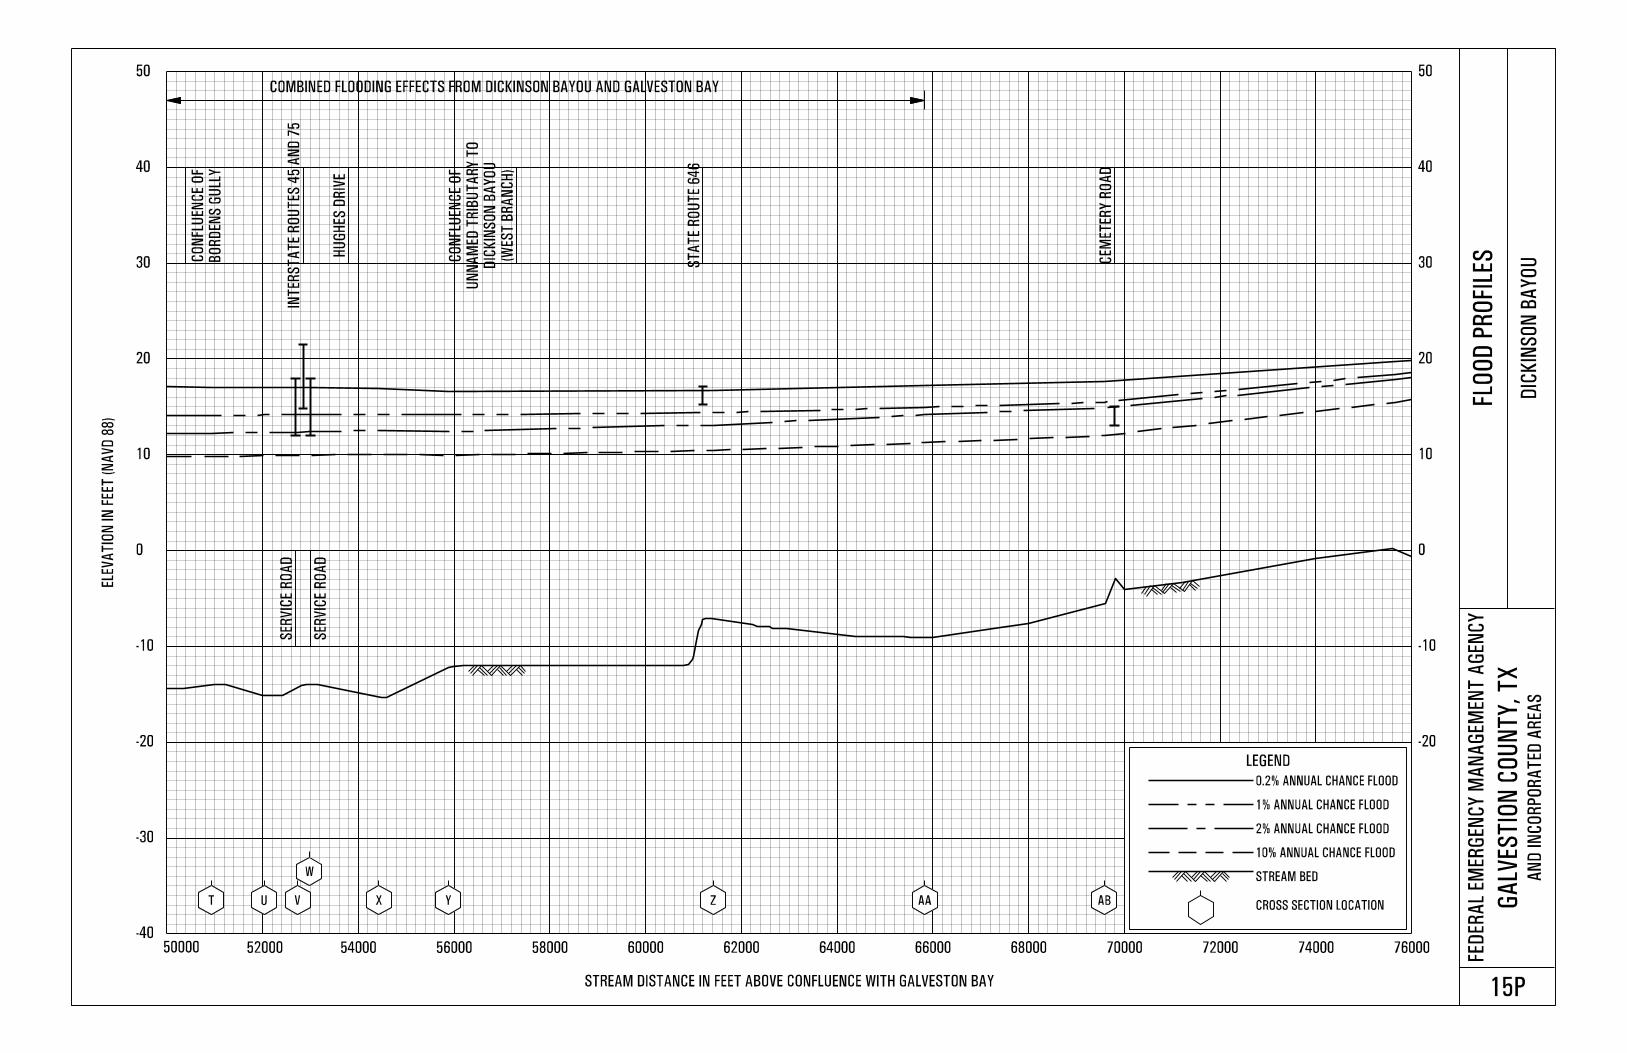
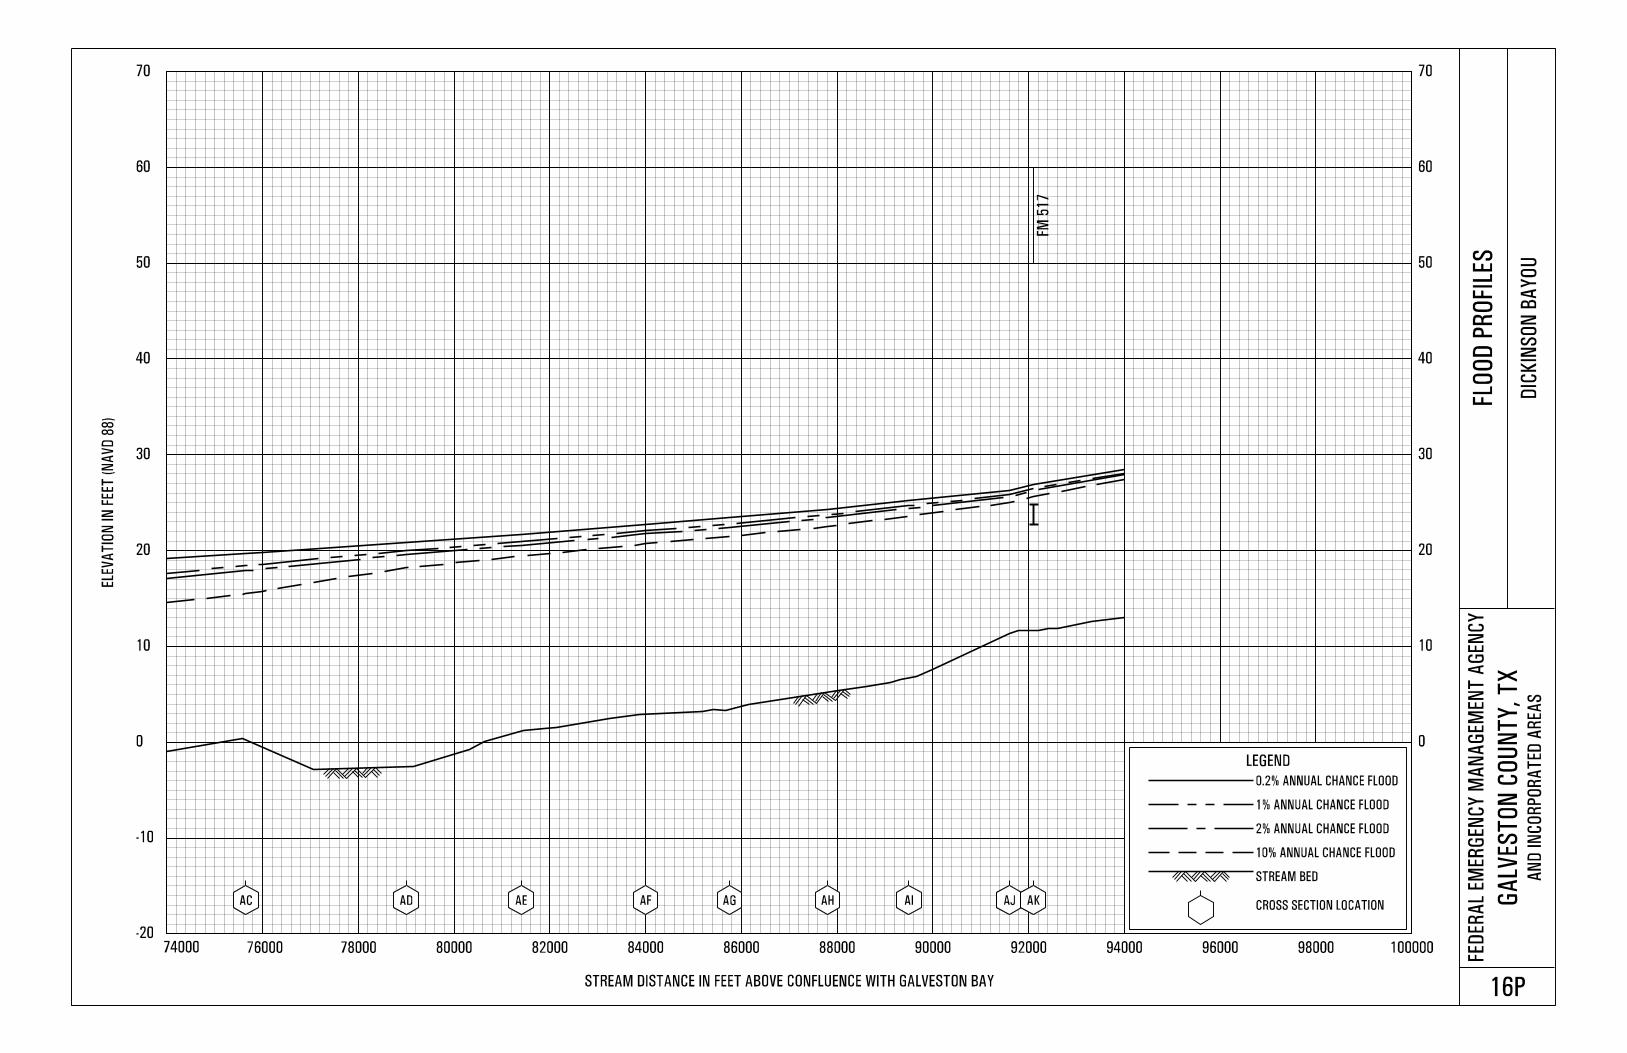
Locations of selected cross sections used in the hydraulic analyses are shown on the
Flood Profiles (Exhibit 1). For stream segments for which a floodway was computed
(Section 4.2), selected cross-section locations are also shown on the FIRM.
The hydraulic analyses for this study were based on unobstructed flow. The flood
elevations shown on the Flood Profiles (Exhibit 1) are thus considered valid only if
hydraulic structures remain unobstructed, operate properly, and do not fail.
Below is a summary of the hydraulic studies previously published and adapted for this
countywide study. While no new study was completed for this countywide FIS, the new
detailed study on Clear Creek (The Harris County TSARP developed data) was
incorporated. Also, updated USACE HEC-RAS models for Borden’s Gully, Magnolia
Creek, Unnamed Tributary 3 to Lower Highland Bayou and Unnamed Tributary 3
Diversion Channel to Lower Highland Bayou from 2006, 2001, and 2007 LOMR’s,
respectively, were incorporated (Reference 29).
City of Dickinson
Cross sections for the backwater analyses were obtained from field surveys and USGS
topographic maps (Reference 16). All bridges, dams, and culverts were field-checked to
19
obtain elevation data and structural geometry. Releveling of all bench marks along
Dickinson Bayou was performed by Tetra Tech Inc., during field surveys in 1978. The
channel cross sections, therefore, actually reflect the subsidence effect up to 1978. Cross
sections for the restudy of Magnolia Bayou were taken from USACE surveys performed
November 1984 through January 1985. Cross section elevations were corrected to the
National Geodetic Vertical Datum of 1929 (NGVD) 1984 adjustment.
Water-surface elevations of floods of the selected recurrence intervals were computed
using the USACE HEC-2 step-backwater computer program (Reference 29). Starting
water-surface elevations for Dickinson Bayou were set equal to mean high tide. Starting
water-surface elevations for the remaining streams were set equal to the elevation of the
main stream at their confluence. Flood profiles were drawn showing computed water-
surface elevations of floods of the selected recurrence intervals.
Channel roughness factors (Manning's "n") used in the hydraulic computations were
chosen by engineering judgment and based on field observations and aerial photographs
of the streams and floodplain areas, and USGS Water-Supply Paper 1849 (Reference 30).
Channel "n" values for the streams studied by detailed methods ranged from 0.020 to
0.080, and the overbank "n" values ranged from 0.060 to 0.130.
City of Friendswood
Cross sectional information in this study was obtained from the Galveston District of the
USACE based on field survey data taken in 1976 and tied to National Geodetic Survey
(NGS) bench marks releveled in 1973. The HCFCD, in updating the analyses for Cedar
Gully, utilized field survey data based on USACE marks that also tied into the NGS
bench marks releveled in 1973. The updated analysis of Marys Creek, Cowart Creek, and
Chigger Creek, performed by BJI, incorporated updated field surveys and as-built plans
based on the 1978 releveling of NGS datum. The cross sections were located at close
intervals above and below bridges and culverts and supplemented with information from
USGS topographic maps in order to compute the significant backwater effects of these
structures (Reference 16).
Water-surface elevations of floods of the selected recurrence intervals were computed
using the USACE HEC-2 step-backwater computer program (Reference 29). Flood
profiles were drawn shoving computed water-surface elevations for floods of the selected
recurrence intervals. The starting water-surface elevations for Cedar Gully, Chigger
Creek, Cowart Creek, and Marys Creek were calculated by the slope/area method taking
elevations at the mouth of each stream.
Channel roughness factors (Manning's "n") used in the hydraulic computations were
chosen by engineering judgment based on field observations, aerial photographs of the
streams and floodplain areas, and USGS Water Supply Paper 1849 (References 17 and
30). For Chigger Creek, Cowart Creek, and Marys Creek, channel "n" values ranged from
0.013 to 0.040, and overbank "n" values ranged from 0.080 to 0.150. The Cedar Gully
Channel "n" ranged from 0.035 to 0.070 and overbank "n" values ranged from 0.035 to
0.150.
In the watersheds of these streams, flat terrain makes definition of the watershed divides
difficult. The discharges in Table 3 that are identified as being adjusted for basin
20
overflow reflect the final discharges used in the hydraulic backwater model and have
already had the basin overflow discharge subtracted from the total discharge computed by
hydrologic methods. The three hydraulic methods used to calculate basin overflow are
Manning's Equation, the Weir Equation, and a known stage-discharge curve.
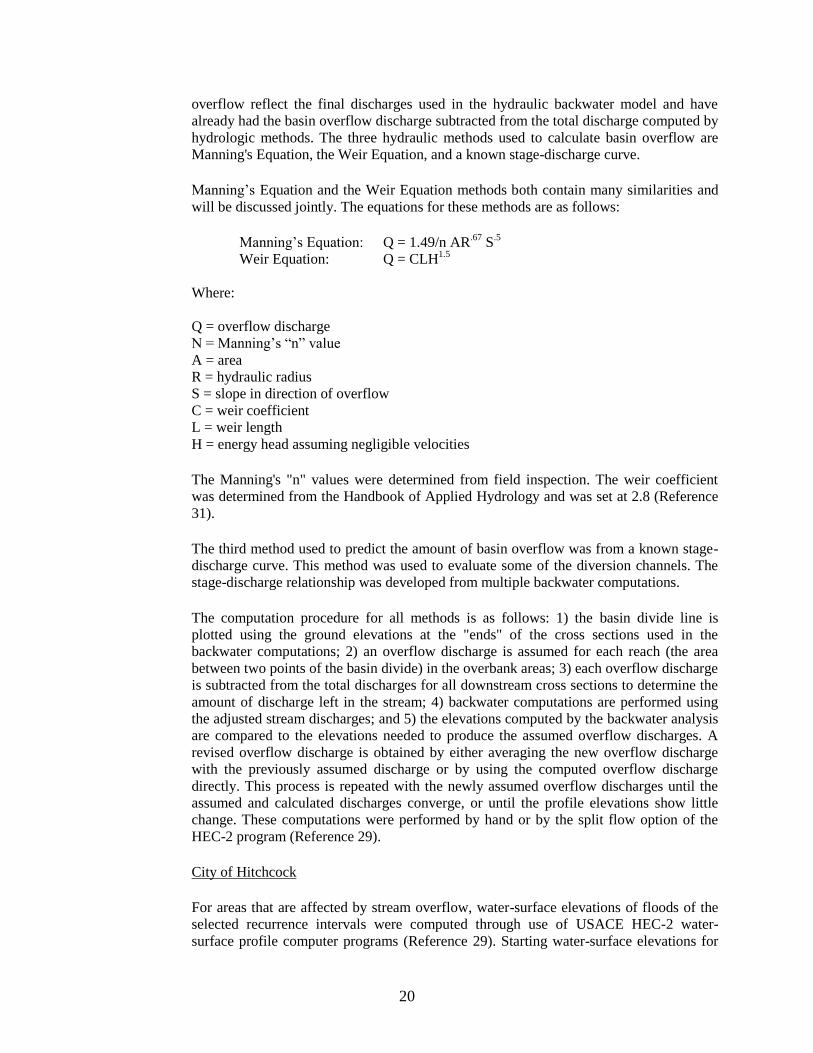
Manning’s Equation and the Weir Equation methods both contain many similarities and
will be discussed jointly. The equations for these methods are as follows:
Manning’s Equation: Q = 1.49/n AR.67
S.5
Weir Equation: Q = CLH1.5
Where:
Q = overflow discharge
N = Manning’s “n” value
A = area
R = hydraulic radius
S = slope in direction of overflow
C = weir coefficient
L = weir length
H = energy head assuming negligible velocities
The Manning's "n" values were determined from field inspection. The weir coefficient
was determined from the Handbook of Applied Hydrology and was set at 2.8 (Reference
31).
The third method used to predict the amount of basin overflow was from a known stage-
discharge curve. This method was used to evaluate some of the diversion channels. The
stage-discharge relationship was developed from multiple backwater computations.
The computation procedure for all methods is as follows: 1) the basin divide line is
plotted using the ground elevations at the "ends" of the cross sections used in the
backwater computations; 2) an overflow discharge is assumed for each reach (the area
between two points of the basin divide) in the overbank areas; 3) each overflow discharge
is subtracted from the total discharges for all downstream cross sections to determine the
amount of discharge left in the stream; 4) backwater computations are performed using
the adjusted stream discharges; and 5) the elevations computed by the backwater analysis
are compared to the elevations needed to produce the assumed overflow discharges. A
revised overflow discharge is obtained by either averaging the new overflow discharge
with the previously assumed discharge or by using the computed overflow discharge
directly. This process is repeated with the newly assumed overflow discharges until the
assumed and calculated discharges converge, or until the profile elevations show little
change. These computations were performed by hand or by the split flow option of the
HEC-2 program (Reference 29).
City of Hitchcock
For areas that are affected by stream overflow, water-surface elevations of floods of the
selected recurrence intervals were computed through use of USACE HEC-2 water-
surface profile computer programs (Reference 29). Starting water-surface elevations for
21
Highland Bayou were set equal to mean high tide. Starting water-surface elevations for
Marchand Bayou and Unnamed Tributary 4 were set equal to the backwater elevation of
Highland Bayou.
Cross sections for the backwater analysis of Highland Bayou, Marchand Bayou,
Unnamed Tributary 4 were obtained from field surveys and USGS 7.5-minute
topographic maps (Reference 16). All bridges, dams, and culverts were field checked to
obtain elevation data and structural geometry. Re-leveling of all benchmarks along
Highland Bayou was performed by Tetra Tech, Inc. during field surveys in 1978. The
channel cross sections, therefore, actually reflect the subsidence effect up to 1978.
Channel roughness factors (Manning's "n") used in the hydraulic computations were
chosen by engineering judgment and based on field observations and aerial photo of the
streams and flood plain areas and on U.S. Geological Supply Paper 1849 (Reference 30).
Roughness values used for Highland Bayou and its tributaries in the Hitchcock area range
from 0.33 to 0.04, with flood plain roughness values ranging from 0.06 to 0.1 for all
floods.
City of La Marque
For areas subject to stream overflow, water-surface elevations of floods of the selected
recurrence intervals were computed through use of the USACE HEC-2 water-surface
profile computer program (Reference 29). Starting water-surface elevations for Highland
Bayou were set equal to mean high tide. Starting water-surface elevations for Marchand
Bayou and Unnamed Tributary 3 were set equal to backwater elevations of Highland
Bayou at their respective confluences. The starting water- surface elevations for
Unnamed Tributaries 1 and 2 were estimated to be the maximum rainfall ponding levels
behind the southwest levee.
Cross sections for the backwater analysis of Highland Bayou, Marchand Bayou,
Unnamed Tributary 1, Unnamed Tributary 2, and Unnamed Tributary 3 were obtained
from field surveys and U.S. Geological Survey 7.5-Minute Topographic Maps (Reference
16). All bridges, dams, and culverts were field checked to obtain elevation data and
structural geometry. Releveling of all benchmarks along Highland Bayou was performed
by Tetra Tech during field surveys in 1978. The channel cross sections, therefore,
actually reflect the subsidence effect up to 1978.
Channel roughness factors (Manning's "n”) used in the hydraulic computations were
chosen by engineering judgment and based on field observations and aerial photos of the
streams and flood-plain areas and on U.S. Geological Survey Water Supply Paper 1849
(Reference 30). Roughness values used for Highland Bayou and its tributaries in the La
Marque area range from 0.025 to 0.040, with flood plain roughness values ranging from
0.060 to 0.10 for all floods.
City of League City
For the streams studied by detailed methods in the original study and in the September
22, 1999 revision, water-surface elevations of floods of the selected recurrence intervals
were computed using the USACE HEC-2 step-backwater computer program (Reference
29). Starting water-surface elevations for Benson Bayou, and Unnamed Tributary of
22
Clear Creek were set equal to normal depth. Cross sectional data for Unnamed Tributary
of Clear Creek was obtained from the Galveston District of the USACE. Cross sectional
data for Benson Bayou were obtained from field surveys and USGS topographic maps
(Reference 16). For Magnolia Bayou in the 1999 revision, starting water-surface
elevations were determined from the backwater elevation of Dickinson Bayou. Cross
sectional data used in this revision were obtained from field surveys; elevations were
adjusted to the 1984 vertical datum due to subsidence. Flood profiles were drawn
showing computed water-surface elevations for floods of the selected recurrence
intervals. Flood profiles for Clear Creek were obtained from the Harris County FIS
(Reference 22).
Channel roughness factors (Manning's "n") used in the hydraulic computations were
chosen by engineering judgment based on field observations, aerial photographs of the
streams and floodplain areas, and USGS Water Supply Paper 1849 (Reference 30). For
the streams studied by detailed methods, the channel "n" values ranged from 0.020 to
0.080, and overbank "n" values ranged from 0.080 to 0.150.
City of Santa Fe
For areas subject to stream overflow, water-surface elevations of floods of the selected
recurrence intervals were computed through use of the USACE HEC-2 water-surface
profile computer programs (Reference 29). Starting water-surface elevations for the reach
of Highland Bayou downstream of the diversion darn were set equal to the mean high
tide. Starting water-surface elevations for the tributaries of Highland Bayou were set
equal to the elevation of the mainstream at their confluence. The starting elevations for
Highland Bayou above the Diversion Dam were estimated at normal depth.
Cross sections for the backwater analysis of Highland Bayou and tributaries were
obtained from field surveys and U.S. Geological Survey 7.5-minute topographic maps
(Reference 16). All bridges, dams, and culverts were field checked to obtain elevation
data and structural geometry. Releveling of all bench marks along Highland and
Dickinson Bayous was performed by Tetra Tech during field surveys in 1978. The
channel cross sections, therefore, actually reflect the subsidence effect up to 1978.
Channel roughness factors (Manning's “n”) used in the hydraulic computations, were
chosen by engineering judgment and based on field observations and aerial photos of the
streams and floodplain areas and on U.S. Geological Survey Water Supply Paper 1849
(Reference 30). Roughness values used for the main channel of Highland Bayou and its
tributaries range from 0.025 to 0.080, with flood plain roughness values ranging from
0.060 to 0.120 for all floods.
City of Texas City
For areas subject to stream overflow, water-surface elevations of floods of the selected
recurrence intervals were computed through use of the USACE HEC-2 water-surface
profile computer programs (Reference 29). Starting water-surface elevations for
Dickinson Bayou were set equal to mean high tide. Starting water-surface elevations for
Gum Bayou were set equal to the backwater elevations at its confluence with Dickinson
Bayou.
23
Cross sections for the backwater analysis of Dickinson Bayou and Gum Bayou were
obtained from field surveys and U.S. Geological Survey 7.5-minute topographic maps
(Reference 16). All bridges, dams, and culverts were field checked to obtain elevation
data and structural geometry. Releveling of all benchmarks along Dickinson Bayou was
performed by Tetra Tech during field surveys in 1978. The channel cross sections,
therefore, actually reflect the subsidence effect up to 1978. Channel roughness factors
(Manning's "n”) used in the hydraulic computations were chosen by engineering
judgment and based on field observations and aerial photos of the streams and floodplain
areas and on U.S. Geological Survey Water Supply Paper 1849 (Reference 30).
Roughness values used for the main channels of Dickson Bayou and Gum Bayou range
from 0.030 to 0.040, with flood plain roughness values ranging from 0.060 to 0.100 for
all floods.
Galveston County (Unincorporated Areas)
In the 1983 revision and in the November 16, 1990, revision, water surface elevations of
floods of the selected recurrence intervals were computed using the USACE HEC-2 step-
backwater computer program (Reference 29). Starting water-surface elevations for
Dickinson Bayou and the portion of Highland Bayou downstream of the diversion dam
were set equal to mean high tide. Starting water surface elevations for the remaining
streams were set equal to the elevation of the main stream at their confluence. Starting
water surface elevations for Highland Bayou above the diversion dam were estimated at
normal depth. Flood profiles were drawn showing computed water-surface elevations of
floods of the selected recurrence intervals.
Cross sections for the backwater analysis of Dickinson Bayou and tributaries, and
Highland Bayou and tributaries, were obtained from field surveys and USGS topographic
maps (Reference 16). All bridges, dams, and culverts were field- checked to obtain
elevation data and structural geometry. Releveling of all benchmarks along Highland and
Dickinson Bayous was performed by Tetra Tech, Inc., during field surveys in 1978. The
channel cross sections, therefore, actually reflect the subsidence effect up to 1978. Cross
sections for the November 16, 1990, restudy of Magnolia Bayou were taken from
USACE surveys performed between November 1984 and January 1985.
Channel roughness factors (Manning's "n") used in the hydraulic computations were
chosen by engineering judgment and based on field observations and aerial photographs
of the streams and floodplain areas, and USGS Water-Supply Paper 1849 (Reference 30).
Channel "n" values for the streams studied by detailed methods ranged from 0.025 to
0.080, and the overbank "n" values ranged from 0.060 to 0.120.
Locations of selected cross sections used in the hydraulic analyses are shown on the
Flood Profiles (Exhibit 1). For stream segments for which a floodway was computed
(Section 4.2), selected cross-section locations are also shown on the Flood Insurance Rate
Map (Exhibit 2).
3.3 Coastal Analysis
The hydraulic characteristics of coastal flood sources were analyzed to provide estimates
of flood elevations for selected recurrence intervals. Users should be aware that flood
elevations shown on the FIRM represent rounded whole-foot elevations and may not
24
exactly reflect the elevations shown in the coastal data tables and flood profiles provided
in the FIS Report.
3.3.1. Storm Surge Analysis and Modeling
For areas subject to coastal flood effects, the 10-, 2-, 1-, and 0.2-percent-annual-
chance stillwater elevations were taken directly from a detailed storm surge study
documented in Flood Insurance Study: Coastal Counties, Texas Intermediate
Submission 2 – Scoping and Data Review prepared by the USACE. This storm
surge study was completed in November 2011.
The Advanced Circulation (ADCIRC) model for coastal ocean hydrodynamics
developed by the USACE was applied to calculate stillwater elevations for
coastal Texas. The ADCIRC model uses an unstructured grid and is a finite
element long wave model. It has the capability to simulate tidal circulation and
storm surge propagation over large areas and is able to provide highly detailed
resolution in areas of interest along shorelines, open coasts and inland bays. It
solves three dimensional equations of motion, including tidal potential, Coriolis,
and non-linear terms of the governing equations. The model is formulated from
the depth-averaged shallow water equations for conservation of mass and
momentum which result in the generalized wave continuity equation.
In performing the coastal analyses, nearshore waves were required as inputs to
wave runup and overland wave propagation calculations, and wave momentum
(radiation stress) was considered as contribution to elevated water levels (wave
setup). The Steady State Spectral Wave (STWAVE) model was used to generate
and transform waves to the shore for the Texas Joint Storm Surge (JSS) Study.
STWAVE is a finite difference model that calculates wave spectra on a
rectangular grid. The model outputs zero-moment wave height, peak wave
period (Tp), and mean wave direction at all grid points and two-dimensional
spectra at selected grid points. STWAVE includes an option to input spatially
variable wind and storm surge field. Storm surge significantly alters wave
transformation and generation for the hurricane simulations in shallow-flooded
areas.
STWAVE was applied on five grids for the Texas JSS: NE, CE, SW, NEn, and
CEn. Three large grids (NE, CE, SW) with offshore boundaries at depths near
100 feet (30 meters) encompassed the entire coast of Texas and applied the
efficient half-plane version of STWAVE (which must approximately align with
the shoreline). Two nested grids (NEn and CEn) covered Galveston Bay and
Corpus Christi Bay and applied the fullplane version of STWAVE to allow
generation of wind waves in all directions. Notably, memory requirements for
the full-plane model precluded its use for the large grids with offshore
boundaries. The input for each grid includes the bathymetry (interpolated from
the ADCIRC domain), surge fields (interpolated from ADCIRC surge fields), and
wind fields (interpolated from the ADCIRC wind fields, which apply land effects
to the base wind fields). The wind and surge applied in STWAVE are spatially
and temporally variable for all domains. STWAVE was run at 30-minute
intervals for 93 quasi-time steps (46.5 hours).
25
The ADCIRC model computational domain and the geometric/topographic
representation developed for the Joint Coastal Surge effort was designated as the
TX2008 mesh. This provided a common domain and mesh from the Texas-
Mexico border to western Louisiana, extends inland across the floodplains of
Coastal Texas (to the 30- to 75-foot contour NAVD88), and extends over the
entire Gulf of Mexico to the deep Atlantic Ocean. The TX2008 domain
boundaries were selected to ensure the correct development, propagation, and
attenuation of storm surge without necessitating nesting solutions or specifying
ad hoc boundary conditions for tides or storm surge. The TX2008 computational
mesh contains more than 2.8 million nodes and nodal spacing varies significantly
throughout the mesh. Grid resolution varies from approximately 12 to15 miles in
the deep Atlantic Ocean to about 100 ft. in Texas. Further details about the
terrain data as well as the ADCIRC mesh creation and grid development process
can be found in Flood Insurance Study: Coastal Counties, Texas Intermediate
Submission 2 – Scoping and Data Review (Reference 40).
3.3.2. Statistical Analysis
The Joint Probability Method (JPM) is a simulation methodology that relies on
the development of statistical distributions of key hurricane input variables such
as central pressure, radius to maximum wind speed, maximum wind speed,
translation speed, track heading, etc., and sampling from these distributions to
develop model hurricanes. The resulting simulation results in a family of
modeled storms that preserve the relationships between the various input model
components, but provides a means to model the effects and probabilities of
storms that historically have not occurred.
Due to the excessive number of simulations required for the traditional JPM
method, the JPM-Optimum Sampling (JPM-OS) was utilized to determine the
stillwater elevations associated with tropical events. JPM-OS is a modification
of the JPM method and is intended to minimize the number of synthetic storms
that are needed as input to the ADCIRC model. The methodology entails
sampling from a distribution of model storm parameters (e.g., central pressure,
radius to maximum wind speed, maximum wind speed, translation speed, and
track heading) whose statistical properties are consistent with historical storms
impacting the region, but whose detailed tracks differ. The methodology
inherently assumes that the hurricane climatology over the past 60 to 65 years
(back to 1940) is representative of the past and future hurricanes likely to occur
along the Texas coast.
A set of 446 storms (two sets of 152 low frequency storms + two sets of 71
higher frequency storms) was developed by combining the “probable”
combinations of central pressure, radius to maximum winds, forward speed,
angle of track relative to coastline, and track. Tracks were defined by five
primary tracks and four secondary tracks. Storm parameters for synthetic storms
are provided in Table 11 of Flood Insurance Study: Coastal Counties, Texas
Intermediate Submission 2 – Scoping and Data Review (Reference 40). The
estimated range of storm frequencies using the selected parameters was between
the 10%- and 0.2%-annual-chance storm events. The ADCIRC-STWAVE
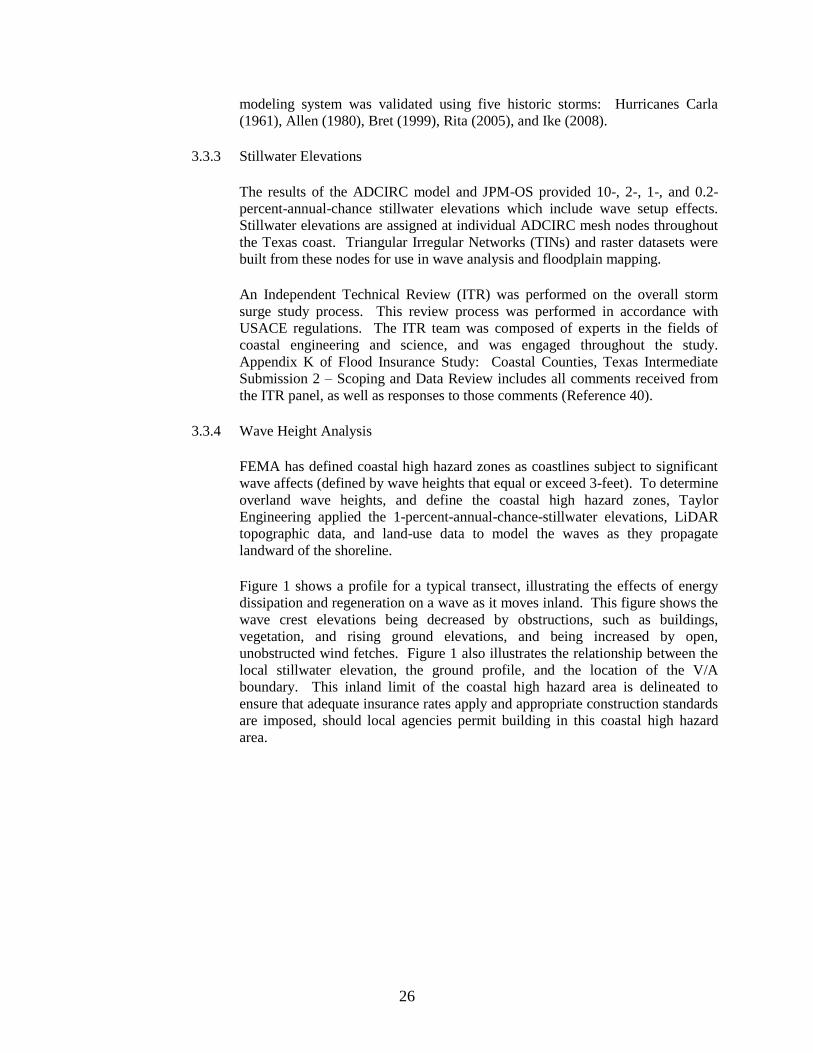
26
modeling system was validated using five historic storms: Hurricanes Carla
(1961), Allen (1980), Bret (1999), Rita (2005), and Ike (2008).
3.3.3 Stillwater Elevations
The results of the ADCIRC model and JPM-OS provided 10-, 2-, 1-, and 0.2-
percent-annual-chance stillwater elevations which include wave setup effects.
Stillwater elevations are assigned at individual ADCIRC mesh nodes throughout
the Texas coast. Triangular Irregular Networks (TINs) and raster datasets were
built from these nodes for use in wave analysis and floodplain mapping.
An Independent Technical Review (ITR) was performed on the overall storm
surge study process. This review process was performed in accordance with
USACE regulations. The ITR team was composed of experts in the fields of
coastal engineering and science, and was engaged throughout the study.
Appendix K of Flood Insurance Study: Coastal Counties, Texas Intermediate
Submission 2 – Scoping and Data Review includes all comments received from
the ITR panel, as well as responses to those comments (Reference 40).
3.3.4 Wave Height Analysis
FEMA has defined coastal high hazard zones as coastlines subject to significant
wave affects (defined by wave heights that equal or exceed 3-feet). To determine
overland wave heights, and define the coastal high hazard zones, Taylor
Engineering applied the 1-percent-annual-chance-stillwater elevations, LiDAR
topographic data, and land-use data to model the waves as they propagate
landward of the shoreline.
Figure 1 shows a profile for a typical transect, illustrating the effects of energy
dissipation and regeneration on a wave as it moves inland. This figure shows the
wave crest elevations being decreased by obstructions, such as buildings,
vegetation, and rising ground elevations, and being increased by open,
unobstructed wind fetches. Figure 1 also illustrates the relationship between the
local stillwater elevation, the ground profile, and the location of the V/A
boundary. This inland limit of the coastal high hazard area is delineated to
ensure that adequate insurance rates apply and appropriate construction standards
are imposed, should local agencies permit building in this coastal high hazard
area.
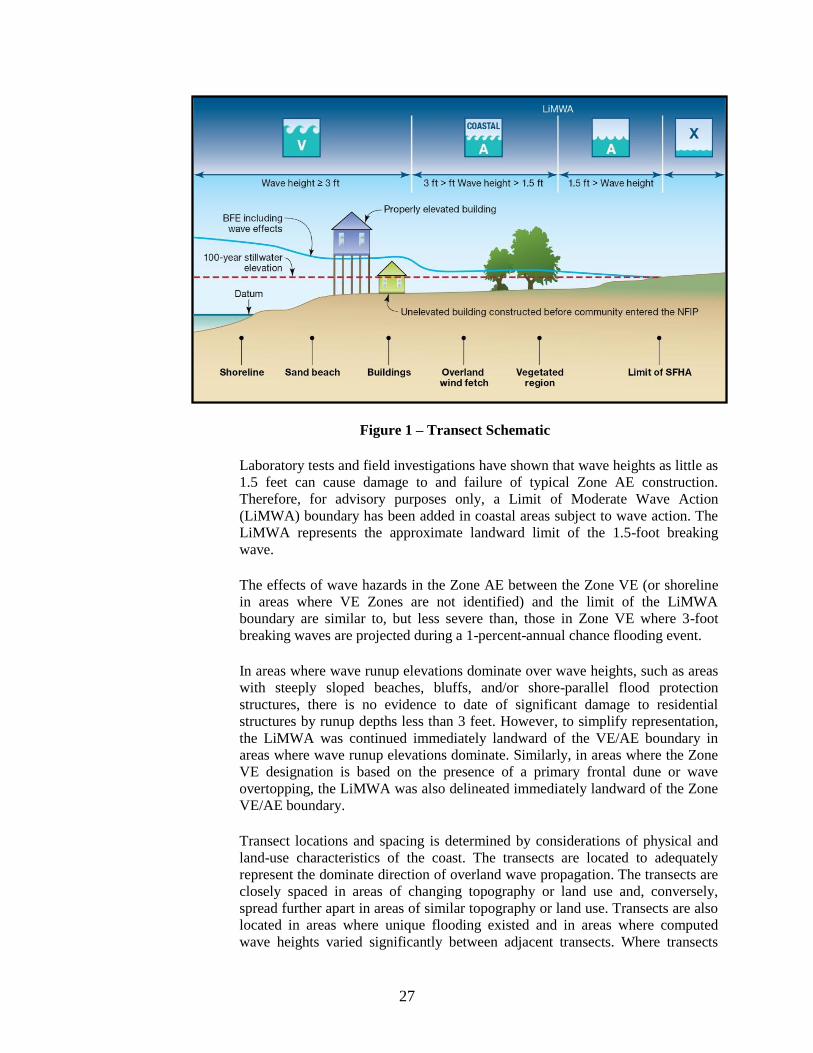
27
Figure 1 – Transect Schematic
Laboratory tests and field investigations have shown that wave heights as little as
1.5 feet can cause damage to and failure of typical Zone AE construction.
Therefore, for advisory purposes only, a Limit of Moderate Wave Action
(LiMWA) boundary has been added in coastal areas subject to wave action. The
LiMWA represents the approximate landward limit of the 1.5-foot breaking
wave.
The effects of wave hazards in the Zone AE between the Zone VE (or shoreline
in areas where VE Zones are not identified) and the limit of the LiMWA
boundary are similar to, but less severe than, those in Zone VE where 3-foot
breaking waves are projected during a 1-percent-annual chance flooding event.
In areas where wave runup elevations dominate over wave heights, such as areas
with steeply sloped beaches, bluffs, and/or shore-parallel flood protection
structures, there is no evidence to date of significant damage to residential
structures by runup depths less than 3 feet. However, to simplify representation,
the LiMWA was continued immediately landward of the VE/AE boundary in
areas where wave runup elevations dominate. Similarly, in areas where the Zone
VE designation is based on the presence of a primary frontal dune or wave
overtopping, the LiMWA was also delineated immediately landward of the Zone
VE/AE boundary.
Transect locations and spacing is determined by considerations of physical and
land-use characteristics of the coast. The transects are located to adequately
represent the dominate direction of overland wave propagation. The transects are
closely spaced in areas of changing topography or land use and, conversely,
spread further apart in areas of similar topography or land use. Transects are also
located in areas where unique flooding existed and in areas where computed
wave heights varied significantly between adjacent transects. Where transects
28
crossed, the largest wave height value was delineated on the FIRM panel.
Transects are shown on the respective FIRM panels for the county.
This study applied topographic data from LiDAR data collected by FEMA in
2006 under a subcontract with Sanborn (Reference 35). In 2011 NOAA modified
and updated some areas of the data (Reference 36). The topographic data is
referenced to NAVD88.
The combination of three land use data sources comprised the data used to
identify areas of vegetative cover (forest, marsh grass, etc), buildings (density
and spacing), and open water. The three sources are: aerial photos from 2010
(Reference 36), U.S. Fish and Wildlife Service, National Wetland Inventory,
2006 (Reference 37), and NOAA Coastal Change Analysis Program (C-CAP)
data, 2006 (Reference 38). In addition, Taylor Engineering collected detailed
information about the features, such as building types, density, and vegetation
types during a ground field reconnaissance.
No storm-induced erosion analysis was performed for this study. Primary frontal
dune mapping was not applied.
Wave height calculation used in this study follows the methodology described in
the Atlantic Ocean and Gulf of Mexico Coastal Guidelines Update, 2007.
Calculations of overland wave height propagation, using WHAFIS 4.0, included
both the 1- and 0.2-percent-annual-chance events. The 0.2-percent wave height
results are not included on the FIRMs but are provided as wave-transect profiles
in Exhibit 2 of the FIS.
Each transect calculates wave heights based on stillwater elevations (from the 1-
percent surge modeling), ground elevations at each station along a transect, and
land-use properties. Wave setup was not calculated separately because wave
setup was included in the base stillwater elevations from the storm surge
analysis.
This study used default WHAFIS initial wave conditions based on fetch for each
transect. Open water transects (primarily along the open Gulf) used the maximum
24 miles of open fetch and interior transects used measured fetch lengths
(Reference 34).
Figure 2 on page 41, “Transect Location Map” shows the transect layout used for
the overland wave analyses. Along each transect, wave envelopes were computed
considering the combined effects of changes in ground elevation, stillwater
surface elevation (including wave setup), vegetation, and physical features.
Between transects, elevations were interpolated using LiDAR topographic data,
land-use and land-cover data, and engineering judgment to determine the aerial
extent of flooding. The transect data for each transect in the county, including
the flood hazard zone, base flood elevations, transect location description, 10-,
2-, 1-, and 0.2-percent annual chance stillwater elevations at the start of the
transect and the range found along the length of the transect is provided in Table
4.

29
Taylor Engineering applied the Technical Advisory Committee for Water
Retaining Structures (TAW) method and Coastal Engineering Design & Analysis
System (ACES) to calculate runup for transects 30, 33, 36, 77, 80, 81, 83, 85, 87,
108, 109, 110, and 111 along the Texas City Hurricane Protection Levee;
transects 100 and 101 for the Texas City Rainwater Levee; and transects 31, 35,
38, and 40 for the Galveston Seawall. For non-levee areas affected by runup,
transects 93, 97, 103, 104, 105, 106, 107, the TAW method was used. The 2%
runup height was added to the stillwater elevation to compute a BFE. If the runup
BFE exceeded the WHAFIS computed BFE, the map was adjusted to reflect the
runup elevation (Reference 32 and 33).
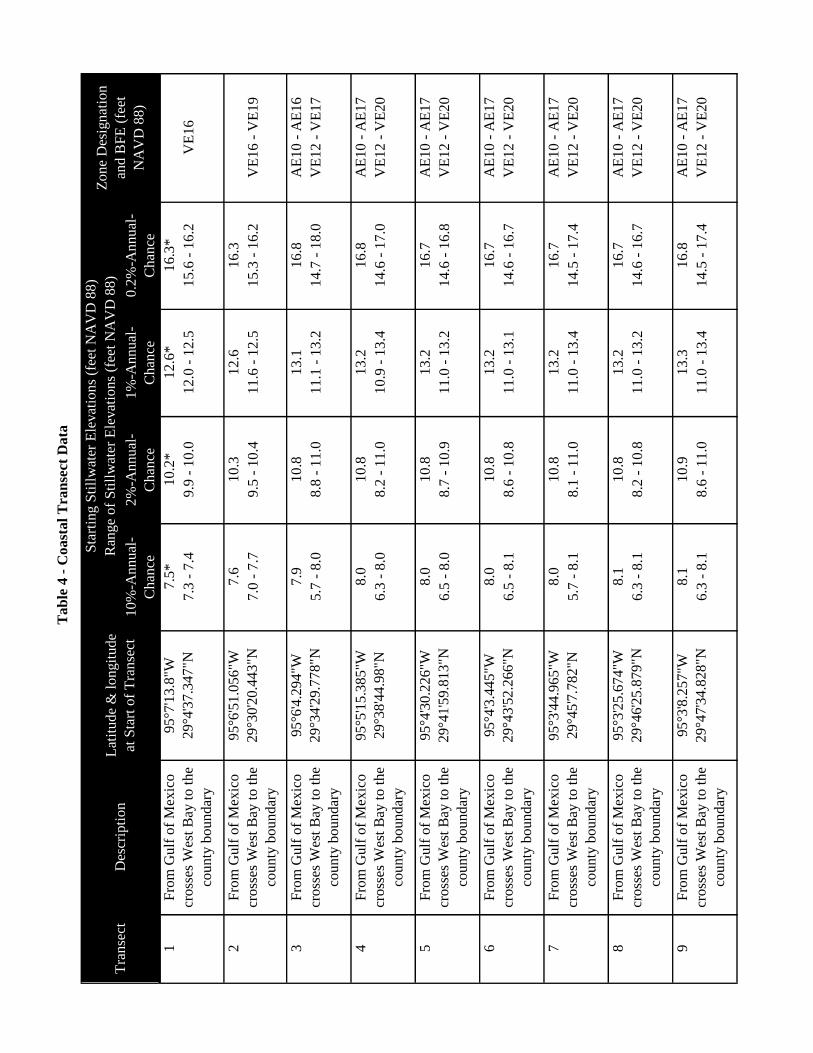
Tab
le 4
- C
oast
al
Tra
nse
ct D
ata
10%
-Annual
-
Chan
ce
2%
-Annual
-
Chan
ce
1%
-An
nu
al-
Ch
ance
0.2
%-A
nn
ual
-
Ch
ance
7.5
*10.2
*12
.6*
16
.3*
7.3
- 7
.49.9
- 1
0.0
12.0
- 1
2.5
15
.6 -
16
.2V
E1
6
7.6
10.3
12
.61
6.3
7.0
- 7
.79.5
- 1
0.4
11.6
- 1
2.5
15
.3 -
16
.2V
E1
6 -
VE
19
7.9
10.8
13
.11
6.8
AE
10
- A
E1
6
5.7
- 8
.08.8
- 1
1.0
11.1
- 1
3.2
14
.7 -
18
.0V
E1
2 -
VE
17
8.0
10.8
13
.21
6.8
AE
10
- A
E1
7
6.3
- 8
.08.2
- 1
1.0
10.9
- 1
3.4
14
.6 -
17
.0V
E1
2 -
VE
20
8.0
10.8
13
.21
6.7
AE
10
- A
E1
7
6.5
- 8
.08.7
- 1
0.9
11.0
- 1
3.2
14
.6 -
16
.8V
E1
2 -
VE
20
8.0
10.8
13
.21
6.7
AE
10
- A
E1
7
6.5
- 8
.18.6
- 1
0.8
11.0
- 1
3.1
14
.6 -
16
.7V
E1
2 -
VE
20
8.0
10.8
13
.21
6.7
AE
10
- A
E1
7
5.7
- 8
.18.1
- 1
1.0
11.0
- 1
3.4
14
.5 -
17
.4V
E1
2 -
VE
20
8.1
10.8
13
.21
6.7
AE
10
- A
E1
7
6.3
- 8
.18.2
- 1
0.8
11.0
- 1
3.2
14
.6 -
16
.7V
E1
2 -
VE
20
8.1
10.9
13
.31
6.8
AE
10
- A
E1
7
6.3
- 8
.18.6
- 1
1.0
11.0
- 1
3.4
14
.5 -
17
.4V
E1
2 -
VE
20
Fro
m G
ulf
of
Mex
ico
cross
es W
est
Bay
to
th
e
cou
nty
bo
un
dar
y
95
°3'2
5.6
74"W
29
°46
'25.8
79"N
5F
rom
Gu
lf o
f M
exic
o
cross
es W
est
Bay
to
th
e
cou
nty
bo
un
dar
y
95
°4'3
0.2
26"W
29
°41
'59.8
13"N
Sta
rtin
g S
till
wat
er E
levat
ions
(fee
t N
AV
D 8
8)
Zo
ne
Des
ign
atio
n
and
BF
E (
feet
NA
VD
88
)
Ran
ge
of
Sti
llw
ater
Ele
vat
ions
(fee
t N
AV
D 8
8)
3F
rom
Gu
lf o
f M
exic
o
cross
es W
est
Bay
to
th
e
cou
nty
bo
un
dar
y
95
°6'4
.294"W
29
°34
'29.7
78"N
Fro
m G
ulf
of
Mex
ico
cross
es W
est
Bay
to
th
e
cou
nty
bo
un
dar
y
95
°6'5
1.0
56"W
29
°30
'20.4
43"N
86
Tra
nse
ctD
escr
ipti
on
Lat
itu
de
& l
ongit
ude
at S
tart
of
Tra
nse
ct
9F
rom
Gu
lf o
f M
exic
o
cross
es W
est
Bay
to
th
e
cou
nty
bo
un
dar
y
95
°3'8
.257"W
29
°47
'34.8
28"N
7F
rom
Gu
lf o
f M
exic
o
cross
es W
est
Bay
to
th
e
cou
nty
bo
un
dar
y
95
°3'4
4.9
65"W
29
°45'7
.782"N
1F
rom
Gu
lf o
f M
exic
o
cross
es W
est
Bay
to
th
e
cou
nty
bo
un
dar
y
95
°7'1
3.8
"W
29
°4'3
7.3
47"N
2 4F
rom
Gu
lf o
f M
exic
o
cross
es W
est
Bay
to
th
e
cou
nty
bo
un
dar
y
95
°5'1
5.3
85"W
29
°38'4
4.9
8"N
Fro
m G
ulf
of
Mex
ico
cross
es W
est
Bay
to
th
e
cou
nty
bo
un
dar
y
95
°4'3
.445"W
29
°43
'52.2
66"N

Tab
le 4
- C
oast
al
Tra
nse
ct D
ata
(C
on
tin
ued
)
10%
-Annual
-
Chan
ce
2%
-Annual
-
Chan
ce
1%
-An
nu
al-
Ch
ance
0.2
%-A
nn
ual
-
Ch
ance
Sta
rtin
g S
till
wat
er E
levat
ions
(fee
t N
AV
D 8
8)
Zo
ne
Des
ign
atio
n
and
BF
E (
feet
NA
VD
88
)
Ran
ge
of
Sti
llw
ater
Ele
vat
ions
(fee
t N
AV
D 8
8)
Tra
nse
ctD
escr
ipti
on
Lat
itu
de
& l
ongit
ude
at S
tart
of
Tra
nse
ct
1F
rom
Gu
lf o
f M
exic
o
cross
es W
est
Bay
to
th
e
cou
nty
bo
un
dar
y
95
°7'1
3.8
"W
29
°4'3
7.3
47"N
8.1
10.8
13
.31
6.8
AE
10
- A
E1
7
6.5
- 8
.18.6
- 1
0.9
11.0
- 1
3.3
14
.5 -
16
.8V
E1
2 -
VE
20
8.1
10.9
13
.41
6.8
AE
10
- A
E1
7
6.4
- 8
.17.8
- 1
0.9
10.2
- 1
3.5
14
.4 -
17
.8V
E1
2 -
VE
20
8.2
10.9
13
.41
6.9
AE
10
- A
E1
7
4.0
- 8
.27.8
- 1
1.2
10.7
- 1
3.9
14
.3 -
19
.5V
E1
2 -
VE
20
8.2
10.8
13
.41
6.8
AE
10
- A
E1
7
6.2
- 8
.28.3
- 1
1.0
10.8
- 1
3.9
14
.4 -
19
.7V
E1
2 -
VE
20
8.2
10.8
13
.41
6.9
AE
10
- A
E1
7
6.4
- 8
.28.4
- 1
1.0
10.8
- 1
4.2
14
.4 -
20
.0V
E1
2 -
VE
20
8.3
10.8
13
.41
7.0
AE
10
- A
E1
7
6.1
- 8
.38.4
- 1
1.4
10.8
- 1
4.2
14
.4 -
20
.5V
E1
2 -
VE
20
8.3
10.8
13
.41
7.0
AE
13
- A
E1
6
6.2
- 8
.38.3
- 1
1.6
10.6
- 1
4.5
14
.4 -
18
.9V
E1
4 -
VE
19
8.3
10.7
13
.41
7.0
AE
13
- A
E1
6
6.4
- 8
.38.3
- 1
1.4
10.7
- 1
4.3
14
.4 -
18
.6V
E1
4 -
VE
19
8.3
10.7
13
.41
7.1
AE
11
- A
E1
6
6.6
- 8
.38.4
- 1
1.4
10.8
- 1
4.5
14
.4 -
19
.9V
E1
4 -
VE
19
16
Fro
m G
ulf
of
Mex
ico
cross
es W
est
Bay
an
d
exte
nd
s in
lan
d
94
°59
'7.9
94"W
29
°62
'25.0
63"N
17
Fro
m G
ulf
of
Mex
ico
cross
es W
est
Bay
an
d
exte
nd
s in
lan
d
94
°58
'42.9
5"W
29
°63
'54.0
53"N
18
Fro
m G
ulf
of
Mex
ico
cross
es W
est
Bay
an
d
exte
nd
s in
lan
d
94
°58'2
2.2
45"W
29
°65
'11.4
83"N
13
Fro
m G
ulf
of
Mex
ico
cross
es W
est
Bay
an
d
exte
nd
s in
lan
d
95
°1'5
.844"W
29
°55
'10.1
53"N
14
95
°0'2
2.5
21"W
29
°57
'49.8
89"N
Fro
m G
ulf
of
Mex
ico
cross
es W
est
Bay
an
d
exte
nd
s in
lan
d
15
Fro
m G
ulf
of
Mex
ico
cross
es W
est
Bay
an
d
exte
nd
s in
lan
d
94
°59'3
5.6
07"W
29
°60
'43.1
52"N
12
Fro
m G
ulf
of
Mex
ico
cross
es W
est
Bay
to
th
e
cou
nty
bo
un
dar
y
95
°1'3
3.9
37"W
29
°53
'28.9
75"N
10
11
Fro
m G
ulf
of
Mex
ico
cross
es W
est
Bay
to
th
e
cou
nty
bo
un
dar
y
95
°2'6
.542"W
29
°51
'29.3
88"N
Fro
m G
ulf
of
Mex
ico
cross
es W
est
Bay
to
th
e
cou
nty
bo
un
dar
y
95
°2'3
4.6
62"W
29
°49
'40.2
72"N

Tab
le 4
- C
oast
al
Tra
nse
ct D
ata
(C
on
tin
ued
)
10%
-Annual
-
Chan
ce
2%
-Annual
-
Chan
ce
1%
-An
nu
al-
Ch
ance
0.2
%-A
nn
ual
-
Ch
ance
Sta
rtin
g S
till
wat
er E
levat
ions
(fee
t N
AV
D 8
8)
Zo
ne
Des
ign
atio
n
and
BF
E (
feet
NA
VD
88
)
Ran
ge
of
Sti
llw
ater
Ele
vat
ions
(fee
t N
AV
D 8
8)
Tra
nse
ctD
escr
ipti
on
Lat
itu
de
& l
ongit
ude
at S
tart
of
Tra
nse
ct
1F
rom
Gu
lf o
f M
exic
o
cross
es W
est
Bay
to
th
e
cou
nty
bo
un
dar
y
95
°7'1
3.8
"W
29
°4'3
7.3
47"N
8.3
10.7
13
.41
7.1
AE
13
- A
E1
6
6.3
- 8
.38.4
- 1
1.2
10.7
- 1
4.3
14
.4 -
20
.0V
E1
4 -
VE
19
8.3
10.7
13
.41
7.1
AE
10
- A
E1
7
6.3
- 8
.48.3
- 1
1.3
10.6
- 1
4.8
14
.4 -
20
.2V
E1
2 -
VE
20
8.3
10.6
13
.41
7.2
AE
12
- A
E1
6
6.4
- 8
.37.6
- 1
1.0
10.7
- 1
4.6
14
.4 -
20
.3V
E1
3 -
VE
19
8.3
10.5
13
.41
7.3
AE
12
- A
E1
6
6.3
- 8
.38.3
- 1
1.1
10.8
- 1
4.8
14
.6 -
20
.7V
E1
3 -
VE
19
8.3
10.5
13
.41
7.3
AE
10
- A
E1
7
6.4
- 8
.38.4
- 1
1.4
10.6
- 1
4.8
14
.5 -
20
.7V
E1
2 -
VE
20
8.3
10.5
13
.41
7.3
AE
12
- A
E1
7
6.0
- 8
.38.1
- 1
1.7
10.8
- 1
5.1
14
.7 -
20
.2V
E1
4 -
VE
19
8.3
10.4
13
.41
7.4
AE
12
- A
E1
7
5.9
- 8
.38.0
- 1
1.2
10.7
- 1
4.9
14
.7 -
20
.0V
E1
4 -
VE
19
8.3
10.4
13
.41
7.5
AE
10
- A
E1
7
6.1
- 8
.38.2
- 1
1.0
10.7
- 1
4.6
14
.7 -
20
.6V
E1
2 -
VE
20
8.3
10.3
13
.31
7.5
AE
10
- A
E1
7
6.4
- 8
.48.6
- 1
1.4
10.8
- 1
5.2
14
.7 -
20
.5V
E1
2 -
VE
20
25
Fro
m G
ulf
of
Mex
ico
cross
es W
est
Bay
an
d
exte
nd
s in
lan
d
94
°54'2
0.8
58"W
29
°79'2
9.8
1"N
26
Fro
m G
ulf
of
Mex
ico
cross
es W
est
Bay
an
d
exte
nd
s in
lan
d
94
°53'4
2.5
99"W
29
°81'5
1.1
1"N
27
Fro
m G
ulf
of
Mex
ico
cross
es W
est
Bay
an
d
exte
nd
s in
lan
d
94
°53
'0.8
73"W
29
°84
'22.0
79"N
22
Fro
m G
ulf
of
Mex
ico
cross
es W
est
Bay
an
d
exte
nd
s in
lan
d
94
°55'4
4.9
88"W
29
°74
'27.6
66"N
23
Fro
m G
ulf
of
Mex
ico
cross
es W
est
Bay
an
d
exte
nd
s in
lan
d
94
°55'3
2.0
57"W
29
°75
'16.8
93"N
24
Fro
m G
ulf
of
Mex
ico
cross
es W
est
Bay
an
d
exte
nd
s in
lan
d
94
°55
'3.2
12"W
29
°76
'58.1
11"N
19
Fro
m G
ulf
of
Mex
ico
cross
es W
est
Bay
an
d
exte
nd
s in
lan
d
94
°57
'51.4
2"W
29
°67'1
.958"N
20
Fro
m G
ulf
of
Mex
ico
cross
es W
est
Bay
an
d
exte
nd
s in
lan
d
94
°57'1
0.1
94"W
29
°69
'26.4
02"N
21
Fro
m G
ulf
of
Mex
ico
cross
es W
est
Bay
an
d
exte
nd
s in
lan
d
94
°56'1
9.1
06"W
29
°72
'25.3
72"N
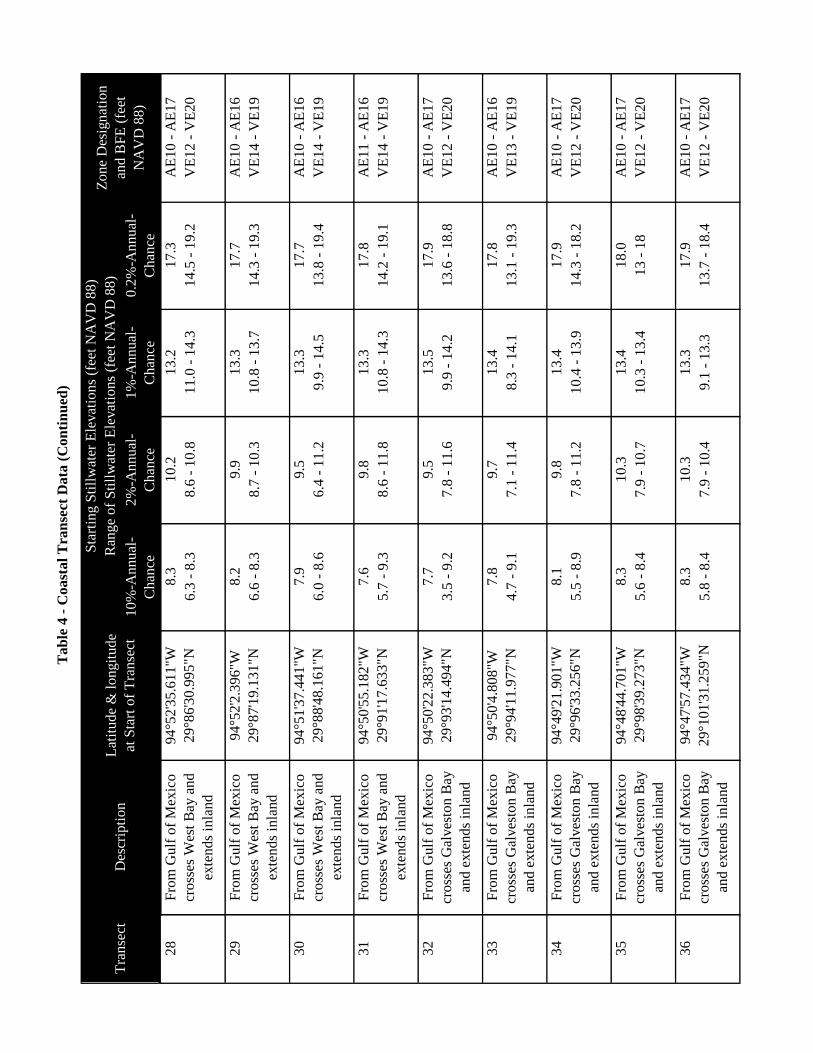
Tab
le 4
- C
oast
al
Tra
nse
ct D
ata
(C
on
tin
ued
)
10%
-Annual
-
Chan
ce
2%
-Annual
-
Chan
ce
1%
-An
nu
al-
Ch
ance
0.2
%-A
nn
ual
-
Ch
ance
Sta
rtin
g S
till
wat
er E
levat
ions
(fee
t N
AV
D 8
8)
Zo
ne
Des
ign
atio
n
and
BF
E (
feet
NA
VD
88
)
Ran
ge
of
Sti
llw
ater
Ele
vat
ions
(fee
t N
AV
D 8
8)
Tra
nse
ctD
escr
ipti
on
Lat
itu
de
& l
ongit
ude
at S
tart
of
Tra
nse
ct
1F
rom
Gu
lf o
f M
exic
o
cross
es W
est
Bay
to
th
e
cou
nty
bo
un
dar
y
95
°7'1
3.8
"W
29
°4'3
7.3
47"N
8.3
10.2
13
.21
7.3
AE
10
- A
E1
7
6.3
- 8
.38.6
- 1
0.8
11.0
- 1
4.3
14
.5 -
19
.2V
E1
2 -
VE
20
8.2
9.9
13
.31
7.7
AE
10
- A
E1
6
6.6
- 8
.38.7
- 1
0.3
10.8
- 1
3.7
14
.3 -
19
.3V
E1
4 -
VE
19
7.9
9.5
13
.31
7.7
AE
10
- A
E1
6
6.0
- 8
.66.4
- 1
1.2
9.9
- 1
4.5
13
.8 -
19
.4V
E1
4 -
VE
19
7.6
9.8
13
.31
7.8
AE
11
- A
E1
6
5.7
- 9
.38.6
- 1
1.8
10.8
- 1
4.3
14
.2 -
19
.1V
E1
4 -
VE
19
7.7
9.5
13
.51
7.9
AE
10
- A
E1
7
3.5
- 9
.27.8
- 1
1.6
9.9
- 1
4.2
13
.6 -
18
.8V
E1
2 -
VE
20
7.8
9.7
13
.41
7.8
AE
10
- A
E1
6
4.7
- 9
.17.1
- 1
1.4
8.3
- 1
4.1
13
.1 -
19
.3V
E1
3 -
VE
19
8.1
9.8
13
.41
7.9
AE
10
- A
E1
7
5.5
- 8
.97.8
- 1
1.2
10.4
- 1
3.9
14
.3 -
18
.2V
E1
2 -
VE
20
8.3
10.3
13
.41
8.0
AE
10
- A
E1
7
5.6
- 8
.47.9
- 1
0.7
10.3
- 1
3.4
13
- 1
8V
E1
2 -
VE
20
8.3
10.3
13
.31
7.9
AE
10
- A
E1
7
5.8
- 8
.47.9
- 1
0.4
9.1
- 1
3.3
13
.7 -
18
.4V
E1
2 -
VE
20
34
Fro
m G
ulf
of
Mex
ico
cross
es G
alves
ton
Bay
and
ex
ten
ds
inla
nd
94
°49'2
1.9
01"W
29
°96
'33.2
56"N
35
Fro
m G
ulf
of
Mex
ico
cross
es G
alves
ton
Bay
and
ex
ten
ds
inla
nd
94
°48'4
4.7
01"W
29
°98
'39.2
73"N
36
Fro
m G
ulf
of
Mex
ico
cross
es G
alves
ton
Bay
and
ex
ten
ds
inla
nd
94
°47'5
7.4
34"W
29
°10
1'3
1.2
59"N
31
Fro
m G
ulf
of
Mex
ico
cross
es W
est
Bay
an
d
exte
nd
s in
lan
d
94
°50'5
5.1
82"W
29
°91
'17.6
33"N
32
Fro
m G
ulf
of
Mex
ico
cross
es G
alves
ton
Bay
and
ex
ten
ds
inla
nd
94
°50'2
2.3
83"W
29
°93
'14.4
94"N
33
Fro
m G
ulf
of
Mex
ico
cross
es G
alves
ton
Bay
and
ex
ten
ds
inla
nd
94
°50
'4.8
08"W
29
°94
'11.9
77"N
28
Fro
m G
ulf
of
Mex
ico
cross
es W
est
Bay
an
d
exte
nd
s in
lan
d
94
°52'3
5.6
11"W
29
°86
'30.9
95"N
29
Fro
m G
ulf
of
Mex
ico
cross
es W
est
Bay
an
d
exte
nd
s in
lan
d
94
°52
'2.3
96"W
29
°87
'19.1
31"N
30
Fro
m G
ulf
of
Mex
ico
cross
es W
est
Bay
an
d
exte
nd
s in
lan
d
94
°51'3
7.4
41"W
29
°88
'48.1
61"N
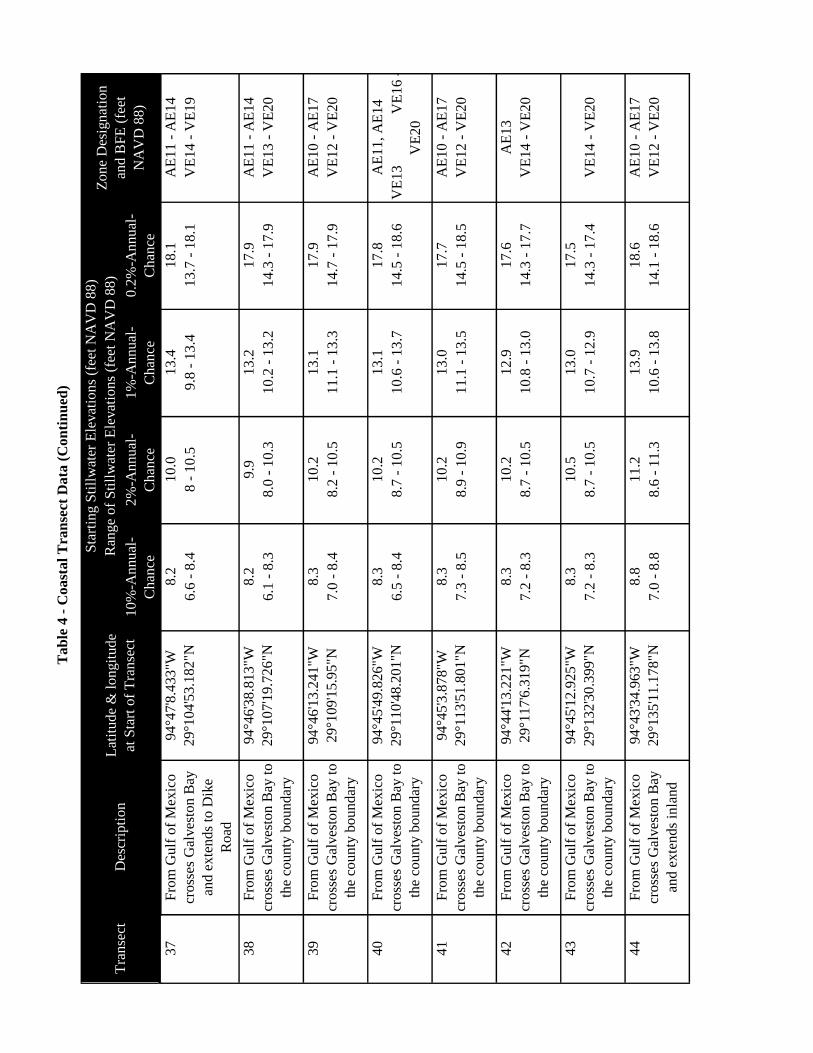
Tab
le 4
- C
oast
al
Tra
nse
ct D
ata
(C
on
tin
ued
)
10%
-Annual
-
Chan
ce
2%
-Annual
-
Chan
ce
1%
-An
nu
al-
Ch
ance
0.2
%-A
nn
ual
-
Ch
ance
Sta
rtin
g S
till
wat
er E
levat
ions
(fee
t N
AV
D 8
8)
Zo
ne
Des
ign
atio
n
and
BF
E (
feet
NA
VD
88
)
Ran
ge
of
Sti
llw
ater
Ele
vat
ions
(fee
t N
AV
D 8
8)
Tra
nse
ctD
escr
ipti
on
Lat
itu
de
& l
ongit
ude
at S
tart
of
Tra
nse
ct
1F
rom
Gu
lf o
f M
exic
o
cross
es W
est
Bay
to
th
e
cou
nty
bo
un
dar
y
95
°7'1
3.8
"W
29
°4'3
7.3
47"N
8.2
10.0
13
.41
8.1
AE
11
- A
E1
4
6.6
- 8
.48 -
10.5
9.8
- 1
3.4
13
.7 -
18
.1V
E1
4 -
VE
19
8.2
9.9
13
.21
7.9
AE
11
- A
E1
4
6.1
- 8
.38.0
- 1
0.3
10.2
- 1
3.2
14
.3 -
17
.9V
E1
3 -
VE
20
8.3
10.2
13
.11
7.9
AE
10
- A
E1
7
7.0
- 8
.48.2
- 1
0.5
11.1
- 1
3.3
14
.7 -
17
.9V
E1
2 -
VE
20
8.3
10.2
13
.11
7.8
AE
11
, A
E1
4
6.5
- 8
.48.7
- 1
0.5
10.6
- 1
3.7
14
.5 -
18
.6V
E1
3
VE
16
-
VE
20
8.3
10.2
13
.01
7.7
AE
10
- A
E1
7
7.3
- 8
.58.9
- 1
0.9
11.1
- 1
3.5
14
.5 -
18
.5V
E1
2 -
VE
20
8.3
10.2
12
.91
7.6
AE
13
7.2
- 8
.38.7
- 1
0.5
10.8
- 1
3.0
14
.3 -
17
.7V
E1
4 -
VE
20
8.3
10.5
13
.01
7.5
7.2
- 8
.38.7
- 1
0.5
10.7
- 1
2.9
14
.3 -
17
.4V
E1
4 -
VE
20
8.8
11.2
13
.91
8.6
AE
10
- A
E1
7
7.0
- 8
.88.6
- 1
1.3
10.6
- 1
3.8
14
.1 -
18
.6V
E1
2 -
VE
20
43
Fro
m G
ulf
of
Mex
ico
cross
es G
alves
ton
Bay
to
the
cou
nty
bo
un
dar
y
94
°45'1
2.9
25"W
29
°13
2'3
0.3
99"N
44
Fro
m G
ulf
of
Mex
ico
cross
es G
alves
ton
Bay
and
ex
ten
ds
inla
nd
94
°43'3
4.9
63"W
29
°13
5'1
1.1
78"N
40
Fro
m G
ulf
of
Mex
ico
cross
es G
alves
ton
Bay
to
the
cou
nty
bo
un
dar
y
94
°45'4
9.8
26"W
29
°11
0'4
8.2
01"N
41
Fro
m G
ulf
of
Mex
ico
cross
es G
alves
ton
Bay
to
the
cou
nty
bo
un
dar
y
94
°45
'3.8
78"W
29
°11
3'5
1.8
01"N
42
Fro
m G
ulf
of
Mex
ico
cross
es G
alves
ton
Bay
to
the
cou
nty
bo
un
dar
y
94
°44'1
3.2
21"W
29
°11
7'6
.319"N
37
Fro
m G
ulf
of
Mex
ico
cross
es G
alves
ton
Bay
and e
xte
nd
s to
Dik
e
Ro
ad
94
°47
'8.4
33"W
29
°10
4'5
3.1
82"N
38
Fro
m G
ulf
of
Mex
ico
cross
es G
alves
ton
Bay
to
the
cou
nty
bo
un
dar
y
94
°46'3
8.8
13"W
29
°10
7'1
9.7
26"N
39
Fro
m G
ulf
of
Mex
ico
cross
es G
alves
ton
Bay
to
the
cou
nty
bo
un
dar
y
94
°46'1
3.2
41"W
29
°10
9'1
5.9
5"N

Tab
le 4
- C
oast
al
Tra
nse
ct D
ata
(C
on
tin
ued
)
10%
-Annual
-
Chan
ce
2%
-Annual
-
Chan
ce
1%
-An
nu
al-
Ch
ance
0.2
%-A
nn
ual
-
Ch
ance
Sta
rtin
g S
till
wat
er E
levat
ions
(fee
t N
AV
D 8
8)
Zo
ne
Des
ign
atio
n
and
BF
E (
feet
NA
VD
88
)
Ran
ge
of
Sti
llw
ater
Ele
vat
ions
(fee
t N
AV
D 8
8)
Tra
nse
ctD
escr
ipti
on
Lat
itu
de
& l
ongit
ude
at S
tart
of
Tra
nse
ct
1F
rom
Gu
lf o
f M
exic
o
cross
es W
est
Bay
to
th
e
cou
nty
bo
un
dar
y
95
°7'1
3.8
"W
29
°4'3
7.3
47"N
8.8
11.3
13
.91
8.8
AE
12
- A
E1
5
6.8
- 8
.98.2
- 1
1.5
9.9
- 1
41
3.4
- 1
8.8
VE
12
- V
E2
0
8.7
11.3
13
.91
8.8
AE
12
- A
E1
5
6.0
- 9
.07.4
- 1
1.4
9.3
- 1
3.9
13
.1 -
18
.8V
E1
2 -
VE
20
8.7
11.2
13
.91
8.7
AE
10
- A
E1
7
6.1
- 8
.87.6
- 1
1.5
9.2
- 1
4.2
12
.8 -
19
.3V
E1
2 -
VE
20
8.7
11.2
13
.81
8.6
AE
11
- A
E1
3
5.3
- 9
.07.6
- 1
1.4
8.9
- 1
3.8
12
.7 -
18
.6V
E1
2 -
VE
19
8.6
11.2
13
.81
8.6
AE
10
- A
E1
7
5.4
- 8
.87.2
- 1
1.3
9.3
- 1
4.0
12
.5 -
18
.9V
E1
2 -
VE
20
8.6
11.2
13
.71
8.5
AE
11
- A
E1
3
5.3
- 8
.77.7
- 1
1.3
7.7
- 1
3.9
12
.5 -
18
.9V
E1
2 -
VE
19
8.6
11.1
13
.71
8.3
AE
10
5.6
- 8
.67.6
- 1
1.2
9.1
- 1
3.6
12
.5 -
18
.3V
E1
2 -
VE
19
8.6
11.1
13
.71
8.3
AE
10
- A
E1
7
5.4
- 8
.67.6
- 1
1.3
9.1
- 1
3.7
12
.4 -
18
.3V
E1
2 -
VE
20
8.5
11.1
13
.61
8.1
AE
10
, A
E1
2-A
E1
5
5.1
- 8
.66.3
- 1
1.3
8.7
- 1
3.8
12
.0 -
18
.7V
E1
2 -
VE
19
52
Fro
m G
ulf
of
Mex
ico
cross
es E
ast
Bay
to
th
e
cou
nty
bo
un
dar
y
94
°39'3
7.2
73"W
29
°15
7'1
2.4
98"N
53
Fro
m G
ulf
of
Mex
ico
cross
es E
ast
Bay
to
th
e
cou
nty
bo
un
dar
y
94
°38'3
9.5
48"W
29
°16
0'1
6.2
27"N
49
Fro
m G
ulf
of
Mex
ico
cross
es G
alves
ton
Bay
to
the
cou
nty
bo
un
dar
y
94
°41'3
1.0
21"W
29
°15
0'0
.801"N
50
Fro
m G
ulf
of
Mex
ico
cross
es E
ast
Bay
to
th
e
cou
nty
bo
un
dar
y
94
°40'5
5.1
31"W
29
°15
2'3
5.0
92"N
51
Fro
m G
ulf
of
Mex
ico
cross
es E
ast
Bay
to
th
e
cou
nty
bo
un
dar
y
94
°40
'4.6
77"W
29
°15
5'4
1.4
46"N
46
Fro
m G
ulf
of
Mex
ico
cross
es G
alves
ton
Bay
to
the
cou
nty
bo
un
dar
y
94
°42'5
3.6
43"W
29
°14
1'5
2.7
1"N
47
Fro
m G
ulf
of
Mex
ico
cross
es G
alves
ton
Bay
to
the
cou
nty
bo
un
dar
y
94
°42'2
1.6
45"W
29
°14
5'3
6.9
75"N
48
Fro
m G
ulf
of
Mex
ico
cross
es G
alves
ton
Bay
to
the
cou
nty
bo
un
dar
y
94
°41'5
4.9
53"W
29
°14
8'0
.309"N
45
Fro
m G
ulf
of
Mex
ico
cross
es G
alves
ton
Bay
and
ex
ten
ds
inla
nd
94
°43'1
4.8
82"W
29
°13
8'4
6.3
66"N
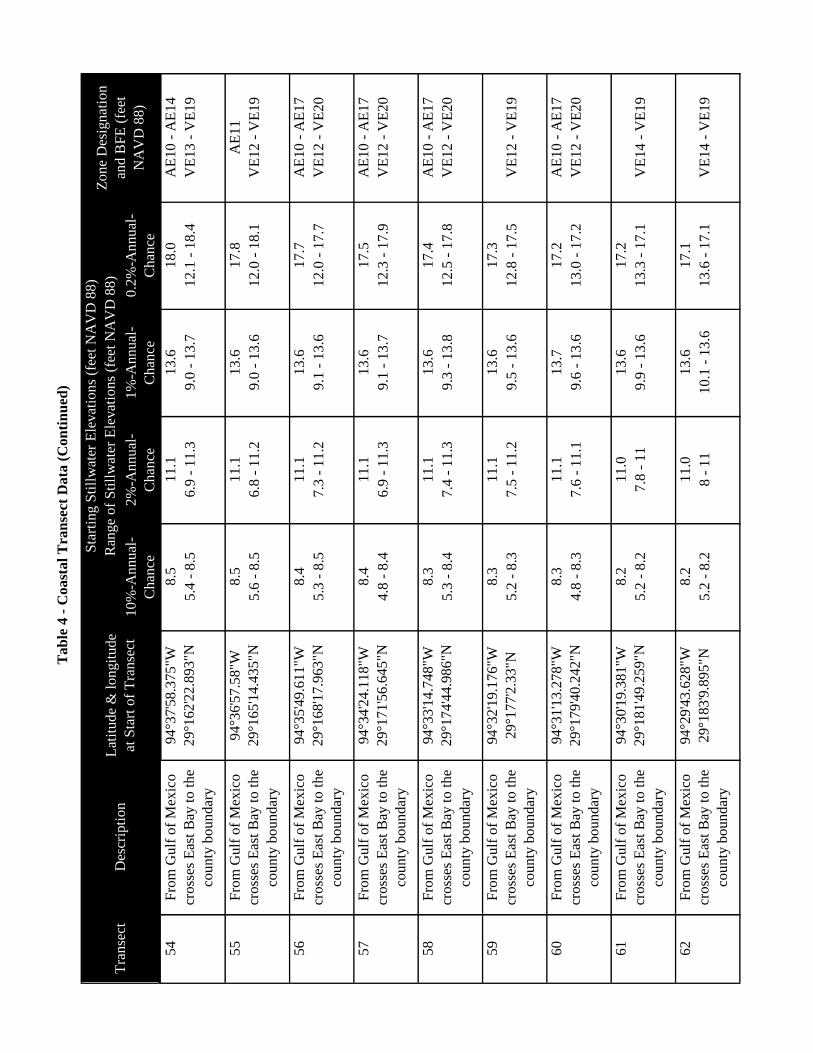
Tab
le 4
- C
oast
al
Tra
nse
ct D
ata
(C
on
tin
ued
)
10%
-Annual
-
Chan
ce
2%
-Annual
-
Chan
ce
1%
-An
nu
al-
Ch
ance
0.2
%-A
nn
ual
-
Ch
ance
Sta
rtin
g S
till
wat
er E
levat
ions
(fee
t N
AV
D 8
8)
Zo
ne
Des
ign
atio
n
and
BF
E (
feet
NA
VD
88
)
Ran
ge
of
Sti
llw
ater
Ele
vat
ions
(fee
t N
AV
D 8
8)
Tra
nse
ctD
escr
ipti
on
Lat
itu
de
& l
ongit
ude
at S
tart
of
Tra
nse
ct
1F
rom
Gu
lf o
f M
exic
o
cross
es W
est
Bay
to
th
e
cou
nty
bo
un
dar
y
95
°7'1
3.8
"W
29
°4'3
7.3
47"N
8.5
11.1
13
.61
8.0
AE
10
- A
E1
4
5.4
- 8
.56.9
- 1
1.3
9.0
- 1
3.7
12
.1 -
18
.4V
E1
3 -
VE
19
8.5
11.1
13
.61
7.8
AE
11
5.6
- 8
.56.8
- 1
1.2
9.0
- 1
3.6
12
.0 -
18
.1V
E1
2 -
VE
19
8.4
11.1
13
.61
7.7
AE
10
- A
E1
7
5.3
- 8
.57.3
- 1
1.2
9.1
- 1
3.6
12
.0 -
17
.7V
E1
2 -
VE
20
8.4
11.1
13
.61
7.5
AE
10
- A
E1
7
4.8
- 8
.46.9
- 1
1.3
9.1
- 1
3.7
12
.3 -
17
.9V
E1
2 -
VE
20
8.3
11.1
13
.61
7.4
AE
10
- A
E1
7
5.3
- 8
.47.4
- 1
1.3
9.3
- 1
3.8
12
.5 -
17
.8V
E1
2 -
VE
20
8.3
11.1
13
.61
7.3
5.2
- 8
.37.5
- 1
1.2
9.5
- 1
3.6
12
.8 -
17
.5V
E1
2 -
VE
19
8.3
11.1
13
.71
7.2
AE
10
- A
E1
7
4.8
- 8
.37.6
- 1
1.1
9.6
- 1
3.6
13
.0 -
17
.2V
E1
2 -
VE
20
8.2
11.0
13
.61
7.2
5.2
- 8
.27.8
- 1
19.9
- 1
3.6
13
.3 -
17
.1V
E1
4 -
VE
19
8.2
11.0
13
.61
7.1
5.2
- 8
.28 -
11
10.1
- 1
3.6
13
.6 -
17
.1V
E1
4 -
VE
19
61
Fro
m G
ulf
of
Mex
ico
cross
es E
ast
Bay
to
th
e
cou
nty
bo
un
dar
y
94
°30'1
9.3
81"W
29
°18
1'4
9.2
59"N
62
Fro
m G
ulf
of
Mex
ico
cross
es E
ast
Bay
to
th
e
cou
nty
bo
un
dar
y
94
°29'4
3.6
28"W
29
°18
3'9
.895"N
58
Fro
m G
ulf
of
Mex
ico
cross
es E
ast
Bay
to
th
e
cou
nty
bo
un
dar
y
94
°33'1
4.7
48"W
29
°17
4'4
4.9
86"N
59
Fro
m G
ulf
of
Mex
ico
cross
es E
ast
Bay
to
th
e
cou
nty
bo
un
dar
y
94
°32'1
9.1
76"W
29
°177'2
.33"N
60
Fro
m G
ulf
of
Mex
ico
cross
es E
ast
Bay
to
th
e
cou
nty
bo
un
dar
y
94
°31'1
3.2
78"W
29
°17
9'4
0.2
42"N
55
Fro
m G
ulf
of
Mex
ico
cross
es E
ast
Bay
to
th
e
cou
nty
bo
un
dar
y
94
°36
'57.5
8"W
29
°16
5'1
4.4
35"N
56
Fro
m G
ulf
of
Mex
ico
cross
es E
ast
Bay
to
th
e
cou
nty
bo
un
dar
y
94
°35'4
9.6
11"W
29
°16
8'1
7.9
63"N
57
Fro
m G
ulf
of
Mex
ico
cross
es E
ast
Bay
to
th
e
cou
nty
bo
un
dar
y
94
°34'2
4.1
18"W
29
°17
1'5
6.6
45"N
54
Fro
m G
ulf
of
Mex
ico
cross
es E
ast
Bay
to
th
e
cou
nty
bo
un
dar
y
94
°37'5
8.3
75"W
29
°16
2'2
2.8
93"N
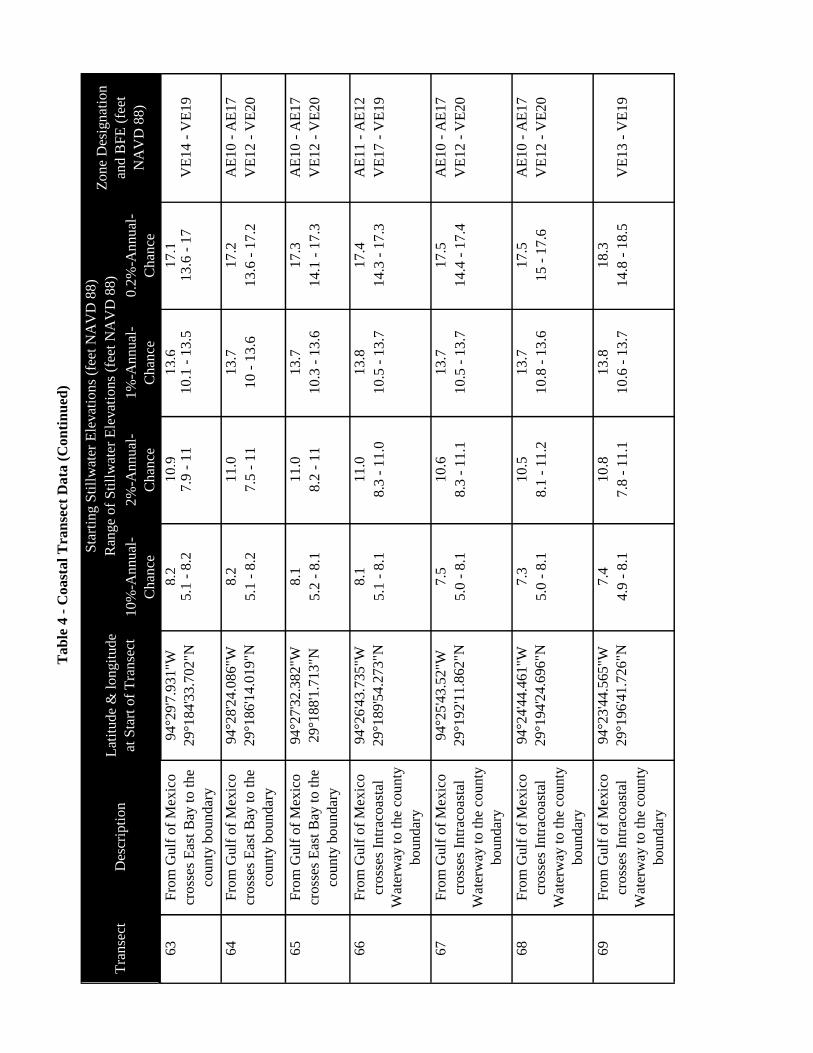
Tab
le 4
- C
oast
al
Tra
nse
ct D
ata
(C
on
tin
ued
)
10%
-Annual
-
Chan
ce
2%
-Annual
-
Chan
ce
1%
-An
nu
al-
Ch
ance
0.2
%-A
nn
ual
-
Ch
ance
Sta
rtin
g S
till
wat
er E
levat
ions
(fee
t N
AV
D 8
8)
Zo
ne
Des
ign
atio
n
and
BF
E (
feet
NA
VD
88
)
Ran
ge
of
Sti
llw
ater
Ele
vat
ions
(fee
t N
AV
D 8
8)
Tra
nse
ctD
escr
ipti
on
Lat
itu
de
& l
ongit
ude
at S
tart
of
Tra
nse
ct
1F
rom
Gu
lf o
f M
exic
o
cross
es W
est
Bay
to
th
e
cou
nty
bo
un
dar
y
95
°7'1
3.8
"W
29
°4'3
7.3
47"N
8.2
10.9
13
.61
7.1
5.1
- 8
.27.9
- 1
110.1
- 1
3.5
13
.6 -
17
VE
14
- V
E1
9
8.2
11.0
13
.71
7.2
AE
10
- A
E1
7
5.1
- 8
.27.5
- 1
110 -
13
.61
3.6
- 1
7.2
VE
12
- V
E2
0
8.1
11.0
13
.71
7.3
AE
10
- A
E1
7
5.2
- 8
.18.2
- 1
110.3
- 1
3.6
14
.1 -
17
.3V
E1
2 -
VE
20
8.1
11.0
13
.81
7.4
AE
11
- A
E1
2
5.1
- 8
.18.3
- 1
1.0
10.5
- 1
3.7
14
.3 -
17
.3V
E1
7 -
VE
19
7.5
10.6
13
.71
7.5
AE
10
- A
E1
7
5.0
- 8
.18.3
- 1
1.1
10.5
- 1
3.7
14
.4 -
17
.4V
E1
2 -
VE
20
7.3
10.5
13
.71
7.5
AE
10
- A
E1
7
5.0
- 8
.18.1
- 1
1.2
10.8
- 1
3.6
15
- 1
7.6
VE
12
- V
E2
0
7.4
10.8
13
.81
8.3
4.9
- 8
.17.8
- 1
1.1
10.6
- 1
3.7
14
.8 -
18
.5V
E1
3 -
VE
19
69
Fro
m G
ulf
of
Mex
ico
cro
sses
In
trac
oas
tal
Wat
erw
ay t
o t
he
cou
nty
bo
un
dar
y
94
°23'4
4.5
65"W
29
°19
6'4
1.7
26"N
67
Fro
m G
ulf
of
Mex
ico
cro
sses
In
trac
oas
tal
Wat
erw
ay t
o t
he
cou
nty
bo
un
dar
y
94
°25
'43.5
2"W
29
°19
2'1
1.8
62"N
68
Fro
m G
ulf
of
Mex
ico
cro
sses
In
trac
oas
tal
Wat
erw
ay t
o t
he
cou
nty
bo
un
dar
y
94
°24'4
4.4
61"W
29
°19
4'2
4.6
96"N
64
Fro
m G
ulf
of
Mex
ico
cross
es E
ast
Bay
to
th
e
cou
nty
bo
un
dar
y
94
°28'2
4.0
86"W
29
°18
6'1
4.0
19"N
65
Fro
m G
ulf
of
Mex
ico
cross
es E
ast
Bay
to
th
e
cou
nty
bo
un
dar
y
94
°27'3
2.3
82"W
29
°18
8'1
.713"N
66
Fro
m G
ulf
of
Mex
ico
cro
sses
In
trac
oas
tal
Wat
erw
ay t
o t
he
cou
nty
bo
un
dar
y
94
°26'4
3.7
35"W
29
°18
9'5
4.2
73"N
63
Fro
m G
ulf
of
Mex
ico
cross
es E
ast
Bay
to
th
e
cou
nty
bo
un
dar
y
94
°29
'7.9
31"W
29
°18
4'3
3.7
02"N
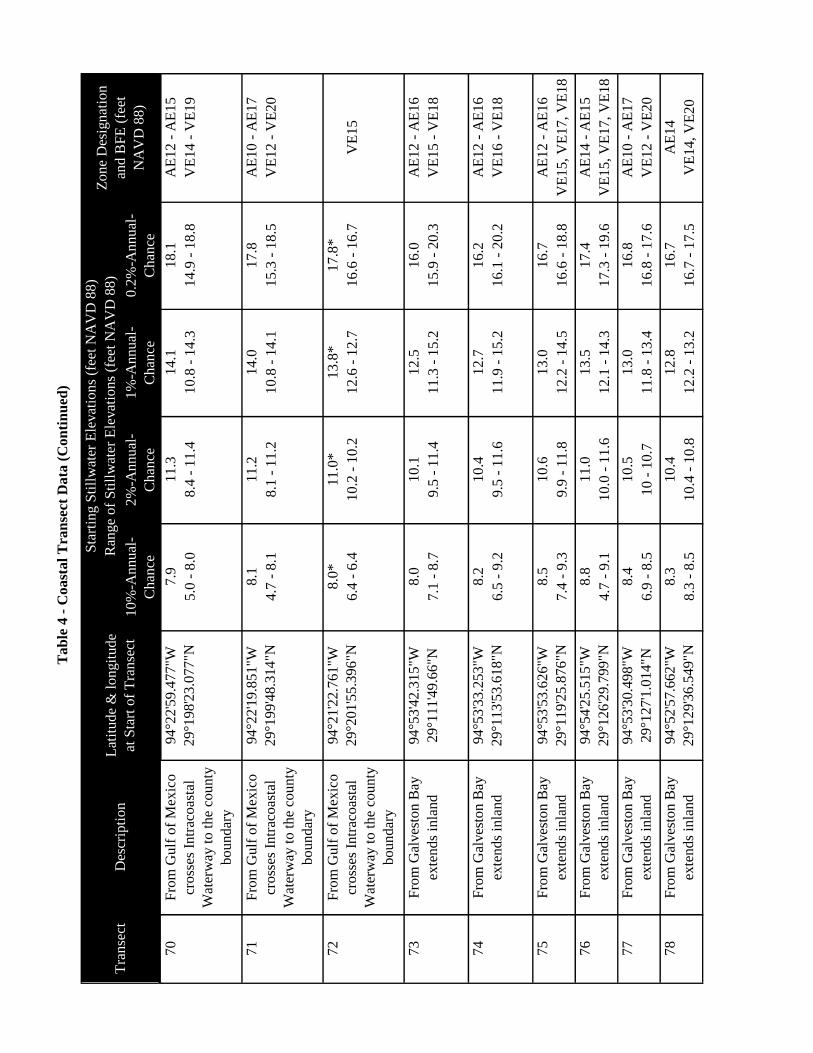
Tab
le 4
- C
oast
al
Tra
nse
ct D
ata
(C
on
tin
ued
)
10%
-Annual
-
Chan
ce
2%
-Annual
-
Chan
ce
1%
-An
nu
al-
Ch
ance
0.2
%-A
nn
ual
-
Ch
ance
Sta
rtin
g S
till
wat
er E
levat
ions
(fee
t N
AV
D 8
8)
Zo
ne
Des
ign
atio
n
and
BF
E (
feet
NA
VD
88
)
Ran
ge
of
Sti
llw
ater
Ele
vat
ions
(fee
t N
AV
D 8
8)
Tra
nse
ctD
escr
ipti
on
Lat
itu
de
& l
ongit
ude
at S
tart
of
Tra
nse
ct
1F
rom
Gu
lf o
f M
exic
o
cross
es W
est
Bay
to
th
e
cou
nty
bo
un
dar
y
95
°7'1
3.8
"W
29
°4'3
7.3
47"N
7.9
11.3
14
.11
8.1
AE
12
- A
E1
5
5.0
- 8
.08.4
- 1
1.4
10.8
- 1
4.3
14
.9 -
18
.8V
E1
4 -
VE
19
8.1
11.2
14
.01
7.8
AE
10
- A
E1
7
4.7
- 8
.18.1
- 1
1.2
10.8
- 1
4.1
15
.3 -
18
.5V
E1
2 -
VE
20
8.0
*11.0
*13
.8*
17
.8*
6.4
- 6
.410.2
- 1
0.2
12.6
- 1
2.7
16
.6 -
16
.7V
E1
5
8.0
10.1
12
.51
6.0
AE
12
- A
E1
6
7.1
- 8
.79.5
- 1
1.4
11.3
- 1
5.2
15
.9 -
20
.3V
E1
5 -
VE
18
8.2
10.4
12
.71
6.2
AE
12
- A
E1
6
6.5
- 9
.29.5
- 1
1.6
11.9
- 1
5.2
16
.1 -
20
.2V
E1
6 -
VE
18
8.5
10.6
13
.01
6.7
AE
12
- A
E1
6
7.4
- 9
.39.9
- 1
1.8
12.2
- 1
4.5
16
.6 -
18
.8V
E1
5,
VE
17
, V
E1
8
8.8
11.0
13
.51
7.4
AE
14
- A
E1
5
4.7
- 9
.110.0
- 1
1.6
12.1
- 1
4.3
17
.3 -
19
.6V
E1
5,
VE
17
, V
E1
8
8.4
10.5
13
.01
6.8
AE
10
- A
E1
7
6.9
- 8
.510 -
10.7
11.8
- 1
3.4
16
.8 -
17
.6V
E1
2 -
VE
20
8.3
10.4
12
.81
6.7
AE
14
8.3
- 8
.510.4
- 1
0.8
12.2
- 1
3.2
16
.7 -
17
.5V
E1
4,
VE
20
71
Fro
m G
ulf
of
Mex
ico
cro
sses
In
trac
oas
tal
Wat
erw
ay t
o t
he
cou
nty
bo
un
dar
y
94
°22'1
9.8
51"W
29
°19
9'4
8.3
14"N
70
94
°53'4
2.3
15"W
29
°11
1'4
9.6
6"N
Fro
m G
alves
ton
Bay
exte
nd
s in
lan
d
73
94
°21'2
2.7
61"W
29
°20
1'5
5.3
96"N
Fro
m G
ulf
of
Mex
ico
cro
sses
In
trac
oas
tal
Wat
erw
ay t
o t
he
cou
nty
bo
un
dar
y
72
Fro
m G
ulf
of
Mex
ico
cro
sses
In
trac
oas
tal
Wat
erw
ay t
o t
he
cou
nty
bo
un
dar
y
94
°22'5
9.4
77"W
29
°19
8'2
3.0
77"N
74
Fro
m G
alves
ton
Bay
exte
nd
s in
lan
d
94
°53'3
3.2
53"W
29
°11
3'5
3.6
18"N
75
Fro
m G
alves
ton
Bay
exte
nd
s in
lan
d
94
°53'5
3.6
26"W
29
°11
9'2
5.8
76"N
76
Fro
m G
alves
ton
Bay
exte
nd
s in
lan
d
94
°54'2
5.5
15"W
29
°12
6'2
9.7
99"N
77
Fro
m G
alves
ton
Bay
exte
nd
s in
lan
d
94
°53'3
0.4
98"W
29
°12
7'1
.014"N
78
Fro
m G
alves
ton
Bay
exte
nd
s in
lan
d
94
°52'5
7.6
62"W
29
°12
9'3
6.5
49"N
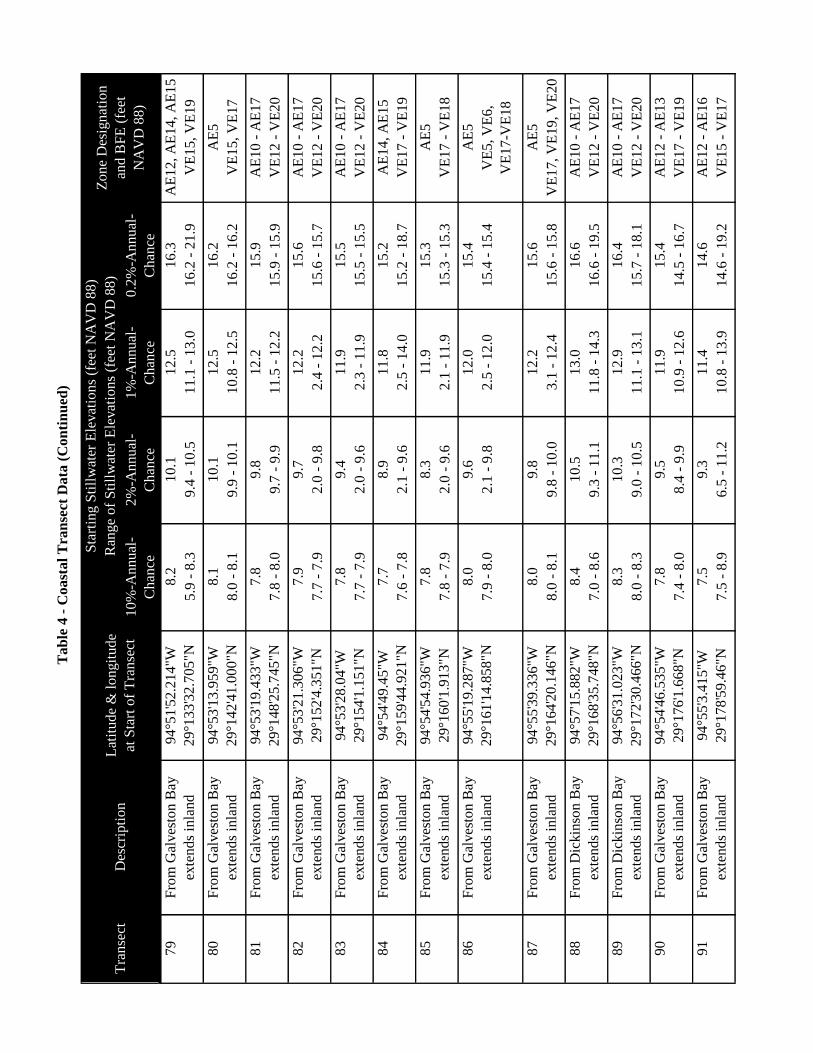
Tab
le 4
- C
oast
al
Tra
nse
ct D
ata
(C
on
tin
ued
)
10%
-Annual
-
Chan
ce
2%
-Annual
-
Chan
ce
1%
-An
nu
al-
Ch
ance
0.2
%-A
nn
ual
-
Ch
ance
Sta
rtin
g S
till
wat
er E
levat
ions
(fee
t N
AV
D 8
8)
Zo
ne
Des
ign
atio
n
and
BF
E (
feet
NA
VD
88
)
Ran
ge
of
Sti
llw
ater
Ele
vat
ions
(fee
t N
AV
D 8
8)
Tra
nse
ctD
escr
ipti
on
Lat
itu
de
& l
ongit
ude
at S
tart
of
Tra
nse
ct
1F
rom
Gu
lf o
f M
exic
o
cross
es W
est
Bay
to
th
e
cou
nty
bo
un
dar
y
95
°7'1
3.8
"W
29
°4'3
7.3
47"N
8.2
10.1
12
.51
6.3
AE
12
, A
E1
4,
AE
15
5.9
- 8
.39.4
- 1
0.5
11.1
- 1
3.0
16
.2 -
21
.9V
E1
5,
VE
19
8.1
10.1
12
.51
6.2
AE
5
8.0
- 8
.19.9
- 1
0.1
10.8
- 1
2.5
16
.2 -
16
.2V
E1
5,
VE
17
7.8
9.8
12
.21
5.9
AE
10
- A
E1
7
7.8
- 8
.09.7
- 9
.911.5
- 1
2.2
15
.9 -
15
.9V
E1
2 -
VE
20
7.9
9.7
12
.21
5.6
AE
10
- A
E1
7
7.7
- 7
.92.0
- 9
.82.4
- 1
2.2
15
.6 -
15
.7V
E1
2 -
VE
20
7.8
9.4
11
.91
5.5
AE
10
- A
E1
7
7.7
- 7
.92.0
- 9
.62.3
- 1
1.9
15
.5 -
15
.5V
E1
2 -
VE
20
7.7
8.9
11
.81
5.2
AE
14
, A
E1
5
7.6
- 7
.82.1
- 9
.62.5
- 1
4.0
15
.2 -
18
.7V
E1
7 -
VE
19
7.8
8.3
11
.91
5.3
AE
5
7.8
- 7
.92.0
- 9
.62.1
- 1
1.9
15
.3 -
15
.3V
E1
7 -
VE
18
8.0
9.6
12
.01
5.4
AE
5
7.9
- 8
.02.1
- 9
.82.5
- 1
2.0
15
.4 -
15
.4V
E5
, V
E6
,
VE
17
-VE
18
8.0
9.8
12
.21
5.6
AE
5
8.0
- 8
.19.8
- 1
0.0
3.1
- 1
2.4
15
.6 -
15
.8V
E1
7,
VE
19
, V
E2
0
8.4
10.5
13
.01
6.6
AE
10
- A
E1
7
7.0
- 8
.69.3
- 1
1.1
11.8
- 1
4.3
16
.6 -
19
.5V
E1
2 -
VE
20
8.3
10.3
12
.91
6.4
AE
10
- A
E1
7
8.0
- 8
.39.0
- 1
0.5
11.1
- 1
3.1
15
.7 -
18
.1V
E1
2 -
VE
20
7.8
9.5
11
.91
5.4
AE
12
- A
E1
3
7.4
- 8
.08.4
- 9
.910.9
- 1
2.6
14
.5 -
16
.7V
E1
7 -
VE
19
7.5
9.3
11
.41
4.6
AE
12
- A
E1
6
7.5
- 8
.96.5
- 1
1.2
10.8
- 1
3.9
14
.6 -
19
.2V
E1
5 -
VE
17
79
Fro
m G
alves
ton
Bay
exte
nd
s in
lan
d
94
°51'5
2.2
14"W
29
°13
3'3
2.7
05"N
80
Fro
m G
alves
ton
Bay
exte
nd
s in
lan
d
94
°53'1
3.9
59"W
29
°14
2'4
1.0
00"N
81
Fro
m G
alves
ton
Bay
exte
nd
s in
lan
d
94
°53'1
9.4
33"W
29
°14
8'2
5.7
45"N
82
Fro
m G
alves
ton
Bay
exte
nd
s in
lan
d
94
°53'2
1.3
06"W
29
°15
2'4
.351"N
83
Fro
m G
alves
ton
Bay
exte
nd
s in
lan
d
94
°53
'28.0
4"W
29
°15
4'1
.151"N
84
Fro
m G
alves
ton
Bay
exte
nd
s in
lan
d
94
°54
'49.4
5"W
29
°15
9'4
4.9
21"N
85
Fro
m G
alves
ton
Bay
exte
nd
s in
lan
d
94
°54'5
4.9
36"W
29
°16
0'1
.913"N
86
Fro
m G
alves
ton
Bay
exte
nd
s in
lan
d
94
°55'1
9.2
87"W
29
°16
1'1
4.8
58"N
87
Fro
m G
alves
ton
Bay
exte
nd
s in
lan
d
94
°55'3
9.3
36"W
29
°16
4'2
0.1
46"N
88
Fro
m D
ickin
son
Bay
exte
nd
s in
lan
d
94
°57'1
5.8
82"W
29
°16
8'3
5.7
48"N
89
Fro
m D
ickin
son
Bay
exte
nd
s in
lan
d
94
°56'3
1.0
23"W
29
°17
2'3
0.4
66"N
90
Fro
m G
alves
ton
Bay
exte
nd
s in
lan
d
94
°54'4
6.5
35"W
29
°17
6'1
.668"N
91
Fro
m G
alves
ton
Bay
exte
nd
s in
lan
d
94
°55
'3.4
15"W
29
°17
8'5
9.4
6"N
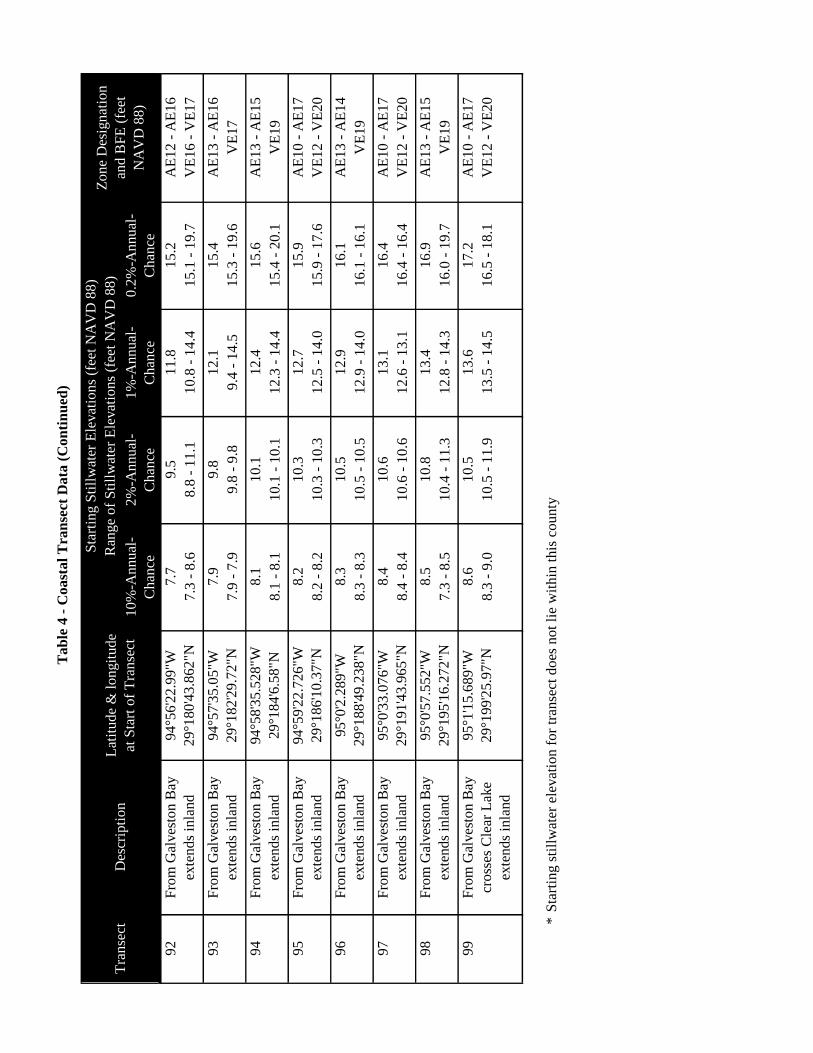
Tab
le 4
- C
oast
al
Tra
nse
ct D
ata
(C
on
tin
ued
)
10%
-Annual
-
Chan
ce
2%
-Annual
-
Chan
ce
1%
-An
nu
al-
Ch
ance
0.2
%-A
nn
ual
-
Ch
ance
Sta
rtin
g S
till
wat
er E
levat
ions
(fee
t N
AV
D 8
8)
Zo
ne
Des
ign
atio
n
and
BF
E (
feet
NA
VD
88
)
Ran
ge
of
Sti
llw
ater
Ele
vat
ions
(fee
t N
AV
D 8
8)
Tra
nse
ctD
escr
ipti
on
Lat
itu
de
& l
ongit
ude
at S
tart
of
Tra
nse
ct
1F
rom
Gu
lf o
f M
exic
o
cross
es W
est
Bay
to
th
e
cou
nty
bo
un
dar
y
95
°7'1
3.8
"W
29
°4'3
7.3
47"N
7.7
9.5
11
.81
5.2
AE
12
- A
E1
6
7.3
- 8
.68.8
- 1
1.1
10.8
- 1
4.4
15
.1 -
19
.7V
E1
6 -
VE
17
7.9
9.8
12
.11
5.4
AE
13
- A
E1
6
7.9
- 7
.99.8
- 9
.89.4
- 1
4.5
15
.3 -
19
.6V
E1
7
8.1
10.1
12
.41
5.6
AE
13
- A
E1
5
8.1
- 8
.110.1
- 1
0.1
12.3
- 1
4.4
15
.4 -
20
.1V
E1
9
8.2
10.3
12
.71
5.9
AE
10
- A
E1
7
8.2
- 8
.210.3
- 1
0.3
12.5
- 1
4.0
15
.9 -
17
.6V
E1
2 -
VE
20
8.3
10.5
12
.91
6.1
AE
13
- A
E1
4
8.3
- 8
.310.5
- 1
0.5
12.9
- 1
4.0
16
.1 -
16
.1V
E1
9
8.4
10.6
13
.11
6.4
AE
10
- A
E1
7
8.4
- 8
.410.6
- 1
0.6
12.6
- 1
3.1
16
.4 -
16
.4V
E1
2 -
VE
20
8.5
10.8
13
.41
6.9
AE
13
- A
E1
5
7.3
- 8
.510.4
- 1
1.3
12.8
- 1
4.3
16
.0 -
19
.7V
E1
9
8.6
10.5
13
.61
7.2
AE
10
- A
E1
7
8.3
- 9
.010.5
- 1
1.9
13.5
- 1
4.5
16
.5 -
18
.1V
E1
2 -
VE
20
*S
tart
ing s
till
wat
er e
levat
ion
fo
r tr
anse
ct d
oes
not
lie
wit
hin
this
county
92
Fro
m G
alves
ton
Bay
exte
nd
s in
lan
d
94
°56
'22.9
9"W
29
°18
0'4
3.8
62"N
93
Fro
m G
alves
ton
Bay
exte
nd
s in
lan
d
94
°57
'35.0
5"W
29
°18
2'2
9.7
2"N
94
Fro
m G
alves
ton
Bay
exte
nd
s in
lan
d
94
°58'3
5.5
28"W
29
°184'6
.58"N
98
Fro
m G
alves
ton
Bay
exte
nd
s in
lan
d
95
°0'5
7.5
52"W
29
°19
5'1
6.2
72"N
99
Fro
m G
alves
ton
Bay
cro
sses
Cle
ar L
ake
exte
nd
s in
lan
d
95
°1'1
5.6
89"W
29
°19
9'2
5.9
7"N
95
Fro
m G
alves
ton
Bay
exte
nd
s in
lan
d
94
°59'2
2.7
26"W
29
°18
6'1
0.3
7"N
96
Fro
m G
alves
ton
Bay
exte
nd
s in
lan
d
95
°0'2
.289"W
29
°18
8'4
9.2
38"N
97
Fro
m G
alves
ton
Bay
exte
nd
s in
lan
d
95
°0'3
3.0
76"W
29
°19
1'4
3.9
65"N
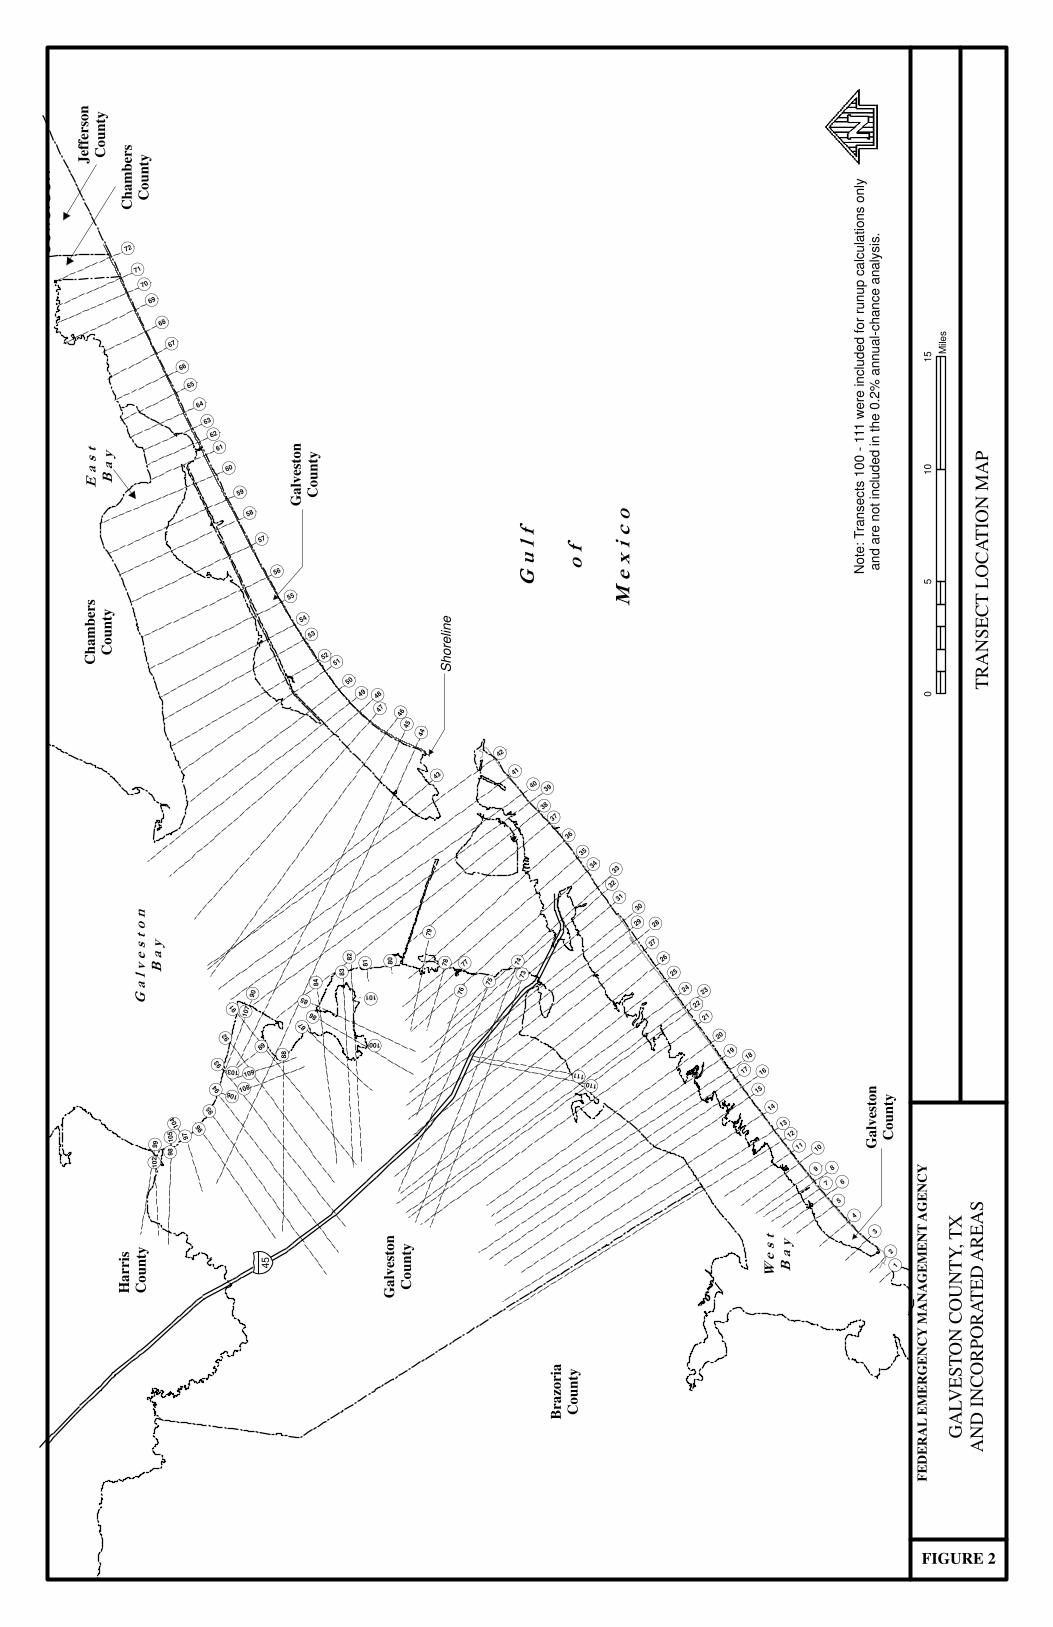
Galveston
Bay
East
Bay
Gulf
of
Mexico
West
Bay
Ha
rris
Co
un
ty
Bra
zori
a
Co
un
ty
Ga
lves
ton
Co
un
ty
Ch
am
ber
s
Co
un
ty
Ch
am
ber
s
Co
un
tyJef
fers
on
Co
un
ty
Ga
lves
ton
Co
un
ty
Ga
lves
ton
Co
un
ty
� � �45
Je
ffers
on
!(44!(4
5
!(41
!(40
!(42
!(24
!(23
!(22
!(21
!(25
!(39
!(26
!(12
!(17
!(16
!(15
!(27
!(28
!(14
!(19
!(43
!(20
!(30
!(47
!(49
!(73
!(31
!(34
!(32
!(35
!(75
!(36
!(33
!(93
!(50
!(94
!(91
!(95
!(83
!(37
!(82
!(51
!(84
!(92
! (88
!(53
!(54
!(55
!(56
!(59
!(57
!(58
!(60
!(96
!(76
!(110
!(86
!(85
!(79
!(69
!(70
!(87
!(98 !(1
1
!(71
!(99
!(10
!(72
!(65
!(61
!(64
!(66
!(9
!(62
!(67
!(8
!(63
!(78
!(77
!(68
!(7
!(90
!(108
!(6
!(109
!(97
!(5
!(4
!(3
!(89
!(2
!(1
!(81 !(80
!(101
!(100
!(38
!(13
!(46
!(29
!(18
!(74
!(48
!(52
!(111
!(102
!(107
!(104
!(106
!(105
!(103
FIGURE 2
FE
DE
RA
L E
ME
RG
EN
CY
MA
NA
GE
ME
NT
AG
EN
CY
GA
LV
ES
TO
N C
OU
NT
Y, T
X
AN
D I
NC
OR
PO
RA
TE
D A
RE
AS
TR
AN
SE
CT
LO
CA
TIO
N M
AP
05
10
15 M
iles
Sh
ore
line
Note
: T
ranse
cts
10
0 -
111 w
ere
in
clu
ded
fo
r ru
nup c
alc
ula
tions o
nly
an
d a
re n
ot
inclu
ded
in th
e 0
.2%
annu
al-
chan
ce a
na
lysis
.

41
3.4 Vertical Datum
All FIS reports and FIRMs are referenced to a specific vertical datum. The vertical
datum provides a starting point against which flood, ground, and structure elevations can
be referenced and compared. Until recently, the standard vertical datum in use for newly
created or revised FIS reports and FIRMs was the National Geodetic Vertical Datum of
1929 (NGVD29). With the finalization of the North American Vertical Datum of 1988
(NAVD88), many FIS reports and FIRMs are being prepared using NAVD88 as the
referenced vertical datum.
Flood elevations shown in this FIS report and on the FIRM are referenced to the NAVD.
These flood elevations must be compared to structure and ground elevations referenced to
the same vertical datum. Some of the data used in this revision were taken from the prior
effective FIS reports and FIRMs and adjusted to NAVD88. The datum conversion factor
from NGVD29 to NAVD88 in Galveston County is (+) 0.01 feet.
For additional information regarding conversion between the NGVD and NAVD, visit
the National Geodetic Survey website at www.ngs.noaa.gov, or contact the National
Geodetic Survey at the following address:
Vertical Network Branch, N/CG13
National Geodetic Survey, NOAA
Silver Spring Metro Center 3
1315 East-West Highway
Silver Spring, Maryland 20910
(301) 713-3191
Temporary vertical monuments are often established during the preparation of a flood
hazard analysis for the purpose of establishing local vertical control. Although these
monuments are not shown on the FIRM, they may be found in the Technical Support
Data Notebook associated with the FIS report and FIRM for this community. Interested
individuals may contact FEMA to access these data.
To obtain current elevation, description, and/or location information for benchmarks
shown on this map, please contact the Information Services Branch of the NGS at
(301) 713-3242, or visit their website at www.ngs.noaa.gov.
4.0 FLOODPLAIN MANAGEMENT APPLICATIONS
The NFIP encourages State and local governments to adopt sound floodplain management
programs. To assist in this endeavor, each FIS report provides 1-percent-annual-chance
floodplain data, which may include a combination of the following: 10-, 2-, 1-, and
0.2-percent-annual-chance flood elevations; delineations of the 1- and 0.2-percent-annual-chance
floodplains; and a 1-percent-annual-chance floodway. This information is presented on the FIRM
and in many components of the FIS report, including Flood Profiles, Floodway Data tables, and
Summary of Stillwater Elevation tables. Users should reference the data presented in the FIS
report as well as additional information that may be available at the local community map
repository before making flood elevation and/or floodplain boundary determinations.
42
4.1 Floodplain Boundaries
To provide a national standard without regional discrimination, the 1-percent-annual-
chance flood has been adopted by FEMA as the base flood for floodplain management
purposes. The 0.2-percent-annual-chance flood is employed to indicate additional areas
of flood risk in the community. For each stream studied by detailed methods, the 1- and
0.2-percent-annual-chance floodplain boundaries have been delineated using the flood
elevations determined at each cross section. Between cross sections, the boundaries were
interpolated using LiDAR collected by Sanborn (Reference 35).
The 1- and 0.2-percent-annual-chance floodplain boundaries are shown on the FIRM
(Exhibit 3). On this map, the 1-percent-annual-chance floodplain boundary corresponds
to the boundary of the areas of special flood hazards (Zones A, AE, AO, VE); and the
0.2-percent-annual-chance floodplain boundary corresponds to the boundary of areas of
moderate flood hazards. In cases where the 1- and 0.2-percent-annual-chance floodplain
boundaries are close together, only the 1-percent-annual-chance floodplain boundary has
been shown. Small areas within the floodplain boundaries may lie above the flood
elevations but cannot be shown due to limitations of the map scale and/or lack of detailed
topographic data.
For the streams studied by approximate methods, only the 1-percent-annual-chance
floodplain boundary is shown on the FIRM (Exhibit 3).
4.2 Floodways
Encroachment on floodplains, such as structures and fill, reduces flood-carrying capacity,
increases flood heights and velocities, and increases flood hazards in areas beyond the
encroachment itself. One aspect of floodplain management involves balancing the
economic gain from floodplain development against the resulting increase in flood
hazard. For purposes of the NFIP, a floodway is used as a tool to assist local communities
in this aspect of floodplain management. Under this concept, the area of the 1-percent-
annual-chance floodplain is divided into a floodway and a floodway fringe. The
floodway is the channel of a stream, plus any adjacent floodplain areas, that must be kept
free of encroachment so that the 1-percent-annual-chance flood can be carried without
substantial increases in flood heights. Minimum Federal standards limit such increases to
1.0 foot, provided that hazardous velocities are not produced. The floodways in this
study are presented to local agencies as minimum standards that can be adopted directly
or that can be used as a basis for additional floodway studies.
The floodways presented in this study were computed for certain stream segments on the
basis of equal-conveyance reduction from each side of the floodplain. Floodway widths
were computed at cross sections. Between cross sections, the floodway boundaries were
interpolated. The results of the floodway computations are tabulated for selected cross
sections (see Table 5, Floodway Data on page 44). In cases where the floodway and 1-
percent-annual-chance floodplain boundaries are either close together or collinear, only
the floodway boundary has been shown.
The area between the floodway and 1-percent-annual-chance floodplain boundaries is
termed the floodway fringe. The floodway fringe encompasses the portion of the
floodplain that could be completely obstructed without increasing the water-surface
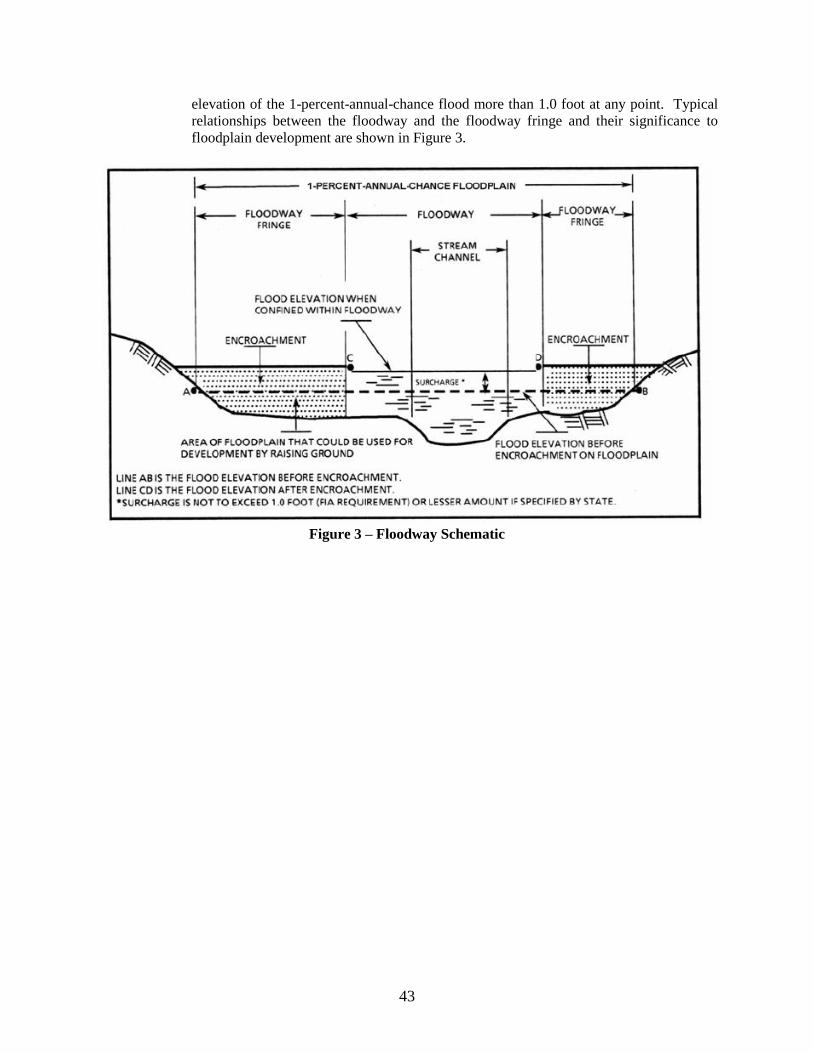
43
elevation of the 1-percent-annual-chance flood more than 1.0 foot at any point. Typical
relationships between the floodway and the floodway fringe and their significance to
floodplain development are shown in Figure 3.
Figure 3 – Floodway Schematic
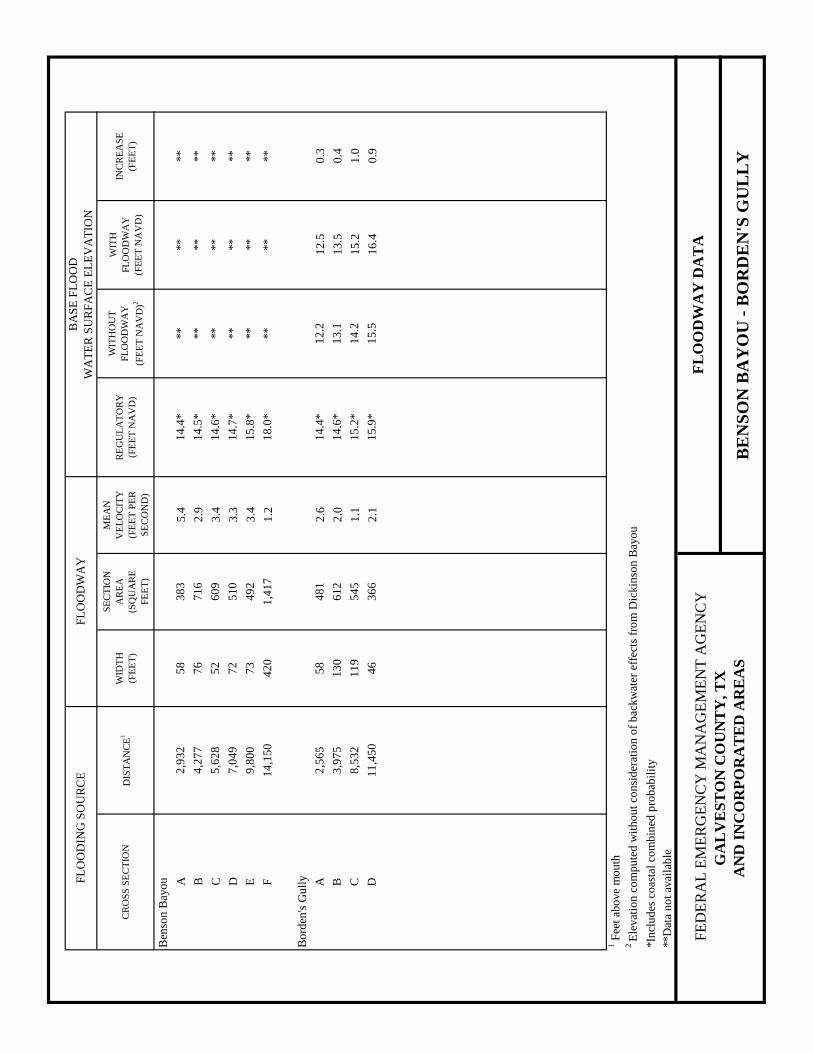
CR
OS
S S
EC
TIO
ND
IST
AN
CE
1W
IDT
H
(FE
ET
)
SE
CT
ION
AR
EA
(SQ
UA
RE
FE
ET
)
ME
AN
VE
LO
CIT
Y
(FE
ET
PE
R
SE
CO
ND
)
RE
GU
LA
TO
RY
(FE
ET
NA
VD
)
WIT
HO
UT
FL
OO
DW
AY
(FE
ET
NA
VD
)2
WIT
H
FL
OO
DW
AY
(FE
ET
NA
VD
)
INC
RE
AS
E
(FE
ET
)
Ben
son
Bay
ou A
2,9
32
58
38
35
.41
4.4
***
**
**
B4
,27
7
76
71
62
.91
4.5
***
**
**
C5
,62
8
52
60
93
.41
4.6
***
**
**
D7
,04
9
72
51
03
.31
4.7
***
**
**
E9
,80
0
73
49
23
.41
5.8
***
**
**
F1
4,1
50
4
20
1,4
17
1.2
18
.0*
**
**
**
Bo
rden
's G
ull
y A2
,56
55
84
81
2.6
14
.4*
12
.21
2.5
0.3
B3
,97
51
30
61
22
.01
4.6
*1
3.1
13
.50
.4
C8
,53
21
19
54
51
.11
5.2
*1
4.2
15
.21
.0
D1
1,4
50
46
36
62
.11
5.9
*1
5.5
16
.40
.9
1 F
eet
abo
ve
mo
uth
2 E
levat
ion
co
mp
ute
d w
ith
ou
t co
nsi
der
atio
n o
f b
ackw
ater
eff
ects
fro
m D
ickin
son
Bay
ou
*In
clu
des
co
asta
l co
mb
ined
pro
bab
ilit
y
**D
ata
no
t av
aila
ble
FL
OO
DIN
G S
OU
RC
EF
LO
OD
WA
YB
AS
E F
LO
OD
WA
TE
R S
UR
FA
CE
EL
EV
AT
ION
F
ED
ER
AL
EM
ER
GE
NC
Y M
AN
AG
EM
EN
T A
GE
NC
Y
GA
LV
ES
TO
N C
OU
NT
Y,
TX
A
ND
IN
CO
RP
OR
AT
ED
AR
EA
S
FL
OO
DW
AY
DA
TA
BE
NS
ON
BA
YO
U -
BO
RD
EN
'S G
UL
LY
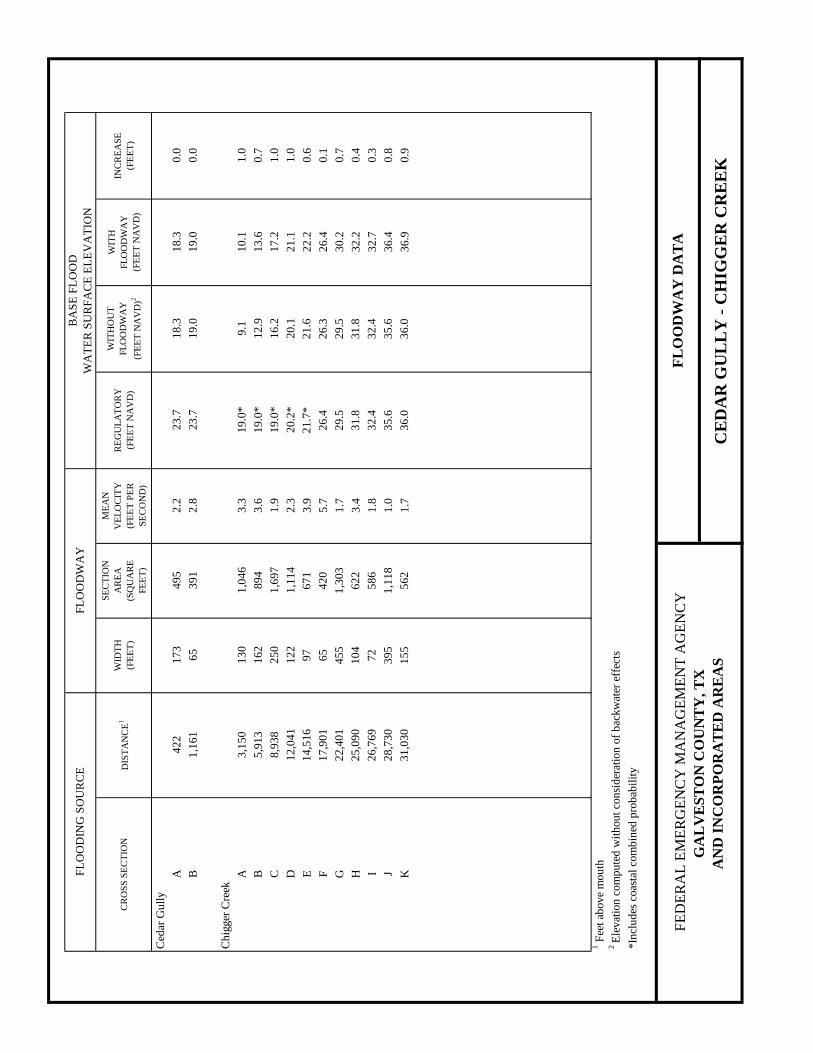
CR
OS
S S
EC
TIO
ND
IST
AN
CE
1W
IDT
H
(FE
ET
)
SE
CT
ION
AR
EA
(SQ
UA
RE
FE
ET
)
ME
AN
VE
LO
CIT
Y
(FE
ET
PE
R
SE
CO
ND
)
RE
GU
LA
TO
RY
(FE
ET
NA
VD
)
WIT
HO
UT
FL
OO
DW
AY
(FE
ET
NA
VD
)2
WIT
H
FL
OO
DW
AY
(FE
ET
NA
VD
)
INC
RE
AS
E
(FE
ET
)
Ced
ar G
ull
y
A4
22
17
34
95
2.2
23
.71
8.3
18
.30
.0
B1
,16
16
53
91
2.8
23
.71
9.0
19
.00
.0
Ch
igger
Cre
ek
A3
,15
01
30
1,0
46
3.3
19
.0*
9.1
10
.11
.0
B5
,91
31
62
89
43
.61
9.0
*1
2.9
13
.60
.7
C8
,93
82
50
1,6
97
1.9
19
.0*
16
.21
7.2
1.0
D1
2,0
41
12
21
,11
42
.32
0.2
*2
0.1
21
.11
.0
E1
4,5
16
97
67
13
.92
1.7
*2
1.6
22
.20
.6
F1
7,9
01
65
42
05
.72
6.4
26
.32
6.4
0.1
G2
2,4
01
45
51
,30
31
.72
9.5
29
.53
0.2
0.7
H2
5,0
90
1
04
62
23
.43
1.8
31
.83
2.2
0.4
I2
6,7
69
7
25
86
1.8
32
.43
2.4
32
.70
.3
J2
8,7
30
3
95
1,1
18
1.0
35
.63
5.6
36
.40
.8
K3
1,0
30
1
55
56
21
.73
6.0
36
.03
6.9
0.9
1 F
eet
above
mou
th2
Ele
vat
ion
com
pu
ted
wit
hou
t co
nsi
der
atio
n o
f b
ackw
ater
eff
ects
*In
clu
des
coas
tal
com
bin
ed p
rob
abil
ity
FL
OO
DIN
G S
OU
RC
EF
LO
OD
WA
YB
AS
E F
LO
OD
WA
TE
R S
UR
FA
CE
EL
EV
AT
ION
F
ED
ER
AL
EM
ER
GE
NC
Y M
AN
AG
EM
EN
T A
GE
NC
Y
G
AL
VE
ST
ON
CO
UN
TY
, T
X
A
ND
IN
CO
RP
OR
AT
ED
AR
EA
S
FL
OO
DW
AY
DA
TA
CE
DA
R G
UL
LY
- C
HIG
GE
R C
RE
EK

CR
OS
S S
EC
TIO
ND
IST
AN
CE
1W
IDT
H
(FE
ET
)
SE
CT
ION
AR
EA
(SQ
UA
RE
FE
ET
)
ME
AN
VE
LO
CIT
Y
(FE
ET
PE
R
SE
CO
ND
)
RE
GU
LA
TO
RY
(FE
ET
NA
VD
)
WIT
HO
UT
FL
OO
DW
AY
(FE
ET
NA
VD
) 2
WIT
H
FL
OO
DW
AY
(FE
ET
NA
VD
)
INC
RE
AS
E
(FE
ET
)
Cle
ar C
reek
Q2
5,3
86
2,8
61
31
,86
80
.81
6.2
*7
.57
.90
.4
R2
6,8
74
3,0
26
31
,14
80
.81
5.0
*7
.57
.90
.4
S2
7,8
60
2,5
65
28
,81
20
.91
4.6
*7
.67
.90
.3
T2
8,9
90
2,0
71
16
,42
41
.51
4.5
*7
.67
.90
.3
U3
0,1
39
2,3
71
19
,60
71
.31
4.5
*7
.68
.00
.4
V3
1,5
00
1,3
51
9,7
68
2.5
14
.5*
7.6
7.9
0.3
W3
2,5
02
1,7
87
15
,89
01
.61
4.4
*7
.88
.20
.4
X3
3,4
91
1,5
07
10
,67
22
.31
4.4
*7
.98
.20
.3
Y3
4,4
80
1,1
21
9,3
05
2.6
14
.4*
8.0
8.5
0.5
Z3
5,7
80
75
67
,77
33
.21
4.4
*8
.18
.70
.6
AA
37
,27
39
69
7,8
47
3.1
14
.4*
8.5
9.2
0.7
AB
39
,37
31
,51
21
9,5
29
1.4
14
.4*
9.0
9.7
0.7
AC
40
,31
01
,57
91
4,3
44
1.7
14
.3*
9.1
9.7
0.6
AD
41
,42
11
,04
11
2,5
23
2.0
14
.3*
9.2
9.9
0.7
AE
43
,25
81
,25
71
5,4
08
1.6
14
.3*
9.3
10
.00
.7
AF
46
,23
92
,15
02
1,4
40
3.6
14
.4*
9.6
10
.30
.7
1 F
eet
above
con
flu
ence
wit
h G
alves
ton
Bay
2 E
levat
ion
s co
mp
ute
d w
ith
ou
t co
nsi
der
atio
n o
f co
asta
l fl
ood
ing e
ffec
ts3
Cro
ss S
ecti
on
lie
s ou
tsid
e of
Gal
ves
ton
Cou
nty
an
d w
ith
in G
alves
ton
Bay
*In
clu
des
coas
tal
com
bin
ed p
rob
abil
ity
FL
OO
DIN
G S
OU
RC
EF
LO
OD
WA
YB
AS
E F
LO
OD
WA
TE
R S
UR
FA
CE
EL
EV
AT
ION
F
ED
ER
AL
EM
ER
GE
NC
Y M
AN
AG
EM
EN
T A
GE
NC
Y
G
AL
VE
ST
ON
CO
UN
TY
, T
X
A
ND
IN
CO
RP
OR
AT
ED
AR
EA
S
FL
OO
DW
AY
DA
TA
CL
EA
R C
RE
EK
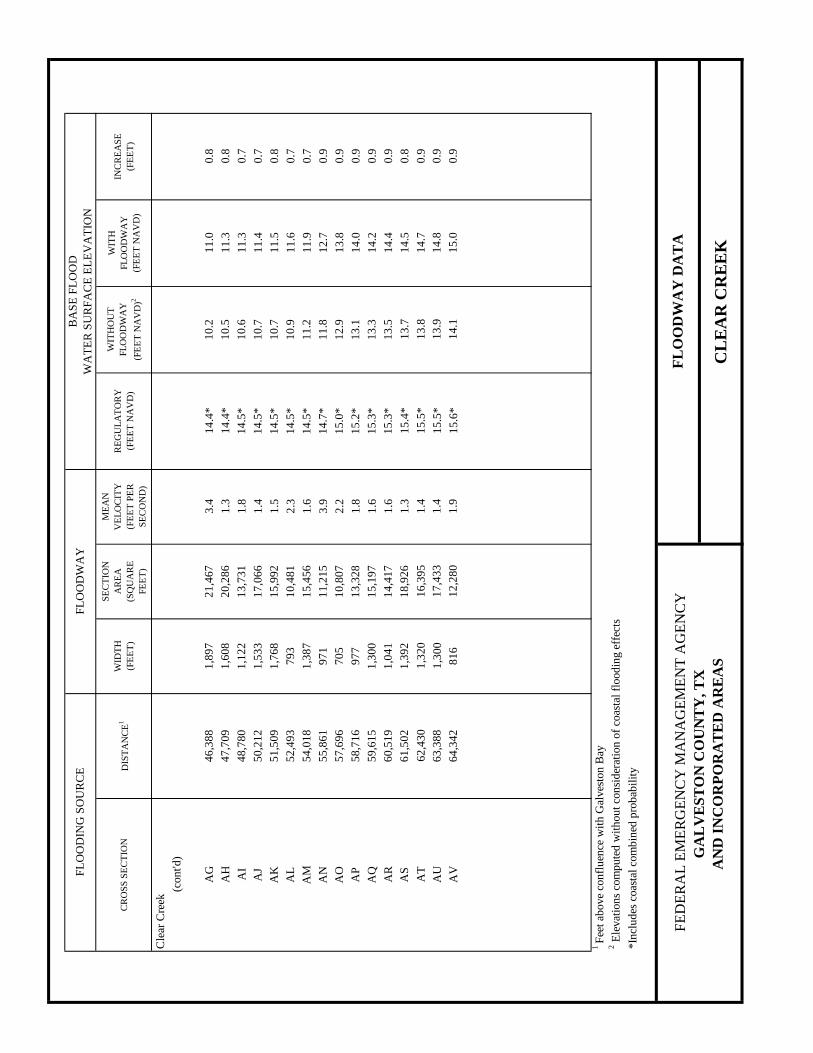
CR
OS
S S
EC
TIO
ND
IST
AN
CE
1W
IDT
H
(FE
ET
)
SE
CT
ION
AR
EA
(SQ
UA
RE
FE
ET
)
ME
AN
VE
LO
CIT
Y
(FE
ET
PE
R
SE
CO
ND
)
RE
GU
LA
TO
RY
(FE
ET
NA
VD
)
WIT
HO
UT
FL
OO
DW
AY
(FE
ET
NA
VD
)2
WIT
H
FL
OO
DW
AY
(FE
ET
NA
VD
)
INC
RE
AS
E
(FE
ET
)
Cle
ar C
reek
(con
t'd)
AG
46
,38
81
,89
72
1,4
67
3.4
14
.4*
10
.21
1.0
0.8
AH
47
,70
91
,60
82
0,2
86
1.3
14
.4*
10
.51
1.3
0.8
AI
48
,78
01
,12
21
3,7
31
1.8
14
.5*
10
.61
1.3
0.7
AJ
50
,21
21
,53
31
7,0
66
1.4
14
.5*
10
.71
1.4
0.7
AK
51
,50
91
,76
81
5,9
92
1.5
14
.5*
10
.71
1.5
0.8
AL
52
,49
37
93
10
,48
12
.31
4.5
*1
0.9
11
.60
.7
AM
54
,01
81
,38
71
5,4
56
1.6
14
.5*
11
.21
1.9
0.7
AN
55
,86
19
71
11
,21
53
.91
4.7
*1
1.8
12
.70
.9
AO
57
,69
67
05
10
,80
72
.21
5.0
*1
2.9
13
.80
.9
AP
58
,71
69
77
13
,32
81
.81
5.2
*1
3.1
14
.00
.9
AQ
59
,61
51
,30
01
5,1
97
1.6
15
.3*
13
.31
4.2
0.9
AR
60
,51
91
,04
11
4,4
17
1.6
15
.3*
13
.51
4.4
0.9
AS
61
,50
21
,39
21
8,9
26
1.3
15
.4*
13
.71
4.5
0.8
AT
62
,43
01
,32
01
6,3
95
1.4
15
.5*
13
.81
4.7
0.9
AU
63
,38
81
,30
01
7,4
33
1.4
15
.5*
13
.91
4.8
0.9
AV
64
,34
28
16
12
,28
01
.91
5.6
*1
4.1
15
.00
.9
1 F
eet
above
con
flu
ence
wit
h G
alves
ton
Bay
2 E
levat
ion
s co
mp
ute
d w
ith
ou
t co
nsi
der
atio
n o
f co
asta
l fl
ood
ing e
ffec
ts
*In
clu
des
coas
tal
com
bin
ed p
rob
abil
ity
FL
OO
DIN
G S
OU
RC
EF
LO
OD
WA
YB
AS
E F
LO
OD
WA
TE
R S
UR
FA
CE
EL
EV
AT
ION
F
ED
ER
AL
EM
ER
GE
NC
Y M
AN
AG
EM
EN
T A
GE
NC
Y
G
AL
VE
ST
ON
CO
UN
TY
, T
X
A
ND
IN
CO
RP
OR
AT
ED
AR
EA
S
FL
OO
DW
AY
DA
TA
CL
EA
R C
RE
EK
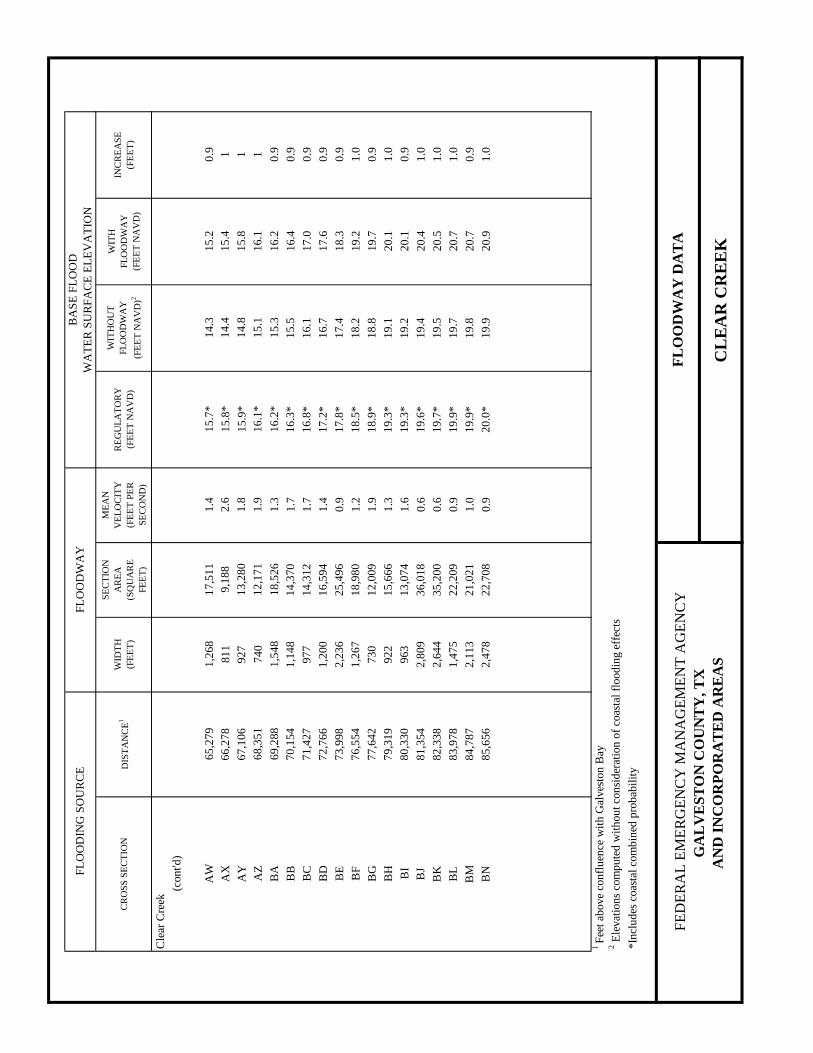
CR
OS
S S
EC
TIO
ND
IST
AN
CE
1W
IDT
H
(FE
ET
)
SE
CT
ION
AR
EA
(SQ
UA
RE
FE
ET
)
ME
AN
VE
LO
CIT
Y
(FE
ET
PE
R
SE
CO
ND
)
RE
GU
LA
TO
RY
(FE
ET
NA
VD
)
WIT
HO
UT
FL
OO
DW
AY
(FE
ET
NA
VD
)2
WIT
H
FL
OO
DW
AY
(FE
ET
NA
VD
)
INC
RE
AS
E
(FE
ET
)
Cle
ar C
reek
(con
t'd)
AW
65
,27
91
,26
81
7,5
11
1.4
15
.7*
14
.31
5.2
0.9
AX
66
,27
88
11
9,1
88
2.6
15
.8*
14
.41
5.4
1
AY
67
,10
69
27
13
,28
01
.81
5.9
*1
4.8
15
.81
AZ
68
,35
17
40
12
,17
11
.91
6.1
*1
5.1
16
.11
BA
69
,28
81
,54
81
8,5
26
1.3
16
.2*
15
.31
6.2
0.9
BB
70
,15
41
,14
81
4,3
70
1.7
16
.3*
15
.51
6.4
0.9
BC
71
,42
79
77
14
,31
21
.71
6.8
*1
6.1
17
.00
.9
BD
72
,76
61
,20
01
6,5
94
1.4
17
.2*
16
.71
7.6
0.9
BE
73
,99
82
,23
62
5,4
96
0.9
17
.8*
17
.41
8.3
0.9
BF
76
,55
41
,26
71
8,9
80
1.2
18
.5*
18
.21
9.2
1.0
BG
77
,64
27
30
12
,00
91
.91
8.9
*1
8.8
19
.70
.9
BH
79
,31
99
22
15
,66
61
.31
9.3
*1
9.1
20
.11
.0
BI
80
,33
09
63
13
,07
41
.61
9.3
*1
9.2
20
.10
.9
BJ
81
,35
42
,80
93
6,0
18
0.6
19
.6*
19
.42
0.4
1.0
BK
82
,33
82
,64
43
5,2
00
0.6
19
.7*
19
.52
0.5
1.0
BL
83
,97
81
,47
52
2,2
09
0.9
19
.9*
19
.72
0.7
1.0
BM
84
,78
72
,11
32
1,0
21
1.0
19
.9*
19
.82
0.7
0.9
BN
85
,65
62
,47
82
2,7
08
0.9
20
.0*
19
.92
0.9
1.0
1 F
eet
above
con
flu
ence
wit
h G
alves
ton
Bay
2 E
levat
ion
s co
mp
ute
d w
ith
ou
t co
nsi
der
atio
n o
f co
asta
l fl
ood
ing e
ffec
ts
*In
clu
des
coas
tal
com
bin
ed p
rob
abil
ity
FL
OO
DIN
G S
OU
RC
EF
LO
OD
WA
YB
AS
E F
LO
OD
WA
TE
R S
UR
FA
CE
EL
EV
AT
ION
F
ED
ER
AL
EM
ER
GE
NC
Y M
AN
AG
EM
EN
T A
GE
NC
Y
G
AL
VE
ST
ON
CO
UN
TY
, T
X
A
ND
IN
CO
RP
OR
AT
ED
AR
EA
S
FL
OO
DW
AY
DA
TA
CL
EA
R C
RE
EK
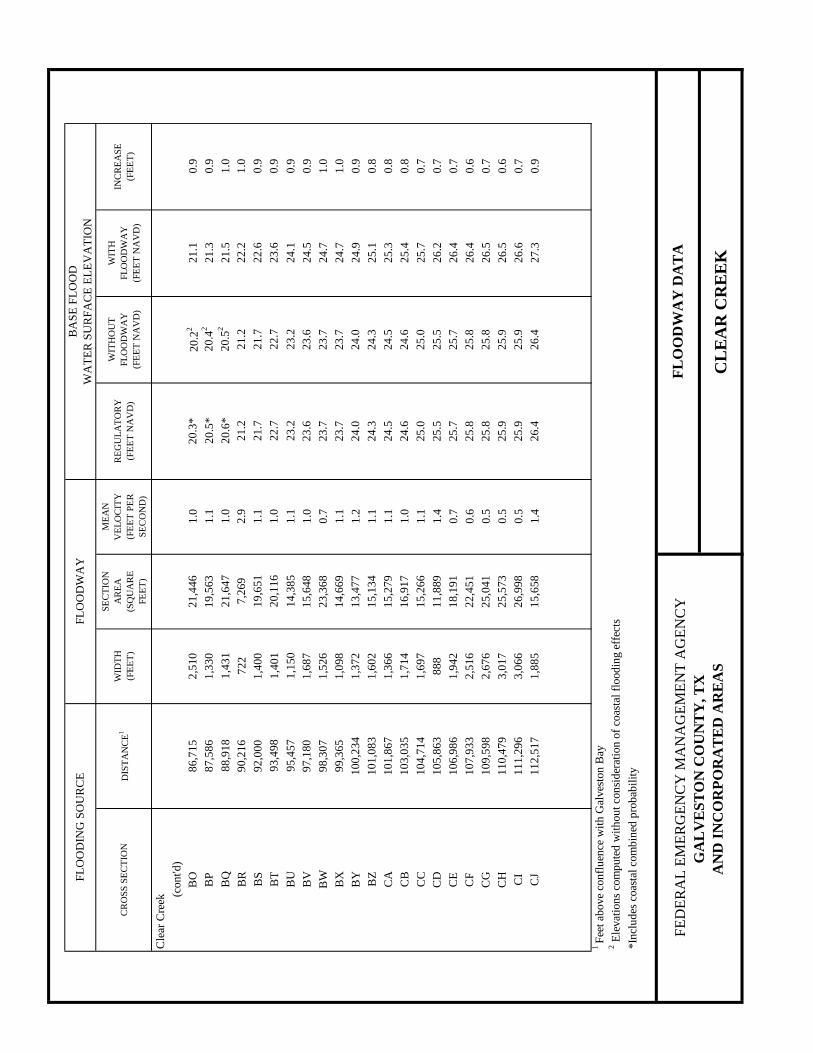
CR
OS
S S
EC
TIO
ND
IST
AN
CE
1W
IDT
H
(FE
ET
)
SE
CT
ION
AR
EA
(SQ
UA
RE
FE
ET
)
ME
AN
VE
LO
CIT
Y
(FE
ET
PE
R
SE
CO
ND
)
RE
GU
LA
TO
RY
(FE
ET
NA
VD
)
WIT
HO
UT
FL
OO
DW
AY
(FE
ET
NA
VD
)
WIT
H
FL
OO
DW
AY
(FE
ET
NA
VD
)
INC
RE
AS
E
(FE
ET
)
Cle
ar C
reek
(con
t'd)
BO
86
,71
52
,51
02
1,4
46
1.0
20
.3*
20
.22
21
.10
.9
BP
87
,58
61
,33
01
9,5
63
1.1
20
.5*
20
.42
21
.30
.9
BQ
88
,91
81
,43
12
1,6
47
1.0
20
.6*
20
.52
21
.51
.0
BR
90
,21
67
22
7,2
69
2.9
21
.22
1.2
22
.21
.0
BS
92
,00
01
,40
01
9,6
51
1.1
21
.72
1.7
22
.60
.9
BT
93
,49
81
,40
12
0,1
16
1.0
22
.72
2.7
23
.60
.9
BU
95
,45
71
,15
01
4,3
85
1.1
23
.22
3.2
24
.10
.9
BV
97
,18
01
,68
71
5,6
48
1.0
23
.62
3.6
24
.50
.9
BW
98
,30
71
,52
62
3,3
68
0.7
23
.72
3.7
24
.71
.0
BX
99
,36
51
,09
81
4,6
69
1.1
23
.72
3.7
24
.71
.0
BY
10
0,2
34
1,3
72
13
,47
71
.22
4.0
24
.02
4.9
0.9
BZ
10
1,0
83
1,6
02
15
,13
41
.12
4.3
24
.32
5.1
0.8
CA
10
1,8
67
1,3
66
15
,27
91
.12
4.5
24
.52
5.3
0.8
CB
10
3,0
35
1,7
14
16
,91
71
.02
4.6
24
.62
5.4
0.8
CC
10
4,7
14
1,6
97
15
,26
61
.12
5.0
25
.02
5.7
0.7
CD
10
5,8
63
88
81
1,8
89
1.4
25
.52
5.5
26
.20
.7
CE
10
6,9
86
1,9
42
18
,19
10
.72
5.7
25
.72
6.4
0.7
CF
10
7,9
33
2,5
16
22
,45
10
.62
5.8
25
.82
6.4
0.6
CG
10
9,5
98
2,6
76
25
,04
10
.52
5.8
25
.82
6.5
0.7
CH
11
0,4
79
3,0
17
25
,57
30
.52
5.9
25
.92
6.5
0.6
CI
11
1,2
96
3,0
66
26
,99
80
.52
5.9
25
.92
6.6
0.7
CJ
11
2,5
17
1,8
85
15
,65
81
.42
6.4
26
.42
7.3
0.9
1 F
eet
above
con
flu
ence
wit
h G
alves
ton
Bay
2 E
levat
ion
s co
mp
ute
d w
ith
ou
t co
nsi
der
atio
n o
f co
asta
l fl
ood
ing e
ffec
ts
*In
clu
des
coas
tal
com
bin
ed p
rob
abil
ity
FL
OO
DIN
G S
OU
RC
EF
LO
OD
WA
YB
AS
E F
LO
OD
WA
TE
R S
UR
FA
CE
EL
EV
AT
ION
F
ED
ER
AL
EM
ER
GE
NC
Y M
AN
AG
EM
EN
T A
GE
NC
Y
G
AL
VE
ST
ON
CO
UN
TY
, T
X
A
ND
IN
CO
RP
OR
AT
ED
AR
EA
S
FL
OO
DW
AY
DA
TA
CL
EA
R C
RE
EK
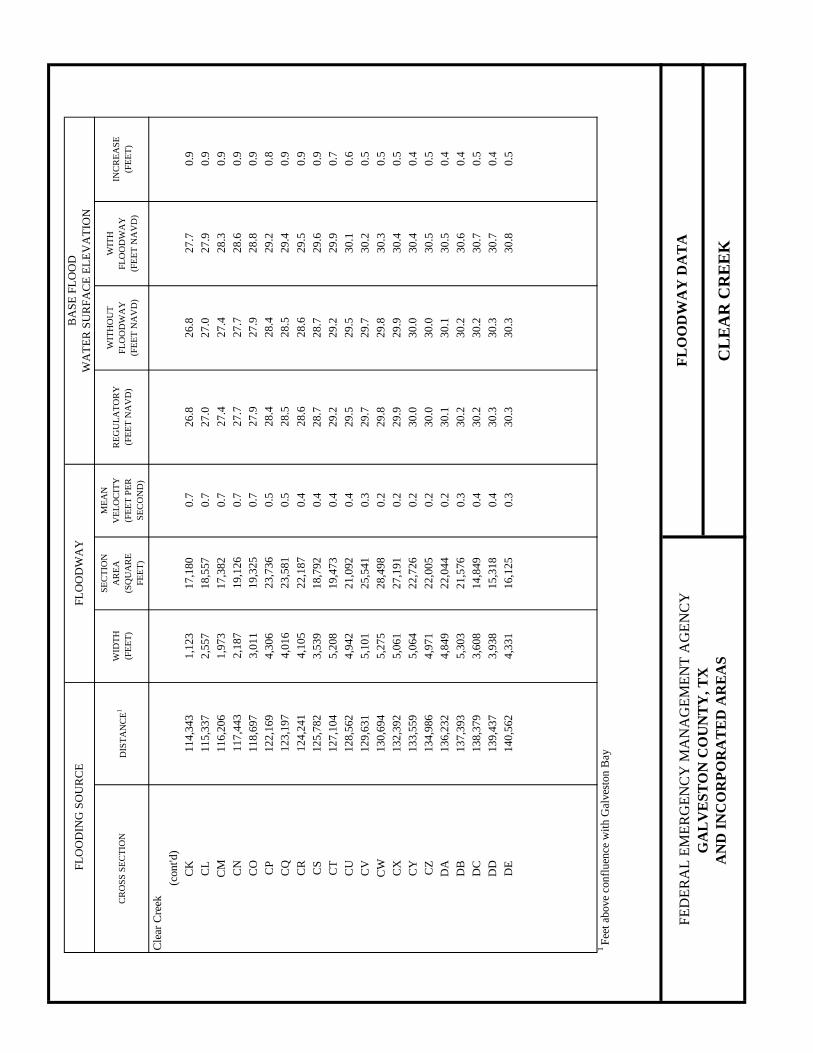
CR
OS
S S
EC
TIO
ND
IST
AN
CE
1W
IDT
H
(FE
ET
)
SE
CT
ION
AR
EA
(SQ
UA
RE
FE
ET
)
ME
AN
VE
LO
CIT
Y
(FE
ET
PE
R
SE
CO
ND
)
RE
GU
LA
TO
RY
(FE
ET
NA
VD
)
WIT
HO
UT
FL
OO
DW
AY
(FE
ET
NA
VD
)
WIT
H
FL
OO
DW
AY
(FE
ET
NA
VD
)
INC
RE
AS
E
(FE
ET
)
Cle
ar C
reek
(con
t'd
)
CK
11
4,3
43
1,1
23
17
,18
00
.72
6.8
26
.82
7.7
0.9
CL
11
5,3
37
2,5
57
18
,55
70
.72
7.0
27
.02
7.9
0.9
CM
11
6,2
06
1,9
73
17
,38
20
.72
7.4
27
.42
8.3
0.9
CN
11
7,4
43
2,1
87
19
,12
60
.72
7.7
27
.72
8.6
0.9
CO
11
8,6
97
3,0
11
19
,32
50
.72
7.9
27
.92
8.8
0.9
CP
12
2,1
69
4,3
06
23
,73
60
.52
8.4
28
.42
9.2
0.8
CQ
12
3,1
97
4,0
16
23
,58
10
.52
8.5
28
.52
9.4
0.9
CR
12
4,2
41
4,1
05
22
,18
70
.42
8.6
28
.62
9.5
0.9
CS
12
5,7
82
3,5
39
18
,79
20
.42
8.7
28
.72
9.6
0.9
CT
12
7,1
04
5,2
08
19
,47
30
.42
9.2
29
.22
9.9
0.7
CU
12
8,5
62
4,9
42
21
,09
20
.42
9.5
29
.53
0.1
0.6
CV
12
9,6
31
5,1
01
25
,54
10
.32
9.7
29
.73
0.2
0.5
CW
13
0,6
94
5,2
75
28
,49
80
.22
9.8
29
.83
0.3
0.5
CX
13
2,3
92
5,0
61
27
,19
10
.22
9.9
29
.93
0.4
0.5
CY
13
3,5
59
5,0
64
22
,72
60
.23
0.0
30
.03
0.4
0.4
CZ
13
4,9
86
4,9
71
22
,00
50
.23
0.0
30
.03
0.5
0.5
DA
13
6,2
32
4,8
49
22
,04
40
.23
0.1
30
.13
0.5
0.4
DB
13
7,3
93
5,3
03
21
,57
60
.33
0.2
30
.23
0.6
0.4
DC
13
8,3
79
3,6
08
14
,84
90
.43
0.2
30
.23
0.7
0.5
DD
13
9,4
37
3,9
38
15
,31
80
.43
0.3
30
.33
0.7
0.4
DE
14
0,5
62
4,3
31
16
,12
50
.33
0.3
30
.33
0.8
0.5
1 F
eet
above
con
flu
ence
wit
h G
alves
ton
Bay
FL
OO
DIN
G S
OU
RC
EF
LO
OD
WA
YB
AS
E F
LO
OD
WA
TE
R S
UR
FA
CE
EL
EV
AT
ION
F
ED
ER
AL
EM
ER
GE
NC
Y M
AN
AG
EM
EN
T A
GE
NC
Y
GA
LV
ES
TO
N C
OU
NT
Y,
TX
AN
D I
NC
OR
PO
RA
TE
D A
RE
AS
FL
OO
DW
AY
DA
TA
CL
EA
R C
RE
EK
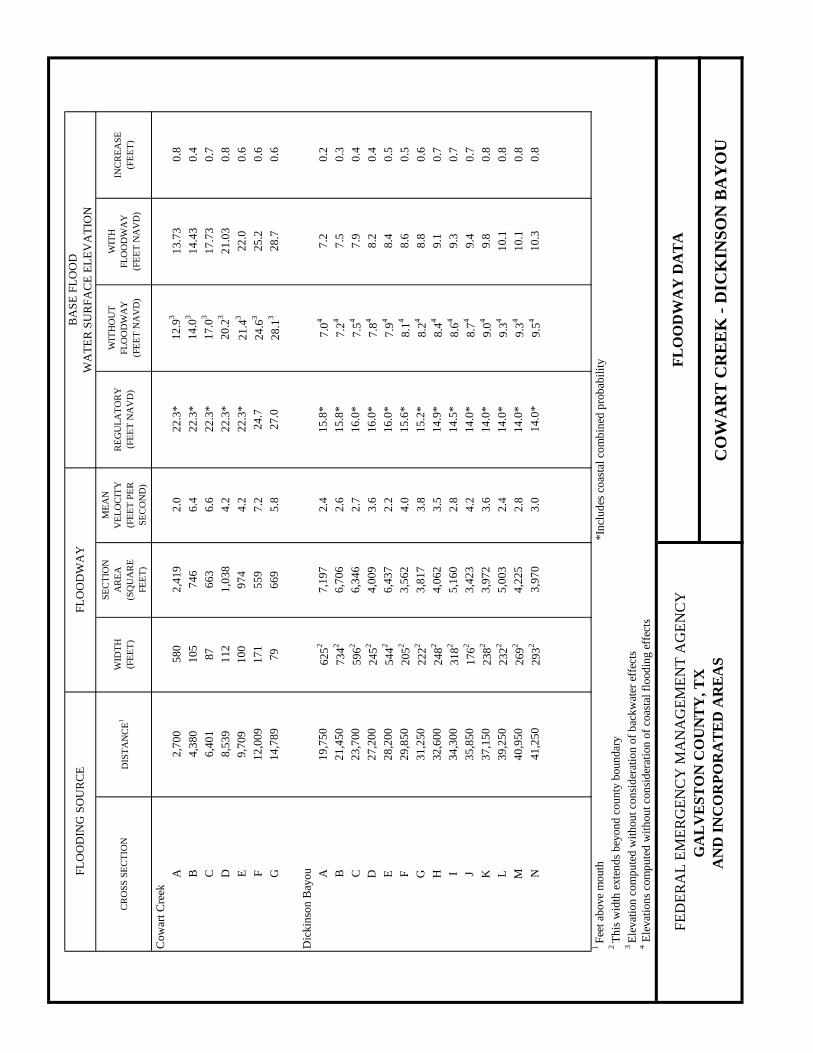
CR
OS
S S
EC
TIO
ND
IST
AN
CE
1W
IDT
H
(FE
ET
)
SE
CT
ION
AR
EA
(SQ
UA
RE
FE
ET
)
ME
AN
VE
LO
CIT
Y
(FE
ET
PE
R
SE
CO
ND
)
RE
GU
LA
TO
RY
(FE
ET
NA
VD
)
WIT
HO
UT
FL
OO
DW
AY
(FE
ET
NA
VD
)
WIT
H
FL
OO
DW
AY
(FE
ET
NA
VD
)
INC
RE
AS
E
(FE
ET
)
Cow
art
Cre
ek
A2
,70
05
80
2,4
19
2.0
22
.3*
12
.93
13
.73
0.8
B4
,38
01
05
74
66
.42
2.3
*1
4.0
31
4.4
30
.4
C6
,40
18
76
63
6.6
22
.3*
17
.03
17
.73
0.7
D8
,53
91
12
1,0
38
4.2
22
.3*
20
.23
21
.03
0.8
E9
,70
91
00
97
44
.22
2.3
*2
1.4
32
2.0
0.6
F1
2,0
09
17
15
59
7.2
24
.72
4.6
32
5.2
0.6
G1
4,7
89
79
66
95
.82
7.0
28
.13
28
.70
.6
Dic
kin
son
Bay
ou A
19
,75
0
62
52
7,1
97
2.4
15
.8*
7.0
47
.20
.2
B2
1,4
50
7
34
26
,70
62
.61
5.8
*7
.24
7.5
0.3
C2
3,7
00
5
96
26
,34
62
.71
6.0
*7
.54
7.9
0.4
D2
7,2
00
24
52
4,0
09
3.6
16
.0*
7.8
48
.20
.4
E2
8,2
00
54
42
6,4
37
2.2
16
.0*
7.9
48
.40
.5
F2
9,8
50
20
52
3,5
62
4.0
15
.6*
8.1
48
.60
.5
G3
1,2
50
22
22
3,8
17
3.8
15
.2*
8.2
48
.80
.6
H3
2,6
00
24
82
4,0
62
3.5
14
.9*
8.4
49
.10
.7
I3
4,3
00
31
82
5,1
60
2.8
14
.5*
8.6
49
.30
.7
J3
5,8
50
17
62
3,4
23
4.2
14
.0*
8.7
49
.40
.7
K3
7,1
50
23
82
3,9
72
3.6
14
.0*
9.0
49
.80
.8
L3
9,2
50
23
22
5,0
03
2.4
14
.0*
9.3
41
0.1
0.8
M4
0,9
50
26
92
4,2
25
2.8
14
.0*
9.3
41
0.1
0.8
N4
1,2
50
29
32
3,9
70
3.0
14
.0*
9.5
41
0.3
0.8
1 F
eet
above
mou
th*In
clu
des
coas
tal
com
bin
ed p
rob
abil
ity
2 T
his
wid
th e
xte
nd
s b
eyon
d c
ou
nty
bou
nd
ary
3 E
levat
ion
com
pu
ted
wit
hou
t co
nsi
der
atio
n o
f b
ackw
ater
eff
ects
4 E
levat
ion
s co
mp
ute
d w
ith
ou
t co
nsi
der
atio
n o
f co
asta
l fl
ood
ing e
ffec
ts
FL
OO
DIN
G S
OU
RC
EF
LO
OD
WA
YB
AS
E F
LO
OD
WA
TE
R S
UR
FA
CE
EL
EV
AT
ION
F
ED
ER
AL
EM
ER
GE
NC
Y M
AN
AG
EM
EN
T A
GE
NC
Y
G
AL
VE
ST
ON
CO
UN
TY
, T
X
A
ND
IN
CO
RP
OR
AT
ED
AR
EA
S
FL
OO
DW
AY
DA
TA
CO
WA
RT
CR
EE
K -
DIC
KIN
SO
N B
AY
OU
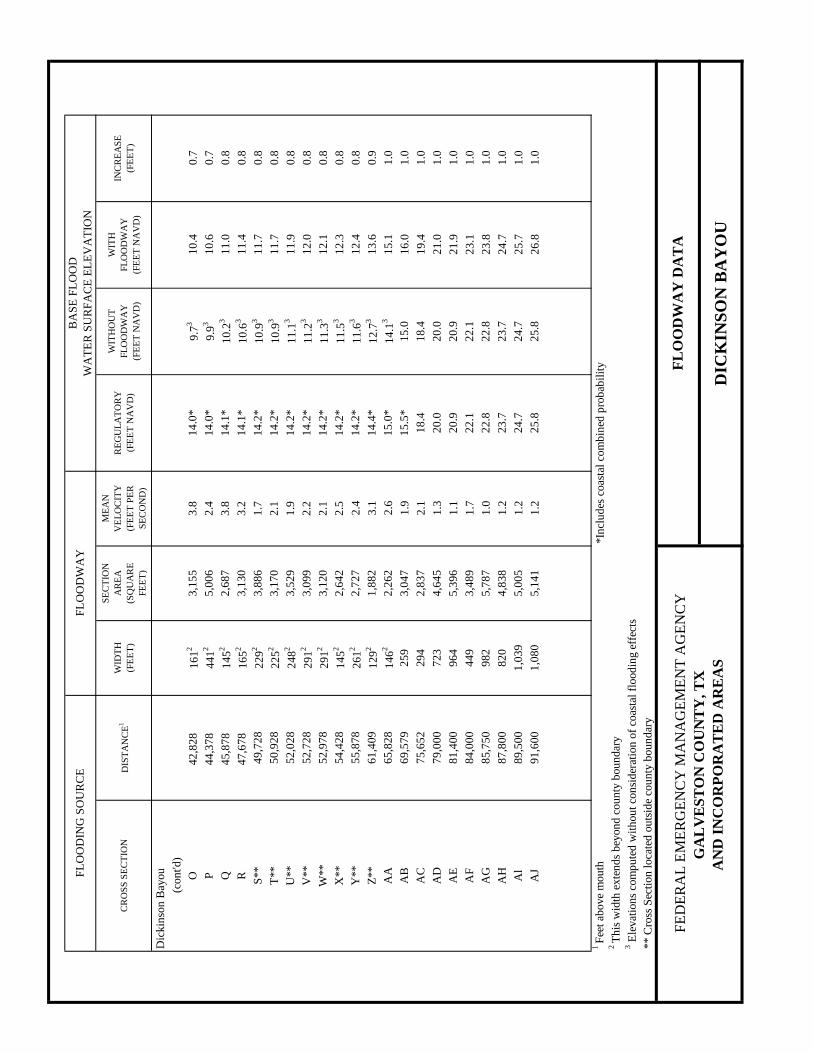
CR
OS
S S
EC
TIO
ND
IST
AN
CE
1W
IDT
H
(FE
ET
)
SE
CT
ION
AR
EA
(SQ
UA
RE
FE
ET
)
ME
AN
VE
LO
CIT
Y
(FE
ET
PE
R
SE
CO
ND
)
RE
GU
LA
TO
RY
(FE
ET
NA
VD
)
WIT
HO
UT
FL
OO
DW
AY
(FE
ET
NA
VD
)
WIT
H
FL
OO
DW
AY
(FE
ET
NA
VD
)
INC
RE
AS
E
(FE
ET
)
Dic
kin
son
Bay
ou
(con
t'd)
O4
2,8
28
16
12
3,1
55
3.8
14
.0*
9.7
31
0.4
0.7
P4
4,3
78
44
12
5,0
06
2.4
14
.0*
9.9
31
0.6
0.7
Q4
5,8
78
14
52
2,6
87
3.8
14
.1*
10
.23
11
.00
.8
R4
7,6
78
16
52
3,1
30
3.2
14
.1*
10
.63
11
.40
.8
S**
49
,72
8
22
92
3,8
86
1.7
14
.2*
10
.93
11
.70
.8
T**
50
,92
8
22
52
3,1
70
2.1
14
.2*
10
.93
11
.70
.8
U**
52
,02
8
24
82
3,5
29
1.9
14
.2*
11
.13
11
.90
.8
V**
52
,72
8
29
12
3,0
99
2.2
14
.2*
11
.23
12
.00
.8
W**
52
,97
8
29
12
3,1
20
2.1
14
.2*
11
.33
12
.10
.8
X**
54
,42
8
14
52
2,6
42
2.5
14
.2*
11
.53
12
.30
.8
Y**
55
,87
8
26
12
2,7
27
2.4
14
.2*
11
.63
12
.40
.8
Z**
61
,40
9
12
92
1,8
82
3.1
14
.4*
12
.73
13
.60
.9
AA
65
,82
8
14
62
2,2
62
2.6
15
.0*
14
.13
15
.11
.0
AB
69
,57
9
25
93
,04
71
.91
5.5
*1
5.0
16
.01
.0
AC
75
,65
2
29
42
,83
72
.11
8.4
18
.41
9.4
1.0
AD
79
,00
0
72
34
,64
51
.32
0.0
20
.02
1.0
1.0
AE
81
,40
0
96
45
,39
61
.12
0.9
20
.92
1.9
1.0
AF
84
,00
0
44
93
,48
91
.72
2.1
22
.12
3.1
1.0
AG
85
,75
0
98
25
,78
71
.02
2.8
22
.82
3.8
1.0
AH
87
,80
0
82
04
,83
81
.22
3.7
23
.72
4.7
1.0
Al
89
,50
0
1,0
39
5,0
05
1.2
24
.72
4.7
25
.71
.0
AJ
91
,60
0
1,0
80
5,1
41
1.2
25
.82
5.8
26
.81
.0
1 F
eet
above
mou
th*In
clu
des
coas
tal
com
bin
ed p
rob
abil
ity
2 T
his
wid
th e
xte
nd
s b
eyon
d c
ou
nty
bou
nd
ary
3 E
levat
ion
s co
mp
ute
d w
ith
ou
t co
nsi
der
atio
n o
f co
asta
l fl
ood
ing e
ffec
ts
** C
ross
Sec
tion
loca
ted
ou
tsid
e co
un
ty b
ou
nd
ary
FL
OO
DIN
G S
OU
RC
EF
LO
OD
WA
YB
AS
E F
LO
OD
WA
TE
R S
UR
FA
CE
EL
EV
AT
ION
F
ED
ER
AL
EM
ER
GE
NC
Y M
AN
AG
EM
EN
T A
GE
NC
Y
G
AL
VE
ST
ON
CO
UN
TY
, T
X
A
ND
IN
CO
RP
OR
AT
ED
AR
EA
S
FL
OO
DW
AY
DA
TA
DIC
KIN
SO
N B
AY
OU
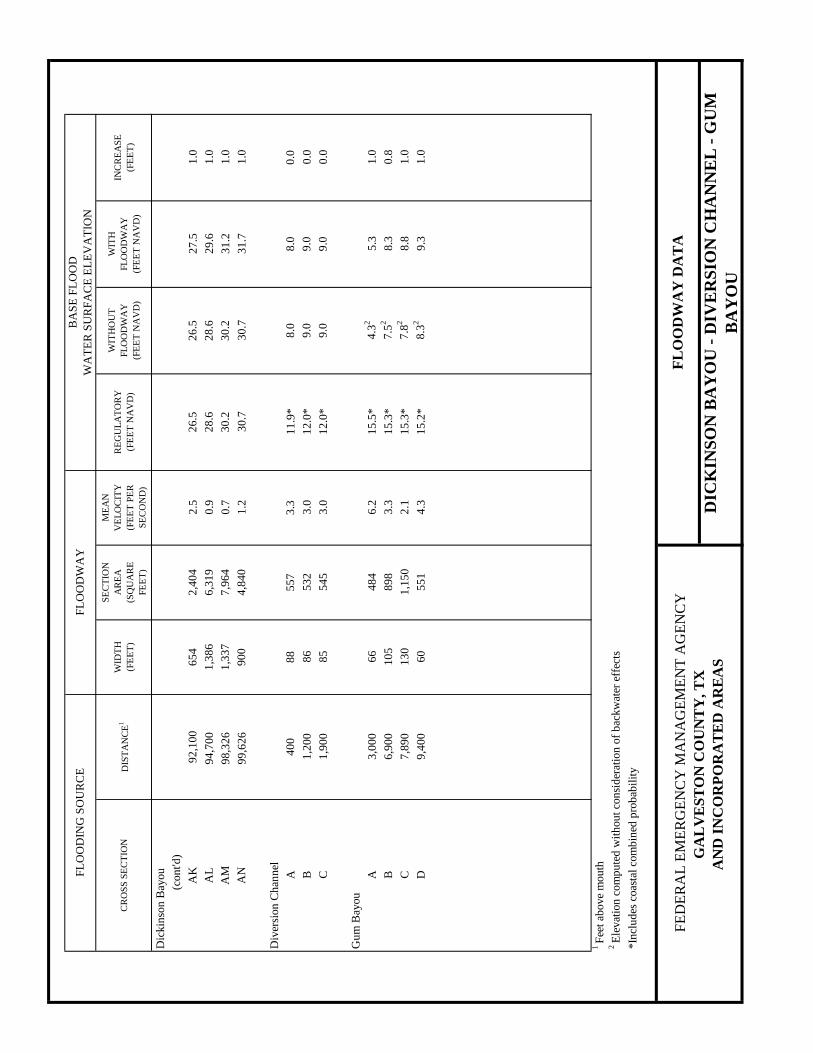
CR
OS
S S
EC
TIO
ND
IST
AN
CE
1W
IDT
H
(FE
ET
)
SE
CT
ION
AR
EA
(SQ
UA
RE
FE
ET
)
ME
AN
VE
LO
CIT
Y
(FE
ET
PE
R
SE
CO
ND
)
RE
GU
LA
TO
RY
(FE
ET
NA
VD
)
WIT
HO
UT
FL
OO
DW
AY
(FE
ET
NA
VD
)
WIT
H
FL
OO
DW
AY
(FE
ET
NA
VD
)
INC
RE
AS
E
(FE
ET
)
Dic
kin
son
Bay
ou
(c
on
t'd)
AK
92
,10
0
65
42
,40
42
.52
6.5
26
.52
7.5
1.0
AL
94
,70
01
,38
66
,31
90
.92
8.6
28
.62
9.6
1.0
AM
98
,32
61
,33
77
,96
40
.73
0.2
30
.23
1.2
1.0
AN
99
,62
69
00
4,8
40
1.2
30
.73
0.7
31
.71
.0
Div
ersi
on
Ch
ann
el
A4
00
88
55
73
.31
1.9
*8
.08
.00
.0
B1
,20
08
65
32
3.0
12
.0*
9.0
9.0
0.0
C1
,90
08
55
45
3.0
12
.0*
9.0
9.0
0.0
Gu
m B
ayou
A3
,00
06
64
84
6.2
15
.5*
4.3
25
.31
.0
B6
,90
01
05
89
83
.31
5.3
*7
.52
8.3
0.8
C7
,89
01
30
1,1
50
2.1
15
.3*
7.8
28
.81
.0
D9
,40
06
05
51
4.3
15
.2*
8.3
29
.31
.0
1 F
eet
above
mou
th2
Ele
vat
ion
com
pu
ted
wit
hou
t co
nsi
der
atio
n o
f b
ackw
ater
eff
ects
*In
clu
des
coas
tal
com
bin
ed p
rob
abil
ity
FL
OO
DIN
G S
OU
RC
EF
LO
OD
WA
YB
AS
E F
LO
OD
WA
TE
R S
UR
FA
CE
EL
EV
AT
ION
F
ED
ER
AL
EM
ER
GE
NC
Y M
AN
AG
EM
EN
T A
GE
NC
Y
G
AL
VE
ST
ON
CO
UN
TY
, T
X
A
ND
IN
CO
RP
OR
AT
ED
AR
EA
S
FL
OO
DW
AY
DA
TA
DIC
KIN
SO
N B
AY
OU
- D
IVE
RS
ION
CH
AN
NE
L -
GU
M
BA
YO
U
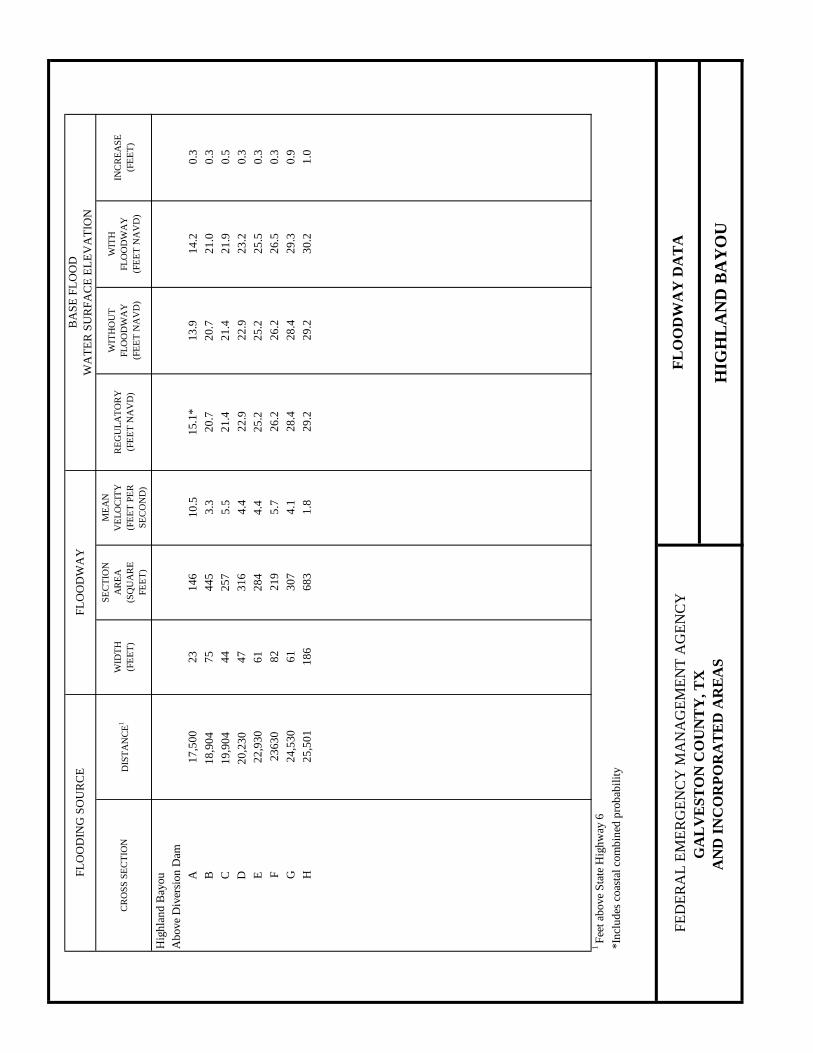
CR
OS
S S
EC
TIO
ND
IST
AN
CE
1W
IDT
H
(FE
ET
)
SE
CT
ION
AR
EA
(SQ
UA
RE
FE
ET
)
ME
AN
VE
LO
CIT
Y
(FE
ET
PE
R
SE
CO
ND
)
RE
GU
LA
TO
RY
(FE
ET
NA
VD
)
WIT
HO
UT
FL
OO
DW
AY
(FE
ET
NA
VD
)
WIT
H
FL
OO
DW
AY
(FE
ET
NA
VD
)
INC
RE
AS
E
(FE
ET
)
Hig
hla
nd
Bay
ou
Ab
ove
Div
ersi
on
Dam
A1
7,5
00
2
31
46
10
.51
5.1
*1
3.9
14
.20
.3
B1
8,9
04
75
44
53
.32
0.7
20
.72
1.0
0.3
C1
9,9
04
44
25
75
.52
1.4
21
.42
1.9
0.5
D2
0,2
30
47
31
64
.42
2.9
22
.92
3.2
0.3
E2
2,9
30
6
12
84
4.4
25
.22
5.2
25
.50
.3
F2
36
30
82
21
95
.72
6.2
26
.22
6.5
0.3
G2
4,5
30
61
30
74
.12
8.4
28
.42
9.3
0.9
H2
5,5
01
18
66
83
1.8
29
.22
9.2
30
.21
.0
1 F
eet
above
Sta
te H
igh
way
6
*In
clu
des
coas
tal
com
bin
ed p
rob
abil
ity
FL
OO
DIN
G S
OU
RC
EF
LO
OD
WA
YB
AS
E F
LO
OD
WA
TE
R S
UR
FA
CE
EL
EV
AT
ION
F
ED
ER
AL
EM
ER
GE
NC
Y M
AN
AG
EM
EN
T A
GE
NC
Y
G
AL
VE
ST
ON
CO
UN
TY
, T
X
A
ND
IN
CO
RP
OR
AT
ED
AR
EA
S
FL
OO
DW
AY
DA
TA
HIG
HL
AN
D B
AY
OU

CR
OS
S S
EC
TIO
ND
IST
AN
CE
1W
IDT
H
(FE
ET
)
SE
CT
ION
AR
EA
(SQ
UA
RE
FE
ET
)
ME
AN
VE
LO
CIT
Y
(FE
ET
PE
R
SE
CO
ND
)
RE
GU
LA
TO
RY
(FE
ET
NA
VD
)
WIT
HO
UT
FL
OO
DW
AY
(FE
ET
NA
VD
)2
WIT
H
FL
OO
DW
AY
(FE
ET
NA
VD
)
INC
RE
AS
E
(FE
ET
)
Low
er H
igh
lan
d B
ayou
A8
,21
74
00
2,5
12
2.8
15
.3*
3.4
3.9
0.5
B1
0,6
67
55
33
,83
91
.81
5.3
*3
.84
.40
.6
C1
3,3
89
32
72
,60
71
.81
5.0
*4
.14
.70
.6
D1
6,4
39
18
01
,60
92
.91
5.0
*4
.45
.10
.7
E1
8,1
39
17
81
,69
82
.71
5.3
*4
.55
.40
.9
F2
0,4
39
54
63
,26
61
.41
4.9
*4
.85
.81
.0
G2
2,7
39
46
63
,10
41
.51
4.9
*5
.06
.01
.0
H2
4,8
39
18
11
,61
42
.51
4.9
*5
.26
.21
.0
I2
7,0
39
97
1,0
45
3.9
14
.9*
5.6
6.6
1.0
J2
9,9
92
84
1,0
51
3.8
14
.6*
6.6
7.5
0.9
K3
1,9
92
78
1,0
04
3.4
14
.6*
7.1
8.0
0.9
L3
3,7
92
72
85
74
.01
4.5
*7
.58
.51
.0
M3
5,5
92
10
01
,22
22
.81
4.3
*8
.09
.01
.0
N3
9,6
45
11
01
,13
33
.11
3.3
*8
.49
.41
.0
O4
3,4
23
48
62
83
.41
2.5
*9
.21
0.1
0.9
P4
5,1
23
97
98
02
.21
2.4
*9
.81
0.8
1.0
Q4
8,1
03
60
61
92
.61
2.8
*1
1.1
11
.90
.8
1 D
ista
nce
in
fee
t ab
ove
mou
th2
Ele
vat
ion
com
pu
ted
wit
hou
t co
nsi
der
atio
n o
f b
ackw
ater
eff
ects
*In
clu
des
coas
tal
com
bin
ed p
rob
abil
ity
FL
OO
DIN
G S
OU
RC
EF
LO
OD
WA
YB
AS
E F
LO
OD
WA
TE
R S
UR
FA
CE
EL
EV
AT
ION
F
ED
ER
AL
EM
ER
GE
NC
Y M
AN
AG
EM
EN
T A
GE
NC
Y
G
AL
VE
ST
ON
CO
UN
TY
, T
X
A
ND
IN
CO
RP
OR
AT
ED
AR
EA
S
FL
OO
DW
AY
DA
TA
LO
WE
R H
IGH
LA
ND
BA
YO
U
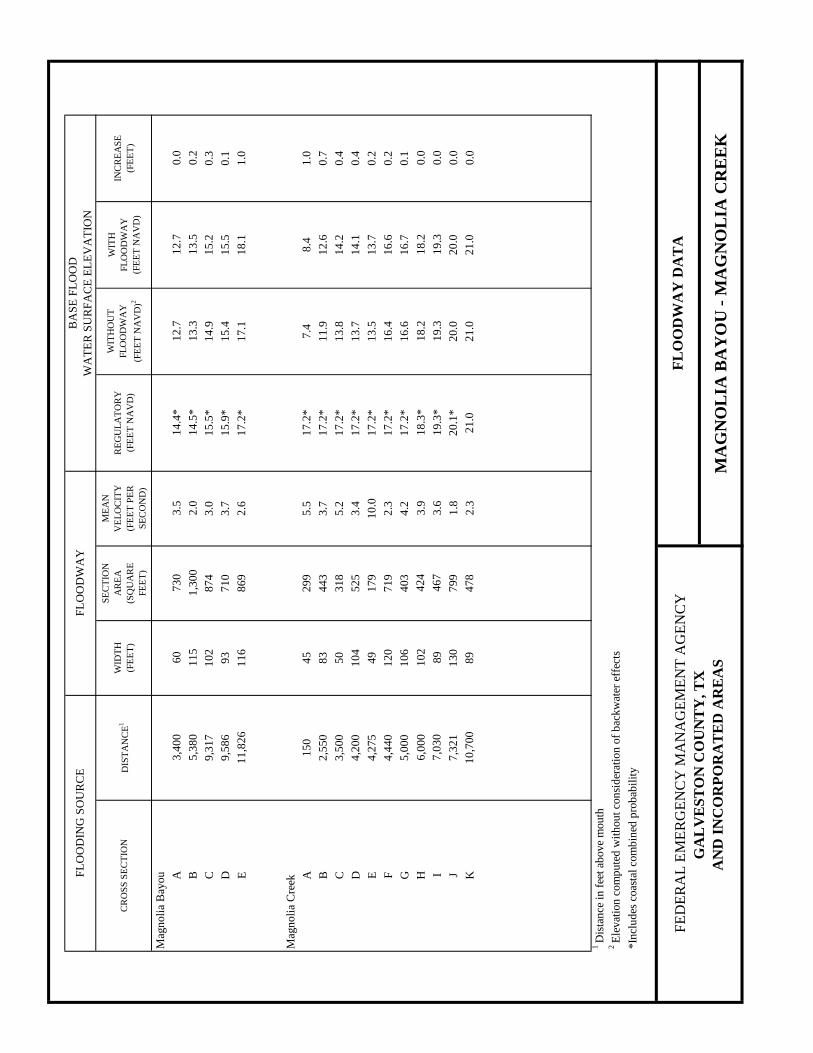
CR
OS
S S
EC
TIO
ND
IST
AN
CE
1W
IDT
H
(FE
ET
)
SE
CT
ION
AR
EA
(SQ
UA
RE
FE
ET
)
ME
AN
VE
LO
CIT
Y
(FE
ET
PE
R
SE
CO
ND
)
RE
GU
LA
TO
RY
(FE
ET
NA
VD
)
WIT
HO
UT
FL
OO
DW
AY
(FE
ET
NA
VD
)2
WIT
H
FL
OO
DW
AY
(FE
ET
NA
VD
)
INC
RE
AS
E
(FE
ET
)
Mag
noli
a B
ayou A
3,4
00
60
73
03
.51
4.4
*1
2.7
12
.70
.0
B5
,38
01
15
1,3
00
2.0
14
.5*
13
.31
3.5
0.2
C9
,31
71
02
87
43
.01
5.5
*1
4.9
15
.20
.3
D9
,58
69
37
10
3.7
15
.9*
15
.41
5.5
0.1
E1
1,8
26
11
68
69
2.6
17
.2*
17
.11
8.1
1.0
Mag
noli
a C
reek
A1
50
45
29
95
.51
7.2
*7
.48
.41
.0
B2
,55
08
34
43
3.7
17
.2*
11
.91
2.6
0.7
C3
,50
05
03
18
5.2
17
.2*
13
.81
4.2
0.4
D4
,20
01
04
52
53
.41
7.2
*1
3.7
14
.10
.4
E4
,27
54
91
79
10
.01
7.2
*1
3.5
13
.70
.2
F4
,44
01
20
71
92
.31
7.2
*1
6.4
16
.60
.2
G5
,00
01
06
40
34
.21
7.2
*1
6.6
16
.70
.1
H6
,00
01
02
42
43
.91
8.3
*1
8.2
18
.20
.0
I7
,03
08
94
67
3.6
19
.3*
19
.31
9.3
0.0
J7
,32
11
30
79
91
.82
0.1
*2
0.0
20
.00
.0
K1
0,7
00
89
47
82
.32
1.0
21
.02
1.0
0.0
1 D
ista
nce
in
fee
t ab
ove
mou
th2
Ele
vat
ion
com
pu
ted
wit
hou
t co
nsi
der
atio
n o
f b
ackw
ater
eff
ects
*In
clu
des
coas
tal
com
bin
ed p
rob
abil
ity
FL
OO
DIN
G S
OU
RC
EF
LO
OD
WA
YB
AS
E F
LO
OD
WA
TE
R S
UR
FA
CE
EL
EV
AT
ION
F
ED
ER
AL
EM
ER
GE
NC
Y M
AN
AG
EM
EN
T A
GE
NC
Y
G
AL
VE
ST
ON
CO
UN
TY
, T
X
A
ND
IN
CO
RP
OR
AT
ED
AR
EA
S
FL
OO
DW
AY
DA
TA
MA
GN
OL
IA B
AY
OU
- M
AG
NO
LIA
CR
EE
K
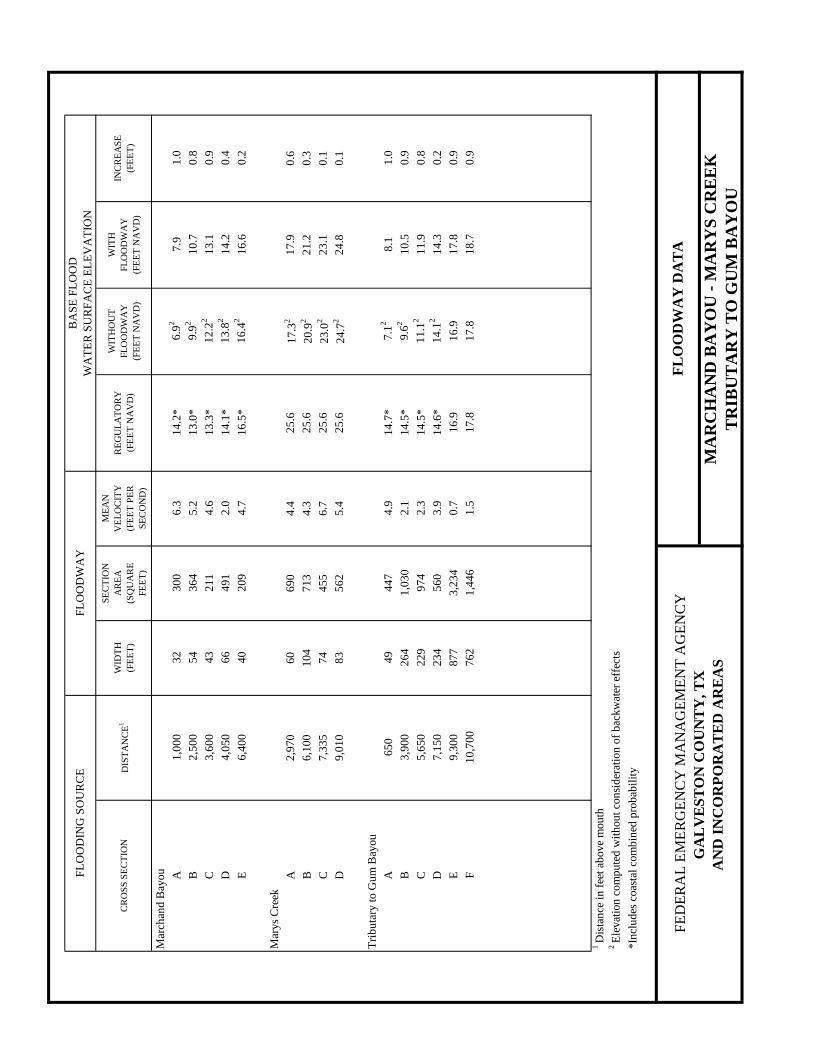
CR
OS
S S
EC
TIO
ND
IST
AN
CE
1W
IDT
H
(FE
ET
)
SE
CT
ION
AR
EA
(SQ
UA
RE
FE
ET
)
ME
AN
VE
LO
CIT
Y
(FE
ET
PE
R
SE
CO
ND
)
RE
GU
LA
TO
RY
(FE
ET
NA
VD
)
WIT
HO
UT
FL
OO
DW
AY
(FE
ET
NA
VD
)
WIT
H
FL
OO
DW
AY
(FE
ET
NA
VD
)
INC
RE
AS
E
(FE
ET
)
Mar
chan
d B
ayou A
1,0
00
32
30
06
.31
4.2
*6
.92
7.9
1.0
B2
,50
05
43
64
5.2
13
.0*
9.9
21
0.7
0.8
C3
,60
04
32
11
4.6
13
.3*
12
.22
13
.10
.9
D4
,05
06
64
91
2.0
14
.1*
13
.82
14
.20
.4
E6
,40
04
02
09
4.7
16
.5*
16
.42
16
.60
.2
Mar
ys
Cre
ek
A2
,97
06
06
90
4.4
25
.61
7.3
21
7.9
0.6
B6
,10
01
04
71
34
.32
5.6
20
.92
21
.20
.3
C7
,33
57
44
55
6.7
25
.62
3.0
22
3.1
0.1
D9
,01
08
35
62
5.4
25
.62
4.7
22
4.8
0.1
Tri
bu
tary
to G
um
Bay
ou
A6
50
49
44
74
.91
4.7
*7
.12
8.1
1.0
B3
,90
02
64
1,0
30
2.1
14
.5*
9.6
21
0.5
0.9
C5
,65
02
29
97
42
.31
4.5
*1
1.1
21
1.9
0.8
D7
,15
02
34
56
03
.91
4.6
*1
4.1
21
4.3
0.2
E9
,30
08
77
3,2
34
0.7
16
.91
6.9
17
.80
.9
F1
0,7
00
76
21
,44
61
.51
7.8
17
.81
8.7
0.9
1 D
ista
nce
in
fee
t ab
ove
mou
th2
Ele
vat
ion
com
pu
ted
wit
hou
t co
nsi
der
atio
n o
f b
ackw
ater
eff
ects
*In
clu
des
coas
tal
com
bin
ed p
rob
abil
ity
FL
OO
DIN
G S
OU
RC
EF
LO
OD
WA
YB
AS
E F
LO
OD
WA
TE
R S
UR
FA
CE
EL
EV
AT
ION
F
ED
ER
AL
EM
ER
GE
NC
Y M
AN
AG
EM
EN
T A
GE
NC
Y
G
AL
VE
ST
ON
CO
UN
TY
, T
X
A
ND
IN
CO
RP
OR
AT
ED
AR
EA
S
FL
OO
DW
AY
DA
TA
MA
RC
HA
ND
BA
YO
U -
MA
RY
S C
RE
EK
TR
IBU
TA
RY
TO
GU
M B
AY
OU
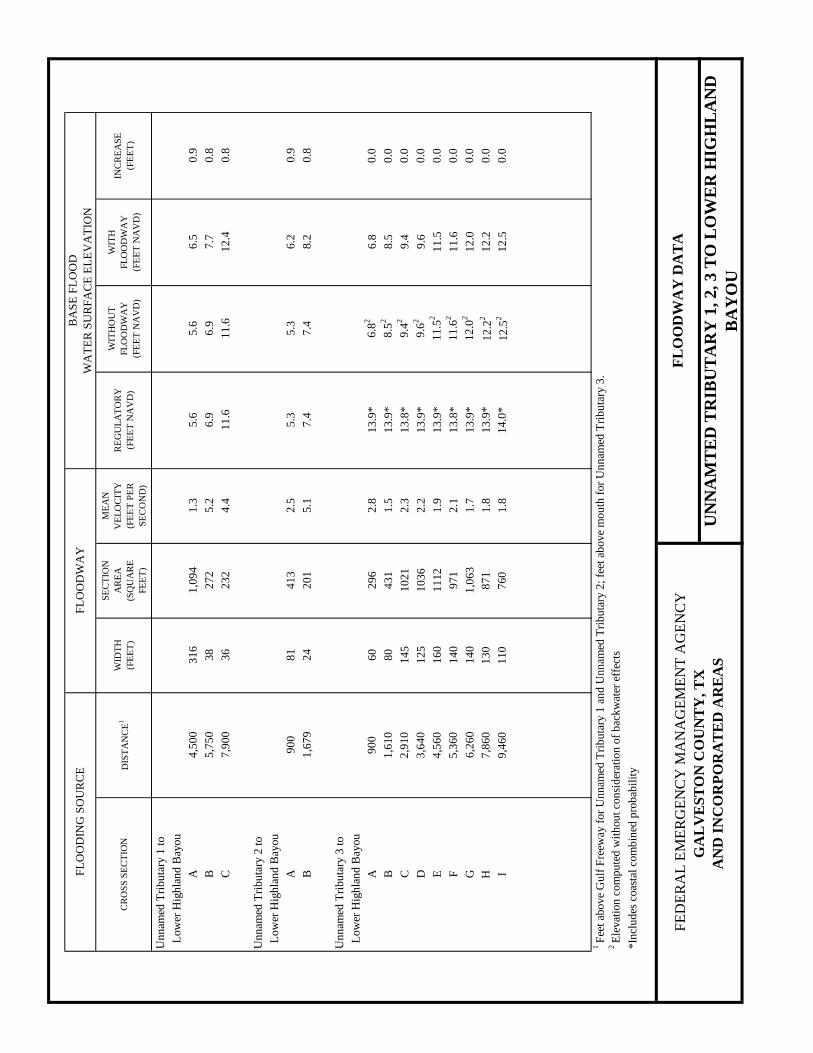
CR
OS
S S
EC
TIO
ND
IST
AN
CE
1W
IDT
H
(FE
ET
)
SE
CT
ION
AR
EA
(SQ
UA
RE
FE
ET
)
ME
AN
VE
LO
CIT
Y
(FE
ET
PE
R
SE
CO
ND
)
RE
GU
LA
TO
RY
(FE
ET
NA
VD
)
WIT
HO
UT
FL
OO
DW
AY
(FE
ET
NA
VD
)
WIT
H
FL
OO
DW
AY
(FE
ET
NA
VD
)
INC
RE
AS
E
(FE
ET
)
Un
nam
ed T
rib
uta
ry 1
to
L
ow
er H
igh
lan
d B
ayou
A4
,50
03
16
1,0
94
1.3
5.6
5.6
6.5
0.9
B5
,75
03
82
72
5.2
6.9
6.9
7.7
0.8
C7
,90
03
62
32
4.4
11
.61
1.6
12
.40
.8
Un
nam
ed T
rib
uta
ry 2
to
L
ow
er H
igh
lan
d B
ayou
A9
00
81
41
32
.55
.35
.36
.20
.9
B1
,67
92
42
01
5.1
7.4
7.4
8.2
0.8
Un
nam
ed T
rib
uta
ry 3
to
L
ow
er H
igh
lan
d B
ayou
A9
00
60
29
62
.81
3.9
*6
.82
6.8
0.0
B1
,61
08
04
31
1.5
13
.9*
8.5
28
.50
.0
C2
,91
01
45
10
21
2.3
13
.8*
9.4
29
.40
.0
D3
,64
01
25
10
36
2.2
13
.9*
9.6
29
.60
.0
E4
,56
01
60
11
12
1.9
13
.9*
11
.52
11
.50
.0
F5
,36
01
40
97
12
.11
3.8
*1
1.6
21
1.6
0.0
G6
,26
01
40
1,0
63
1.7
13
.9*
12
.02
12
.00
.0
H7
,86
01
30
87
11
.81
3.9
*1
2.2
21
2.2
0.0
I9
,46
01
10
76
01
.81
4.0
*1
2.5
21
2.5
0.0
2 E
levat
ion
com
pu
ted
wit
hou
t co
nsi
der
atio
n o
f b
ackw
ater
eff
ects
*In
clu
des
coas
tal
com
bin
ed p
rob
abil
ity
FL
OO
DIN
G S
OU
RC
EF
LO
OD
WA
YB
AS
E F
LO
OD
WA
TE
R S
UR
FA
CE
EL
EV
AT
ION
F
ED
ER
AL
EM
ER
GE
NC
Y M
AN
AG
EM
EN
T A
GE
NC
Y
G
AL
VE
ST
ON
CO
UN
TY
, T
X
A
ND
IN
CO
RP
OR
AT
ED
AR
EA
S
FL
OO
DW
AY
DA
TA
UN
NA
MT
ED
TR
IBU
TA
RY
1,
2,
3 T
O L
OW
ER
HIG
HL
AN
D
BA
YO
U
1 F
eet
above
Gu
lf F
reew
ay f
or
Un
nam
ed T
rib
uta
ry 1
an
d U
nn
amed
Tri
bu
tary
2;
feet
ab
ove
mou
th f
or
Un
nam
ed T
rib
uta
ry 3
.
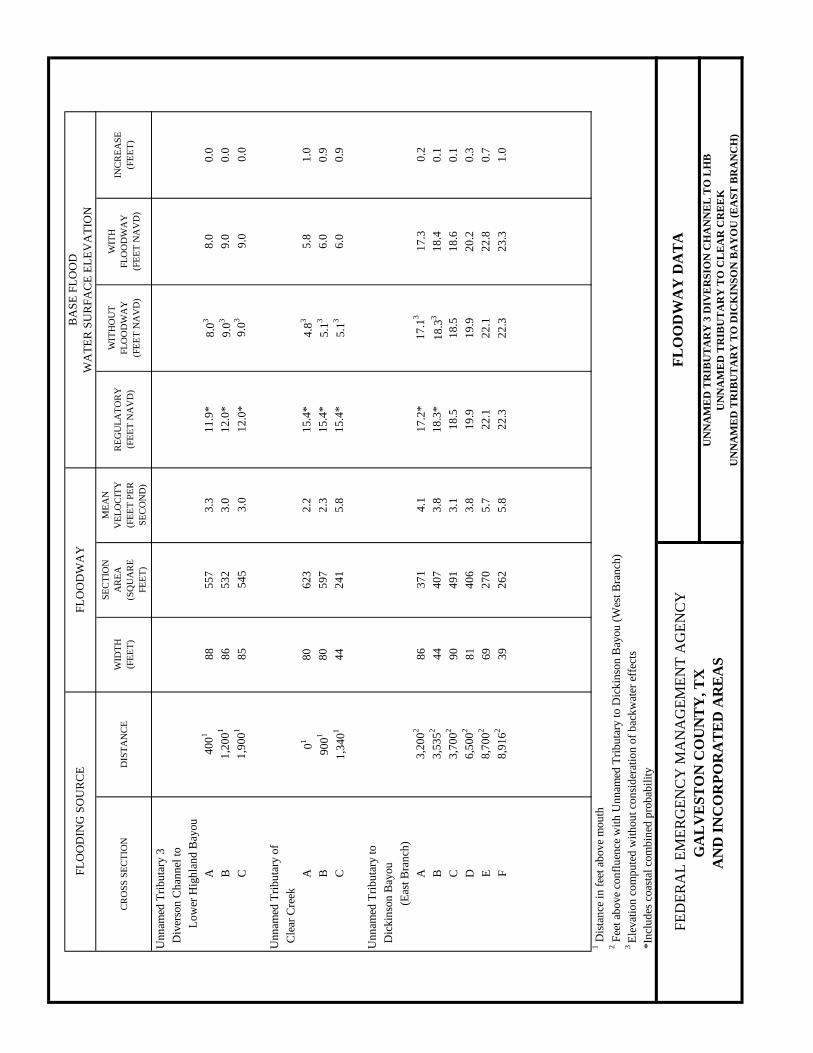
CR
OS
S S
EC
TIO
ND
IST
AN
CE
WID
TH
(FE
ET
)
SE
CT
ION
AR
EA
(SQ
UA
RE
FE
ET
)
ME
AN
VE
LO
CIT
Y
(FE
ET
PE
R
SE
CO
ND
)
RE
GU
LA
TO
RY
(FE
ET
NA
VD
)
WIT
HO
UT
FL
OO
DW
AY
(FE
ET
NA
VD
)
WIT
H
FL
OO
DW
AY
(FE
ET
NA
VD
)
INC
RE
AS
E
(FE
ET
)
Un
nam
ed T
rib
uta
ry 3
D
iver
son
Ch
ann
el t
o
Low
er H
igh
lan
d B
ayou
A4
00
18
85
57
3.3
11
.9*
8.0
38
.00
.0
B1
,20
01
86
53
23
.01
2.0
*9
.03
9.0
0.0
C1
,90
01
85
54
53
.01
2.0
*9
.03
9.0
0.0
Un
nam
ed T
rib
uta
ry o
f
C
lear
Cre
ek
A0
18
06
23
2.2
15
.4*
4.8
35
.81
.0
B9
00
18
05
97
2.3
15
.4*
5.1
36
.00
.9
C1
,34
01
44
24
15
.81
5.4
*5
.13
6.0
0.9
Un
nam
ed T
rib
uta
ry t
o
D
ickin
son
Bay
ou
(Eas
t B
ran
ch)
A3
,20
02
86
37
14
.11
7.2
*1
7.1
31
7.3
0.2
B3
,53
52
44
40
73
.81
8.3
*1
8.3
31
8.4
0.1
C3
,70
02
90
49
13
.11
8.5
18
.51
8.6
0.1
D6
,50
02
81
40
63
.81
9.9
19
.92
0.2
0.3
E8
,70
02
69
27
05
.72
2.1
22
.12
2.8
0.7
F8
,91
62
39
26
25
.82
2.3
22
.32
3.3
1.0
1 D
ista
nce
in
fee
t ab
ove
mou
th
3 E
levat
ion
com
pu
ted
wit
hou
t co
nsi
der
atio
n o
f b
ackw
ater
eff
ects
*In
clu
des
coas
tal
com
bin
ed p
rob
abil
ity
2 F
eet
above
con
flu
ence
wit
h U
nn
amed
Tri
bu
tary
to D
ickin
son
Bay
ou
(W
est
Bra
nch
)
FL
OO
DIN
G S
OU
RC
EF
LO
OD
WA
YB
AS
E F
LO
OD
WA
TE
R S
UR
FA
CE
EL
EV
AT
ION
F
ED
ER
AL
EM
ER
GE
NC
Y M
AN
AG
EM
EN
T A
GE
NC
Y
G
AL
VE
ST
ON
CO
UN
TY
, T
X
A
ND
IN
CO
RP
OR
AT
ED
AR
EA
S
FL
OO
DW
AY
DA
TA
UN
NA
ME
D T
RIB
UT
AR
Y 3
DIV
ER
SIO
N C
HA
NN
EL
TO
LH
B
UN
NA
ME
D T
RIB
UT
AR
Y T
O C
LE
AR
CR
EE
K
UN
NA
ME
D T
RIB
UT
AR
Y T
O D
ICK
INS
ON
BA
YO
U (
EA
ST
BR
AN
CH
)

CR
OS
S S
EC
TIO
ND
IST
AN
CE
WID
TH
(FE
ET
)
SE
CT
ION
AR
EA
(SQ
UA
RE
FE
ET
)
ME
AN
VE
LO
CIT
Y
(FE
ET
PE
R
SE
CO
ND
)
RE
GU
LA
TO
RY
(FE
ET
NA
VD
)
WIT
HO
UT
FL
OO
DW
AY
(FE
ET
NA
VD
)
WIT
H
FL
OO
DW
AY
(FE
ET
NA
VD
)
INC
RE
AS
E
(FE
ET
)
Un
nam
ed T
rib
uta
ry t
o
D
ick
inso
n B
ayou
(Wes
t B
ran
ch)
A5
00
15
24
19
5.4
14
.2*
8.4
39
.41
.0
B4
,50
01
12
04
72
2.0
14
.5*
13
.63
13
.60
.0
C4
,90
01
12
24
95
1.9
14
.5*
13
.83
13
.80
.0
D6
,80
01
52
18
75
.11
7.0
17
.01
7.4
0.4
E7
,30
01
89
37
72
.51
8.6
18
.61
9.5
0.9
F8
,70
01
70
43
74
.31
9.8
19
.82
0.8
1.0
G1
2,0
00
12
59
1,1
10
1.7
22
.62
2.6
23
.61
.0
Up
per
Hig
hla
nd
Bay
ou
A1
7,5
00
22
31
46
10
.51
4.9
*1
3.9
31
4.2
0.3
B1
8,9
04
27
54
45
3.3
20
.72
0.7
21
.00
.3
C1
9,9
04
24
42
57
5.5
21
.42
1.4
21
.90
.5
D2
0,2
30
24
73
16
4.4
22
.92
2.9
23
.20
.3
E2
2,9
30
26
12
84
4.4
25
.22
5.2
25
.50
.3
F2
3,6
30
28
22
19
5.7
26
.22
6.2
26
.50
.3
G2
4,5
30
26
13
07
4.1
28
.42
8.4
29
.30
.9
H2
5,5
01
21
86
68
31
.82
9.2
29
.23
0.2
1.0
3 E
levat
ion
com
pu
ted
wit
hou
t co
nsi
der
atio
n o
f b
ack
wat
er e
ffec
ts
*In
clu
des
coas
tal
com
bin
ed p
rob
abil
ity
FL
OO
DIN
G S
OU
RC
EF
LO
OD
WA
YB
AS
E F
LO
OD
WA
TE
R S
UR
FA
CE
EL
EV
AT
ION
1 D
ista
nce
in
fee
t ab
ove
mou
th
F
ED
ER
AL
EM
ER
GE
NC
Y M
AN
AG
EM
EN
T A
GE
NC
Y
GA
LV
ES
TO
N C
OU
NT
Y,
TX
AN
D I
NC
OR
PO
RA
TE
D A
RE
AS
FL
OO
DW
AY
DA
TA
UN
NA
ME
D T
RIB
UT
AR
Y T
O D
ICK
INS
ON
BA
YO
U (
WE
ST
BR
AN
CH
)
UP
PE
R H
IGH
LA
ND
BA
YO
U
2 F
eet
above
Sta
te H
igh
way
6.
61
5.0 INSURANCE APPLICATIONS
For flood insurance rating purposes, flood insurance zone designations are assigned to a
community based on the results of the engineering analyses. These zones are as follows:
Zone A
Zone A is the flood insurance risk zone that corresponds to the 1-percent-annual-chance
floodplains that are determined in the FIS by approximate methods. Because detailed hydraulic
analyses are not performed for such areas, no BFEs or base flood depths are shown within this
zone.
Zone AE
Zone AE is the flood insurance risk zone that corresponds to the 1-percent-annual-chance
floodplains that are determined in the FIS by detailed methods. In most instances, whole-foot
BFEs derived from the detailed hydraulic analyses are shown at selected intervals within this
zone.
Zone AO
Zone AO is the flood insurance risk zone that corresponds to the 1-percent-annual-chance
shallow flooding (usually sheet flow on sloping terrain) where average depths are between 1 and
3 feet. Average whole-foot base flood depths derived from the detailed hydraulic analyses are
shown within this zone.
Zone VE
Zone VE is the flood insurance risk zone that corresponds to the 1-percent-annual-chance coastal
floodplains that have additional hazards associated with storm waves. Whole-foot BFEs derived
from the detailed hydraulic analyses are shown at selected intervals within this zone.
Zone X
Zone X is the flood insurance risk zone that corresponds to areas outside the 0.2-percent-annual-
chance floodplain, areas within the 0.2-percent-annual-chance floodplain, areas of 1-percent-
annual-chance flooding where average depths are less than 1 foot, areas of 1-percent-annual-
chance flooding where the contributing drainage area is less than 1 square mile, and areas
protected from the 1-percent-annual-chance flood by levees. No BFEs or base flood depths are
shown within this zone.
6.0 FLOOD INSURANCE RATE MAP
The FIRM is designed for flood insurance and floodplain management applications.
For flood insurance applications, the map designates flood insurance risk zones as described in
Section 5.0 and, in the 1-percent-annual-chance floodplains that were studied by detailed
methods, shows selected whole-foot BFEs or average depths. Insurance agents use the zones and
62
BFEs in conjunction with information on structures and their contents to assign premium rates for
flood insurance policies.
For floodplain management applications, the map shows by tints, screens, and symbols, the 1-
and 0.2-percent-annual-chance floodplains, floodways, and the locations of selected cross
sections used in the hydraulic analyses and floodway computations.
This FIRM presents flooding information for the entire geographic area of Galveston County.
This FIRM also includes flood-hazard information that was historically presented separately on
Floodway Maps (FBFMs), where applicable. Historical data relating to the maps prepared for
each community, prior to the initial FIRM, are presented in Table 6, “Community Map History”.
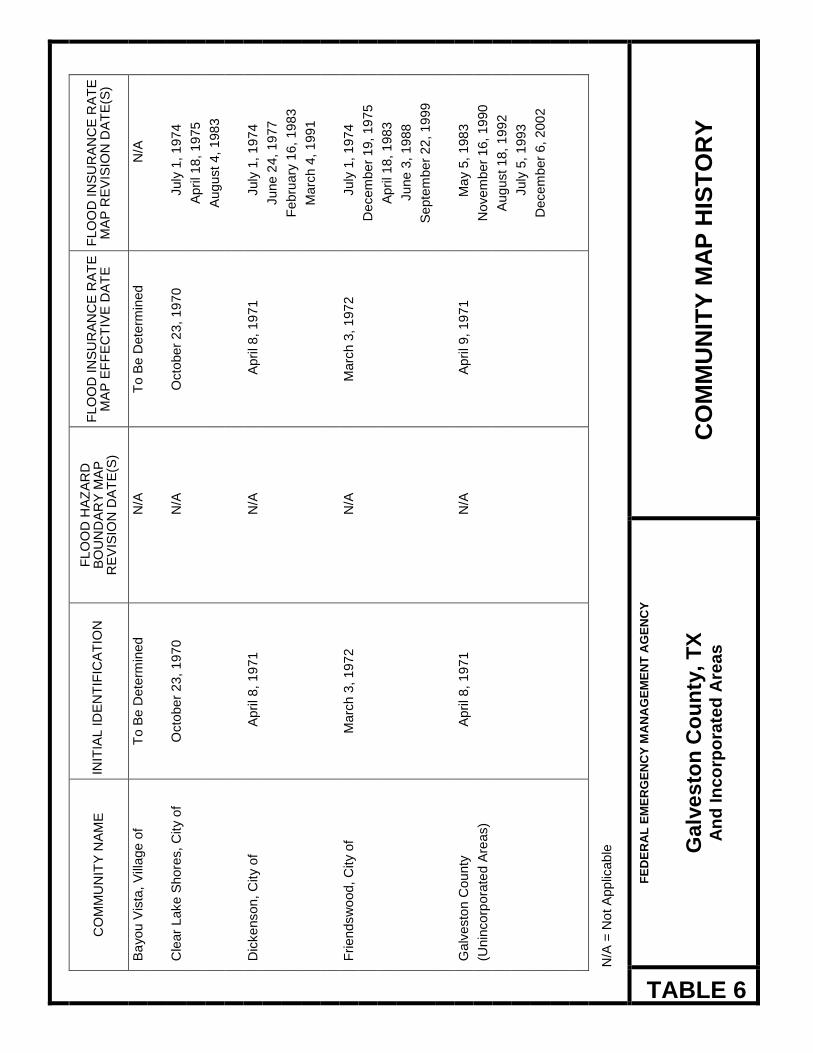
CO
MM
UN
ITY
NA
ME
IN
ITIA
L ID
EN
TIF
ICA
TIO
N
FLO
OD
HA
ZA
RD
B
OU
ND
AR
Y M
AP
R
EV
ISIO
N D
AT
E(S
)
FLO
OD
IN
SU
RA
NC
E R
AT
E
MA
P E
FF
EC
TIV
E D
AT
E
FLO
OD
IN
SU
RA
NC
E R
AT
E
MA
P R
EV
ISIO
N D
AT
E(S
)
B
ayou V
ista
, V
illage o
f T
o B
e D
ete
rmin
ed
N
/A
To B
e D
ete
rmin
ed
N
/A
C
lear
Lake S
hore
s, C
ity o
f O
cto
ber
23,
19
70
N
/A
Octo
ber
23,
19
70
July
1, 1
974
A
pri
l 1
8, 1
975
A
ug
ust 4,
198
3
D
ickenson, C
ity o
f A
pri
l 8,
19
71
N
/A
Apri
l 8,
19
71
July
1, 1
974
June 2
4, 1
977
F
ebru
ary
16,
19
83
M
arc
h 4
, 199
1
F
riendsw
ood,
City o
f M
arc
h 3
, 197
2
N/A
M
arc
h 3
, 197
2
July
1, 1
974
D
ecem
ber
19, 19
75
A
pri
l 1
8, 1
983
June 3
, 19
88
S
epte
mber
22, 1
999
G
alv
esto
n C
ou
nty
A
pri
l 8,
19
71
N
/A
Apri
l 9,
19
71
M
ay 5
, 198
3
(U
nin
corp
ora
ted A
reas)
N
ovem
ber
16, 19
90
A
ug
ust 18,
19
92
July
5, 1
993
D
ecem
ber
6, 200
2
N/A
= N
ot A
pp
licab
le
TABLE 6
FE
DE
RA
L E
ME
RG
EN
CY
MA
NA
GE
ME
NT
AG
EN
CY
Galv
es
ton
Co
un
ty, T
X
An
d I
nco
rpo
rate
d A
reas
C
OM
MU
NIT
Y M
AP
HIS
TO
RY
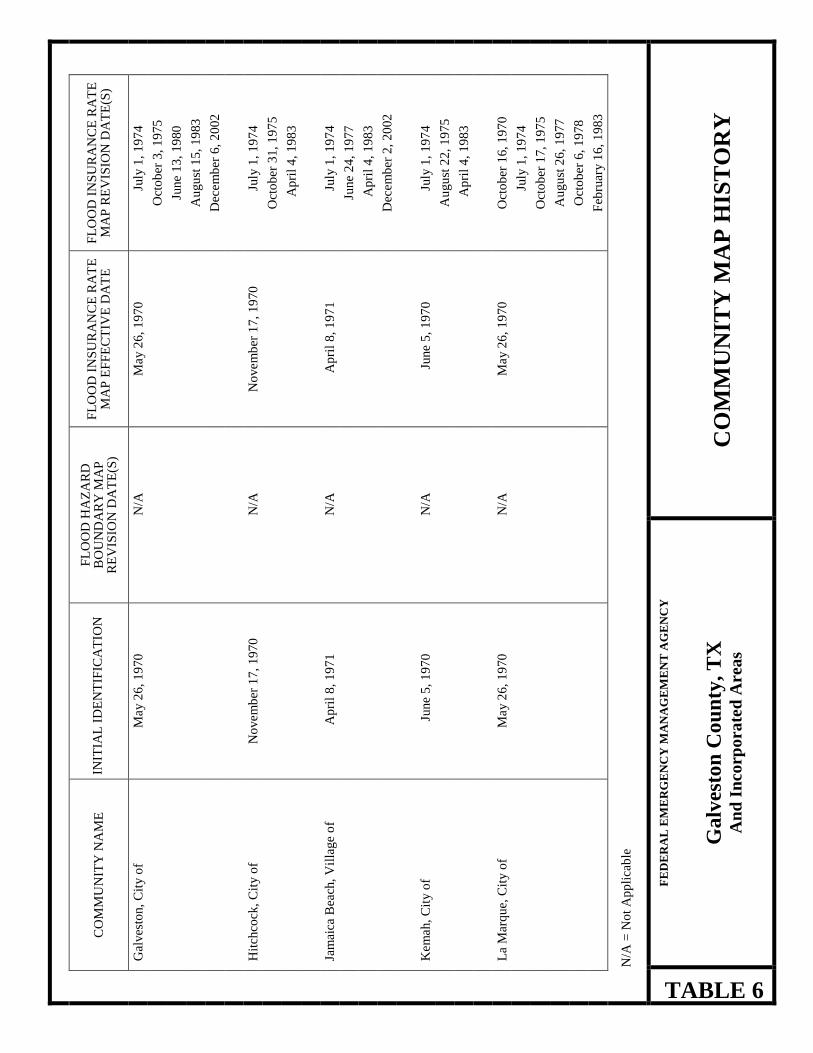
CO
MM
UN
ITY
NA
ME
IN
ITIA
L I
DE
NT
IFIC
AT
ION
F
LO
OD
HA
ZA
RD
B
OU
ND
AR
Y M
AP
R
EV
ISIO
N D
AT
E(S
)
FL
OO
D I
NS
UR
AN
CE
RA
TE
M
AP
EF
FE
CT
IVE
DA
TE
F
LO
OD
IN
SU
RA
NC
E R
AT
E
MA
P R
EV
ISIO
N D
AT
E(S
)
G
alves
ton,
Cit
y o
f M
ay 2
6,
19
70
N
/A
May 2
6,
19
70
Ju
ly 1
, 1
97
4
O
cto
ber
3, 1
975
Ju
ne
13
, 1
980
A
ugu
st 1
5,
19
83
D
ecem
ber
6,
20
02
H
itch
cock
, C
ity o
f N
ovem
ber
17
, 1
970
N
/A
No
vem
ber
17
, 1
970
Ju
ly 1
, 1
97
4
O
cto
ber
31,
197
5
A
pri
l 4
, 1
98
3
Ja
mai
ca B
each
, V
illa
ge
of
Ap
ril
8,
19
71
N
/A
Ap
ril
8,
19
71
Ju
ly 1
, 1
97
4
Ju
ne
24
, 1
977
A
pri
l 4
, 1
98
3
D
ecem
ber
2,
20
02
K
em
ah,
Cit
y o
f Ju
ne
5,
19
70
N
/A
June
5,
19
70
Ju
ly 1
, 1
97
4
A
ugu
st 2
2,
19
75
A
pri
l 4
, 1
98
3
L
a M
arq
ue,
Cit
y o
f M
ay 2
6,
19
70
N
/A
May 2
6,
19
70
Oct
ob
er 1
6,
197
0
Ju
ly 1
, 1
97
4
O
cto
ber
17,
197
5
A
ugu
st 2
6,
19
77
O
cto
ber
6, 1
978
F
ebru
ary 1
6,
19
83
N/A
= N
ot
Ap
pli
cab
le
TABLE 6
777877
FE
DE
RA
L E
ME
RG
EN
CY
MA
NA
GE
ME
NT
AG
EN
CY
Ga
lves
ton
Co
un
ty, T
X
An
d I
ncorp
ora
ted
Area
s C
OM
MU
NIT
Y M
AP
HIS
TO
RY
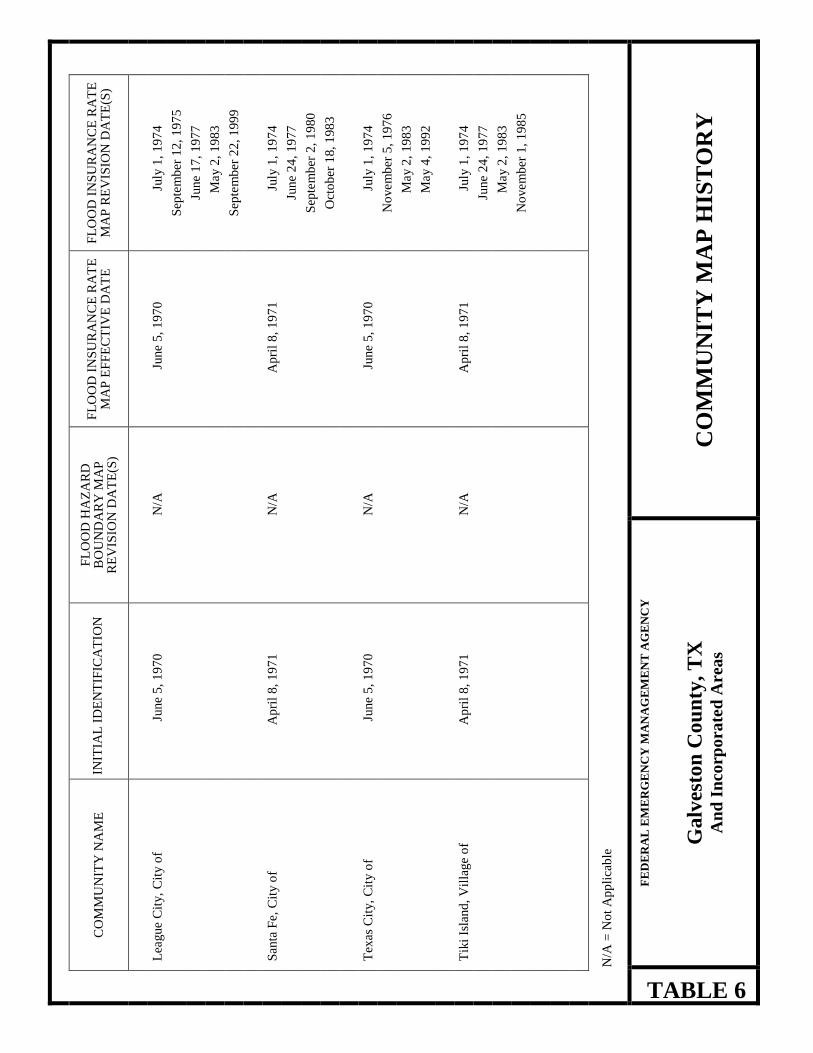
CO
MM
UN
ITY
NA
ME
IN
ITIA
L I
DE
NT
IFIC
AT
ION
F
LO
OD
HA
ZA
RD
B
OU
ND
AR
Y M
AP
R
EV
ISIO
N D
AT
E(S
)
FL
OO
D I
NS
UR
AN
CE
RA
TE
M
AP
EF
FE
CT
IVE
DA
TE
F
LO
OD
IN
SU
RA
NC
E R
AT
E
MA
P R
EV
ISIO
N D
AT
E(S
)
L
eague
Cit
y,
Cit
y o
f Ju
ne
5,
19
70
N
/A
June
5,
19
70
Ju
ly 1
, 1
97
4
S
epte
mb
er 1
2,
197
5
Ju
ne
17
, 1
977
M
ay 2
, 1
98
3
S
epte
mb
er 2
2,
199
9
S
anta
Fe,
Cit
y o
f A
pri
l 8
, 1
97
1
N/A
A
pri
l 8
, 1
97
1
July
1,
19
74
Ju
ne
24
, 1
977
S
epte
mb
er 2
, 1
980
O
cto
ber
18,
198
3
T
exas
Cit
y,
Cit
y o
f Ju
ne
5,
19
70
N
/A
June
5,
19
70
Ju
ly 1
, 1
97
4
N
ovem
ber
5,
19
76
M
ay 2
, 1
98
3
M
ay 4
, 1
99
2
T
iki
Isla
nd
, V
illa
ge
of
Ap
ril
8,
19
71
N
/A
Ap
ril
8,
19
71
Ju
ly 1
, 1
97
4
Ju
ne
24
, 1
977
M
ay 2
, 1
98
3
N
ovem
ber
1,
19
85
N/A
= N
ot
Ap
pli
cab
le
TABLE 6
FE
DE
RA
L E
ME
RG
EN
CY
MA
NA
GE
ME
NT
AG
EN
CY
Ga
lves
ton
Cou
nty
, T
X
An
d I
ncorp
ora
ted
Area
s C
OM
MU
NIT
Y M
AP
HIS
TO
RY
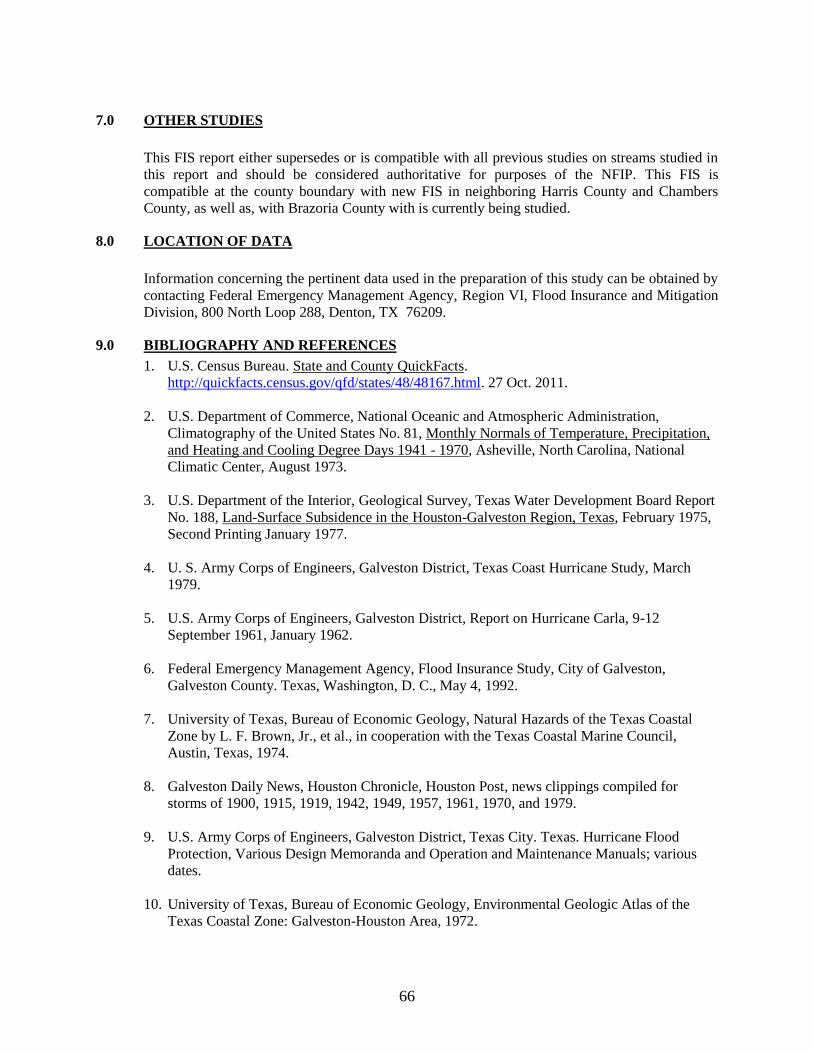
66
7.0 OTHER STUDIES
This FIS report either supersedes or is compatible with all previous studies on streams studied in
this report and should be considered authoritative for purposes of the NFIP. This FIS is
compatible at the county boundary with new FIS in neighboring Harris County and Chambers
County, as well as, with Brazoria County with is currently being studied.
8.0 LOCATION OF DATA
Information concerning the pertinent data used in the preparation of this study can be obtained by
contacting Federal Emergency Management Agency, Region VI, Flood Insurance and Mitigation
Division, 800 North Loop 288, Denton, TX 76209.
9.0 BIBLIOGRAPHY AND REFERENCES
1. U.S. Census Bureau. State and County QuickFacts.
http://quickfacts.census.gov/qfd/states/48/48167.html. 27 Oct. 2011.
2. U.S. Department of Commerce, National Oceanic and Atmospheric Administration,
Climatography of the United States No. 81, Monthly Normals of Temperature, Precipitation,
and Heating and Cooling Degree Days 1941 - 1970, Asheville, North Carolina, National
Climatic Center, August 1973.
3. U.S. Department of the Interior, Geological Survey, Texas Water Development Board Report
No. 188, Land-Surface Subsidence in the Houston-Galveston Region, Texas, February 1975,
Second Printing January 1977.
4. U. S. Army Corps of Engineers, Galveston District, Texas Coast Hurricane Study, March
1979.
5. U.S. Army Corps of Engineers, Galveston District, Report on Hurricane Carla, 9-12
September 1961, January 1962.
6. Federal Emergency Management Agency, Flood Insurance Study, City of Galveston,
Galveston County. Texas, Washington, D. C., May 4, 1992.
7. University of Texas, Bureau of Economic Geology, Natural Hazards of the Texas Coastal
Zone by L. F. Brown, Jr., et al., in cooperation with the Texas Coastal Marine Council,
Austin, Texas, 1974.
8. Galveston Daily News, Houston Chronicle, Houston Post, news clippings compiled for
storms of 1900, 1915, 1919, 1942, 1949, 1957, 1961, 1970, and 1979.
9. U.S. Army Corps of Engineers, Galveston District, Texas City. Texas. Hurricane Flood
Protection, Various Design Memoranda and Operation and Maintenance Manuals; various
dates.
10. University of Texas, Bureau of Economic Geology, Environmental Geologic Atlas of the
Texas Coastal Zone: Galveston-Houston Area, 1972.
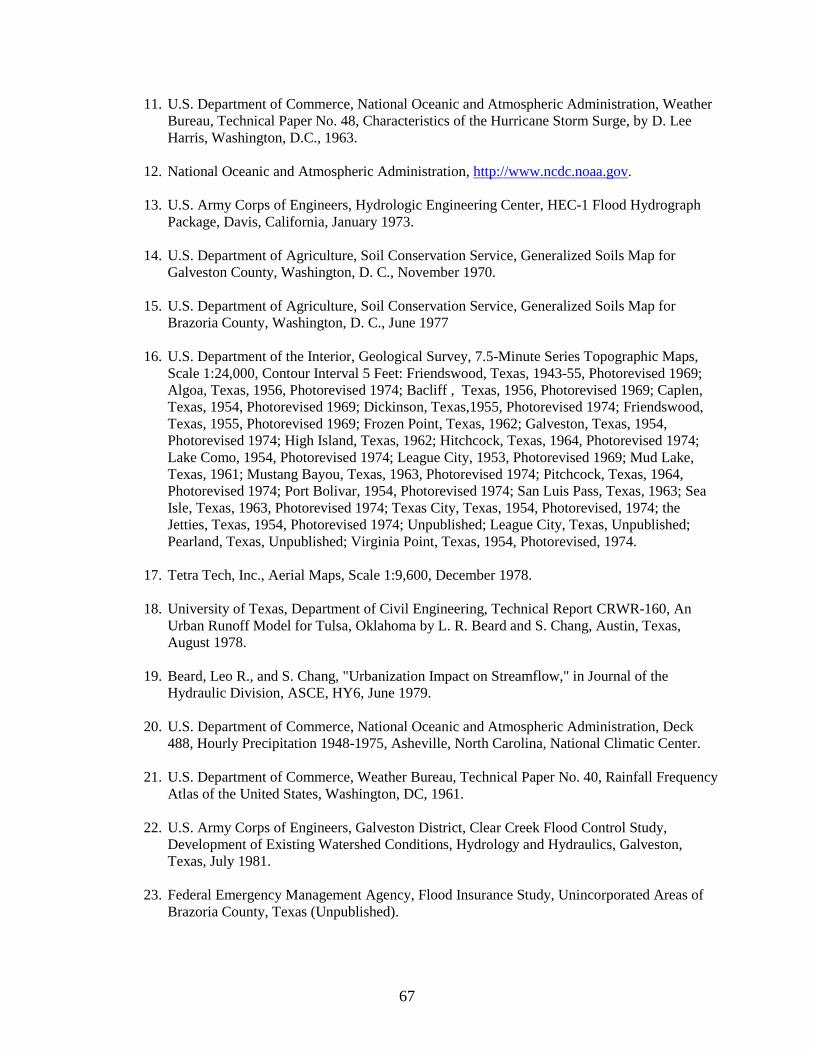
67
11. U.S. Department of Commerce, National Oceanic and Atmospheric Administration, Weather
Bureau, Technical Paper No. 48, Characteristics of the Hurricane Storm Surge, by D. Lee
Harris, Washington, D.C., 1963.
12. National Oceanic and Atmospheric Administration, http://www.ncdc.noaa.gov.
13. U.S. Army Corps of Engineers, Hydrologic Engineering Center, HEC-1 Flood Hydrograph
Package, Davis, California, January 1973.
14. U.S. Department of Agriculture, Soil Conservation Service, Generalized Soils Map for
Galveston County, Washington, D. C., November 1970.
15. U.S. Department of Agriculture, Soil Conservation Service, Generalized Soils Map for
Brazoria County, Washington, D. C., June 1977
16. U.S. Department of the Interior, Geological Survey, 7.5-Minute Series Topographic Maps,
Scale 1:24,000, Contour Interval 5 Feet: Friendswood, Texas, 1943-55, Photorevised 1969;
Algoa, Texas, 1956, Photorevised 1974; Bacliff , Texas, 1956, Photorevised 1969; Caplen,
Texas, 1954, Photorevised 1969; Dickinson, Texas,1955, Photorevised 1974; Friendswood,
Texas, 1955, Photorevised 1969; Frozen Point, Texas, 1962; Galveston, Texas, 1954,
Photorevised 1974; High Island, Texas, 1962; Hitchcock, Texas, 1964, Photorevised 1974;
Lake Como, 1954, Photorevised 1974; League City, 1953, Photorevised 1969; Mud Lake,
Texas, 1961; Mustang Bayou, Texas, 1963, Photorevised 1974; Pitchcock, Texas, 1964,
Photorevised 1974; Port Bolivar, 1954, Photorevised 1974; San Luis Pass, Texas, 1963; Sea
Isle, Texas, 1963, Photorevised 1974; Texas City, Texas, 1954, Photorevised, 1974; the
Jetties, Texas, 1954, Photorevised 1974; Unpublished; League City, Texas, Unpublished;
Pearland, Texas, Unpublished; Virginia Point, Texas, 1954, Photorevised, 1974.
17. Tetra Tech, Inc., Aerial Maps, Scale 1:9,600, December 1978.
18. University of Texas, Department of Civil Engineering, Technical Report CRWR-160, An
Urban Runoff Model for Tulsa, Oklahoma by L. R. Beard and S. Chang, Austin, Texas,
August 1978.
19. Beard, Leo R., and S. Chang, "Urbanization Impact on Streamflow," in Journal of the
Hydraulic Division, ASCE, HY6, June 1979.
20. U.S. Department of Commerce, National Oceanic and Atmospheric Administration, Deck
488, Hourly Precipitation 1948-1975, Asheville, North Carolina, National Climatic Center.
21. U.S. Department of Commerce, Weather Bureau, Technical Paper No. 40, Rainfall Frequency
Atlas of the United States, Washington, DC, 1961.
22. U.S. Army Corps of Engineers, Galveston District, Clear Creek Flood Control Study,
Development of Existing Watershed Conditions, Hydrology and Hydraulics, Galveston,
Texas, July 1981.
23. Federal Emergency Management Agency, Flood Insurance Study, Unincorporated Areas of
Brazoria County, Texas (Unpublished).
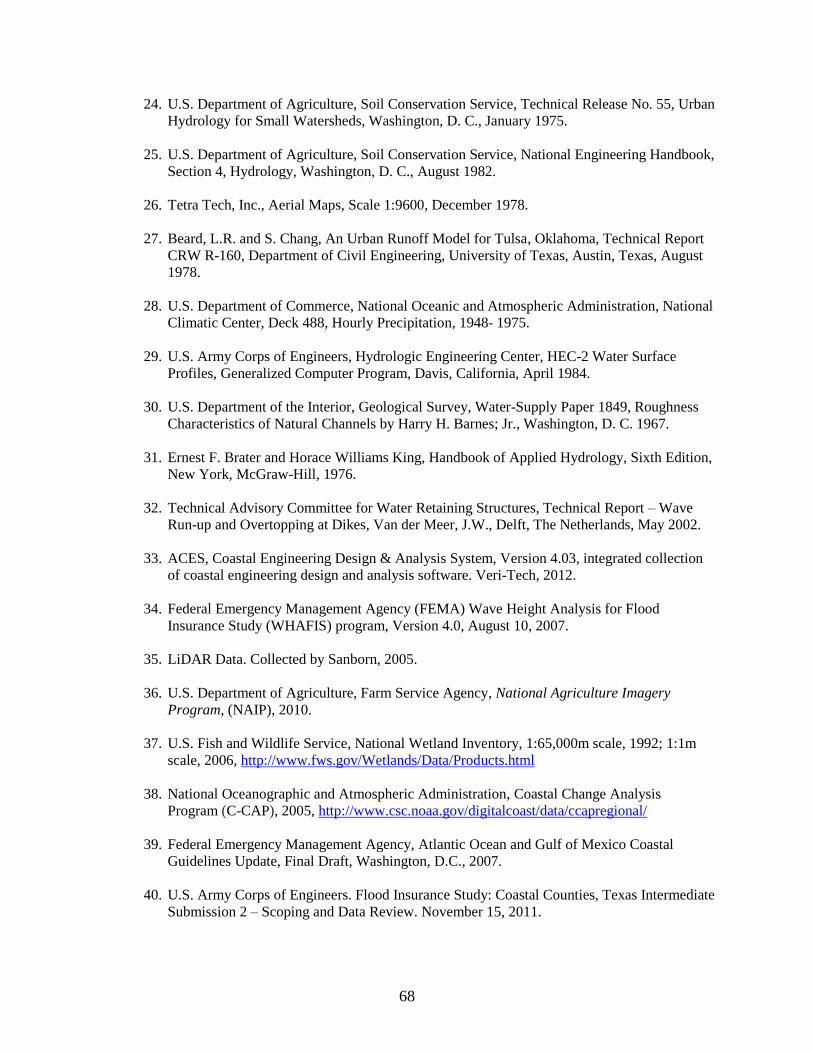
68
24. U.S. Department of Agriculture, Soil Conservation Service, Technical Release No. 55, Urban
Hydrology for Small Watersheds, Washington, D. C., January 1975.
25. U.S. Department of Agriculture, Soil Conservation Service, National Engineering Handbook,
Section 4, Hydrology, Washington, D. C., August 1982.
26. Tetra Tech, Inc., Aerial Maps, Scale 1:9600, December 1978.
27. Beard, L.R. and S. Chang, An Urban Runoff Model for Tulsa, Oklahoma, Technical Report
CRW R-160, Department of Civil Engineering, University of Texas, Austin, Texas, August
1978.
28. U.S. Department of Commerce, National Oceanic and Atmospheric Administration, National
Climatic Center, Deck 488, Hourly Precipitation, 1948- 1975.
29. U.S. Army Corps of Engineers, Hydrologic Engineering Center, HEC-2 Water Surface
Profiles, Generalized Computer Program, Davis, California, April 1984.
30. U.S. Department of the Interior, Geological Survey, Water-Supply Paper 1849, Roughness
Characteristics of Natural Channels by Harry H. Barnes; Jr., Washington, D. C. 1967.
31. Ernest F. Brater and Horace Williams King, Handbook of Applied Hydrology, Sixth Edition,
New York, McGraw-Hill, 1976.
32. Technical Advisory Committee for Water Retaining Structures, Technical Report – Wave
Run-up and Overtopping at Dikes, Van der Meer, J.W., Delft, The Netherlands, May 2002.
33. ACES, Coastal Engineering Design & Analysis System, Version 4.03, integrated collection
of coastal engineering design and analysis software. Veri-Tech, 2012.
34. Federal Emergency Management Agency (FEMA) Wave Height Analysis for Flood
Insurance Study (WHAFIS) program, Version 4.0, August 10, 2007.
35. LiDAR Data. Collected by Sanborn, 2005.
36. U.S. Department of Agriculture, Farm Service Agency, National Agriculture Imagery
Program, (NAIP), 2010.
37. U.S. Fish and Wildlife Service, National Wetland Inventory, 1:65,000m scale, 1992; 1:1m
scale, 2006, http://www.fws.gov/Wetlands/Data/Products.html
38. National Oceanographic and Atmospheric Administration, Coastal Change Analysis
Program (C-CAP), 2005, http://www.csc.noaa.gov/digitalcoast/data/ccapregional/
39. Federal Emergency Management Agency, Atlantic Ocean and Gulf of Mexico Coastal
Guidelines Update, Final Draft, Washington, D.C., 2007.
40. U.S. Army Corps of Engineers. Flood Insurance Study: Coastal Counties, Texas Intermediate
Submission 2 – Scoping and Data Review. November 15, 2011.