Embed Size (px)
Citation preview

GALLAGHER
EVELIUS &JONES LLP
THOMAS C. DAME [email protected] direct dial: 410 347 1331 fax: 410 468 2786
ATTORNEYS AT LAW
VIA EMAIL & HAND DELIVERY
Ms. Ruby Potter Health Facilities Coordination Officer Maryland Health Care Commission 4160 Patterson A venue Baltimore, Maryland 21215
March 13, 2015
Re: CON Application-Prince George's Regional Medical Center As a Replacement and Relocation of Prince George's Hospital Center Matter No. 13-16-2351
Dear Ms. Potter:
Enclosed with the email of this letter is a PDF file containing the "Responses to Completeness Questions Dated February 10, 2015" with respect to the Modified CON Application of Dimensions Health Corporation d/b/a Prince George's Hospital Center and Mount Washington Pediatric Hospital, Inc. for Relocation of a General Acute Care Hospital and a Special Hospital-Pediatric.
On Monday, March 16, we will forward ten hard copies of the responses and exhibits, along with six CDs containing searchable PDF files of the responses and exhibits, a Word version of the responses, and native Excel spreadsheets of the tables and projections.
Please sign and return to our waiting messenger the enclosed acknowledgment of receipt. Thank you for your assistance.
TCD:blr Enclosures cc: Pamela B. Creekmur, Health Officer, Prince George's County
Dr. Laurence Polsky, Health Officer, Calvert County Meenakshi G. Brewster, Health Officer, St. Mary's County Dianna E. Abney, Acting Health Officer, Charles County Patrick D. Dooley, Chief of Staff, Department of Health & Mental Hygiene
#522783 013346-0001
218 North Charles Street, Suite 400 Baltimore MD 21201 TEL: 410 727 7702 FAX: 410 468 2786 WEB: www.gejlaw.com

GALLAGHER EVELIUS &JONES LLP ATTORNEYS AT LAW
Ms. Ruby Potter Page 2 March 13, 2015
Paul Parker, Director, Center for Health Care Facilities Planning & Development, MHCC Kevin McDonald, Chief, Certificate of Need Suellen Wideman, Esq., Assistant Attorney General, Maryland Health Care Commission Bradford L. Seamon, Chief Administrative Officer, Prince George's County Government Neil J. Moore, President & CEO, Dimensions Health Corporation Sheldon Stein, President & CEO, Mt. Washington Pediatric Hospital Carl Jean-Baptiste, Esquire, Senior Vice President & General Counsel, Dimensions
Health Corporation Patricia Tihansky, Strategic Planning & Marketing, Dimensions Health Corporation John Ashworth, Sr. Vice President, Network Development, University of Maryland
Medical System Mark Wasserman, Sr. Vice President, External Affairs, University of Maryland Medical
System Sandra H. Benzer, Esquire, Associate Counsel, University of Maryland Medical System Andrew L. Solberg, A.L.S. Healthcare Consultant Services Richard McAlee, Esquire, Hospital Counsel, MedStar Southern Maryland Hospital
Center Howard L. Sollins, Esq. Peter P. Parvis, Esq. Ella R. Aiken, Esq.
#522783 013346-0001

Dimensions Health Corporation d/b/a Prince George’s Hospital Center Mount Washington Pediatric Hospital, Inc. Relocation of a General Acute Care Hospital and a Special
Hospital-Pediatric Matter No. 13-16-2351 Responses to Additional Information Questions Received 2/10/2015
PROJECT IDENTIFICATION/GENERAL INFORMATION 1. Who is/will be the owner of the proposed new Prince George’s Regional Medical
Center? Applicant Response:
The owner of the Prince George’s Regional Medical Center (PGRMC) will be Dimensions Health Corporation d/b/a Dimensions Healthcare System (Dimensions).
PROJECT DESCRIPTION 2. The application states that the majority of Prince George’s County residents who
seek health care services do so outside of the County. With respect to the health care services that are the subject of this application, acute hospital services, given the county’s location within a major metropolitan area and the basic health planning tenet that high cost, low volume services should be regionalized, please explain why it is an inherently bad thing for residents to travel to major hospitals that are close at hand, especially for higher level services?
(c) Availability of More Cost-Effective Alternatives 19. A theme that runs through the entire plan and proposal is an assertion that the many
health challenges faced by Prince George’s County1 require the installation of an academically-affiliated tertiary care center. In explaining the additional square footage per bed proposed for this project compared to other recent projects in Maryland, the applicant states that the other projects “are not directly comparable in scope or level of service to PGRMC” (page 27, footnote).
Explain why the relocated hospital needs to be an “academically-affiliated tertiary care center” with such a specialized scope of services instead of a modern, full-service and academically-affiliated community hospital.
A. Wouldn’t a new community hospital with a network of physician offices and community clinics and continued and enhanced collaboration with tertiary care programs in Washington, DC and Baltimore be able to meet a very high proportion of the patient services projected to be provided in the CON application at the relocated hospital at a lower cost?
1 Application cites problems such as a substantially lower ratio of primary care providers; higher rates of ambulatory care–sensitive hospitalizations and emergency department visits; higher rates of chronic diseases, including diabetes, heart disease, hypertension, asthma and cancer, than those residing in neighboring counties.
#521045 1

B. Why wouldn’t development of a new community hospital be able to address the
challenges of inadequate numbers of primary care physicians, higher rates of ambulatory care-sensitive visits to the hospital and ED, and higher rates of chronic diseases? What is the unique capability of an academically-affiliated tertiary care center hospital that makes such a hospital able to overcome these challenges while a community hospital with a similar academic affiliation cannot?
Applicant Response to Questions 2, 19A and 19B:
Dimensions Healthcare System (“Dimensions”) believes questions number 2 and 19 are related and, therefore, Dimensions provides the following comprehensive combined response:
A. Introduction / Summary
As shown by the University of Maryland School of Public Health’s (“UM SPH”) report,
Transforming Health in Prince George’s County: A public health impact study (2012) (the “Public Health Impact Study”) and feedback from medical professionals and other stakeholders within Prince George’s County, there is significant value in building a strong academic-affiliated specialty services medical center rather than a smaller community hospital. Dimensions wants to build upon the services PGHC is currently providing and add value at reduced costs for services to patients who are currently migrating out of Prince George’s County for care. Under the new Global Budget Revenue (“GBR”) structure of hospital reimbursement, the recapture of these services actually reduces the cost of service overall for the State of Maryland. A strong academic-affiliated teaching specialty medical center will bring numerous important benefits to the PGRMC service area, including the following: From the patient’s perspective:
1. Most residents prefer to receive health care services from physicians and hospital facilities near their homes. Lack of transportation to specialty care services outside of Prince George’s County is a barrier for underserved residents in receiving timely care, which ultimately leads to increased hospital readmissions and excessive ER utilization.
2. Local access to specialized services improves access for populations with limited means
or those who do not wish to travel to the District of Columbia.
3. Local access to specialty services means local access to specialty physicians, improving chances of patients participating in follow-up care.
4. Local access for certain specialized services allows for the care delivery process to be participated by patients’ local primary care physicians.
5. Referring physicians continue to be part of care delivery of their patients if patients are treated locally. Local physicians and their patients have access to the latest therapies via an academically affiliated hospital.
#521045 2

6. Patients with limited resources may not seek initial care or follow-up care if they have to travel to D.C. or Baltimore. Transition and coordination of care is hindered, delayed, or may not occur when patients have to travel to D.C. or Baltimore for care.
7. Local access to specialty services allows patients to be closer to support mechanisms, such as families and social services entities.
8. In-County central location of specialty services creates a local practice home for specialists/sub-specialists who are in demand by County residents. This adavances the goals of Patient Centered Medical Homes by creating care teams that include local academically affiliated specialty services. This can also enhance trust between the community and academia when an academic hospital is located within community, which in turn allows for increased community-based participatory research, helping to address local health care and disparities issues.
From the healthcare delivery system perspective: A local academic-affiliated specialty care medical center in Prince George’s County:
1. enhances the health system's ability to attract and retain quality providers who have been trained elsewhere, including primary care physicians;
2. promotes a learning culture / utilization of clinical best practices;
3. promotes recruitment / retention efforts of clinical staff including nurses;
4. promotes opportunity for research / clinical trials programs;
5. helps address health care disparities;
6. effectively attracts and retains providers by training them in the County and providing
incentives (such as student loan forgiveness) to remain in the County;
7. increases support mechanisms and resources of existing specialty services currently being provided by PGHC, including trauma services, neonatal intensive care, and cardio-thoracic surgery (PGHC is the only hospital within Prince George’s County that has these specialized services); and
8. will draw more patients currently going to Washington D.C. for care, if the institution is strengthened.
In addition, Dimensions has found it very difficult to get a non-emergent referral to other institutions (especially D.C. hospitals) for patients who are uninsured or un-documented. If the relocated PGRMC did not have the same level of specialty care that these patients currently can receive locally at PGHC, even more long-distance referrals would be required for such patients, and Dimensions’ past difficulty securing referrals suggests that care for such patients would be even more delayed.
#521045 3
To realize the vision of transforming the health care delivery system for Prince George’s County, an academic-affiliated medical center is seen as the catalyst for improving quality care, providing leading best practice methodologies currently being taught at medical teaching hospital centers, increasing access to research / clinical trial programs, and recruiting much needed medical professionals for Prince George’s County and the Southern Maryland region to improve access to primary and specialty care expertise.
The following detailed response compiles and expands upon portions of the CON application that address the transformation of the Prince George’s County healthcare delivery system that will result from a strong, academic-affiliated medical center in the County.
B. Supporting Narrative Detail: (compiled and expanded from the CON application)
1. Current State of PGHC:
The proposed project does not represent a substantially different scope of services from what exists today at PGHC.
Dimensions seeks to replace and relocate PGHC, which is currently licensed for 215
inpatient beds, including 141 MSGA beds, 8 pediatric beds, 38 obstetrical beds, and 28 adult psychiatric beds. PGHC currently serves as a regional hospital center. As a Level II Regional Trauma Center, it is one of the busiest adult trauma center in the State. PGHC is also designated a Level IIIB Neonatal Intensive Care Unit (NICU) serving the Southern Maryland region. PGHC provides cardio-thoracic (including open heart) surgical services and is designated a ST Elevation Myocardial Infarction (STEMI) Center. PGHC hosts the 15-bed pediatric specialty hospital operated by Mount Washington Pediatric Hospital (“MWPH”), which serves the Southern Maryland region.
PGHC has residency programs in Internal Medicine and Family Practice. It has
numerous affiliations with other medical educational and allied health programs and serves as a teaching facility. With the proposed project, Dimensions plans to expand the teaching programs to better serve the Southern Maryland region and improve access to medical professionals who are in short-supply.
In sum, PGHC already serves as a regional hospital center with higher level acute
clinical services and medical teaching programs. The plan for PGHC is to continue to serve within its current mission and scope of services, but to do so much more effectively in a new facility and with enhanced collaboration with the University of Maryland Medical System (“UMMS”).
2. Current State of Healthcare For Prince George’s County
Prince George’s County is the second most populous county in Maryland, and is Maryland’s most diverse county. In 2010, minority groups accounted for more than 80 percent of the County’s population of 863,420.
Despite the population size, higher-than-average median income, and rich diversity of Prince George’s County, available statistics paint a concerning picture of the health of County residents, and their access to care, when compared to neighboring Maryland counties. County residents suffer from higher rates of chronic diseases, including diabetes, heart disease,
#521045 4
hypertension, asthma and cancer, than those residing in neighboring counties. A 2011 report by Maryland Nonprofits found that Prince George’s County’s mortality rate ranked 17th out of Maryland’s 24 counties. By contrast, neighboring Howard and Montgomery Counties had the State’s lowest mortality rates.2
The suboptimal population health of County residents is exacerbated by the lack of a well-functioning ambulatory care safety net. Prince George’s County has a substantially lower ratio of primary care, specialty care, and mid-level providers to the population compared to surroundings counties and the state. A 2009 study by the Rand Corporation (the “Rand Study”) found that Prince George’s County had higher rates of ambulatory care–sensitive hospitalizations than surrounding jurisdictions. That Study further found that these admissions were concentrated in poor regions of the County, suggesting that more affluent residents are able to access primary care outside of the County. An academic-affiliated tertiary medical center will serve as a catalyst to draw additional primary care and other medical / surgical specialties to the service area. The medical education component, including residency programs and other professional education programs, also will help recruit and retain needed medical professionals, which is essential in building and sustaining the ratio of providers needed for the County.
Patient trends also suggest County residents are either disastisfied with, or have limited access to, inpatient care within the County, as the majority of County residents who receive inpatient care are discharged from hospitals outside of the County.3 Improvements in the health outcomes for Prince George’s County residents will be more difficult when care coordination and support services have to occur across jurisdiction lines. As the Editorial Board of the Washington Post stated in August of 2013, “the absence of a top-flight hospital in a locality of 880,000 people — one that provides a variety of specialty care and tertiary services — is a long-running scandal.” See Exhibit 3 to the Modified Application.
PGHC plays a vital and unique role in healthcare within the County. PGHC has served as the healthcare safety net for low-income Prince George’s County residents. Since fiscal year 1999, as a result of the changing demographics of the County and growth in the high proportion of uninsured and underinsured patients that it served, PGHC has been burdened with significant operating losses. In addition, the PGHC facility is aging and in need of a variety of improvements. PGHC’s current facilities are not designed for modern, patient centered, family oriented medicine, and are undersized in various critical areas. Absent a significant overhaul involving an investment in facilities as well as the growth of an ambulatory-care network that will enable County residents to seek preventive care and primary care treatment rather than relying on inpatient and emergency care, PGHC risks being unable to continue serving its already underserved population.
2 The 2011 Maryland Nonprofit report is available at: http://marylandnonprofits.org/Portals/ 0/Files/Pages/Nonprofit%20Resources/Nonprofit%20Research/PG%20Co%20Health%20Rankings.pdf (last accessed 11/26/14); the 2009 Rand Study is available at http://www.rand.org /pubs/technical_reports/TR655.html (last accessed 3/7/15).
3 The Rand Study found, for example, that in 2006, “[a]mong all inpatients who resided in Prince George’s County, 37.2 percent were discharged from Prince George’s County hospitals. By contrast, 77.0 percent of patients from Montgomery County were hospitalized in Montgomery County, and 92.4 percent of patients from the District of Columbia were hospitalized in the District of Columbia.”
#521045 5

The proposed project results from the collaboration of numerous stakeholders who have agreed to assume leadership in addressing the public health problems in Prince George’s County and the difficult financial and operational status of the current PGHC facility. The proposed Prince George’s County Regional Medical Center (“PGRMC”) aims to provide County residents with the hospital and health care network they deserve by transforming PGHC into a thriving regional medical center that will provide efficient, high-quality care while improving the health of its service area population by building a strong ambulatory care network.
An academically-affiliated regional medical center greatly enhances the probability that new care models and technologies will speed improvements in raising health status and limiting the effects of health disparities. This plan creates the capacity to train and attract more of the health professionals needed. It is important that the new regional medical center partner with academic institutions, to foster a comprehensive ambulatory care network so that residents of Prince George’s County will no longer feel compelled to go outside of the County to seek health care services.
The support for a new regional medical center is strong, as demonstrated by the Memorandum of Understanding entered by the County, the State, Dimensions, UMMS, and the University of Maryland System. Strong backing also is evidenced by a substantial number of letters of support, and the demonstrated commitment of the stakeholders, and many other parties – citizens, government officials, health care providers, community leaders, academic institutions, and business people who have supported this proposal. The diversity, number, and enthusiasm of the expressions of support for the project may be unprecedented in the history of Maryland health planning. Many of these supporters noted the benefits of Dimensions’ commitment to connect the regional medical center to a health care system that will promote improved access to primary care in Prince George’s County as well as the planned affiliation with the University of Maryland School of Medicine. As Jane E. Clark, Dean, University of Maryland School of Public Health stated, “This unprecedented partnership of academic, government, and health care institutions to establish a new health care system for the County could be a model for transforming health throughout the nation.”
3. The July 2011 Memorandum of Understanding On July 21, 2011, Dimensions, UMMS, Prince George’s County, the University System
of Maryland, and the State of Maryland signed a Memorandum of Understanding (“MOU”) (Exhibit 6 to the Modified Application) that committed the signatories to developing a comprehensive plan to strengthen health care in Prince George’s County, increase access to primary care, and enhance the County’s overall health infrastructure.
In furtherance of that commitment, the MOU parties commissioned the UM SPH to perform a study of the health care needs of Prince George’s County. Part I of the resulting report, the Public Health Impact Study, details the study’s findings, and is attached to the application as Exhibit 7 to the Modified Application.4
Following completion, review, and approval of Public Health Impact Study by the parties, UMMS agreed to assist Dimensions in the planning of the proposed project. UMMS is dedicated to assisting Dimensions provide quality health care through a market-responsive regional system supported by a world-class academic medical center partnered with University
4 Part II of the Public Health Impact Study includes technical reports with more detailed data, and is available at http://sph.umd.edu/sites/default/files/files/UMDSPH_ImpactStudy.pdf.
#521045 6

of Maryland School of Medicine. A discussion of the history of UMMS and its medical system is included in the supplemental statement attached to the application as Exhibit 8 to the Modified Application.
4. The Public Health Impact Study The Public Health Impact Study addresses the design of a new health care delivery
system for Prince George’s County, using population health management principles. This assessment was integral in the MOU parties’ design consideration and planning for the proposed regional medical center. The Public Health Impact Study’s analysis included:
(1) a survey of Prince George’s County residents;
(2) interviews with State, County, and local stakeholders;
(3) healthcare workforce assessment;
(4) overview of public health resources;
(5) examination of hospital discharges and readmissions of County residents; and
(6) national interviews with leaders from 13 health care systems to help identify best practices in achieving integrated, coordinated, high-quality care that improves population health and reduces costs.
The Study is based on the premise that an efficient, effective and financially viable healthcare system must: (i) promote health, prevent disease, support wellness, and support health equity and quality of life in the County; (ii) address population health broadly, not just focus on those who seek health care; and (iii) have the capacity to deliver high-quality primary prevention and health and hospital care.
The Summary of this report provides the major recommendations that were derived from building on the evidence the research team collected and analyzed from a number of approaches: a random survey of county residents, interviews with key stakeholders, analyses of health status databases, assessment of health care workforce, status of public health and public sector health resources, examination of hospital discharges and readmissions of county residents and lessons from other health care systems. Establishing a “high-quality, academically affiliated regional medical center with a strong and collaborative prevention-focused ambulatory care network” was the UM SPH’s recommendation. Given the input from the various aspects of our study, we concluded that such a “medical center and network would serve as the anchor to the transformation of the health care system” for the County.
Among the study’s key findings and recommendations were the following:
Health Status and Treatment of Prince George’s County Residents
• Findings: County residents suffer from higher rates of chronic diseases, including diabetes, heart disease, hypertension, asthma and cancer, than those residing in neighboring counties. Racial and ethnic differences reveal even greater disparities. In addition, County hospitals demonstrate a significant number of ambulatory-care sensitive discharges.
• Recommendation: Emphasize primary prevention and strong collaborative primary care networks that can provide care management for such ambulatory-care sensitive conditions and lead to improvements that save lives and reduce costly hospital visits.
#521045 7

Health Care Workforce Capacity
• Finding: The County has far fewer primary care providers for the population compared to surrounding counties and the state. The areas with the highest primary care need are within the Beltway and in the southern region of the County. The study shows a need for an additional 61 primary care physicians (a 13% increase) to meet minimum need in the County and recommends expanding community-based health facilities and outreach programs.
• Recommendation: Establish a high quality academically-affiliated regional medical center that will serve as an anchor for transforming the health care system, including attracting primary care and specialty care providers who can assist in developing a strong and collaborative ambulatory care network.
Community-based Care Capacity
• Finding: While the County has many assets that can be mobilized to support a new system, the capacity of community-based care, including safety-net clinics, remains severely limited. The study concludes that County-led efforts are needed to increase this capacity and to guide the integration of primary care and public health services.
• Recommendation: Develop a County-led plan to improve public health and expand access to high quality primary care and support systems integration, by:
(i) Creating an inclusive central planning process; (ii) Coordinating efforts to maximize impact; (iii) Addressing workforce and facilities needs in areas with insufficient
primary care; and (iv) Supporting innovation in health care, prevention and public health care
delivery.
Specific Technical Reports of the Public Health Impact Study Technical Report #1: Random Household Health Survey: The top three priority topics
mentioned by respondents when deciding on the location where they will get health care services includes: location, quality of care/reputation, and accessibility. Of those who mentioned location, two-thirds responded that having the facility or doctor close to their home was important. Regarding quality of care, most responded that they would go where they will receive a higher quality of care.
Technical Report #2: Interviews of Key Stakeholders. Key stakeholders recommended
that “an academically based regional health care system that included a teaching hospital” would greatly improve the reputation of the County’s health care system. One stakeholder mentioned that it would be difficult to build the infrastructure to support ambulatory primary care centers without a regional teaching hospital. In addition, those interviewed mentioned that having a research-based infrastructure would allow providers to maintain current on the latest knowledge and practices.
Technical Report #3: Physician Counts and Categorization and Characteristics of
Physicians in the State of Maryland and Prince George’s County and Technical Report #4: Identification of Geographic Areas of Need for Primary Care: An Assessment of the Geographic Distribution of Selected Health care Resources document the limited number of primary and specialty care physicians, and primary care providers by Public Use Microdata Area (PUMA)
#521045 8
and zip code. Technical Report #4 also integrates socio-demographic, health care utilization, and health provider data to document levels of primary care need. The County has multiple zip code areas where the need is high and trending to high. An academic health care center, by its very nature, attracts medical residents. These residents, upon completion of their specialty training are more likely to stay and practice in the county. This will attract and retain primary and specialty care practitioners to the County in order to address documented underserved communities.
Similarly, a “teaching hospital” is also likely to attract a broader, more diverse selection
of residents, not only based on race and ethnicity, but also based on the different perspectives of the educational institutions from which they come. Again, the UM SPH Random Household Health Survey (Technical Report #1) showed that community residents were interested in having access to providers who understand their culture and their language (20% of the respondents stated that they spoke a language other than English when they were at home).
Citation for Entire Report University of Maryland School of Public Health. Public Health Impact Assessment Workgroup. (2012, July). Transforming health in Prince George’s County, Maryland: A public health impact study. Retrieved from http://sph.umd.edu/princegeorgeshealth/TransformingHealth.pdf Citation for Summary and for Individual Technical Reports Kleinman, D.V., Quinn, S. C., Blake, K. Summary. In Transforming health in Prince George’s County, Maryland: A public health impact study(Section I, pp i-xxx). Retrieved from University of Maryland School of Public Health website: http://sph.umd.edu/princegeorgeshealth/TransformingHealth.pdf Quinn, S. C., Thomas, S. B., & Passmore, S. (2012). Random household health survey. In Transforming health in Prince George’s County, Maryland: A public health impact study (Section II, Technical Report 1, pp. 1-46). Retrieved from University of Maryland School of Public Health website:http://sph.umd.edu/princegeorgeshealth/TransformingHealth.pdf Aldoory, L., Boekeloo, B., Horowitz, A., Kleinman, D., Quinn, S.C., Thomas, S.B. (2012). Interviews with stakeholders. In Transforming health in Prince George’s County, Maryland: A public health impact study (Section II, Technical Report 2, pp. 47-68). Retrieved from University of Maryland School of Public Health website: http://sph.umd.edu/princegeorgeshealth/TransformingHealth.pdf Lee, M. L. T., & Cruz-Cano, R. Physician count and categorization and characteristics of physicians in the state of Maryland and Prince George’s County. In Transforming health in Prince George’s County, Maryland: A public health impact study (Section II, Technical Report 3, pp. 69-94). Retrieved from University of Maryland School of Public Health website: http://sph.umd.edu/princegeorgeshealth/TransformingHealth.pdf Wang, M. Q. (2012). Identification of geographic areas of need for primary care: An assessment of the geographic distribution of selected health care resources.
#521045 9

In Transforming health in Prince George’s County, Maryland: A public health impact study (Section II, Technical Report 4, pp. 95-136). Retrieved from University of Maryland School of Public Health website: http://sph.umd.edu/princegeorgeshealth/TransformingHealth.pdf Segal, E. A., Sims, A., & LaTouche-Howard, S. A. (2012). An overview of the public and public health resources in Prince George’s County. InTransforming health in Prince George’s County, Maryland: A public health impact study (Section II, Technical Report 5, pp. 137-156). Retrieved from University of Maryland School of Public Health website: http://sph.umd.edu/princegeorgeshealth/TransformingHealth.pdf Mortensen, K. (2012). Current (2007-2009) experiences and future projections of Prince George’s County residents’ hospital encounters. InTransforming health in Prince George’s County, Maryland: A public health impact study (Section II, Technical Report 6, pp. 157-192). Retrieved from University of Maryland School of Public Health website: http://sph.umd.edu/princegeorgeshealth/TransformingHealth.pdf Wilson, L., Dagher, R., Simon-Rusinowitz, L., & Hamilton, D. (2012). An assessment of comparable model health care systems: Interviews with key professionals. In Transforming health in Prince George’s County, Maryland: A public health impact study (Section II, Technical Report 7, pp. 193-208). Retrieved from University of Maryland School of Public Health website: http://sph.umd.edu/princegeorgeshealth/TransformingHealth.pdf
5. Commitment to Primary and Community Care The plan to transform the healthcare delivery system in Prince George’s County relies
on the collaboration of the MOU parties not only in the development of a new regional medical center, but also on significant efforts outside of hospital care. Achieving objectives will require increased access to primary care, increased safety-net clinic capacity that is integrated with overall health care and social service system in the County, and further mobilization of public sector programs through schools, mobile care, and parks/recreation facilities. In addition to developing plans for a new regional medical center supported by a comprehensive ambulatory care network, the Prince George’s County Government worked with JSI Inc., with participation from Dimensions, UMMS, and other healthcare providers and community stakeholders, to develop a strategic plan to improve access to integrated primary and community care (the “Primary Healthcare Strategic Plan” or the “Plan”).
The Primary Healthcare Strategic Plan aims to increase access to patient-centered primary care, to improve health outcomes, and to foster economic development in Prince George’s County. The current conditions that have informed the development of the Plan overlap with those that informed the planning of PGRMC, among them:
• Higher rates of chronic disease and poor health status of County residents as compared to neighboring counties
• Fewer primary care practices that have achieved patient-centered medical home status than neighboring counties
• Lack of adequately sized space for medical practices, especially in low-income areas
• Larger percentage of low income, uninsured patients • Maryland’s shift to global payment
#521045 10

The Primary Healthcare Strategic Plan is centered on the following recommendations to address these concerns.
• Increase patient-centered primary care practices in health investment zones • Build capacity of existing primary care practices to operate as patient-centered
medical homes (PCMH) • Build collaboration among Prince George’s County hospitals • Develop workforce to support patient-centered primary care • Deploy marketing and branding campaign • Establish a primary healthcare authority • Develop and implement a monitoring and evaluation plan
6. Development of the Proposed Regional Medical Center
The combined analysis of the Public Health Impact Study resulted in the development and implementation of a strategy to transform the current health system into an efficient, effective, and financially viable healthcare delivery system with a new regional medical center, located in Prince George’s County, supported by a comprehensive ambulatory care network, which will help improve the health of the residents of Prince George’s County and the Southern Maryland region. Based on the Public Health Impact Study, the MOU parties developed the following specific objectives critical to their overall goal of improving the health status of the regional population while improving care delivery effectiveness and efficiencies:
• Improve access of primary/community care, specialty care, and other healthcare services to the region to reduce healthcare disparities and improve health status;
• Help strengthen / coordinate care continuum-from primary/community care through post-acute care;
• Invest in ambulatory based clinics and other health education programs to manage chronic diseases;
• Integrate academic medical teaching and research in a new approach to care for the region; to become a Learning Healthcare System;
• Strengthen / improve access to tertiary care through the proposed regional medical center;
• Attract residents of Prince George’s County and Southern Maryland region who now receive care from hospitals outside the State of Maryland; and
• Transform an existing healthcare system to become more efficient and financially viable while changing focus to population health management practices.
The proposed PGRMC and its clinical programs will be designed to further these objectives. The MOU parties incorporated the following significant design elements and considerations into the development of the proposed regional medical center set forth in this application:
• Dimensions took into consideration declining inpatient utilization rates in the service area as a result of population health management.
• The regional medical center is forecasted to have an ALOS less than what the current PGHC facility is experiencing.
#521045 11

• The regional medical center’s clinical programs will be designed to include better coordinated community care with primary care physicians as well as within the patients’ home environment.
• The regional medical center will have specialized ambulatory clinics to manage high-risk patients having chronic conditions such as diabetes, COPD, and CHF.
• The regional medical center will have an academic affiliation in order to attract high quality providers, which will foster the development of a strong and collaborative ambulatory care network.
• The new health system and its MOU partners will work together to promote increased access to primary care resources (both physicians and mid-level practitioners).
7. Medical Residents are Critically Important to Prince George’s County In comparison to its suburban Washington neighbor, Montgomery County, Prince
George’s County has relatively few medical residents and would have none without PGHC. Two Montgomery County hospitals have medical residents: Holy Cross Hospital of Silver Spring and Suburban Hospital. Together, they have 61.6 FTEs of medical residents, as shown in Table 78 below. PGHC is the only hospital in Prince George’s County with medical residents. The number of medical residents per 100,000 residents is lower in Prince George’s County than in Montgomery County. In order to replicate the number of medical residents in Montgomery County, PGRMC would have to add 15.7 Medical Resident FTEs. [(5.95/100,000) x 900,350 = 53.53; 53.53 - 37.8 = 15.73]
Table 78 Medical Resident FTE Comparison
Montgomery County versus Prince George's County Fiscal Year 2014
Projected
Resident
FTEs per
County
2015 Pop.
FTEs
100,000 Pop. Montgomery County
1,036,000
61.6
5.95
Prince George's County
900,350
37.8
4.20 SOURCES: (1) Projections prepared by the Maryland Department of Planning, July 2014.
(2) Resident FTE's collected from hospital's FY 2014 HSCRC Annual Filing, P4 Schedule. It is important to recognize that PGHC shoulders the responsibility and burden of medical education in Prince George’s County on its own. In addition, PGHC has more Residents than either Holy Cross or Suburban. Moreover, Prince George’s County must be more competitive to attract residents, and, indeed, to increase its number of residents, than Montgomery County. The growing ties between Dimensions and UMMS will enable PGRMC to have a more robust teaching experience than either Holy Cross or Suburban. Dimensions’ investment in the PGRMC site of adequate teaching space will allow it to accommodate this robust experience and make Prince George’s County more competitive in attracting medical residents.
#521045 12

8. Rationale For An Academic-Affiliated Regional Tertiary Medical Center As previously noted, studies of health care in the County demonstrate that a majority of
County residents seek health care services outside of the County. While PGHC has become a safety net of uninsured and underinsured residents of the County, more affluent County residents seek care from facilities in neighboring counties, the District of Columbia, and Virginia. The proposed health system, accompanied by an ambulatory care network and a new academic-affiliated regional tertiary medical center, will have a significant impact on improving the access of quality healthcare within Prince George’s County and the region. Through its partnership with UMMS and the University System of Maryland, PGRMC will have access to a greater network of high quality physicians, and the creation of a new, modern facility with teaching and training capabilities will attract more high quality members of the professional medical community that may have previously sought practice opportunities outside of the service area.
The MOU parties initiated a healthcare planning process more than three years ago with the objective of transforming Prince George’s County’s existing healthcare system into an efficient, effective, and financially viable healthcare delivery system. The overall goal of this initiative is to improve the health status of residents of Prince George’s County and Southern Maryland region by: improving community-based provider access to high quality, cost effective medical care; establishing population health management practices; developing an ambulatory care network; and developing a new regional medical center to replace PGHC, with a recommendation that the new regional medical center be affiliated with an academic medical center.
This initiative design is based on the recommendations from Public Health Impact Study. The new regional healthcare delivery system is a public health plan to improve health status of a regional population while improving care delivery effectiveness and efficiencies. This health care delivery system design complements Dimensions’ new vision: “To be the healthcare system of choice, recognized for clinical, academic, and service excellence, through compassionate and innovative healthcare.”
Through a partnership with the University System of Maryland and UMMS, Dimensions strives to become a leading “learning healthcare delivery system” that will drive health improvement, high-quality outcomes, and efficient care delivery. University System of Maryland proposes to create the establishment of the University of Maryland Research Institute, with a focus on developing inter-professional healthcare education and training in Prince George’s County and throughout Southern Maryland.
The proposed new regional medical center and its clinical programs will be designed to further the objectives of the Public Health Impact Study. The MOU parties incorporated the following significant design elements and considerations into the development of the proposed regional medical center set forth in this application:
• Dimensions took into consideration declining inpatient utilization rates in the service area.
• The regional medical center will be forecasted to have an ALOS less than what the current PGHC facility is experiencing.
• The regional medical center’s clinical programs will be designed to include better coordinated community care with primary care physicians as well as within the patients’ home environment.
#521045 13
• The health system will have specialized ambulatory clinics to manage high-risk patients having chronic conditions such as diabetes, COPD, and CHF.
• The regional medical center will have an academic affiliation in order to attract high quality providers, which will foster the development of a strong/collaborative ambulatory care network.
• The new health system and its MOU partners will work together to promote increased access to primary care resources (both physicians and mid-level practitioners).
The benefits that will be gained from a new academically-affiliated regional tertiary medical center include the following:
• The new regional medical center will be connected to a health system that will promote improved access to community care with a focus on delivering care based upon population health management principles. It will be a community partner in helping to improve the health status of Prince George’s County residents. The academic teaching component will help improve / increase both professional medical education programs as well as community health education programs.
• The new regional medical center will serve as a catalyst to successfully recruit needed physicians of many specialties to the region, with a particular emphasis on reducing the primary care access deficiency within Prince George’s County. Increasing the number of health care professionals within the Southern Maryland region will help address health care disparity issues currently being experienced and can assist in building the components necessary to have an effective population health management program in place. Examples of academic medical education programs to be located at the PGRMC campus include:
o ACGME accredited Internal Medicine Residency Program
o ACGME accredited Family Practice Residency Program
o Expansion of current education rotations of fellows, medical students, residents, and allied health professionals in partnership with other medical academic institutions
• The new regional medical center will be more centrally located within Prince George’s County, with improved accessibility to residents of Southern Maryland for secondary and tertiary care. The planned location for the new regional medical center will be easily accessible given its proximity to I-495 and the Largo Town Center Metro transportation station.
• The new regional medical center project will create opportunities to improve access and quality of health care services to Prince George’s County residents.
• The new regional medical center will allow for the potential development of an on-site educational health science program in partnership with the University of Maryland, Baltimore (“UMB”).
• The new facility’s connections with UMB will provide high quality, clinically advanced medical care to support the regional medical center’s continuing mission of being a tertiary center. The partnership will improve access to the most “up-to-date” clinical best practices for the region and promote team-based medical care practice.
#521045 14

• The regional medical center will serve as a catalyst of bringing back some of the approximately 23,000 residents of Prince George’s County who currently seek inpatient care in Washington D.C. and Virginia hospitals. The project will enable residents to receive secondary and tertiary care services without leaving their home county to receive care. Traveling to D.C. for inpatient care can be difficult for some population groups with limited means or resources.
• The new regional medical center will have a significant positive economic impact to Prince George’s County as well as having a positive impact on the State’s economy.
• The regional medical center will serve as a teaching venue for University System of Maryland.
3. Please confirm all services that will be located in the Ambulatory Care Center (ACC). The submitted drawings show the services to be mechanical, clinics, administration, conference, and cancer center. Please be specific about what is included in “clinics.” Also define which of the services planned for the ACC are rate-regulated hospital services.
Applicant Response:
The Ambulatory Care Center (ACC) will include a cancer center, outpatient clinics, and administrative / conference space. The cancer center will provide both radiation and medical oncology services and is planned to be affiliated with the UMMS oncology program. The outpatient clinics in the ACC will include clinics designed to assist with the hospital’s population health management initiatives. Such ambulatory clinics will include a regional diabetes center, a chronic heart failure clinic, a pulmonary disease clinic, and a wound care clinic. Physician-based clinics planned include trauma, orthopedics, obstetrics, general surgery, and other subspecialties, designed to provide improved access to subspecialty services for the community.
The ambulatory clinic services planned for the new ACC are currently being provided at
PGHC as rate-regulated services, and the projected revenue and expenses related to these services are included in Tables G1 and H1 on a rate-regulated basis, both in Exhibit 1 to the Modified Application and Exhibit 50.
As for the planned cancer center, Dimensions is evaluating whether to structure the
cancer center services on a rate-regulated basis. While Dimensions has included the cost of constructing and building out this space in the Project Budget, it is still in the process of assessing the expected revenues and operating expenses associated with the cancer center to determine the lowest cost setting for providing these new services. Accordingly, it has not included the projected revenue and operating expenses associated with the cancer center in the financial projections presented in Tables G1 and H1 and the other analyses of PGRMC’s Global Budget Revenue.
#521045 15

4. Regarding Exhibit 1 Table B Departmental Gross Square Feet, please fill out the “current” column reflecting the existing Cheverly location.
Applicant Response:
Attached as Exhibit 50, Table B (Revised) is a revised Exhibit 1, Table B, showing Departmental Gross Square Feet for the existing facility at the Cheverly location.
PROJECT BUDGET 5. The project budget shows the CUP cost in a separate column. Can we assume that
the cost of the Ambulatory Care Center is included in the “Hospital Building” column? If so, what is the cost of that element of the project? If not, please provide that information.
A revised Project Budget that breaks out the cost of the Ambulatory Care Center and
Cancer Center is attached as Exhibit 50, Table E (Revised). CONSISTENCY WITH GENERAL REVIEW CRITERIA (COMAR 10.24.01.08G(3)) a) The State Health Plan COMAR 10.24.10 - ACUTE HOSPITAL SERVICES standards Identification of Need and Addition of Beds 6. The licensed bed column of Exhibit 1 Table A is not consistent with the Hospital’s
current number of licensed acute care beds and is not consistent with the Hospital’s Acute General Hospital Licensed Bed Designation form (attached). Please correct the form or explain the changes.
Applicant Response:
Exhibit 1, Table A from the Modified Application is consistent with PGHC’s bed licensure for FY 2014. A revised Table A, reflecting PGHC’s bed licensure for FY2015, is attached as Exhibit 50, Table A (Revised). References to PGHC’s licensed bed count in the Modified Application, including the reference to OB beds on page 86, were based on the FY 2014 licensed bed count. 7. Regarding the definition of PGRMC’s new service area, please provide the following
clarifications;
a. On page 54 in the third paragraph it is stated that drive times were generated from selected zip codes to each Maryland, District of Columbia and Virginia hospital; however, the first paragraph does not identify any Virginia hospitals that were used in the proximity ranking. Were any Virginia hospitals used in the proximity ranking? If yes, please specify.
#521045 16

Applicant Response:
While Virginia hospitals were used in the hospital discharge impact analysis (see page 224), they were not used in the proximity ranking.
b. On page 61 Table 9 shows service area population by age and inpatient service for
2012 for both the current and expected service areas, as well as the 2022 projected population for the expected service area. Are the populations shown for each MSGA age group (15-64, 65-74, and 75+) and the Pediatric population (0-14) for the distinct zip code areas identified for each age group on pages 53 through 60 or were the zip code areas combined in some way to identify one service area for all age groups. If the service areas were combined in any way explain how.
Applicant Response:
The populations presented in Table 9 reflect the distinct zip codes that make up each individual cohort’s service area as defined on pages 55-60. 8. Explain the note below Table 16 on page 66, which says: “Total discharges by zip
code were determined using each zip code’s proportion of the service area in 2013.” An example applying the methodology to a zip code area would be helpful.
Applicant Response:
The hospital impact analysis was performed at the zip code level within each individual cohort. Thus, the total projected discharges for the service area as shown in Table 16 were allocated at the zip code level. The FY 2013 actual allocation of discharges within the defined PGRMC service areas (as shown on pages 55-60) was used to allocate FY 2022 projected discharges to zip codes. For example, in FY 2013, there were 2,328 discharges of residents from zip code 20743 that were classified as MSGA 15-64. For the total PGRMC service area, as defined on page 55, MSGA 15-64 discharges in FY 2013 were 39,921. Thus, zip code 20743 made up 5.83% (2,328 / 39,921) of the service area’s discharges. Assuming FY 2022’s projected discharges for the same service area will be allocated according to FY 2013’s experience, zip code 20743 is projected to have 2,206 (5.83%) of the 37,827 discharges in the MSGA 15-64 service area projected on page 66 of the Modified Application.
9. On page 80 below Table 24, it states that “PGHC developed assumptions regarding out of service area discharges that reflect 10% to 28% increases over the service area discharges depending on cohort.” Explain how out-of-service area discharges can be 10% to 28% of in-service-area discharges when the service areas were defined as the area that accounts for 85% of a hospital’s discharges. Shouldn’t the out of service area discharges approximate 15%? Provide an example of the calculation for each service and age group.
Applicant Response:
Dimensions used the FY 2013 relationships between out-of-service area and in-service area discharges within each cohort to project the out-of-service area discharges within each cohort.
#521045 17

MSGA 15-64: As shown on page 55, the MSGA 15-64 cohort had a large number of discharges of residents from outside of Maryland. Therefore, the service area was cut off at 78.3%. The related 3,521 discharges represent 78.3% of PGHC’s total FY 2013 MSGA 15-64 discharges of 4,497. As such, the out-of-service area discharges were 976 (4,497 – 3,521). Therefore, the relationship between out-of-service area discharges (976) and in-service area discharges (3,521) in FY 2013 was 27.7% (976 / 3,521). This 27.7% was applied to the projected PGRMC FY 2022 in-service area discharges of 4,966 to determine the out-of-service area discharges of 1,377 (27.7% x 4,966), as shown in Table 25 on page 81.
MSGA 65-74: As shown on page 56, the MSGA 65-74 cohort was cut off at 86.0%. The related 903 discharges represent 86.0% of PGHC’s total FY 2013 MSGA 65-74 discharges of 1,050. As such, the out-of-service area discharges were 147 (1,050 – 903). Therefore, the relationship between out-of-service area discharges (147) and in-service area discharges (903) in FY2013 was 16.3% (147 / 903). This 16.3% was applied to projected PGRMC FY 2022 in-service area discharges of 2,036 to determine the out-of-service area discharges of 331 (16.3% x 2,036), as shown in Table 25 on page 81.
MSGA 75+: As shown on page 57, the MSGA 75+ cohort was cut off at 85.2%. The related 993 discharges represent 85.2% of PGHC’s total FY 2013 MSGA 75+ discharges of 1,165. As such, the out-of-service area discharges were 172 (1,165 – 993). Therefore, the relationship between out-of-service area discharges (172) and in-service area discharges (993) in FY 2013 was 17.3% (172 / 993). This 17.3% was applied to projected PGRMC FY 2022 in-service area discharges of 2,135 to determine the out-of-service area discharges of 372 (17.3% x 2,135), as shown in Table 25 on page 81.
PEDS: As shown on page 58, the PEDS cohort was cut off at 87.5%. The related 21 discharges represent 87.5% of PGHC’s total FY 2013 PEDS discharges of 24. As such, the out-of-service area discharges were 3 (24 – 21). Therefore, the relationship between out-of-service area discharges (3) and in-service area discharges (21) in FY 2013 was 14.3% (3 / 21). This 14.3% was applied to projected PGRMC FY 2022 in-service area discharges of 28 to determine the out-of-service area discharges of 4 (14.3% x 28), as shown in Table 25 on page 81.
OB: As shown on page 59, the OB cohort was cut off at 90.8%. The related 2,077 represents 90.8% of PGHC’s total FY2013 OB discharges of 2,287. As such, the out-of-service area discharges were 210 (2,287 – 2,077). Therefore, the relationship between out-of-service area discharges (210) and in-service area discharges (2,077) in FY 2013 was 10.1% (210 / 2,077). This 10.1% was applied to projected PGRMC FY2022 in-service area discharges of 1,991 to determine the out-of-service area discharges of 202 (10.1% x 2,077), as shown in Table 25 on page 81.
PSY: As shown on page 60, the PSY cohort was cut off at 85.7%. The related 1,165 represents 85.7% of PGHC’s total FY 2013 PSY discharges 1,359. As such, the out-of-service area discharges were 194 (1,359 – 1,165). Therefore, the relationship between out-of-service area discharges (194) and in-service area discharges (1,165) in FY 2013 was 16.7 % (194 / 1,165). This 16.7% was applied to projected PGRMC FY 2022 in-service area discharges of 1,179 to determine the out-of-service area discharges of 197 (16.7% x 1,179), as shown in Table 25 on page 81.
#521045 18

Financial Feasibility 10. Project GBR for 2015 through 2022 detailing year to year adjustments including
annual update, population, market share and capital-related rate increase. Reconcile the projections with Tables G1 and H1.
Applicant Response:
The projected Gross Patient Service Revenue, as presented in Tables G1 and H1, is based on the GBR projections, uninflated and inflated, that are presented in Table 50, Table G1 (Revised) and Table H1 (Revised), respectively. These projections include adjustments for annual HSCRC updates, population growth, shifts in market share, and a capital-related rate increase.
Emergency Department Treatment Capacity and Space 11. Please respond to the following:
a. Explain the wide fluctuations in ED visits between FY 2013 and FY 2015 (i.e., a
7.1% drop in FY 2014 followed by a 27.6% increase in FY 2015) reported in Table F1?
Applicant Response:
Exhibit 1, Table F1 incorrectly shows the number of ED visits for 2013 and 2014. For those two years, Table F1 reflects only those ED visits that did not result in admission to the hospital (outpatient ED visits but not inpatient ED visits). In 2015 and thereafter, total ED visits (both inpatient and outpatient visits) are shown. This resulted in the large increase between 2014 and 2015. A corrected Table F1 that includes total ED visits for all years is included in Exhibit 50 (Revised). This corrected table also includes an update of the expected ED visits in 2015 to reflect six months actual experience through December 31, 2014. The update for actual experience in 2015 results in a change to the projection of ED visits in 2016 through 2021 as well. The expected number of ED visits in 2022 is not expected to change.
b. Explain the basis of the statement by Prince George’s County Fire/EMS Department that “the number of transport calls in the new catchment area (Largo) will be significantly greater than in PGHC’s existing catchment area (Cheverly).” How was this information used in projecting future ED visits? Quantify the impact of this information on such visit volume.
Applicant Response:
As discussed on page 148 of the Modified Application, the Prince George's County Fire/EMS Department has subdivided Prince George’s County into catchment areas for each of the hospital Emergency Departments.
On February 19, 2015, representatives of Dimensions spoke with Dennis C. Wood, MS,
NR-P, Assistant Chief, Prince George's County Fire/EMS Department, and asked him to explain the basis for the different number of EMS calls between the existing PGHC (in Cheverly) and the proposed PGRMC (in Largo). Mr. Wood explained that the Fire/EMS Department, using
#521045 19

Geographic Information Systems (GIS) software, calculated the closest hospital by time using road mileage and speed limits. There are two potential factors that cause the proposed PGRMC's Catchment Area to show more calls than the existing PGHC's Catchment Area: (1) the proposed PGRMC has a larger catchment area than PGHC currently does; and (2) PG Fire/EMS receives a larger frequency of calls from the new catchment area than it does from other areas of the County.
Data from Prince George's County Fire/EMS Department for 2012 show that there were
21,900 transport calls from the PGHC’s/Cheverly catchment area. The number of transport calls in the PGRMC/Largo catchment area was 28,702 in 2012, and resulting transports would have gone to PGRMC if it had been located at the proposed site at that time. This is the basis of the statement by Prince George’s County Fire/EMS Department that “the number of transport calls in the new catchment area (Largo) will be significantly greater than in PGHC’s existing catchment area (Cheverly).”
According to the EMS Department, approximately two-thirds of transport calls result in
actual transports. Further, while the selection of the hospital to which patients are transported may be affected by patient preference, the EMS Department has advised Dimensions to assume that nearly all of the transports in PGHC’s catchment area do and will go to PGHC. This means that the existing catchment area resulted in 14,601 transports to PGHC in 2012 and would have resulted in 19,136 transports if the hospital was located in Largo.
Dimensions utilized the EMS Department data as follows:
To estimate the number of ED visits at PGHC in 2012 that resulted from EMS transports,
Dimensions multiplied the number of transport calls by .6667, consistent with the EMS Department’s estimate that two-thirds of the calls result in transports to an emergency department.
Transport Calls, PGHC/Cheverly Catchment Area, 2012 21,900 Call to Transport Conversion 0.6667 Estimated Transports, 2012 14,601
Dimensions then subtracted the number of ED visits that resulted from EMS transport in
2012 from the total number of ED visits at PGHC in 2012 in order to calculate the number of Non-Transport ED visits.
Total ED Visits, 2012 52,309 Estimated Transports, 2012 14,601 Non-Transport Visits, 2012 37,708
Dimensions then calculated a use rate for the Non-Transport Visits by dividing the
number of Non Transport ED visits by the 2012 population for the PGHC Service Area.
Total Population, 2012 1,071,171 Non-Transport Visits, 2012 37,708 Use Rate of Non-Transport Visits/Population 0.0352
#521045 20
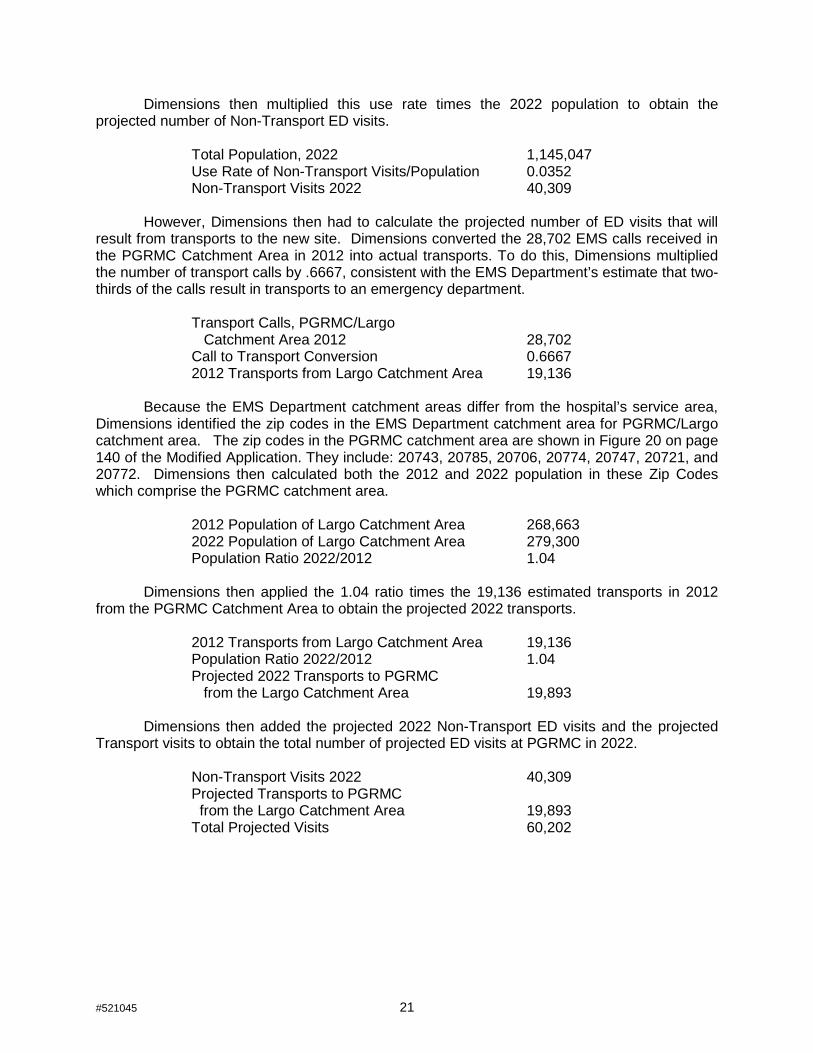
Dimensions then multiplied this use rate times the 2022 population to obtain the projected number of Non-Transport ED visits.
Total Population, 2022 1,145,047 Use Rate of Non-Transport Visits/Population 0.0352 Non-Transport Visits 2022 40,309
However, Dimensions then had to calculate the projected number of ED visits that will
result from transports to the new site. Dimensions converted the 28,702 EMS calls received in the PGRMC Catchment Area in 2012 into actual transports. To do this, Dimensions multiplied the number of transport calls by .6667, consistent with the EMS Department’s estimate that two-thirds of the calls result in transports to an emergency department.
Transport Calls, PGRMC/Largo Catchment Area 2012 28,702 Call to Transport Conversion 0.6667 2012 Transports from Largo Catchment Area 19,136
Because the EMS Department catchment areas differ from the hospital’s service area,
Dimensions identified the zip codes in the EMS Department catchment area for PGRMC/Largo catchment area. The zip codes in the PGRMC catchment area are shown in Figure 20 on page 140 of the Modified Application. They include: 20743, 20785, 20706, 20774, 20747, 20721, and 20772. Dimensions then calculated both the 2012 and 2022 population in these Zip Codes which comprise the PGRMC catchment area.
2012 Population of Largo Catchment Area 268,663 2022 Population of Largo Catchment Area 279,300 Population Ratio 2022/2012 1.04
Dimensions then applied the 1.04 ratio times the 19,136 estimated transports in 2012 from the PGRMC Catchment Area to obtain the projected 2022 transports.
2012 Transports from Largo Catchment Area 19,136 Population Ratio 2022/2012 1.04 Projected 2022 Transports to PGRMC from the Largo Catchment Area 19,893
Dimensions then added the projected 2022 Non-Transport ED visits and the projected Transport visits to obtain the total number of projected ED visits at PGRMC in 2022.
Non-Transport Visits 2022 40,309 Projected Transports to PGRMC from the Largo Catchment Area 19,893 Total Projected Visits 60,202
#521045 21
COMAR 10.24.11 GENERAL SURGICAL SERVICES STANDARDS
Transfer Agreements
12. Exhibit 40 provides a number of agreements from health care providers who transfer patients to PGHC for care and treatment. Please provide evidence of any transfer agreements that PGHC has or will have with hospitals capable of managing cases that exceed the capabilities of PGHC.
Applicant Response:
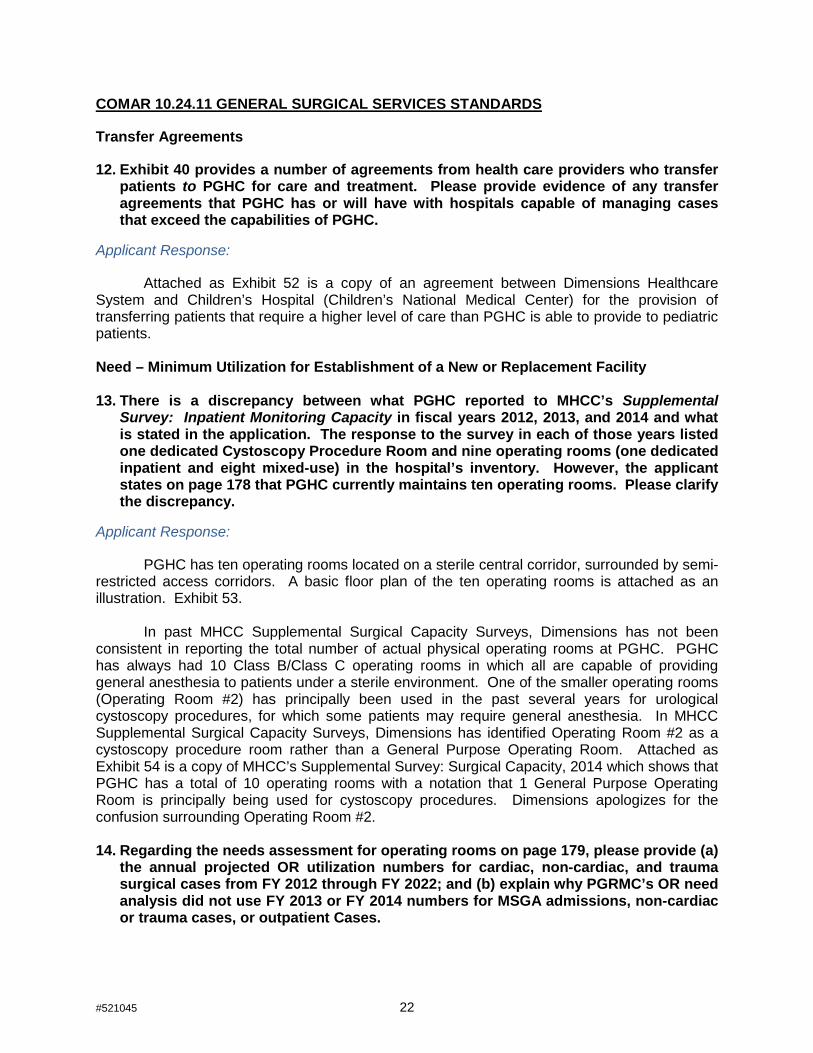
Attached as Exhibit 52 is a copy of an agreement between Dimensions Healthcare System and Children’s Hospital (Children’s National Medical Center) for the provision of transferring patients that require a higher level of care than PGHC is able to provide to pediatric patients. Need – Minimum Utilization for Establishment of a New or Replacement Facility 13. There is a discrepancy between what PGHC reported to MHCC’s Supplemental
Survey: Inpatient Monitoring Capacity in fiscal years 2012, 2013, and 2014 and what is stated in the application. The response to the survey in each of those years listed one dedicated Cystoscopy Procedure Room and nine operating rooms (one dedicated inpatient and eight mixed-use) in the hospital’s inventory. However, the applicant states on page 178 that PGHC currently maintains ten operating rooms. Please clarify the discrepancy.
Applicant Response:
PGHC has ten operating rooms located on a sterile central corridor, surrounded by semi-restricted access corridors. A basic floor plan of the ten operating rooms is attached as an illustration. Exhibit 53.
In past MHCC Supplemental Surgical Capacity Surveys, Dimensions has not been consistent in reporting the total number of actual physical operating rooms at PGHC. PGHC has always had 10 Class B/Class C operating rooms in which all are capable of providing general anesthesia to patients under a sterile environment. One of the smaller operating rooms (Operating Room #2) has principally been used in the past several years for urological cystoscopy procedures, for which some patients may require general anesthesia. In MHCC Supplemental Surgical Capacity Surveys, Dimensions has identified Operating Room #2 as a cystoscopy procedure room rather than a General Purpose Operating Room. Attached as Exhibit 54 is a copy of MHCC’s Supplemental Survey: Surgical Capacity, 2014 which shows that PGHC has a total of 10 operating rooms with a notation that 1 General Purpose Operating Room is principally being used for cystoscopy procedures. Dimensions apologizes for the confusion surrounding Operating Room #2. 14. Regarding the needs assessment for operating rooms on page 179, please provide (a)
the annual projected OR utilization numbers for cardiac, non-cardiac, and trauma surgical cases from FY 2012 through FY 2022; and (b) explain why PGRMC’s OR need analysis did not use FY 2013 or FY 2014 numbers for MSGA admissions, non-cardiac or trauma cases, or outpatient Cases.
#521045 22

Applicant Response:
Dimensions did not update the need projections for operating rooms to 2013 or 2014 because, in the interim, it had changed the data system that it had been using and was having difficulty obtaining accurate data for 2014 and confirming the 2013 count of cases and minutes.
Since the filing of the modified application, Dimensions has resolved the problem. This will require Dimensions to modify its projections found on pages 178-180 of the modified application and adjust the number of operating rooms for the proposed facility. Project drawings reflecting the adjustment are attached as Exhibit 55.
PGHC currently has ten operating rooms and proposes to maintain nine operating rooms in the new facility. Dimensions will not fit out one of the originally proposed operating rooms and will use it for equipment storage. Dimensions will seek regulatory approval when the additional operating room is needed. PGHC’s operating room configuration includes one dedicated Trauma OR, two dedicated Cardiac Surgery operating rooms (one for surgery and one for backup, which is standard among hospitals with Cardiac Surgery programs), and seven operating rooms for non-Cardiac or Trauma cases. Table 58 shows the volumes for 2009-2014.
Table 58 (Revised) Historical OR Volumes
PGHC 2008-2013
Cases
Minutes
Inpatient
Outpatient
Inpatient
Outpatient
Total Cardiac Trauma
Non-Cardiac
or Trauma
Total Cardiac Trauma
Non-Cardiac
or Trauma
FY: 2009
2,736
31
97
2,608 2,067
276,814
8,835
12,659
255,320
137,392
FY: 2010 2,547
27
101
2,419 1,911
258,873
8,150
12,571
238,152
124,949
FY: 2011 2,549
39
87
2,423 1,742
270,724
11,340
11,327
248,057
111,262
FY: 2012 2,546
8
84
2,454 1,738
279,146
2,323
10,338
266,485
117,502
FY: 2013 2,329
22
91
2,216 1,927
290,633
7,143
11,824
271,666
144,066
FY: 2014 2,172
13
164
1,995 1,807
296,950
5,235
30,251
261,464
134,115
Source: PGHC, Volumes include only OR Cases, excluding endoscopies, cystoscopies, C-sections, and other procedure room cases.
#521045 23

Table 59 shows the historical and average minutes per case at PGHC:
Table 59 (Revised) Historical OR Minutes per Case
PGHC 2008-2013
Inpt. Non-Cardiac or
Trauma Minutes/Case
Outpt. Minutes/Case
FY: 2009 97.90 66.47 FY: 2010 98.45 65.38 FY: 2011 102.38 63.87 FY: 2012 108.59 67.61 FY: 2013 122.59 74.76 FY: 2014 131.06 74.22 Average: 110.16 68.72
Dimensions recognizes that volumes have declined, as have admissions in general, as
PGHC’s physical plant has aged and the hospital has not had the capacity to compete with other hospitals with more modern operating room suites. Also, several Dimensions surgeons have recently retired, and it has been difficult to recruit new surgeons to replace them because of the hospital’s physical plant and the hospital’s uncertain future over the last ten years. However, Dimensions believes that its volumes will grow in the future, as hospital volumes grow. (See the discussion of projected MSGA volumes.) Dimensions has initiated the recruitment of several surgeons to replace those who have retired. In addition, Dimensions will work with local referring physicians to recapture patients who have been traveling into Washington, D.C. for surgery.
Just as it currently has three operating rooms to accommodate its trauma and cardiac surgery programs, Dimensions proposes three operating rooms for these programs in the new facility. Dimensions projects future need for its non-cardiac or trauma operating rooms based on the projected growth in MSGA admissions from 2014-2022. Dimensions used the average number of minutes per case between 2009 and 2014 (110.16 minutes/case for non-Cardiac, non-Trauma inpatient cases and 68.72 minutes/case for Outpatients). Dimensions believes that this is conservative because, as Table 59 shows, inpatient minutes per case have increased steadily through the five year period. This is particularly true in 2013-2014 because UMMS affiliated orthopedic surgeons have begun practicing at PGHC, and they are performing more complicated surgeries, which require more operating room time. In 2014, the inpatient cases took 131.06 minutes/case. PGHC has chosen to be consistent with the methodology included in both the original CON application and the modification and has continued to use the average minutes/case over the five year period. PGHC has used 25 minutes per case for cleanup time, just as it did in the CON application and the modification. These projections are shown below. The result is that Dimensions will require 5.68 ORs for non-Cardiac or trauma cases. When the Cardiac and trauma ORs are included, Dimensions is proposing to maintain nine of the ten operating rooms that it currently uses.
#521045 24
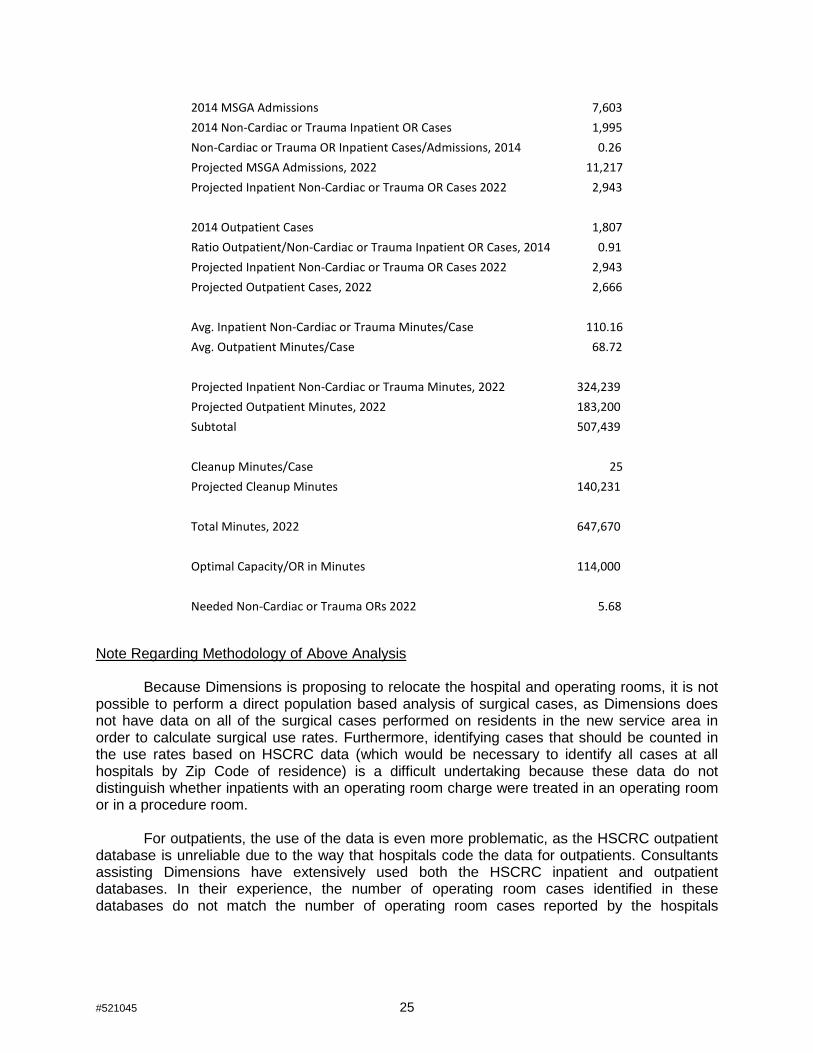
2014 MSGA Admissions
7,603 2014 Non-Cardiac or Trauma Inpatient OR Cases 1,995 Non-Cardiac or Trauma OR Inpatient Cases/Admissions, 2014 0.26 Projected MSGA Admissions, 2022 11,217 Projected Inpatient Non-Cardiac or Trauma OR Cases 2022 2,943
2014 Outpatient Cases
1,807 Ratio Outpatient/Non-Cardiac or Trauma Inpatient OR Cases, 2014 0.91 Projected Inpatient Non-Cardiac or Trauma OR Cases 2022 2,943 Projected Outpatient Cases, 2022 2,666
Avg. Inpatient Non-Cardiac or Trauma Minutes/Case 110.16 Avg. Outpatient Minutes/Case
68.72
Projected Inpatient Non-Cardiac or Trauma Minutes, 2022 324,239 Projected Outpatient Minutes, 2022 183,200 Subtotal
507,439
Cleanup Minutes/Case
25 Projected Cleanup Minutes
140,231
Total Minutes, 2022
647,670
Optimal Capacity/OR in Minutes 114,000
Needed Non-Cardiac or Trauma ORs 2022 5.68 Note Regarding Methodology of Above Analysis
Because Dimensions is proposing to relocate the hospital and operating rooms, it is not possible to perform a direct population based analysis of surgical cases, as Dimensions does not have data on all of the surgical cases performed on residents in the new service area in order to calculate surgical use rates. Furthermore, identifying cases that should be counted in the use rates based on HSCRC data (which would be necessary to identify all cases at all hospitals by Zip Code of residence) is a difficult undertaking because these data do not distinguish whether inpatients with an operating room charge were treated in an operating room or in a procedure room.
For outpatients, the use of the data is even more problematic, as the HSCRC outpatient database is unreliable due to the way that hospitals code the data for outpatients. Consultants assisting Dimensions have extensively used both the HSCRC inpatient and outpatient databases. In their experience, the number of operating room cases identified in these databases do not match the number of operating room cases reported by the hospitals
#521045 25
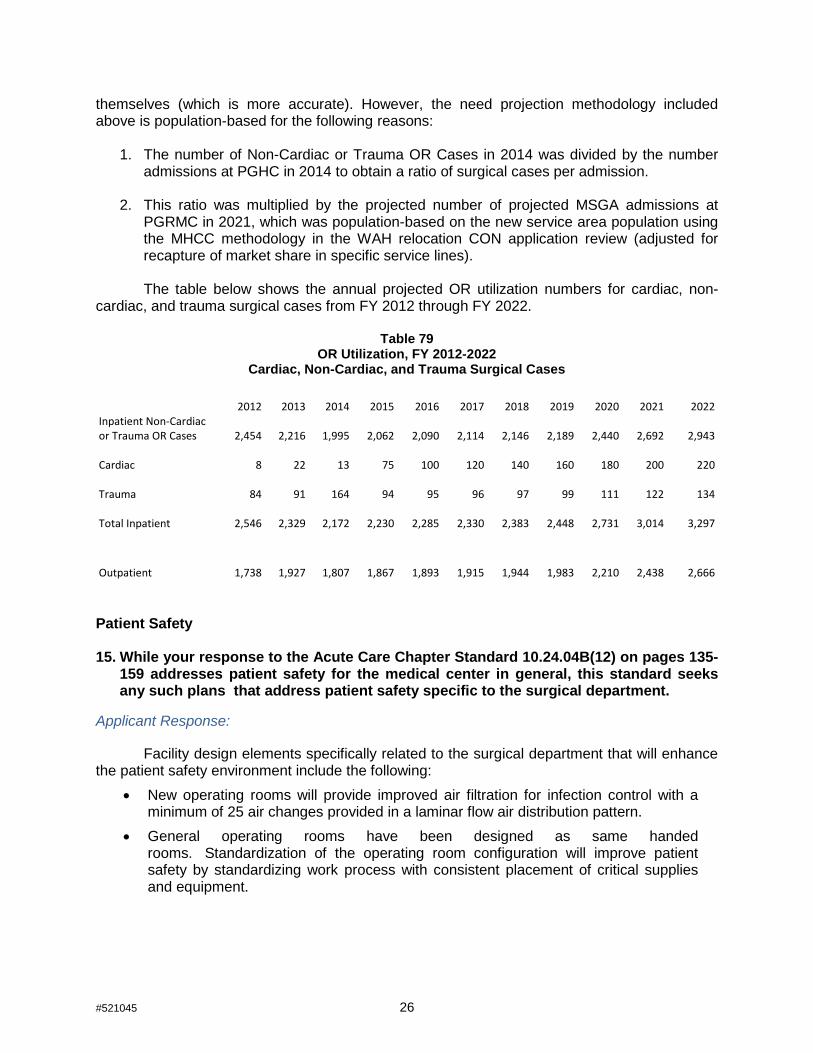
themselves (which is more accurate). However, the need projection methodology included above is population-based for the following reasons:
1. The number of Non-Cardiac or Trauma OR Cases in 2014 was divided by the number admissions at PGHC in 2014 to obtain a ratio of surgical cases per admission.
2. This ratio was multiplied by the projected number of projected MSGA admissions at PGRMC in 2021, which was population-based on the new service area population using the MHCC methodology in the WAH relocation CON application review (adjusted for recapture of market share in specific service lines).
The table below shows the annual projected OR utilization numbers for cardiac, non-
cardiac, and trauma surgical cases from FY 2012 through FY 2022.
Table 79 OR Utilization, FY 2012-2022
Cardiac, Non-Cardiac, and Trauma Surgical Cases
2012 2013 2014 2015 2016 2017 2018 2019 2020 2021 2022
Inpatient Non-Cardiac or Trauma OR Cases
2,454
2,216
1,995
2,062
2,090
2,114
2,146
2,189
2,440
2,692
2,943
Cardiac 8 22 13
75
100
120
140
160
180
200
220
Trauma 84 91 164
94
95
96
97
99
111
122
134
Total Inpatient 2,546
2,329
2,172
2,230
2,285
2,330
2,383
2,448
2,731
3,014
3,297
Outpatient
1,738
1,927
1,807
1,867
1,893
1,915
1,944
1,983
2,210
2,438
2,666
Patient Safety 15. While your response to the Acute Care Chapter Standard 10.24.04B(12) on pages 135-
159 addresses patient safety for the medical center in general, this standard seeks any such plans that address patient safety specific to the surgical department.
Applicant Response:
Facility design elements specifically related to the surgical department that will enhance the patient safety environment include the following:
• New operating rooms will provide improved air filtration for infection control with a minimum of 25 air changes provided in a laminar flow air distribution pattern.
• General operating rooms have been designed as same handed rooms. Standardization of the operating room configuration will improve patient safety by standardizing work process with consistent placement of critical supplies and equipment.
#521045 26

• Durable monolithic flooring with integral base will improve patient safety by eliminating the opportunities for contamination with damaged or degraded surfaces experienced with traditional sheet flooring alternatives
• Reducing Communication Errors – Communication failures have been identified as a cause of wrong-site surgeries. By maintaining visual connections among staff work areas the proposed design will promote communication.
• Implementing the current recommendations of the FGI Guidelines for Healthcare Construction and using inherently antimicrobial surfaces where appropriate, will limit Ambulatory Surgery Center acquired infections and improve patient safety.
• Integrating Computerized Physician Order Entry technology in the patient care process will improve patient safety by reducing opportunities for medication errors.
COMAR 10.24.17 CARDIAC SURGERY standards 16. COMAR 30.08.05.09 lists cardiac surgery as a desirable service for a Level II trauma
center, not an essential one. Given that the existence of a Level II Trauma Center is one of the key justifications for the presence of a cardiac surgery program at PGRMC, please:
a) Provide a three-year history of the number of trauma patients requiring cardiac surgery
b) Describe what the alternative approach would be for trauma patients who did
require this capability if it were not available at PGRMC. Applicant Response:
An analysis was completed using HSCRC inpatient data for fiscal years 2012, 2013, and 2014 for PGHC. Patient discharges that were flagged as “trauma patients” were identified and studied. An analysis was performed to identify how many “trauma flagged” patients received some kind of cardiac/thoracic procedure as well as how many patients had some type of cardiovascular procedure (including cardio-thoracic procedures). Specifically, the ICD-9 Procedure Codes that were used for cardio-thoracic procedures include the following codes:
35.00 - 35.99 36.03 - 36.99 37.0 - 37.99 38.04 38.05 38.14 38.15 38.35 38.45 38.64 38.65 38.84 38.85
39.61 39.62 39.63 39.64 39.66
#521045 27

The following table gives a summary of trauma inpatient cases of which patients had some kind of cardio-thoracic or cardiovascular surgical/interventional procedure.
Table 80
Prince George’s Hospital Center Historical Trauma Cases with Cardio-Thoracic Procedures and Cardiovascular Procedures
2012-2014
Results from the study show that approximately 18% of trauma patients will require some form of cardiovascular procedure, whereas approximately 2% will require some form of cardio-thoracic procedure. With the exception of one hospital (John’s Hopkins Bayview Medical Center), all Level 1 and 2 trauma centers in Maryland have cardiac surgery programs. In order to attract and retain cardiovascular surgeons, a hospital must have opportunities for surgeons to practice beyond that of serving trauma patients. Cardiovascular surgeons are trained to perform vascular cases including open-heart procedures. Having a cardiac surgery program assists the hospital in attracting cardiovascular surgeons for the trauma program. Having cardiovascular surgeons that focus on cardiac procedures adds an important component to the trauma program. Having more clinical expertise available for trauma patients will generally have a positive impact on the “trauma patient save rate” saving lives of critical trauma patients with cardio-thoracic injuries.
Even though the percentage of patients requiring a cardio-thoracic intervention is small,
these type of injuries are generally time-sensitive, requiring immediate intervention. Patient transfers may not be in the best interest of patient care and patient outcomes. Because of the severity of the illness of these specific patients, PGHC’s medical staff leadership feels it cannot have a trauma program without the support of cardio-thoracic service and be able to maintain the current Level II Trauma Center status. A trauma program is a clinical service that requires significant support resources in multiple clinical areas in order to be successful in achieving desired patient outcomes. Thus, it is clinically important for PGRMC to have elective clinical practice opportunities beyond trauma patients to maintain a strong and stable clinical staff for a trauma program. 17. The application failed to provide a response to an earlier completeness question,
which was:
As an existing cardiac surgery program, PGHC should be reviewing morbidity and mortality rates and other indicators of patient outcomes, and compliance with established processes of care as compared with regional or national averages
#521045 28
[See COMAR 10.24. 17.06B(2)(e)]. Please describe PGHC's history of participation in the Society for Thoracic Surgeons (STS) cardiac surgery registry during the last five years and provide the STS Coronary Artery Bypass Graft Composite Scores reported by STS for the PGHC cardiac surgery program for any reporting period during the last five years. Please identify the reporting period for each reported composite score.
The response (on page 200 of the modified application) does not directly answer that question, and instead speaks to the current quality assurance program that is in place for cardiac surgery. It also stated:
PGHC completed an agreement with the Society of Thoracic Surgeons (“STS”) in May 2014 and also contracted with AXIS, an approved STS software vendor. A STS data coordinator was hired and software / AXIS training was recently completed. In addition, the data coordinator has participated in several data manager training seminars and received one-on-one training from the UMMC STS data manager. In accordance with the regulatory changes in the State Health Plan, data has been collected on all cases since July 2014. The first submission of outcomes data will be submitted in February, 2015, allowing for a sufficient number of cases to be harvested and reported on.
MHCC staff infers from this response that the request for PGHC’s history of participation with the STS is moot (as apparently there is no such history) as is the request for composite scores reported by STS for the PGHC cardiac surgery program. Therefore, in lieu of providing the answers initially requested, please submit the outcomes data referenced in the application as being available in February 2015.
Applicant Response:
PGHC provided its submission of outcomes data to AXIS (approved Society of Thoracic Surgeons (STS) software vendor used to harvest data) on February 27, 2015 for the STS Adult Cardiac Surgery Database (ACSD) system. This submission covered cardiac surgery cases performed since the cardiac surgery program was placed under the Medical Director leadership of Dr. Jamie Brown. The submission included cardiac surgery cases performed from July to December 31, 2014. PGHC provided this data set to the Maryland Health Care Commission on February 27, 2015. (b) Need Mount Washington Pediatric Hospital 18. Table 67 on page 208 uses two years of actual admissions data (2013 and 2014) to
calculate an admission rate for MWPH at PGHC. Please provide admission data for 2009 through 2012 and project future admissions based on the average of the last five years and the five year trend. If there is no distinctive trend of increasing or decreasing admission rate, it is only necessary to project future admissions based on the average admission over the period from 2009 through 2014.
#521045 29

Applicant Response:
MWPH has calculated alternate volume assumptions, attached as Exhibit 56. As
requested, the alternate calculation used admissions data going back to 2009. The alternate use rate was calculated using the constant for the rate of increase from 2009 - 2014 in the rate of admissions per population 0-4. The alternate average length of stay was calculated using the 4-year average from 2010 - 2014. ALOS from 2009 was not used as it was an outlier. Using these calculations, at a 65% occupancy rate, 15.6 beds would be needed by 2024. MWPH has modified its Revenue and Expense projections in Tables G2, H2, J and K based on these alternate volume assumptions. See Exhibit 57.
19. Question 19, and Applicant’s response to it, appears above with Question 2. See pages 2-
14.
(d) Viability of the Proposal 20. Please submit revised Tables G1 and H1 with separate estimates and projections of
revenue for inpatient and outpatient services. Applicant Response:
Revised Tables G1 and H1 are attached in Exhibit 50. These tables include an estimated split of the GBR between inpatient and outpatient revenues based on expected changes in inpatient and outpatient utilization. 21. The assumptions include a 49% increase in MSGA discharges from 2020 to 2022.
MHCC staff cannot decipher the derivation of the increase based on discharge and patient day projections as they appear in Table F1 for years 2019 through 2022; staff calculated an increase of 20.5% from 2020 to 2022. MHCC staff also calculated an increase in discharges of 34.5% between 2019 and 2022 (including significant increases from 2019 to 2020). Please submit the calculation of the 49% increase reconciling it with the projections in Table F1.
Applicant Response:
The presentation of a 49% increase was a mistake. The actual projected increase in MSGA discharges from 2019 to 2022 is 34.5%. See the revised assumptions pages that accompany the revised Tables G1 and H1 in Exhibit 50.
In addition, it was determined that the ‘discharges’ presented in fiscal years 2013 and 2014 in Table F1 were actually ‘admissions’ in those years. The presentation of these admissions have been revised to reflect discharges that agree to the HSCRC data tapes with the exception of the ICU/CCU discharges. In order to accurately present the average length of stay associated with those patients, the ‘admissions’ associated with ICU/CCU patients are presented in lieu of ‘discharges’. The General Medical/Surgical discharges are adjusted to ensure that the total MSGA discharges in 2013 and 2014 agree to the HSCRC data tapes. While the total projected MSGA discharges have not changed, the mix of General
#521045 30
Medical/Surgical discharges and ICU/CCU admissions have changed by 16 to 23 cases between the two classifications over the projection period.
As presented in the response to Question 11, the presentation of ED visits have been
corrected and updated in Table F1. As presented in the response to Question 14, the presentation of Same Day Surgery visits in Table F1 have been updated to reflect actual outpatient OR cases in 2013 and 2014, as well as the updated projection through 2022. The updates associated with these changes are presented in a corrected Table F1 that is included in Exhibit 50. 22. Exhibit 1 page 15 includes the assumption that market share volume increases
related to recapture at the new hospital will be recognized immediately in the year of volume growth. Please submit revised Tables G1 and H1 based on the alternate assumption that revenue increases for market share growth occur in the year following the volume growth.
Applicant Response:
Dimensions has met with the HSCRC and discussed the assumption of revenue recognition in the year of volume growth for the new hospital. The HSCRC has also set precedent on this issue. Specifically, the HSCRC approved a request by Holy Cross Germantown Hospital for 100% revenue variability during its first three years of operation. It also approved a market share adjustment for University of Maryland St. Joseph Medical Center after six months of volume growth. Based on conversations with the HSCRC and the precedent set in these cases, Dimensions’ projections assume that the new PGRMC will be able to receive immediate recognition of revenue associated with volume growth.
At the MHCC’s request, however, Dimensions attaches Exhibit 51, which contain Tables
G1 and H1, revised to reflect a one year delay in adjustment. This timing sensitivity presents a $7.6 million adverse impact on the projection of net patient revenue when compared to the projection with revenue recognized in the year of volume growth. This reduction in revenue would result in operating losses each year and likely result in a 3% increase in the requested capital related increase. 23. On page 213, projected depreciation is reported as $25.2 million5, but on Table G1
(Revenues and Expenses un-inflated) it is projected to be $25.9 million for FY 2020. Explain or correct this apparent discrepancy.
Applicant Response:
The $25.2 million projected depreciation reflects strictly the project related capital expenditures. The $714,286 discrepancy is a result of additional depreciation on routine capital expenditures. The $25.9 million presented on Table G1 includes depreciation on both project and routine capital expenditure.
5 Which is presumably for 2022 when interest on project debt is reported to be $11.4 million on page 213 and on Table G1
#521045 31

24. Explain why project interest is reported on Table G1 as $14 million for FY 2020 and $11.4 million for FY 2022, but is reported on Table H1 as $14.4 million for FY 2020 and $12.3 million for FY 2022. If the only reason or one of the reasons is inflation, explain why interest on project debt should be subject to inflation assumptions.
Applicant Response:
The reason inflation has an impact on projected interest expense is related to the assumed Line of Credit. The projected amount of the Line of Credit is based on the need for 100 days of cash operating expenses on hand. With inflation applied to the operating expenses, as presented in Table H1, the required Line of Credit is $76.8 million. Without inflation applied to the operating expenses, as presented in Table G1, the required Line of Credit is $68.2 million. The difference in the Line of Credit drives the change in projected interest expense. 25. One of the expense assumptions for both Tables G1 and H1 is the lease of 60,000
square feet for administration. Given the construction of a new hospital, explain the need and the cost effectiveness of leasing such space. Where is this lease cost accounted for on the tables?
Applicant Response:
The 60,000 square feet will house Dimensions’ corporate offices, which are currently housed at PGHC. Dimensions determined that it would be more cost effective to lease space in lower cost office buildings rather than building out additional space at the new hospital for these corporate offices.
Previously, 100% of the related corporate office lease expense was presented on the
projected financial statements for the new hospital. Upon further review and consideration, Dimensions determined that approximately 67% of the related corporate office lease expense will be allocated to the new hospital. The remaining lease expense will be reflected on the projected financial statements for the other Dimensions entities. The change in allocation of corporate office lease expense is included in the projected Contractual Services expense in the revised Tables G1 and H1, along with the schedules of supporting assumptions, attached in Exhibit 50. 26. With respect to Mount Washington Pediatric Hospital (“MWPH”) projected revenues
and expenses, please provide the following clarifications: a) No statement of and basis for assumptions was submitted for Tables G2, H2, J and K.
Please submit a statement of all assumptions made to project the revenues and expenses on these tables. Also check the tables to insure that Table H2 and K include inflation. And table G2 and J do not. The percentage year to year increases in patient revenue and total operating expenses on G2 and H2 and J and K appear to be the same when the tables with inflation should be higher. Tables G2 and J should reflect changes in revenues and expenses associated with changes in volume but not inflation. Specify the base year for the revenue and costs reflected on these tables.
#521045 32

Applicant Response:
MWPH previously included its statement of assumptions on pages 20 and 28 of Exhibit 1 to the Modified Application. MWPH has modified its assumptions as set forth below. In addition, MWPH has modified Tables H2 and K to accurately show inflation, Exhibit 57. As noted in assumptions, the base year is 2014.
MWPH at PGHC Volume Assumptions used in Revenue and Expense Projections 1. Inpatient volume assumptions are based on use rate: the number of admissions per
projected Maryland population aged 0-4.
2. Use rate for FY 2015 - FY 2024 uses the rates from 2009-2014.
3. The use rate was calculated using the constant for the rate of increase from 2009 - 2014 in the rate of admissions per population 0-4.
4. The average length of stay was calculated using the 4-year average from 2010 - 2014. ALOS from 2009 was not used as it was an outlier.
5. Using these calculations, at a 65% occupancy rate, 15.6 beds would be needed by 2024.
6. Outpatient volumes assumptions are based on current demand. Rehabilitation and psychology are projected to double with the availability of new space; clinic volumes are projected to remain stable.
7. The base year for revenue and costs was Fiscal Year 2014.
MWPH at Rogers Volume Assumptions 1. Inpatient volume assumptions are based on use rate: the number of admissions per
projected Maryland population aged 0-4.
2. Use rate for FY 2015 is based on actual for FY 2014. Use rate was lower in FY 2012 and FY 2013 due to renovations to largest patient unit. FY 2014 is first year with completed unit with greater capacity.
3. Use rate for FY 2015 - FY 2021 reflects this same higher use rate as in FY 2014, due to increased capacity and waiver model that encourages admissions to post-acute settings.
4. Average length of stay for FY 2015 is average of past five years.
5. Average length of stay for FY 2016 - FY 2023 grows at .25 days per year. Increase is expected due to new waiver with population health model, encouraging hospitals to move patients more quickly to lower-cost settings.
6. Outpatient volumes are projected to grow by 3% per year, consistent with current trends.
7. The base year for revenue and costs was Fiscal Year 2014.
b) On page 213 it states that since MWPH is in leased space and not responsible for any
debt, this project will not impact charges. It also states that rent will increase as reflected in Tables G2 and H2. Wouldn’t it also be reflected in Table J? How much is the expected rent increase? Which line of the tables reflects this increase? Explain why the rent increase will not impact charges.
#521045 33
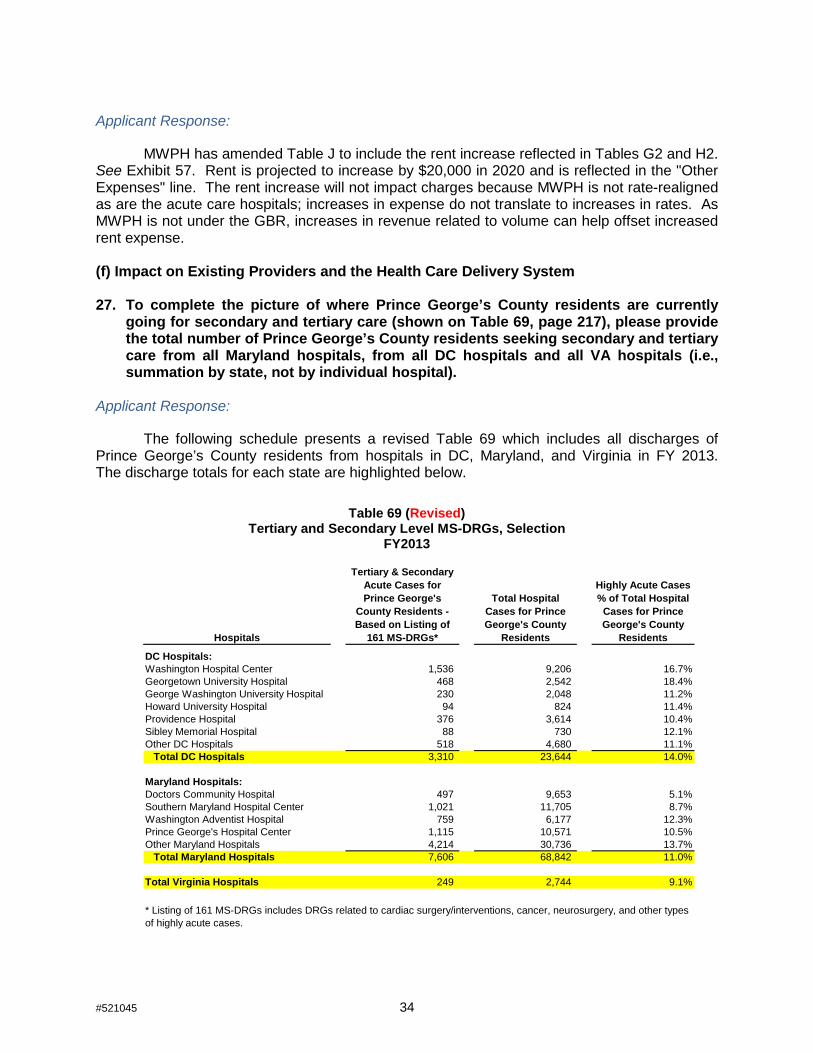
Applicant Response:
MWPH has amended Table J to include the rent increase reflected in Tables G2 and H2. See Exhibit 57. Rent is projected to increase by $20,000 in 2020 and is reflected in the "Other Expenses" line. The rent increase will not impact charges because MWPH is not rate-realigned as are the acute care hospitals; increases in expense do not translate to increases in rates. As MWPH is not under the GBR, increases in revenue related to volume can help offset increased rent expense. (f) Impact on Existing Providers and the Health Care Delivery System 27. To complete the picture of where Prince George’s County residents are currently
going for secondary and tertiary care (shown on Table 69, page 217), please provide the total number of Prince George’s County residents seeking secondary and tertiary care from all Maryland hospitals, from all DC hospitals and all VA hospitals (i.e., summation by state, not by individual hospital).
Applicant Response:
The following schedule presents a revised Table 69 which includes all discharges of Prince George’s County residents from hospitals in DC, Maryland, and Virginia in FY 2013. The discharge totals for each state are highlighted below.
Table 69 (Revised)
Tertiary and Secondary Level MS-DRGs, Selection FY2013
Hospitals
Tertiary & Secondary Acute Cases for Prince George's
County Residents - Based on Listing of
161 MS-DRGs*
Total Hospital Cases for Prince George's County
Residents
Highly Acute Cases % of Total Hospital
Cases for Prince George's County
Residents
DC Hospitals:Washington Hospital Center 1,536 9,206 16.7%Georgetown University Hospital 468 2,542 18.4%George Washington University Hospital 230 2,048 11.2%Howard University Hospital 94 824 11.4%Providence Hospital 376 3,614 10.4%Sibley Memorial Hospital 88 730 12.1%Other DC Hospitals 518 4,680 11.1% Total DC Hospitals 3,310 23,644 14.0%
Maryland Hospitals:Doctors Community Hospital 497 9,653 5.1%Southern Maryland Hospital Center 1,021 11,705 8.7%Washington Adventist Hospital 759 6,177 12.3%Prince George's Hospital Center 1,115 10,571 10.5%Other Maryland Hospitals 4,214 30,736 13.7% Total Maryland Hospitals 7,606 68,842 11.0%
Total Virginia Hospitals 249 2,744 9.1%
* Listing of 161 MS-DRGs includes DRGs related to cardiac surgery/interventions, cancer, neurosurgery, and other types of highly acute cases.
#521045 34

28. Please provide the quantitative basis for the allocation of the discharges expected to
be recaptured as shown in Table 70 (32% of the MSGA discharges from Maryland and 68% from out-of-state.
Applicant Response:
In support of the allocation of discharges set forth in Table 70, Dimensions described the rationale of market recapture origin projected for the PGRMC facility in the modified application (see pages 215-225). Market recapture information specific to service lines is set forth on pages 71-80. FY2013 market data is annualized based on full fiscal year data of Maryland and Virginia hospitals and six month actual fiscal year data annualized of Washington DC hospital inpatient data. This response compiles and supplements previous information provided to demonstrate further the basis of the recapture allocation between Maryland and non-Maryland hospitals. However, the market analysis is also based on qualitative analysis including the UM SPH Study and physician interviews.
I. Project Vision & Objective: The objective of the new hospital is to be a regional medical center for all of Prince
George’s County and the Southern Maryland region, with a focus on providing and growing tertiary and secondary specialty care in trauma, cardiovascular, neonatal, cancer, obstetrics, orthopedics, other subspecialty medical and surgical services. PGRMC is one component of a new health system supported by a stronger primary care, specialty care, and ambulatory care network.
An important business goal for PGRMC is to target and attract residents who are currently utilizing hospital services in D.C. and Virginia. Approximately 2/3 of the incremental volume growth from market share recapture is projected to come from D.C. and Virginia hospitals with a focus on capturing volumes related to service lines of cardiovascular, cancer, neurosurgery, and medical/surgical subspecialty care. Much of this will be driven by strengthening the access of primary care providers and other specialty physicians within regions of the County where access is limited or non-existent, making it necessary for many Prince George’s County residents to obtain healthcare from non-Maryland located providers. An affiliation with UMMS and partnerships with University Maryland Baltimore campus will provide resources to attract and retain healthcare providers that have been historically challenging to place within Prince George’s County.
II. Service Line Analysis & Overall Recapture Assumptions: With a baseline of projected PGRMC discharges established for the PGRMC service
area, Dimensions considered the initiatives and growth areas anticipated for the new hospital.
• Dimensions analyzed PGHC data by service line back to 2001 to determine historical trends and potential for reasonable market share recapture.
• Dimensions concluded that there were significant growth opportunities in the cardiac, vascular, oncology, orthopedics, and other specialty service lines.
• These conclusions were based on interviews with physicians, recruitment plans, and new clinics and programs.
• Service line market share increases related to clinical program development will be supported by the recruitment of needed specialists into the region.
#521045 35

• Dimensions is currently working with the University of Maryland School of Medicine (“UMSOM”) to assist with some of these physician specialty needs. For example, Dimensions now contracts with UMSOM to provide emergency medicine specialists to staff its emergency departments at PGHC, Laurel Regional, and at the Bowie Emergency Medical Center. It also has a contractual relationship for the provision of orthopedic and cardio-thoracic surgeons.
Cardiovascular Program Initiatives
To increase its market share for cardiovascular services, Dimensions’ Cardiovascular Program Strategic Business Plan sets forth multi-year business objectives for operational and infrastructure enhancements, developing the cardiovascular service line into a leading regional clinical program, supported by resources from UMMS and UMSOM. Initiatives that have been completed or are underway include:
• replacement or improvement of capital equipment; • expansion and development of clinical and strategic leadership; • contracting with UMSOM for UMSOM-affiliated cardio-thoracic surgeons to revitalize
the cardiac surgery and vascular surgery program; • developing clinical protocols and staff education, supported by the University of
Maryland Medical Center; and • development of a detailed outreach plan in the community including plans to open an
ambulatory cardiac clinic to help improve local access to cardio-thoracic specialists.
Population Health Management Initiatives
As part of its strategic focus, Dimensions is emphasizing the development / expansion of primary care / ambulatory resources within its service area to improve access and develop population health management initiatives. In conjunction with Prince George’s County, Dimensions will dedicate resources to:
• Recruit new specialists to Prince George’s County, addressing the issues of lack of access to specialists and the aging physician workforce within some specialties.
• Coordinate / enhance services at Laurel Regional Hospital and Bowie Health Campus to develop an efficient and effective healthcare delivery system among the existing facilities.
• Dedicate resources to improve access to primary/community care by: o developing new primary care/community care sites; o recruiting new primary care physicians, mid-level providers, and other
community health providers, especially to those regions within the County that show a high need for such care, causing residents to seek care into Washington D.C., and
o working collaboratively with existing primary care providers to expand primary care/community care resources (Federally Qualified Community Health Centers, Health Department, as well as other community practitioners)
• Operate a disease management program for three chronic disease populations through a combination of specialty department resources, centralized shared resources at the System level, and community-based resources provided through working partnerships.
• Expand ambulatory care configuration and diagnostic services at existing Dimensions facilities to expand service to locations at Cheverly (Gladys Spellman facility), Suitland (Health & Wellness Center) and Capitol Heights.
#521045 36

• Create strategic quality “Alliance” through use of EMR with community providers. • Develop MSO services to support community providers. • Complete gain-sharing models that will focus on selected clinical pathways.
To improve quality care and attract patients back into Prince George’s County,
Dimensions has plans to work in partnership with the University System of Maryland (“USM”) to improve access to primary and community care and ambulatory services in the region by USM:
• Establishing a research institute to drive the new healthcare delivery system (including PGRMC) to become a “learning healthcare system” defined by the Institute of Medicine in its publication, “Best Care At Lower Cost.”
• Create a proposal for inter-professional healthcare education and training in Prince George’s County and Southern Maryland
• Create a proposal to design inter-professional healthcare service delivery to support the existing and new healthcare providers in Prince George’s County and Southern Maryland
PGRMC Inpatient Market Size & Service Line Market Share Projections
Table 21 (page 76 of the Modified Application) projects the market size of PGRMC’s service area by service line for the year 2022.
Based on market analysis, Table 22 (pages 76-78 of the Modified Application) illustrates expected market share by service line.
Applying the PGRMC FY2022 market shares by service line to total discharges for the PGRMC service area, Table 23 (page 79 of the Modified Application) illustrates projected PGRMC FY2022 discharges.
Table 24 (page 80 of the Modified Application) illustrates the recaptured discharges by service line based on expected market share.
III. Market Analysis Specific To Market Recapture From Non-Maryland Hospitals:
The Public Health Impact Study, as well as patient utilization characteristics, help support and make conclusions of incremental growth projections from non-Maryland hospitals. Community feedback from the Public Health Impact Study demonstrated that residents will return to Prince George’s County to use an academically-affiliated new hospital facility under the following health planning scenario:
• The new hospital demonstrates high quality care and is academically affiliated;
• Increased access to clinicians (primary care and specialty care);
• New hospital needs to provide services at reasonable costs to be an in-network provider among insurance companies.
UM SPH survey results indicated that 55.1% of those surveyed were very likely to use a new state-of-the-art hospital facility, while 37.1% reported they would likely use the new facility. Inpatient data indicates that residents within PGHC’s primary and secondary service area are trending coming back to the County for hospital care.
#521045 37
• FY 2001: Approximately 32.5% inpatient discharges of PGHC’s PSA/SSA residents were from D.C. and Virginia hospitals.
• FY 2008: Approximately 28.0% inpatient discharges of PGHC’s PSA/SSA residents were from D.C. and Virginia hospitals.
• FY 2012: Approximately 26.6% inpatient discharges of PGHC’s PSA/SSA residents were from D.C. and Virginia hospitals.
In FY2012, Prince George’s County residents represented approximately 97,809 inpatient discharges. Of those, approximately 26,125 (or 26.7%) of discharges came from D.C. and Virginia hospitals. PGRMC’s volume projections present a market share recapture of approximately 3,282 discharges by the year 2022. Of that, approximately 2/3 or 2,210 of those discharges are targeted to come from D.C. and Virginia hospitals. This represents a market share decline of only 2.2 percentile points (26.7% to 24.5%) for D.C. and Virginia hospitals combined of the Prince George’s County market.
The rationale supporting 2/3 of market share recapture coming from D.C./Virginia hospitals includes the following:
• An important business objective of Dimensions at PGRMC is to focus more on higher-acuity specialty care.
• Significant D.C. / Virginia hospital volume within the top 10 Maryland Zip Codes of PGHC, where approximately 30% of all discharges from these 10 Zip Codes come from D.C. / Virginia hospitals.
Table 69 (page 217 of the Modified Application) represents a selection of tertiary and secondary level MS-DRGs to illustrate that WHC, GTUH, and GWUH have a higher percentage of tertiary/secondary level of discharges than community hospitals, which are the type of patients the PGRMC will be targeting. This supports the assumption that a higher percentage of recaptured cases will come from Washington D.C. hospitals because of the intended focus on specialty services. Note that this table does not represent all inpatient discharges within the projected PGRMC service area.
The rationale supporting an estimate of 2/3 of market share recapture coming from D.C./Virginia hospitals also considers:
• PGHC’s Emergency Department transfers of patients to be admitted to other facilities for higher level of care indicate that there is a strong preference among physicians/patients toward Washington Hospital Center for adult care. Presumably, patients presenting to physician offices in need of hospital care have similar preferences. Other hospitals with volume of note include University of Maryland Medical Center and Holy Cross Hospital.
• The recruitment of subspecialty physicians to increase access of such specialty services within Prince George’s County will prevent patients from having to travel to Washington D.C. for subspecialty care.
• Physicians on staff prefer to have patients taken care of locally rather than going to out-of-area hospitals:
- Physicians wish to stay connected with their patients;
- Physicians prefer to refer to local specialists so they can receive real-time information regarding referred patients;
#521045 38

- Patients / families prefer treatment locally rather than traveling if local access to specialists exists.
Additional market analysis points which led to the percentage allocations of Table 70 include the following:
Obstetrics:
Based on FY2012 and 2013 discharge data, non-Maryland hospitals represented approximately 22% of the Obstetrical service line (approximately 2,400-2,500 discharges out of approximately 11,200-11,300 within PGRMC’s service area). Dimensions (PGHC and Laurel Regional) experiences a market share of approximately 23%. Therefore other Maryland hospitals represent approximately 55% of the market. Dimensions believes that Holy Cross Hospital, Anne Arundel Medical Center, and Washington Adventist Hospital have strong obstetrical programs representing approximately 30% of the total market and that PGRMC would achieve minimal market gains from these three hospitals.
Through recruitment of additional obstetricians in specific areas of need, Dimensions believes it can achieve a market share of approximately 19% within the PGRMC service area. In achieving its targeted market share, Dimensions believe that 60% of the case recapture is going to come from non-Maryland hospitals based upon competitive analysis of existing obstetrical programs and placement of new community providers. Therefore Dimensions is projecting a total market recapture of 294 Obstetrical cases, of which 118 cases come from Maryland hospitals and 176 from out-of-state hospitals.
Psychiatry:
Dimensions is not forecasting an increase in market share of acute adult psychiatric services for PGRMC. Dimensions reviewed the inpatient cases and market share of Washington D.C. and Virginia hospitals and concluded there was minimal recapture opportunity within this service line. Washington D.C. and Virginia hospitals have a significantly smaller market share in psychiatric service line (approximately 10%), in comparison to medical/surgical specialty services. Therefore, no recapture assumptions were made for inpatient psychiatric services from either Maryland hospitals or Washington D.C. / Virginia hospitals.
MSGA:
To summarize, Table 21 (page 76 of the Modified Application) illustrates the projected MSGA discharges for the PGRMC service area in FY2022. Table 22 (pages 76-78 of the Modified Application) illustrates the projected market share gains by service line. Table 24 (page 80 of the Modified Application) shows the incremental recaptured cases by service line. Table 81 below illustrates the breakdown of projected cases by service line that are projected to be recaptured from Maryland hospitals and non-Maryland hospitals. Table 81 is based on market information including current market positions of hospital providers.
#521045 39

Table 81 Projected PGRMC Recaptured Discharges, by Service Line
FY 2022
Data compiled from HSCRC inpatient database (FY 2013), Virginia Hospital database (FY 2013) and Washington DC hospital inpatient database 6 month actual FY 2013 data annualized.
Table 70 (page 218 of the Modified Application) was developed from the service line and service area market analysis, and summarizes PGRMC’s market recapture from Maryland and non-Maryland hospital categories:
Service LineRecaptured Discharges Out of State MD Total Out of State MD Total
Burn 2 0% 100% 100% 0 2 2Dental/Oral 12 0% 100% 100% 0 12 12Cardiac Arrhythmia 70 75% 25% 100% 53 18 70Cardiac Surgery 147 80% 20% 100% 118 29 147Cardiology 224 50% 50% 100% 112 112 224Interventional Cardiology 146 66% 34% 100% 96 50 146Vascular 83 66% 34% 100% 55 28 83Vascular Surgery 134 75% 25% 100% 101 34 134Gastroenterology 124 66% 34% 100% 82 42 124Gynecology 60 66% 34% 100% 40 20 60HIV 20 66% 34% 100% 13 7 20Medical Oncology/Hematology 330 80% 20% 100% 264 66 330Medicine 241 80% 20% 100% 193 48 241Nephrology 75 80% 20% 100% 60 15 75Neurology 239 66% 34% 100% 158 81 239Neurosurgery 36 75% 25% 100% 27 9 36Ophthalmology 14 50% 50% 100% 7 7 14Orthopedics 386 66% 34% 100% 255 131 386Otolaryngology 20 66% 34% 100% 13 7 20Rehab 0 0% 100% 100% 0 0 0Pulmonary Medicine 179 66% 34% 100% 118 61 179Spine-Back/Neck Procedures 57 66% 34% 100% 38 19 57Substance Abuse 19 0% 100% 100% 0 19 19Surgery 211 70% 30% 100% 148 63 211Transplant 0 80% 20% 100% 0 0 0Trauma 42 20% 80% 100% 8 34 42Urology 117 66% 34% 100% 77 40 117
Subtotal - MSGA 2,988 68% 32% 100% 2,034 954 2,988
Obstetrics 294 60% 40% 100% 176 118 294Psychiatry -
Total 3,282 67% 33% 100% 2,210 1,072 3,282
Allocation
#521045 40

Table 70 (from Modified Application) Market Share Recapture
Table 73 (page 219 of the Modified Application) illustrates the split of recaptured cases by service line for Maryland and non-Maryland hospital groupings.
Table 73 (from Modified Application) MSGA Discharges, by Service Line
Note that Table 73 shows the recapture of 2,034 patients who previously were being discharged from Washington D.C. and Virginia hospitals. Adding the 176 recaptured obstetrical patients (from Table 70) results in the total of 2,210 patients being projected to be recaptured from Washington D.C. and Virginia hospitals by FY2022.
Table 77 (page 225 of the Modified Application) shows a summary of the impact that PGRMC’s market share recapture of 3,282 discharges is expected to have on other hospitals:
Out of State MD Total Out of State MD TotalMSGA Adult / Pediatric Discharges 2,988 68% 32% 100% 2,034 954 2,988
Obstetrics 294 60% 40% 100% 176 118 294
Psychiatry - 50% 50% 100% - - -
Total 3,282 67% 33% 100% 2,210 1,072 3,282
Market Share Recapture Discharges
Allocation of Recaptured Discharges Discharge Recapture
MSGA 75+
MSGA 65-74
MSGA 15-64 PEDS Total
MSGA 75+
MSGA 65-74
MSGA 15-64 PEDS Total
Burn - - - - - 0 0 1 0 2 Dental / Oral - - - - - 3 3 7 0 12 Cardiac Arrhythmia 12 12 28 0 52 4 4 9 0 17 Cardiac Surgery 27 26 64 0 118 7 7 16 0 29 Cardiology 26 25 61 0 112 26 25 61 0 112 Interventional Cardiology 22 21 52 0 96 12 11 27 0 50 Vascular 13 12 30 0 55 7 6 15 0 28 Vascular Surgery 23 22 54 0 100 8 7 18 0 33 Gastroenterology 19 18 44 0 82 10 9 23 0 42 Gynecology 9 9 21 0 40 5 5 11 0 20 HIV 3 3 7 0 13 2 1 4 0 7 Medical Oncology/ Hematology 62 59 144 1 265 15 15 36 0 66 Medicine 45 43 104 1 192 11 11 26 0 48 Nephrology 14 13 32 0 60 3 3 8 0 15 Neurology 37 35 85 0 158 19 18 44 0 81 Neuro Surgery 6 6 15 0 27 2 2 5 0 9 Ophthalmology 2 2 4 0 7 2 2 4 0 7 Orthopedics 59 57 138 1 255 31 29 71 0 132 Otolaryngology 3 3 7 0 13 2 1 4 0 7 Respiratory 28 26 64 0 118 14 14 33 0 61 Spine-Back/Neck Procedures 9 8 20 0 37 4 4 10 0 19 Substance Abuse - - - - - 4 4 10 0 19 Surgery 34 33 80 0 147 15 14 34 0 63 Transplant 0 0 0 0 0 0 0 0 0 0 Trauma 2 2 5 0 8 8 8 18 0 34 Urology 18 17 42 0 77 9 9 21 0 40 Total 474 452 1,102 6 2,034 222 212 517 3 954
23.3% 22.2% 54.2% 0.3% 100.0% 23.3% 22.2% 54.2% 0.3% 100.0%
Out of State Recapture Allocation by Cohort Maryland Recapture Allocation by Cohort
#521045 41

Table 77 (from Modified Application) PGRMC Market Share Recapture Impact on Other Hospitals
2022
29. On pages 218 through 223 the application material demonstrates how discharges
that are expected to be recaptured are distributed for the impact analysis. This appears to be based on the allocation of the recaptured discharges by age set forth in Table 70 and the projected distribution of discharges to the expected Largo service area by age. It is not clear how the projected recaptured discharges from in-state and from out-of state were allocated to each zip code area as shown on pages 220 through 223 for the population 15-64. Please explain and demonstrate how this allocation was done.
Applicant Response:
Projected recaptured discharges were allocated based on a given zip code’s pro-rata share of FY 2013 in-state or out-of state hospital discharges. As presented in Table 74 on page 220 of the Modified Application, the FY 2013 MSGA 15-64 discharges related to zip code 20721 from Maryland hospitals were 667 of the total 28,641 discharges from Maryland hospitals for residents in the PGRMC service area for that cohort. Therefore, zip code 20721 represented 2.3% of the service area discharges within the cohort. Applying this 2.3% to the 517 projected recaptured discharges from Maryland hospitals results in 12 of those MSGA 15-64 discharges projected to be recaptured within zip code 20721. The same logic was used when determining the allocation of recaptured discharges from out-of state hospitals, except a given zip code’s pro-rata share of out-of state hospital discharges was used instead of Maryland hospital discharges. 30. On page 219 it states that “with the projection of recaptured discharges split
between In and Out of State, the impact was allocated to other hospitals based on their FY 2013 proximity adjusted market share by zip code within each cohort.” However the example shows that for zip code area 20743, PGRMC is expected to recapture 28 discharges and that 12 of these are expected to come from Doctors
HospitalChange in Discharges 2013 Discharges Hospital
Change in Discharges 2013 Discharges
Southern Maryland Hospital Center (234) 12,127 Washington Hospital Center (1,017) 8,642 Doctor's Community Hospital (224) 9,552 Georgetown University Hospital (295) 2,684 Holy Cross Hospital (114) 5,535 George Washington University Hospital (199) 1,896 Anne Arundel Medical Center (87) 4,335 Providence Hospital (198) 1,786 Washington Adventist Hospital (70) 3,509 Children's National Medical Center (61) 3,506 Laurel Regional Hospital (58) 3,326 Other DC Hospitals (178) 1,774 Fort Washington Medical Center (37) 1,784 Recapture Impact on DC Hospitals (1,947) Johns Hopkins Hospital (28) 1,503 University of Maryland Medical Center (23) 1,117 Inova Fairfax Hospital (61) 639 Suburban Hospital (16) 762 Inova Alexandria Hospital (61) 604 Howard County General Hospital (13) 701 Virginia Hospital Center - Arlington (56) 541 Shady Grove Hospital (6) 311 Inova Mount Vernon Hospital (38) 315 Montgomery General Hospital (3) 185 Inova Fair Oaks Hospital (9) 81 Other MD Hospitals (159) Other VA Hospitals (38) 358
Recapture Impact on MD Hospitals (1,072) Recapture Impact on VA Hospitals (263)
Total Impact on Non-MD Hospitals (2,210)
Estimated Impact on Maryland Hospital Discharges Estimated Impact on Non-Maryland Hospital Discharges
#521045 42
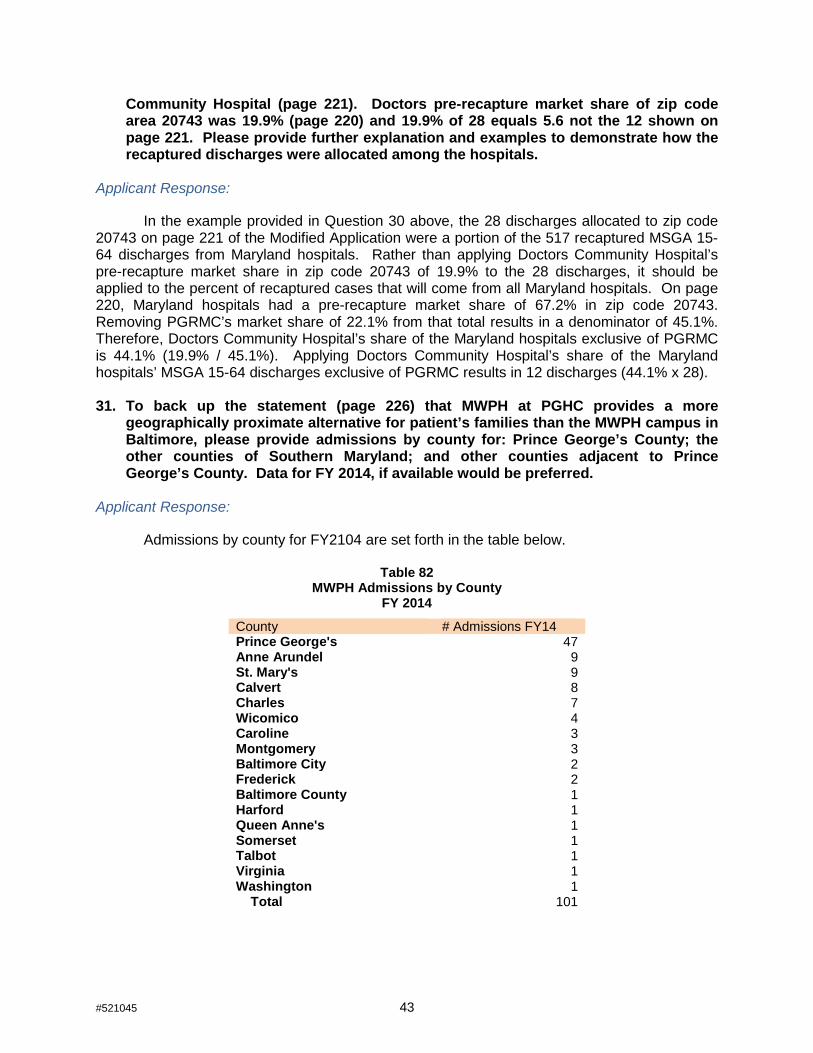
Community Hospital (page 221). Doctors pre-recapture market share of zip code area 20743 was 19.9% (page 220) and 19.9% of 28 equals 5.6 not the 12 shown on page 221. Please provide further explanation and examples to demonstrate how the recaptured discharges were allocated among the hospitals.
Applicant Response:
In the example provided in Question 30 above, the 28 discharges allocated to zip code 20743 on page 221 of the Modified Application were a portion of the 517 recaptured MSGA 15-64 discharges from Maryland hospitals. Rather than applying Doctors Community Hospital’s pre-recapture market share in zip code 20743 of 19.9% to the 28 discharges, it should be applied to the percent of recaptured cases that will come from all Maryland hospitals. On page 220, Maryland hospitals had a pre-recapture market share of 67.2% in zip code 20743. Removing PGRMC’s market share of 22.1% from that total results in a denominator of 45.1%. Therefore, Doctors Community Hospital’s share of the Maryland hospitals exclusive of PGRMC is 44.1% (19.9% / 45.1%). Applying Doctors Community Hospital’s share of the Maryland hospitals’ MSGA 15-64 discharges exclusive of PGRMC results in 12 discharges (44.1% x 28). 31. To back up the statement (page 226) that MWPH at PGHC provides a more
geographically proximate alternative for patient’s families than the MWPH campus in Baltimore, please provide admissions by county for: Prince George’s County; the other counties of Southern Maryland; and other counties adjacent to Prince George’s County. Data for FY 2014, if available would be preferred.
Applicant Response:
Admissions by county for FY2104 are set forth in the table below.
Table 82 MWPH Admissions by County
FY 2014
County # Admissions FY14 Prince George's 47 Anne Arundel 9 St. Mary's 9 Calvert 8 Charles 7 Wicomico 4 Caroline 3 Montgomery 3 Baltimore City 2 Frederick 2 Baltimore County 1 Harford 1 Queen Anne's 1 Somerset 1 Talbot 1 Virginia 1 Washington 1 Total 101
#521045 43
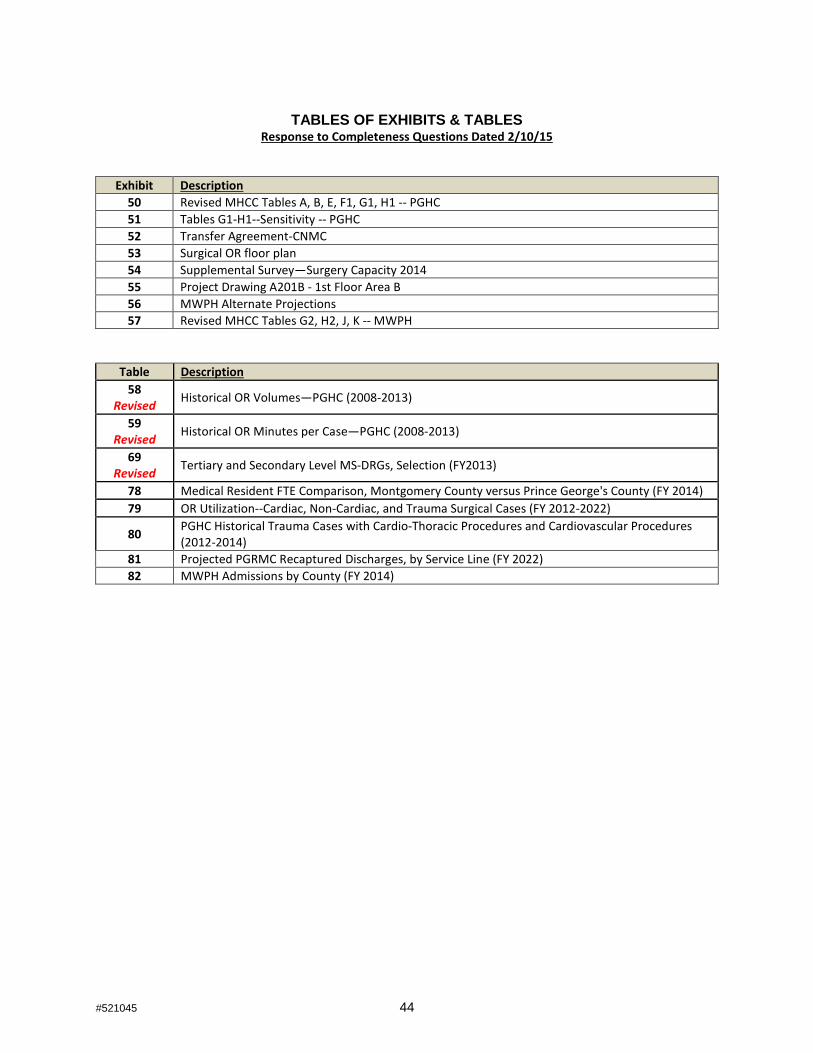
TABLES OF EXHIBITS & TABLES Response to Completeness Questions Dated 2/10/15
Exhibit Description 50 Revised MHCC Tables A, B, E, F1, G1, H1 -- PGHC 51 Tables G1-H1--Sensitivity -- PGHC 52 Transfer Agreement-CNMC 53 Surgical OR floor plan 54 Supplemental Survey—Surgery Capacity 2014 55 Project Drawing A201B - 1st Floor Area B 56 MWPH Alternate Projections 57 Revised MHCC Tables G2, H2, J, K -- MWPH
Table Description 58
Revised Historical OR Volumes—PGHC (2008-2013)
59 Revised Historical OR Minutes per Case—PGHC (2008-2013)
69 Revised Tertiary and Secondary Level MS-DRGs, Selection (FY2013)
78 Medical Resident FTE Comparison, Montgomery County versus Prince George's County (FY 2014) 79 OR Utilization--Cardiac, Non-Cardiac, and Trauma Surgical Cases (FY 2012-2022)
80 PGHC Historical Trauma Cases with Cardio-Thoracic Procedures and Cardiovascular Procedures (2012-2014)
81 Projected PGRMC Recaptured Discharges, by Service Line (FY 2022) 82 MWPH Admissions by County (FY 2014)
#521045 44


I hereby declare and affirm under the penalties of perjury that the facts stated in
Co-Applicants' Response to February 10, 2015Completeness Questions and its
exhibitsare true and correct to the best of my knowledge, information, and belief.
March 5, 2015 Date
#480776
Mary Miller Vice President, Finance and Business
Development Mt. Washington Pediatric Hospital

#516937 013346-0001
I hereby declare and affirm under the penalties of perjury that the facts stated in
Co-Applicants’ Response to February 10, 2015 Completeness Questions and its exhibits
are true and correct to the best of my knowledge, information, and belief.
March 5, 2015 Date Craig Moskowitz
Wilmot Sanz, Inc.

I hereby declare and affirm under the penalties of perjury that the facts stated in
Co-Applicants' Response to February 10, 2015 Completeness Questions and its exhibits
that I was involved with answering are true and correct to the best of my knowledge,
information, and belief.
#486238 013346-0001
March 5, 2015 Date Terri aber
Cardiovascular Program Development Consultant Haber Consulting, LLC

I hereby declare and affirm under the penalties of perjury that the facts stated in
Co-Applicants' Response to February 10, 2015 Completeness Questions and its exhibits
are tme and correct to the best of my knowledge, information, and belief.
#481237 013346-0001
March 5, 2015 Date Jeffrey~
Consul
I I ~ ii I il ii
'I I ii
I ~
JI
I

#481240 013346-0001
I hereby declare and affirm under the penalties of perjury that the facts stated in
Co-Applicants’ Response to February 10, 2015 Completeness Questions and its exhibits
are true and correct to the best of my knowledge, information, and belief.
March 13, 2015
Date Andrew L. Solberg
A.L.S. Healthcare Consultant Services

EXHIBIT 50

Table Number Table Title Instructions
Table A Physical Bed Capacity Before and After Project All applicants whose project impacts any nursing unit, regardless of project type or scope, must completeTable A.
Table B Departmental Gross Square Feet All applicants, regardless of project type or scope, must complete Table B for all departments andfunctional areas affected by the proposed project.
Table C Construction Characteristics All applicants proposing new construction or renovation must complete Table C.
Table D Site and Offsite Costs Included and Excluded inMarshall Valuation Costs All applicants proposing new construction or renovation must complete Table D.
Table E Project Budget All applicants, regardless of project type or scope, must complete Table E.
Table F Statistical Projections - Entire Facility Existing facility applicants must complete Table F. All applicants who complete this table must alsocomplete Tables G and H.
Table G Revenues & Expenses, Uninflated - Entire Facility Existing facility applicants must complete Table G. The projected revenues and expenses in Table Gshould be consistent with the volume projections in Table F.
Table H Revenues & Expenses, Inflated - Entire Facility Existing facility applicants must complete Table H. The projected revenues and expenses in H should beconsistent with the projections in Tables F and G.
Table I Statistical Projections - New Facility or ServiceApplicants who propose to establish a new facility, existing facility applicants who propose a new service,and applicants who are directed by MHCC staff must complete Table I. All applicants who complete thistable must also complete Tables J and K.
Table J Revenues & Expenses, Uninflated - New Facility orService
Applicants who propose to establish a new facility and existing facility applicants who propose a newservice and any other applicant who completes a Table I must complete Table J. The projected revenuesand expenses in Table J should be consistent with the volume projections in Table I.
Table K Revenues & Expenses, Inflated - New Facility orService
Applicants who propose to establish a new facility and existing facility applicants who propose a newservice and any other applicant that completes a Table I must complete Table K. The projected revenuesand expenses in Table K should be consistent with the projections in Tables I and J.
Table L Manpower All applicants, regardless of project type or scope, must complete Table L.
Response to Completeness Questions Dated 2/10/15

TABLE A. PHYSICAL BED CAPACITY BEFORE AND AFTER PROJECTINSTRUCTION : Identify the location of each nursing unit (add or delete rows if necessary) and specify the room and bed count before and after the project in accordance with the definition of physical capacity notedbelow. Applicants should add columns and recalculate formulas to address rooms with 3 and 4 bed capacity. See additional instruction in the column to the right of the table.NOTE: Physical capacity is the total number of beds that could be physically set up in space without significant renovations. This should be the maximum operating capacity under normal, non-emergencycircumstances and is a physical count of bed capacity, rather than a measure of staffing capacity. A room with two headwalls and two sets of gasses should be counted as having capacity for two beds, even if it istypically set up and operated with only one bed. A room with one headwall and one set of gasses is counted as a private room, even if it is large enough from a square footage perspective to be used as a semi-privateroom, since renovation/construction would be required to convert it to semi-private use. If the hospital operates patient rooms that contain no headwalls or a single headwall, but are normally used to accommodate oneor more than one patient (e.g., for psychiatric patients), the physical capacity of such rooms should be counted as they are currently used.
Before the Project After Project Completion Additional InstructionHospital Service Location Licensed Based on Physical Capacity Hospital Service Location Based on Physical Capacity
(Floor/Wing)* Beds: Room Count Bed Count (Floor/Wing)* Room Count Bed CountPrivate Semi- Total Physical Private Semi- Total Physical
July 1, 2015 Private Rooms Capacity Private Rooms CapacityACUTE CARE ACUTE CAREGeneral Medical/Surgical* 0 0 General Medical/Surgical* 0 0Med Surg Oncology E900 24 10 16 26 42 Med/Surg 6 34 0 34 34Med Surg Trauma E800 24 9 17 26 43 Med/Surg 7 33 0 33 33General Medical/Surgical E700 23 10 16 26 42 Med/Surg 8 33 0 33 33PCRU Extended E500 12 3 7 10 17 Med/Surg 9 33 0 33 33Post Coronary Recovery Unit E400 24 4 11 15 26
SUBTOTAL Gen. Med/Surg* 107 36 67 103 170 SUBTOTAL Gen. Med/Surg* 133 0 133 133Calculate the sum of allGeneral Medical/Surgicalrows
ICU/CCU 300 24 24 0 24 24 ICU/CCU 5 32 0 32 32CCU K400 10 10 0 10 10 0 0 0 0Other (Specify/add rows as needed) 0 0 0 0 0 0 0 0 0
TOTAL MSGA 141 70 67 137 204 TOTAL MSGA 165 0 165 165Calculate the sum ofMed/Surg Subtotal,ICU/CCU, and other physicalcapacity
Obstetrics K300 19 21 0 21 21 Obstetrics 2 22 0 22 22Obstetrics K200 19 21 0 21 21Pediatrics E600 8 0 6 6 12 Pediatrics 1 1 0 1 1Psychiatric E400 28 0 18 18 38 Psychiatric 4 28 0 28 28
TOTAL ACUTE 215 112 91 203 296 TOTAL ACUTE 216 0 216 216 Ensure that Total includesTotal MSGA and Obstetrics,Pediatrics, and Psych rows
NON-ACUTE CARE NON-ACUTE CAREDedicated Observation** 0 0 0 0 0 Dedicated Observation** 1 20 0 20 20Rehabilitation (MWPH) 15 15 0 15 15 Rehabilitation (MWPH) 2 15 0 15 15Comprehensive Care 0 0 0 0 0 Comprehensive Care 0 0 0 0Other (Specify/add rows as needed) 0 0 0 0 0 Other (Specify/add rows as needed) 0 0 0 0
TOTAL NON-ACUTE 15 15 0 15 15 TOTAL NON-ACUTE 35 0 35 35Calculate the sum of all Non-Acute Care rows
HOSPITAL TOTAL 230 127 91 218 311 HOSPITAL TOTAL 251 0 251 251Ensure that Hospital Totalincludes Total Acute andTotal Non-acute rows
* Include beds dedicated to gynecology and addictions, if unit(s) is separate for acute psychiatric unit** Include services included in the reporting of the “Observation Center”. Service furnished by the hospital on the hospital's promise, including use of a bed and periodic monitoring by the hospital's nursing or other staff, which arereasonable and necessary to determine the need for a possible admission to the hospital as an inpatient; Must be ordered and documented in writing, given by a medical practitioner.
TABLE A. PHYSICAL BED CAPACITY BEFORE AND AFTER PROJECT 2

TABLE B. DEPARTMENTAL GROSS SQUARE FEET AFFECTED BY PROPOSED PROJECT
CurrentTo be Added
Thru NewConstruction
To BeRenovated To Remain As Is
Total AfterProject
Completion0
ACUTE PATIENT CARE 0ACUTE CARE INPT. UNITS 59,850 90,840 90,840INTENSIVE CARE 21,913 22,794 22,794POST-PARTUM 28,764 17,454 17,454
NEONATAL INTENSIVE CARE UNIT 2,272 11,921 11,921
PEDIATRICS 5,773 400 400MT. WASHINGTON PEDIATRICS 8,197 13,149 13,149
0DIAGNOSTICS & TREATMENT 0SURGERY 18,894 33,137 33,137CARDIAC CATH LAB 3,939 4,676 4,676GI - ENDOSCOPY 5,398 1,903 1,903ADULT ED 15,024 27,151 27,151PEDS ED 1,757 1,757TRAUMA 859 5,165 5,165UNIVERSAL CARE / PRE-POST 10,507 19,516 19,516CLINCIAL DECISION UNIT 1,397 9,904 9,904
0IMAGING 17,854 18,135 18,135NEUROLOGY/CARDIOLOGY 1,363 6,854 6,854LABOR & DELIVERY 7,248 14,648 14,648C-SECTION 1,129 3,735 3,735WOMENS CENTER 5,540 10,082 10,082DOMESTIC VIOLENCE CENTER 1,187 2,235 2,235DIALYSIS 1,166 2,344 2,344PT/OT 3,905 3,461 3,461RESP THERAPY 1,932 1,222 1,222
0CLINICAL SUPPORT 0LABORATORY / PATHOLOGY 13,593 12,895 12,895PHARMACY 2,293 5,220 5,220
0NON CLINICAL SUPPORT 0DIETARY / DINING 13,791 13,333 13,333MATERIALS / BIO MED / EVS 9,271 16,176 16,176CENTRAL STERILE 6,806 8,004 8,004
FACILITIES & SUPPORT SERVICES 28,972 8,545 8,545
IT / TELECOM 10,406 9,616 9,6160
OFFICES & EDUCATION 0OFFICE / ADMINISTRATION 31,298 21,318 21,318ON CALL 4,838 3,643 3,643CONFERENCE CENTER 6,967 5,256 5,256RESIDENT / FACULTY 7,577 15,341 15,341
0PUBLIC SPACES 39,186 11,630 11,630CIRCULATION 102,527 98,817 98,817
0MECHANICAL/ELECTRICAL 15,558 74,503 74,503
0BEHAVIORAL HEALTH 0CLINICAL PROGRAMS 2,292 2,580 2,580ACUTE BEHAVIORAL HEALTH 15,905 20,488 20,488ASSESSMENT STABILIZATION 3,031 3,444 3,444
0AMBULATORY/CANCER CLINICALPROGRAMS 0
MT WASHINGTON OUTPATIENT 1,344 1,922 1,922CANCER CENTER 12,105 12,105AMBULATORY CLINICS 7,443 11,241 11,241
0SHAFTS / EXTERIOR WALLTHICKNESS 31,848 25,452 25,452
0Total 579,057 704,012 704,012
DEPARTMENT/FUNCTIONAL AREA
INSTRUCTION : Add or delete rows if necessary. See additional instruction in the column to the right of the table.
TABLE B. DEPARTMENTAL GROSS SQUARE FEET AFFECTED BY PROPOSED PROJECT 3

Hospital Building Amb Care/CA Ctr. CUP TotalA.
1.a. Land Purchase $11,972,775.00 $377,225 $12,350,000b.(1) Building $254,125,216 $21,921,491 $8,697,383 $284,744,090
(2) Fixed Equipment $0
(3) Site and Infrastructure $16,303,282 $300,000 $530,668 $17,133,951(4) Architect/Engineering Fees $14,676,523 $1,000,000 $501,048 $16,177,571(5) Permits (Building, Utilities, Etc.) $9,749,567 $841,023 $338,493 $10,929,082
SUBTOTAL $294,854,589 $24,062,513 $10,067,591 $328,984,693c.(1) Building $0(2) Fixed Equipment (not included in construction) $0(3) Architect/Engineering Fees $0(4) Permits (Building, Utilities, Etc.) $0
SUBTOTAL $0 $0 $0d.(1) Movable Equipment $117,420,566 $9,000,000.0 $32,496,000 $158,916,566(2) Contingency Allowance $26,143,453 $2,439,028 $1,417,519 $30,000,000(3) Gross interest during construction period $33,659,699 $2,725,640 $3,376,661.0 $39,762,000
(4)
Other (Specify) UMMS PM, Builder's Risk,Commissioning/Testing, Warehousing, Testing,Traffic Study, Davis Langdon, CM Pricing,Scheduling, Helipad, Survey, Risk Assesment,Code, review, ICRA, MET Testing, CurtainwallTesting, Legal, Office Consolidation, Enabling,Equipment Planning, IT Design, OffsiteImprovements, IT Design, Original site leavebehind
$19,329,220 $750,000 $20,079,220
SUBTOTAL $196,552,938 $14,914,667 $37,290,180 $248,757,786
TOTAL CURRENT CAPITAL COSTS $503,380,302 $38,977,181 $47,734,997 $590,092,479
e. Inflation Allowance $21,605,285 $1,863,727 $2,355,508 $25,824,521
TOTAL CAPITAL COSTS $524,985,587 $40,840,908 $50,090,505 $615,917,000
2.a. Loan Placement Fees $3,521,116 $273,923 $335,961 $4,131,000b. Bond Discount $0c. Legal Fees $844,929 $72,886 $82,186 $1,000,000d. Non-Legal Consultant Fees $760,436 $65,597 $73,967 $900,000e. Liquidation of Existing Debt $0f. Debt Service Reserve Fund $12,593,681 $979,717 $1,201,602 $14,775,000g. Other (Specify)RPAI, Gold's Gym $13,308,310 $1,191,690 $14,500,000
SUBTOTAL $31,028,471 $1,392,123 $2,885,406 $35,306,000
3. Working Capital Startup Costs $0
TOTAL USES OF FUNDS $556,014,058 $42,233,030 $52,975,911 $651,223,000
New Construction
TABLE E. PROJECT BUDGETINSTRUCTION : Estimates for Capital Costs (1.a-e), Financing Costs and Other Cash Requirements (2.a-g), and Working Capital Startup Costs (3) must reflectcurrent costs as of the date of application and include all costs for construction and renovation. Explain the basis for construction cost estimates, renovation costestimates, contingencies, interest during construction period, and inflation in an attachment to the application. See additional instruction in the column to the right ofthe table.
NOTE : Inflation should only be included in the Inflation allowance line A.1.e. The value of donated land for the project should be included on Line A.1.a as a use offunds and on line B.8 as a source of funds
USE OF FUNDSCAPITAL COSTS
Renovations
Other Capital Costs
Financing Cost and Other Cash Requirements
TABLE E. PROJECT BUDGET

Hospital Building Amb Care/CA Ctr. CUP Total
TABLE E. PROJECT BUDGETINSTRUCTION : Estimates for Capital Costs (1.a-e), Financing Costs and Other Cash Requirements (2.a-g), and Working Capital Startup Costs (3) must reflectcurrent costs as of the date of application and include all costs for construction and renovation. Explain the basis for construction cost estimates, renovation costestimates, contingencies, interest during construction period, and inflation in an attachment to the application. See additional instruction in the column to the right ofthe table.
NOTE : Inflation should only be included in the Inflation allowance line A.1.e. The value of donated land for the project should be included on Line A.1.a as a use offunds and on line B.8 as a source of funds
B.1. Cash $0
2. Philanthropy (to date and expected) $0
3. Authorized Bonds $206,760,0004. Interest Income from bond proceeds listed in #3 $16,113,0005. Mortgage $06. Working Capital Loans $07.
a. Federal $0b. State $208,000,000c. Local $208,000,000
8. Other (rounding) $12,350,000
TOTAL SOURCES OF FUNDS $651,223,000
1. $02. $03. $04. $05. $0
Annual Lease Costs (if applicable)
Sources of Funds
Grants or Appropriations
LandBuildingMajor Movable EquipmentMinor Movable EquipmentOther (Specify/add rows if needed)
Describe the terms of the lease(s) below, including information on the fair market value of the item(s), and the number of years, annual cost, and the interest ratefor the lease.
TABLE E. PROJECT BUDGET
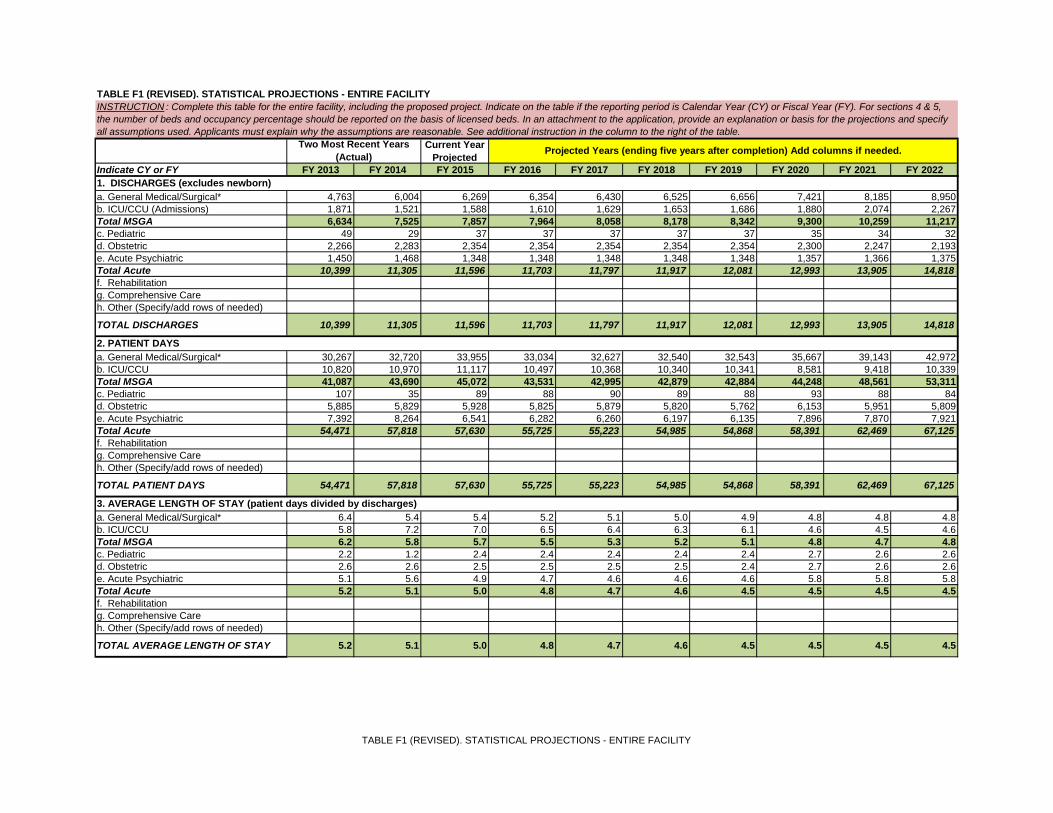
Current YearProjected
Indicate CY or FY FY 2013 FY 2014 FY 2015 FY 2016 FY 2017 FY 2018 FY 2019 FY 2020 FY 2021 FY 2022
a. General Medical/Surgical* 4,763 6,004 6,269 6,354 6,430 6,525 6,656 7,421 8,185 8,950b. ICU/CCU (Admissions) 1,871 1,521 1,588 1,610 1,629 1,653 1,686 1,880 2,074 2,267Total MSGA 6,634 7,525 7,857 7,964 8,058 8,178 8,342 9,300 10,259 11,217c. Pediatric 49 29 37 37 37 37 37 35 34 32d. Obstetric 2,266 2,283 2,354 2,354 2,354 2,354 2,354 2,300 2,247 2,193e. Acute Psychiatric 1,450 1,468 1,348 1,348 1,348 1,348 1,348 1,357 1,366 1,375Total Acute 10,399 11,305 11,596 11,703 11,797 11,917 12,081 12,993 13,905 14,818f. Rehabilitationg. Comprehensive Careh. Other (Specify/add rows of needed)
TOTAL DISCHARGES 10,399 11,305 11,596 11,703 11,797 11,917 12,081 12,993 13,905 14,818
a. General Medical/Surgical* 30,267 32,720 33,955 33,034 32,627 32,540 32,543 35,667 39,143 42,972b. ICU/CCU 10,820 10,970 11,117 10,497 10,368 10,340 10,341 8,581 9,418 10,339Total MSGA 41,087 43,690 45,072 43,531 42,995 42,879 42,884 44,248 48,561 53,311c. Pediatric 107 35 89 88 90 89 88 93 88 84d. Obstetric 5,885 5,829 5,928 5,825 5,879 5,820 5,762 6,153 5,951 5,809e. Acute Psychiatric 7,392 8,264 6,541 6,282 6,260 6,197 6,135 7,896 7,870 7,921Total Acute 54,471 57,818 57,630 55,725 55,223 54,985 54,868 58,391 62,469 67,125f. Rehabilitationg. Comprehensive Careh. Other (Specify/add rows of needed)
TOTAL PATIENT DAYS 54,471 57,818 57,630 55,725 55,223 54,985 54,868 58,391 62,469 67,125
a. General Medical/Surgical* 6.4 5.4 5.4 5.2 5.1 5.0 4.9 4.8 4.8 4.8b. ICU/CCU 5.8 7.2 7.0 6.5 6.4 6.3 6.1 4.6 4.5 4.6Total MSGA 6.2 5.8 5.7 5.5 5.3 5.2 5.1 4.8 4.7 4.8c. Pediatric 2.2 1.2 2.4 2.4 2.4 2.4 2.4 2.7 2.6 2.6d. Obstetric 2.6 2.6 2.5 2.5 2.5 2.5 2.4 2.7 2.6 2.6e. Acute Psychiatric 5.1 5.6 4.9 4.7 4.6 4.6 4.6 5.8 5.8 5.8Total Acute 5.2 5.1 5.0 4.8 4.7 4.6 4.5 4.5 4.5 4.5f. Rehabilitationg. Comprehensive Careh. Other (Specify/add rows of needed)
TOTAL AVERAGE LENGTH OF STAY 5.2 5.1 5.0 4.8 4.7 4.6 4.5 4.5 4.5 4.5
TABLE F1 (REVISED). STATISTICAL PROJECTIONS - ENTIRE FACILITYINSTRUCTION : Complete this table for the entire facility, including the proposed project. Indicate on the table if the reporting period is Calendar Year (CY) or Fiscal Year (FY). For sections 4 & 5,the number of beds and occupancy percentage should be reported on the basis of licensed beds. In an attachment to the application, provide an explanation or basis for the projections and specifyall assumptions used. Applicants must explain why the assumptions are reasonable. See additional instruction in the column to the right of the table.
Two Most Recent Years(Actual) Projected Years (ending five years after completion) Add columns if needed.
1. DISCHARGES (excludes newborn)
2. PATIENT DAYS
3. AVERAGE LENGTH OF STAY (patient days divided by discharges)
TABLE F1 (REVISED). STATISTICAL PROJECTIONS - ENTIRE FACILITY

Current YearProjected
Indicate CY or FY FY 2013 FY 2014 FY 2015 FY 2016 FY 2017 FY 2018 FY 2019 FY 2020 FY 2021 FY 2022
TABLE F1 (REVISED). STATISTICAL PROJECTIONS - ENTIRE FACILITYINSTRUCTION : Complete this table for the entire facility, including the proposed project. Indicate on the table if the reporting period is Calendar Year (CY) or Fiscal Year (FY). For sections 4 & 5,the number of beds and occupancy percentage should be reported on the basis of licensed beds. In an attachment to the application, provide an explanation or basis for the projections and specifyall assumptions used. Applicants must explain why the assumptions are reasonable. See additional instruction in the column to the right of the table.
Two Most Recent Years(Actual) Projected Years (ending five years after completion) Add columns if needed.
1. DISCHARGES (excludes newborn)a. General Medical/Surgical* 118 108 107 107 107 107 107 133 133 133b. ICU/CCU 34 34 34 34 34 34 34 32 32 32Total MSGA 152 142 141 141 141 141 141 165 165 165c. Pediatric 8 8 8 8 8 8 8 1 1 1d. Obstetric 36 36 38 38 38 38 38 22 22 22e. Acute Psychiatric 28 28 28 28 28 28 28 28 28 28Total Acute 224 214 215 215 215 215 215 216 216 216f. Rehabilitationg. Comprehensive Careh. Other (Specify/add rows of needed)
TOTAL LICENSED BEDS 224 214 215 215 215 215 215 216 216 216
a. General Medical/Surgical* 70.3% 83.0% 86.9% 84.4% 83.5% 83.3% 83.3% 73.3% 80.6% 88.5%b. ICU/CCU 87.2% 88.4% 89.6% 84.4% 83.5% 83.3% 83.3% 73.3% 80.6% 88.5%Total MSGA 74.1% 84.3% 87.6% 84.4% 83.5% 83.3% 83.3% 73.3% 80.6% 88.5%c. Pediatric 3.7% 1.2% 3.0% 3.0% 3.1% 3.0% 3.0% 25.5% 24.2% 23.1%d. Obstetric 44.8% 44.4% 42.7% 41.9% 42.4% 42.0% 41.5% 76.4% 74.1% 72.3%e. Acute Psychiatric 72.3% 80.9% 64.0% 61.3% 61.3% 60.6% 60.0% 77.1% 77.0% 77.5%Total Acute 66.6% 74.0% 73.4% 70.8% 70.4% 70.1% 69.9% 73.9% 79.2% 85.1%f. Rehabilitationg. Comprehensive Careh. Other (Specify/add rows of needed)
TOTAL OCCUPANCY % 66.6% 74.0% 73.4% 70.8% 70.4% 70.1% 69.9% 73.9% 79.2% 85.1%
a. Emergency Department (IP and OP) 51,881 50,229 50,490 50,490 50,490 50,490 50,490 53,727 56,965 60,202b. Same-day Surgery 1,927 1,807 1,867 1,893 1,915 1,944 1,983 2,210 2,438 2,666c. Laboratoryd. Imaginge. Other - Psych. Day & Night 3,796 2,303 2,940 2,940 2,940 2,940 2,940 3,163 3,385 3,608e. Other - Clinic 1,378 697 890 890 890 890 890 957 1,025 1,092
TOTAL OUTPATIENT VISITS 58,982 55,036 56,187 56,213 56,235 56,264 56,303 60,057 63,813 67,568
a. Number of Patients 4,056 4,292 4,442 4,479 4,479 4,479 4,479 4,740 5,001 5,262b. Hours 143,995 130,072 134,618 135,735 135,735 135,735 135,735 143,643 151,550 159,457* Include beds dedicated to gynecology and addictions, if separate for acute psychiatric unit. ** Services included in the reporting of the “Observation Center”, direct expenses incurred in providing bedside care to observation patients; furnished by the hospital on the hospital’s premises, including use of a bedand periodic monitoring by the hospital’s nursing or other staff, in order to determine the need for a possible admission to the hospitals as an inpatient. Such services must be ordered and documented in writing, givenby a medical practitioner; may or may not be provided in a distinct area of the hospital.
4. NUMBER OF LICENSED BEDS
5. OCCUPANCY PERCENTAGE *IMPORTANT NOTE: Leap year formulas should be changed by applicant to reflect 366 days per year.
6. OUTPATIENT VISITS
7. OBSERVATIONS**
TABLE F1 (REVISED). STATISTICAL PROJECTIONS - ENTIRE FACILITY

Current YearProjected
Indicate CY or FY FY 2013 FY 2014 FY 2015 FY 2016 FY 2017 FY 2018 FY 2019 FY 2020 FY 2021 FY 20221. REVENUE a. Inpatient Services 173,139$ 188,441$ 189,791$ 194,319$ 196,694$ 199,060$ 202,014$ 227,339$ 235,894$ 244,209$ b. Outpatient Services 76,775$ 76,379$ 78,899$ 80,017$ 80,289$ 80,293$ 80,255$ 85,540$ 86,593$ 87,717$
Gross Patient Service Revenues (1) 249,914$ 264,820$ 268,691$ 274,336$ 276,983$ 279,353$ 282,268$ 312,879$ 322,487$ 331,926$
c. Allowance For Bad Debt 16,710$ 28,269$ 28,134$ 28,725$ 29,002$ 29,250$ 29,555$ 30,671$ 30,618$ 30,539$ d. Contractual Allowance 22,759$ 30,070$ 26,283$ 23,835$ 24,065$ 24,271$ 24,524$ 25,697$ 25,670$ 25,621$ e. Charity Care 21,930$ 13,185$ 13,119$ 13,394$ 13,524$ 13,639$ 13,782$ 14,302$ 14,277$ 14,240$ e. Uncompensated Care Receipts (16,487)$ (17,044)$ (17,303)$ (18,529)$ (18,797)$ (18,908)$ (18,968)$ (21,025)$ (21,671)$ (21,777)$
Net Patient Services Revenue 205,003$ 210,340$ 218,459$ 226,910$ 229,189$ 231,101$ 233,375$ 263,234$ 273,592$ 283,303$
f. Other Operating Revenues - State Support 10,650$ 10,000$ 10,000$ 10,000$ 10,000$ 10,000$ 10,000$ 3,333$ 3,333$ -$ f. Other Operating Revenues - County Support 10,650$ 12,165$ 8,988$ 6,516$ 6,516$ 6,516$ 6,516$ 3,333$ 3,333$ -$ f. Other Operating Revenues 5,939$ 6,092$ 7,134$ 7,134$ 7,134$ 7,134$ 7,134$ 7,134$ 7,134$ 7,134$
NET OPERATING REVENUE 232,242$ 238,597$ 244,581$ 250,560$ 252,839$ 254,751$ 257,025$ 277,035$ 287,393$ 290,437$
2. EXPENSES a. Salaries & Wages (including benefits) 133,564$ 133,828$ 127,822$ 125,269$ 121,438$ 117,607$ 117,228$ 120,053$ 123,817$ 128,047$ b. Contractual Services 30,498$ 35,391$ 31,407$ 31,651$ 32,324$ 33,286$ 33,215$ 35,826$ 36,904$ 37,953$ c. Interest on Current Debt 1,816$ 970$ 103$ 246$ 232$ 225$ 220$ d. Interest on Project Debt 13,937$ 12,413$ 11,308$ e. Current Depreciation 6,567$ 7,893$ 9,056$ 10,511$ 11,965$ 12,333$ 13,762$ f. Project Depreciation 25,930$ 26,430$ 27,073$ g. Current Amortization 41$ -$ -$ -$ -$ -$ -$ h. Project Amortization 138$ 138$ 138$ i. Supplies 33,702$ 31,619$ 35,988$ 36,582$ 37,135$ 37,865$ 38,826$ 39,978$ 41,238$ 42,464$ j. Other Expenses - Physician Support 23,855$ 28,326$ 32,717$ 35,417$ 36,980$ 37,253$ 34,063$ 32,467$ 32,102$ 32,101$ j. Other Expenses - Transition Costs -$ -$ -$ -$ -$ -$ 2,000$ 700$ -$ -$j. Other Expenses - UMMS Overhead Allocation -$ -$ -$ -$ -$ -$ -$ 3,000$ 3,000$ 3,000$
j. Other Expenses - Utilities 1,184$ 2,932$ 2,896$ 2,892$ 2,891$ 2,890$ 2,884$ 2,969$ 3,063$ 3,154$
TOTAL OPERATING EXPENSES 231,226$ 240,958$ 239,990$ 242,568$ 242,965$ 241,460$ 242,197$ 274,998$ 279,106$ 285,239$
3. INCOME
a. Income From Operation 1,016$ (2,361)$ 4,591$ 7,992$ 9,874$ 13,291$ 14,828$ 2,037$ 8,287$ 5,198$
b. Non-Operating Income 12$ 24$ 24$ 24$ 24$ 24$ 24$ 36$ 24$ 24$
SUBTOTAL 1,028$ (2,337)$ 4,615$ 8,016$ 9,898$ 13,315$ 14,852$ 2,073$ 8,311$ 5,222$
c. Income Taxes
NET INCOME (LOSS) 1,028$ (2,337)$ 4,615$ 8,016$ 9,898$ 13,315$ 14,852$ 2,073$ 8,311$ 5,222$
d. Depreciation and Amortization 6,608$ 7,893$ 9,056$ 10,511$ 11,965$ 12,333$ 13,762$ 26,068$ 26,568$ 27,211$
CASH FLOW FROM OPERATIONS 7,636$ 5,555$ 13,672$ 18,527$ 21,863$ 25,648$ 28,614$ 28,141$ 34,879$ 32,433$
Note (1): Since the Hospital signed a Global Budget Revenue Agreement, patient revenues are projected in total for FY2014 - FY2022.
TABLE G1 (REVISED). REVENUES & EXPENSES, UNINFLATED - ENTIRE FACILITYINSTRUCTION : Complete this table for the entire facility, including the proposed project. Table H should reflect inflation. Projected revenues and expenses should be consistent with the projections inTable F. Indicate on the table if the reporting period is Calendar Year (CY) or Fiscal Year (FY). In an attachment to the application, provide an explanation or basis for the projections and specify allassumptions used. Applicants must explain why the assumptions are reasonable. See additional instruction in the column to the right of the table.
Two Most Recent Years(Actual) Projected Years (ending five years after completion) Add columns if needed.
TABLE G1 (REVISED). REVENUES EXPENSES, UNINFLATED - ENTIRE FACILITY

Current YearProjected
Indicate CY or FY FY 2013 FY 2014 FY 2015 FY 2016 FY 2017 FY 2018 FY 2019 FY 2020 FY 2021 FY 2022
TABLE G1 (REVISED). REVENUES & EXPENSES, UNINFLATED - ENTIRE FACILITYINSTRUCTION : Complete this table for the entire facility, including the proposed project. Table H should reflect inflation. Projected revenues and expenses should be consistent with the projections inTable F. Indicate on the table if the reporting period is Calendar Year (CY) or Fiscal Year (FY). In an attachment to the application, provide an explanation or basis for the projections and specify allassumptions used. Applicants must explain why the assumptions are reasonable. See additional instruction in the column to the right of the table.
Two Most Recent Years(Actual) Projected Years (ending five years after completion) Add columns if needed.
4. PATIENT MIXa. Percent of Total Revenue 1) Medicare 27.2% 25.5% 25.5% 25.5% 25.5% 25.5% 25.5% 27.6% 28.5% 29.5% 2) Medicaid 32.4% 36.5% 36.5% 36.5% 36.5% 36.5% 36.5% 33.4% 32.0% 30.6% 3) Blue Cross 10.6% 9.9% 9.9% 9.9% 9.9% 9.9% 9.9% 9.1% 8.7% 8.3% 4) Commercial Insurance 16.7% 16.0% 16.0% 16.0% 16.0% 16.0% 16.0% 18.9% 20.2% 21.5% 5) Self-pay 11.5% 10.8% 10.8% 10.8% 10.8% 10.8% 10.8% 9.9% 9.5% 9.0% 6) Other 1.6% 1.3% 1.3% 1.3% 1.3% 1.3% 1.3% 1.2% 1.1% 1.1%TOTAL 100.0% 100.0% 100.0% 100.0% 100.0% 100.0% 100.0% 100.0% 100.0% 100.0%b. Percent of Equivalent Inpatient Days 1) Medicare 27.1% 25.9% 25.9% 25.9% 25.9% 25.9% 25.9% 29.4% 30.9% 32.3% 2) Medicaid 43.2% 41.6% 41.6% 41.6% 41.6% 41.6% 41.6% 35.5% 32.8% 30.6% 3) Blue Cross 9.1% 9.0% 9.0% 9.0% 9.0% 9.0% 9.0% 7.7% 7.1% 6.6% 4) Commercial Insurance 11.4% 10.8% 10.8% 10.8% 10.8% 10.8% 10.8% 16.5% 19.0% 21.2% 5) Self-pay 8.1% 11.8% 11.8% 11.8% 11.8% 11.8% 11.8% 10.0% 9.3% 8.7% 6) Other 1.2% 1.0% 1.0% 1.0% 1.0% 1.0% 1.0% 0.9% 0.8% 0.8%TOTAL 100.0% 100.0% 100.0% 100.0% 100.0% 100.0% 100.0% 100.0% 100.0% 100.0%
TABLE G1 (REVISED). REVENUES EXPENSES, UNINFLATED - ENTIRE FACILITY

Prince George's Hospital CenterGBR Revenue Projection - Uninflated
FY2015 - FY2022
ProjectedBudget New Hosp.2015 2016 2017 2018 2019 2020 2021 2022
Prior Year GBR Cap 268,691$ 274,336$ 276,983$ 279,353$ 282,268$ 312,879$ 322,487$
Update Factor % 0.00% 0.00% 0.00% 0.00% 0.00% 0.00% 0.00%
Population % 0.31% 0.31% 0.31% 0.31% 0.31% 0.31% 0.31%
Subtotal 264,469$ 269,524 275,186 277,842 280,219 283,143 313,849 323,487
Adjustment to FY15 GBR % 1.60%Adjustment to FY15 GBR $ 4,222
Market Share Adjustment % 0.00% 1.79% 0.65% 0.54% 0.73% 2.91% 2.75% 2.61%Market Share Adjustment $ - 4,812 1,797 1,511 2,050 8,247 8,639 8,439
Capital Rate Adjustment % - 0.0% 0.0% 0.0% 0.0% 7.6% 0.0% 0.0%Capital Rate Adjustment $ - - - - - 21,488 - -
Current Year GBR Cap 268,691$ 274,336$ 276,983$ 279,353$ 282,268$ 312,879$ 322,487$ 331,926$
G.1 GBR UNINFLATED
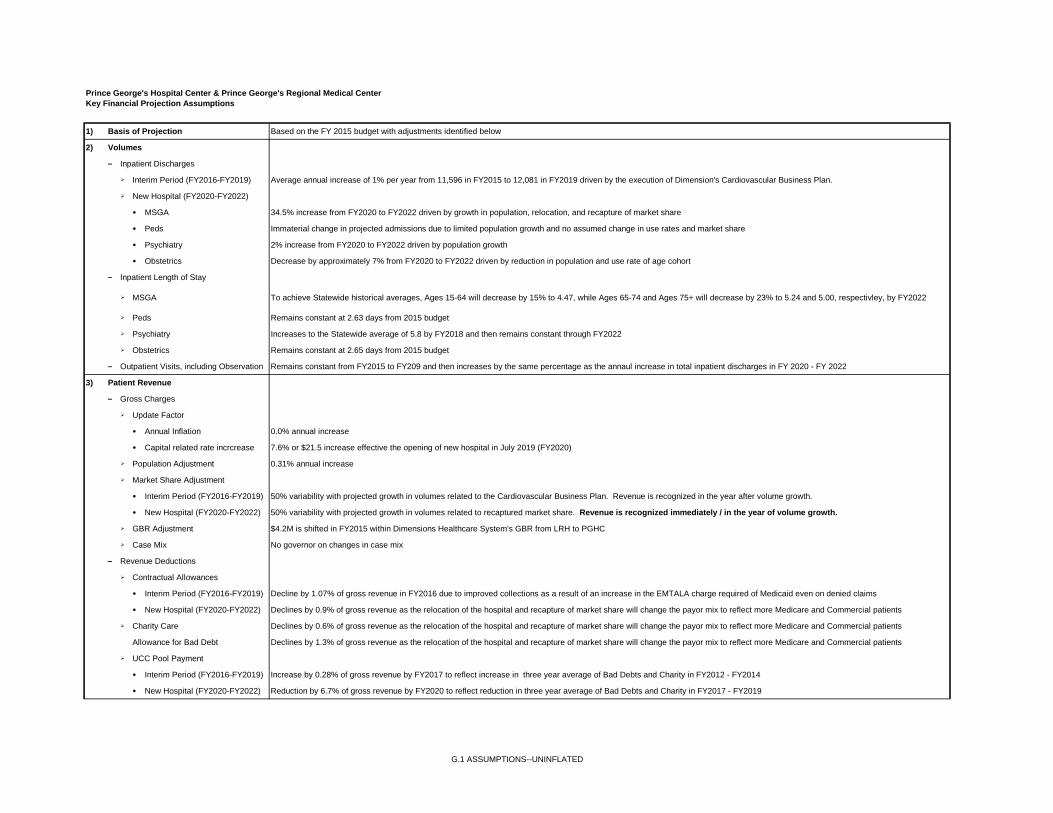
Prince George's Hospital Center & Prince George's Regional Medical CenterKey Financial Projection Assumptions
1) Basis of Projection Based on the FY 2015 budget with adjustments identified below
2) Volumes
– Inpatient Discharges
Interim Period (FY2016-FY2019) Average annual increase of 1% per year from 11,596 in FY2015 to 12,081 in FY2019 driven by the execution of Dimension's Cardiovascular Business Plan.
New Hospital (FY2020-FY2022)
• MSGA 34.5% increase from FY2020 to FY2022 driven by growth in population, relocation, and recapture of market share
• Peds Immaterial change in projected admissions due to limited population growth and no assumed change in use rates and market share
• Psychiatry 2% increase from FY2020 to FY2022 driven by population growth
• Obstetrics Decrease by approximately 7% from FY2020 to FY2022 driven by reduction in population and use rate of age cohort
– Inpatient Length of Stay
MSGA To achieve Statewide historical averages, Ages 15-64 will decrease by 15% to 4.47, while Ages 65-74 and Ages 75+ will decrease by 23% to 5.24 and 5.00, respectivley, by FY2022
Peds Remains constant at 2.63 days from 2015 budget
Psychiatry Increases to the Statewide average of 5.8 by FY2018 and then remains constant through FY2022
Obstetrics Remains constant at 2.65 days from 2015 budget
– Outpatient Visits, including Observation Remains constant from FY2015 to FY209 and then increases by the same percentage as the annaul increase in total inpatient discharges in FY 2020 - FY 2022
3) Patient Revenue
– Gross Charges
Update Factor
• Annual Inflation 0.0% annual increase
• Capital related rate incrcrease 7.6% or $21.5 increase effective the opening of new hospital in July 2019 (FY2020)
Population Adjustment 0.31% annual increase
Market Share Adjustment
• Interim Period (FY2016-FY2019) 50% variability with projected growth in volumes related to the Cardiovascular Business Plan. Revenue is recognized in the year after volume growth.
• New Hospital (FY2020-FY2022) 50% variability with projected growth in volumes related to recaptured market share. Revenue is recognized immediately / in the year of volume growth.
GBR Adjustment $4.2M is shifted in FY2015 within Dimensions Healthcare System's GBR from LRH to PGHC
Case Mix No governor on changes in case mix
– Revenue Deductions
Contractual Allowances
• Interim Period (FY2016-FY2019) Decline by 1.07% of gross revenue in FY2016 due to improved collections as a result of an increase in the EMTALA charge required of Medicaid even on denied claims
• New Hospital (FY2020-FY2022) Declines by 0.9% of gross revenue as the relocation of the hospital and recapture of market share will change the payor mix to reflect more Medicare and Commercial patients
Charity Care Declines by 0.6% of gross revenue as the relocation of the hospital and recapture of market share will change the payor mix to reflect more Medicare and Commercial patients
Allowance for Bad Debt Declines by 1.3% of gross revenue as the relocation of the hospital and recapture of market share will change the payor mix to reflect more Medicare and Commercial patients
UCC Pool Payment
• Interim Period (FY2016-FY2019) Increase by 0.28% of gross revenue by FY2017 to reflect increase in three year average of Bad Debts and Charity in FY2012 - FY2014
• New Hospital (FY2020-FY2022) Reduction by 6.7% of gross revenue by FY2020 to reflect reduction in three year average of Bad Debts and Charity in FY2017 - FY2019
G.1 ASSUMPTIONS--UNINFLATED

Prince George's Hospital Center & Prince George's Regional Medical CenterKey Financial Projection Assumptions
4) Other Revenue
– State Grant $10M per year through 2019 declining to $3.3M per year in 2020-21 and then $0 in FY 2022
– County Grant $9M in 2015 declining to $6.5M per year in 2016-2019, $3.3M per year in 2020-2021 and $0 in 2022
– McGruder Grant Approximately $1M per year
– Physician Billing and Other Revenue 0% increase per year
5) Non-Operating Revenue 0% increase per year
6) Expenses
– Operating Expense Drivers
Salaries Based on FTEs per Average Occupied Bed which is expected to decrease from 6.5 in FY 2015 to Statewide historical average of 5.8 in FY 2022
Benefits Reflects 27% of salaries as included in 2015 budget
Other Operating Expenses Reflects changes in adjusted admissions
– Inflation
Operating Exp, excl Phys Fees 0.0% increase per year
Physician Fees 0.0% increase per year
– Expense Variability 50% throughout projection period
– Performance Improvements Reduction of $8M in 2016-2018 based on change in workforce rules in Service Employees International Union (SEIU) agreement
– Transition Costs $2M of costs spread between 2019 and 2020 associated with transition of campuses from Cheverly to Largo
– UMMS Overhead Allocation $3M annual overhead allocated to PGRMC upon opening of new facility in FY2020
– Rental Space 60,000 sq. ft. of space is expected to be leased for Dimensions' corporate offices at $40 per sq.ft. effective the opening of the new building with 67% of the lease expense allocated toPGRMC
– Interest Expense
Interim Period (FY2016-FY2019) Series 1994 Bonds paid off by County in 2014
New Hospital (FY2020-FY2022) $206.5M bond issuance at 5.5% over 30 years
Line of Credit (FY2020-FY2022) $68.2M loan required at opening of new hospital to fund 100 days of cash on hand at 5.0% interest. Will be paid off over first five to six years of operations.
– Depreciation and Amortization
Interim Period (FY2016-FY2019) Reflects FY2015 budget plus depreciation on annual routine capital expenditures with average lives of 7 years
New Hospital (FY2020-FY2022) Reflects depreciation on new hosptial facility with average useful life of 23 years plus depreciation on annual routine capital expenditures with average lives of 7 years
7) Routine Capital Expenditures
– Interim Period (FY2016-FY2019) $10M per year
– New Hospital (FY2020-FY2022) $5M in 2020, $8.5M in 2021, and $13M in 20228) Debt
– New Hospital Construction $206.5M bond issuance in December 2015 at 5.5% over 30 years. Interest expense during construction will be capitalized. Principal payments will begin upon the new hospital'scommencement of operations in July 2019
– Line of Credit $68.2M loan required at opening of new hospital to fund 100 days of cash on hand at 5.0% interest. Will be paid off over first five years of operations as cash exceeds 100 days of cash onhand
G.1 ASSUMPTIONS--UNINFLATED

Current YearProjected
Indicate CY or FY FY 2013 FY 2014 FY 2015 FY 2016 FY 2017 FY 2018 FY 2019 FY 2020 FY 2021 FY 20221. REVENUE a. Inpatient Services 173,139$ 188,441$ 189,791$ 198,774$ 205,861$ 213,156$ 221,302$ 252,739$ 268,332$ 284,227$ b. Outpatient Services 76,775$ 76,379$ 78,899$ 81,741$ 83,814$ 85,660$ 87,508$ 94,848$ 98,144$ 101,624$
Gross Patient Service Revenues (1) 249,914$ 264,820$ 268,691$ 280,515$ 289,675$ 298,817$ 308,810$ 347,587$ 366,476$ 385,852$
c. Allowance For Bad Debt 16,710$ 28,269$ 28,134$ 29,372$ 30,331$ 31,288$ 32,335$ 34,056$ 34,769$ 35,466$ d. Contractual Allowance 22,759$ 30,070$ 26,283$ 24,440$ 25,238$ 26,034$ 26,905$ 28,886$ 29,510$ 30,122$ e. Charity Care 21,930$ 13,185$ 13,119$ 13,696$ 14,143$ 14,590$ 15,077$ 15,880$ 16,213$ 16,537$ e. Uncompensated Care Receipts (16,487)$ (17,044)$ (17,303)$ (18,946)$ (19,658)$ (20,226)$ (20,751)$ (23,357)$ (24,627)$ (25,310)$
Net Patient Services Revenue 205,003$ 210,340$ 218,459$ 231,954$ 239,621$ 247,131$ 255,244$ 292,123$ 310,611$ 329,036$
f. Other Operating Revenues - State Support 10,650$ 10,000$ 10,000$ 10,000$ 10,000$ 10,000$ 10,000$ 3,333$ 3,333$ -$ f. Other Operating Revenues - County Support 10,650$ 12,165$ 8,988$ 6,516$ 6,516$ 6,516$ 6,516$ 3,333$ 3,333$ -$ f. Other Operating Revenues 5,939$ 6,092$ 7,134$ 7,195$ 7,257$ 7,319$ 7,257$ 7,319$ 7,382$ 7,445$
NET OPERATING REVENUE 232,242$ 238,597$ 244,581$ 255,665$ 263,394$ 270,965$ 279,017$ 306,108$ 324,659$ 336,481$
2. EXPENSES a. Salaries & Wages (including benefits) 133,564$ 133,828$ 127,822$ 128,335$ 127,418$ 126,375$ 129,100$ 135,559$ 143,285$ 151,867$ b. Contractual Services 30,498$ 35,391$ 31,407$ 32,421$ 33,306$ 34,482$ 35,270$ 38,860$ 41,030$ 43,250$ c. Interest on Current Debt 1,816$ 970$ 103$ 246$ 232$ 225$ 220$ d. Interest on Project Debt 14,425$ 13,080$ 12,241$ e. Current Depreciation 6,567$ 7,893$ 9,056$ 10,511$ 11,965$ 12,333$ 13,762$ f. Project Depreciation 25,930$ 26,430$ 27,073$ g. Current Amortization 41$ -$ -$ -$ -$ -$ -$ h. Project Amortization 138$ 138$ 138$ i. Supplies 33,702$ 31,619$ 35,988$ 37,586$ 38,545$ 39,726$ 41,861$ 44,195$ 46,722$ 49,307$ j. Other Expenses - Physician Support 23,855$ 28,326$ 32,717$ 37,155$ 40,039$ 41,475$ 40,106$ 40,408$ 42,074$ 44,215$ j. Other Expenses - Transition Costs -$ -$ -$ -$ -$ -$ 2,200$ 800$ -$ -$j. Other Expenses - UMMS Overhead Allocation -$ -$ -$ -$ -$ -$ -$ 3,000$ 3,075$ 3,152$
j. Other Expenses - Utilities 1,184$ 2,932$ 2,896$ 2,964$ 2,981$ 2,999$ 3,067$ 3,238$ 3,423$ 3,612$
TOTAL OPERATING EXPENSES 231,226$ 240,958$ 239,990$ 249,217$ 254,486$ 257,615$ 265,584$ 306,553$ 319,256$ 334,854$
3. INCOME
a. Income From Operation 1,016$ (2,361)$ 4,591$ 6,448$ 8,907$ 13,351$ 13,433$ (444)$ 5,403$ 1,627$
b. Non-Operating Income 12$ 24$ 24$ 25$ 25$ 25$ 25$ 38$ 26$ 26$
SUBTOTAL 1,028$ (2,337)$ 4,616$ 6,473$ 8,932$ 13,376$ 13,458$ (406)$ 5,429$ 1,653$
c. Income Taxes
NET INCOME (LOSS) 1,028$ (2,337)$ 4,616$ 6,473$ 8,932$ 13,376$ 13,458$ (406)$ 5,429$ 1,653$
d. Depreciation and Amortization 6,608$ 7,893$ 9,056$ 10,511$ 11,965$ 12,333$ 13,762$ 26,068$ 26,568$ 27,211$
CASH FLOW FROM OPERATIONS 7,636$ 5,555$ 13,672$ 16,983$ 20,897$ 25,709$ 27,220$ 25,662$ 31,997$ 28,864$
Note (1): Since the Hospital signed a Global Budget Revenue Agreement, patient revenues are projected in total for FY2014 - FY2022.
TABLE H1 (REVISED). REVENUES & EXPENSES, INFLATED - ENTIRE FACILITYINSTRUCTION : Complete this table for the entire facility, including the proposed project. Table H should reflect inflation. Projected revenues and expenses should be consistent with the projections inTable F. Indicate on the table if the reporting period is Calendar Year (CY) or Fiscal Year (FY). In an attachment to the application, provide an explanation or basis for the projections and specify allassumptions used. Applicants must explain why the assumptions are reasonable. See additional instruction in the column to the right of the table.
Two Most Recent Years(Actual) Projected Years (ending five years after completion) Add columns if needed.
TABLE H1 (REVISED). REVENUES EXPENSES, INFLATED - ENTIRE FACILITY

Current YearProjected
Indicate CY or FY FY 2013 FY 2014 FY 2015 FY 2016 FY 2017 FY 2018 FY 2019 FY 2020 FY 2021 FY 2022
TABLE H1 (REVISED). REVENUES & EXPENSES, INFLATED - ENTIRE FACILITYINSTRUCTION : Complete this table for the entire facility, including the proposed project. Table H should reflect inflation. Projected revenues and expenses should be consistent with the projections inTable F. Indicate on the table if the reporting period is Calendar Year (CY) or Fiscal Year (FY). In an attachment to the application, provide an explanation or basis for the projections and specify allassumptions used. Applicants must explain why the assumptions are reasonable. See additional instruction in the column to the right of the table.
Two Most Recent Years(Actual) Projected Years (ending five years after completion) Add columns if needed.
4. PATIENT MIXa. Percent of Total Revenue 1) Medicare 27.2% 25.5% 25.5% 25.5% 25.5% 25.5% 25.5% 27.6% 28.6% 29.5% 2) Medicaid 32.4% 36.5% 36.5% 36.5% 36.5% 36.5% 36.5% 33.4% 32.0% 30.6% 3) Blue Cross 10.6% 9.9% 9.9% 9.9% 9.9% 9.9% 9.9% 9.0% 8.7% 8.3% 4) Commercial Insurance 16.7% 16.0% 16.0% 16.0% 16.0% 16.0% 16.0% 18.9% 20.2% 21.5% 5) Self-pay 11.5% 10.8% 10.8% 10.8% 10.8% 10.8% 10.8% 9.9% 9.4% 9.0% 6) Other 1.6% 1.3% 1.3% 1.3% 1.3% 1.3% 1.3% 1.2% 1.1% 1.1%TOTAL 100.0% 100.0% 100.0% 100.0% 100.0% 100.0% 100.0% 100.0% 100.0% 100.0%b. Percent of Equivalent Inpatient Days 1) Medicare 27.1% 25.9% 25.9% 25.9% 25.9% 25.9% 25.9% 29.4% 30.9% 32.3% 2) Medicaid 43.2% 41.6% 41.6% 41.6% 41.6% 41.6% 41.6% 35.5% 32.8% 30.6% 3) Blue Cross 9.1% 9.0% 9.0% 9.0% 9.0% 9.0% 9.0% 7.7% 7.1% 6.6% 4) Commercial Insurance 11.4% 10.8% 10.8% 10.8% 10.8% 10.8% 10.8% 16.5% 19.0% 21.2% 5) Self-pay 8.1% 11.8% 11.8% 11.8% 11.8% 11.8% 11.8% 10.0% 9.3% 8.7% 6) Other 1.2% 1.0% 1.0% 1.0% 1.0% 1.0% 1.0% 0.9% 0.8% 0.8%TOTAL 100.0% 100.0% 100.0% 100.0% 100.0% 100.0% 100.0% 100.0% 100.0% 100.0%
TABLE H1 (REVISED). REVENUES EXPENSES, INFLATED - ENTIRE FACILITY

Prince George's Hospital CenterGBR Revenue Projection - Inflated
FY2015 - FY2022
ProjectedBudget New Hosp.2015 2016 2017 2018 2019 2020 2021 2022
Prior Year GBR Cap 268,691$ 280,515$ 289,675$ 298,817$ 308,810$ 347,587$ 366,476$
Update Factor % 2.30% 2.30% 2.30% 2.30% 2.30% 2.30% 2.30%
Population % 0.31% 0.31% 0.31% 0.31% 0.31% 0.31% 0.31%
Subtotal 264,469$ 275,704 287,837 297,236 306,616 316,870 356,660 376,041
Adjustment to FY15 GBR % 1.60%Adjustment to FY15 GBR $ 4,222
Market Share Adjustment % 0.00% 1.75% 0.64% 0.53% 0.72% 2.91% 2.75% 2.61%Market Share Adjustment $ - 4,812 1,838 1,581 2,194 9,230 9,817 9,810
Capital Rate Adjustment % - 0.0% 0.0% 0.0% 0.0% 7.0% 0.0% 0.0%Capital Rate Adjustment $ - - - - - 21,488 - -
Current Year GBR Cap 268,691$ 280,515$ 289,675$ 298,817$ 308,810$ 347,587$ 366,476$ 385,852$
H.1 GBR INFLATED

Prince George's Hospital Center & Prince George's Regional Medical CenterKey Financial Projection Assumptions
1) Basis of Projection Based on the FY 2015 budget with adjustments identified below
2) Volumes
– Inpatient Discharges
Interim Period (FY2016-FY2019) Average annual increase of 1% per year from 11,596 in FY2015 to 12,081 in FY2019 driven by the execution of Dimension's Cardiovascular Business Plan.
New Hospital (FY2020-FY2022)
• MSGA 34.5% increase from FY2020 to FY2022 driven by growth in population, relocation, and recapture of market share
• Peds Immaterial change in projected admissions due to limited population growth and no assumed change in use rates and market share
• Psychiatry 2% increase from FY2020 to FY2022 driven by population growth
• Obstetrics Decrease by approximately 7% from FY2020 to FY2022 driven by reduction in population and use rate of age cohort
– Inpatient Length of Stay
MSGA To achieve Statewide historical averages, Ages 15-64 will decrease by 15% to 4.47, while Ages 65-74 and Ages 75+ will decrease by 23% to 5.24 and 5.00, respectivley, by FY2022
Peds Remains constant at 2.63 days from 2015 budget
Psychiatry Increases to the Statewide average of 5.8 by FY2018 and then remains constant through FY2022
Obstetrics Remains constant at 2.65 days from 2015 budget
– Outpatient Visits, including Observation Remains constant from FY2015 to FY209 and then increases by the same percentage as the annaul increase in total inpatient discharges in FY 2020 - FY 2022
3) Patient Revenue
– Gross Charges
Update Factor
• Annual Inflation 2.30% annual increase
• Capital related rate incrcrease 7.0% or $21.5 increase effective the opening of new hospital in July 2019 (FY2020)
Population Adjustment 0.31% annual increase
Market Share Adjustment
• Interim Period (FY2016-FY2019) 50% variability with projected growth in volumes related to the Cardiovascular Business Plan. Revenue is recognized in the year after volume growth.
• New Hospital (FY2020-FY2022) 50% variability with projected growth in volumes related to recaptured market share. Revenue is recognized immediately / in the year of volume growth.
GBR Adjustment $4.2M is shifted in FY2015 within Dimensions Healthcare System's GBR from LRH to PGHC
Case Mix No governor on changes in case mix
– Revenue Deductions
Contractual Allowances
• Interim Period (FY2016-FY2019) Decline by 1.07% of gross revenue in FY2016 due to improved collections as a result of an increase in the EMTALA charge required of Medicaid even on denied claims
• New Hospital (FY2020-FY2022) Declines by 0.9% of gross revenue as the relocation of the hospital and recapture of market share will change the payor mix to reflect more Medicare and Commercial patients
Charity Care Declines by 0.6% of gross revenue as the relocation of the hospital and recapture of market share will change the payor mix to reflect more Medicare and Commercial patients
Allowance for Bad Debt Declines by 1.3% of gross revenue as the relocation of the hospital and recapture of market share will change the payor mix to reflect more Medicare and Commercial patients
UCC Pool Payment
• Interim Period (FY2016-FY2019) Increase by 0.28% of gross revenue by FY2017 to reflect increase in three year average of Bad Debts and Charity in FY2012 - FY2014
• New Hospital (FY2020-FY2022) Reduction by 6.7% of gross revenue by FY2020 to reflect reduction in three year average of Bad Debts and Charity in FY2017 - FY2019
H.1 ASSUMPTIONS--INFLATED
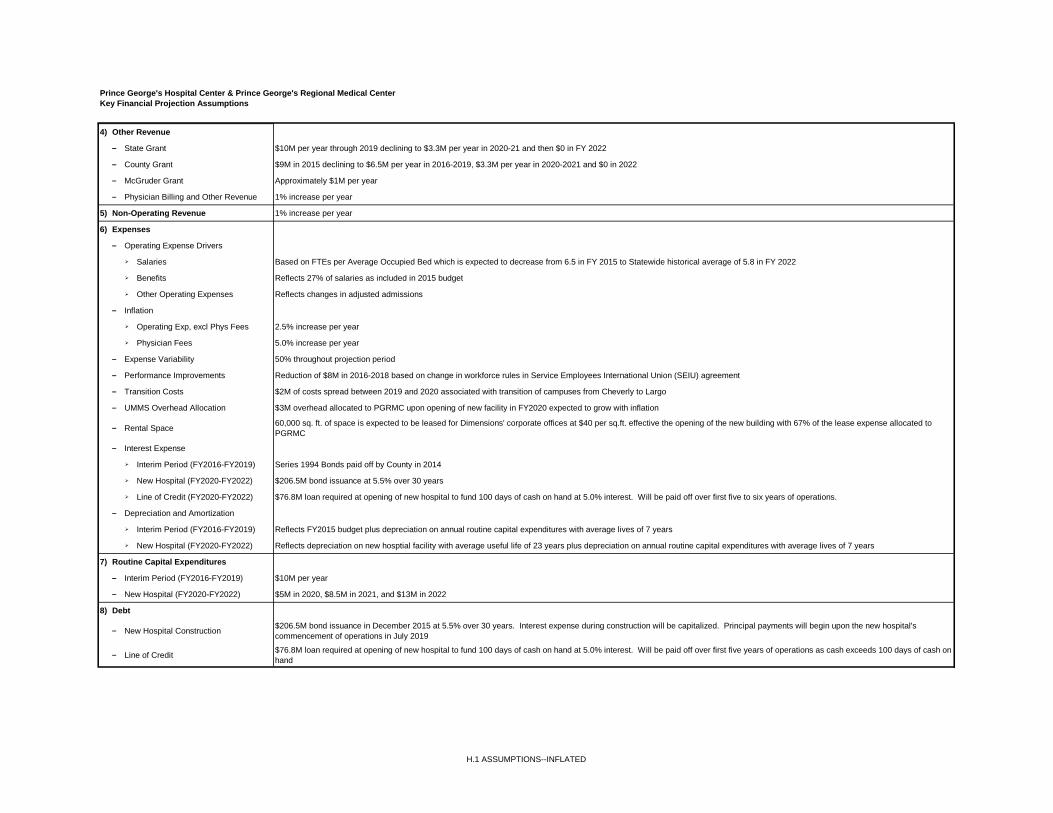
Prince George's Hospital Center & Prince George's Regional Medical CenterKey Financial Projection Assumptions
4) Other Revenue
– State Grant $10M per year through 2019 declining to $3.3M per year in 2020-21 and then $0 in FY 2022
– County Grant $9M in 2015 declining to $6.5M per year in 2016-2019, $3.3M per year in 2020-2021 and $0 in 2022
– McGruder Grant Approximately $1M per year
– Physician Billing and Other Revenue 1% increase per year
5) Non-Operating Revenue 1% increase per year
6) Expenses
– Operating Expense Drivers
Salaries Based on FTEs per Average Occupied Bed which is expected to decrease from 6.5 in FY 2015 to Statewide historical average of 5.8 in FY 2022
Benefits Reflects 27% of salaries as included in 2015 budget
Other Operating Expenses Reflects changes in adjusted admissions
– Inflation
Operating Exp, excl Phys Fees 2.5% increase per year
Physician Fees 5.0% increase per year
– Expense Variability 50% throughout projection period
– Performance Improvements Reduction of $8M in 2016-2018 based on change in workforce rules in Service Employees International Union (SEIU) agreement
– Transition Costs $2M of costs spread between 2019 and 2020 associated with transition of campuses from Cheverly to Largo
– UMMS Overhead Allocation $3M overhead allocated to PGRMC upon opening of new facility in FY2020 expected to grow with inflation
– Rental Space 60,000 sq. ft. of space is expected to be leased for Dimensions' corporate offices at $40 per sq.ft. effective the opening of the new building with 67% of the lease expense allocated toPGRMC
– Interest Expense
Interim Period (FY2016-FY2019) Series 1994 Bonds paid off by County in 2014
New Hospital (FY2020-FY2022) $206.5M bond issuance at 5.5% over 30 years
Line of Credit (FY2020-FY2022) $76.8M loan required at opening of new hospital to fund 100 days of cash on hand at 5.0% interest. Will be paid off over first five to six years of operations.
– Depreciation and Amortization
Interim Period (FY2016-FY2019) Reflects FY2015 budget plus depreciation on annual routine capital expenditures with average lives of 7 years
New Hospital (FY2020-FY2022) Reflects depreciation on new hosptial facility with average useful life of 23 years plus depreciation on annual routine capital expenditures with average lives of 7 years
7) Routine Capital Expenditures
– Interim Period (FY2016-FY2019) $10M per year
– New Hospital (FY2020-FY2022) $5M in 2020, $8.5M in 2021, and $13M in 2022
8) Debt
– New Hospital Construction $206.5M bond issuance in December 2015 at 5.5% over 30 years. Interest expense during construction will be capitalized. Principal payments will begin upon the new hospital'scommencement of operations in July 2019
– Line of Credit $76.8M loan required at opening of new hospital to fund 100 days of cash on hand at 5.0% interest. Will be paid off over first five years of operations as cash exceeds 100 days of cash onhand
H.1 ASSUMPTIONS--INFLATED

EXHIBIT 51
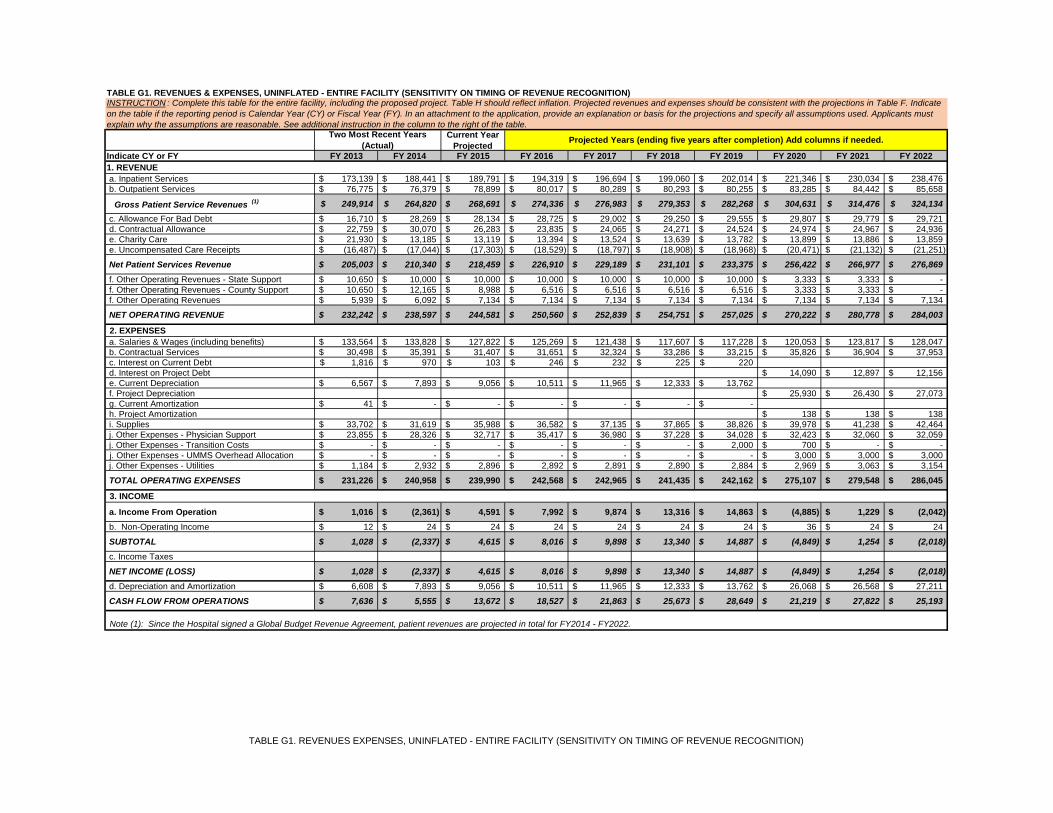
Current YearProjected
Indicate CY or FY FY 2013 FY 2014 FY 2015 FY 2016 FY 2017 FY 2018 FY 2019 FY 2020 FY 2021 FY 20221. REVENUE a. Inpatient Services 173,139$ 188,441$ 189,791$ 194,319$ 196,694$ 199,060$ 202,014$ 221,346$ 230,034$ 238,476$ b. Outpatient Services 76,775$ 76,379$ 78,899$ 80,017$ 80,289$ 80,293$ 80,255$ 83,285$ 84,442$ 85,658$
Gross Patient Service Revenues (1) 249,914$ 264,820$ 268,691$ 274,336$ 276,983$ 279,353$ 282,268$ 304,631$ 314,476$ 324,134$ c. Allowance For Bad Debt 16,710$ 28,269$ 28,134$ 28,725$ 29,002$ 29,250$ 29,555$ 29,807$ 29,779$ 29,721$ d. Contractual Allowance 22,759$ 30,070$ 26,283$ 23,835$ 24,065$ 24,271$ 24,524$ 24,974$ 24,967$ 24,936$ e. Charity Care 21,930$ 13,185$ 13,119$ 13,394$ 13,524$ 13,639$ 13,782$ 13,899$ 13,886$ 13,859$ e. Uncompensated Care Receipts (16,487)$ (17,044)$ (17,303)$ (18,529)$ (18,797)$ (18,908)$ (18,968)$ (20,471)$ (21,132)$ (21,251)$
Net Patient Services Revenue 205,003$ 210,340$ 218,459$ 226,910$ 229,189$ 231,101$ 233,375$ 256,422$ 266,977$ 276,869$ f. Other Operating Revenues - State Support 10,650$ 10,000$ 10,000$ 10,000$ 10,000$ 10,000$ 10,000$ 3,333$ 3,333$ -$ f. Other Operating Revenues - County Support 10,650$ 12,165$ 8,988$ 6,516$ 6,516$ 6,516$ 6,516$ 3,333$ 3,333$ -$ f. Other Operating Revenues 5,939$ 6,092$ 7,134$ 7,134$ 7,134$ 7,134$ 7,134$ 7,134$ 7,134$ 7,134$
NET OPERATING REVENUE 232,242$ 238,597$ 244,581$ 250,560$ 252,839$ 254,751$ 257,025$ 270,222$ 280,778$ 284,003$
2. EXPENSES a. Salaries & Wages (including benefits) 133,564$ 133,828$ 127,822$ 125,269$ 121,438$ 117,607$ 117,228$ 120,053$ 123,817$ 128,047$ b. Contractual Services 30,498$ 35,391$ 31,407$ 31,651$ 32,324$ 33,286$ 33,215$ 35,826$ 36,904$ 37,953$ c. Interest on Current Debt 1,816$ 970$ 103$ 246$ 232$ 225$ 220$ d. Interest on Project Debt 14,090$ 12,897$ 12,156$ e. Current Depreciation 6,567$ 7,893$ 9,056$ 10,511$ 11,965$ 12,333$ 13,762$ f. Project Depreciation 25,930$ 26,430$ 27,073$ g. Current Amortization 41$ -$ -$ -$ -$ -$ -$ h. Project Amortization 138$ 138$ 138$ i. Supplies 33,702$ 31,619$ 35,988$ 36,582$ 37,135$ 37,865$ 38,826$ 39,978$ 41,238$ 42,464$ j. Other Expenses - Physician Support 23,855$ 28,326$ 32,717$ 35,417$ 36,980$ 37,228$ 34,028$ 32,423$ 32,060$ 32,059$ j. Other Expenses - Transition Costs -$ -$ -$ -$ -$ -$ 2,000$ 700$ -$ -$j. Other Expenses - UMMS Overhead Allocation -$ -$ -$ -$ -$ -$ -$ 3,000$ 3,000$ 3,000$
j. Other Expenses - Utilities 1,184$ 2,932$ 2,896$ 2,892$ 2,891$ 2,890$ 2,884$ 2,969$ 3,063$ 3,154$
TOTAL OPERATING EXPENSES 231,226$ 240,958$ 239,990$ 242,568$ 242,965$ 241,435$ 242,162$ 275,107$ 279,548$ 286,045$
3. INCOME
a. Income From Operation 1,016$ (2,361)$ 4,591$ 7,992$ 9,874$ 13,316$ 14,863$ (4,885)$ 1,229$ (2,042)$ b. Non-Operating Income 12$ 24$ 24$ 24$ 24$ 24$ 24$ 36$ 24$ 24$
SUBTOTAL 1,028$ (2,337)$ 4,615$ 8,016$ 9,898$ 13,340$ 14,887$ (4,849)$ 1,254$ (2,018)$ c. Income Taxes
NET INCOME (LOSS) 1,028$ (2,337)$ 4,615$ 8,016$ 9,898$ 13,340$ 14,887$ (4,849)$ 1,254$ (2,018)$ d. Depreciation and Amortization 6,608$ 7,893$ 9,056$ 10,511$ 11,965$ 12,333$ 13,762$ 26,068$ 26,568$ 27,211$
CASH FLOW FROM OPERATIONS 7,636$ 5,555$ 13,672$ 18,527$ 21,863$ 25,673$ 28,649$ 21,219$ 27,822$ 25,193$
Note (1): Since the Hospital signed a Global Budget Revenue Agreement, patient revenues are projected in total for FY2014 - FY2022.
TABLE G1. REVENUES & EXPENSES, UNINFLATED - ENTIRE FACILITY (SENSITIVITY ON TIMING OF REVENUE RECOGNITION)INSTRUCTION : Complete this table for the entire facility, including the proposed project. Table H should reflect inflation. Projected revenues and expenses should be consistent with the projections in Table F. Indicateon the table if the reporting period is Calendar Year (CY) or Fiscal Year (FY). In an attachment to the application, provide an explanation or basis for the projections and specify all assumptions used. Applicants mustexplain why the assumptions are reasonable. See additional instruction in the column to the right of the table.
Two Most Recent Years(Actual) Projected Years (ending five years after completion) Add columns if needed.
TABLE G1. REVENUES EXPENSES, UNINFLATED - ENTIRE FACILITY (SENSITIVITY ON TIMING OF REVENUE RECOGNITION)
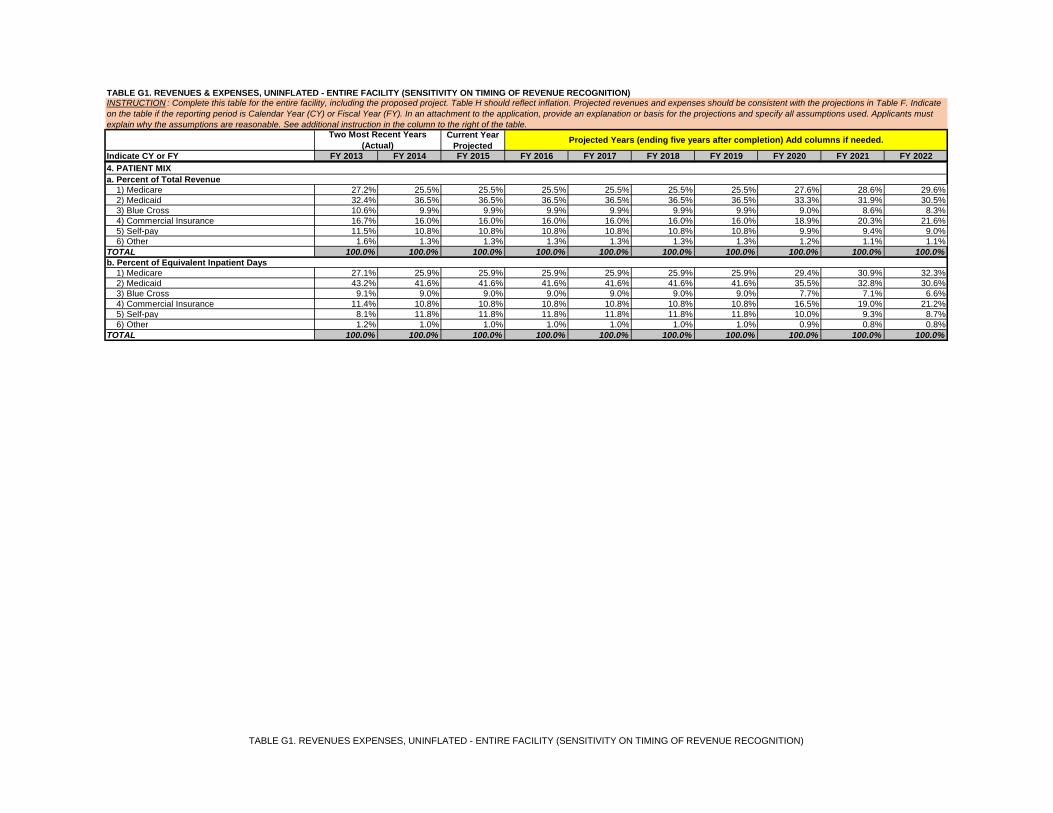
Current YearProjected
Indicate CY or FY FY 2013 FY 2014 FY 2015 FY 2016 FY 2017 FY 2018 FY 2019 FY 2020 FY 2021 FY 2022
TABLE G1. REVENUES & EXPENSES, UNINFLATED - ENTIRE FACILITY (SENSITIVITY ON TIMING OF REVENUE RECOGNITION)INSTRUCTION : Complete this table for the entire facility, including the proposed project. Table H should reflect inflation. Projected revenues and expenses should be consistent with the projections in Table F. Indicateon the table if the reporting period is Calendar Year (CY) or Fiscal Year (FY). In an attachment to the application, provide an explanation or basis for the projections and specify all assumptions used. Applicants mustexplain why the assumptions are reasonable. See additional instruction in the column to the right of the table.
Two Most Recent Years(Actual) Projected Years (ending five years after completion) Add columns if needed.
4. PATIENT MIXa. Percent of Total Revenue 1) Medicare 27.2% 25.5% 25.5% 25.5% 25.5% 25.5% 25.5% 27.6% 28.6% 29.6% 2) Medicaid 32.4% 36.5% 36.5% 36.5% 36.5% 36.5% 36.5% 33.3% 31.9% 30.5% 3) Blue Cross 10.6% 9.9% 9.9% 9.9% 9.9% 9.9% 9.9% 9.0% 8.6% 8.3% 4) Commercial Insurance 16.7% 16.0% 16.0% 16.0% 16.0% 16.0% 16.0% 18.9% 20.3% 21.6% 5) Self-pay 11.5% 10.8% 10.8% 10.8% 10.8% 10.8% 10.8% 9.9% 9.4% 9.0% 6) Other 1.6% 1.3% 1.3% 1.3% 1.3% 1.3% 1.3% 1.2% 1.1% 1.1%TOTAL 100.0% 100.0% 100.0% 100.0% 100.0% 100.0% 100.0% 100.0% 100.0% 100.0%b. Percent of Equivalent Inpatient Days 1) Medicare 27.1% 25.9% 25.9% 25.9% 25.9% 25.9% 25.9% 29.4% 30.9% 32.3% 2) Medicaid 43.2% 41.6% 41.6% 41.6% 41.6% 41.6% 41.6% 35.5% 32.8% 30.6% 3) Blue Cross 9.1% 9.0% 9.0% 9.0% 9.0% 9.0% 9.0% 7.7% 7.1% 6.6% 4) Commercial Insurance 11.4% 10.8% 10.8% 10.8% 10.8% 10.8% 10.8% 16.5% 19.0% 21.2% 5) Self-pay 8.1% 11.8% 11.8% 11.8% 11.8% 11.8% 11.8% 10.0% 9.3% 8.7% 6) Other 1.2% 1.0% 1.0% 1.0% 1.0% 1.0% 1.0% 0.9% 0.8% 0.8%TOTAL 100.0% 100.0% 100.0% 100.0% 100.0% 100.0% 100.0% 100.0% 100.0% 100.0%
TABLE G1. REVENUES EXPENSES, UNINFLATED - ENTIRE FACILITY (SENSITIVITY ON TIMING OF REVENUE RECOGNITION)

Prince George's Hospital CenterGBR Revenue Projection - Uninflated Sensitivity
FY2015 - FY2022
ProjectedBudget New Hosp.2015 2016 2017 2018 2019 2020 2021 2022
Prior Year GBR Cap 268,691$ 274,336$ 276,983$ 279,353$ 282,268$ 304,631$ 314,476$
Update Factor % 0.00% 0.00% 0.00% 0.00% 0.00% 0.00% 0.00%
Population % 0.31% 0.31% 0.31% 0.31% 0.31% 0.31% 0.31%
Subtotal 264,469$ 269,524 275,186 277,842 280,219 283,143 305,576 315,451
Adjustment to FY15 GBR % 1.60%Adjustment to FY15 GBR $ 4,222
Market Share Adjustment % 0.00% 1.79% 0.65% 0.54% 0.73% 0.00% 2.91% 2.75%Market Share Adjustment $ - 4,812 1,797 1,511 2,050 - 8,901 8,683
Capital Rate Adjustment % - 0.0% 0.0% 0.0% 0.0% 7.6% 0.0% 0.0%Capital Rate Adjustment $ - - - - - 21,488 - -
Current Year GBR Cap 268,691$ 274,336$ 276,983$ 279,353$ 282,268$ 304,631$ 314,476$ 324,134$
G1. GBR REVENUE PROJECTION--UNINFLATED SENSITIVITYFY2015-FY2022
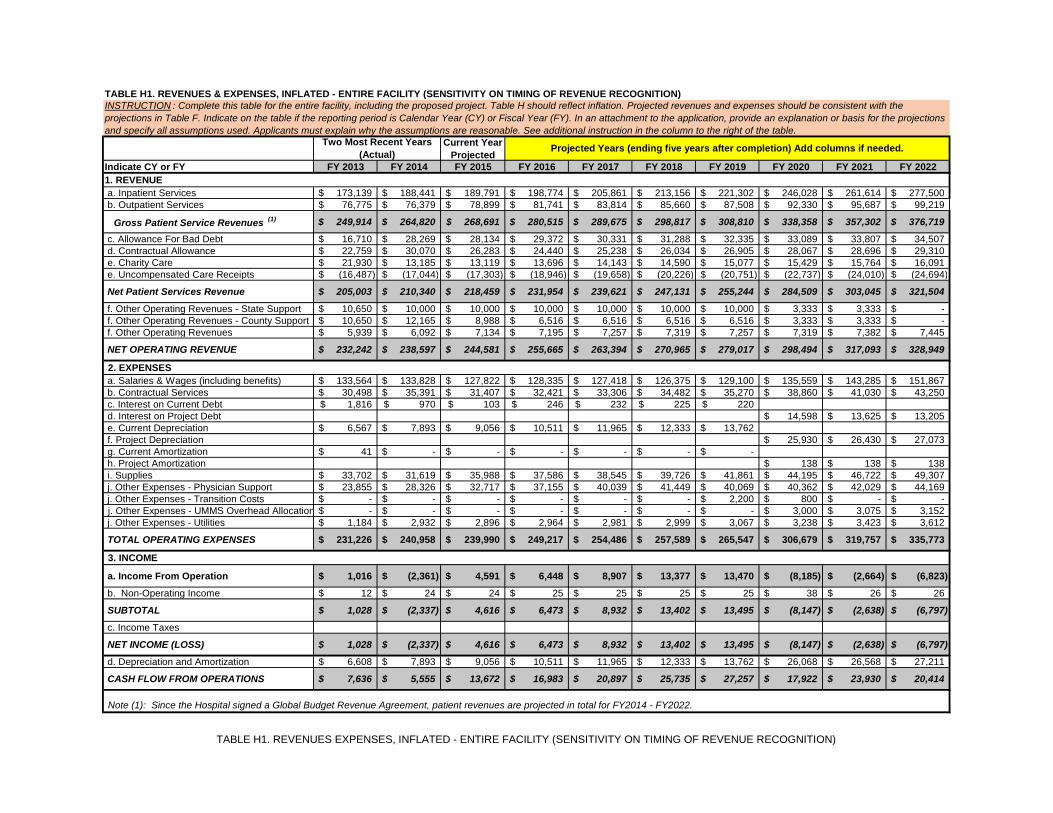
Current YearProjected
Indicate CY or FY FY 2013 FY 2014 FY 2015 FY 2016 FY 2017 FY 2018 FY 2019 FY 2020 FY 2021 FY 20221. REVENUE a. Inpatient Services 173,139$ 188,441$ 189,791$ 198,774$ 205,861$ 213,156$ 221,302$ 246,028$ 261,614$ 277,500$ b. Outpatient Services 76,775$ 76,379$ 78,899$ 81,741$ 83,814$ 85,660$ 87,508$ 92,330$ 95,687$ 99,219$
Gross Patient Service Revenues (1) 249,914$ 264,820$ 268,691$ 280,515$ 289,675$ 298,817$ 308,810$ 338,358$ 357,302$ 376,719$
c. Allowance For Bad Debt 16,710$ 28,269$ 28,134$ 29,372$ 30,331$ 31,288$ 32,335$ 33,089$ 33,807$ 34,507$ d. Contractual Allowance 22,759$ 30,070$ 26,283$ 24,440$ 25,238$ 26,034$ 26,905$ 28,067$ 28,696$ 29,310$ e. Charity Care 21,930$ 13,185$ 13,119$ 13,696$ 14,143$ 14,590$ 15,077$ 15,429$ 15,764$ 16,091$ e. Uncompensated Care Receipts (16,487)$ (17,044)$ (17,303)$ (18,946)$ (19,658)$ (20,226)$ (20,751)$ (22,737)$ (24,010)$ (24,694)$
Net Patient Services Revenue 205,003$ 210,340$ 218,459$ 231,954$ 239,621$ 247,131$ 255,244$ 284,509$ 303,045$ 321,504$
f. Other Operating Revenues - State Support 10,650$ 10,000$ 10,000$ 10,000$ 10,000$ 10,000$ 10,000$ 3,333$ 3,333$ -$ f. Other Operating Revenues - County Support 10,650$ 12,165$ 8,988$ 6,516$ 6,516$ 6,516$ 6,516$ 3,333$ 3,333$ -$ f. Other Operating Revenues 5,939$ 6,092$ 7,134$ 7,195$ 7,257$ 7,319$ 7,257$ 7,319$ 7,382$ 7,445$
NET OPERATING REVENUE 232,242$ 238,597$ 244,581$ 255,665$ 263,394$ 270,965$ 279,017$ 298,494$ 317,093$ 328,949$
2. EXPENSES a. Salaries & Wages (including benefits) 133,564$ 133,828$ 127,822$ 128,335$ 127,418$ 126,375$ 129,100$ 135,559$ 143,285$ 151,867$ b. Contractual Services 30,498$ 35,391$ 31,407$ 32,421$ 33,306$ 34,482$ 35,270$ 38,860$ 41,030$ 43,250$ c. Interest on Current Debt 1,816$ 970$ 103$ 246$ 232$ 225$ 220$ d. Interest on Project Debt 14,598$ 13,625$ 13,205$ e. Current Depreciation 6,567$ 7,893$ 9,056$ 10,511$ 11,965$ 12,333$ 13,762$ f. Project Depreciation 25,930$ 26,430$ 27,073$ g. Current Amortization 41$ -$ -$ -$ -$ -$ -$ h. Project Amortization 138$ 138$ 138$ i. Supplies 33,702$ 31,619$ 35,988$ 37,586$ 38,545$ 39,726$ 41,861$ 44,195$ 46,722$ 49,307$ j. Other Expenses - Physician Support 23,855$ 28,326$ 32,717$ 37,155$ 40,039$ 41,449$ 40,069$ 40,362$ 42,029$ 44,169$ j. Other Expenses - Transition Costs -$ -$ -$ -$ -$ -$ 2,200$ 800$ -$ -$j. Other Expenses - UMMS Overhead Allocation -$ -$ -$ -$ -$ -$ -$ 3,000$ 3,075$ 3,152$
j. Other Expenses - Utilities 1,184$ 2,932$ 2,896$ 2,964$ 2,981$ 2,999$ 3,067$ 3,238$ 3,423$ 3,612$
TOTAL OPERATING EXPENSES 231,226$ 240,958$ 239,990$ 249,217$ 254,486$ 257,589$ 265,547$ 306,679$ 319,757$ 335,773$
3. INCOME
a. Income From Operation 1,016$ (2,361)$ 4,591$ 6,448$ 8,907$ 13,377$ 13,470$ (8,185)$ (2,664)$ (6,823)$
b. Non-Operating Income 12$ 24$ 24$ 25$ 25$ 25$ 25$ 38$ 26$ 26$
SUBTOTAL 1,028$ (2,337)$ 4,616$ 6,473$ 8,932$ 13,402$ 13,495$ (8,147)$ (2,638)$ (6,797)$
c. Income Taxes
NET INCOME (LOSS) 1,028$ (2,337)$ 4,616$ 6,473$ 8,932$ 13,402$ 13,495$ (8,147)$ (2,638)$ (6,797)$
d. Depreciation and Amortization 6,608$ 7,893$ 9,056$ 10,511$ 11,965$ 12,333$ 13,762$ 26,068$ 26,568$ 27,211$
CASH FLOW FROM OPERATIONS 7,636$ 5,555$ 13,672$ 16,983$ 20,897$ 25,735$ 27,257$ 17,922$ 23,930$ 20,414$
Note (1): Since the Hospital signed a Global Budget Revenue Agreement, patient revenues are projected in total for FY2014 - FY2022.
TABLE H1. REVENUES & EXPENSES, INFLATED - ENTIRE FACILITY (SENSITIVITY ON TIMING OF REVENUE RECOGNITION)INSTRUCTION : Complete this table for the entire facility, including the proposed project. Table H should reflect inflation. Projected revenues and expenses should be consistent with theprojections in Table F. Indicate on the table if the reporting period is Calendar Year (CY) or Fiscal Year (FY). In an attachment to the application, provide an explanation or basis for the projectionsand specify all assumptions used. Applicants must explain why the assumptions are reasonable. See additional instruction in the column to the right of the table.
Two Most Recent Years(Actual) Projected Years (ending five years after completion) Add columns if needed.
TABLE H1. REVENUES EXPENSES, INFLATED - ENTIRE FACILITY (SENSITIVITY ON TIMING OF REVENUE RECOGNITION)

Current YearProjected
Indicate CY or FY FY 2013 FY 2014 FY 2015 FY 2016 FY 2017 FY 2018 FY 2019 FY 2020 FY 2021 FY 2022
TABLE H1. REVENUES & EXPENSES, INFLATED - ENTIRE FACILITY (SENSITIVITY ON TIMING OF REVENUE RECOGNITION)INSTRUCTION : Complete this table for the entire facility, including the proposed project. Table H should reflect inflation. Projected revenues and expenses should be consistent with theprojections in Table F. Indicate on the table if the reporting period is Calendar Year (CY) or Fiscal Year (FY). In an attachment to the application, provide an explanation or basis for the projectionsand specify all assumptions used. Applicants must explain why the assumptions are reasonable. See additional instruction in the column to the right of the table.
Two Most Recent Years(Actual) Projected Years (ending five years after completion) Add columns if needed.
4. PATIENT MIXa. Percent of Total Revenue 1) Medicare 27.2% 25.5% 25.5% 25.5% 25.5% 25.5% 25.5% 27.6% 28.6% 29.6% 2) Medicaid 32.4% 36.5% 36.5% 36.5% 36.5% 36.5% 36.5% 33.3% 31.8% 30.4% 3) Blue Cross 10.6% 9.9% 9.9% 9.9% 9.9% 9.9% 9.9% 9.0% 8.6% 8.2% 4) Commercial Insurance 16.7% 16.0% 16.0% 16.0% 16.0% 16.0% 16.0% 19.0% 20.3% 21.7% 5) Self-pay 11.5% 10.8% 10.8% 10.8% 10.8% 10.8% 10.8% 9.8% 9.4% 9.0% 6) Other 1.6% 1.3% 1.3% 1.3% 1.3% 1.3% 1.3% 1.2% 1.1% 1.1%TOTAL 100.0% 100.0% 100.0% 100.0% 100.0% 100.0% 100.0% 100.0% 100.0% 100.0%b. Percent of Equivalent Inpatient Days 1) Medicare 27.1% 25.9% 25.9% 25.9% 25.9% 25.9% 25.9% 29.4% 30.9% 32.3% 2) Medicaid 43.2% 41.6% 41.6% 41.6% 41.6% 41.6% 41.6% 35.5% 32.8% 30.6% 3) Blue Cross 9.1% 9.0% 9.0% 9.0% 9.0% 9.0% 9.0% 7.7% 7.1% 6.6% 4) Commercial Insurance 11.4% 10.8% 10.8% 10.8% 10.8% 10.8% 10.8% 16.5% 19.0% 21.2% 5) Self-pay 8.1% 11.8% 11.8% 11.8% 11.8% 11.8% 11.8% 10.0% 9.3% 8.7% 6) Other 1.2% 1.0% 1.0% 1.0% 1.0% 1.0% 1.0% 0.9% 0.8% 0.8%TOTAL 100.0% 100.0% 100.0% 100.0% 100.0% 100.0% 100.0% 100.0% 100.0% 100.0%
TABLE H1. REVENUES EXPENSES, INFLATED - ENTIRE FACILITY (SENSITIVITY ON TIMING OF REVENUE RECOGNITION)

Prince George's Hospital CenterGBR Revenue Projection - Inflated Sensitivity
FY2015 - FY2022
ProjectedBudget New Hosp.2015 2016 2017 2018 2019 2020 2021 2022
Prior Year GBR Cap 268,691$ 280,515$ 289,675$ 298,817$ 308,810$ 338,358$ 357,302$
Update Factor % 2.30% 2.30% 2.30% 2.30% 2.30% 2.30% 2.30%
Population % 0.31% 0.31% 0.31% 0.31% 0.31% 0.31% 0.31%
Subtotal 264,469$ 275,704 287,837 297,236 306,616 316,870 347,189 366,627
Adjustment to FY15 GBR % 1.60%Adjustment to FY15 GBR $ 4,222
Market Share Adjustment % 0.00% 1.75% 0.64% 0.53% 0.72% 0.00% 2.91% 2.75%Market Share Adjustment $ - 4,812 1,838 1,581 2,194 - 10,113 10,091Capital Rate Adjustment % - 0.0% 0.0% 0.0% 0.0% 7.0% 0.0% 0.0%Capital Rate Adjustment $ - - - - - 21,488 - -
Current Year GBR Cap 268,691$ 280,515$ 289,675$ 298,817$ 308,810$ 338,358$ 357,302$ 376,719$
H1. GBR REVENUE PROJECTION--INFLATED SENSITIVITYFY2015-FY2022

EXHIBIT 52


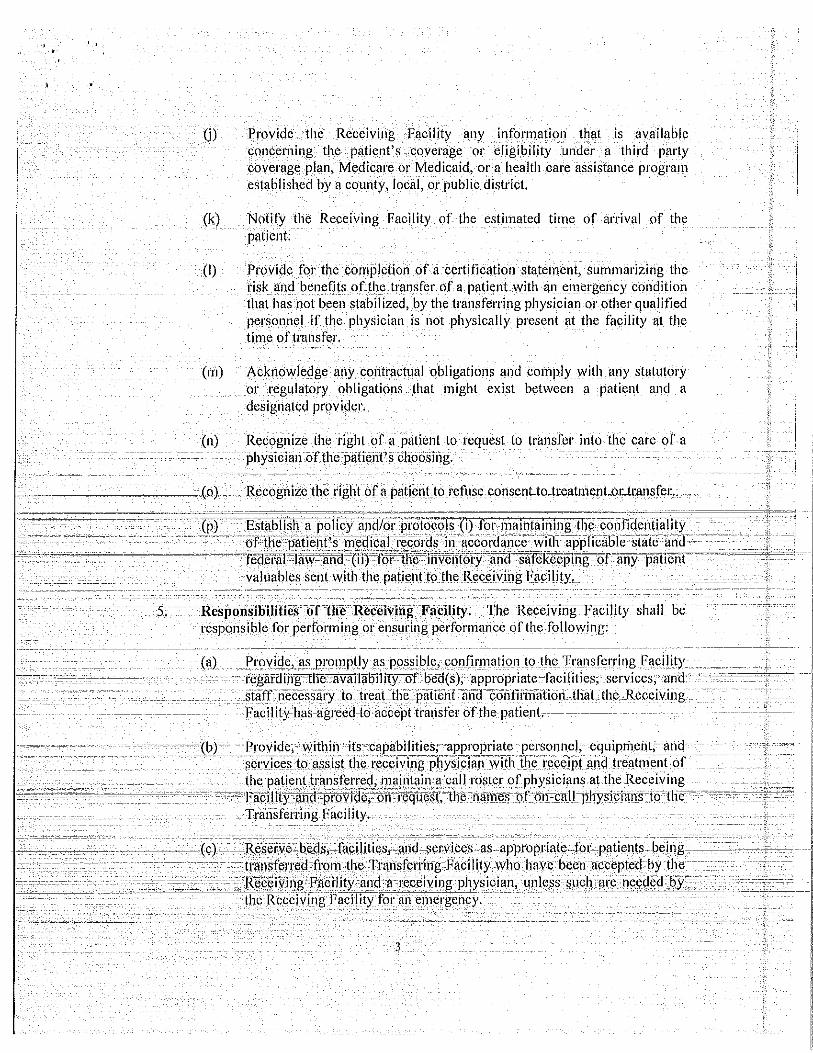


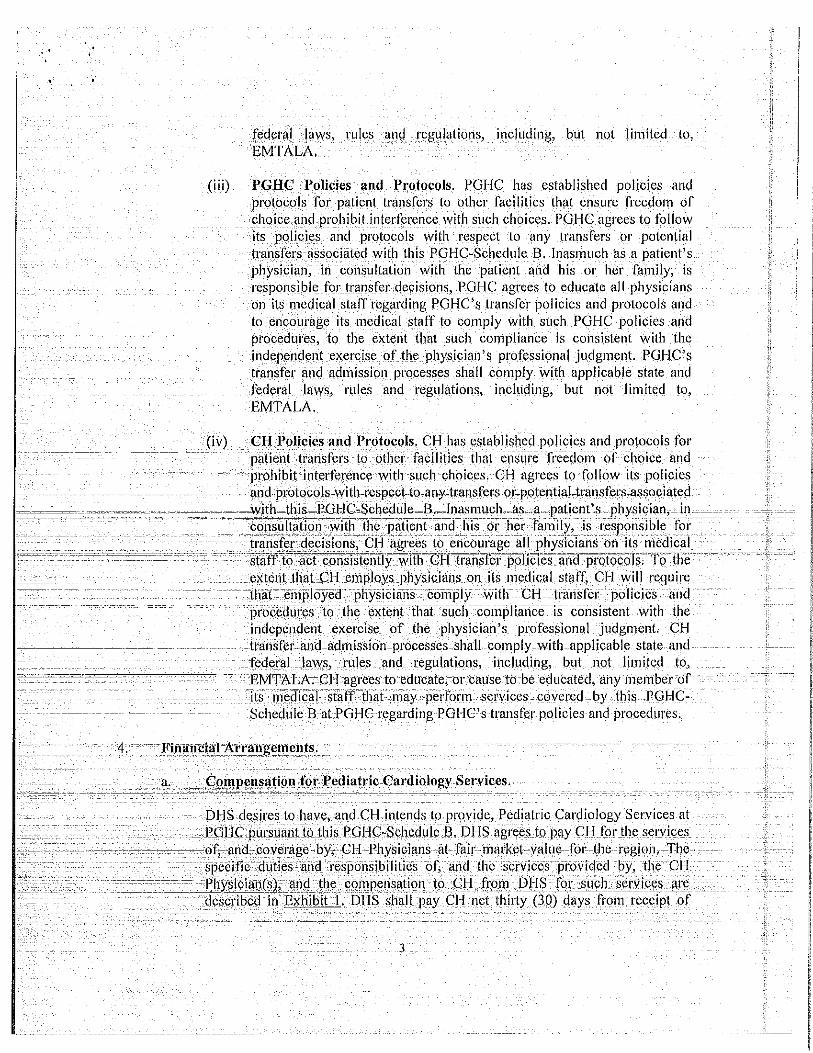


EXHIBIT 53
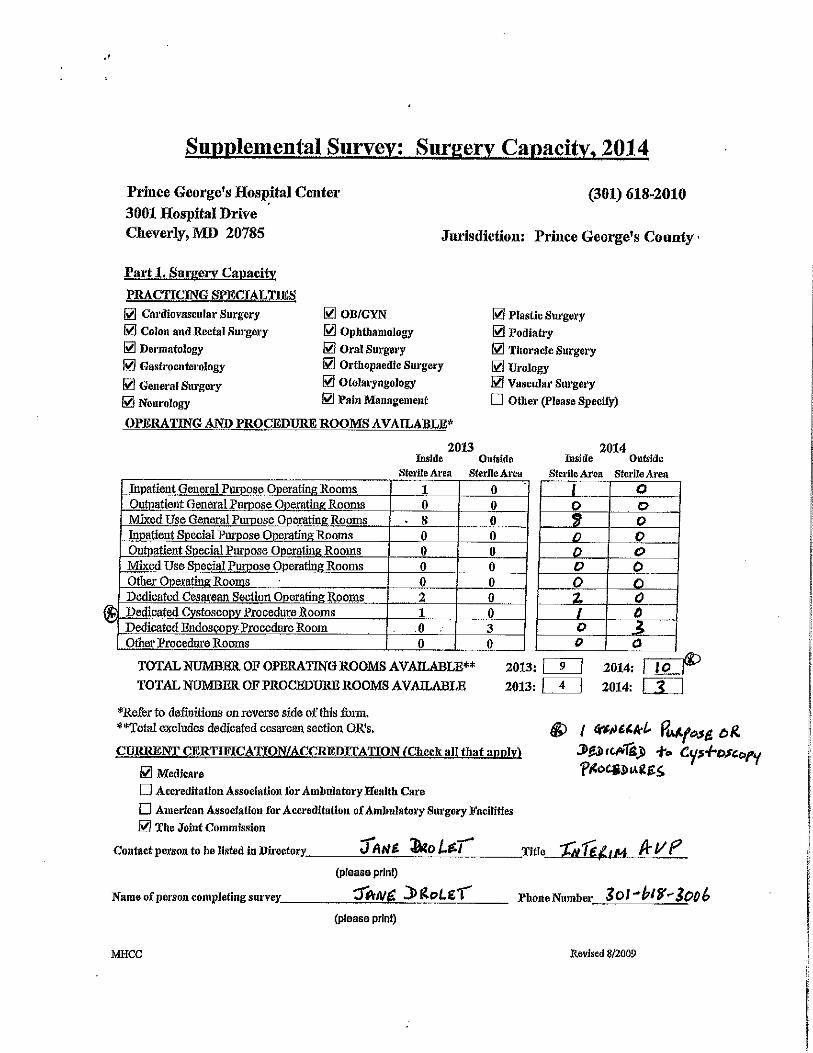
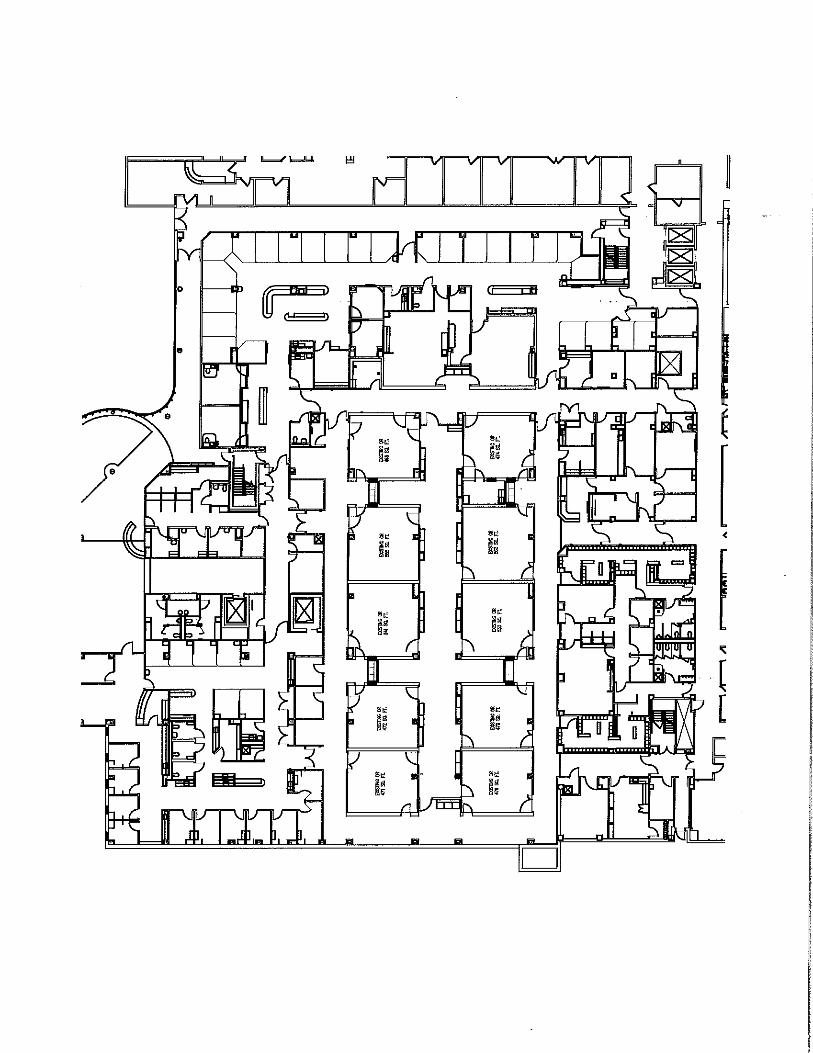

EXHIBIT 54


EXHIBIT 55


EXHIBIT 56

Alternate Volume Projections - MWPHCAGR 2009-2014 Use Rate Change: 0.03682
2009 2010 2011 2012 2013 2014 2015 2016 2017 2018 2019 2020 2021 2022 2023 2024 2025MD. Pop Age 0-4 363,360 364,490 366,523 368,568 370,624 372,691 374,770 376,743 378,727 380,721 382,725 384,740 385,850 386,962 386,962 386,962 386,962
Admissions 83 93 87 100 125 102 106 111 116 120 126 131 136 141 147 152 158Use Rate/1,000 0.228424 0.255151 0.237366 0.271321 0.337269 0.273685 0.283761 0.294209 0.305040 0.316271 0.327915 0.339988 0.352505 0.365483 0.378939 0.392891 0.407356
% Change Use Rate 12% -7% 14% 24% -19% 4% 4% 4% 4% 4% 4% 4% 4% 4% 4% 4%
Average ALOS: 24.31
ALOS 31.78 25.57 27.21 21.29 23.38 24.11 24.31 24.31 24.31 24.31 24.31 24.31 24.31 24.31 24.31 24.31 24.31
Pt. Days 2,638 2,378 2,367 2,129 2,923 2,459 2,585 2,695 2,808 2,927 3,051 3,180 3,306 3,438 3,565 3,696 3,832
Beds 15 15 15 15 15 15 15 15 15 15 15 15 15 15 15 15 15
% Occupancy 48.2% 43.4% 43.2% 38.9% 53.4% 44.9% 47.2% 49.2% 51.3% 53.5% 55.7% 58.1% 60.4% 62.8% 65.1% 67.5% 70.0%
Bed Need at 65% Occupancy 11.12 10.02 9.98 8.97 12.32 10.36 10.90 11.36 11.84 12.34 12.86 13.40 13.94 14.49 15.03 15.58 16.15
ALTERNATE VOLUME PROJECTIONS--MWPH

EXHIBIT 57
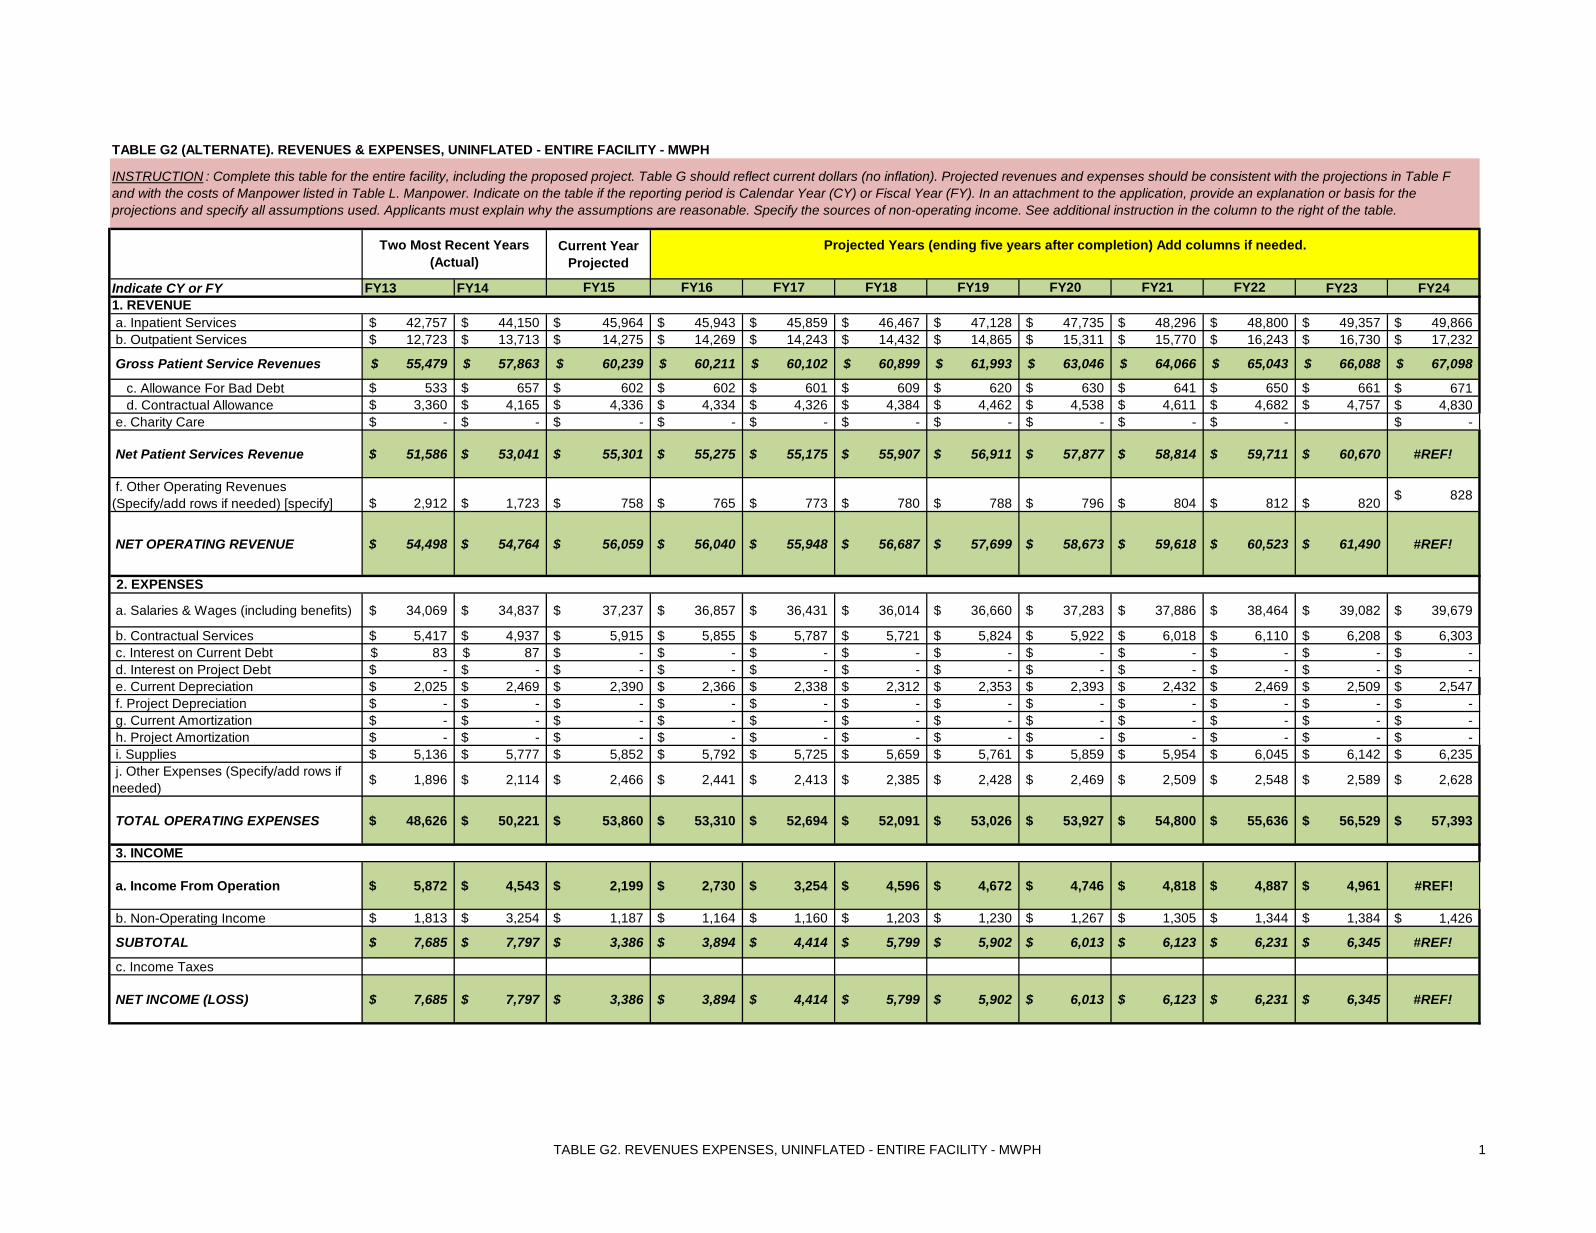
TABLE G2. REVENUES EXPENSES, UNINFLATED - ENTIRE FACILITY - MWPH 1
Current Year Projected
Indicate CY or FY FY13 FY14 FY15 FY16 FY17 FY18 FY19 FY20 FY21 FY22 FY23 FY24
a. Inpatient Services 42,757$ 44,150$ 45,964$ 45,943$ 45,859$ 46,467$ 47,128$ 47,735$ 48,296$ 48,800$ 49,357$ 49,866$ b. Outpatient Services 12,723$ 13,713$ 14,275$ 14,269$ 14,243$ 14,432$ 14,865$ 15,311$ 15,770$ 16,243$ 16,730$ 17,232$
Gross Patient Service Revenues 55,479$ 57,863$ 60,239$ 60,211$ 60,102$ 60,899$ 61,993$ 63,046$ 64,066$ 65,043$ 66,088$ 67,098$
c. Allowance For Bad Debt 533$ 657$ 602$ 602$ 601$ 609$ 620$ 630$ 641$ 650$ 661$ 671$ d. Contractual Allowance 3,360$ 4,165$ 4,336$ 4,334$ 4,326$ 4,384$ 4,462$ 4,538$ 4,611$ 4,682$ 4,757$ 4,830$
e. Charity Care -$ -$ -$ -$ -$ -$ -$ -$ -$ -$ -$
Net Patient Services Revenue 51,586$ 53,041$ 55,301$ 55,275$ 55,175$ 55,907$ 56,911$ 57,877$ 58,814$ 59,711$ 60,670$ #REF!
f. Other Operating Revenues (Specify/add rows if needed) [specify] 2,912$ 1,723$ 758$ 765$ 773$ 780$ 788$ 796$ 804$ 812$ 820$ 828$
NET OPERATING REVENUE 54,498$ 54,764$ 56,059$ 56,040$ 55,948$ 56,687$ 57,699$ 58,673$ 59,618$ 60,523$ 61,490$ #REF!
a. Salaries & Wages (including benefits) 34,069$ 34,837$ 37,237$ 36,857$ 36,431$ 36,014$ 36,660$ 37,283$ 37,886$ 38,464$ 39,082$ 39,679$
b. Contractual Services 5,417$ 4,937$ 5,915$ 5,855$ 5,787$ 5,721$ 5,824$ 5,922$ 6,018$ 6,110$ 6,208$ 6,303$ c. Interest on Current Debt 83$ 87$ -$ -$ -$ -$ -$ -$ -$ -$ -$ -$ d. Interest on Project Debt -$ -$ -$ -$ -$ -$ -$ -$ -$ -$ -$ -$ e. Current Depreciation 2,025$ 2,469$ 2,390$ 2,366$ 2,338$ 2,312$ 2,353$ 2,393$ 2,432$ 2,469$ 2,509$ 2,547$ f. Project Depreciation -$ -$ -$ -$ -$ -$ -$ -$ -$ -$ -$ -$ g. Current Amortization -$ -$ -$ -$ -$ -$ -$ -$ -$ -$ -$ -$ h. Project Amortization -$ -$ -$ -$ -$ -$ -$ -$ -$ -$ -$ -$ i. Supplies 5,136$ 5,777$ 5,852$ 5,792$ 5,725$ 5,659$ 5,761$ 5,859$ 5,954$ 6,045$ 6,142$ 6,235$ j. Other Expenses (Specify/add rows if needed) 1,896$ 2,114$ 2,466$ 2,441$ 2,413$ 2,385$ 2,428$ 2,469$ 2,509$ 2,548$ 2,589$ 2,628$
TOTAL OPERATING EXPENSES 48,626$ 50,221$ 53,860$ 53,310$ 52,694$ 52,091$ 53,026$ 53,927$ 54,800$ 55,636$ 56,529$ 57,393$
a. Income From Operation 5,872$ 4,543$ 2,199$ 2,730$ 3,254$ 4,596$ 4,672$ 4,746$ 4,818$ 4,887$ 4,961$ #REF!
b. Non-Operating Income 1,813$ 3,254$ 1,187$ 1,164$ 1,160$ 1,203$ 1,230$ 1,267$ 1,305$ 1,344$ 1,384$ 1,426$
SUBTOTAL 7,685$ 7,797$ 3,386$ 3,894$ 4,414$ 5,799$ 5,902$ 6,013$ 6,123$ 6,231$ 6,345$ #REF!
c. Income Taxes
NET INCOME (LOSS) 7,685$ 7,797$ 3,386$ 3,894$ 4,414$ 5,799$ 5,902$ 6,013$ 6,123$ 6,231$ 6,345$ #REF!
3. INCOME
TABLE G2 (ALTERNATE). REVENUES & EXPENSES, UNINFLATED - ENTIRE FACILITY - MWPH
INSTRUCTION : Complete this table for the entire facility, including the proposed project. Table G should reflect current dollars (no inflation). Projected revenues and expenses should be consistent with the projections in Table F and with the costs of Manpower listed in Table L. Manpower. Indicate on the table if the reporting period is Calendar Year (CY) or Fiscal Year (FY). In an attachment to the application, provide an explanation or basis for the projections and specify all assumptions used. Applicants must explain why the assumptions are reasonable. Specify the sources of non-operating income. See additional instruction in the column to the right of the table.
Two Most Recent Years (Actual)
Projected Years (ending five years after completion) Add columns if needed.
1. REVENUE
2. EXPENSES
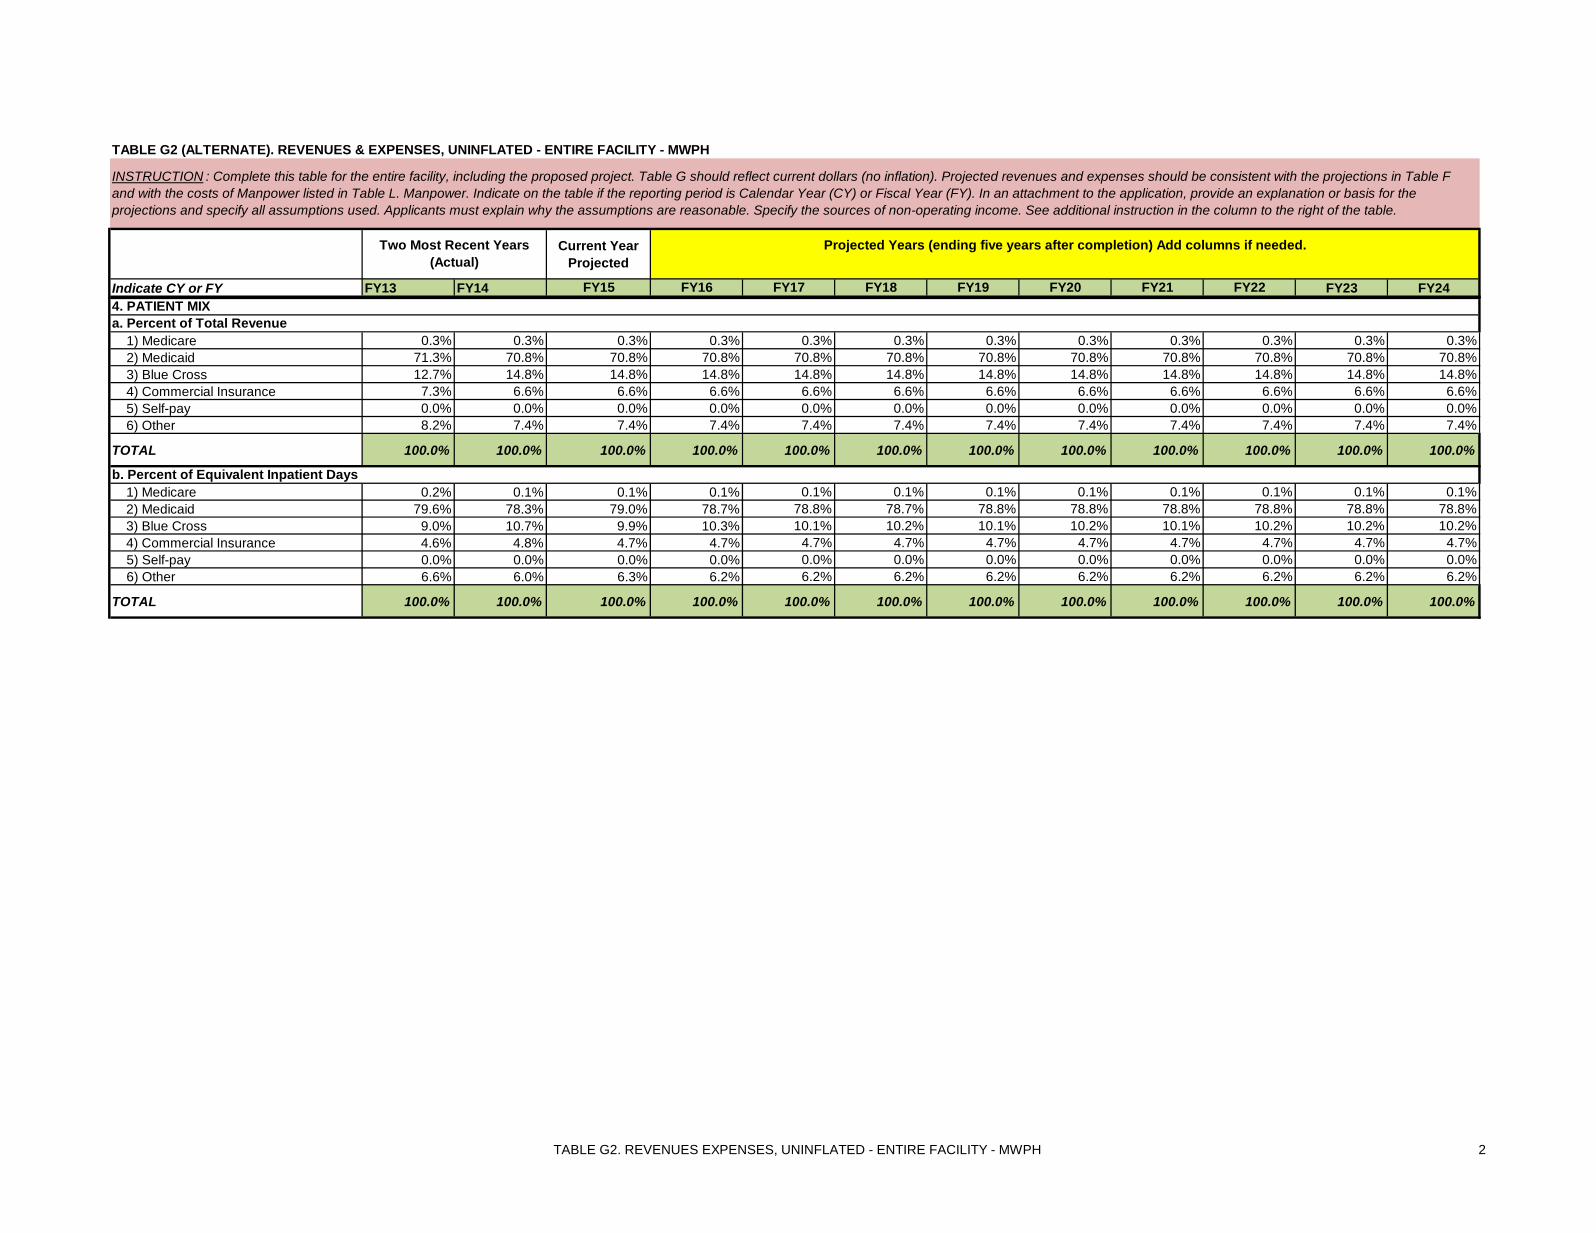
TABLE G2. REVENUES EXPENSES, UNINFLATED - ENTIRE FACILITY - MWPH 2
Current Year Projected
Indicate CY or FY FY13 FY14 FY15 FY16 FY17 FY18 FY19 FY20 FY21 FY22 FY23 FY24
TABLE G2 (ALTERNATE). REVENUES & EXPENSES, UNINFLATED - ENTIRE FACILITY - MWPH
INSTRUCTION : Complete this table for the entire facility, including the proposed project. Table G should reflect current dollars (no inflation). Projected revenues and expenses should be consistent with the projections in Table F and with the costs of Manpower listed in Table L. Manpower. Indicate on the table if the reporting period is Calendar Year (CY) or Fiscal Year (FY). In an attachment to the application, provide an explanation or basis for the projections and specify all assumptions used. Applicants must explain why the assumptions are reasonable. Specify the sources of non-operating income. See additional instruction in the column to the right of the table.
Two Most Recent Years (Actual)
Projected Years (ending five years after completion) Add columns if needed.
1) Medicare 0.3% 0.3% 0.3% 0.3% 0.3% 0.3% 0.3% 0.3% 0.3% 0.3% 0.3% 0.3% 2) Medicaid 71.3% 70.8% 70.8% 70.8% 70.8% 70.8% 70.8% 70.8% 70.8% 70.8% 70.8% 70.8% 3) Blue Cross 12.7% 14.8% 14.8% 14.8% 14.8% 14.8% 14.8% 14.8% 14.8% 14.8% 14.8% 14.8% 4) Commercial Insurance 7.3% 6.6% 6.6% 6.6% 6.6% 6.6% 6.6% 6.6% 6.6% 6.6% 6.6% 6.6% 5) Self-pay 0.0% 0.0% 0.0% 0.0% 0.0% 0.0% 0.0% 0.0% 0.0% 0.0% 0.0% 0.0% 6) Other 8.2% 7.4% 7.4% 7.4% 7.4% 7.4% 7.4% 7.4% 7.4% 7.4% 7.4% 7.4%
TOTAL 100.0% 100.0% 100.0% 100.0% 100.0% 100.0% 100.0% 100.0% 100.0% 100.0% 100.0% 100.0%
1) Medicare 0.2% 0.1% 0.1% 0.1% 0.1% 0.1% 0.1% 0.1% 0.1% 0.1% 0.1% 0.1% 2) Medicaid 79.6% 78.3% 79.0% 78.7% 78.8% 78.7% 78.8% 78.8% 78.8% 78.8% 78.8% 78.8% 3) Blue Cross 9.0% 10.7% 9.9% 10.3% 10.1% 10.2% 10.1% 10.2% 10.1% 10.2% 10.2% 10.2% 4) Commercial Insurance 4.6% 4.8% 4.7% 4.7% 4.7% 4.7% 4.7% 4.7% 4.7% 4.7% 4.7% 4.7% 5) Self-pay 0.0% 0.0% 0.0% 0.0% 0.0% 0.0% 0.0% 0.0% 0.0% 0.0% 0.0% 0.0% 6) Other 6.6% 6.0% 6.3% 6.2% 6.2% 6.2% 6.2% 6.2% 6.2% 6.2% 6.2% 6.2%
TOTAL 100.0% 100.0% 100.0% 100.0% 100.0% 100.0% 100.0% 100.0% 100.0% 100.0% 100.0% 100.0%
4. PATIENT MIXa. Percent of Total Revenue
b. Percent of Equivalent Inpatient Days

TABLE H2. REVENUES EXPENSES, INFLATED - ENTIRE FACILITY - MWPH 3
TABLE H2 (ALTERNATE). REVENUES & EXPENSES, INFLATED - ENTIRE FACILITY - MWPH
Current Year Projected
Indicate CY or FY FY13 FY14 FY15 FY16 FY17 FY18 FY19 FY20 FY21 FY22 FY23 FY24
a. Inpatient Services 42,757$ 47,087$ 45,964$ 46,632$ 46,547$ 47,164$ 47,835$ 48,451$ 49,021$ 49,532$ 50,098$ 50,614$ b. Outpatient Services 12,723$ 13,822$ 14,275$ 14,483$ 14,456$ 14,648$ 15,088$ 15,540$ 16,006$ 16,487$ 16,981$ 17,491$ Gross Patient Service Revenues 55,479$ 60,909$ 60,239$ 61,114$ 61,004$ 61,813$ 62,923$ 63,992$ 65,027$ 66,019$ 67,079$ 68,104$
c. Allowance For Bad Debt 533$ 589$ 602$ 611$ 610$ 618$ 629$ 640$ 650$ 660$ 671$ 681$ d. Contractual Allowance 3,360$ 4,002$ 4,336$ 4,399$ 4,391$ 4,449$ 4,529$ 4,606$ 4,681$ 4,752$ 4,828$ 4,902$ e. Charity Care -$ -$ -$ -$ -$ -$ -$ -$ -$ -$ -$
Net Patient Services Revenue 51,586$ 56,318$ 55,301$ 56,104$ 56,002$ 56,745$ 57,764$ 58,746$ 59,696$ 60,607$ 61,580$ 62,521$
f. Other Operating Revenues (Specify/add rows if needed) 2,912$ 750$ 758$ 765$ 773$ 780$ 788$ 796$ 804$ 812$ 820$ 828$
NET OPERATING REVENUE 54,498$ 57,068$ 56,059$ 56,869$ 56,775$ 57,525$ 58,552$ 59,541$ 60,500$ 61,418$ 62,400$ 63,349$
a. Salaries & Wages (including benefits) 34,069$ 39,117$ 37,237$ 37,778$ 37,342$ 36,914$ 37,577$ 38,215$ 38,834$ 39,426$ 40,059$ 40,671$
b. Contractual Services 5,417$ 5,596$ 5,915$ 6,001$ 5,932$ 5,864$ 5,969$ 6,071$ 6,169$ 6,263$ 6,363$ 6,461$ c. Interest on Current Debt 83$ 151$ -$ -$ -$ d. Interest on Project Debt -$ -$ -$ -$ -$ e. Current Depreciation 2,025$ 2,381$ 2,390$ 2,425$ 2,397$ 2,369$ 2,412$ 2,453$ 2,493$ 2,531$ 2,571$ 2,611$ f. Project Depreciation -$ -$ -$ -$ -$ g. Current Amortization -$ -$ -$ -$ -$ h. Project Amortization -$ -$ -$ -$ -$ i. Supplies 5,136$ 5,748$ 5,852$ 5,937$ 5,868$ 5,801$ 5,905$ 6,005$ 6,103$ 6,196$ 6,295$ 6,391$ j. Other Expenses (Specify/add rows if needed) 1,896$ 2,322$ 2,466$ 2,502$ 2,473$ 2,445$ 2,489$ 2,531$ 2,572$ 2,611$ 2,653$ 2,694$
TOTAL OPERATING EXPENSES 48,626$ 55,315$ 53,860$ 54,643$ 54,012$ 53,393$ 54,352$ 55,275$ 56,170$ 57,027$ 57,942$ 58,828$
a. Income From Operation 5,872$ 1,753$ 2,198$ 2,226$ 2,764$ 4,132$ 4,200$ 4,266$ 4,330$ 4,392$ 4,457$ 4,521$
b. Non-Operating Income 1,813$ 1,082$ 1,187$ 1,164$ 1,160$ 1,203$ 1,230$ 1,267$ 1,305$ 1,344$ 1,384$ 1,426$
SUBTOTAL 7,685$ 2,835$ 3,385$ 3,390$ 3,924$ 5,335$ 5,430$ 5,533$ 5,635$ 5,736$ 5,842$ 5,947$
c. Income Taxes -$ -$ -$ -$ -$ -$ -$ -$ -$ -$ -$
NET INCOME (LOSS) 7,685$ 2,835$ 3,385$ 3,390$ 3,924$ 5,335$ 5,430$ 5,533$ 5,635$ 5,736$ 5,842$ 5,947$
3. INCOME
2. EXPENSES
INSTRUCTION : Complete this table for the entire facility, including the proposed project. Table H should reflect inflation. Projected revenues and expenses should be consistent with the projections in Table F. Indicate on the table if the reporting period is Calendar Year (CY) or Fiscal Year (FY). In an attachment to the application, provide an explanation or basis for the projections and specify all assumptions used. Applicants must explain why the assumptions are reasonable. See additional instruction in the column to the right of the table.
Two Most Recent Years (Actual) Projected Years (ending five years after completion) Add columns if needed.
1. REVENUE
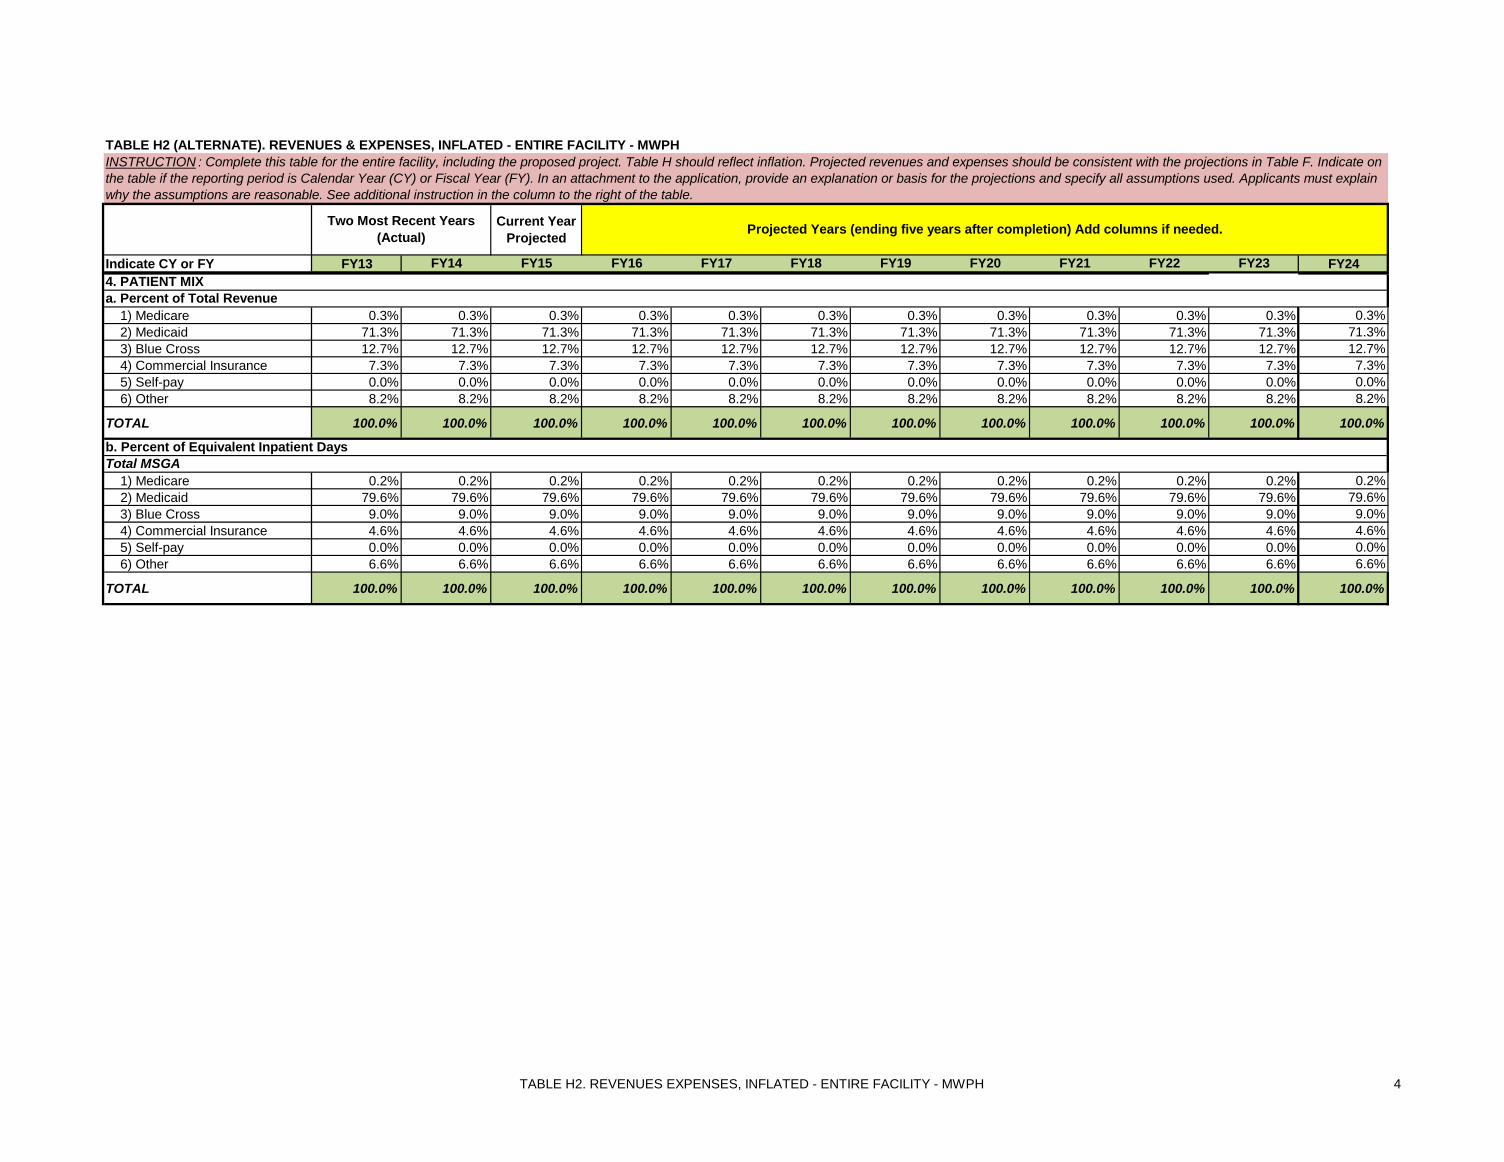
TABLE H2. REVENUES EXPENSES, INFLATED - ENTIRE FACILITY - MWPH 4
TABLE H2 (ALTERNATE). REVENUES & EXPENSES, INFLATED - ENTIRE FACILITY - MWPH
Current Year Projected
Indicate CY or FY FY13 FY14 FY15 FY16 FY17 FY18 FY19 FY20 FY21 FY22 FY23 FY24
INSTRUCTION : Complete this table for the entire facility, including the proposed project. Table H should reflect inflation. Projected revenues and expenses should be consistent with the projections in Table F. Indicate on the table if the reporting period is Calendar Year (CY) or Fiscal Year (FY). In an attachment to the application, provide an explanation or basis for the projections and specify all assumptions used. Applicants must explain why the assumptions are reasonable. See additional instruction in the column to the right of the table.
Two Most Recent Years (Actual) Projected Years (ending five years after completion) Add columns if needed.
1) Medicare 0.3% 0.3% 0.3% 0.3% 0.3% 0.3% 0.3% 0.3% 0.3% 0.3% 0.3% 0.3% 2) Medicaid 71.3% 71.3% 71.3% 71.3% 71.3% 71.3% 71.3% 71.3% 71.3% 71.3% 71.3% 71.3% 3) Blue Cross 12.7% 12.7% 12.7% 12.7% 12.7% 12.7% 12.7% 12.7% 12.7% 12.7% 12.7% 12.7% 4) Commercial Insurance 7.3% 7.3% 7.3% 7.3% 7.3% 7.3% 7.3% 7.3% 7.3% 7.3% 7.3% 7.3% 5) Self-pay 0.0% 0.0% 0.0% 0.0% 0.0% 0.0% 0.0% 0.0% 0.0% 0.0% 0.0% 0.0% 6) Other 8.2% 8.2% 8.2% 8.2% 8.2% 8.2% 8.2% 8.2% 8.2% 8.2% 8.2% 8.2%
TOTAL 100.0% 100.0% 100.0% 100.0% 100.0% 100.0% 100.0% 100.0% 100.0% 100.0% 100.0% 100.0%
1) Medicare 0.2% 0.2% 0.2% 0.2% 0.2% 0.2% 0.2% 0.2% 0.2% 0.2% 0.2% 0.2% 2) Medicaid 79.6% 79.6% 79.6% 79.6% 79.6% 79.6% 79.6% 79.6% 79.6% 79.6% 79.6% 79.6% 3) Blue Cross 9.0% 9.0% 9.0% 9.0% 9.0% 9.0% 9.0% 9.0% 9.0% 9.0% 9.0% 9.0% 4) Commercial Insurance 4.6% 4.6% 4.6% 4.6% 4.6% 4.6% 4.6% 4.6% 4.6% 4.6% 4.6% 4.6% 5) Self-pay 0.0% 0.0% 0.0% 0.0% 0.0% 0.0% 0.0% 0.0% 0.0% 0.0% 0.0% 0.0% 6) Other 6.6% 6.6% 6.6% 6.6% 6.6% 6.6% 6.6% 6.6% 6.6% 6.6% 6.6% 6.6%
TOTAL 100.0% 100.0% 100.0% 100.0% 100.0% 100.0% 100.0% 100.0% 100.0% 100.0% 100.0% 100.0%
4. PATIENT MIXa. Percent of Total Revenue
b. Percent of Equivalent Inpatient DaysTotal MSGA
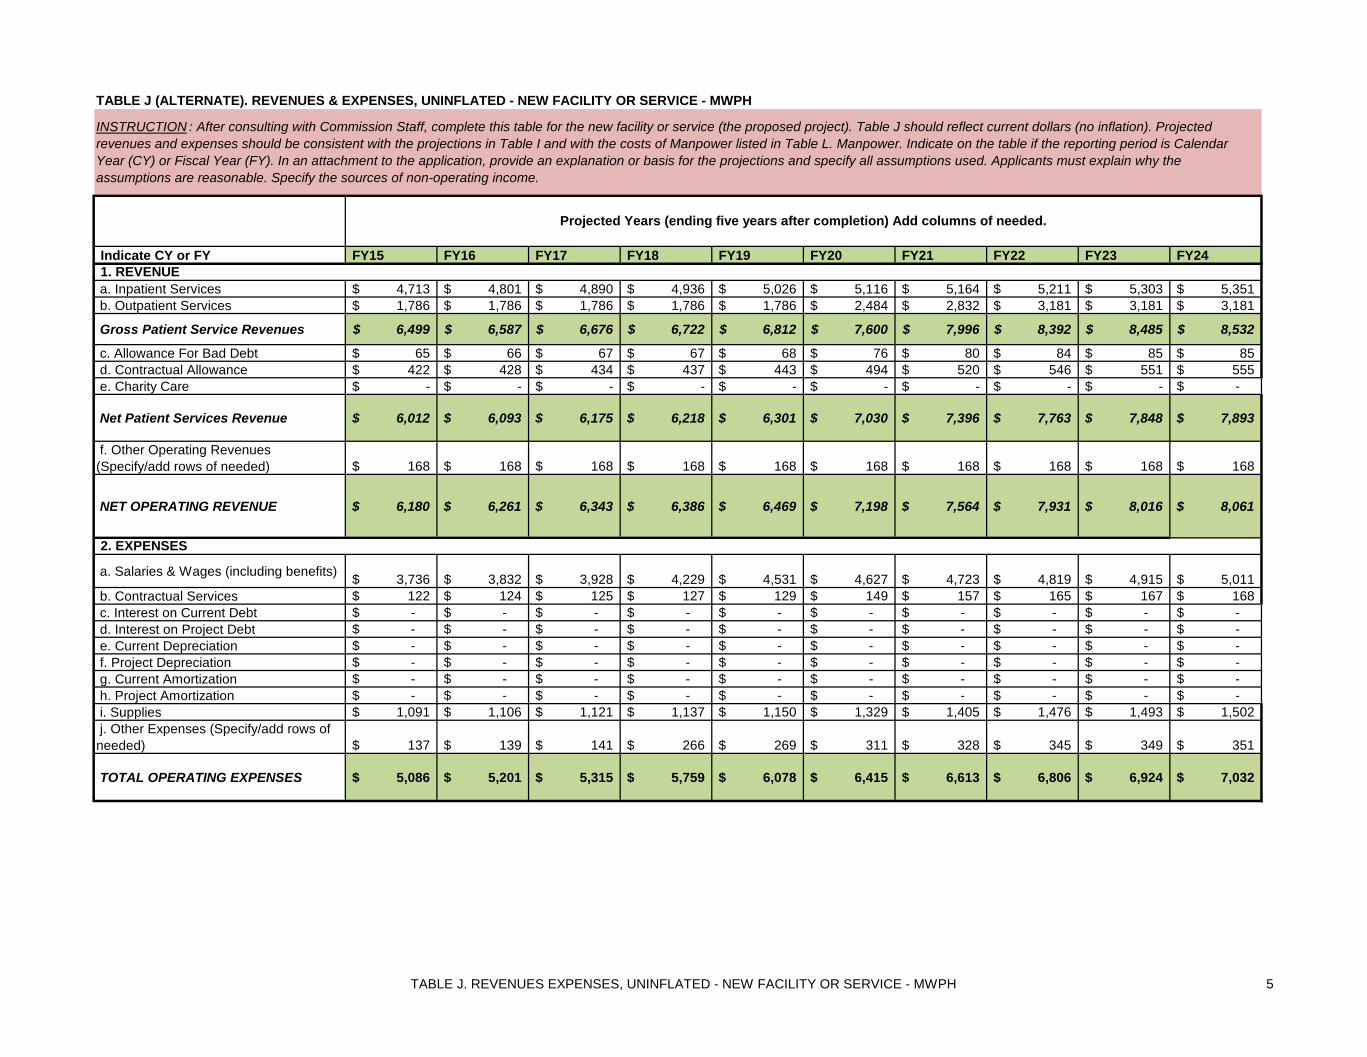
TABLE J. REVENUES EXPENSES, UNINFLATED - NEW FACILITY OR SERVICE - MWPH 5
Indicate CY or FY FY15 FY16 FY17 FY18 FY19 FY20 FY21 FY22 FY23 FY24
a. Inpatient Services 4,713$ 4,801$ 4,890$ 4,936$ 5,026$ 5,116$ 5,164$ 5,211$ 5,303$ 5,351$ b. Outpatient Services 1,786$ 1,786$ 1,786$ 1,786$ 1,786$ 2,484$ 2,832$ 3,181$ 3,181$ 3,181$
Gross Patient Service Revenues 6,499$ 6,587$ 6,676$ 6,722$ 6,812$ 7,600$ 7,996$ 8,392$ 8,485$ 8,532$
c. Allowance For Bad Debt 65$ 66$ 67$ 67$ 68$ 76$ 80$ 84$ 85$ 85$ d. Contractual Allowance 422$ 428$ 434$ 437$ 443$ 494$ 520$ 546$ 551$ 555$ e. Charity Care -$ -$ -$ -$ -$ -$ -$ -$ -$ -$
Net Patient Services Revenue 6,012$ 6,093$ 6,175$ 6,218$ 6,301$ 7,030$ 7,396$ 7,763$ 7,848$ 7,893$
f. Other Operating Revenues (Specify/add rows of needed) 168$ 168$ 168$ 168$ 168$ 168$ 168$ 168$ 168$ 168$
NET OPERATING REVENUE 6,180$ 6,261$ 6,343$ 6,386$ 6,469$ 7,198$ 7,564$ 7,931$ 8,016$ 8,061$
a. Salaries & Wages (including benefits) 3,736$ 3,832$ 3,928$ 4,229$ 4,531$ 4,627$ 4,723$ 4,819$ 4,915$ 5,011$ b. Contractual Services 122$ 124$ 125$ 127$ 129$ 149$ 157$ 165$ 167$ 168$ c. Interest on Current Debt -$ -$ -$ -$ -$ -$ -$ -$ -$ -$ d. Interest on Project Debt -$ -$ -$ -$ -$ -$ -$ -$ -$ -$ e. Current Depreciation -$ -$ -$ -$ -$ -$ -$ -$ -$ -$ f. Project Depreciation -$ -$ -$ -$ -$ -$ -$ -$ -$ -$ g. Current Amortization -$ -$ -$ -$ -$ -$ -$ -$ -$ -$ h. Project Amortization -$ -$ -$ -$ -$ -$ -$ -$ -$ -$ i. Supplies 1,091$ 1,106$ 1,121$ 1,137$ 1,150$ 1,329$ 1,405$ 1,476$ 1,493$ 1,502$ j. Other Expenses (Specify/add rows of needed) 137$ 139$ 141$ 266$ 269$ 311$ 328$ 345$ 349$ 351$
TOTAL OPERATING EXPENSES 5,086$ 5,201$ 5,315$ 5,759$ 6,078$ 6,415$ 6,613$ 6,806$ 6,924$ 7,032$
TABLE J (ALTERNATE). REVENUES & EXPENSES, UNINFLATED - NEW FACILITY OR SERVICE - MWPH
INSTRUCTION : After consulting with Commission Staff, complete this table for the new facility or service (the proposed project). Table J should reflect current dollars (no inflation). Projected revenues and expenses should be consistent with the projections in Table I and with the costs of Manpower listed in Table L. Manpower. Indicate on the table if the reporting period is Calendar Year (CY) or Fiscal Year (FY). In an attachment to the application, provide an explanation or basis for the projections and specify all assumptions used. Applicants must explain why the assumptions are reasonable. Specify the sources of non-operating income.
Projected Years (ending five years after completion) Add columns of needed.
1. REVENUE
2. EXPENSES

TABLE J. REVENUES EXPENSES, UNINFLATED - NEW FACILITY OR SERVICE - MWPH 6
Indicate CY or FY FY15 FY16 FY17 FY18 FY19 FY20 FY21 FY22 FY23 FY24
TABLE J (ALTERNATE). REVENUES & EXPENSES, UNINFLATED - NEW FACILITY OR SERVICE - MWPH
INSTRUCTION : After consulting with Commission Staff, complete this table for the new facility or service (the proposed project). Table J should reflect current dollars (no inflation). Projected revenues and expenses should be consistent with the projections in Table I and with the costs of Manpower listed in Table L. Manpower. Indicate on the table if the reporting period is Calendar Year (CY) or Fiscal Year (FY). In an attachment to the application, provide an explanation or basis for the projections and specify all assumptions used. Applicants must explain why the assumptions are reasonable. Specify the sources of non-operating income.
Projected Years (ending five years after completion) Add columns of needed.
a. Income From Operation 1,094$ 1,061$ 1,028$ 627$ 391$ 783$ 951$ 1,126$ 1,092$ 1,029$
b. Non-Operating Income -$ -$ -$ -$ -$ -$ -$ -$ -$ -$
SUBTOTAL 1,094$ 1,061$ 1,028$ 627$ 391$ 783$ 951$ 1,126$ 1,092$ 1,029$
c. Income Taxes -$
NET INCOME (LOSS) 1,094$ 1,061$ 1,028$ 627$ 391$ 783$ 951$ 1,126$ 1,092$ 1,029$
1) Medicare 0.4% 0.4% 0.4% 0.4% 0.4% 0.4% 0.4% 0.4% 0.4% 0.4% 2) Medicaid 79.9% 79.9% 79.9% 79.9% 79.9% 79.9% 79.9% 79.9% 79.9% 79.9% 3) Blue Cross 11.1% 11.1% 11.1% 11.1% 11.1% 11.1% 11.1% 11.1% 11.1% 11.1% 4) Commercial Insurance 3.7% 3.7% 3.7% 3.7% 3.7% 3.7% 3.7% 3.7% 3.7% 3.7% 5) Self-pay 0.0% 0.0% 0.0% 0.0% 0.0% 0.0% 0.0% 0.0% 0.0% 0.0% 6) Other 4.9% 4.9% 4.9% 4.9% 4.9% 4.9% 4.9% 4.9% 4.9% 4.9%
TOTAL 100.0% 100.0% 100.0% 100.0% 100.0% 100.0% 100.0% 100.0% 100.0% 100.0%
1) Medicare 0.0% 0.0% 0.0% 0.0% 0.0% 0.0% 0.0% 0.0% 0.0% 0.0% 2) Medicaid 84.9% 84.9% 84.9% 84.9% 84.9% 84.9% 84.9% 84.9% 84.9% 84.9% 3) Blue Cross 8.2% 8.2% 8.2% 8.2% 8.2% 8.2% 8.2% 8.2% 8.2% 8.2% 4) Commercial Insurance 6.3% 6.3% 6.3% 6.3% 6.3% 6.3% 6.3% 6.3% 6.3% 6.3% 5) Self-pay 0.0% 0.0% 0.0% 0.0% 0.0% 0.0% 0.0% 0.0% 0.0% 0.0% 6) Other 0.6% 0.6% 0.6% 0.6% 0.6% 0.6% 0.6% 0.6% 0.6% 0.6%
TOTAL 100.0% 100.0% 100.0% 100.0% 100.0% 100.0% 100.0% 100.0% 100.0% 100.0%
4. PATIENT MIXa. Percent of Total Revenue
b. Percent of Equivalent Inpatient Days
3. INCOME
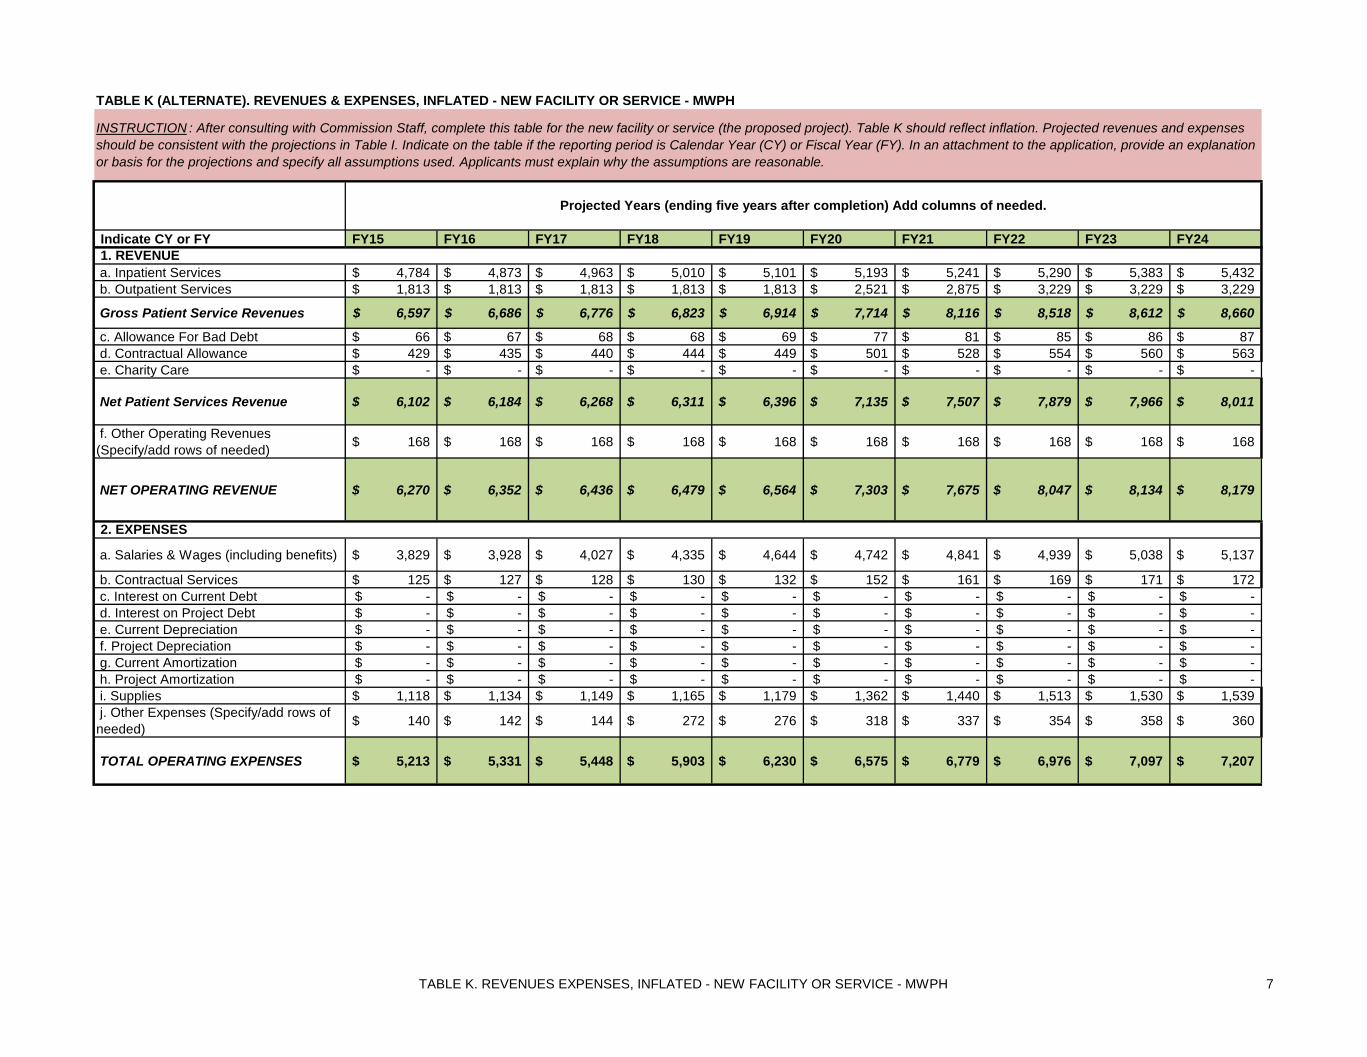
TABLE K. REVENUES EXPENSES, INFLATED - NEW FACILITY OR SERVICE - MWPH 7
Indicate CY or FY FY15 FY16 FY17 FY18 FY19 FY20 FY21 FY22 FY23 FY24
a. Inpatient Services 4,784$ 4,873$ 4,963$ 5,010$ 5,101$ 5,193$ 5,241$ 5,290$ 5,383$ 5,432$ b. Outpatient Services 1,813$ 1,813$ 1,813$ 1,813$ 1,813$ 2,521$ 2,875$ 3,229$ 3,229$ 3,229$
Gross Patient Service Revenues 6,597$ 6,686$ 6,776$ 6,823$ 6,914$ 7,714$ 8,116$ 8,518$ 8,612$ 8,660$
c. Allowance For Bad Debt 66$ 67$ 68$ 68$ 69$ 77$ 81$ 85$ 86$ 87$ d. Contractual Allowance 429$ 435$ 440$ 444$ 449$ 501$ 528$ 554$ 560$ 563$ e. Charity Care -$ -$ -$ -$ -$ -$ -$ -$ -$ -$
Net Patient Services Revenue 6,102$ 6,184$ 6,268$ 6,311$ 6,396$ 7,135$ 7,507$ 7,879$ 7,966$ 8,011$
f. Other Operating Revenues (Specify/add rows of needed) 168$ 168$ 168$ 168$ 168$ 168$ 168$ 168$ 168$ 168$
NET OPERATING REVENUE 6,270$ 6,352$ 6,436$ 6,479$ 6,564$ 7,303$ 7,675$ 8,047$ 8,134$ 8,179$
a. Salaries & Wages (including benefits) 3,829$ 3,928$ 4,027$ 4,335$ 4,644$ 4,742$ 4,841$ 4,939$ 5,038$ 5,137$
b. Contractual Services 125$ 127$ 128$ 130$ 132$ 152$ 161$ 169$ 171$ 172$ c. Interest on Current Debt -$ -$ -$ -$ -$ -$ -$ -$ -$ -$ d. Interest on Project Debt -$ -$ -$ -$ -$ -$ -$ -$ -$ -$ e. Current Depreciation -$ -$ -$ -$ -$ -$ -$ -$ -$ -$ f. Project Depreciation -$ -$ -$ -$ -$ -$ -$ -$ -$ -$ g. Current Amortization -$ -$ -$ -$ -$ -$ -$ -$ -$ -$ h. Project Amortization -$ -$ -$ -$ -$ -$ -$ -$ -$ -$ i. Supplies 1,118$ 1,134$ 1,149$ 1,165$ 1,179$ 1,362$ 1,440$ 1,513$ 1,530$ 1,539$ j. Other Expenses (Specify/add rows of needed) 140$ 142$ 144$ 272$ 276$ 318$ 337$ 354$ 358$ 360$
TOTAL OPERATING EXPENSES 5,213$ 5,331$ 5,448$ 5,903$ 6,230$ 6,575$ 6,779$ 6,976$ 7,097$ 7,207$
TABLE K (ALTERNATE). REVENUES & EXPENSES, INFLATED - NEW FACILITY OR SERVICE - MWPH
INSTRUCTION : After consulting with Commission Staff, complete this table for the new facility or service (the proposed project). Table K should reflect inflation. Projected revenues and expenses should be consistent with the projections in Table I. Indicate on the table if the reporting period is Calendar Year (CY) or Fiscal Year (FY). In an attachment to the application, provide an explanation or basis for the projections and specify all assumptions used. Applicants must explain why the assumptions are reasonable.
Projected Years (ending five years after completion) Add columns of needed.
1. REVENUE
2. EXPENSES

TABLE K. REVENUES EXPENSES, INFLATED - NEW FACILITY OR SERVICE - MWPH 8
Indicate CY or FY FY15 FY16 FY17 FY18 FY19 FY20 FY21 FY22 FY23 FY24
TABLE K (ALTERNATE). REVENUES & EXPENSES, INFLATED - NEW FACILITY OR SERVICE - MWPH
INSTRUCTION : After consulting with Commission Staff, complete this table for the new facility or service (the proposed project). Table K should reflect inflation. Projected revenues and expenses should be consistent with the projections in Table I. Indicate on the table if the reporting period is Calendar Year (CY) or Fiscal Year (FY). In an attachment to the application, provide an explanation or basis for the projections and specify all assumptions used. Applicants must explain why the assumptions are reasonable.
Projected Years (ending five years after completion) Add columns of needed.
a. Income From Operation 1,057$ 1,022$ 987$ 576$ 333$ 728$ 897$ 1,072$ 1,037$ 972$
b. Non-Operating Income -$ -$ -$ -$ -$ -$ -$ -$ -$ -$
SUBTOTAL 1,057$ 1,022$ 987$ 576$ 333$ 728$ 897$ 1,072$ 1,037$ 972$
c. Income Taxes -$ -$ -$ -$ -$ -$ -$ -$ -$ -$
NET INCOME (LOSS) 1,057$ 1,022$ 987$ 576$ 333$ 728$ 897$ 1,072$ 1,037$ 972$
1) Medicare 0.4% 0.4% 0.4% 0.4% 0.4% 0.4% 0.4% 0.4% 0.4% 0.4% 2) Medicaid 79.9% 79.9% 79.9% 79.9% 79.9% 79.9% 79.9% 79.9% 79.9% 79.9% 3) Blue Cross 11.1% 11.1% 11.1% 11.1% 11.1% 11.1% 11.1% 11.1% 11.1% 11.1% 4) Commercial Insurance 3.7% 3.7% 3.7% 3.7% 3.7% 3.7% 3.7% 3.7% 3.7% 3.7% 5) Self-pay 0.0% 0.0% 0.0% 0.0% 0.0% 0.0% 0.0% 0.0% 0.0% 0.0% 6) Other 4.9% 4.9% 4.9% 4.9% 4.9% 4.9% 4.9% 4.9% 4.9% 4.9%
TOTAL 100.0% 100.0% 100.0% 100.0% 100.0% 100.0% 100.0% 100.0% 100.0% 100.0%
1) Medicare 0.0% 0.0% 0.0% 0.0% 0.0% 0.0% 0.0% 0.0% 0.0% 0.0% 2) Medicaid 84.9% 84.9% 84.9% 84.9% 84.9% 84.9% 84.9% 84.9% 84.9% 84.9% 3) Blue Cross 8.2% 8.2% 8.2% 8.2% 8.2% 8.2% 8.2% 8.2% 8.2% 8.2% 4) Commercial Insurance 6.3% 6.3% 6.3% 6.3% 6.3% 6.3% 6.3% 6.3% 6.3% 6.3% 5) Self-pay 0.0% 0.0% 0.0% 0.0% 0.0% 0.0% 0.0% 0.0% 0.0% 0.0% 6) Other 0.6% 0.6% 0.6% 0.6% 0.6% 0.6% 0.6% 0.6% 0.6% 0.6%
TOTAL 100.0% 100.0% 100.0% 100.0% 100.0% 100.0% 100.0% 100.0% 100.0% 100.0%
4. PATIENT MIXa. Percent of Total Revenue
b. Percent of Equivalent Inpatient Days
3. INCOME
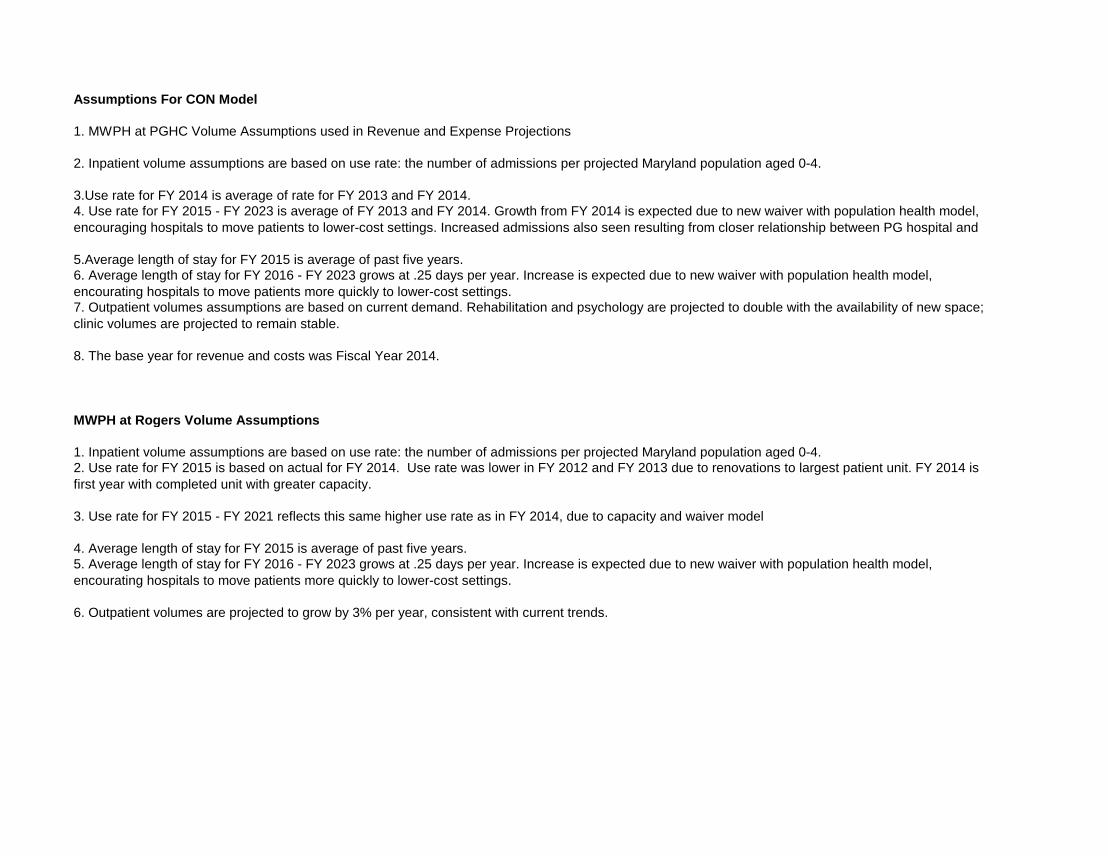
Assumptions For CON Model
1. MWPH at PGHC Volume Assumptions used in Revenue and Expense Projections
2. Inpatient volume assumptions are based on use rate: the number of admissions per projected Maryland population aged 0-4.
3.Use rate for FY 2014 is average of rate for FY 2013 and FY 2014.4. Use rate for FY 2015 - FY 2023 is average of FY 2013 and FY 2014. Growth from FY 2014 is expected due to new waiver with population health model, encouraging hospitals to move patients to lower-cost settings. Increased admissions also seen resulting from closer relationship between PG hospital and
5.Average length of stay for FY 2015 is average of past five years.6. Average length of stay for FY 2016 - FY 2023 grows at .25 days per year. Increase is expected due to new waiver with population health model, encourating hospitals to move patients more quickly to lower-cost settings.7. Outpatient volumes assumptions are based on current demand. Rehabilitation and psychology are projected to double with the availability of new space; clinic volumes are projected to remain stable.
8. The base year for revenue and costs was Fiscal Year 2014.
MWPH at Rogers Volume Assumptions
1. Inpatient volume assumptions are based on use rate: the number of admissions per projected Maryland population aged 0-4.2. Use rate for FY 2015 is based on actual for FY 2014. Use rate was lower in FY 2012 and FY 2013 due to renovations to largest patient unit. FY 2014 is first year with completed unit with greater capacity.
3. Use rate for FY 2015 - FY 2021 reflects this same higher use rate as in FY 2014, due to capacity and waiver model
4. Average length of stay for FY 2015 is average of past five years.5. Average length of stay for FY 2016 - FY 2023 grows at .25 days per year. Increase is expected due to new waiver with population health model, encourating hospitals to move patients more quickly to lower-cost settings.
6. Outpatient volumes are projected to grow by 3% per year, consistent with current trends.