Embed Size (px)
Citation preview

Assessing D&O Risk for Publicly Traded Corporations
GallagherManagement LiabilityPractice
MAY 2016
Gallagher Management Liability Practice Assessing D&O Risk for Publicly Traded Corporations 2
Ever since directors & officers liability (D&O) insurance really began to emerge in the 1980s, the question of how much insurance to buy has been both a critical business decision and an increasingly popular topic of discussion. The first method introduced for addressing this issue was benchmarking, which became very popular for D&O in 1991, once customized access to a vast database of survey data on the purchasing patterns of major corporations was established. The popularity of benchmarking increased steadily over the next decade as additional data was collected and companies became comfortable sharing data. But time and again, companies relied too heavily on benchmarking alone and as a result were often misled by the data supplied by their peers. Early in 1999, Gallagher developed a model for projecting the likely exposure to D&O loss under the most commonly occurring adverse scenarios. In particular, the Gallagher modeling process focused on the most prevalent and costly types of D&O claims, thereby allowing corporations to better estimate their likely D&O exposure under adverse conditions and then to purchase their D&O insurance accordingly.
The Gallagher D&O Modeling Evaluation (DOME) supplements benchmarking analyses and the review of historical large D&O losses as a third method for assessing D&O risk — one which our experience shows to be the most accurate. DOME was created by collecting thousands of data points (D&O losses and corresponding company exposure
information and trading statistics, and fitting the data to non-linear statistical models originally using a form of regression analysis). As a result, our D&O limits model is based on Gallagher’s proprietary models and algorithms, which rely wholly on client exposure data to project potential liabilities. This projection is especially valuable, as it can be made well in advance of potential claims and thus increases the likelihood of having sufficient limits for those claims. The data used by the model includes the client’s industry, specific ownership structure and a variety of unique trading data, such as market capitalization and price volatility. The model estimates the amount of D&O insurance coverage required to cover most D&O claims. Our point estimate approximates the 75th percentile, though we offer a range up to the 90th percentile. By 90th percentile, we refer to a DOME estimate that will be greater than 90 out of a 100 adverse D&O claims against clients with similar risk profiles (or less than 10 out of 100 such adverse D&O claims).
In this paper, we will explore the D&O studies published in 2016 by both Cornerstone Research and National Economic Research Associates (NERA). Specifically, we will examine their recent reports on D&O liability, and compare their results to our own model assumptions. Ultimately, we will describe how our Gallagher D&O model was developed and why it continues to be most successful.
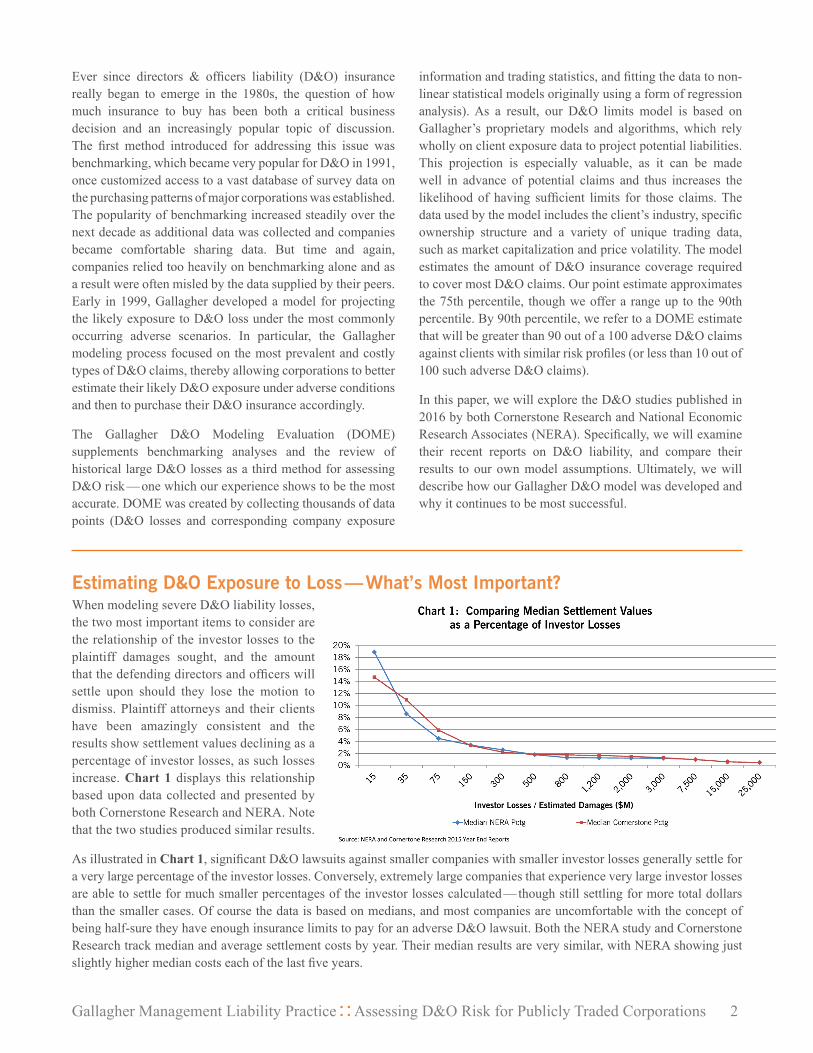
Estimating D&O Exposure to Loss — What’s Most Important?When modeling severe D&O liability losses, the two most important items to consider are the relationship of the investor losses to the plaintiff damages sought, and the amount that the defending directors and officers will settle upon should they lose the motion to dismiss. Plaintiff attorneys and their clients have been amazingly consistent and the results show settlement values declining as a percentage of investor losses, as such losses increase. Chart 1 displays this relationship based upon data collected and presented by both Cornerstone Research and NERA. Note that the two studies produced similar results.
As illustrated in Chart 1, significant D&O lawsuits against smaller companies with smaller investor losses generally settle for a very large percentage of the investor losses. Conversely, extremely large companies that experience very large investor losses are able to settle for much smaller percentages of the investor losses calculated — though still settling for more total dollars than the smaller cases. Of course the data is based on medians, and most companies are uncomfortable with the concept of being half-sure they have enough insurance limits to pay for an adverse D&O lawsuit. Both the NERA study and Cornerstone Research track median and average settlement costs by year. Their median results are very similar, with NERA showing just slightly higher median costs each of the last five years.

Gallagher Management Liability Practice Assessing D&O Risk for Publicly Traded Corporations 3
Adjusting for inflation and removing obvious outliers, we are able to construct a comparison between median and average D&O settlement costs as shown in Chart 2. Using NERA data, Chart 2 exhibits some wonderful consistency between average D&O settlement costs and median costs. The blue horizontal lines are added for emphasis; they represent the typical value for each group of 14 years of data. Very clearly, the average settlement generally equals four times the median.
From Chart 3, we conclude that the average cost of a D&O settlement is reasonably conservative. In that chart, we tracked for several years what percentile the average indicates when compared to all severe ($1M+) D&O claims. It turns out that average D&O claim severity is very close to the 75th percentile in all years. Thus, buying limits based on average severity means having enough insurance for the most severe claim scenarios about 75% of the time, which may be an acceptable strategy for healthy companies. However, as an aside, we would always recommend additional “Side-A” only limits be purchased on top of your traditional D&O program. By Side-A, we refer to the individual D&O protection triggered when corporate indemnification is not permissible or available. Side-A purchases often approach the 99th percentile.
Applying gross-up factors is therefore a good strategy in converting NERA median percentages to what we will call “NERA average percentages.” The results are illustrated in Chart 4.
There is one more important factor to consider, namely the length of the class period. The core of our modeling looks at claim costs from securities class actions typically alleging a violation of Section 10(b) of the Securities Exchange Act of 1934 and Rule 10b-5 promulgated thereunder. Thus Plaintiffs are typically claiming that our clients have made financial disclosures that were inaccurate or inadequate. And the class period represents the length of time that corrected information was withheld. Clearly, the longer the class
30
45
60
75
30 75 150 300 550 950 1,450 2,600 6,750 15,000
wee
ks
Market Capitalization ($M)
Chart 5: Modeling Class Period Length
NERA Class Period Modeled Length
0
10
20
30
40
50
60
2002 2003 2004 2005 2006 2007 2008 2009 2010 2011 2012 2013 2014 2015
SettlementCost ($M)
Chart 2: Comparing Avg D&O Settlements to Median Cost
Average
Median
Gallagher Management Liability Practice Assessing D&O Risk for Publicly Traded Corporations 4
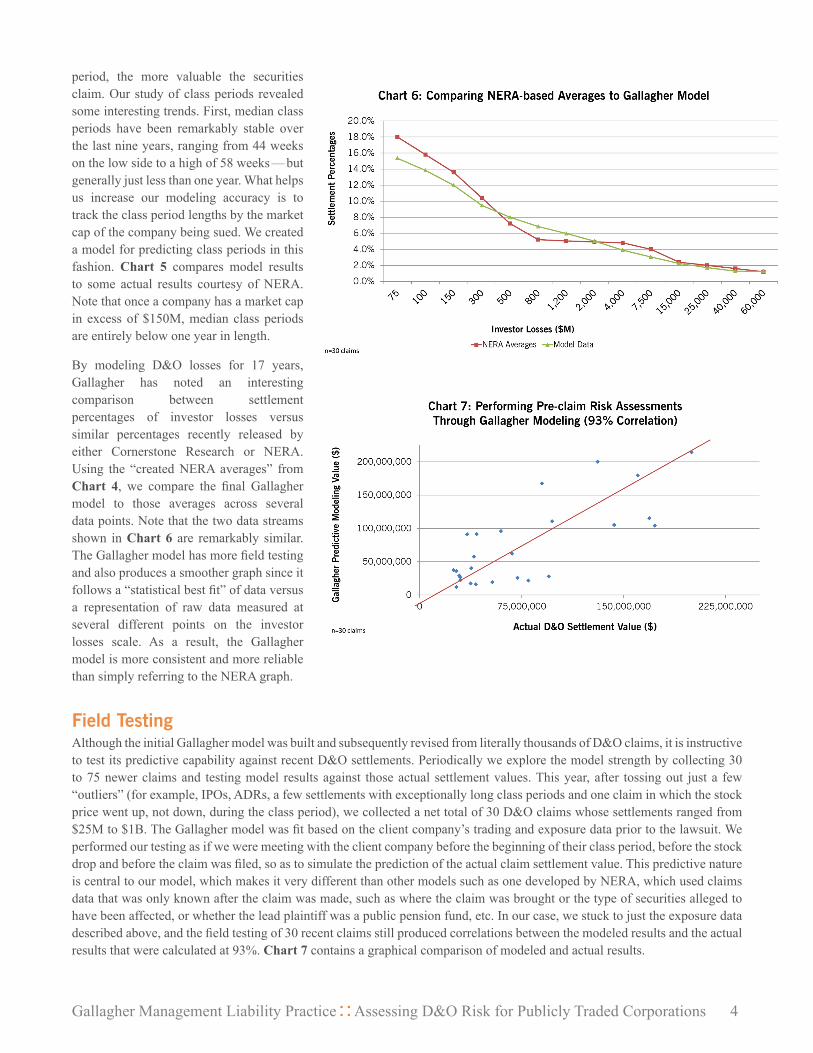
period, the more valuable the securities claim. Our study of class periods revealed some interesting trends. First, median class periods have been remarkably stable over the last nine years, ranging from 44 weeks on the low side to a high of 58 weeks — but generally just less than one year. What helps us increase our modeling accuracy is to track the class period lengths by the market cap of the company being sued. We created a model for predicting class periods in this fashion. Chart 5 compares model results to some actual results courtesy of NERA. Note that once a company has a market cap in excess of $150M, median class periods are entirely below one year in length.
By modeling D&O losses for 17 years, Gallagher has noted an interesting comparison between settlement percentages of investor losses versus similar percentages recently released by either Cornerstone Research or NERA. Using the “created NERA averages” from Chart 4, we compare the final Gallagher model to those averages across several data points. Note that the two data streams shown in Chart 6 are remarkably similar. The Gallagher model has more field testing and also produces a smoother graph since it follows a “statistical best fit” of data versus a representation of raw data measured at several different points on the investor losses scale. As a result, the Gallagher model is more consistent and more reliable than simply referring to the NERA graph.
Field TestingAlthough the initial Gallagher model was built and subsequently revised from literally thousands of D&O claims, it is instructive to test its predictive capability against recent D&O settlements. Periodically we explore the model strength by collecting 30 to 75 newer claims and testing model results against those actual settlement values. This year, after tossing out just a few “outliers” (for example, IPOs, ADRs, a few settlements with exceptionally long class periods and one claim in which the stock price went up, not down, during the class period), we collected a net total of 30 D&O claims whose settlements ranged from $25M to $1B. The Gallagher model was fit based on the client company’s trading and exposure data prior to the lawsuit. We performed our testing as if we were meeting with the client company before the beginning of their class period, before the stock drop and before the claim was filed, so as to simulate the prediction of the actual claim settlement value. This predictive nature is central to our model, which makes it very different than other models such as one developed by NERA, which used claims data that was only known after the claim was made, such as where the claim was brought or the type of securities alleged to have been affected, or whether the lead plaintiff was a public pension fund, etc. In our case, we stuck to just the exposure data described above, and the field testing of 30 recent claims still produced correlations between the modeled results and the actual results that were calculated at 93%. Chart 7 contains a graphical comparison of modeled and actual results.

Gallagher Management Liability Practice Assessing D&O Risk for Publicly Traded Corporations 5
One special item to note is that the model will naturally have some difficulties predicting settlement values for unusually large companies as such data is somewhat sparse. However, it may still provide a good ballpark for potential claim size. As an illustration, we use two recent American International Group (AIG) settlements. The chart below summarizes our model predictions for the size of the claim alongside the actual settlement costs. Even for this challenging situation, the model does quite well, especially in the aggregate. The difference between the actual settlement values of the two claims in total compared to the total modeled costs is within 2%. Despite this solid performance, all bets are usually off when a mega-sized company underperforms enough to attract a D&O claim.
Year Settled Settlement Modeled Cost
AIG 2013 $ 725M $ 984M
AIG 2015 $ 960M $ 730M
Total $ 1.685B $ 1.715B
The Gallagher model relies very much on the relationship between investor losses and ultimate settlement values, but we also incorporate other useful data and sub-models. For example, adjustments are made for corporate governance, accruals and leverage, and the most likely causes of action by plaintiffs based on your company’s own trading data. The model also presumes that the most likely D&O claim types continue to be shareholder class actions alleging inadequate or inaccurate disclosure. These claims have been historically the most prevalent and the most costly. And since these are also securities claims that are typically indemnified, they are often denoted as “B/C” claims, which makes reference to “Insuring clause B” designed to reimburse the corporation for indemnification it provides to the individual directors and officers, and “Insuring Clause C” which simply picks up coverage for the corporate entity in the event of a securities claim. Thus, once we have this indemnifiable (B/C) risk assessed, we employ one last modeling exercise, namely to determine the Side-A D&O loss exposure. Thus, our final display of model results may look like the following table.
Minimum D&O Limits for Indemnified Loss Calculated Above
$45,000,000
Side-A Limits indicated from revenue-based Gallagher modeling
$21,000,000
Side-A Limits indicated from Gallagher Market Cap based analysis
$20,000,000
Side-A Limits suggested from review of both methods
$25,000,000
Total D&O Program Limits implied by this Analysis
$70,000,000
Ratio of Side-A Dedicated D&O Limits to Total D&O Limits
36%
In this summary table, we have an initial model calculation of $45M, which pertains to B/C risk because it expects financial disclosure driven lawsuits to be indemnifiable. Beneath that, we have the models to measure the potential Side-A risk, and then add that $25M of Side-A risk to obtain the total D&O program limits implied (which is $70M in our example). We recognize that this may be somewhat conservative as there is the potential for overlap between the two models (B/C risk modeling and Side-A only risk modeling) due to the fact that traditional D&O insurance has all three insuring clauses (A, B and C).
Note also that the Side-A risk models are much less complex. The first Side-A “model” is based on a regression model wherein revenue correlates to the size of the Side-A settlements. This correlation has proven to be strong, especially for bankruptcy and back-dating options claims. The second Side-A model is more of a rule of thumb based on market cap. It relies on the fact that as a matter of practice, most companies consistently purchase enough Side-A only D&O insurance limits to get into the range of 24% to 36% of the total D&O limits purchased. Thus, we offer that calculation (36% in our example above) as part of the final modeling results because some clients may “overrule” the Side-A modeling and simply buy additional Side-A D&O only coverage in the event that this number would otherwise fall too far below 25%.
SummaryThe evolution of D&O insurance has led us to a point where the purchase of this insurance is both widespread and critical to attracting and maintaining strong independent board members. An important question for at least the past 25 years has been, “How much in limits should we purchase?” While benchmarking is a good tool, a robust model customized to the client’s own risk characteristics is an even more powerful tool for assessing D&O risk. Gallagher DOME estimates have proven to give accurate assessments of public company D&O risk over the past 17 years, providing our clients with valuable guidance on this very important topic.

Two Pierce Place Itasca, IL 60143-3141
About the AuthorPhil Norton, Ph.D., is Vice Chairman for the Midwest Region and a Managing Director in Arthur J. Gallagher & Co.’s Management Liability Practice. This practice focuses on providing insurance and risk management solutions related to executive and management liabilities.
For more information, contact:
Phil Norton, Ph.D.Vice Chairman, Midwest RegionGallagher Management Liability [email protected]/mlp
16BSD28390A
GallagherManagement LiabilityPractice


![IN THE UNITED STATES DISTRICT COURT FOR THE DISTRICT …securities.stanford.edu/filings-documents/1040/...promulgated thereunder by the SEC [17 C.F.R. § 240.10b-5], which permits](https://img.dokumen.tips/doc/110x75/5e9791ee3e0ce525ca4cd739/in-the-united-states-district-court-for-the-district-promulgated-thereunder.jpg)


![10B-LR 10B-SUB - Bryston10B].pdf · The 10B crossover is available in three stock versions; 10B-SUB incorporating frequencies more ... MONO LOW PASS MODE (10B-SUB AND 10B-STD ONLY):](https://img.dokumen.tips/doc/110x75/5afd7a367f8b9a434e8d9dda/10b-lr-10b-sub-10bpdfthe-10b-crossover-is-available-in-three-stock-versions.jpg)