Embed Size (px)
Citation preview

arX
iv:a
stro
-ph/
0102
056
v1
3 Fe
b 20
01
Galaxy Formation and Evolution: RecentProgress
By RICHARD ELLIS
California Institute of Technology MS 105-24, Pasadena, CA 91125 USA
In this series of lectures†, I review recent observational progress in constraining models of galaxyformation and evolution highlighting the importance advances in addressing questions of theassembly history and origin of the Hubble sequence in the context of modern pictures of structureformation.
1. Introduction
These are exciting times to be working on any aspect of studies of galaxies at highredshift whether observational or theoretical. Most would agree that the current periodrepresents something of a golden era in the subject. Figure 1 shows the increasing extentto which articles concerned with galaxy evolution dominate the published literature overthe past 25 years (gauged xenophobically I’m afraid by keyword statistics only in twoNorth American journals).
To try and understand the cause for this prominence in the subject, the dates associ-ated with the commissioning of some major observational facilities have been marked.The progress appears to have been driven largely by new kinds of optical and near-infrared data: faint counts and searches for primaeval galaxies in the late 1970’s and early1980’s (Peterson et al 1979, Tyson & Jarvis 1979, Kron 1980, Koo 1985), faint galaxy red-shift surveys made possible by multi-object spectrographs in the late 1980’s and early1990’s (Lilly et al 1995, Ellis et al 1996, Cowie et al 1996, Cohen et al 2000), the launchof Hubble Space Telescope (HST) and its revelation of resolved galaxy images to signif-icant redshifts (Griffiths et al 1994, Glazebrook et al 1995, Brinchmann et al 1998), theremarkable Hubble Deep Field image (Williams et al 1996) and the plethora of papersthat followed (Livio, Fall & Madau 1998) and the arrival of the Keck telescopes bring-ing a new wave of faint Lyman-break galaxy spectroscopy at unprecedented redshifts(Steidel et al 1996, Steidel et al 1999)‡.
One often hears claims that a subject undergoing spectacular progress is one that isnearing completion (c.f. Horgan 1997). After all, the rise in Figure 1 clearly cannotcontinue indefinitely and fairly soon, it could be argued, we will then have solved all ofthe essential problems in the subject. As if anticipating this, a theoretical colleague gavea recent colloquium at my institute entitled Galaxy Formation: End of the Road !
† Lectures given at the XIth Canary Islands Winter School of Astrophysics “Galaxies at HighRedshift” in November 1999 updated to reflect progress in the subject during 2000
‡ A correlation was also made with three key international conferences (Larson & Tinsley 1978,Frenk et al 1988, Livio, Fall & Madau 1998) but I was horrified to see that these appeared to havehad a negative effect on the community’s output! I assume this arose from a much-needed periodof post-conference reflection!
1

2 Richard S. Ellis: Galaxy Formation and Evolution
Consider the evidence. Observationally we may soon, via photometric redshifts, have de-termined the redshift distribution, luminosity evolution and spatial clustering of sourcesto unprecedented limits. If one accepts photometric redshifts are reliable, the rate ofprogress in the traditional pursuit of N(m, color, z) is limited solely by the field of viewof the telescope and the exposure times adopted. Panchromatic data matching that ob-tained with optical and near-infrared telescopes from SIRTF, FIRST, and ALMA will alsoenable us unravel the cosmic star formation history ρSFR(z) to unprecedented precision(Madau et al 1996, Blain et al 1999). It has already been claimed that the above data, e.g.N(m, color, z) and ρSFR(z), can be understood in terms of hierarchical models of structureformation where galaxies assemble through the cooling of baryonic gas into merging colddark matter halos (CDM, Kauffmann et al 1994, Baugh et al 1998, Cole et al 2000a).
The word ‘concordance’ was recently coined astrophysically in an article reconcilingdifferent estimates of the cosmological parameters (Ostriker & Steinhardt 1996). Suchconcordance in our understanding of galaxy evolution is a natural consequence of semi-analytical theories whose sole purpose is to explain the ‘big picture’ as realised with theextant galaxy data. In this series of lectures I want to show that we have our work cutout for some considerable time! Exciting progress is definitely being made, but observersmust rise to the challenge of testing the fundamentals of contemporary theories such asCDM and theorists must get ready to interpret qualitatively new kinds of data that wecan expect in the next decade.
Figure 1: The remarkably rapid growth in galaxy evolution studies: the fraction of theApJ and AJ literature containing the key word ‘galaxy evolution’ over the past 25 years.The inset shows the marked decline in the use of galaxies as probes of the cosmologicalparameters during 1970-1980 (after Brinchmann, Ph.D. thesis 1998).
These lectures are intended for interested graduate students or postdocs entering thefield. There is an obvious observational flavor although I have tried to keep in perspec-tive an ultimate goal of comparing results with recent CDM predictions. The bias is

Richard S. Ellis: Galaxy Formation and Evolution 3
largely to optical and near-infrared applications; there is insufficient space to do justiceto the rapidly-developing contributions being made at sub-millimetre, radio and X-raywavelengths which other contributors at this winter school will cover in detail.
2. Galaxy Formation and Cosmology
Traditionally faint galaxies were studied in order to constrain the cosmological worldmodel (Sandage 1961); their evolution was considered just one more tedious correction(the so-called evolutionary correction) in the path to the Holy Grail of the decelerationparameter qo (≡ ΩM/2 in Λ=0 Friedmann models). The most useful galaxies in thisrespect were giant ellipticals in rich clusters. Tinsley (1976) demonstrated how sensitivethe derived q0 was to the assumed main sequence brightening with look-back time in thesepopulations.
The traditional view for the formation history of an elliptical followed Eggen, Lynden-Bell & Sandage (1962). Monolithic collapse and rapid star formation leads to a subsequenttrack known as ‘passive evolution’ (i.e. without further star formation). Tinsley showedthat main sequence brightening in such a stellar population is largely governed by therate at which stars evolve off the main sequence, i.e. the slope x(≃ 1) of the initial massfunction at the typical turnoff mass 0.4–1M⊙. Whence:
E(z, t) = d Mv/d lnt ∼ 1.3 − 0.3 x (2.1)
and, in terms of its bias on qo:
∆ qo = 1.4(Ho to)−1 d Mv/d lnt = 1.8 − 0.42 x (2.2)
Tinsley argued that one would have to know the evolutionary correction to remarkableprecision get a secure value of qo. In fact, noting that the difference in apparent magnitudefor a standard candle at z=1 between an empty and Einstein-de Sitter Universe is only≃0.5 mag, the relative importance of cosmology and evolution can be readily gauged.
Despite the above, it is always a mystery to me why several of our most eminent as-tronomers (Kristian et al 1978, Gunn & Oke 1975) continued to pursue the Hubble dia-gram as a cosmological probe using first-ranked cluster galaxies, in some cases for severalyears after the challenge of resolving the evolutionary correction became known. Tam-mann (1985) estimated about 400 nights nights of Palomar 200-inch time was consumedby the two competing groups whose resulting values of qo fundamentally disagreed. Re-cently Aragon-Salamanca (1998) showed, in a elegant summary of the situation, how themodern K-band Hubble diagram is most likely complicated further by the fact that first-ranked cluster galaxies are still assembling their stars over the redshift interval 0< z <1,offsetting the main sequence brightening (Figure 2).
In the late 1970’s therefore, the motivation for studying faint galaxies became one ofunderstanding their history rather than using them as tracers of the cosmic expansion(see inset panel in Figure 1). This is not to say that uncertainties in the cosmologicalmodel do not affect the conclusions drawn. The connection between cosmology and sourceevolutions remains strong in three respects:

4 Richard S. Ellis: Galaxy Formation and Evolution
Figure 2: A recent appraisal of the prospects of securing cosmological constraints fromthe Hubble diagram of brightest cluster galaxies (Aragon-Salamanca et al 1998). Lumi-nosity evolution is parameterised as L = L(0) (1 + z)γ . For qo=0, the top panel showsresiduals and best fit trend applying k-correction and luminosity distance effects only; noluminosity evolution is seen. The middle and bottom panels show the residuals when evo-lution is modeled for single burst populations formed at zF =2 and 5, respectively. High zgalaxies are less luminous than expected, presumably because they are still accreting mate-rial. Quantitatively, the effect amounts to a factor of 2-4 less stellar mass depending onthe assumed qo (c.f. van Dokkum et al 1999).
(a) We use our knowledge of stellar evolution to predict the past appearance of stellarpopulations in galaxies observed at high redshift. However, stellar evolution is baselined inphysical time (the conventional unit is the Gyr: 109yr), whereas we observe distant sourcesin redshift units. The mapping of time and redshift depends on the world model. Broadlyspeaking there is less time for the necessary changes to occur in a high ΩM universe andconsequently evolutionary trends are much stronger in such models.
(b) Many evolutionary tests depend on the numbers of sources, the most familiar beingthe number-magnitude count which is remarkably sensitive to small changes in source lu-minosity. However, the relativistic volume element dV (z) depends sensitively on curvaturebeing much larger in open and accelerating Universes than in the Einstein-de Sitter case.
(c) Predictions for the mass assembly history of a galaxy in hierarchical models dependalso on the cosmological model in a fairly complex manner since these models jointlysatisfy constraints concerned with the normalisation of the mass power spectrum via thepresent abundance of clusters (e.g. Baugh et al 1998). Figure 3 illustrates one aspect ofthis dependence (Kauffmann & Charlot 1998); structure grows more rapidly in a dense
Richard S. Ellis: Galaxy Formation and Evolution 5
Universe so the decline with redshift in the abundance of massive spheroidal galaxies,which are thought in this picture to forms via mergers of smaller systems, is much moremarked in high density models than in open or accelerating Universes.
Figure 3: The abundance of massive (>1011M⊙) systems as a function of redshift intwo hierarchical models (Kauffmann & Charlot 1998) showing the strong decline in a highdensity (τCDM) model c.f. that in a low density accelerating model (ΛCDM).
Fortunately, we are making excellent progress in constraining the cosmological parame-ters from independent methods, the most prominent of which include the angular fluctu-ation spectrum in the microwave background (de Bernardis et al 2000, Balbi et al 2000),the Hubble diagram of distant Type Ia supernovae (Garnavich et al 1998, Perlmutter et al 1999),the abundance of rich clusters at various epochs (Bahcall & Fan 1998) and the redshift-space distortion in large redshift surveys such as 2dF (Peacock et al 2000).
Given it matters, how then should we respond to the widely-accepted concordance inthe determination of Ho, ΩM , Λ from various probes (Ostriker & Steinhardt 1996, Bahcall1999)? The claimed convergence on the value of Hubble’s constant (Mould et al 2000)is not so important for the discussion below since most evolutionary tests are primarilyconcerned with relative comparisons at various look-back times where Ho cancels. Themost bewildering aspect of the concordance picture is the resurrection of a non-zero Λ,the evidence for which comes primarily from the Hubble diagram for Type Ia supernovae.
As a member of the Supernova Cosmology Project (Perlmutter et al 1999) I obviouslytake the supernova results seriously! However, this does not prevent me from being sur-prised as to the implications of a non-zero Λ. The most astonishing fact is how readilythe community has apparently accepted the resurrection of Λ - a term for which thereis no satisfactory physical explanation (c.f Wang et al 2000). To one poorly-understandcomponent of the cosmic energy density (non-baryonic dark matter), we seem to have

6 Richard S. Ellis: Galaxy Formation and Evolution
added another (vacuum energy). It seems a remarkable coincidence that all three signif-icant constituents (ΩB, ΩDM , ΩΛ) are comparable in magnitude to within a factor of 10,and hardly a step forward that only one is physically understood!
The lesson I think we should draw from the cosmic concordance is similar to the commentI made in §1 when we discussed some theorists’ triumphant reconciliation of their theorieswith faint galaxy data (a point we will debate in detail in §3). In both cases, the hypothesiscertainly reproduces a wide range of observations but note it takes, as input, parametersfor which there is not yet a clear physical model. One should not, therefore, regarda concordant picture as anything other than one of many possible working hypotheses.In the case of the cosmological models, we need to invest effort into understanding thephysical nature of dark matter and vacuum energy. In the case of galaxy evolution ourgoal should be to test the basic ingredients of hierarchical galaxy formation.
3. Star Formation Histories
One of the most active areas of relevance to understanding the rate at which galaxiesassemble is concerned with determining the cosmic star formation history. The idea issimple enough. A systematic survey is conducted according to some property that issensitive to the on-going rate of star formation. The volume-average luminosity density isconverted into its equivalent star formation rate averaged per unit co-moving volume andthe procedure repeated as a function of redshift to give the cosmic star formation historyρ∗(z). In this section we will explore the uncertainties and also the significance of thisconsiderable area of current activity in terms of the constraints they provide on theoriesof galaxy formation.
The joint distribution of luminosity L and redshift z, N(L, z), for a flux-limited samplepermits the construction of the luminosity function Φ(L) according to procedures whichare reviewed by Efstathiou, Ellis & Peterson (1988) and compared by Ellis (1997) . Theluminosity function is often characterised according to the form defined by Schechter(1976), viz:
Φ(L) dL/L∗ = Φ∗ (L/L∗)−α exp(−L/L∗) dL/L∗ (3.3)
in which case the integrated number of galaxies per unit volume N and the luminositydensity ρL then becomes:
N =
∫Φ(L) dL = Φ∗ Γ(α + 1) (3.4)
and
ρL =
∫Φ(L) L dL = Φ∗ L∗ Γ(α + 2) (3.5)
and the source counts in the non-relativistic case, applicable to local catalogs, is:
N(< m) ∝ d∗ 3(m)
∫dL Φ(L) (L/L∗)
3
2 ∝ Φ∗ L∗ 3
2 Γ(α +5
2) (3.6)
Frequently-used measures of star formation in galaxies over a range of redshift includerest-frame ultraviolet and blue broad-band luminosities (Lilly et al 1995, Steidel et al 1996,

Richard S. Ellis: Galaxy Formation and Evolution 7
Sullivan et al 2000), nebular emission lines such as Hα (Gallego et al 1995, Tresse &Maddox 1998, Glazebrook et al 1999), thermal far-infrared emission from dust clouds(Rowan-Robinson et al 1997, Blain et al 1999) and, most recently, radio continuum emis-sion (Mobasher et al 1999).
Since only a limited range of the luminosity function centered on L∗ is reliably probedin flux-limited samples, a key issue is how well the integrated luminosity density ρL canbe determined from such surveys. In the Schechter formalism, equations [3.4] and [3.5]show that whilst N would diverge for α <–1, the luminosity density is convergent unlessα <–2.
Figure 4: The luminosity function for galaxies selected at 2000 A from the recent surveyof Sullivan et al (2000). The histogram and associated numbers indicate the absolutemagnitude distribution observed which is corrected by volume and k-correction effects togive the data points. The dotted curve illustrates the considerable effect of extinctionas gauged by Balmer decrements determined individually for those galaxies with emissionlines. Such uncertainties translate in factors of two uncertainty in the local UV luminositydensity.
Figure 4 shows the local rest-frame ultraviolet (2000 A ) luminosity function from Sulli-van et al (2000) whose faint end slope α=–1.6 is markedly steeper than that found for sam-ples selected in the near-infrared (Mobasher et al 1993, Gardner et al 1997, Cole et al 2000b)(where α ≃-1). This contrast in the luminosity distribution of young and old stellar pop-ulations is an important result which emphasizes the relatively weak connection betweenstellar mass and light and implies there may be significant uncertainties in the estimationof integrated luminosity densities for star-forming populations.

8 Richard S. Ellis: Galaxy Formation and Evolution
Kennicutt (1998) carefully reviewed the relationships between the various observationaldiagnostics listed above and the star formation rate. Clearly a major uncertainty inany transformation based on the ultraviolet/optical continuum or nebular emission linemeasures is the likely presence of absorbing dust (Figure 4). Other uncertainties includethe form of the initial stellar mass function and the nature of the star formation historyitself.
Figure 5: Star formation rates derived from UV (2000 A ) continua versus those derivedfrom Hα fluxes from the local survey of Sullivan et al (2000, open squares) and the z ≃1samples of Glazebrook et al (1999, large stars). For the Sullivan et al sample, extinctioncorrections were derived from individual Balmer decrements assuming Case B recombina-tion and applied to the Hα fluxes in the upper panel and both estimates in the lower panel.
Some of these uncertainties are quite imponderable and the only way to estimate theireffect in typical populations is to undertake a comparison of the various diagnostics forthe same sample. Sullivan et al (2000) compared UV and Hα-based estimators for theirlocal balloon-based UV-selected sample and Glazebrook et al (1999) undertook a similarcomparison for a restricted incomplete sample of high redshift galaxies (drawn from aI-selected sample). Bell & Kennicutt (2000) independently examined some of Sullivan etal’s conclusions based on a smaller local sample with satellite UV fluxes. The comparisonanalysed by Sullivan et al is shown in Figure 5. Although an overall linear relation isobserved the scatter is quite considerable, greater than accountable from observational
Richard S. Ellis: Galaxy Formation and Evolution 9
errors. The uncertainties would appear to be alarming in view of the fairly modest trendsclaimed in ρSFR(z) (see below).
In addition to the scatter arising from extinction (accounted for via individual Balmeremission line decrements), Sullivan et al suggest that some fraction of their UV-selectedpopulation must be suffering star formation which is erratic in its time history. In such asituation, different diagnostics will be sensitive to bursts of activity for different periods,corresponding to the time over which the contributing stars remain on the main sequence.Hα flux arises from recombination photons linked to those emitted below the Lyman limitfrom main sequence stars with lifetimes ≃106 years. The UV and blue continua persistfor much longer periods (≃ 108 − 109 years).
Depending upon how widespread star formation histories of this kind may be, two formsof error may arise in estimating cosmic star formation histories. Firstly, the star formationrate derived for an individual galaxy will be a past time average, smoothing over any erraticbehavior, rather than a true instantaneous value. More importantly however, particularlyat high redshift, galaxies may be preferentially selected only if their star formation historyis erratic, for example in Hα surveys where some threshold of detectability may seriouslyrestrict the samples.
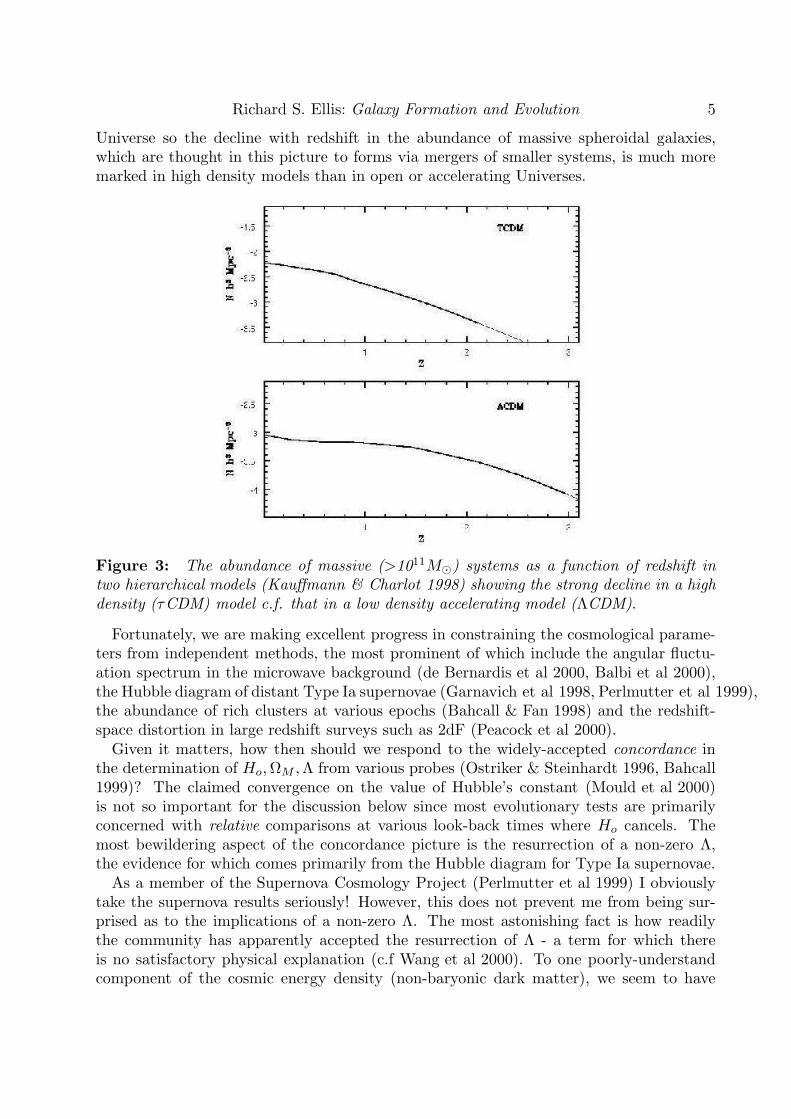
Figure 6 shows a recent estimate of the cosmic star formation history drawn from varioussurveys (Blain 2000). There appears to be a marked increase in activity over 0< z <1 witha possible decline beyond z >2. Although, inevitably perhaps, attention has focused onthe case for the high redshift decline, even the strong rise to z ≃1 remains controversial.Originally proposed independently by Lilly et al (1995) and Fall et al (1996), revisedestimates for the local luminosity density (Sullivan et al 2000) and independent surveys(Cowie et al 1999) have challenged the rapidity of this rise. Part of the problem is thatno single survey permits a self-consistent measurement of ρSFR over more than a verylimited range in z. Most likely, therefore, much of the scatter in Figure 6 is simply amanefestation of the kinds of uncertainties discussed above in the context of Sullivan etal’s survey.
Beyond z≃2, the available star formation rates have been derived almost exclusivelyfrom UV continua in Lyman break galaxies selected by their ‘dropout’ signatures in vari-ous photometric bands (Madau et al 1996, Steidel et al 1996, Steidel et al 1999) and fromcurrently scant datasets of sub-mm sources interpreted assuming thermal emission fromdust heated by young stars (Blain et al 1999, Barger et al 1999b). There has been muchdiscussion on the possible disparity between the estimates derived from these two diagnos-tics (which other lecturers will address). Two points can be made: firstly, the measuredUV luminosity densities will clearly underestimate the true values given likely extinctions.Secondly, the sample of sub-mm sources with reliable redshifts remains quite inadequatefor luminosity density estimates in the sense described above. Most of the constraints arisefrom modelling their likely properties in a manner consistent with their source counts andthe integrated far-infrared background.
Have we become over-obsessed with determining the cosmic star formation history?Observers are eager to place their survey points alongside others on the overall curve anddifferent groups defend their methods against those whose data points disagree. We shouldconsider carefully what role this cosmic star formation history plays in understanding howgalaxies form?

10 Richard S. Ellis: Galaxy Formation and Evolution
Figure 6: The history of recent star formation from the recent compilation of Blain(2000). Data points are taken from a variety of sources referenced in that article. Thicksolid and dashed lines represent trends expected from simple luminosity evolution and hi-erarchical models, respectively. It is clear there is considerable observational scatter at allredshifts, not just beyond z ≃1 as often assumed.
Clearly, the prime conclusion we can draw from Figure 6 is that the stars which makethe galaxies we see today formed continuously over a very wide redshift range. Thismay seem such an obvious deduction that it hardly merits stating but it is important tostress the absence of any obvious detectable ‘epoch of star formation’ as was once imag-ined (Eggen, Lynden-Bell & Sandage 1962, Frenk et al 1988). Hierarchical modelers werequick to point out (e.g. Baugh et al 1998) that they predicted extended star formationhistories as early as 1990 (White & Frenk 1991). It is certainly true that a continuousassembly of galaxies is a major feature of these models and thus one supported by thedata.
However, what about the quantitative form of Figure 6 which remains so difficult to pindown: does the shape of the curve really matter? Firstly, we should recognise that theluminosity density integrates over much detailed astrophysics that may be important. Aparticular ρSFR at a given redshift could be consistent either with a population of estab-lished massive sources undergoing modest continous star formation or a steep luminosityfunction where most of the activity is in newly-formed dwarf galaxies. In terms of struc-ture formation theories, these are very different physical situations yet that distinction islost in Figure 6.
Secondly, theoretically, the cosmic star formation history is not particularly closelyrelated to how galaxies assemble. It is more sensitive to the rate at which gas cools intothe assembling dark matter halos, a process of considerable interest but which involvesa myriad of uncertain astrophysical processes (Figure 7) which are fairly detached fromthe underlying physical basis of say the hierarchical picture. In support of this, we shouldnote that Baugh et al (1999) were able, within the same Λ-dominated CDM model, to

Richard S. Ellis: Galaxy Formation and Evolution 11
‘refine’ their earlier prediction to match new high redshift datapoints revealing a muchless marked decline beyond z≃2.
Figure 7: An illustration of the complex physical processes governing the star formationrate of a young galaxy (courtesy of Carlos Frenk). Star formation is governed by the rateat which baryonic gas cools and falls into dark matter halos and this is inhibited by heating,e.g. from supernovae. The precise form of the cosmic star formation history gives us moreinsight into the interplay between these processes, integrated over all star-forming galaxies,than in distinguishing between various forms of structure formation (e.g. hierarchical vs.monolithic).
4. Morphological Data from HST
As we discussed in §1, one of the most exciting new datasets that arrived in themid-1990’s was the first set of resolved images of galaxies at significant look-back timesfrom HST. Much of the early work was conducted in rich clusters (Couch et al 1994,Dressler et al 1994, Couch et al 1998, Dressler et al 1998) where the well-known ‘Butcher-Oemler’ effect (Butcher & Oemler 1978) - a surprisingly recent increase in the fraction ofblue cluster members - was found to be due to a dramatic shift in the morphology-densityrelation (Figure 8). As recently as z ≃0.3-0.4 (3-4 Gyr ago), cluster S0s were noticeablyfewer in proportion, their place apparently taken by spirals, many of which showed signsof recent disturbances, such a distorted arms and tidal tails.
The physical origin of this transformation from spirals to S0s remains unclear andis currently being explored by detailed spectroscopy of representative cluster members(Barger et al 1996, Abraham et al 1996b, Poggianti et al 1999). A key diagnostic here isthe interplay between the changing morphologies, the presence of nebular emission lines(such as [O II] 3727 A – Hα is generally redshifted out of the accessible range) and Balmerabsorption lines (such as Hδ 4101 A ). The latter lines are prominent in main sequence Astars which linger for ≃1 Gyr after any enhanced starburst activity.

12 Richard S. Ellis: Galaxy Formation and Evolution
Figure 8: Evolution in the morphology density relation from the ‘Morphs’ survey ofDressler et al (1998). (Left) The fraction of E/S0/Spirals as a function of projectedgalaxian surface density for Dressler’s 55 local cluster sample. (Right) As left, for alldistant HST clusters with 0.3< z <0.55. The comparison refers to the same clustercore radius (<0.6Mpc,h=0.5) and includes galaxies to the same rest-frame V luminosity(MV =-20.0). Note the dramatic decline in the S0 population and the marked increase inthe spiral fraction for environments with high projected density.
Barger et al (1996) proposed a simple cycle where an unsuspecting galaxy undergoessome perturbation, perhaps due to a merger or its first encounter with the intraclustergas, subsequently becomes morphologically-distorted and spectrally-active before subsid-ing to a regular spheroidal with a decaying Balmer absorption line. Whereas such a cyclecan explain the proportion of unusual objects, it has difficulty matching their luminosi-ties. A galaxy should be rendered more luminous during a burst and thus blue examplescannot easily be the precursors of the equally-luminous red post-burst cases. A contro-versy has since arisen over the fractions of objects seen in the various spectrally-activeclasses (Balogh et al 1999) suggesting much work is needed in this area, both in quantify-ing cluster-cluster variations and also radial variations in the responsible processes.
Although the cluster work discussed above represents something of a digression inour overall theme, the realisation that galaxies can so easily be transformed morpho-logically has profound implications for our understanding of galaxy formation. Much ofthe early work explaining the Hubble sequence (Tinsley 1977) assumed galaxies evolveas isolated systems, however the abundance of morphologically-peculiar and interact-ing galaxies in early HST images (Griffiths et al 1994) has been used to emphasize theimportant role that galaxy mergers must play in shaping the present Hubble sequence(Toomre & Toomre 1972, Barnes & Hernquist 1992). Merger-induced transformations ofthis kind are a natural consequence of hierarchical models (Baugh, Cole & Frenk 1996).Early disk systems are prone to merge during epochs when the cosmic density is high andthe peculiar velocity field is cold, forming bulge-dominated and spheroidal systems whichmay then later accrete disks.

Richard S. Ellis: Galaxy Formation and Evolution 13
The possibility that galaxies transform from one class to another is a hard hypothesisto verify observationally since, as we have seen, traditionally observers have searched forredshift-dependent trends with subsets of the population chosen via an observed property(color, morphology, spectral characteristics) which could be transient. Moreover, experi-ence ought to teach us that the outcome of tests of galaxy formation rarely come downsimply to either Theory A or Theory B; usually it is some complicated mixture or the ques-tion was naive in the first place! Fortunately, the late formation of massive regular galaxiesin the hierarchical picture (Figure 9) seems a particularly robust prediction and one instark contrast to the classical ‘monolithic collapse’ picture (Tinsley 1977, Sandage 1983).The distinction is greatest for ellipticals presumed to form at high redshift with minimumdissipation (their central density reflecting that of the epoch of formation). Studying theevolutionary history of massive ellipticals is thus an obvious place to start.
Figure 9: The important role of late merging in a typical CDM semi-analytical model(Baugh et al 1996). The panels show the redshift-dependent growth for the stellar mass(left) and that of all baryonic material (right), as indicated by the thickness of the black areaat a given epoch, for two present-day massive galaxies. The top system grows gradually andis thought to represent a present-day spiral. The bottom system suffers a late equal-massmerger thought to produce a present-day elliptical. Note the remarkably late assembly;most of stellar mass in both cases assembles in the interval 0< z <1.

14 Richard S. Ellis: Galaxy Formation and Evolution
An oft-quoted result in support of old ellipticals is the remarkable homogeneity of theiroptical colors (Sandage & Visvanathan 1978, Bower et al 1992). The idea is simple: theintrinsic population scatter in a color sensitive to recent star formation, such as U − B,places a constraint either on how synchronous the previous star formation history musthave been across the population or, if galaxies form independently, the mean age oftheir stellar populations. By combining cluster data at low redshift (Bower et al 1992)with HST-selected samples at intermediate redshift (Ellis et al 1998), the bulk of thecluster elliptical population was deduced to have formed its stars before z≃2, in appar-ent conflict with hierarchical models. Similar conclusions have been drawn from evolu-tion of the mass/light ratio deduced from the fundamental plane (Ziegler & Bender 1997,van Dokkum et al 1998).
Unfortunately, one cannot generalize from the results found in distant clusters. Inhierarchical models, clusters represent early peaks in the density fluctuations and thusevolution is likely accelerated in these environments (Kauffmann 1995) plus, of course,there may be processes peculiar to these environments involving the intracluster gas. It isalso important to distinguish between the history of mass assembly and that of the stars.Recent evidence for widespread merging of ellipticals in clusters (van Dokkum et al 1999)lends support to the idea that the stars in dense regions were formed at high redshift, inlower mass systems which later merged.
For these reasons, attention has recently switched to tracking the evolution of fieldellipticals. The term field elliptical is something of a misnomer here since a high fractionof ellipticals actually reside in clusters. What is really meant in this case is that we preferto select ellipticals systematically in flux-limited samples rather than concentrate on thosefound in the cores of dense clusters†.
The study of evolution in field ellipticals is currently very active and I cannot possiblydo justice, in the space available, to the many complex issues being discussed. Instead letme summarise what I think are the most interesting results.
• Searches for a population of faint intrinsically red objects, representing the expectedz >1 precursors of passively-evolving ellipticals which formed their stars at high red-shift have been conducted both with and without HST morphological data (Zepf 1997,Barger et al 1999a, Menanteau et al 1999, Daddi et al 2000, McCarthy et al 2000). How-ever, only recently have substantial areas of sky been mapped. This is because suchsearches are most sensitive to high z sources when conducted using optical-near infraredcolors and access to large infrared arrays is a recent technical development. Both Daddi etal (2000) and McCarthy et al (2000) (Figure 10) claim strong angular clustering in theirfaint red populations and there is limited evidence that the abundance is consistent witha constant comoving number density, in contrast to the hierarchical predictions. How-ever, without confirmatory spectroscopy neither the redshift range nor the nature of thesered sources is yet clear. Even if it later emerges, as was claimed on far less convincingdata (Zepf 1997, Barger et al 1999a, Menanteau et al 1999), that there is a shortage ofintrinsically red objects beyond z ≃1, only a modest amount of residual star formationis needed to substantially bluen a well-established old galaxy (Jimenez et al 1999). Even
† A major concern in all the work relating to the evolution of galaxies in clusters is preciselyhow the clusters were located.

Richard S. Ellis: Galaxy Formation and Evolution 15
when redshift data is secured, color alone may be an unreliable way to track a specificpopulation.
Figure 10: Evidence for a clustered population of red objects in a 1000 arcmin2 area ofthe ongoing Las Campanas Infrared Survey (McCarthy et al 2000). The angular correla-tion function for objects with I − H >3.5 (top set of data points) is substantially abovethat for all H-selected galaxies (bottom set) and consistent with a high fraction of the redobjects being clustered ellipticals with z ≃1.0-1.5.
• At brighter magnitudes, systematic redshift surveys with associated HST data giveconstraints on the luminosity function and colors of morphologically-selected ellipticals(Brinchmann et al 1998, Schade et al 1999, Menanteau et al 1999, Im et al 2000). Unfor-tunately, because of the disparity in field of view betweeen WFPC-2 and the ground-basedmultislit spectrographs, the samples remain small and hence the conclusions are subjectto significant field-to-field clustering uncertainties. However, no substantial decline inthe volume density of ellipticals is yet observed to z ≃1, although there is some disputeas to the fraction which may deviate in color from the passive track (Im et al 2000 c.f.Menanteau et al 1999). Current spectroscopic surveys may not be quite deep enough tocritically test the expected evolution in the hierarchical models, particularly if Λ 6=0.
• A completely independent method of determining whether field ellipticals form conti-nously as expected in hierarchical models is possible in the Hubble Deep Fields (Menanteauet al 2000). Here, the imaging signal/noise is sufficient to permit an examination of theinternal colors of ellipticals with I <24, a subset of which have redshifts. Menanteau etal (2000) find about 25% of the HDF ellipticals show blue cores and other color inho-mogeneities suggestive of recent star formation, perhaps as a result of the merger with agas-rich low mass galaxy. Keck spectroscopy (Ellis et al 2001) supports this suggestion:galaxies with blue cores generally show emission and absorption line features indicativeof star formation (Figure 11). The amount of blue light seen in the affected ellipticalscan be used to quantify the amount of recent star formation and the associated spectrum

16 Richard S. Ellis: Galaxy Formation and Evolution
can be used to estimate the timescale of activity through diagnostic features of main se-quence stars. Only modest accretion rates of ≃10% by mass over ≃1 Gyr are implied,albeit for a significant fraction of the population. This continued growth, whilst mod-est c.f. expectations of hierarchical models, is noticeably less prominent in rich clusters(Menanteau et al 2000).
Figure 11: Color inhomogeneities in HDF field ellipticals suggest continued star forma-tion is occurring, possibly as a result of hierarchical assembly. Each row displays the Iband HST image, a V − I color image and the Keck LRIS spectrum. The top set refers toa z=0.92 elliptical with a blue core; its spectrum shows features indicative of active starformation ([O II] emission and deep Balmer absorption lines). The bottom set refers toa quiescent example at z=0.966 whose spectrum is consistent with an old stellar popula-tion. The amount of blue light can be combined with the depth of the spectral features tostatistically estimate the amount and timescale of recent star formation.
What evolution is found in the properties of other kinds of galaxy? Brinchmann et al(1998) secured HST images for a sizeable and statistically-complete subset of CFRS andLDSS redshift survey galaxies and found the abundance of spirals to I=22 - a flux limitwhich samples 0.3< z <0.8 - is comparable to that expected on the basis of their local abun-dance if their disks were somewhat brighter and bluer in the past as evidenced from surfacephotometry (Lilly et al 1999). In practice, however, the detectability of spiral disks is af-fected by a number of possible selection effects (Simard et al 1999, Bouwens & Silk 2000)and it may be some time before a self-consistent picture emerges.
A less controversial result from Brinchmann et al (1998) claimed in earlier analyseswithout redshift data (Glazebrook et al 1995, Driver et al 1995) is the remarkably highabundance of morphologically-peculiar galaxies in faint HST data. Brinchmann et alquantified this in terms of the luminosity density arguing that a substantial fraction of the

Richard S. Ellis: Galaxy Formation and Evolution 17
claimed decline in the blue luminosity density since z ≃1 (c.f. Figure 6) arises from thedemise of this population (Figure 12).
Figure 12: The morphological dependence of the blue luminosity density from that sub-set of the CFRS/LDSS redshift survey imaged with HST (Brinchmann et al 1998). Themarked decline in the luminosity density of galaxies with peculiar morphology over 0< z <1is the primary cause for steep slope in the blue faint galaxy counts.
Given our earlier concerns with over-interpreting the cosmic star formation history,should we be cautious in drawing conclusions from Figure 12? Although Brinchmann etal’s redshift sample is small, the basic result is consistent with the HST morphologicalnumber counts where much larger samples are involved. Whereas early skeptics arguedthat morphologically-peculiar galaxies represent regular systems viewed at unfamiliar ul-traviolet wavelengths, recent NICMOS imaging (see Dickinson’s lectures) suggests such‘morphological bandshifting’ is only of minor consequence. In quantitative detail, as be-fore, uncertain corrections must be made for the effects of the flux limited sample and ofcourse extinction is a major uncertainty. However, it seems inescapable that the bulk ofthe decline in blue light (the so-called faint blue galaxy problem, Ellis 1997) arises from thedemise of a population of late-type and morphologically-peculiar systems. A key questiontherefore is what happened to this population? We will address this problem in the nextsection.
5. Constraining the Masses of Distant Galaxies
A recurring issue arises from the discussions in the earlier sections. Whilst observersare, with some restrictions, able to measure distant galaxy properties such as rest-framecolors, luminosities and star formation rates, these may be poor indications of the under-lying stellar and total masses predicted most straightforwardly by contemporary models

18 Richard S. Ellis: Galaxy Formation and Evolution
of structure formation. Either we put our faith in the forward modelling of the readily-available observables (i.e. we invest a lot of effort in understanding the complexities offeedback, Figure 7), or we consider how to measure galactic masses.
Ideally we seek methods for determining the total mass (baryonic plus the dark matterhalo) but this seems out of reach for the moment except for local systems with tracers ofthe larger halo in which galaxies are thought to reside. Useful tracers here include the dy-namical properties of attendant dwarf galaxies (Zaritsky et al 1998) and globular clusters(Huchra et al 1998). A promising route in the future might be galaxy-galaxy gravitationallensing (Blandford & Narayan 1992). Here a foreground population is restricted in its se-lection, perhaps according to morphology or redshift, and the statistical image distortionsin a background population analysed. Early results were based on HST data, for clus-ter spheroidals (Natarajan et al 1999) and various field populations (Griffiths et al 1996),however with extensive panoramic data from the Sloan Digital Sky Survey, convincing sig-nals can be seen with ground-based photometry (Fischer et al 2000). Again, photometricredshifts will be helpful in refining the sample selection and in determining the preciseredshift distribution essential for accurate measures on an absolute scale.
Unfortunately, promising though the technique appears, the restrictions of galaxy-galaxylensing are numerous. It only gives mass estimates for statistical samples: the signalis too weak to be detected in individual cases, unless a strong lensing feature is seen(Hogg et al 1996). Moreover, the redshift range and physical scale on which the mass isdetermined is defined entirely by geometrical factors and, ultimately, one may never beable to apply the method to galaxies beyond z ≃1.
Extensive dynamical data is becoming available for restricted classes of high redshiftgalaxy, via linewidth measures (Koo et al 1995), resolved rotation curves (Vogt et al 1997)for sources with detectable [O II] 3727 A emission, and via internal stellar velocity disper-sions for absorption line galaxies such as spheroidals. Under certain assumptions, thesegive mass estimates and have enabled the construction of the fundamental plane for distantspheroidals (Treu et al 2000) and the Tully-Fisher relation for high redshift disk galaxies(Vogt et al 1997). The greatest progress in the former has been in constructing the funda-mental plane in rich clusters (van Dokkum et al 1998) where slow evolution in the inferredmass/light ratio for cluster ellipticals is consistent with a high redshift of formation (see§5). For the emission line studies it is not straightforward to convert data obtained over alimited spatial extent into reliable masses even for regular well-ordered systems. For com-pact and irregular sources, the required emission lines may come from unrepresentativecomponents yielding poor mass estimates (Lehnert & Heckman 1996).
The prospects improve significantly if we drop the requirement to measure the total massand are willing to consider only the stellar mass. In this case, the near-infrared luminosityis of particular importance. Broadhurst et al (1992) and Kauffmann & Charlot (1998)have demonstrated that the K (2µm) luminosity is a good measure of its underlyingstellar mass regardless of how that mass assembled itself (Figure 13). This remarkablefact arises because K-band light in all stellar populations (whether induced in bursts orcontinuous periods of activity) arises from long-lived giants whose collective output mirrorsthe amount of past activity, smoothing over its production timetable.

Richard S. Ellis: Galaxy Formation and Evolution 19
Figure 13: The K-band luminosity is a good measure of the underlying stellar massirrespective the past star formation history (Kauffmann & Charlot 1998). The curvesshow the observed K magnitude as a function of the redshift at which such an object isselected for a system containing 1011M⊙ produced according to a variety of star formationhistories. Even across extreme cases (single burst at z = ∞, solid line, to a constantstar formation rate to the epoch of observation, short-dash), the K-band output remainsthe same to within a factor of ≃2. The lower panel shows, how different the observedoptical-infrared color would be in these cases.
A deep K-band redshift survey thus probes the very existence of massive systems at earlytimes. A slightly incomplete survey to K=20 (Cowie et al 1996) and a complete photo-metric survey to K=21 (Fontana et al 1999) indicates an apparently shortfall of luminousK objects beyond z ≃1-1.5 c.f. pure luminosity evolution models. Unfortunately, smallsample sizes, field-to-field clustering, spectroscopic incompleteness and untested photo-metric redshift techniques beyond z≃1 each weaken this potentially important conclusion.An important goal in the immediate future must be to reconcile these claims with theapparently abundant (and hence conflicting) population of optical-infrared red objects toK ≃19-20 (Daddi et al 2000, McCarthy et al 2000).
The precision of the technique introduced by Kauffmann & Charlot (1998) can be im-proved if the optical-infrared color is available as an extra parameter (Ellis et al 2000).

20 Richard S. Ellis: Galaxy Formation and Evolution
Figure 14: The infrared method for determining the stellar mass of a distant galaxy(Ellis et al 2000). The technique fits the observed SED for a galaxy of known redshift inthe context of evolutionary synthesis models where the stellar mass is the fitted variable.(Top) Likelihood functions for the derived logarithmic stellar mass for sample galaxies inthe CFHT/LDSS redshift survey (Brinchmann, Ph.D. thesis 1998); a typical uncertaintyof 30-50% is secured at I≃22. (Bottom) Correlations of stellar and dynamical mass forboth low z (circles) and high z (squares with error bars) galaxies from the analysis ofBrinchmann & Ellis (2000).

Richard S. Ellis: Galaxy Formation and Evolution 21
In this way a first-order correction can be made for the past star formation history andhence the effect of the spread in the lower panel of Figure 13 can be used to improve themass estimate. Importantly, such a technique for determine accurate stellar masses canthen be applied to all galaxies, regular or peculiar, irrespective of their dynamical stateand over a range in redshift (providing the data is sufficiently precise). The techniquecan be considered as a modification of that frequently utilised in estimating photometricredshifts. The observed optical-infrared SED for an object of known redshift is used tooptimally fit the stellar mass rather than the redshift in the framework of an evolutionarysynthesis code. Stellar masses can be derived to within a random uncertainty of 30-50%by this technique although at present there is no reliable way to verify the results exceptby comparison with independent dynamical measures (Figure 14).
Figure 15: Evolution of the stellar mass density ρstars(z, T ) from the analysis of Brinch-mann & Ellis (2000). A remarkable decline with time in stellar mass density is seen forthe morphologically-peculiar class which argues against a truncation of their star forma-tion activity as the primary cause for their demise. Brinchmann & Ellis argue that thispopulation must be transforming, possibly via mergers, into the regular classes. A simplemodel which implements a likely redshift-dependent merger rate (LeFevre et al 2000) withelliptical products can broadly reproduce the trends observed (shaded area of the plot).
6. Origin of the Hubble Sequence
The availability of stellar masses for all types enables the construction of a powerfulevolutionary plot, analogous to Figure 6, involving the stellar mass density, ρstars(z, T ),as a function of morphology T . Whilst the stellar mass density can grow by continuedstar formation, unlike the UV luminosity density, ρUV , it is difficult to imagine how it

22 Richard S. Ellis: Galaxy Formation and Evolution
can decline. As we saw earlier ρUV can decline significantly in only 1-2 Gyr because of anabrupt truncation of activity. However, such a change would have very little effect on theinfrared output as illustrated in Figure 13.
Brinchmann and Ellis (2000) secured K luminosities and optical-IR SEDS for over 300galaxies in the CFRS/LDSS and Hawaii survey fields and derive ρstars(z, T ) (Figure 15).Estimating the integrated stellar mass density is prone to all of the difficulties reviewedearlier for the luminosity density and there is the added complication that the redshiftsurveys in question are optically-selected and thus must miss some (red) fraction of a trueK-limited sample. Accordingly, the mass densities derived are lower limits to the truevalues.
Remarkably, ρstars(z, T ) is a declining function for the intriguing population of morphologically-peculiar galaxies. Whereas the declining UV luminosity density could imply a fading popu-lation, such an explanation cannot be consistent with Figure 15 which argues, instead, thatthe objects are genuinely disappearing into other systems. The most logical explanationfor their declining contribution to the stellar mass density is that morphologically-peculiarobjects are being transformed, e.g. by mergers, into regular objects.
Figure 16: An increase in the merger fraction as a function of redshift from the HSTanalysis of LeFevre et al (2000). Galaxies of known redshift were examined for satellitesbrighter than a fixed rest-frame luminosity within a projected radius of 20h−1 kpc andcorrections made for unrelated line-of-sight contamination. This redshift-dependent mergerrate was adopted by Brinchmann & Ellis (2000) in Figure 15.
Merging has been an attractive means for governing the evolution of galaxies for manyyears (Toomre & Toomre 1972, Rocca-Volmerange & Guiderdoni 1989, Broadhurst et al 1992)and of course is fundamental to the hierarchical formation picture. However it has beenextremely difficult to determine the observed rate at intermediate redshift. The fundamen-tal problem is that we observe galaxies at various look-back times via discrete ‘snapshots’

Richard S. Ellis: Galaxy Formation and Evolution 23
without ever being able to prove two associated systems are destined to merge on a par-ticular timescale. Using the CFRS/LDSS HST dataset referred to earlier, LeFevre et al(2000) undertook a quantitative survey of the fraction of luminous galaxies with satellitesbrighter than a fixed absolute magnitude within a 20h−1 kpc metric radius and, afterallowance for projection effects, determined the merger fraction increases with redshiftas ∝ (1 + z)3.4±0.5 - a result consistent with earlier ground-based efforts. Sadly, it isnot straightforward to convert the proportion of galaxies with associated sources into aphysical merger rate or, as ideally required, a mass assembly rate without some indicationof the dynamical timescale for each merger and the mass of each satellite. Moreover, thereare several annoying biases that affect even the derived merger fraction.
Brinchmann & Ellis (2000) attempted to reconcile the decline of the morphologically-peculiar population, the redshift dependence of the LeFevre et al merger fraction and asso-ciated evidence for continued formation of ellipticals (Menanteau et al 2000) into a simpleself-consistent picture. They transferred the dominant population of morphologically-irregular galaxies, via the z-dependent merger rate, into a growth in the regular galaxies(shaded area of Figure 15). This is clearly a simplistic view, but nonetheless, gives a crudeempirical rate at which regular galaxies are assembling. If correct, how does this agreewith mass assembly histories predicted, say in ΛCDM?
Figure 17: Predicted evolution in stellar mass functions for disk and spheroidal pop-ulations in a ΛCDM hierarchical model (Frenk, priv. comm). The curves define massfunctions as a function of redshift (z=0,0.5,1,2, from right to left). Modest growth over0< z <2 is expected for disk galaxies but significant growth is predicted for massivespheroidals.

24 Richard S. Ellis: Galaxy Formation and Evolution
Figure 17 shows a recent prediction of the assembly history of spheroids and disks(Frenk, private communication). Although there are some discrepancies between this andits equivalent prediction from Kauffmann & Charlot (1998, Figure 3), the trends are clear.The strongest evolutionary signal is expected in terms of a recent assembly of massivespheroids; the equivalent growth rate in stellar disks is more modest. To the extent itis currently possible to test this picture, the qualitative trend is supported by the data.Field ellipticals are certainly still assembling (Menanteau et al 2000) but perhaps moreslowly than expected according to Figure 17; unfortunately deeper samples with redshiftsare needed for a precise statement. Brinchmann (in prep.) has examined the stellar massgrowth rate in disks using the infrared-based method over 0< z <1 and finds only modestchanges. This is very much a developing area and one that would benefit from significantlyenlarged HST datasets chosen to overlap the growing faint redshift survey databases.
Figure 18: Face-on barred spirals of known redshift in the Hubble Deep Field. Abrahamet al (1999) claim that all such systems should easily be recognised to z≃1 in HDF-qualitydata whereas, beyond z≃0.6, there appears to be a marginal paucity of such systems com-pared to their non-barred counterparts. If supported by further data, this could indicate anepoch corresponding to the ‘dynamical maturing’ of stellar disks.
The HST data, particularly that in the Hubble Deep Fields (HDF), is an astonishinglyrich resource which is still not completely exploited. As an indication of what might be

Richard S. Ellis: Galaxy Formation and Evolution 25
possible with future instrumentation, I will close with some remarks on the important rolethat bulges and bars may play in the history of the Hubble sequence.
50% of local spirals have bars which are thought to originate through dynamical in-stabilities in well-established differentially-rotating stellar disks. If we could determinethe epoch at which bars begin appearing, conceivably this would shed some light on howrecently mature spirals came to be. Via careful simulations based on local examples, Abra-ham et al (1999) showed that face-on barred galaxies should be recognisable to z ≃1 in theHDF exposures. In fact, many are seen (Figure 18) but tantalisingly the barred fractionof face-on spirals appears to drop beyond a redshift z≃0.6. The effect is marginal butillustrative of a powerful future use of morphological imaging with the Advanced Camerafor Surveys.
The story with bulges is also unclear, although potentially equally exciting. Tradition-ally, bulges were thought to represent miniature ellipticals which formed monolithicallyat high redshift (Eggen, Lynden-Bell & Sandage 1962). Detailed studies of local exam-ples, including the Galactic bulge, have shown a considerable diversity in properties, bothin integrated color and even in their photometric structure (Wyse 1999). There is someevidence of a bimodality in the population; prominent bulges in early type spirals sharesurface brightness characteristics of ellipticals, whereas those in late-type spirals are closerto exponential disks. This might indicate two formation mechanisms, one primordial (asin the traditional picture), the other related perhaps to the merging assembly history orvia disk instabilities through what is termed ‘secular’ evolution.
Taking advantage of the HDF images, including those from NICMOS, Ellis et al (2000)have examined the color distribution for a large sample of spirals bulges of known redshiftand compared these colors with their integrated equivalent for the HDF ellipticals. Ifbulges are miniature ellipticals formed at high redshift, one would expect similar trends.Interestingly, in the hierarchical picture, one expects bulges to be older and presumablyredder than ellipticals (since the latter predominantly form from merged disk systemswhich most likely contain bulges as early merger remnants). Ellis et al (2000) find in-termediate redshift bulges are the reddest part of a typical spiral but, surprisingly, theyare often bluer than their elliptical counterparts and far less homogeneous as a popula-tion. Contamination from disk light is an obvious concern though simulations suggestonly modest bias arises to redshifts where these trends become prominent. What could beresponsible for this puzzling behavior? Evolutionary synthesis modelling suggest only amodest amount of star formation corresponding to continued infall of ≃5% by mass wouldbe needed to explain the bluing.
7. Conclusions
In summary, despite the frantic increase in publication rate in this field, there is anenormous amount of work still to be done, both observationally, in exploiting the connec-tion between resolved images from HST and ground-based spectroscopy, and theoretically,in predicting more accurately the expected evolutionary histories of resolved components.In my opinion the subject suffers too much from a satisfaction with simply replicating,

26 Richard S. Ellis: Galaxy Formation and Evolution
Figure 19:The remarkable diversity of intermediate redshift spiral bulges in the HubbleDeep Fields as revealed in the analysis of Ellis et al (2000). (Top) Selected face-on spiralsin the HDF with pixel-by-pixel BV I color distributions. The marked points representvarious aperture selections which serve to define the mean bulge color; in each case thebulge remains the reddest part of the spiral galaxies. (bottom) V −I aperture color for bulges(open circles) and integrated color for ellipticals (filled circles) versus redshift. Bulges aregenerally more diverse with a mean color bluer than their elliptical counterparts. Curvesillustrate that a continued infall of 5% by mass over 1-2 Gyr timescales could explain theobserved trends.
according to a particular theory, a range of observations. This is particularly dangerouswhen the observables are luminosities, colors and star formation rates since the theoreticalparameters involved are numerous. The challenge will be to overcome the obvious limi-tations we presently face in determining galactic masses for complete samples of galaxiesviewed at various look-back times, as well as integrating the growing body of data beingobtained in the far infrared and sub-mm spectral regions.
I thank my students, past and present, and collaborators at Cambridge, Caltech andelsewhere for allowing me to present the results of unpublished work undertaken with them.I also thank Marc Balcells, Ismael Perez-Fournon and Francisco Sanchez for inviting me to

Richard S. Ellis: Galaxy Formation and Evolution 27
Tenerife to give these lectures and for their remarkable patience in waiting for this writtenversion.
REFERENCES
Abraham, R.G., Valdes, F., Yee, H.K.C. & van den Bergh, S. 1994 Astrophys. J., 432, 75.
Abraham, R.G., Tanvir, N.R., Santiago, B.X. 1996a et al.Mon. Not. R. astr. Soc., 279, L47.
Abraham, R.G., Smecker-Hane, T.A., Hutchings, J.B. et al.1996b Astrophys. J., 471, 694.
Abraham, R.G. Merrifield, M.R., Ellis, R.S. et al.1999 Mon. Not. R. astr. Soc., 308, 569.
Adelberger, K.L., Steidel, C.C., Giavalisco, M. et al.1998 Astrophys. J., 505, 18.
Aragon-Salamanca, A., Baugh, C.M. & Kauffmann, G. 1998 Mon. Not. R. astr. Soc., 297. 427.
Bahcall, N., Ostriker, J.P., Perlmutter, S. & Steinhardt, P.J. 1999 Science, 284, 1481.
Bahcall, N. & Fan, X. 1998 Astrophys. J., 504, 1.
Balbi, A., Ade, P.A.R., Bock, J.J. et al.2000 Astrophys. J., 545, L1.
Balogh, M.L., Morris, S.L., Yee, H.K.C., Carlberg, R.G. & Ellingson, E. 1999 Astrophys. J., 527,54.
Barger, A., Aragon-Salamanca, A., Ellis, R.S. et al.1996 Mon. Not. R. astr. Soc., 279, 1.
Barger, A., Cowie, L.L., Trentham, N. et al.1999a Astron. J., 117, 102.
Barger, A., Cowie, L.L., Smail, I. et al.1999b Astron. J., 117, 2656.
Barnes, J. & Hernquist,L. 1992 Ann. Rev. Astron. Astr., 30, 705.
Baugh, C.M., Cole, S.M. & Frenk, C.S. 1996 Mon. Not. R. astr. Soc., 283, 1361.
Baugh, C.M., Cole, S., Frenk, C.S. & Lacey, C.G. 1998 Astrophys. J.498, 504.
Baugh, C.M., Benson, A., Cole, S.M., Frenk, C.S, & Lacey, C.G 1999 in Photometric Redshifts,in press (astro-ph/99007054).
Bell, E.F. & Kennicutt, R. 2000 Astrophys. J., in press (astro-ph/0010340).
Blain, A. in press. (astro-ph/0011387).
Blain, A., Smail,I., Ivison, R.J. & Kneib, J-P. 1999 Mon. Not. R. astr. Soc., 302, 632.
Blandford, R. & Narayan, R. 1992 Ann. Rev. Astron. Astr., 30, 311.
Bouwens, R., Broadhurst, T.J. & Silk, J. 1998 Astrophys. J., 506, 557.
Bouwens, R. & Silk, J. 2000 Astrophys. J., in press (astro-ph/0002133).
Bower, R.G., Lucey, J.R. & Ellis, R.S. 1992 Mon. Not. R. astr. Soc., 254, 589.
Broadhurst, T.J., Ellis, R.S. & Glazebrook, K. 1992 Nature, 355, 55.
Brunner, R.J., Szalay, A.S. & Connolly, A.J. 2000 Astrophys. J., 541, 527.
Brinchmann, J. & Ellis, R.S. 2000 Astrophys. J., 536, L77.
Brinchmann, J., Abraham, R.G., Schade, D. et al.1998 Astrophys. J., 499, 112.
Butcher, H. & Oemler, A. 1978 Astrophys. J., 219, 18.
Cohen, J.G., Hogg, D.W. & Blandford, R. et al.2000 Astrophys. J., 538, 29.
Cole, S.M., Lacey, C.G., Baugh, C.M. & Frenk, C.S. 2000a Mon. Not. R. astr. Soc., 319, 168.
Cole, S.M., Norberg, P., Baugh, C.M. et al.2000 Mon. Not. R. astr. Soc., submitted (astro-ph/0012429)
Cole, S.M., Aragon-Salamanca, A., Frenk, C.S. et al.1998 Mon. Not. R. astr. Soc., 271, 781.
Connolly, A.J., Csabai, I. & Szalay, A.S. 1996 Astron. J., 110, 2655.
Couch, W.J., Ellis, R.S., Sharples, R.M. & Smail, I. 1994 Astrophys. J., 430, 121.

28 Richard S. Ellis: Galaxy Formation and Evolution
Couch, W.J., Barger, A., Smail, I. et al.1998 Astrophys. J., 497, 189.
Cowie, L.L., Songaila, A., Hu, E.M. & Cohen, J.G. 1996 Astron. J., 112, 839.
Cowie, L.L., Songaila, A. & Barger, A.J. 1999 Astron. J., 118, 603.
Mobasher, B., Cram, L., Georgakakis, A. & Hopkins, A. 1999 Mon. Not. R. astr. Soc., 308, 45.
Daddi, E., Cimatti, A., Pozzetti, L. et al.2000 Astron. Astrophys., 361, 535.
de Bernardis, P., Ade, P.A.R., Bock, J.J. et al.2000 Nature, 404, 955.
Dressler, A., Oemler, A., Butcher, H. & Gunn, J.E. 1994 Astrophys. J., 430, 107.
Dressler, A., Oemler, A., Couch, W.J. et al.1997 Astrophys. J., 490, 577.
Dressler, A., Smail, I., Poggianti, B. et al.1998 Astrophys. J. Suppl., 122, 51.
Driver, S.P., Windhorst, R.A. & Griffiths, R.E. 1995 Astrophys. J., 453, 48.
Efstathiou, G.P., Ellis, R.S. & Peterson, B.A. 1986 Mon. Not. R. astr. Soc., 232, 431.
Eggen, O., Lynden-Bell, D. & Sandage, A.R. 1962 Astrophys. J., 136, 748.
Ellis, R.S., Colless, M., Broadhurst, T.J. et al.1996 Mon. Not. R. astr. Soc., 280, 235.
Ellis, R.S. 1997 Ann. Rev. Astron. Astr., 35, 389.
Ellis, R.S., Smail, I., Dressler, A. et al.1998 Astrophys. J., 483, 582.
Ellis, R.S., Abraham, R.G. & Dickinson, M.E. 2000 Astrophys. J.in press (astro-ph/0010401)bulges
Ellis, R.S., van Dokkum, P., Abraham, R. & Menanteau, F. 2001 in preparation.
Fall, S.M., Charlot,S. & Pei, Y.C. 1995 Astrophys. J., 464, 43.
Fischer, P. et al.2000 Astron. J., 120, 1198.
Fontana,A.,D’Odorico, S., Poli, F. et al.1999 Astron. J., 120,2206.
Frenk, C.S. et al.1988 The Epoch of Galaxy Formation, Kluwer.
Gallego, J., Zamorano, J., Aragon-Salamanca, A. & Rego, M. 1995 Astrophys. J., 455, L1.
Gardner, J.P., Sharples, R.M., Frenk, C.S. & Carrasco, B.E. 1997 Astrophys. J., 480, L99.
Garnavich, P., Kirshner, R.P., Challis, P. et al.1998 Astrophys. J., 493, L53.
Glazebrook, K., Ellis, R.S., Colless, M. et al.1995 Mon. Not. R. astr. Soc., 275, L19.
Glazebrook, K., Blake, C., Economou, F. et al.1999 Mon. Not. R. astr. Soc., 306, 843.
Griffiths, R., Casertano, S., Ratnatunga, K. et al.1994 Astrophys. J., 435, L19.
Griffiths, R., Casertano, S., Im, M. & Ratnatunga, K.U. 1996 Mon. Not. R. astr. Soc., 282, 1159.
Gunn, J.E. & Oke, J.B. 1975 Astrophys. J., 195, 255.
Hogg, D.W., Blandford, R., Kundic, T. et al.Astrophys. J., 467, 73.
Hogg, D.W., Cohen, J.L., Blandford, R.D. et al.1998 Astron. J., 115, 1418.
Horgan, J. 1997 The End of Science, Abacus.
Huchra, J. et al.1998 globulars
Im, M., Simard, L., Faber, S.M. et al.2000 Astrophys. J., in press (astro-ph/0011092).
Jimenez, R., Friaca, A.C.S., Dunlop, J.S. et al.1999 Mon. Not. R. astr. Soc., 305, L16.
Kauffmann, G. 1995 Mon. Not. R. astr. Soc., 274, 153.
Kauffmann, G. & Charlot, S. 1998 in The Birth of Galaxies, Xth Blois Conference, in press(astro-ph/9810031).
Kauffmann, G., Guiderdoni, B. & White, S.D.M. 1994 Mon. Not. R. astr. Soc., 267, 981.
Kauffmann, G. & Charlot, S. 1998 Mon. Not. R. astr. Soc., 297, 981.
Kauffmann, G., Colberg, J.M., Diaferio, A. & White, S.D.M. 1999 Mon. Not. R. astr. Soc., 307,

Richard S. Ellis: Galaxy Formation and Evolution 29
529.
Kennicutt, R. 1998 Ann. Rev. Astron. Astr., 36, 189.
Koo, D.C. 1985 Astron. J., 90, 418.
Koo, D.C., Guzman, R., Faber, S.M. et al.1995 Astrophys. J., 440, L49.
Kristian, J., Sandage, A.R. & Westphal, J.A. 1978 Astrophys. J., 221, 383.
Kron, R.G. 1980 Astrophys. J. Suppl., 43, 305.
Larson, R.B. & Tinsley, B.M. 1978 Evolution of Stellar Populations, Yale University Press.
LeFevre, O., Abraham, R.G., Lilly, S.J. et al.2000 Mon. Not. R. astr. Soc., 311, 565.
Lehnert, M.D. & Heckman, T. 1996 Astrophys. J., 472, 546.
Lilly, S.J., Tresse, L., Hammer, F. et al.1995 Astrophys. J., 455, 108.
Lilly, S.J., Schade, D.J., Ellis, R.S. et al.1999 Astrophys. J., 500, 75.
Livio, M., Fall, S.M. & Madau, P. 1998 The Hubble Deep Field, STScI Conference Series, Cam-bridge University Press.
McCarthy, P., Carlberg, R., Marzke, R. et al.2000 in Deep Fields, ESO Publications in press(astro-ph/0011499).
Madau, P., Ferguson, H., Dickinson, M.E. 1996 Mon. Not. R. astr. Soc., 283, 1388.
Madau, P., Pozzetti, L. & Dickinson, M.E. 1998 Astrophys. J., 498, 106.
Madau, P. & Pozzetti, L. 1999 Mon. Not. R. astr. Soc., 312, L9.
Marleau, F. & Simard, L. 1998 Astrophys. J., 507, 585.
Menanteau, F., Ellis, R.S. & Abraham, R.G. 1999 Mon. Not. R. astr. Soc., 309, 208.
Menanteau, F., Abraham, R.G. & Ellis, R.S. 2000 Mon. Not. R. astr. Soc., in press (astro-ph/0007114).
Mo, H.J., Mao, S. & White, S.D.M. 1998 Mon. Not. R. astr. Soc.295, 319.
Mobasher, B., Sharples, R.M. & Ellis, R.S. 1993 Mon. Not. R. astr. Soc., 263, 560.
Mould, J.R., Huchra, J.P., Freedman, W. et al.2000 Astrophys. J., 529, 786.
Natarajan, P., Kneib, J-P, Smail, I. & Ellis, R.S. 1999 Astrophys. J., 499, 603.
Peacock, J.A. et al.2000 in preparation.
Perlmutter, S., Aldering, G., Goldhaber, G. et al.1999 Astrophys. J., 517, 565.
Peterson, B.A., Ellis, R.S., Kibblewhite, E.J. et al.1979 Astrophys. J., 233, L109.
Poggianti, B., Smail, I., Dressler, A. et al.1999 Astrophys. J., 518, 576.
Rocca-Volmerange, B. & Guiderdoni, B. 1989 Astron. Astrophys., xx. yy.
Rowan-Robinson, M., Mann, R.G., Oliver, S.J. et al.1997 Mon. Not. R. astr. Soc., 289, 490.
Sandage, A.R. 1961 Astrophys. J., 134, 916.
Sandage, A.R. 1983 Astron. Astrophys.hubble sequence
Sandage, A.R. & Visvanathan, N. 1978 Astrophys. J., 225, 742.
Schade, D., Lilly, S.J., Crampton, D. et al.1999 Astrophys. J., 525, 31.
Schechter, P.L. 1976 Astrophys. J., 203, 297.
Simard, L., Koo, D.C., Faber, S.M. et al.1999 Astrophys. J., 519, 563.
Steidel, C.C., Giavalisco, M., Pettini, M. et al.1996 Astrophys. J., 462, L17.
Steidel, C.C., Adelberger, K.L., Giavalisco, M. et al.1999 Astrophys. J., 519, 1.
Steidel, C.C. 2000 S.P.I.E., 4005, 22.
Tresse, L. & Maddox, S.J. 1998 Astrophys. J., 495, 691.

30 Richard S. Ellis: Galaxy Formation and Evolution
Wang, L., Caldwell, R.R., Ostriker, J.P. & Steinhardt, P.J. 2000 Astrophys. J., 530, 17.
Ostriker, J.P. & Steinhardt, P.J. 1996 Nature, 377, 600.
Struck-Marcell, C. & Tinsley, B.M. 1978 Astrophys. J., 221, 562.
Sullivan, M., Treyer, M., Ellis, R.S. et al.2000 Mon. Not. R. astr. Soc., 312, 442.
Tammann, G. 1985 in Trieste review
Tinsley, B.M. 1976 Astrophys. J., 203, 63.
Tinsley, B.M. 1977 Astrophys. J., 211, 621.
Tinsley, B.M. 1980 Astrophys. J., 241, 41.
Toomre, A. & Toomre, J. 1972 Astrophys. J., 178, 623.
Treu, T., Stiavelli, M., Casertano, S. et al.2000 Mon. Not. R. astr. Soc., 308, 1037.
Tyson, A.J. & Jarvis, J.F. 1979 Astrophys. J., 230, L153.
Weil, M., Eke, V.R. & Efstathiou, G.P. 1998 Mon. Not. R. astr. Soc., 300, 773.
van Dokkum, P.G., Franx, M., Kelson, D.D. & Illingworth, G. 1998 Astrophys. J.504, L17.
van Dokkum, P.G., Franx, M., Fabricant, D. et al.1999 Astrophys. J., 530, L95.
Vogt, N., Phillipps, A.C., Faber, S.M. et al.1997 Astrophys. J., 479, L121.
White, S.D.M. & Frenk, C.S. 1991 Astrophys. J., 379, 52.
Williams, R., Blacker, B., Dickinson, M.E. et al.1996 Astron. J., 112, 1335.
Wyse, R. 1999 in The Formation of Galactic Bulges, eds. Carollo, C.M. et al., Cambridge Uni-versity Press.
Zaritsky, D., Smith, R., Frenk, C.S. & White, S.D.M. 1998 Astrophys. J., 478, L53.
Zepf, S.E. 1997 Nature, 390, 377
Ziegler, B.L. & Bender, R. 1997 Mon. Not. R. astr. Soc., 291, 527.

This figure "iac_fig3.jpg" is available in "jpg" format from:
http://it.arXiv.org/ps/astro-ph/0102056