Embed Size (px)
Citation preview

CONSTRUCTION TRENDS ECONOMIC AND MARKET UPDATE HELP TO BUY ANALYSIS
RESIDENTIAL RESEARCH
EXCLUSIVE 2015 UK
HOUSEBUILD
ER SURVEY
RESULTS
GAINING GROUND HOUSEBUILDING REPORT 2015

2
SUMMARYActivity in the housebuilding sector has continued to pick up over the last year, but the supply of new homes is still falling well short of demand. Boosting supply, where new housing is most keenly needed, is a key priority if the UK housing market is to avoid long-term distortion.
This report examines the factors currently at play in the housebuilding sector, from policy to planning, and looks ahead at how the sector may perform in the years to come.
The report also includes the findings from Knight Frank’s annual housebuilder survey. More than 160 respondents from housebuilders and developers of all sizes across the UK shared their views with us as part of our market-leading survey. Some key findings include:
• Nearly 60% of respondents expect housing completions to rise over the next year, with 18% saying the rise could be between 10% and 25%. However around half of respondents expect no change in the delivery of affordable homes over the next 12 months.
• Just 9% of respondents said that under current market conditions it would be possible to deliver more than 200,000 homes a year, every year.
• More than 90% of respondents are expecting construction costs to rise again over the next 12 months and two-thirds expect that development land prices will rise again this year.
• Rising labour and build costs are expected to pose the greatest risk to the sector in the coming year.
• Some 56% of respondents said that the Community Infrastructure Levy (CIL) was weighing on development volumes.
• The biggest policy change that would help boost development volumes would be recruiting more people to Local Authority planning departments, according to respondents.
“ Development levels are increasing, but demand for housing continues to outpace supply. Our survey of the housebuilding industry suggests some key measures which could help boost delivery further in the coming years.”
GRÁINNE GILMORE Head of UK Residential Research
FIGURE 2 How housebuilding has changed: 1968-2014
**estimate Source: DCLG / Knight Frank Residential Research
0
500,00
100,000
150,000
200,000
250,000
300,000
350,000
400,000
HOUSING ASSOCIATION PRIVATE ENTERPRISE LOCAL AUTHORITY
2013
**20
14
Dw
ellin
ga
com
ple
ted
2012
2011
2009
2010
2008
2007
2006
2005
2004
2003
2002
2001
2000
1999
1998
1997
1996
1995
1994
1993
1992
1991
1990
1989
1988
1987
1986
1985
1984
1983
1982
1981
1980
1979
1978
1976
1975
1974
1973
1972
1971
1970
1969
1968
Labour pledge on housebuilding
Liberal Democrat pledge on housebuilding300,000
SUPPLY TARGETS
200,000
<140k 160k - 180k
180k - 200k
200k+
140,000 - 160,000
140,000 - 160,000
140,000 - 160,000
<140,000
140,000 - 160,000
0
5
10
15
20
25
30
35
14%
35%
29%
22%18%
6%
1%
<180k 180k - 200k 200k+
67%
24%
9%
<180,000
180,000-200,000
200,000+
67%
24%
9%
0
10
20
30
40
50
60
70
80
FIGURE 1
What is a sustainable annual level of housebuilding? % of respondents, housebuilder survey
Source: Knight Frank Residential Research

3
RESIDENTIAL RESEARCHHOUSEBUILDING 2015
The UK economy has fared well over the last year compared to many of its closest neighbours. Economic output rose by 2.8% in 2014, up from 1.7% in 2013. This was the highest growth since 2007, before the effects of the financial crisis were being felt. Alongside this better economic news, there has been positive data from the labour market, with unemployment continuing to fall. Some 1.86 million people are now unemployed, down from a peak of 2.66 million in November 2011, while the employment rate of 73.3% is the highest since records began in 1977.
Improved confidence in both businesses and job security, coupled with ultra-low interest rates helped boost sentiment around the housing market in the first half of last year – as shown in our house price sentiment index, produced in conjunction with Markit Economics. While sentiment remains positive, it started to ease in the second half of 2014, affected by new, tighter, mortgage regulations, and a slowing in the pace of house price growth in London and the South East.
Economic and market update
The reform of stamp duty in December last year has provided a fillip for many potential buyers, making it cheaper for those buying homes priced at up to around £930,000 to purchase a home in England and Wales. However, on the other hand, the General Election, one of the most uncertain in terms of outcome in decades, has caused some to adopt a “wait and see” approach until the result is decided.
FIGURE 4
Rising sentiment House Price Sentiment Index
30
35
40
45
50
55
60
65
70
75
80
CURRENT HOUSE PRICESFUTURE HOUSE PRICES
Pricesrising
Pricesfalling
Nochange
2010 2011 2012 2013 2014 2015
69.6
57.5
Source: Knight Frank / Markit Economics NB: A score of 50 equates to no change, above or below representing growth or decline respectively
FIGURE 5
Rising sales Monthly transactions, 3-month average, England & Wales
Source: Knight Frank Residential Research, Land Registry
Housing transactions rose by 18% in 2014 in England and Wales, and new-build sales climbed by 11%, according to data from the Land Registry.
Meanwhile house prices are up 7.2% year-on-year across the UK in the year to February, according to data from the ONS.
The imbalance between the demand for new homes and the number of units being built is well-recognised, by the industry and political parties alike. In the 12 months to April 2014, some 141,000 homes were built in the UK, up by 4% on the previous year. However, official household growth projections suggest an additional 230,000 potential households a year in the UK.
Below these headline figures, there is a recognition that the right type of homes must be built in areas where there is the most housing need, typically adjacent to existing urban areas. This has led to tensions about the greenbelt, with a lack of consensus on how to expand accommodation in some of the UK’s most thriving towns and cities.
Nearly one half of the respondents to the housebuilder survey said that rules around developing on greenbelt land should be loosened (figure 12) .
Delivery of new homes
FIGURE 3
Over the next 12 months, completion volumes will… % of respondents, housebuilder survey
Source: Knight Frank Residential Research
FALL BY <10%FALL BY >10%
RISE BY up to 10%
RISE BY 25%-50%RISE BY 10%-25%
RISE BY 50%-75%REMAINS UNCHANGED
RISE BY 75%-100%
RISE BY 100%+
FALL BY <10%FALL BY >10%
RISE BY up to 10%
RISE BY 25%-50%RISE BY 10%-25%
RISE BY 50%-75%REMAINS UNCHANGED
RISE BY 75%-100%
RISE BY 100%+
0% 20% 40% 60% 80% 100%% of survey respondents
MODESTLY REDUCINGDEVELOPMENT VOLUMES
NO IMPACT
38%
36%
34% 21% 17% 15%
18%
4% 4%
OTHER
ACTING AS ASIGNIFICANT DRAGON DEVELOPMENT
VOLUMES
ENCOURAGING AMODEST RISE
IN DEVELOPMENTVOLUMES
FALL
RISENO
CHANGE
Rise Not change
Fall
33%
7%
59%
34%
21%
17%
15%
2%1%
4% 2%6%
7%
59%33%
0
2,000
4,000
6,000
8,000
10,000
12,000
14,000
0
20,000
40,000
60,000
80,000
100,000
120,000
140,000ALL TRANSACTIONSNEW-BUILD TRANSACTIONS(Right Hand Scale)
2014
2013
2012
2011
2010
2009
2008
2007
62%proportion of respondents who expect their start volumes to increase over the next year
Housebuilder survey:

4
FIGURE 6
What impact has the NPPF had on… % of respondents, housebuilder survey
Source: Knight Frank Residential Research
HEDGEFUNDS
(HFRIcomposite
index)
SHARES(FTSE
100 index)
COMMODITIES(S&P GSCI index)
PRIMECENTRALLONDON
PRIMEOUTER
LONDON
HEDGEFUNDS
(HFRIcomposite
index)
SHARES(FTSE
100 index)
COMMODITIES(S&P GSCI index)
PRIMECENTRALLONDON
PRIMEOUTER
LONDON
fewer than 140,000140,000 - 160,000160,000 - 180,000180,000 - 200,000200,000 - 220,000220,000 - 240,000more than 240,000
DECREASED INCREASEDUNCHANGED
EASE OF SECURINGPLANNING PERMISSION
SPEED OF SECURINGPERMISSION
TOTAL DEVELOPMENTVOLUMES
SIZE OFDEVELOPMENTS
46%
28%
60%
12%9%
41%
51%
30%
25%
34%
41%
25%
EASE OF SECURINGPLANNING PERMISSION
SPEED OF SECURINGPERMISSION
TOTAL DEVELOPMENTVOLUMES
SIZE OFDEVELOPMENTS
46%
28%
9%
51%
30%
25%
34%
41%
25%
EASE OF SECURINGPLANNING PERMISSION
SPEED OF SECURINGPERMISSION
TOTAL DEVELOPMENTVOLUMES
SIZE OFDEVELOPMENTS
46%
28%
12%9%
41%
51%
30%
25%
34%
41%
25%
60%
12%
60%
41%
Source: Knight Frank Residential Research
MODESTLY REDUCINGDEVELOPMENT VOLUMES
NO IMPACT
38%
36%18%
4% 4%
OTHER
ACTING AS ASIGNIFICANT DRAGON DEVELOPMENT
VOLUMES
ENCOURAGING AMODEST RISE
IN DEVELOPMENTVOLUMES
FIGURE 7
What impact is CIL having on development volumes? % of respondents, housebuilder survey
67%proportion of respondents who say maximum annual housing delivery is 180,000 units or less
Housebuilder survey:
Policymakers from all parties are keen to encourage development on brownfield land – indeed RICS has published research suggesting there is enough brownfield land available in England to build 226,000 homes by 2019. However, brownfield development is more costly than that on greenfield, and there must be some recognition of this.
In addition, there must also be some recognition that brownfield sites are not always ideally situated to provide the right type of units where they are needed.
In terms of housing delivery, nearly 60% of respondents to our survey expect to increase their housing completions in the next 12 months, with a fifth expecting to increase by up to 10% compared to the previous 12 months (figure 3).
While any uplift in development volumes will be welcome, it will be a worry for policymakers that, when asked the maximum level of housing supply that could be delivered to the market under current conditions, more than two-thirds said it was 180,000 units or less. Only 9% said that it was possible to deliver more than 200,000 homes a year across the country.
Labour has pledged to build 200,000 homes a year, while the Liberal Democrats would like to see 300,000 new homes
every year. The Conservatives believe targets should be set on a localised basis.
The developers and housebuilders we surveyed outlined some policy measures they believe would be most beneficial to boost the levels of new housebuilding – and these are examined later in the report (pages 7 & 8).
Planning The deadline for the changes to the use of Section 106 payments to fund infrastructure passed on April 6th 2015. However, fewer than a third of local councils have so far adopted a new Community Infrastructure Levy (CIL) charging structure instead, meaning that development may be stalled as these charging structures are organised.
CIL was identified by three-quarters of respondents as a potential risk to the sector in the coming years, with 56% of respondents saying it was acting as a drag on development overall. Some 44% said that policymakers should consider scrapping or reforming CIL to help boost development.
In terms of planning, the verdict on the National Planning Policy Framework (NPPF) three years on from its introduction is mixed, but overall housebuilders say it has contributed to a rise in development volumes, as shown in figure 6.
While there may be some issues with the NPPF, only 26% said that moving back to a more regional approach to planning was a
5
RESIDENTIAL RESEARCHHOUSEBUILDING 2015
FIGURE 10
Rising costs Labour and material costs, net balance
Source: RICS
-60
-40
-20
0
20
40
60
80 INPUT COSTS
Q2
2006
Q4
2006
Q2
2007
Q4
2007
Q2
2008
Q4
2008
Q2
2009
Q4
2009
Q2
2010
Q4
2010
Q2
2011
Q4
2011
Q2
2012
Q4
2012
Q2
2013
Q4
2013
Q2
2014
Q4
2014
67%
-60
-40
-20
0
20
40
60
80 INPUT COSTS
Q2
2006
Q4
2006
Q2
2007
Q4
2007
Q2
2008
Q4
2008
Q2
2009
Q4
2009
Q2
2010
Q4
2010
Q2
2011
Q4
2011
Q2
2012
Q4
2012
Q2
2013
Q4
2013
Q2
2014
Q4
2014
Risingcosts
Fallingcosts
Nochange
“ Since 1964 the population of the UK has grown by over 10 million people (18.7%). About half of this growth has occurred since 2001.”Office for National Statistics
Source: Knight Frank Residential Research
FIGURE 8
Annual change in development land prices
-5%
0%
5%
10%
15%
20%
25%
Dec
SepJun
Mar
Mar
201520142013
Dec
SepJun
Mar
Dec
Sep
PRIME CENTRAL LONDON
ENGLAND AND WALESGREENFIELD
18.5%
-0.5%
key priority for policymakers as shown in figure 12. While many in the industry believe there are issues that need to be ironed out with the NPPF, there is little appetite for policymakers to launch a new form of planning legislation.
However, it is notable that only a quarter of respondents said that under the NPPF the speed of securing planning permissions had fallen. This may underpin the feeling that more resources should be allocation to local planning departments, as examined later in the report (pages 7 & 8).
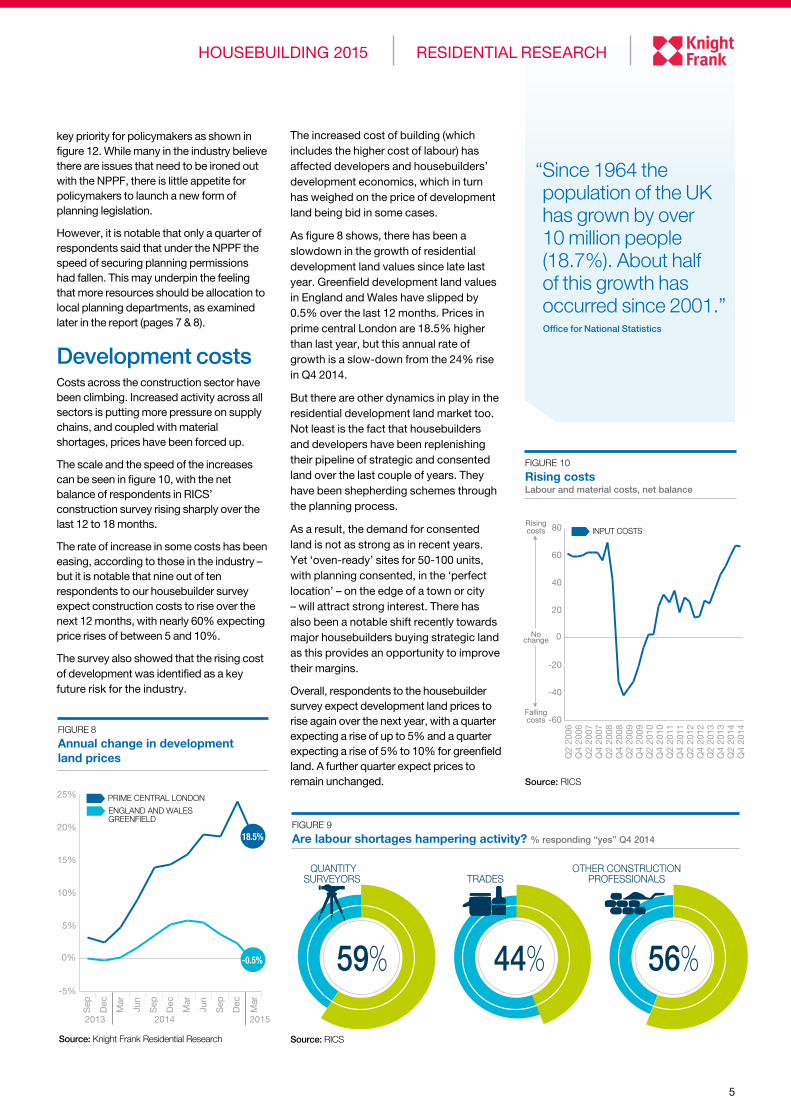
Development costsCosts across the construction sector have been climbing. Increased activity across all sectors is putting more pressure on supply chains, and coupled with material shortages, prices have been forced up.
The scale and the speed of the increases can be seen in figure 10, with the net balance of respondents in RICS’ construction survey rising sharply over the last 12 to 18 months.
The rate of increase in some costs has been easing, according to those in the industry – but it is notable that nine out of ten respondents to our housebuilder survey expect construction costs to rise over the next 12 months, with nearly 60% expecting price rises of between 5 and 10%.
The survey also showed that the rising cost of development was identified as a key future risk for the industry.
QUANTITYSURVEYORS TRADES
OTHER CONSTRUCTIONPROFESSIONALS
56%59% 44%
FIGURE 9
Are labour shortages hampering activity? % responding “yes” Q4 2014
Source: RICS
The increased cost of building (which includes the higher cost of labour) has affected developers and housebuilders’ development economics, which in turn has weighed on the price of development land being bid in some cases.
As figure 8 shows, there has been a slowdown in the growth of residential development land values since late last year. Greenfield development land values in England and Wales have slipped by 0.5% over the last 12 months. Prices in prime central London are 18.5% higher than last year, but this annual rate of growth is a slow-down from the 24% rise in Q4 2014.
But there are other dynamics in play in the residential development land market too. Not least is the fact that housebuilders and developers have been replenishing their pipeline of strategic and consented land over the last couple of years. They have been shepherding schemes through the planning process.
As a result, the demand for consented land is not as strong as in recent years. Yet ‘oven-ready’ sites for 50-100 units, with planning consented, in the ‘perfect location’ – on the edge of a town or city – will attract strong interest. There has also been a notable shift recently towards major housebuilders buying strategic land as this provides an opportunity to improve their margins.
Overall, respondents to the housebuilder survey expect development land prices to rise again over the next year, with a quarter expecting a rise of up to 5% and a quarter expecting a rise of 5% to 10% for greenfield land. A further quarter expect prices to remain unchanged.

6
9.5% - 11.5%
7.5% - 9.5%
5.5% - 7.5%
3.5% - 5.5%
1.5% - 3.5%
<1.5%
Chorley
50%
10%
England
32%
2.9%
of all new-build
of all sales
Telford andWrekin
56%
10%
Ashfield
47%
8%
Gloucester
60%
8%
Bedford
47%
10%
Kingston upon Hull
64%
9%
Stockton-on-Tees
Help to Buy Equity Loans asa percentage of all transactions April 2013-February 2015
Equity loans as proportion…
57%
8%
Peterborough
54%
11%
Knowsley
61%
9%
Corby
44%
11%
FIGURE 11
Help to Buy – Equity Loan Help to Buy purchases as a % of all transactions (April 2013 - March 2015), top 10 locations
Source: Knight Frank Residential Research / DCLGLondon

7
RESIDENTIAL RESEARCHHOUSEBUILDING 2015
GardenCities
Move back to a moreregional approach
to planning
Improve accessto development
funding
Provide additionalresources to
local authorityplanning departments
Improve skillstraining forthe industry
Improve accessto public
sector land
Loosen rulesaround developmenton Green belt land
Scrap/Review CIL
Ease time frames for, or amend,environmentalrequirements
Further expandHelp to Buy EquityLoan (beyond 2020additional funding)
82%
58% 57%
47% 44% 39% 37% 37%
26% 26%
Help to BuyThe introduction of the Help to Buy Equity Loan had an immediate impact on the housebuilding industry in an era of relatively high price to income ratios. The scheme, which helps buyers access better mortgage deals, resulted in developers and housebuilders submitting higher numbers of planning applications and taking on larger schemes. In the last year, the total number of units in planning or under construction is up nearly 10%, according to data prepared for Knight Frank from Glenigan.
As can be seen from the map on page 7, the biggest take-up of Help to Buy as a proportion of all sales has been in Corby in the East Midlands and Peterborough in East Anglia, where equity loans accounted for more than one in ten of all housing transactions. Some 45,000 Equity Loans have been advanced so far, with around 36,000 of these to first-time buyers, underwriting some £8.8 billion in sales.
While the housebuilding industry has made it clear that maintaining the extension of Help to Buy to 2020 is key, only 37% of respondents to our survey said that extending the scheme beyond 2020 should be a priority for policymakers (see figure 12).
“ The single biggest constraint to increasing the delivery of housing in the UK is the lack of capacity in the development industry. Developers are responding by increasing their workforces, but this is a slow process and supply is unlikely to rise quickly.”Justin Gaze, Joint Head of Residential Development, Knight Frank
The Mortgage Guarantee, which can be used on new-build properties as well as existing homes has also supported mortgage borrowing, accounting for around 4.5% of all transactions in England and Wales since it was introduced in late 2013.
Market outlookHousing starts data, and the results of our survey, suggest that housebuilding will continue to gain momentum in the years to come, although it us unlikely to approach levels targeted by the main political parties in the short to medium term.
Knight Frank has analysed the possible impact of some key election pledges. Alongside this, our survey respondents were clear in what they wanted to see from policymakers.
Providing additional resources to local authority planning departments was identified as the key measure for boosting development volumes by respondents, as shown in figure 12. Many planning departments have been affected by public sector cuts, and as a result are now overstretched. While it may on the surface seem counter-intuitive, housebuilders and developers are in favour of robust local planning departments, it follows that developers not only want speedier
FIGURE 12
What measures should policymakers take to help boost housing supply? % of respondents, housebuilder survey*
Source: Knight Frank Residential Research *Respondents could choose more than one option

Front cover image – Chase Wood View at Ross-on-Wye used courtesy of Persimmon HomesOur thanks to the respondents to the survey for their time
For the latest news, views and analysison the world of prime property, visit
KnightFrankblog.com/global-briefing
GLOBAL BRIEFING
RESIDENTIAL RESEARCH
Gráinne Gilmore Head of UK Residential Research+44 20 7861 5102 [email protected]
RESIDENTIAL DEVELOPMENT
Justin Gaze Joint Head of Residential Development +44 20 7861 5407 [email protected]
Ian Marris Joint Head of Residential Development +44 20 7861 5404 [email protected]
David Fenton Head of Regional Land +44 78 3658 7931 [email protected]
Knight Frank Research Reports are available at KnightFrank.com/Research
You cannot rely on the whole or any part/s of this document (“Information”) in any way. You must make your own independent enquiries, inspections and searches and take your own independent professional advice.
The Information is not definitive and is not intended to give advice about properties, markets, policies, taxes, currencies or any other matters. The Information may not be accurate and all of the subject matter may change without notice. So far as applicable laws allow, neither we nor any of our members, consultants, ‘partners’ or employees will have any responsibility or liability in connection with or arising out of the accuracy or completeness or otherwise of the Information or the reasonableness of any assumption we have made or any information included in the document or for any loss or damage resulting from any use of or reference to the Information. As a general review, prepared using information from various sources which may not have been verified, this document does not necessarily represent the view of Knight Frank LLP in any respect.
© Knight Frank LLP 2015All rights reserved. Copying, modification or reproduction of the Information is not permitted without the prior written approval of Knight Frank LLP. Knight Frank LLP is a limited liability partnership registered in England with registered number OC305934. Our registered office is 55 Baker Street, London W1U 8AN, where you may look at a list of members’ names.
Knight Frank Residential Research provides strategic advice, consultancy services and forecasting to a wide range of clients worldwide including developers, investors, funding organisations, corporate institutions and the public sector. All our clients recognise the need for expert independent advice customised to their specific needs.
decision times, but also more robust discussions around planning decisions, resulting in fewer appeals, and planning permissions granted subject to long lists of conditions.
Improving and encouraging more skills training for the construction industry is seen as the second most important measure. The need for more skilled labour is underlined further in our survey, with 94% of respondents saying that the current cost and availability of labour was a risk to the industry.
Some 40% of respondents said the risk was significant, while 42% said the risk was moderate. A further 12% said the risk was modest. Those working in the industry also report that lack of available labour is hampering activity, as shown in figure 9.
The effective release of public sector land continues to be a key concern of the industry. Last year, the government
announced that from this year, the HCA would become the default disposer of centrally held government land. In last year’s Autumn Statement, it was pledged that land with the capacity for up to 150,000 homes would be released between 2015 and 2020.
There is a need for local councils to also get involved in disposing of land or using it as part of joint venture developments. In London, the pressing need to deliver more homes has been addressed by setting up a London Land Commission to help speed up the process. It is estimated that 100,000 homes could be built in the capital if all surplus land held by the GLA alone was used for development.
The need for more homes built where they are needed most is pressing. Ultimately it is a step-change in supply which will help ameliorate affordability issues faced by some buyers, creating a sustainable long-term housing market.
FIGURE 13 Over next year, new-build prices will… % of respondents, housebuilder survey
FALL BY >10% FALL BY 0%-10% REMAIN UNCHANGEDRISE BY 0%-5% RISE BY 5%-10% RISE BY 10%+
RisingFalling
0% 20% 40% 60% 80% 100%
RISE BY 10%+RISE BY 5%-10%RISE BY 0%-5%REMAIN UNCHANGEDFALL BY 0%-10%FALL BY >10%
0 20 40 60 80 100
17%5%1% 4%43% 30%
Source: Knight Frank Residential Research
The Wealth Report 2015
BIRMINGHAM REPORTSPRING 2015
RESIDENTIAL RESEARCH
ECONOMIC FUNDAMENTALS THE “BUSINESS” CASE HOUSING SUPPLY AND DEMAND
Birmingham Report 2015
RESIDENTIAL RESEARCH
RESIDENTIAL DEVELOPMENT LAND INDEX
Greenfield residential development land values remained broadly static in the final quarter of 2014, rising by just 0.1%. This took the annual rate of growth to 2.3%, well under the 7.2% rate of growth seen in house prices. However it is likely land price growth will remain subdued over the coming year as rising costs press on margins.
Activity in the land market has certainly picked up over the last 12-18 months – this is reflected in 17% rise in private units under construction across the UK in December 2014 compared to December 2013. There has been an increase in activity in most regions, as shown in figure 2. The demand for new housing is also robust across most parts of the country, with the take-up of the Government’s Help to Buy Equity Loan scheme rising to 38,052 in the 20 months to November 2014, with some 83% of these being first-time buyers.
The supply of land has also risen, with the activities of land promoters helping boost the pipeline of oven-ready sites. This, in
turn, has started to weigh on pricing as while there is still sturdy competition for good sites, it is less fierce.
Another factor weighing on greenfield land prices is the increasing cost of labour and materials. The industry is still gearing up after the recession, and recruitment of new tradesmen is proving problematic in many areas. It is no coincidence that the cost of building in the UK has risen up the international rankings. It is now the 8th most expensive country in which to build, from 43 countries surveyed, according to Arcadis, the design consultancy firm – although the relative strength of sterling to the Euro this year has also played a part in this calculation.
GREENFIELD LAND PRICES RISE 2.3% IN 2014The growth in land values moderated across England and Wales in the final quarter of 2014, reflecting the movement in the wider housing market. However residential development land values in prime central London continued their strong growth, ending the year up 24%. Gráinne Gilmore examines the latest market trends.
Key facts Q4 2014Average greenfield residential development land prices up 2.3% in 2014, after a 5.3% rise in 2013
Prices rose by 0.1% in Q4, the most modest growth since Q4 2012
Land values in prime central London climbed by 6.4% in Q4 2014, taking the annual rise to 24%
Land prices in prime central London up 48% since September 2011
Source: Knight Frank Residential Research
FIGURE 2
Change in number of residential units on site (under construction) December 2014 v December 2013
FIGURE 1
Development land values Quarterly changes, Sep 2012 - Dec 2014
-1%
0%
1%
2%
3%
4%
5%
6%
7%
8%
Dec
-14
Sep
-14
Jun-
14
Mar
-14
Dec
-13
Sep
-13
Jun-
13
Mar
-13
Dec
-12
Sep
-12
PCL
ENGLAND AND WALES
Source: Knight Frank Residential Research, Glenigan
GRÁINNE GILMORE Head of UK Residential Research
“ Price growth for residential development sites is likely to be more subdued over the coming year as rising construction costs press on margins.”
Follow Gráinne at @ggilmorekf
For the latest news, views and analysis on the world of prime property, visit Global Briefing or @kfglobalbrief
Residential Development Land Index Q4 2014
Residential Development Finance Report 2013/14
LONDON HOTSPOTSRESIDENTIAL DEVELOPMENT OPPORTUNITY AREAS 2015
RESIDENTIAL RESEARCH
HOUSING DELIVERY ACROSS LONDON
IMPROVING TRANSPORT INFRASTRUCTURE MARKET FORECASTS
London Development Hotspots - 2015
RECENT MARKET-LEADING RESEARCH PUBLICATIONS
Private Rented Sector Index - Q4 2014
Total returns from PRS investment-grade blocks slipped towards the end of 2014, as a result of slightly more modest capital growth and a moderate slowdown in average rental growth across the six cities monitored by the Knight Frank index.
The trend in capital growth reflects the wider market, with average pace of growth UK residential prices for owner-occupied properties also easing from 11% annual growth in the summer to 7% at the end of the year.
It is interesting to note, however, the shallower discounts on offer on institutional-grade blocks, a reflection of the increasing interest in the PRS sector in some key city markets. In Q4 2013, the average discount on offer for purchase of whole-sale block in Manchester was 13%; this has now fallen to 11%. Likewise, average discounts in Birmingham have fallen from 14% to 12% over the same period.
The fundamentals for private rented sector investment blocks remained regionalised
Key facts Q4 2014Average initial gross yields in London, Leeds, Bristol, Birmingham, Manchester and Glasgow at 6.3% in Q4 2014
Average total returns at 11.2% in Q4 2014
Average capital growth was 6.5%, down from 7.3% in Q2 2014
Gross yields range from 4.2% in central London to 8% in Leeds
RESIDENTIAL RESEARCH
PRIVATE RENTEDSECTOR INDEX
“ The shallower discounts on offer on institutional-grade blocks in some key city markets is a reflection of the increasing interest in the PRS sector.”
Follow Gráinne at @ggilmorekf
For the latest news, views and analysis on the world of prime property, visit Global Briefing or @kfglobalbrief
GRÁINNE GILMORE Head of UK Residential Research
YIELDS HARDEN MARGINALLY IN PRIVATE RENTED SECTOR The private rented sector index, encompassing key city markets across the UK, shows that initial gross yields hardened slightly in Q4 2014. Activity levels in the market are robust, and this is reflected in the shallower discounts on offer, while capital growth tracked the wider market to come in at 6.5% year-on-year. Grainne Gilmore examines the latest trends in the market.
in 2014, with capital growth ranging from 3.2% in Bristol to 11.4% in outer London in Q4. Average rental growth was also spread over a wide range across the UK, not only by region but by type of property. Annual growth in rents in a typical ‘secondary block’ in London Zones 3-6 rose by 0.96%, while average prime blocks in Manchester saw annual rental growth of 2.99%.
The regions also commanded the highest yields, with average gross initial yields in Birmingham of 7.9%, and Leeds of 8%. In contrast, yields were tightest in central London, at 4.2%.
The index is comprised of rental data collected from large rental single-block properties classed as prime, median and economic. The classification of these blocks takes into account location, monthly rents and also the type of unit on offer – a prime block will have units in the most desirable areas. In contrast, economic blocks are the least expensive for tenants, but their capital value is also lower, indicating higher initial yields for investors.
Source: Knight Frank Residential Research
0
1
2
3
4
5
6
7
8
9
10
Lond
onzo
ne 1
Lond
onzo
nes
2-3
Gre
ater
Lond
on
Birm
ingh
am
Bris
tol
Gla
sgow
Leed
s
Man
ches
ter
Average initial gross yield Q4 2014Average initial gross yield Q2 2014
Source: Knight Frank Residential Research
0
2
4
6
8
10
12
14
16
Lond
onzo
ne 1
Lond
onzo
nes
2-3
Gre
ater
Lond
on
Birm
ingh
am
Bris
tol
Gla
sgow
Leed
s
Man
ches
ter
Average capital growth Q4 2014Average capital growth Q2 2014
FIGURE 1
Average initial gross yields Q4 2014 v Q2 2014
FIGURE 2
Average capital growth Q4 2014 v Q2 2014
UK AND REGIONAL PRICE FORECASTS
COMPREHENSIVE DATA AND COMMENTARY
HOUSING POLICY ROUND-UP
UK RESIDENTIAL FORECAST & RISK MONITOR PRE-ELECTION EDITION FEBRUARY 2015
RESIDENTIAL RESEARCH
LEADING POLITICIANS SHARE THEIR KEY HOUSING
PLEDGES WITH KNIGHT FRANK
UK Housing Market Forecast Q1 2015
Prime country house prices rose at a faster rate than those in central London between January and March, as average values increased by 0.9%. However, while quarterly growth overtook prime central London for only the second time since 2009, on an annual basis growth in the value of country houses slowed to 2.5%, from 3.4% in December.
As figure 1 shows, the rate of annual price growth between prime central London and the prime country market has narrowed considerably in recent months.
Uncertainty surrounding the result of the forthcoming UK General Election and tighter mortgage lending criteria are the primary reasons behind the slowdown. Some buyers and sellers in both prime central London and the prime country market – particularly those at the top-end – are delaying decisions until greater clarity emerges.
The new rates of stamp duty introduced by the Chancellor in his Autumn Statement on December 3rd 2014 may also be having an impact, although it will take time for the full effect to become clear. The early indications are that it has resulted in an adjustment in values at the top-end of the market.
For all buyers below £937,500, stamp duty rates have fallen, while those purchasing
above this threshold face higher up-front costs when moving.
In the year to Q1 2015, price growth for sub-£1m properties reached 3%. This compares to 1.6% growth over the same period for homes valued between £2m and £5m. Above £5m, prices have declined by 3.6% year-on-year.
Agents note that where stock is priced competitively, the market continues to function with a healthy level of buyer interest.
Average prices remain 16% below their 2007 peak although there are areas of outperformance. This is most notable in prime urban markets where, in some cases, prices have now surpassed previous peaks.
Londoners continue to be active in the prime country market, especially in regions within commuting distance of the capital, with many looking to take advantage of the relative value gap which has opened up between the two markets (figure 3).
The number of Londoners registering their interest in buying a country home was 19% higher in 2014 compared to the previous year and 32% higher than in 2012, highlighting how demand from the capital has started to filter into the country market. A trend we expect to continue this year.
ANNUAL PRICE GROWTH SLOWS AHEAD OF UK ELECTION Uncertainty surrounding the outcome of the election has resulted in the rate of annual price growth slowing says Oliver Knight
Key headlines from Q1 2015Prime country house prices increased by 0.9% between January and March
Annual price growth in the prime country market over the year to March 2015 stood at 2.5%, down from 3.4% in December
Uncertainty surrounding the outcome of the General Election has resulted in some buyers delaying purchasing decisions
Price growth for sub-£1m properties was 3% over the year to Q1 2015
FIGURE 1
Rate of price growth narrows Annual change in prime central London and prime country property prices
Source: Knight Frank Residential Research Source: Knight Frank Residential Research
FIGURE 2
Price change by price bracket Annual change to Q1 2015
PRIME CENTRAL LONDONPRIME COUNTRY
2009 2010 2011 2012 2013 2014 2015-10%
-5%
0%
5%
10%
15%
20%
25%
£5m+
£2m-£5mSub-£1m
3.0%3.0%
1.6%
-3.6%
RESIDENTIAL RESEARCH
PRIME COUNTRY HOUSE INDEX
OLIVER KNIGHT Residential Research
“ The annual rate of price growth between prime central London and the prime country market has narrowed considerably in recent months.”
Follow Oliver at @oliverknightkf
For the latest news, views and analysis on the world of prime property, visit Global Briefing or @kfglobalbrief
Prime Country House Index Q1 2015