Embed Size (px)
Citation preview
3GABAergic synapse properties may explain genetic varia-
tion in hippocampal network oscillations in mice Published in Frontiers in Cellular Neuroscience (2010) 4:18. doi:10.3389 Tim S. Heistek, A. Jaap Timmerman, Sabine Spijker, Arjen B . Brussaard and Huibert D. Mansvelder 1Department of Integrative Neurophysiology, 2Department of Molecular and Cellular Neuroscience, Center for Neurogenomics and Cognitive Research (CNCR), Neuroscience Campus Amsterdam, VU University, The Netherlands
Cognitive ability and the properties of brain oscillation are highly heritable in humans. Genetic variation underlying oscillatory activity might give rise to differences in cogni-tion and behavior. How genetic diversity translates into altered properties of oscilla-tions and synchronization of neuronal activity is unknown. To address this issue, we in-vestigated cellular and synaptic mechanisms of hippocampal fast network oscillations in eight genetically distinct inbred mouse strains. The frequency of carbachol-induced oscillations differed substantially between mouse strains. Since GABAergic inhibition sets oscillation frequency, we studied the properties of inhibitory synaptic inputs (IP-SCs) received by CA3 and CA1 pyramidal cells of three mouse strains that showed the highest, lowest and intermediate frequencies of oscillations. In CA3 pyramidal cells, the frequency of rhythmic IPSC input showed the same strain differences as the fre-quency of field oscillations. Furthermore, IPSC decay times in both CA1 and CA3 pyramidal cells were faster in mouse strains with higher oscillation frequencies than in mouse strains with lower oscillation frequency, suggesting that differences in GABAA-receptor subunit composition exist between these strains. Indeed, gene expression of GABAA-receptor β2 (Gabrb2) and β3 (Gabrb2) subunits was higher in mouse strains with faster decay kinetics compared with mouse strains with slower decay kinetics. Hip-pocampal pyramidal neurons in mouse strains with higher oscillation frequencies and faster decay kinetics fired action potential at higher frequencies. These data indicate that differences in genetic background may result in different GABAA-receptor subunit expression, which affects the rhythm of pyramidal neuron firing and fast network activ-ity through GABA synapse kinetics.
34 Chapter 3
Introduction
Variation in cognitive abilities in humans can for a large part be explained by genetic variation. More than 85% of the variation in cognitive ability is of genetic origin (Posthuma et al., 2001a, Posthuma et al., 2001b). Twin studies have shown that in humans properties of brain oscillations are also highly heritable (Posthuma et al., 2001b, Smit et al., 2005, Linkenkaer-Hansen et al., 2007). Brain oscillations are thought to be involved in cognition and different oscillation frequencies have been related to specific cognitive processes (Gray et al., 1989, Lopes da Silva, 1991, Llinas and Ribary, 1993). For instance, beta- and gamma-band oscillations are increased during working memory and selective attention tasks (Roelfsema et al., 1997, Tallon-Baudry et al., 1998, Fries et al., 2001, Tallon-Baudry et al., 2001, Womelsdorf et al., 2007). Findings in laboratory animals show that gamma-band oscillations in the hippocampus are most likely involved in memory encoding and retrieval (Lisman and Idiart, 1995, Montgomery and Buzsaki, 2007). Phase coupling of gamma-oscillations between CA1 and CA3 increases during memory retrieval (Montgomery and Buzsaki, 2007), which occurs at different gamma frequencies than between CA1 and the enthorinal cortex (Colgin et al., 2009). In mice, hippocampal oscillations are affected by genetic background ( Jansen et al., 2009). Genetic variation resulting in differences in brain oscillations may give rise to differences in cognition and intelligence in general. However, how genetic differences translate into differences in properties of oscillations and synchronization of neuronal activity is poorly understood.
To address this issue, we studied cellular and synaptic mechanisms underlying hippocampal fast network oscillations in acute brain slices of different mouse strains with known genetic differences. Muscarinic acetylcholine receptor (mAChR) activation in cortical and hippocampal networks acute brain slices induces synchronized activity and network oscillations. During these oscillations, synchronized activity of pyramidal neurons alternates with synchronized activity of inhibitory interneurons (Hajos et al., 2004, Mann et al., 2005, van Aerde et al., 2009). Cellular mechanisms underlying mAChR-induced synchronization depend on synaptic communication between neurons (Fisahn et al., 1998, van Aerde et al., 2008, van Aerde et al., 2009). Ordered pyramidal and interneuron cell firing and inhibitory synaptic feedback constitute the underlying mechanism underlying oscillating neuronal networks at beta/gamma frequencies in all cortical areas (Fisahn et al., 1998, Hajos et al., 2004, Mann and Paulsen, 2005, Mann et al., 2005, Oren et al., 2006). Fast network oscillations in hippocampal slices, which resemble gamma frequency oscillations in hippocampus in vivo (Csicsvari et al., 2003, Mann et al., 2005), are generated within the CA3 region and depend on fast inhibitory transmission within the stratum pyramidale of CA3 (Mann et al., 2005). Inbred mouse strains show substantial differences in gene expression within the hippocampus (Fernandes et al., 2004, Hovatta et al., 2005) and show clear heritable differences in hippocampal oscillation properties ( Jansen et al., 2009). To address the mechanisms underlying genetic variation in network oscillations, we studied CA3 pyramidal neuronal activity and the synaptic inputs they receive in eight different mouse strains during carbachol-induced fast network oscillations. We found that differences in oscillation frequency between mouse strains may be explained by differences
GABAergic properties may explain variation in oscillations 35
in GABAergic synapse properties and GABAA receptor subunit expression.
Material & Methods
Tissue preparationAll experimental methods involving animals were approved by the animal welfare committee of our university, and in accordance with Dutch and European law. The eight inbred mouse strains (129S1SvImJ, A/J, Balb/cByJ (Balbc), C3H/HeJ, C57Bl/6J (C57), DBA/2J, FVB/NJ and NOD/LtJ (NOD); Figure.3.1A) were obtained from Jackson Laboratories (www.jax.com). All animals were between 13 and 17 days old. After decapitation without anesthesia, brains were quickly removed and stored in ice cold artificial cerebrospinal fluid (ACSF) containing 125 mM NaCl, 25 mM NaHCO3, 3 mM KCl, 1.2 mM NaH2PO4, 1 mM CaCl2, 3 mM MgSO4, and 10 mM D(+)-glucose (carboxygenated with 5% CO2 / 95% O2). For RNA isolation, the ventral hippocampus was dissected on ice, and stored at –80° C until further use. For electrophysiology, horizontal slices (400 µm thick)) from the ventral hippocampus were cut using a microtome (Microm; www.microm-online.com). After preparation, slices were stored for at least 1 hour in ACSF containing 2 mM CaCl2 and 2 mM MgSO4. To record field potentials, slices were placed on planar eight by eight multi-electrode arrays with 150 μm spacing (MED-P5155, Panasonic; www.med64.com) or 200 μm (Multichannel Systems; www.multichannelsystems.com), which were coated with polyethylene (Sigma). Slices were left to properly attach to the electrodes for at least 1 hour in a chamber with humidified carbogen gas before they were placed in the recording unit.
ElectrophysiologyLocal field potentials were measured in 4 slices simultaneous with 4 recording units at the same time using the multichannel system or in combination with patch clamp recordings in the MED64 system. During recording slices were perfused with ACSF at a flow rate between 4 and 5 ml/min and were kept at 30ºC. carbamoylcholine chloride (Carbachol, Sigma, www.sigmaaldrich.com) was perfused for at least 45 minutes or added after the mounting of the slices onto the multi electrode grids. Spontaneous field potentials from all 64 recording electrodes were acquired simultaneously at 20 kHz (MED64 system) or with 60 electrodes at 1 kHz (multichannel systems). In addition to fast network oscillations we also observed low frequency network bursts in some slices of Balbc mice (9 out of 19) which occurred at a frequency of 0.54± 0.11 Hz.
Pyramidal cells in CA3 and CA1 neurons were recorded in whole-cell mode using a Multiclamp 700B amplifier (molecular devices www.moleculardevices.com). Borosilicate glass (Harvard Apparatus, www.harvardapparatus.com) electrodes with tip resistances of 2–5 MOhm were filled with intracellular solution containing 140 mM K-gluconate, 1 mM KCl, 10 mM HEPES, 4 mM K-phosphocreatine, 4 mM ATP-Mg, and 0.4 mM GTP (pH adjusted to 7.2 with KOH). To ensure temporal alignment between the multi-electrode and single-cell electrophysiological signals, the current or voltage signals
36 Chapter 3
from the patch-clamp amplifiers were recorded on one channel of the MED64 amplifier, using an interface (Panasonic). IPSCs were recorded at + 20 mV holding potential, while EPSCs were recorded at –70 mV. Internal chloride concentrations were such that at these potentials IPSCs and EPSCs would have a different polarity. As the holding potential might influence the decay time kinetics (Collingridge et al., 1984) mIPSCs were recorded at –70 mV in presence of 25 μM carbachol, 10 μM 6,7-dinitroquinoxaline-2,3(1H, 4H)-dione (DNQX) and 20 μM DL-AP5 and 1 μM TTX and with use of intracellular solution with high chloride concentrations containing: 70 mM Cs-gluconate, 70 mM CsCl, 10 mM HEPES, 5 mM ATP-Mg, and 0.5 mM GTP and 5 mM EGTA (pH adjusted to 7.2 with CsOH). Zolpidem was obtained from Duchefa (www.duchefa.com).
RNA isolation, cDNA synthesis and real-time quantitative PCR (qPCR)After isolation of total RNA (Trizol, Invitrogen, San Diego, USA) according to standard procedures, a DNase-I treatment (2 U, Invitrogen Carlsbad, CA, USA) to remove traces of genomic DNA was performed. The amount and purity of RNA was measured using a spectrophotometer (NanoDrop ND–1000 UV-Vis Spectrophotometer, Nanodrop Technologies, www.nanodrop.com), and the integrity was analyzed by gel electrophoresis. For mouse genes encoding GABAA receptor subunits, transcript-specific primers (Table 1) were designed based on Genbank sequence entries using Primer Express software (PE Biosystems, www.appliedbiosystems.com; manufacturer’s settings). Only primers were taken of which endpoint PCRs showed the amplicon and no primer-dimers as determined by generation of dissociation curves, and which had high amplification efficiencies.
From each tissue sample (n=4 per strain), random primed (hexamers; Eurogentec, www.eurogentec.com) cDNA (1 µg total RNA) was made with reverse transcriptase (200 U; Promega, www.promega.com; manufacturer’s protocol). cDNA Aliquots were stored at –80° C, because repeated freeze-thaw cycles affect measured cycle of threshold (Ct) values. For qPCR measurements (ABI PRISM 7900, Applied Biosystems), PCR conditions (50° C, 2 min; 95° C, 10 min; 40 cycles: 95° C, 10 s, 60° C, 1 min; dissociation curve in 10 min) and SYBR green reagents (Applied Biosystems) were used in a reaction volume of 10 µl using transcript-specific primers (300 nM) on cDNA (~5 ng RNA equivalent).
The obtained Cycle of threshold value for every gene (Ctx) was used to calculate the relative level of gene expression by normalization to the geometric means of replicated reference controls (CtHK; Gapdh, Hprt). GAPDH and HPRT were shown as stable expressing genes across strains (Loos et al., 2009). For all graphical representation and statistical calculations, log2-based values were used for amount of normalized transcript, C – (Ctx – CtHK) (C = 5).
Data AnalysisSynaptic events were detected using Mini Analysis Program (www.synaptosoft.com). All other analysis was done using custom made scripts in igorPro 6.04 (Wavematrics www.wavematrics.com) and matlab R2006B (The Mathworks, www.mathworks.com). Data was down sampled to 200 Hz – 2 kHz for analysis. Frequency and power of oscillations were calculated by fitting a Gaussian function to the Fourier transformed data. The average
GABAergic properties may explain variation in oscillations 37
power and frequency of the oscillations were calculated separately in the different layers of the dentate gyrus, CA3 region and CA1 region by taking the average of all electrodes in that region. Synaptic events were selected by a threshold for amplitude and area which were equal across strains. IPSC τ decay times were calculated by fitting an exponential function to the individual IPSCs and only single synaptic events were used for fitting. The τ decay, amplitudes and interval times of a single neuron were put in a histogram and fitted with a lognormal for τ decay and amplitudes, or Gaussian distribution for interval times. The average IPSC/EPSC frequency was calculated as 1/average interval time. Phase coupling factor was calculated by wavelet transforming the local field potential (LFP) of the electrode closest to the site of the whole cell recording to determine the phase of the oscillations. Statistical analysis used either the Student’s t test (paired or unpaired) or an ANOVA with Student Newman Keuls post-hoc test, as appropriate. For circular statistics we used Hotellings test for paired comparisons and the Watson Williams test. The Rayleigh test was used to test whether the events showed significant phase locking to the oscillation. Data are represented as average ± SEM.
Results
Recently, we reported that in eight genetically different inbred mouse strains variation in properties of fast hippocampal network oscillations can be partly explained by genetic differences ( Jansen et al., 2009). To test whether these genetic differences are reflected in properties of excitatory and inhibitory synapses in CA3 and CA1, which underlie fast
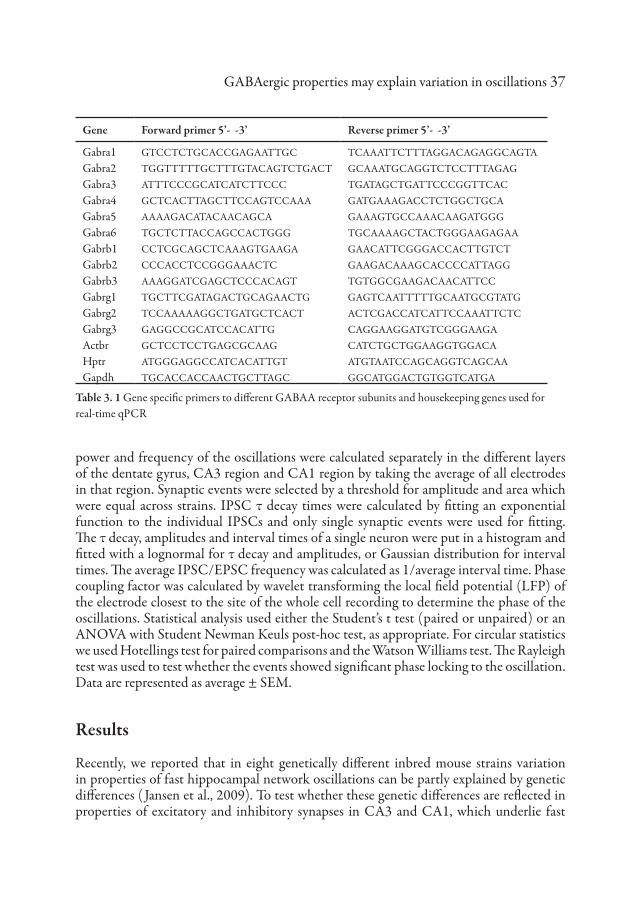
Gene Forward primer 5’- -3’ Reverse primer 5’- -3’
Gabra1 GTCCTCTGCACCGAGAATTGC TCAAATTCTTTAGGACAGAGGCAGTAGabra2 TGGTTTTTGCTTTGTACAGTCTGACT GCAAATGCAGGTCTCCTTTAGAGGabra3 ATTTCCCGCATCATCTTCCC TGATAGCTGATTCCCGGTTCACGabra4 GCTCACTTAGCTTCCAGTCCAAA GATGAAAGACCTCTGGCTGCAGabra5 AAAAGACATACAACAGCA GAAAGTGCCAAACAAGATGGGGabra6 TGCTCTTACCAGCCACTGGG TGCAAAAGCTACTGGGAAGAGAAGabrb1 CCTCGCAGCTCAAAGTGAAGA GAACATTCGGGACCACTTGTCTGabrb2 CCCACCTCCGGGAAACTC GAAGACAAAGCACCCCATTAGGGabrb3 AAAGGATCGAGCTCCCACAGT TGTGGCGAAGACAACATTCCGabrg1 TGCTTCGATAGACTGCAGAACTG GAGTCAATTTTTGCAATGCGTATGGabrg2 TCCAAAAAGGCTGATGCTCACT ACTCGACCATCATTCCAAATTCTCGabrg3 GAGGCCGCATCCACATTG CAGGAAGGATGTCGGGAAGAActbr GCTCCTCCTGAGCGCAAG CATCTGCTGGAAGGTGGACAHptr ATGGGAGGCCATCACATTGT ATGTAATCCAGCAGGTCAGCAAGapdh TGCACCACCAACTGCTTAGC GGCATGGACTGTGGTCATGA
Table 3. 1 Gene specific primers to different GABAA receptor subunits and housekeeping genes used for real-time qPCR
38 Chapter 3
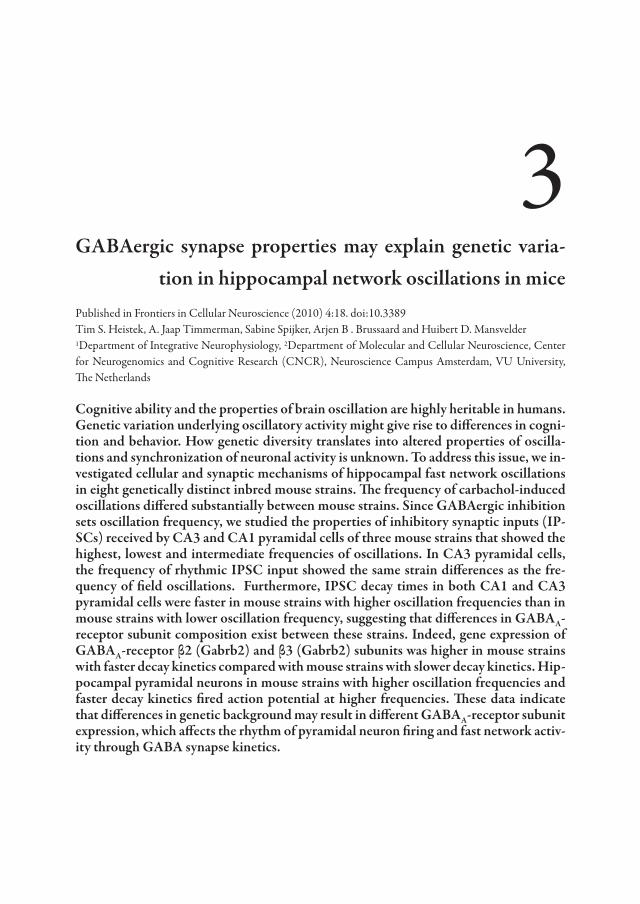
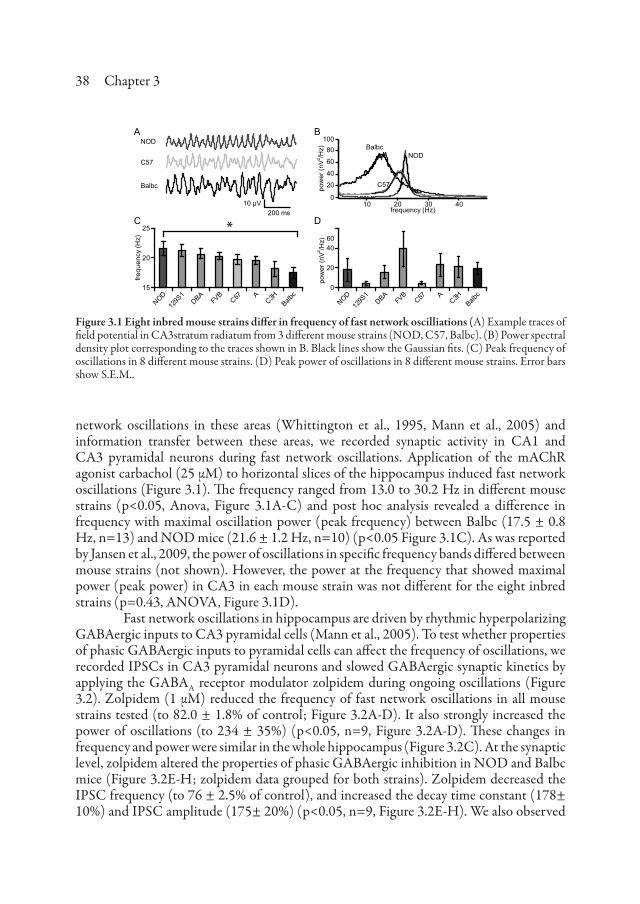
Figure 3.1 Eight inbred mouse strains differ in frequency of fast network oscilliations (A) Example traces of field potential in CA3stratum radiatum from 3 different mouse strains (NOD, C57, Balbc). (B) Power spectral density plot corresponding to the traces shown in B. Black lines show the Gaussian fits. (C) Peak frequency of oscillations in 8 different mouse strains. (D) Peak power of oscillations in 8 different mouse strains. Error bars show S.E.M..
network oscillations in these areas (Whittington et al., 1995, Mann et al., 2005) and information transfer between these areas, we recorded synaptic activity in CA1 and CA3 pyramidal neurons during fast network oscillations. Application of the mAChR agonist carbachol (25 μM) to horizontal slices of the hippocampus induced fast network oscillations (Figure 3.1). The frequency ranged from 13.0 to 30.2 Hz in different mouse strains (p<0.05, Anova, Figure 3.1A-C) and post hoc analysis revealed a difference in frequency with maximal oscillation power (peak frequency) between Balbc (17.5 ± 0.8 Hz, n=13) and NOD mice (21.6 ± 1.2 Hz, n=10) (p<0.05 Figure 3.1C). As was reported by Jansen et al., 2009, the power of oscillations in specific frequency bands differed between mouse strains (not shown). However, the power at the frequency that showed maximal power (peak power) in CA3 in each mouse strain was not different for the eight inbred strains (p=0.43, ANOVA, Figure 3.1D).
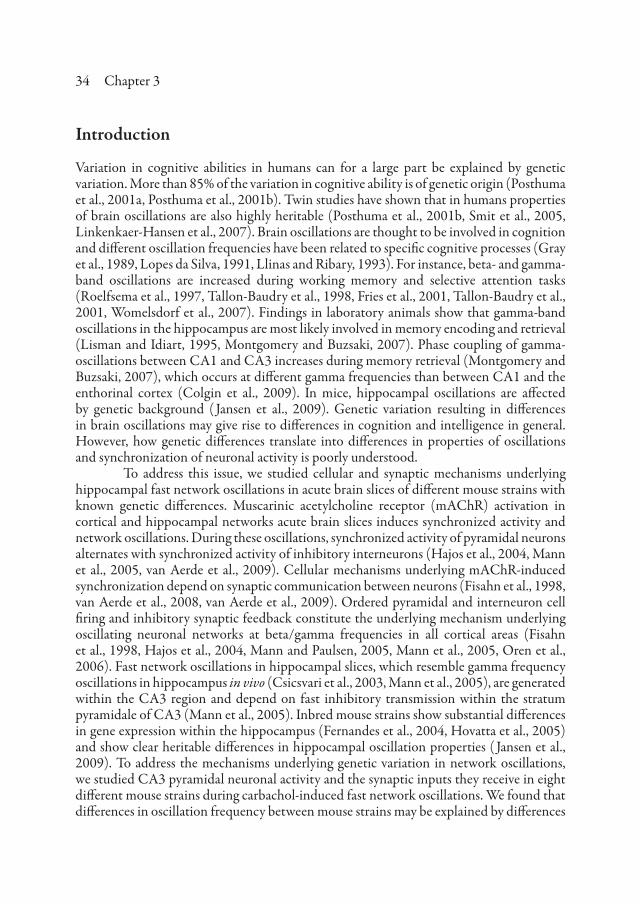
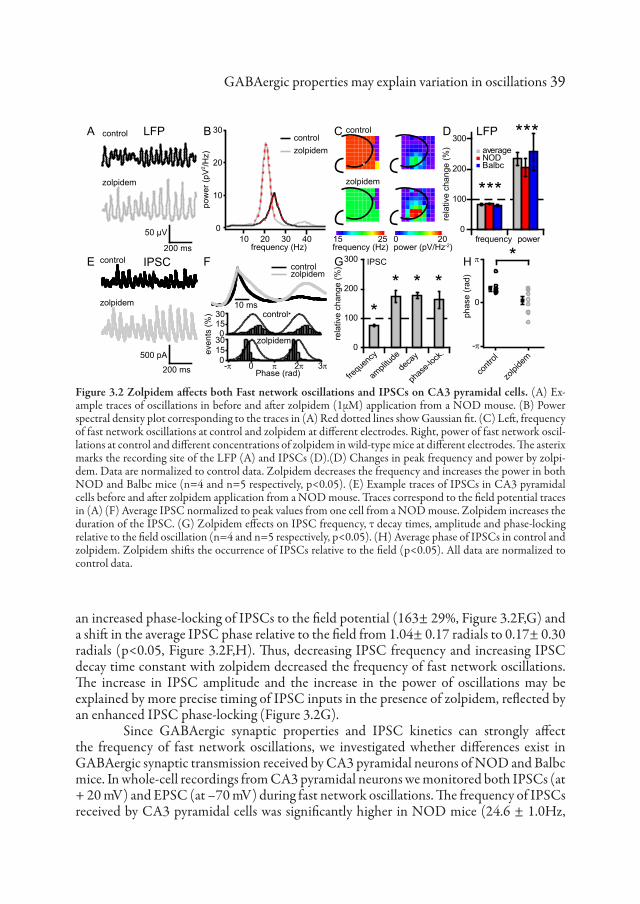
Fast network oscillations in hippocampus are driven by rhythmic hyperpolarizing GABAergic inputs to CA3 pyramidal cells (Mann et al., 2005). To test whether properties of phasic GABAergic inputs to pyramidal cells can affect the frequency of oscillations, we recorded IPSCs in CA3 pyramidal neurons and slowed GABAergic synaptic kinetics by applying the GABAA receptor modulator zolpidem during ongoing oscillations (Figure 3.2). Zolpidem (1 μM) reduced the frequency of fast network oscillations in all mouse strains tested (to 82.0 ± 1.8% of control; Figure 3.2A-D). It also strongly increased the power of oscillations (to 234 ± 35%) (p<0.05, n=9, Figure 3.2A-D). These changes in frequency and power were similar in the whole hippocampus (Figure 3.2C). At the synaptic level, zolpidem altered the properties of phasic GABAergic inhibition in NOD and Balbc mice (Figure 3.2E-H; zolpidem data grouped for both strains). Zolpidem decreased the IPSC frequency (to 76 ± 2.5% of control), and increased the decay time constant (178± 10%) and IPSC amplitude (175± 20%) (p<0.05, n=9, Figure 3.2E-H). We also observed
NOD12
9S1
DBAFV
BC57 A
C3HBalb
c15
20
25
NOD12
9S1
DBAFV
BC57 A
C3HBalb
c
frequ
ency
(Hz)
0
20
4060
pow
er (n
V2 /H
z)
80
60
40
20
040302010
frequency (Hz)
pow
er (n
V2 /H
z)
100
200 ms 10 µV
NOD
Balbc
C57
A
C
B
D*
NODBalbc
C57
GABAergic properties may explain variation in oscillations 39
an increased phase-locking of IPSCs to the field potential (163± 29%, Figure 3.2F,G) and a shift in the average IPSC phase relative to the field from 1.04± 0.17 radials to 0.17± 0.30 radials (p<0.05, Figure 3.2F,H). Thus, decreasing IPSC frequency and increasing IPSC decay time constant with zolpidem decreased the frequency of fast network oscillations. The increase in IPSC amplitude and the increase in the power of oscillations may be explained by more precise timing of IPSC inputs in the presence of zolpidem, reflected by an enhanced IPSC phase-locking (Figure 3.2G).
Since GABAergic synaptic properties and IPSC kinetics can strongly affect the frequency of fast network oscillations, we investigated whether differences exist in GABAergic synaptic transmission received by CA3 pyramidal neurons of NOD and Balbc mice. In whole-cell recordings from CA3 pyramidal neurons we monitored both IPSCs (at + 20 mV) and EPSC (at –70 mV) during fast network oscillations. The frequency of IPSCs received by CA3 pyramidal cells was significantly higher in NOD mice (24.6 ± 1.0Hz,
Figure 3.2 Zolpidem affects both Fast network oscillations and IPSCs on CA3 pyramidal cells. (A) Ex-ample traces of oscillations in before and after zolpidem (1μM) application from a NOD mouse. (B) Power spectral density plot corresponding to the traces in (A) Red dotted lines show Gaussian fit. (C) Left, frequency of fast network oscillations at control and zolpidem at different electrodes. Right, power of fast network oscil-lations at control and different concentrations of zolpidem in wild-type mice at different electrodes. The asterix marks the recording site of the LFP (A) and IPSCs (D).(D) Changes in peak frequency and power by zolpi-dem. Data are normalized to control data. Zolpidem decreases the frequency and increases the power in both NOD and Balbc mice (n=4 and n=5 respectively, p<0.05). (E) Example traces of IPSCs in CA3 pyramidal cells before and after zolpidem application from a NOD mouse. Traces correspond to the field potential traces in (A) (F) Average IPSC normalized to peak values from one cell from a NOD mouse. Zolpidem increases the duration of the IPSC. (G) Zolpidem effects on IPSC frequency, τ decay times, amplitude and phase-locking relative to the field oscillation (n=4 and n=5 respectively, p<0.05). (H) Average phase of IPSCs in control and zolpidem. Zolpidem shifts the occurrence of IPSCs relative to the field (p<0.05). All data are normalized to control data.
200 ms
50 µV
A control
zolpidem
200 ms
500 pA
control
zolpidem
0
100
200
300
frequency power
rela
tive
chan
ge (%
)
D
*
*
E
0
10
20
30
40302010frequency (Hz)
pow
er (p
V2 /H
z)
B controlzolpidem
LFP LFP
IPSC
0
100
200
300
frequ
ency
amplit
ude
deca
y
phas
e-loc
k.
rela
tive
chan
ge (%
)G
****
IPSC
averageNODBalbc
**
* *
10 ms
F
even
ts (%
)
zolpidem
control
30150
3π2ππ0-π
3015
controlzolpidem
Phase (rad)
0
π
0
-π
phas
e (r
ad)
contr
ol
zolpi
dem
*H
2515frequency (Hz)
200power (pV/Hz-2)
zolpidem
controlC
*

40 Chapter 3
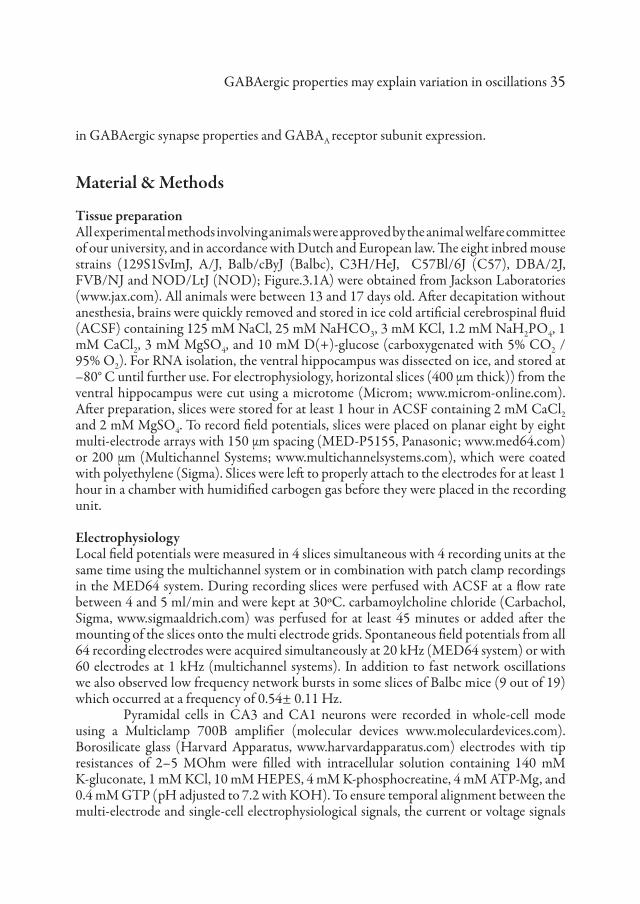
n=7) than in Balbc mice (20.6 ± 1.1Hz, n=6), while in C57 mice pyramidal neurons received IPSCs at intermediate frequencies (21.7 ± 0.9Hz, n=8) (p<0.05, Figure 3.3B,C). In each mouse strain, the IPSC frequency received by CA3 pyramidal neurons was very similar to the frequency of fast network oscillations in that particular strain (Figure 3.3E). In addition to higher frequencies of IPSCs, GABAergic inputs to CA3 pyramidal neurons
Figure 3.3 IPSCs in CA3 pyramidal cells of NOD and Balbc mice differ in IPSC frequency and τ decay times. (A) Hippocampal slice placed on a 64 electrode grid and example traces of local field potential and cor-responding IPSCs in a CA3 pyramidal cell from an NOD mouse. (B) Histogram of decay time constants of IPSCs from NOD (light gray) and Balbc (dark gray) mice. Histograms are fitted with lognormal functions. (C) Decay time constants of NOD (n=7), C57 (n=8) and Balbc (n=6) mice. NOD mice have faster decay time constants than Balbc mice (p<0.05). Average values are shown in black. (D) Histogram of IPSC interval times from cells of NOD and Balbc mice. Histograms are fitted with a Gaussian function. The average IPSC frequency is calculated as 1/average interval time. (E) IPSC frequencies of 3 different mouse lines. Average values are shown in black, average frequency of field oscillations are shown in gray. NOD mice have higher IPSC and field potential frequencies than Balbc mice (p<0.05). (F) IPSC Amplitudes in 3 different mouse strains. Amplitudes were calculated by fitting a log normal function to the amplitude distribution. (G) (top) Average waveform of the field oscillation next to the recording site of the CA3 pyramidal cell. (middle) IPSC event probability histogram at different phases of the oscillation. (bottom) EPSC event probability histogram at different phases of the oscillation from a Balbc mouse. (H) IPSC – field potential phase-locking r values for 3 different mouse strains. (I) Average phase of IPSCs. Error bars show SEM.
A B
F
LFP
IPSC’s
Ham
plitu
de (p
A)
NOD BalbcC57
400
300
200
100
0
I
200 ms
30
25
20
15
IPS
C fr
eque
ncy
(Hz)
NOD BalbcC57
*15
10
5
0
τ decay (ms)
*
LFP
freq
uenc
y (H
z)
2520151050
20
15
10
5
0
C
IPS
Cs
(%)
τ de
cay
(ms)
80604020
5
0
20
15
10
IPS
Cs
(%)
D E
NOD BalbcC57IPSC interval (ms)
phas
eloc
king
r va
lue
1
0.8
0.6
0.4
0.2
0NOD BalbcC57
2π
1π
0
phas
e (r
adia
ns)
NOD BalbcC57
20100
even
ts (%
)
3π2ππ0-πPhase (rad)
1050
LFP
IPSC
EPSC
NODBalbc
G
30
15
300 µm
20 µV
200 pA

GABAergic properties may explain variation in oscillations 41
in NOD mice also had a significantly faster τ decay time constant (8.3 ±0.7ms) compared to Balbc mice (10.7 ±0.4ms) (p<0.05, Figure 3.3D,E), while IPSCs in C57 mice showed intermediate decay time constants (9.0 ±0.7ms). Just as IPSC frequency, IPSC kinetics paralleled the frequency of oscillations in different mouse strains: NOD mice showed faster network oscillations and faster IPSC decay kinetics, whereas Balbc mice showed slower network oscillations and slower IPSC decay kinetics. IPSC amplitude, phase-locking and IPSC timing relative to the field were not different between different mouse strains (p>0.05 Figure 3.3F-I), in line with the absence of difference between power of fast network oscillations between NOD and Balbc mice (Figure 3.1E). These data suggest that differences in kinetics of GABAergic inhibition received by CA3 pyramidal neurons may explain the differences in fast network oscillations in genetically distinct mouse strains.
We next tested whether differences exist in excitatory glutamatergic transmission received by CA3 pyramidal neurons in NOD and Balbc mice. Spontaneous EPSCs recorded in CA3 pyramidal cells of NOD mice arrived at a similar frequency as in Balbc mice and were timed similarly related to the network oscillations (Figure 3.4C, E, and F). However, the amplitude of excitatory inputs were larger in Balbc mice (57.5 ±6.5pA n=6) than in NOD mice (39.1 ±2.7pA, n=7; p<0.05, Figure 3.4D). Thus, lower frequencies of phasic GABAergic inhibition and fast network oscillations in Balbc mice are not reflected by an altered frequency of excitatory transmission, but by increased amplitudes of EPSCs.
Carbachol-induced fast network oscillations in the CA1 area of the hippocampus are driven by rhythmic activity of CA3 circuits (Fisahn et al., 1998, Mann et al., 2005). Physically dissociating CA1 from CA3 in hippocampal slices silences carbachol-induced
Figure 3.4 EPSCs in CA3 pyramidal cells in NOD and Balbc mice differ in amplitude. (A) Hippocampal slice placed on a 64 electrode grid and example traces of local field potential and corresponding EPSCs in a CA3 pyramidal cell from a NOD mouse recorded at the in the white colored electrode in the picture. (B) Example traces of EPSCs in NOD and Balbc mice. (C) EPSC frequency in NOD (n=7) and Balbc (n=6) mice. (D) Average EPSC amplitude is higher in Balbc mice compared to NOD mice (p<0.05). (E) IPSC – field potential phase-locking r values for NOD and Balbc mice. (F) Average phase of IPSCs. Average values + SEM are shown in black.
A B
EP
SC
freq
uenc
y (H
z)
LFP
EPSC’s
200 ms
50 pA
C D100
75
50
25
0
*
ampl
itude
(pA
)
NOD Balbc
phas
eloc
king
r va
lue 1
0.8
0.6
0.4
0.2
0NOD Balbc
phas
e (r
ad)
2p
1π
0
NOD Balbc
30
20
10
0NOD Balbc
LFP
freq
uenc
y (H
z)30
15E F
NOD
Balbc
150 µm
200 ms 20 µV
50 pA
42 Chapter 3
ALFP
IPSC’s
200 ms15
10
5
0
B
τ de
cay
(ms)
20151050 IP
SC
s (%
)
τ decay (ms)2520151050
*
NOD Balbc
D
even
ts (%
)
3π2ππ0-πPhase (rad)
LFP
IPSC
EPSC
151050
10
5
0
30
25
20
15
IPS
C fr
eque
ncy
(Hz)
C
NOD Balbc
NODBalbc
150 µm
5 µV
100 pA
Figure 3.5 IPSCs in CA1 pyramidal cells of NOD and Balbc mice differ in τ decay times. (A) Hippocampal slice (top) placed on a 64 electrode grid and example traces of local field potential and corresponding IPSCs in a CA1 pyramidal cell from an NOD mouse. Histogram (bottom) of de-cay time constants of IPSCs from NOD and Balbc mice. Histograms are fitted with lognormal functions. (B) Decay time con-stants of NOD (n=11) and Balbc (n=7) mice. NOD mice have faster decay time constants than Balbc mice (p<0.05). (C) IPSC frequencies of NOD and Balbc mice. (D) (top) Average waveform of the field oscillation next to the recording site of the CA1 pyramidal cell. (middle) IPSC event probability histogram at different phases of the oscillation. (bottom) EPSC event prob-ability histogram at different phases of the oscillation from an NOD mouse. Average values + SEM are shown in black.
oscillations in CA1, but not in CA3 (Fisahn et al., 1998). Within a mouse strain, carbachol-induced fast network oscillations in CA1 had the same frequency as oscillations in CA3. Between mouse strains, oscillation frequency in CA1 showed similar differences as was the case for CA3 (NOD: 19.7± 0.5 Hz; Balbc: 16.9± 0.6 Hz, p<0.05, data not shown). To test whether spontaneous GABAergic inhibition received by CA1 pyramidal cells during ongoing oscillations showed similar differences between NOD and Balbc mice as inhibition received by CA3 pyramidal cells, we recorded IPSCs in CA1 pyramidal neurons. The IPSC inputs to CA1 pyramidal cells were less timed than in CA3 and showed lower phase-locking r-values (p<0.05 Figure 3.3G,H and Figure 3.5D). Although the IPSC decay kinetics were faster in CA1 compared with CA3 pyramidal cells, we observed a similar difference in decay time constant between NOD (6.4 ±0.3ms, n=11) and Balbc (8.8 ±0.6pA, n=7) (p<0.05, Figure 3.5A,B). We observed no differences in IPSC frequency between NOD and Balbc (p>0.05, Figure 3.5D,E), neither did we find differences in IPSC amplitude, phase-locking or phase (Figure 3.5F-I).
Altered decay kinetics of GABAergic synaptic activity most likely results from differences in GABAA receptor subunit expression in GABAergic synapses (Brussaard et al., 1997, Brussaard and Herbison, 2000, Bosman et al., 2005b). To test whether differences in GABAA receptor subunits exist in hippocampus of NOD and Balbc mice, we compared mRNA levels of different GABAA receptor subunits in hippocampus. We observed no differences in expression of α or γ subunits, however there was a significant

GABAergic properties may explain variation in oscillations 43
higher expression of the β2 and β3 subunits in NOD mice compared with Balbc mice (p=0.008 and p=0.020, both n=4, Figure 3.6A), suggesting that GABAergic synapses in NOD mice may have a different molecular composition or stochiometry of subunits.
To test whether differences in GABAA receptor subunit expression in hippocampus of NOD and Balbc mice was reflected in altered kinetics of single GABAergic synapses, we recorded miniature IPSCs (mIPSCs) from CA3 pyramidal neurons while preventing action potential firing by blocking sodium channels with TTX. In the presence of Carbachol, decay time constants of mIPSCs in NOD mice were faster than in Balbc mice (NOD: 6.8 ±0.3ms, n=5; Balbc: 7.8 ±0.2ms, n=8; p<0.05, Figure 3.6B,C). The frequency of mIPSCs did not differ between the mouse strains (Figure 3.6D). IPSCs from CA1 pyramidal cells showed a similar difference in decay time constants (data not shown). These data show that GABAergic synapses on hippocampal pyramidal neurons show different kinetics that most likely result from differences in GABAA receptor subunit expression. These differences in subunit expression may explain the higher frequency of fast network oscillations in hippocampus of NOD mice compared with Balbc mice.
The pyramidal cell-interneuron feedback model for fast network oscillations predicts that the spike timing and spiking probability of pyramidal cells depends on the decay time of inhibitory inputs (Traub et al., 2000). Since decay times of IPSCs differed between NOD and Balbc mice, we tested whether hippocampal pyramidal cells showed differences in action potential firing during fast network oscillations in these mouse strains. In cell-attached recordings during carbachol induced oscillations, the AP firing frequency of CA3 pyramidal cells was significantly higher in NOD (6.1 ±1.0Hz ) compared to Balbc mice (3.7 ±0.6Hz, p<0.05 Figure 3.7A,B). All CA3 cells showed significant phase-locking to the field oscillations (Figure 3.7C) in both mouse strains. However, the timing
mR
NA
exp
ress
ion
leve
l (lo
g2)
β-actin α1 α2 β1 β2 β3 γ2
**
GABAAR
ABalbcNOD
1
2
3
8B +CCh + TTX
20151050
2520151050τ decay (ms)
mIP
SC
s (%
)
C10
5
0
τ de
cay
(ms)
NOD Balbc
mIP
SC
freq
uenc
y (H
z)
D
NOD Balbc
2
1.5
1
0.5
0
*
5 ms 20 pA
Figure 3.6 NOD and Balbc mice strains differ in mRNA expression of GABAA receptor subunits β2 and β3 and mIPSC kinetics. (A) mRNA expression levels of β actin (Actb) and different GABAA receptor subunits in NOD and Balbc mice in the hippocampus. There is a significant difference in mRNA expression of the GABAA receptor subunits β2 (Gabrb2) and β3 (Gabrb3) between NOD and Balbc mice (both n=4, p<0.05). (B) Example traces of mIPSCs from CA3 pyramidal cells from NOD and Balbc mice (top) and histogram (bottom) of decay time constants of IPSCs from NOD and Balbc mice. Histograms are fitted with lognormal functions. (C) Decay time constants of NOD (n=5) and Balbc (n=8) mice. NOD mice have faster decay time constants then Balbc mice (p<0.05). (D) Average frequencies of mIPSCs of NOD and Balbc mice. Average values + SEM. are shown in black.

44 Chapter 3
A B *
C
20
15
10
5
0NOD Balbc
100 ms 20 pA
100 ms 5 µV
Spikes
LFP
NODSpikes
Balbc
LFP
spik
e fre
quen
cy (H
z)
D
-π
π
0
phas
e (r
adia
ns)
NOD Balbc
*20
10
0
Spik
es (%
)
3π2ππ0-πPhase (rad)
20
10
0
Spik
es (%
)
3π2ππ0-πPhase (rad)
NOD
Balbc
NOD Balbc
F20
15
10
5
0
spik
e fre
quen
cy (H
z)
E
Spikes
LFP 100 ms 20 pA
100 ms 5 µV
1510
0Spik
es (%
)
3π2ππ0-πPhase (rad)
5
CA3
CA1
Figure 3.7 Spike timing and frequency differs between NOD and Balbc mice. (A) Example traces of spikes recorded from CA3 pyramidal cells in cell-attached mode and field potential in NOD and Balbc mice. (B) Average firing frequency of CA3 pyramidal cells in NOD (n=16) is higher than in Balbc (n=16, p<0.05) mice. (C) Av-erage waveform of the field oscillation spike probability histogram at different phases of the oscillation from a cell from a NOD (top) and a Balbc (bottom) mouse. (D) I. Average phase of spikes. Spikes in CA3 pyramidal cells from Balbc mice occur at a earlier phase than in NOD mice (p<0.05).(E) Example traces of spikes recorded from CA1 pyramidal cells from a Balbc mouse in cell-attached mode and field potential (top) and average spike probability histogram at different phases of the oscillation (bottom). F. Average firing frequency of CA1 pyrami-dal cells in NOD and Balbc mice. Average values + SEM are shown in black.
of spiking occurred around the peak of the oscillation in pyramidal neurons of NOD mice (-0.05 ±0.02π), while in Balbc mice most spikes occurred before the peak (-0.16 ±0.04π, p<0.05, Figure 3.7C,D). Unlike CA3 pyramidal cells only 4 out of 16 CA1 pyramidal cells in NOD mice and 2 out of 13 CA1 pyramidal cells in Balbc mice fired phase-locked to the oscillations in CA1 (Figure 3.7E). Furthermore, there was no difference in firing frequency between NOD and Balbc mice in CA1 pyramidal cells (Figure 3.7F). These data indicate that the decay kinetics of GABAergic synapses may affect the timing and frequency of

GABAergic properties may explain variation in oscillations 45
CA3 pyramidal cell firing as well as the frequency of fast network oscillations.
Discussion
Brain oscillations are thought to be involved in cognition (Gray et al., 1989, Lopes da Silva, 1991, Llinas and Ribary, 1993), and properties of brain oscillations are also highly heritable (Deary et al., 2010). Little is known about the mechanisms by which genetic variation affects synchronized neuronal activity. In this study, we investigated what mechanisms may give rise to differences in fast network oscillations in hippocampus of genetically distinct inbred mouse strains. Our main findings are that: 1- Genetically distinct mouse lines show differences in the frequency of fast network oscillations that are paralleled by similar differences in the frequency of inhibitory inputs received by CA3 pyramidal neurons. 2- Differences in frequency of oscillations are also paralleled by differences in GABAergic synapse decay kinetics in CA3 and CA1 pyramidal cells. 3- In mouse strains with the highest frequency of oscillations and fastest GABA synapse kinetics, there is more gene expression of GABAA receptor β2 and β3 subunit mRNA. 4- In NOD mice, which show the fastest field oscillations, CA3 pyramidal cells fire at a higher frequency and at a later phase of the field oscillations than in Balbc mice. Our findings suggest that differences in genetic background result in different GABAA-receptor subunit expression. This may affect GABA synapse kinetics and thereby action potential firing of CA3 pyramidal cells and the frequency of fast network oscillations
GABAergic inhibition is critical for fast network oscillations, both in hippocampus and neocortex (Whittington et al., 1995, Fisahn et al., 1998, Traub et al., 2000, Mann et al., 2005, Atallah and Scanziani, 2009, van Aerde et al., 2009). Recurrent feedback loops between pyramidal cells and inhibitory interneurons underlie cholinergically-induced gamma oscillations (Fisahn et al., 1998; Traub et al., 2000; Mann et al., 2005). In the CA3 region of the hippocampus, perisomatic inhibition of CA3 pyramidal neurons appears to dictate the time window during which these neurons fire action potentials (Hajos et al., 2004, Mann et al., 2005). Rapid adjustments in inhibition can instantaneously modulate oscillation frequency(Atallah and Scanziani, 2009). We find that the frequency of inhibitory inputs received by CA3 pyramidal neurons is similar to the frequency of field oscillations. In addition, in genetically different mouse strains the inhibitory input frequency differs to a similar extent as the field oscillations. Therefore, one may predict that the window during which the CA3 pyramidal neuron can escape inhibition and fire an action potential may be shorter in NOD mice due to higher IPSC frequencies.
However, this appears not to be the case, since mouse strains that showed higher IPSC frequencies, also showed faster IPSC decay kinetics. In line with other studies (Fisahn et al., 1998, Cope et al., 2005), we found that the modulation of IPSC decay kinetics directly affects the frequency of oscillations. Decay kinetics of perisomatic inhibition in pyramidal neurons most likely also determines the time window during which the cell can fire action potentials. In cells that receive IPSCs with faster decay kinetics, the episode of inhibition during which the threshold for spiking is elevated will most likely be shorter.

46 Chapter 3
Thereby, the combination of IPSCs that arrive more frequent but with faster decay kinetics entrains action potential firing of CA3 pyramidal neurons at higher frequencies. Thus, faster GABAergic synapses may give rise to faster recurrent feedback loops between pyramidal cells and interneurons. Thereby, NOD mice may experience faster field oscillations than Balbc mice. Allosteric enhancement of GABA decay kinetics not only reduced the frequency, but also increased the power of oscillations. In addition to decay times of IPSCs, zolpidem also affected IPSC amplitudes. Since hippocampal field potential oscillations are a reflection of inhibitory synaptic potentials (Oren et al., 2010), this may explain the increase in oscillation power caused by zolpidem. Since we did not observe a different in IPSC amplitude between the mouse strains, this may explain the absence of a difference in oscillation peak power between mouse strains.
Both inhibitory and excitatory synaptic transmission in CA3 are required for rhythm generation. It was shown recently that excitation and inhibition fluctuate in balance during kainate-induced oscillations (Atallah and Scanziani, 2009). However, in carbachol-induced oscillations the phase locking of excitatory input was much smaller then the phase locking of inhibitory input, which is in agreement with earlier studies showing that pyramidal cells receive phase-locked inhibition while interneurons receive phase locked excitation during carbachol induced oscillations (Oren et al., 2006). The amplitude of EPSCs was larger in the mouse strain that showed the slowest oscillation frequency, Balbc. It is unclear what the underlying cause for larger amplitude EPSCs in these mice is. It was recently described that field oscillations are predominantly shaped by inhibitory inputs received by CA3 pyramidal cells (Oren et al., 2010b). Therefore, the difference in EPSC amplitude between mouse strains was most likely not reflected in the frequency of field oscillations.
GABAA receptor subunit distribution in hippocampal synapses has been described to some extent in the CA1 region (Fritschy and Brunig, 2003), however receptor subunit distribution in peri-somatic inhibitory synapses in CA3 is not known. We found that NOD mice showed faster IPSC kinetics and had higher mRNA levels of both β2 as well as β3 subunits. GABAA α and β subunits affect decay time kinetics ((Brussaard et al., 1997, Brussaard and Herbison, 2000, Bosman et al., 2005b). In GABAA receptors containing α5 and γ2 subunits, and β2 and β3 subunits affect GABA currents in opposite directions: receptors with β2 subunits had the highest desensitization rate, while receptors with β3 showed the lowest desensitization rate (Burgard et al., 1996). How increased expression of both β2 and β3 subunits affects GABA receptor kinetics is not clear at this point. Also, it is not known how β subunits affect kinetics of GABAA receptors expressing other α and γ subunits than α5 and γ2. In transgenic mice lacking β3 subunits, decay time kinetics of IPSCs in cortical and hippocampal neurons are faster (Ramadan et al., 2003, Hentschke et al., 2009), and gamma oscillations in the hippocampus are smaller and faster (Hentschke et al., 2009). However in these mice not only the β3 subunit is lacking, but also the expression of α2 and α3 subunits is reduced, which may affect decay time kinetics (Ramadan et al., 2003). This may suggest that β subunits could affect protein levels of other α subunits, thereby affecting receptor kinetics.
IPSC kinetics in CA1 pyramidal neurons was faster than in CA3 pyramidal

GABAergic properties may explain variation in oscillations 47
neurons. Fritschy and Brunig, 2003, showed that in CA1 pyramidal neurons peri-somatic inhibitory synapses predominantly contain α1 subunits. We have evidence that inhibitory inputs to CA3 pyramidal neurons may be mainly mediated by α2 containing receptors (TSH and HDM, unpublished observations), which could explain the differences in IPSC kinetics between these regions. Whether regional differences in β2 and β3 subunit expression exist in hippocampus is not known.
Although it is likely that GABAergic synapse kinetics can account for the observed variation in oscillation frequency between mouse lines, there might be other genes that contribute to differences in properties of fast network oscillations in these strains. While manipulation of ionic channels affecting the excitability of pyramidal cells, such as Im, Ih and Icat (Fisahn et al., 2002, Leao et al., 2009), mainly affects the power of hippocampal oscillations, manipulation of interneuron excitability does affect the frequency of oscillations (Mann and Mody, 2010). Whether differences in interneuron excitability exist between NOD and Balbc mice is not known. and Balbc mice show differences in behavior, including anxiety and impulsivity behavior (Fernandes et al., 2004, Hovatta et al., 2005, Loos et al., 2009). It might very well be that genes involved in anxiety and impulsivity also influence neuronal oscillatory activity. Behavioral studies showed that spatial learning and hippocampal LTP are affected in some of these mouse strains (Nguyen et al., 2000, Nguyen and Gerlai, 2002). In recombinant inbred mouse lines there is a high variability in protein kinase C (PKC) levels which correlates with spatial learning (Wehner et al., 1990). PKC activity is known to affect GABAA receptor functioning and trafficking (Song and Messing, 2005) and could thereby also contribute to the variation in frequency of oscillations. Differences in properties of oscillations might explain heritable variations in cognitive ability. Cognitive functions require the integrated activity of multiple specialized, distributed brain areas. Phase coupling between different areas of the hippocampus and cortex is thought to regulate the information flow between brain areas (Canolty et al., 2006, Sirota et al., 2008, Colgin et al., 2009). Small differences in frequency of oscillations in the hippocampus may lead to a different coupling efficiency and thereby influence spatial and temporal memory processes. Therefore it is likely that genetic variation influencing GABAergic inhibition could impact on neuronal network dynamics and cognition. Indeed in humans there are indications that polymorphisms in GABAA receptor properties are related with beta and gamma band power of neuronal oscillations (Porjesz et al., 2002). Furthermore, in schizophrenia patients there is a decrease in gamma band activity (Cho et al., 2006) that is correlated with increased expression of the GABAA receptor α2 subunit and a decrease in GABA transporters(Lewis et al., 2005, Lewis et al., 2008). However little is known about variation in frequency within the gamma band and its implication for cognition. As the frequency range of gamma oscillations in vivo is much broader than observed in hippocampal slices, it will be challenging to test whether variation in the frequency range of gamma oscillations exists between individuals.


![SpikingNeuralNetworkModel CalculatingLocalFieldPotentialfrom · [1]Gyorgy Buzsaki, Costas A. Anastassiou, and Christof Koch. The origin of extracellular elds and currents eeg, ecog,](https://img.dokumen.tips/doc/110x75/6021deed01e5097b916a3793/spikingneuralnetworkmodel-calculatinglocalfieldpotentialfrom-1gyorgy-buzsaki.jpg)