Embed Size (px)
Citation preview

Agilent G1701EA MSD Productivity ChemStation
Familiarization Guide
Agilent Technologies

Notices© Agilent Technologies, Inc. 2012
No part of this manual may be reproduced
in any form or by any means (including
electronic storage and retrieval or transla-
tion into a foreign language) without prior
agreement and written consent from
Agilent Technologies, Inc. as governed by
United States and international copyright
laws.
Manual Part Number
G1701-90070
Edition
Second edition, June 2012
Printed in USA
Agilent Technologies, Inc.
5301 Stevens Creek Boulevard
Santa Clara, CA 95051 USA
Warranty
The material contained in this docu-ment is provided “as is,” and is sub-ject to being changed, without notice, in future editions. Further, to the max-imum extent permitted by applicable law, Agilent disclaims all warranties, either express or implied, with regard to this manual and any information contained herein, including but not limited to the implied warranties of merchantability and fitness for a par-ticular purpose. Agilent shall not be liable for errors or for incidental or consequential damages in connection with the furnishing, use, or perfor-mance of this document or of any information contained herein. Should Agilent and the user have a separate written agreement with warranty terms covering the material in this document that conflict with these terms, the warranty terms in the sep-arate agreement shall control.
Technology Licenses
The hardware and/or software described in
this document are furnished under a
license and may be used or copied only in
accordance with the terms of such license.
Restricted Rights Legend
If software is for use in the performance of
a U.S. Government prime contract or sub-
contract, Software is delivered and
licensed as “Commercial computer soft-
ware” as defined in DFAR 252.227-7014
(June 1995), or as a “commercial item” as
defined in FAR 2.101(a) or as “Restricted
computer software” as defined in FAR
52.227-19 (June 1987) or any equivalent
agency regulation or contract clause. Use,
duplication or disclosure of Software is
subject to Agilent Technologies’ standard
commercial license terms, and non-DOD
Departments and Agencies of the U.S.
Government will receive no greater than
Restricted Rights as defined in FAR
52.227-19(c)(1-2) (June 1987). U.S. Govern-
ment users will receive no greater than
Limited Rights as defined in FAR 52.227-14
(June 1987) or DFAR 252.227-7015 (b)(2)
(November 1995), as applicable in any
technical data.
Safety Notices
CAUTION
A CAUTION notice denotes a
hazard. It calls attention to an oper-
ating procedure, practice, or the
like that, if not correctly performed
or adhered to, could result in
damage to the product or loss of
important data. Do not proceed
beyond a CAUTION notice until the
indicated conditions are fully
understood and met.
WARNING
A WARNING notice denotes a hazard. It calls attention to an operating procedure, practice, or the like that, if not correctly per-formed or adhered to, could result in personal injury or death. Do not proceed beyond a WARNING notice until the indicated condi-tions are fully understood and met.

In This Guide
Agilent G1701EA MSD Productivity Che
This guide contains a step-by-step exercise to help you become familiar with your Agilent 7890A GC/5975 MSD with G1701EA MSD Productivity ChemStation software.
To successfully use this book, you need the following:
Before operating your instruments, be sure to read all safety and regulatory information included with your instruments.
• GC Inlet: Split/Splitless Inlet with EPC (default inlet configuration)
• Column: HP-5ms 30 m x 250 µm x 0.25 µm
• Sample: 5975 MSD Sample (P/N 05970-60045) or (P/N 5074-3025 Japan only)
• MSD Tuning Calibrator:
PFTBA (perfluorotributylamine)
1
Start Up the SystemStart up your system hardware and software for data acquisition.
2
Tune the MS
Determine whether the instrument is correctly tuned.
3
Create a Method for Qualitative AnalysisCreate a new qualitative analysis scan method from the system default method.
4
Run the Scan MethodRun the method created in Chapter 3 to acquire sample data.
5
Qualitative Data AnalysisUse the Enhanced Data Analysis program to analyze the data generated in Chapter 4.
6
Create a SIM Quantitation MethodCreate a SIM method from the scan method created in Chapter 3.
7
Run a SequenceCreate and run a sequence using the method created in Chapter 6.
mStation Familiarization Guide 3

8
4
Set Up a Quantitation Database
Set up a database with compounds and calibrators to identify unknown samples.
9
Generate a ReportGenerate a report automatically after a run or at a later point from previously acquired data.
10
Recalibrate and Quantitate UnknownsModify a sequence for recalibration and then use it to quantitate an unknown sample.
11
Create a Cool Down MethodCreate and store a maintenance method.
12
Shut Down the System13
Frequently Asked QuestionsAgilent G1701EA MSD Productivity ChemStation

Where to Find Information
Hardware
Agilent G1701EA MSD Productivity Che
In addition to this document, Agilent provides several learning products that document how to install, operate, maintain, and troubleshoot the 7890A GC/5975 MSD. This information can be found on the Agilent Technologies GC and GC/MS Hardware User Information and Utilities DVDs that ship with your instrument.
The Agilent Technologies GC and GC/MS Hardware User Information and Utilities DVDs that ship with your instrument provides an extensive collection of online help, videos, and books for current Agilent gas chromatographs, mass selective detectors, ion traps, and GC samplers. Included are localized versions of the information you need most, such as:
• Getting Familiar documentation
• Safety and Regulatory guides
• Site Preparation checklists
• Installation information
• Operating guides
• Maintenance information
• Troubleshooting details
Software
For an introduction to, and where to find more information on, the G1701EA MSD Productivity ChemStation see the Agilent G1701EA GC/MSD ChemStation Getting Started manual.
mStation Familiarization Guide 5

6
Agilent G1701EA MSD Productivity ChemStation

Contents
1 Start Up the System
Agilent G1701EA MSD Productivity Che
Start up the Hardware 12
Run the ChemStation Software 14
Select the Tune File 15
Load the Method 16
2 Tune the MS
Introduction 18
Run Autotune 19
Evaluate the Autotune Results 22
Tune History Trends 24
3 Create a Method for Qualitative Analysis
Introduction 26Edit the Entire Method 27
Check the GC configuration 29
Set the GC readiness state 32
Set the GC oven parameters 33
Set the GC column parameters 35
Set the GC inlet parameters 36
Set the GC injector parameters 38
Set the GC Aux heaters parameters 40
Set the GC signals parameters 40
Edit the GC real time plots to display 42
Edit the MS parameters 42
Save the method 46
General Information for Editing the GC Parameters 47
Open the GC edit parameters window 47
Add a column to ChemStation local inventory 48
Select and configure a column 51
Upload parameters from the 7890A GC 53
Customize the status panel view 53
mStation Familiarization Guide 7

4 Run the Scan Method
8
Prepare the Sample 56
Load the Method 57
Run the Method 58
Take a Snapshot 61
View the Logbook 62
5 Qualitative Data Analysis
Integrate Peaks 66
Edit the integration events 69
Save the integration events to the method 70
Manually integrate peaks 71
View the integration results in a table 72
Edit the Method to Generate a Report 74
Display Extracted Ion Chromatograms (EIC)s 76
Enable or Disable the Right Mouse Click Context Menu 78
Analyze Data 79
Subtract the baseline noise from the spectra 81
Select target and qualifier ions 82
Search the Spectral Library 83
Generate an automated library search report 84
Print a Window, TIC, Spectrum, or Method 86
Select a printer 86
Select an item to print 87
Save the Data Analysis Method 87
Exit the Data Analysis Program 88
6 Create a SIM Quantitation Method
Introduction 90
Create a SIM Method 91
Simultaneously Acquire Scan and SIM Data (SIM/Scan Mode) 96
SIM/Scan Mode Cycle Frequency 98
7 Run a Sequence
Prepare the Samples 100
Create the Sequence 101
Agilent G1701EA MSD Productivity ChemStation Familiarization Guide

Agilent G1701EA MSD Productivity Che
Save the Sequence 103
Load the Sequence 104
Run the Sequence 105
Print the Sequence Log 106
8 Set Up a Quantitation Database
Add Compound Entries for the Database 108
Identify compounds 112
Add the Calibration Curve 115
Add calibrator level 1 115
Add calibrator levels 5, 10, 25, and 50 to the calibration curve 117
Save the database 119
View or Edit an Existing Database 120
9 Generate a Report
Generate a Report Automatically After the Run 124
Load the method 124
Edit the method to generate a report 124
Run the method and generate the report 127
Generate a Detailed Report for Previously Acquired Data 129
Load the method 129
Load the data file 129
Generate a detailed quantitation report 129
10 Recalibrate and Quantitate Unknowns
Create a Recalibration Sequence 132
Save the Sequence 134
Run the Sequence 135
11 Create a Cool Down Method
Create the Cool Down Method 138
Use the Cool Down Method 139
12 Shut Down the System
Shut Down the MS 142
Shut Down the GC 143
13 Frequently Asked Questions
mStation Familiarization Guide 9

10
Agilent G1701EA MSD Productivity ChemStation Familiarization Guide

Agilent G1701EA MSD Productivity ChemStationFamiliarization Guide
1Start Up the System
Start up the Hardware 12
Run the ChemStation Software 14
Select the Tune File 15
Load the Method 16
In this chapter, the startup checklist is reviewed for instrument readiness. If necessary, changes are made to the instrument hardware configuration to handle the data acquisition of the samples that are run in this manual. With the instruments off and the G1701EA MSD Productivity ChemStation not running, the instruments are started and the MSD is pumped down. Finally, a method is loaded in preparation for bringing all instrument parameters to settings required for data acquisition.
11Agilent Technologies

1 Start Up the System
Start up the Hardware
12
1 Review the Agilent 7890A Gas Chromatograph Operating Guide (P/N G3430-90011) and the Agilent 5975 Series MSD Operation Manual (P/N G3170-90036) for important safety information and start up details before powering on your instruments.
2 Verify that the split/splitless (S/SL) inlet septum, liner, and O-ring are clean, properly installed, and in good condition.
3 Install a conditioned (HP-5ms 30 m x 250 µm x 0.25 µm) column in the GC. Attach the column inlet to the S/SL inlet and its outlet to the MSD transfer line. See the Agilent 5975 Series MSD Operation Manual for details.
4 Verify the EI ion source is installed.
5 Verify 99.9995% purity helium is attached to the carrier gas supply of the S/SL inlet.
6 Power on the 7890A GC.
7 From the GC keypad, turn off the oven, Aux 2 heated zone (GC/MSD transfer line), and inlet heater. If equipped, turn off any GC detectors.
8 Before you turn on or attempt to operate the MSD verify the following:
• The vent valve must be closed (the knob turned all the way clockwise).
• All other vacuum seals and fittings must be in place and fastened correctly.
• The front side plate screw should not be tightened.
• The MSD is connected to a grounded power source.
• The GC/MSD interface extends into the GC oven.
• A conditioned capillary column is installed in the GC inlet and in the GC/MSD interface.
• The GC is on, but the heated zones for the GC/MSD interface, the GC inlet, and the oven are off.
• Carrier gas of at least 99.9995% purity is plumbed to the GC with the recommended traps.
• The foreline pump exhaust is properly vented.
9 Open the MSD analyzer top cover.
10 Close the MSD vent valve.
11 Press the Power button on the front of the MSD to power it on. The foreline pump will make a gurgling noise.
Agilent G1701EA MSD Productivity ChemStation Familiarization Guide

Start Up the System 1
Agilent G1701EA MSD Productivity Che
Press lightly on the metal box mounted on the MSD side board until the air noise stops to ensure a correct seal.
12 Close the MSD analyzer top cover.
13 On the MSD local control panel:
a Press Menu repeatedly until Maintenance appears.
b Press Item repeatedly until Pumpdown appears.
c Press Yes/Select to start the pumpdown.
The pumpdown is completely automatic and does not require operator actions.
After the turbo pump starts and the ion gauge value reaches 100 mTorr, allow the MSD to operate for a minimum of 2 hours before acquiring sample data.
mStation Familiarization Guide 13

1 Start Up the System
Run the ChemStation Software
14
The GC and MSD must both be running before starting an online session of the ChemStation product. If reports are to be printed, a printer must be installed on the computer.
1 Power on the PC.
2 From the PC desktop, select the ChemStation Instrument Control shortcut icon, to display the Enhanced ChemStation Instrument Control window.
3 If the Actual MS temperatures have not reached their Setpoints, the MS Temperatures dialog box will appear. Enter new setpoints if needed and click OK. The screen will appear repeatedly until the temperatures are reached.
4 Set the default printer to PDF Printer, if a PDF writer like Adobe Acrobat is installed on the computer.
Agilent G1701EA MSD Productivity ChemStation Familiarization Guide

Start Up the System 1
Select the Tune File
Agilent G1701EA MSD Productivity Che
1 From the Enhanced ChemStation main control window, select View > Tune and Vacuum Control…. to display the Tune and Vacuum Control window.
2 Select File > Load Tune Parameters. The Select Tune File dialog box opens.
3 From the Files list, select atune.u. The atune.u file contains the optimal MSD parameter settings determined during the last autotune run.
4 Select OK. The atune.u tune file is loaded and the dialog box closes.
mStation Familiarization Guide 15

1 Start Up the System
Load the Method
16
1 Select View > Instrument Control to close the Tune and Vacuum Control…. and display the Enhanced ChemStation Instrument Control window.
2 Select the Load Method button, . The Load Method dialog box opens.
3 Navigate to and select default.m in the msdchem/1/methods directory.
4 Select OK.
Agilent G1701EA MSD Productivity ChemStation Familiarization Guide

Agilent G1701EA MSD Productivity ChemStationFamiliarization Guide
2Tune the MS
Introduction 18
Run Autotune 19
Evaluate the Autotune Results 22
Tune History Trends 24
This chapter provides a brief introduction to tuning and explains how to run an autotune on the instrument. An autotune report is generated as well as a report to evaluate the autotune results. This report is reviewed to see which items pass or fail the evaluation. Finally, we look at how we can graphically view the variation in tuned parameters that are plotted over a number of recent autotune runs.
17Agilent Technologies

2 Tune the MS
Introduction
18
Tuning is the process that adjusts the MS for good performance over the entire mass range. Using a known compound as a calibrator, the tune parameters are set to achieve sensitivity, resolution, and mass assignments for the known calibration ions.
Tuning is performed using either the autotune or manual tune features.
Manual tune allows you to adjust an MS tune parameter while viewing the results easily in profile scans and spectra.
Manual tuning is used:
• To achieve maximum sensitivity by sacrificing some resolution
• To tune specifically for the very low end of the mass range (< 150 amu)
• To tune with a compound other than the standard calibrator
To access manual tune parameters select Parameters > Manual Tune from the Tune and Vacuum Control window or select Instrument > Edit MS Tune Parameters from the Instrument Control window. Please see the ChemStation online help for details on using manual tune.
The autotune program described in this section adjusts the MS for good performance over the entire mass range and is recommended for most applications.
Agilent G1701EA MSD Productivity ChemStation Familiarization Guide

Tune the MS 2
Run Autotune
Agilent G1701EA MSD Productivity Che
1 From the Instrument Control window select Instrument > Tune MSD... to display the Select Tune Type dialog box.
2 Select Tune MSD and click OK to close the dialog box and start the autotune procedure.
The system uses the PFTBA (perfluorotributylamine) calibrator to tune the instrument. When the tune is complete, the mass 69, 219, and 502 profile scans are displayed with abundance and peak widths noted. See Figure 1. The tune report is also generated as shown in Figure 2 on page 21.
mStation Familiarization Guide 19

20
2 Tune the MS
Figure 1 Profile scan results for mass 69, 219, and 502
Agilent G1701EA MSD Productivity ChemStation Familiarization Guide

Tune the MS 2
Figure 2 Autotune report
Agilent G1701EA MSD Productivity ChemStation Familiarization Guide 21

2 Tune the MS
Evaluate the Autotune Results
22
1 Select View > Instrument Control.
2 Select Checkout > Evaluate Tune. The system compares your tune parameter results to preset acceptable results and displays the System Verification report. See Figure 3.
3 Review the report. Criteria marked as OK are functioning correctly. If all criteria are marked OK, Tune portion of System Verification passed is printed on the last line of the report. See Figure 3.
If one or more criteria do not pass verification, the incorrect behavior and suggested corrective actions are described. See Figure 4 on page 23 where the report shows a high ratio of mass 18 to 69. This report warns of a high amount of water in the system and a corrective action to be taken.
Figure 3 Passing system verification tune report
Agilent G1701EA MSD Productivity ChemStation Familiarization Guide

Tune the MS 2
Figure 4 Failing system verification tune report
Agilent G1701EA MSD Productivity ChemStation Familiarization Guide 23

2 Tune the MS
Tune History Trends
24
1 Select View > Instrument Control.
2 Select Checkout > View Previous Tunes... to display the Tuneplot window plotting the results of recent tune parameters.
Agilent G1701EA MSD Productivity ChemStation Familiarization Guide

Agilent G1701EA MSD Productivity ChemStationFamiliarization Guide
3Create a Method for Qualitative Analysis
Introduction 26
Edit the Entire Method 27
General Information for Editing the GC Parameters 47
This chapter describes how to create an acquisition method that will be used later to identify all compounds in an Agilent standard sample. The method is created by editing the default method to include an MS scan that is set to identify all ions created by EI of each compound.
25Agilent Technologies

3 Create a Method for Qualitative Analysis
Introduction
26
The method we are creating will be used to find the known compounds in the Agilent sample P/N 05970-60045 (P/N 5074-3025 Japan only). The sample compounds are in isooctane solvent in 1 mL ampules of 10 ng/µL, 100 ng/µL, and 100 pg/µL concentrations and are shown in Table 1.
The MS part of the method is required to scan for all ions contained in the range that includes all the molecular weights for these compounds. As seen in the table, the range of the molecular ions is from 0 to 270 so we will scan for ions from 0 to 300 in the method.
Table 1 Sample Compound list
Compound MW Formula
Dodecane 170 C12H26
Biphenyl 154 C12H10
4-Chlorobiphenyl (PN 05970-60045 only) 188 C12H9Cl
Methyl palmitate 270 C17H34O2
Agilent G1701EA MSD Productivity ChemStation Familiarization Guide

Create a Method for Qualitative Analysis 3
Edit the Entire Method
Agilent G1701EA MSD Productivity Che
1 With the default method loaded, see “Load the Method” on
page 16, select the Edit Entire Method… button, to edit the currently loaded method. The Edit Method dialog box opens.
2 Mark the Method Information and Instrument/Acquisition checkboxes only. Clear the Data Analysis checkbox.
Selecting Instrument/Acquisition displays all the dialog boxes required to edit the acquisition parameters for both the GC and MS parts of the currently loaded method. We are not modifying the Data Analysis part of the method at this time.
3 Select OK to close the Edit Method dialog box. Because Method Information was selected, the Method Information dialog box opens.
mStation Familiarization Guide 27

28
3 Create a Method for Qualitative Analysis
4 In the Method Comments field, enter a description of this method.
5 Mark the Save Copy of Method With Data checkbox. When the ChemStation acquires sample data using this method, it automatically saves a copy of the method along with the data.
6 In the Method Sections To Run area, mark the Data Acquisition checkbox only. The data analysis will not be run at this time.
7 Select OK to close the Method Information dialog box and display the Inlet and Injection Parameters dialog box.
8 From the Sample Inlet dropdown list, select GC.
9 From the Injection Source dropdown list, select your source.
• If you are injecting from the GC using the Automatic Liquid Sampler (ALS), select GC ALS.
• If you are manually injecting or using another injection source, select Manual.
10 Mark the Use MS checkbox to allow the ChemStation to turn on the MS analyzer and save the MS sample data acquired during the run. You would only uncheck this box when you have a GC (non-MS) detector and you were acquiring data for the GC detector only.
11 In the Inlet Location area, select the location where your S/SL inlet is attached to the MS through the column.
12 In the MS Connected to area, select the location where your S/SL inlet is attached to the MS through the column.
13 Select OK to close the Inlet and Injection Parameters dialog box and display the GC Edit Parameters window.
Agilent G1701EA MSD Productivity ChemStation Familiarization Guide

Create a Method for Qualitative Analysis 3
Check the GC configuration
Agilent G1701EA MSD Productivity Che
1 Select the Configuration button, . See the ChemStation Online Help for more information.
2 With the Miscellaneous tab selected, set the Pressure Units to psi. Under Valve Configuration set all Valve Type fields to Not Installed, and verify that the MSD transfer line is shown as a Thermal Aux Type.
Figure 5 Miscellaneous configuration tabmStation Familiarization Guide 29

30
3 Create a Method for Qualitative Analysis
3 Select the Columns tab to display the columns configuration parameters. The HP-5ms checkout column supplied with the MS should be listed under Column.
Figure 6 Column configuration tab
4 If a different Column is configured to the inlet location you are using or is attached to the MS, select it and click Remove.
5 If the HP-5ms is not listed under Column, click the Inventory button and add it to inventory before listing it here. See “Add a column to ChemStation local inventory” on page 48.
6 If required, use the up and down arrow keys to put the HP-5ms column in the 1 position.
7 For the Inlet pressure for this column, select the Front or Back Inlet from the dropdown.
8 For the column Outlet pressure select Vacuum for the MS
9 For the column Heated By select Oven from the dropdown.
Agilent G1701EA MSD Productivity ChemStation Familiarization Guide

Create a Method for Qualitative Analysis 3
Agilent G1701EA MSD Productivity Che
10 Click the Apply button and then select the Modules tab.
Figure 7 Modules configuration tab
11 Select He gas from the dropdown for the inlet connected to column 1. The system uses the properties of helium to obtain an accurate flow and pressure relationship for the column.
12 Click the Apply button to download any edits to the GC.
mStation Familiarization Guide 31

3 Create a Method for Qualitative Analysis
Set the GC readiness state
32
1 Select the Readiness button, . The Readiness parameters are displayed.
Figure 8 Readiness state component selection
2 Select the Oven, SS Inlet (attached to column 1), and Thermal Aux 2 (MSD Transfer Line). These selections require the GC to wait until all setpoints related to the oven, inlet, and transfer line are held at a steady value before allowing a run to begin.
3 Click Apply to download these selections to the GC.
Agilent G1701EA MSD Productivity ChemStation Familiarization Guide

Create a Method for Qualitative Analysis 3
Set the GC oven parameters
Agilent G1701EA MSD Productivity Che
1 Select the Oven button, . The Oven parameters are displayed.
For this example we require an oven program that initially holds the column temperature at 50 °C. When the run starts, the column temperature is increased from this temperature to 300 °C at a rate of 35 °C/min. The column is then held at 300 °C for an additional 2 minutes. At this time the oven is cooled down to 50 °C to await the next data acquisition run.
Figure 9 GC oven parameters
mStation Familiarization Guide 33

34
3 Create a Method for Qualitative Analysis
2 Mark the Oven Temp On checkbox and enter 50 °C in the corresponding field.
3 In the Equilibration Time field, enter 0.5 min.
4 In the Maximum Oven Temperature field, enter 325 °C. This is the maximum temperature for the HP-5ms column.
5 Clear the Override Column Max. 325 °C checkbox.
6 In the Oven Ramp table, enter the settings shown in Table 2.
7 In the Post Run field, enter 300 °C.
8 In the Post Run Time field, enter 2 min to hold the 300 °C oven temperature for 2 minutes after the run is finished before cooling down to 50 °C for the start of the next run.
9 Select Apply to download these settings to the GC.
Table 2 Oven ramp settings
Oven Ramp Rate Value Hold Time
°C/min °C min
(Initial) 50 0
Ramp 1 35.00 300 0
Agilent G1701EA MSD Productivity ChemStation Familiarization Guide

Create a Method for Qualitative Analysis 3
Set the GC column parameters
Agilent G1701EA MSD Productivity Che
1 Select the Columns button, . The Column parameters are displayed.
2 Check the Column information in the Selection list.
• Column: 19091S-433 (HP-5ms 30 m x 250 µm x 0.25 µm)
• In: front or back (split/splitless inlet position)
• Out: Vacuum
3 Mark the Control Mode checkbox.
4 In the Flow Setpoint field, enter 1.0 mL/min. The Pressure, Average Velocity, and Holdup Time Setpoints will be calculated and displayed in the corresponding fields.
5 In the dropdown list, select Constant Flow.
6 In the Post Run field, enter 1.0 mL/min.
7 Select Apply to download these settings to the GC.
Figure 10 GC columns parameters
mStation Familiarization Guide 35

3 Create a Method for Qualitative Analysis
Set the GC inlet parameters
36
1 Select the Inlets button, . The Inlet parameters are displayed.
2 Select the Front or Back tab, depending on your hardware configuration.
3 Mark the Heater checkbox and enter 250 °C in the corresponding Setpoint field.
4 Mark the Pressure checkbox. The psi in the corresponding Setpoint field is automatically set when the column flow rate is set.
5 Mark the Septum Purge Flow checkbox and enter 3 mL/min in the corresponding Setpoint field.
6 From the Septum Purge Flow Mode drop down list, select Standard.
7 In the Gas Saver area:
a Mark the On checkbox.
b In the field below, enter 20 mL/min.
c In the After field, enter 2 min.
8 In the Mode area:
a From the Mode drop down list, select Splitless.
9 In the Purge Flow to Split vent area:
a In the field, enter 50 mL/min.
b In the Start Time field, enter 1.
10 Select Apply.
Agilent G1701EA MSD Productivity ChemStation Familiarization Guide

Create a Method for Qualitative Analysis 3
Agilent G1701EA MSD Productivity Che
Figure 11 GC inlet parameters
mStation Familiarization Guide 37

3 Create a Method for Qualitative Analysis
Set the GC injector parameters
38
If you are not using the autosampler, skip this section.
1 Select the ALS button, .
2 Select the Front Injector or Back Injector tab, depending on your hardware configuration.
3 In the Injection area:
a Verify that the Syringe Size matches your hardware configuration.
b In the Injection Volume field, enter 1.
4 In the Washes and Pumps area:
a For Solvent A Washes, enter 5 in the PostInj field.
b For Sample Washes, enter 3 in the PreInj field.
c For Sample Pumps, enter 5 in the PreInj field.
5 Select the Advanced button, . Additional options are displayed in the window.
6 In the Plunger Speed area, select Fast.
7 In the Sampling Depth area,
a Mark the Enable checkbox.
b In the field, enter 3.6.
8 Select Apply.
Agilent G1701EA MSD Productivity ChemStation Familiarization Guide

Create a Method for Qualitative Analysis 3
Agilent G1701EA MSD Productivity Che
Figure 12 ALS parameters
mStation Familiarization Guide 39

3 Create a Method for Qualitative Analysis
Set the GC Aux heaters parameters
40
1 Select the AUX Heaters button, .
2 For Thermal Aux 2, mark the On checkbox.
3 In the Ramps table, enter 280 in the Value °C field.
4 Select Apply.
Set the GC signals parameters
Figure 13 GC aux heaters parameters
1 Select the Signals button, .
2 In the Signal Source dropdown list, select None for all the signal sources.
Agilent G1701EA MSD Productivity ChemStation Familiarization Guide

Create a Method for Qualitative Analysis 3
Agilent G1701EA MSD Productivity Che
Figure 14 GC signals parameters
3 Select OK to download the selected parameters to the GC and close the GC Edit parameters window. The GC Detector Data dialog box opens. See Figure 15 on page 42.
mStation Familiarization Guide 41

3 Create a Method for Qualitative Analysis
Edit the GC real time plots to display
42
4 From the GC Detector Data dialog box, clear the checkboxes for all signals. We will not be plotting GC signals.
5 Select OK to save the settings and close the dialog box. The MS Tune File dialog box opens. See Figure 16.
Figure 15 Selecting GC signals to plot in real time
Edit the MS parameters
1 Select atune.u from the File list.
2 Select OK to assign the tune file to the current method and close the MS Tune File dialog box. The MS SIM/Scan Parameters dialog box opens.
3 In the MS Instrument area enter:
a In the Solvent Delay field, enter 3.00 min.
b In the EMV mode drop down list, select Gain Factor.
c In the Gain Factor field, enter 1.00.
Figure 16 Selecting the method MS tune parameter file
Agilent G1701EA MSD Productivity ChemStation Familiarization Guide

Create a Method for Qualitative Analysis 3
Agilent G1701EA MSD Productivity Che
d In the Acq. mode drop down list, select Scan.
e In the Scan Speed drop down list, select Normal.
f Clear the Acquire both Scan and SIM data checkbox.
4 In the Real-Time Plot area Time Window field, enter 10.
5 In the MS Window 1 area:
a From the Plot Type dropdown, select Total.
b In the Y-Scale fields, enter 0 to 2000000.
6 In the MS Window 2 area:
a From the Plot Type dropdown, select Spectrum.
b In the Y-Scale fields, enter 0 to 1000000.
Figure 17 Setting the MS scan parameters7 Select Scan Parameters. The Edit Scan Parameters dialog box opens.
8 Select the Scanning Mass Range tab:
a Mark the Scan Group 1 checkbox.
b In the Start at Mass field, enter 50.00.
c In the End at Mass field, enter 300.00.
This scan range includes all the expected ions.
mStation Familiarization Guide 43

44
3 Create a Method for Qualitative Analysis
Figure 18 Specify the scan range
9 Select the Threshold and Sampling Rates tab:
a In the Threshold field, enter 40.
b In the Sampling Rate field, enter 3.
Agilent G1701EA MSD Productivity ChemStation Familiarization Guide

Create a Method for Qualitative Analysis 3
Agilent G1701EA MSD Productivity Che
Figure 19 Setting the sampling rate and threshold filter
10 Select the Plotting tab, In the Plot Window #2 area:
a Under Low Mass, enter 50.
b Under High Mass, enter 350.
Plot Window #1 was set to be a TIC so no plotting entry is required. Plot Window #2 is a spectrum including all ions found between 50 and 350 m/z.
mStation Familiarization Guide 45

46
3 Create a Method for Qualitative Analysis
Figure 20 Specifying the real time plot scan range
11 Select Close to save the settings and return to the MS SIM/Scan Parameters dialog box.
12 Select OK to save the parameters and close the dialog box. The Save Method As dialog box opens. See Figure 21.
Save the method
1 Enter demoscan.M in the Method File field.
2 Select OK to save the current ChemStation method as demoscan.m method.
Figure 21 Saving the method
Agilent G1701EA MSD Productivity ChemStation Familiarization Guide

Create a Method for Qualitative Analysis 3
General Information for Editing the GC Parameters
Open the GC edit parameters window
Agilent G1701EA MSD Productivity Che
1 From Instrument Control select the GC Parameters button to display the GC Edit Parameters window. See Figure 9 on page 33.
2 When a parameter button at the top of the screen is selected, the button is highlighted in blue and the settings for that parameter are displayed in the right panel. The GC instrument status is shown in the left panel.
Table 3 lists a description of the GC Edit Parameters window buttons.
Table 3 GC Edit Parameters window buttons
Button Action
Apply Downloads any settings that have been changed to the GC.
OK Downloads any settings that have been changed to the GC and
closes the GC Edit Parameters window.
Cancel Discards any settings that have been changed and closes the GC Edit Parameters window.
Help Displays help topics for the current parameter.
mStation Familiarization Guide 47

3 Create a Method for Qualitative Analysis
Add a column to ChemStation local inventory
48
Use the Add Column to Local Inventory dialog box to select a column from the Column Catalog and add it to your Local Column Inventory. This example adds the supplied checkout column to local inventory.
1 Select the Configuration icon to display the columns configured for the instrument.
Figure 22 Columns configured for the instrument
Agilent G1701EA MSD Productivity ChemStation Familiarization Guide

Create a Method for Qualitative Analysis 3
Agilent G1701EA MSD Productivity Che
2 Click Inventory to display the Install Column 1 dialog box containing a list of columns in local inventory.
Figure 23 The local inventory of columns
mStation Familiarization Guide 49

50
3 Create a Method for Qualitative Analysis
3 Click Add Column to Local Inventory to display the Add Column to Local Inventory dialog box.
Figure 24 The catalog of columns
4 Scroll down the list of columns to model number 19091J-433 and enter hp5ms433 as the New Inventory#.
5 Click Add Selected Column to Inventory to display the Install Column 1 dialog box with the selected column now added to the local inventory list. .
Figure 25 Local inventory with the added column
Columns added to local inventory can be quickly added and configured for the instrument. See “Select and configure a column” on page 51.
Agilent G1701EA MSD Productivity ChemStation Familiarization Guide

Create a Method for Qualitative Analysis 3
Select and configure a column
Agilent G1701EA MSD Productivity Che
This example selects a column previously added to local column inventory and configures it as column number 1. See “Add a column to ChemStation local inventory” on page 48.
1 Select the Configuration icon and click on the Column description for column 1 to select it. The column number selected here will be replaced with the column we are adding.
Figure 26 Columns configured for the instrument2 Click Inventory to display the Install Column 1 dialog box containing a list of columns in local inventory.
Figure 27 The local inventory of columns
mStation Familiarization Guide 51

52
3 Create a Method for Qualitative Analysis
3 Select a column from the local inventory list and click Install Selected Column to display the Configuration panel for Edit GC Parameters with the selected column replacing the previously configured column 1 for the instrument.
Figure 28 Columns configured for the instrument
4 Under the Inlet heading dropdown, select the item the column inlet is attached to.
5 Under the Outlet heading dropdown, select the item the column outlet is attached to. For an MS select Vacuum.
6 Under the Heated By heading dropdown, select the method for controlling the column temperature.
Agilent G1701EA MSD Productivity ChemStation Familiarization Guide

Create a Method for Qualitative Analysis 3
Upload parameters from the 7890A GC
Agilent G1701EA MSD Productivity Che
1 On the Instrument > GC Edit Parameters screen, right-click in the blank area.
2 From the shortcut menu, select Upload Method from GC.
Customize the status panel view
1 In the status panel, select the Setup Actuals button, the Status Items dialog box opens.
2 Mark the checkboxes of the items in the Status Item list that you want to have displayed in the status panel.
3 To move an item up or down in the displayed list, select the item and then the up or down arrow buttons until it is in the desired position.
4 Select Save to save the settings and return to the GC Edit Parameters window.
mStation Familiarization Guide 53

54
3 Create a Method for Qualitative Analysis
Agilent G1701EA MSD Productivity ChemStation Familiarization Guide

Agilent G1701EA MSD Productivity ChemStationFamiliarization Guide
4Run the Scan Method
Prepare the Sample 56
Load the Method 57
Run the Method 58
Take a Snapshot 61
View the Logbook 62
In this chapter, a sample is prepared for data acquisition and the ALS is loaded with the sample, the solvent wash vial, and a solvent waste vial. The single sample is run and during the data acquisition a snapshot is taken to demonstrate how it is possible to look at partial analysis results before a run is completed. Finally, the logbook showing actions taken during the run is reviewed.
55Agilent Technologies

4 Run the Scan Method
Prepare the Sample
56
1 Fill a sample vial with the contents of the 10 ng/mL 5975 MSD Sample (P/N 05970-60045 or P/N 5074-3025 Japan only) and cap the vial.
If you are not using an ALS skip the remaining steps.
2 Place the sample vial into position 1 of the GC sample tray.
3 Fill a solvent wash vial with isooctane and place it in injector turret location A for solvent wash mode A, B.
4 Place a waste vial in turret location B specified for solvent wash mode A, B.
Agilent G1701EA MSD Productivity ChemStation Familiarization Guide

Run the Scan Method 4
Load the Method
Agilent G1701EA MSD Productivity Che
1 From the PC desktop, select the ChemStation shortcut icon, the Instrument Control window opens.
2 Select the Load Method button, to open the LoadMethod window. Navigate to and select demoscan.M.
3 Select OK to load the method and close the dialog box.
mStation Familiarization Guide 57

4 Run the Scan Method
Run the Method
58
1 Select the Run Method button, . The Start Run dialog box opens with the GC ALS, Inlet Location, and MS Connected to selections pre-populated.
Figure 29 Start a single sample run
2 In the Operator Name field, enter your name.
Agilent G1701EA MSD Productivity ChemStation Familiarization Guide

Run the Scan Method 4
Agilent G1701EA MSD Productivity Che
3 In the Front Inlet area:
a In the Data File Name field, enter EVALSCAN_1.
b In the Sample Name field, enter a name for your sample (optional).
c In the Misc Info field, enter a description of your scan (optional).
d In the Expected Barcode field, enter a barcode (optional).
e In the Vial Number field, enter 1.
4 In the Method Selections to Run area:
a Mark the Data Acquisition check box.
b Clear the Data Analysis check box.
5 When the instrument is in a ready state as shown by a green Idle indicator in the upper left hand corner, select OK and Run Method to close the dialog box and start the run. The ready state indicator changes to Run. See Figure 30 on page 60.
If the instrument was not in a ready state, the system will prompt for you to override. When the status is Ready, the dialog box will close automatically.
During the solvent delay the system will prompt for you to override. When the time is up, the dialog box will close automatically.
6 Observe the TIC real time plot and go to “Take a Snapshot” on page 61 after the second compound elutes.
mStation Familiarization Guide 59

4 Run the Scan Method
Figure 30 Instrument control window during single sample run
60 Agilent G1701EA MSD Productivity ChemStation Familiarization Guide

Run the Scan Method 4
Take a Snapshot
Agilent G1701EA MSD Productivity Che
Snapshot is useful when a compound of interest elutes early during a long run and you want to analyze that compound immediately. The system creates a snapshot data file with data that has been acquired up to the time the Snapshot is taken.
1 During the run select View > Data Analysis to open the data analysis view.
2 Select File > Take Snapshot. The data analysis windows opens displaying the TIC obtained for the run up to this point in time.
Figure 31 The TIC of the snapshot data file
Observe the location of the snapshot data file in the navigation pane. It is placed in the data directory specified for the run under the snapshot subdirectory and given the same name as the data file specified for the sample.
3 Analyze the compound of interest.
4 Exit data analysis and return to the Instrument Control view.
mStation Familiarization Guide 61

4 Run the Scan Method
View the Logbook
62
The system keeps a logbook named MSLOGBK.LOG that records all instrument error and status messages prior to and during acquisition.
The Current Logbook lets you review instrument diagnostic information and any mass spec malfunctions recorded during the current and previous acquisitions. It is located in the instrument directory.
1 Select the Logbook button, . The Logbook menu opens.
2 Select Current Logbook to display the active log.
Figure 32 The current logbook is open
Agilent G1701EA MSD Productivity ChemStation Familiarization Guide

Run the Scan Method 4
Agilent G1701EA MSD Productivity Che
3 With the logbook open, select the Logbook button again and then from the menu select:
• Open Logbook to select a a logbook to open from a list of all logbooks in the instrument directory.
• Clear Logbook to delete the currently displayed logbook.
• Save As Logbook to save the displayed logbook into a new file.
• Print Logbook to print the displayed logbook.
4 Exit the Instrument Control program.
mStation Familiarization Guide 63

64
4 Run the Scan Method
Agilent G1701EA MSD Productivity ChemStation Familiarization Guide

Agilent G1701EA MSD Productivity ChemStationFamiliarization Guide
5Qualitative Data Analysis
Integrate Peaks 66
Edit the Method to Generate a Report 74
Display Extracted Ion Chromatograms (EIC)s 76
Enable or Disable the Right Mouse Click Context Menu 78
Analyze Data 79
Search the Spectral Library 83
Print a Window, TIC, Spectrum, or Method 86
Save the Data Analysis Method 87
Exit the Data Analysis Program 88
Qualitative data analysis identifies the compounds in your sample by:
• Integrating the peaks in your acquisition scan data
• Identifying the ions in the spectra from those peaks
• Comparing the ions from the peaks it found to ions in a library of known compounds, stored on your system
• Reporting the identity of the compound(s) found for each peak
This chapter reviews each of these processes.
65Agilent Technologies

5 Qualitative Data Analysis
Integrate Peaks
66
Integration is a tool for finding the peaks in a chromatogram and determining their size. In qualitative analysis integration is required for producing a percent report, doing a library search on integrated peaks, and producing a library search report.
1 Start the data analysis program using the desktop Data Analysis icon, .
Figure 33 The initial data analysis window
2 Select the Load Data File button, . The Select Data File dialog box is displayed.
Agilent G1701EA MSD Productivity ChemStation Familiarization Guide

Qualitative Data Analysis 5
Agilent G1701EA MSD Productivity Che
3 Select Change Path. The Browse for Folder dialog box opens.
4 Navigate to evaldemo.d. This is the data file from the scan analysis of our sample.
5 Select OK.
mStation Familiarization Guide 67

68
5 Qualitative Data Analysis
6 In the Select Data File dialog box, select OK. The data file is loaded and the total ion chromatogram (TIC) is displayed.
Agilent G1701EA MSD Productivity ChemStation Familiarization Guide

Qualitative Data Analysis 5
Edit the integration events
Agilent G1701EA MSD Productivity Che
When the data analysis part of your method is run, the chromatogram is integrated using autointegrate. Most of the chromatogram can be successfully integrated by using the ChemStation default auto integration parameters. However, you can customize the auto integration parameters and add integration events for your specific chromatograms. These events are saved and used when your method is run.
1 Select the Integration Parameters button, . The Edit Integration Events dialog box opens.
This example assumes the ChemStation Integrator is the specified integrator
2 To change Initial Area Reject, Initial Peak Width, or Initial Threshold:
a Select the parameter you wish to change in the Integrator Event Name list. The parameter is displayed in the Event field and the current value is displayed in the Value field.
b Enter the custom value in the Value field.
c Select Enter. The custom value is now listed in the Value list.
3 To change Shoulder Detection:
a Select Shoulder Detection in the Integrator Event Name list. The parameter is displayed in the Event field and the current setting is displayed in the Value field.
b Select the Value field. An Edit Integration Events confirmation message appears.
c Select Yes to change the setting.
mStation Familiarization Guide 69

70
5 Qualitative Data Analysis
4 To add integration events:
a From the Possible Events drop down list, select the event to add to your integration.
b Enter the required information in the Value or Time fields.
c Select Enter. The event and value or time is now listed in the Integrator Event Name, Value, Time list.
5 Select Apply to view the results in the TIC window.
6 Select Save to save the auto integration parameters. The Save Events dialog box opens.
7 Enter a file name.
8 Select OK to close the Edit Integration Events dialog box. The results are displayed in the TIC window.
Save the integration events to the method
1 Select the AutoIntegrate button, . The integration results appear in the TIC window (Figure 34) and a confirmation message appears.
2 Select Yes to save the integration or No to continue without saving this integration to the method.
If you selected Yes, a confirmation message appears displaying the saved auto integration parameter file name. Select OK to save the integration to the method.
Agilent G1701EA MSD Productivity ChemStation Familiarization Guide

Qualitative Data Analysis 5
Agilent G1701EA MSD Productivity Che
Manually integrate peaks
Figure 34 Integrated chromatogram
1 If required, “Edit the integration events” or load a saved integration events file.
2 Select Tools > Options to display the Select DA Options dialog box.
mStation Familiarization Guide 71

72
5 Qualitative Data Analysis
3 Select Manual Integration to turn it on and click OK. The mouse cursor changes to a crosshair in the TIC window.
4 Right-click the TIC to display a context menu. Select Enable standard Data Analysis mouse actions from the menu.
5 Click and drag the left mouse button to zoom in on the peak of interest in the chromatogram.
6 Click and drag the right mouse button to draw an integration baseline on the peak. When you release the button, the peak will be integrated, using the integrator you have selected.
If you want to delete an integrated peak, put the cursor on it and double-click the right mouse button.
View the integration results in a table
1 Select Chromatogram > Integrate Results…. The Tabulate window opens and lists the results.
Agilent G1701EA MSD Productivity ChemStation Familiarization Guide

Qualitative Data Analysis 5
Agilent G1701EA MSD Productivity Che
2 To print the integration table, select Print and navigate to your printer.
3 To copy the table to your clipboard for use in another application, such as MS Excel, select Copy.
4 Select Close to close the dialog box.
mStation Familiarization Guide 73

5 Qualitative Data Analysis
Edit the Method to Generate a Report
74
1 Select Method > Edit Method. The Select Reports dialog box opens.
2 Check Percent Report and OK. Other report types can also be selected.
The Percent Report Options dialog box opens.
3 In the Destination pane, check where you want the report to be generated.
4 Select OK. A confirmation message appears.
Agilent G1701EA MSD Productivity ChemStation Familiarization Guide

Qualitative Data Analysis 5
Agilent G1701EA MSD Productivity Che
5 Select Yes. The Save Method As dialog box opens.
6 Select OK to save the setting to the current method.
7 To interactively generate a report, select Chromatography > Percent Report. The report is displayed in a new window.
mStation Familiarization Guide 75

5 Qualitative Data Analysis
Display Extracted Ion Chromatograms (EIC)s
76
1 Select the Ion Chromatograms button . The Extracted Ion Chromatograms dialog box opens.
2 In the Time Range fields, enter the range you wish to extract. The complete time range of the data file is initially displayed. You can specify a shorter time range by entering the appropriate starting and ending values.
3 In the Ions area, enter the ion masses of interest. You can specify up to six ions.
4 In the Use m/z range from fields, enter the range of interest. The default m/z range for each ion is -0.3 to +0.7 of the ion mass specified. You can change the range by entering the appropriate starting and ending values.
5 Select OK. A window opens displaying a chromatogram for each ion.
Agilent G1701EA MSD Productivity ChemStation Familiarization Guide

Qualitative Data Analysis 5
Agilent G1701EA MSD Productivity Che
6 Select the Merged Format button to toggle from a chromatogram that displays the ions separately to one that displays the ions superimposed.
mStation Familiarization Guide 77

5 Qualitative Data Analysis
Enable or Disable the Right Mouse Click Context Menu
78
A right mouse click context menu can be enabled to allow you easy access to common data analysis tasks directly from a chromatogram or spectrum window rather than from using the main menu or toolbar buttons.
Selecting the Switch Data Analysis Mouse Actions button from the toolbar toggles between enabling and disabling the context menu. When the enhanced data analysis context menu is enabled, the standard right button mouse actions are disabled. The enabled context menu is shown in Figure 35.
Figure 35 Right mouse click context menu
Certain mouse actions like averaging peak spectra and manually editing the baseline of a peak require the standard mouse actions.
Agilent G1701EA MSD Productivity ChemStation Familiarization Guide

Qualitative Data Analysis 5
Analyze Data
Agilent G1701EA MSD Productivity Che
To perform these actions you must be using the standard mouse actions. See the preceding topic for details.
1 Enlarge the first peak using a left mouse click and drag to create a rectangle around the peak. The chromatogram is enlarged for the selected area. This is the peak for the compound Dodecane.
Figure 36 The enlarged peak
mStation Familiarization Guide 79

80
5 Qualitative Data Analysis
2 Enable the stack window:
a From the main menu, select Tools > Options.
b In the Select DA Options dialog box, check Stack and OK. The Data Analysis Variable Watch window opens.
3 Position the cursor at the highest point of the first peak and double right mouse click to display the spectrum.
You must be using the standard mouse actions.
Figure 37 The spectrum at the peak apex
The Data Analysis Variable Watch Window now shows the peak spectrum in the X register.
Agilent G1701EA MSD Productivity ChemStation Familiarization Guide

Qualitative Data Analysis 5
Subtract the baseline noise from the spectra
Agilent G1701EA MSD Productivity Che
Use spectral subtraction to improve the quality of your spectra by subtracting the baseline signal (noise) from peaks of interest.
1 With the peak apex stored in the Stack X register, position the cursor on the peak at its baseline and double right mouse click. The spectrum is displayed and placed in the X register in the Data Analysis Variable Watch window. The previous spectrum (peak apex) in the X register is moved to the Y register.
2 Select the Subtract button, . The difference (Y - X) will be displayed as a spectrum labeled with a [-] following its title. See Figure 38.
Figure 38 Subtracted spectrum for Dodecane
mStation Familiarization Guide 81

5 Qualitative Data Analysis
Select target and qualifier ions
82
Target ion
One target ion must be selected for each compound to be quantified (target compound). Ideally, the target ion is characteristic of the target compound and distinguishes it from other compounds with similar retention times.
Qualifier ions
Qualifier ions are secondary characteristic ions present in the mass spectrum of the target compound. The presence and correct amounts relative to the target ion of these ions support the identification of the correct target compound
Selection of peak and qualifier ions for Dodecane
Examination of the spectrum for Dodecane in Figure 38 on page 81 shows that Dodecane (mw = 170) molecular ion of 170 is present and will be used as the target ion. The 85 ion at half the mw of Dodecane is also significant and will be used as the qualifier ion.
Selection of peak and qualifier ions for the other compounds
Repeat the procedures under “Analyze Data” on page 79 selecting the other compound peaks in our sample and determining the target and qualifier ions for these compounds. Suggested selections are shown in Table 4 and will be used to set up a SIM acquisition and quantitative analysis later.
Table 4 Target and qualifier ion selections
Compound Target Ion Qualifier Ion Dwell time
Biphenyl 154 153 60
Dodecane 170 85 60
Chlorobiphenyl 188 152 60
Methyl Palmitate 270 87 60
Agilent G1701EA MSD Productivity ChemStation Familiarization Guide

Qualitative Data Analysis 5
Search the Spectral Library
Agilent G1701EA MSD Productivity Che
A library search compares the spectrum of an unknown compound against a library of reference spectra. The search identifies those spectra from the reference library that are most similar to the spectrum of the unknown compound.
You can do a search on an individual peak (spectrum) or on all integrated peaks in the TIC.
Search for an individual spectrum
1 Select a spectrum to search (X in Data Analysis Variable Watch window). See Figure 38 on page 81.
2 Select the Select Library button, . The Library Search Parameters dialog box opens.
3 Select Browse to open the Browse for Folder window. Navigate to the demonstration library demo.l and select it.
mStation Familiarization Guide 83

84
5 Qualitative Data Analysis
4 Select OK. The file path is entered and this library will be searched first. Use positions 2 and 3 to add any additional libraries you have purchased and installed.
5 Select OK to save selections.
6 Double right-click on the spectrum. A search is performed and the results are displayed.
Generate an automated library search report
1 Open the data file.
2 Select the Library Search Report button, . The Library Search Report Options dialog box opens.
Agilent G1701EA MSD Productivity ChemStation Familiarization Guide

Qualitative Data Analysis 5
Agilent G1701EA MSD Productivity Che
3 From the Style drop down list select Summary.
4 In the destination area, check Printer.
5 From the Spectrum to Use drop down menu, select Apex- Start of Peak. This selection automatically subtracts the spectrum at the start of the peak from the spectrum at the peak apex which you performed manually in the previous section “Subtract the baseline noise from the spectra” on page 81.
6 Select OK to generate the report.
mStation Familiarization Guide 85

86
5 Qualitative Data Analysis
Print a Window, TIC, Spectrum, or Method
Figure 39 The library search report
Once you set your printer you can print a window, scan, spectrum, or method for the data file you are viewing on the screen.
Select a printer
1 Select File > Select Printer.
2 Select printer from the list of printers on your system.
3 Select OK.
To change the page orientation
1 Select File > Printer Setup.
2 Select Orientation.
3 Select OK.
Agilent G1701EA MSD Productivity ChemStation Familiarization Guide

Qualitative Data Analysis 5
Select an item to print
Agilent G1701EA MSD Productivity Che
1 Select File > Print. The Print dialog box is displayed.
2 Select:
• Selected Window to print an open window and enter the window number from the window header in the Input dialog box.
• TIC & Spectrum to print these graphs.
• Method to print the method parameters.
• Select Printer to select a printer from the list of printers on your system.
3 Select OK to print your selection.
Save the Data Analysis Method1 Select the Save Method button, . The Save Method As dialog box opens.
2 Enter a name for the method and select OK to save the updated parameters to this method.
mStation Familiarization Guide 87

5 Qualitative Data Analysis
Exit the Data Analysis Program
88
1 Select File > Exit. A warning message appears.
2 Select Yes to close the program.
If you have not saved your method, you will lose changes if you click Yes to exit now.
Agilent G1701EA MSD Productivity ChemStation Familiarization Guide

Agilent G1701EA MSD Productivity ChemStationFamiliarization Guide
6Create a SIM Quantitation Method
Introduction 90
Create a SIM Method 91
Simultaneously Acquire Scan and SIM Data (SIM/Scan Mode) 96
SIM/Scan Mode Cycle Frequency 98
This chapter describes how to create a SIM method for our standard sample using the target and qualifier ions found during qualitative analysis. We also examine how to set up a method that performs simultaneous SIM and scan data acquisition.
89Agilent Technologies

6 Create a SIM Quantitation Method
Introduction
90
Selected ion monitoring (SIM) mode is a data acquisition technique where only selected ion fragments are monitored in order to obtain maximum sensitivity.
To find appropriate conditions for the SIM data acquisition, analyze your scan data for:
• Ions (m/z) monitored for each peak - MS SIM parameters allow you to define up to 100 groups of up to 60 ions each for selected ion monitoring, however, Agilent recommends you use as few ions as possible to maximize the signal to noise ratio.
• The best time to switch groups - Agilent recommends that you choose a time to switch groups where the peaks are well separated to avoid variations in retention time due to sample matrix effects.
Agilent G1701EA MSD Productivity ChemStation Familiarization Guide

Create a SIM Quantitation Method 6
Create a SIM Method
Agilent G1701EA MSD Productivity Che
1 From the Instrument View, select the Load Method button, the Load Method dialog box opens.
2 Navigate to and select evalscan.M.
Since the GC acquisition parameters in this method were set for good chromatographic data resolution, use this method as a starting point and only change the MS parameters in the method.
3 Select OK to load the method and close the dialog box.
4 Select the MS Parameters button, . The MS SIM / Scan Parameters dialog box opens.
mStation Familiarization Guide 91

92
6 Create a SIM Quantitation Method
5 From the Acq. Mode dropdown box, select SIM.
6 Select SIM Parameters. The Edit SIM Parameters dialog box opens. See Figure 40.
7 In the Group field, enter 1. Group 1 appears in the right panel table.
8 For Resolution, select High.
9 In the Edit Ion area enter the values for all 4 ions in the group 1 ions time segment.
a In the m/z and Dwell fields enter the ion values for these compounds from Table 5 on page 93.
b After each ion addition, select Add/Modify Ion.
Agilent G1701EA MSD Productivity ChemStation Familiarization Guide

Create a SIM Quantitation Method 6
Agilent G1701EA MSD Productivity Che
10 Select Close to save settings and return to the MS SIM / ScanParameters dialog box.
11 Select OK.
12 Select the Save Method button, . The Save Method As dialog box opens.
13 In the Method File field, enter demosim and select OK.
Figure 40 Entering Group 1 ions
Table 5 SIM ion selection
Compound Target Ion Qualifier Ion Dwell time
Biphenyl 154 85 60
Dodecane 170 85 60
Chlorobiphenyl 188 152 60
Methyl pamitate 270 87 60
mStation Familiarization Guide 93

94
6 Create a SIM Quantitation Method
14 Select the Edit Entire Method… button, . The Edit Method dialog box opens.
15 Mark the Method Information check box only. Clear the Data Analysis and Instrument/Acquisition check boxes.
16 Select OK. The Method Information dialog box opens.
17 In the Method Comments field, enter a description of this method.
18 In the Method Sections To Run area, mark the Data Acquisition check box.
Agilent G1701EA MSD Productivity ChemStation Familiarization Guide

Create a SIM Quantitation Method 6
Agilent G1701EA MSD Productivity Che
19 Select OK. The Save Method As dialog box opens.
20 Confirm that demosim is entered in the Method File field and select OK.
mStation Familiarization Guide 95

6 Create a SIM Quantitation Method
Simultaneously Acquire Scan and SIM Data (SIM/Scan Mode)
96
If we start with a method containing Scan parameters and then also enter SIM parameters like we did for the evalsim.m method, our method already contains all parameters required except one. We only need to check a box that specifies that we want to acquire both types of data simultaneously.
In SIM/Scan mode the number of data points taken in each mode is reduced and we will see how that impacts the total cycle frequency.
1 Select the MS Parameters button, . The MS SIM / Scan Parameters dialog box opens.
2 Mark the Acquire Scan and SIM data check box.
3 From the Acq. Mode dropdown box, select Scan.
4 Select Scan Parameters. The Edit Scan Parameters dialog box opens and we can view our previous settings.
Agilent G1701EA MSD Productivity ChemStation Familiarization Guide

Create a SIM Quantitation Method 6
Agilent G1701EA MSD Productivity Che
5 Select the Mass Range tab and note the asterisk.
The asterisk in the Summary Of Settings table, (Scans/Sec*) denotes that the Scans/Sec displayed here does not represent the actual cycles. See “SIM/Scan Mode Cycle Frequency” on page 98, for more information.
6 Write down the cycle frequency for the scan mode.
7 Select Close to return to the MS SIM/Scan Parameters dialog box.
8 From the Acq. Mode dropdown box, select SIM.
9 Select SIM Parameters. The Edit SIM Parameters dialog box opens where we can view our previous settings.
10 Select the Mass Range tab and write down the cycle frequency for the SIM mode.
11 Select Close to return to the MS SIM/Scan Parameters dialog box.
12 Select OK to save the parameters and close the dialog box.
13 Save the method with the name sim_scan.M.
The individual cycle frequencies recorded here will be used to calculate the actual cycle frequency in the next section “SIM/Scan Mode Cycle Frequency” on page 98.
mStation Familiarization Guide 97
6 Create a SIM Quantitation Method
SIM/Scan Mode Cycle Frequency
98
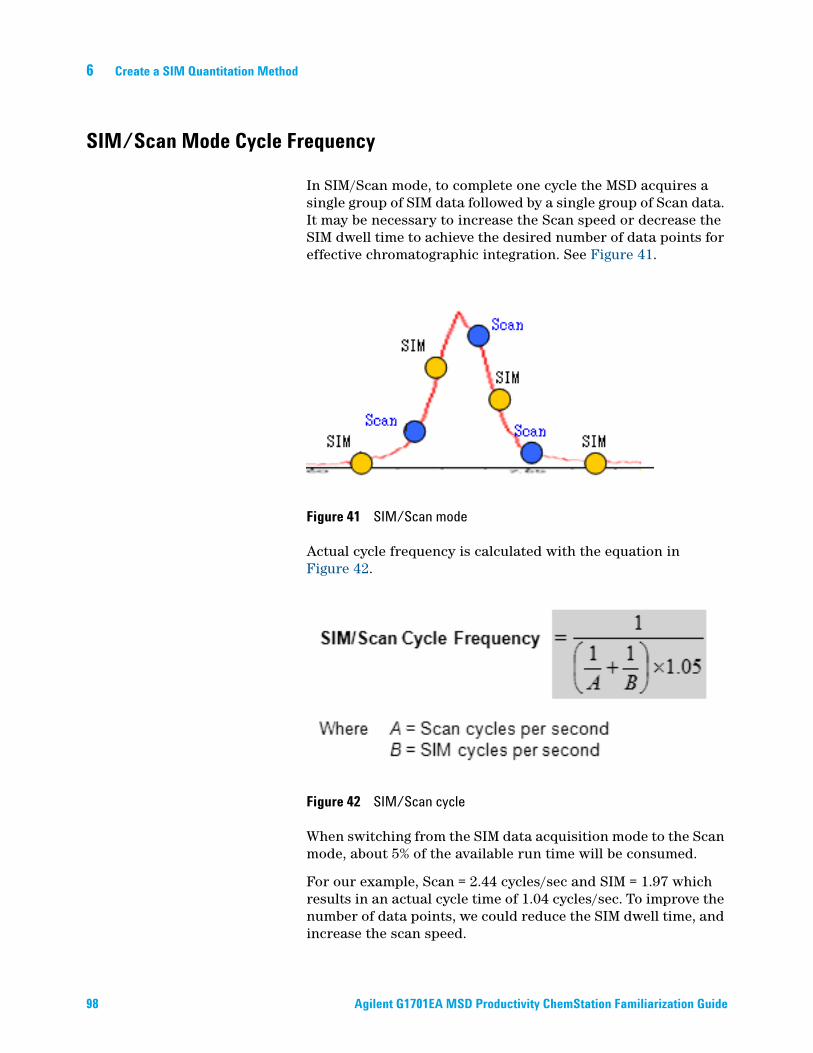
In SIM/Scan mode, to complete one cycle the MSD acquires a single group of SIM data followed by a single group of Scan data. It may be necessary to increase the Scan speed or decrease the SIM dwell time to achieve the desired number of data points for effective chromatographic integration. See Figure 41.
Figure 41 SIM/Scan mode
Actual cycle frequency is calculated with the equation in Figure 42.
Figure 42 SIM/Scan cycle
When switching from the SIM data acquisition mode to the Scan mode, about 5% of the available run time will be consumed.
For our example, Scan = 2.44 cycles/sec and SIM = 1.97 which results in an actual cycle time of 1.04 cycles/sec. To improve the number of data points, we could reduce the SIM dwell time, and increase the scan speed.
Agilent G1701EA MSD Productivity ChemStation Familiarization Guide

Agilent G1701EA MSD Productivity ChemStationFamiliarization Guide
7Run a Sequence
Prepare the Samples 100
Create the Sequence 101
Save the Sequence 103
Load the Sequence 104
Run the Sequence 105
Print the Sequence Log 106
This chapter describes how to create and run a sequence.
A sequence is a list of samples to be analyzed and a designated method to be used for each analysis. Once defined, the sequence may run unattended, automatically processing the samples defined in the sequence.
When an ALS is installed, the entire analysis, from injection of the sample through reporting of results, can be automated to save you time.
The data files generated when running this sequence will be used later for developing a quantitate analysis.
99Agilent Technologies

7 Run a Sequence
Prepare the Samples
100
1 Prepare 1:2 serial dilutions of the 100 ng/mL 5975 MSD Sample (P/N 05970-60045 or P/N 5074-3025 Japan only ) in hexane to make a 50 ng/mL and a 25 ng/mL method calibration sample.
2 Prepare 1:2 serial dilutions of the 10 ng/mL 5975 MSD Sample (P/N 05970-60045 or P/N 5074-3025 Japan only ) in hexane to make a 5 ng/mL and 2.5 ng/mL method calibration sample.
3 Fill the vials with approximately 500 µL of each standard (2.5, 5, 10, 25, and 50 ng/mL).
If you are not using an ALS skip the remaining steps.
4 Place the sample vials in increasing order of concentration into positions 1 through 5 of the GC sample tray.
5 Fill a solvent wash vial with isooctane and place it in injector turret location A for solvent wash mode A, B.
6 Place an empty waste vial in turret location B specified for solvent wash mode A, B.
Agilent G1701EA MSD Productivity ChemStation Familiarization Guide

Run a Sequence 7
Create the Sequence
Agilent G1701EA MSD Productivity Che
1 Select the Edit Sequence button, . The Sample Log
Table opens.
2 In sample row 1 under the Type column, click in the cell to activate the dropdown list, and select Sample.
3 Under the Vial column, enter 1 if you placed the lowest concentration sample in the ALS tray position 1.
4 Under the Sample column, enter Standard 5 ng/mL.
5 Under the Method/Keyword column:
a Right mouse click and select Browse for Method. The Browse for Folder dialog box opens.
b Navigate to and select demoSIM.
c Select OK. The method name appears in the column.
6 In the Data File column, enter STD01.
7 Highlight rows 1 to 5.
mStation Familiarization Guide 101
102
7 Run a Sequence
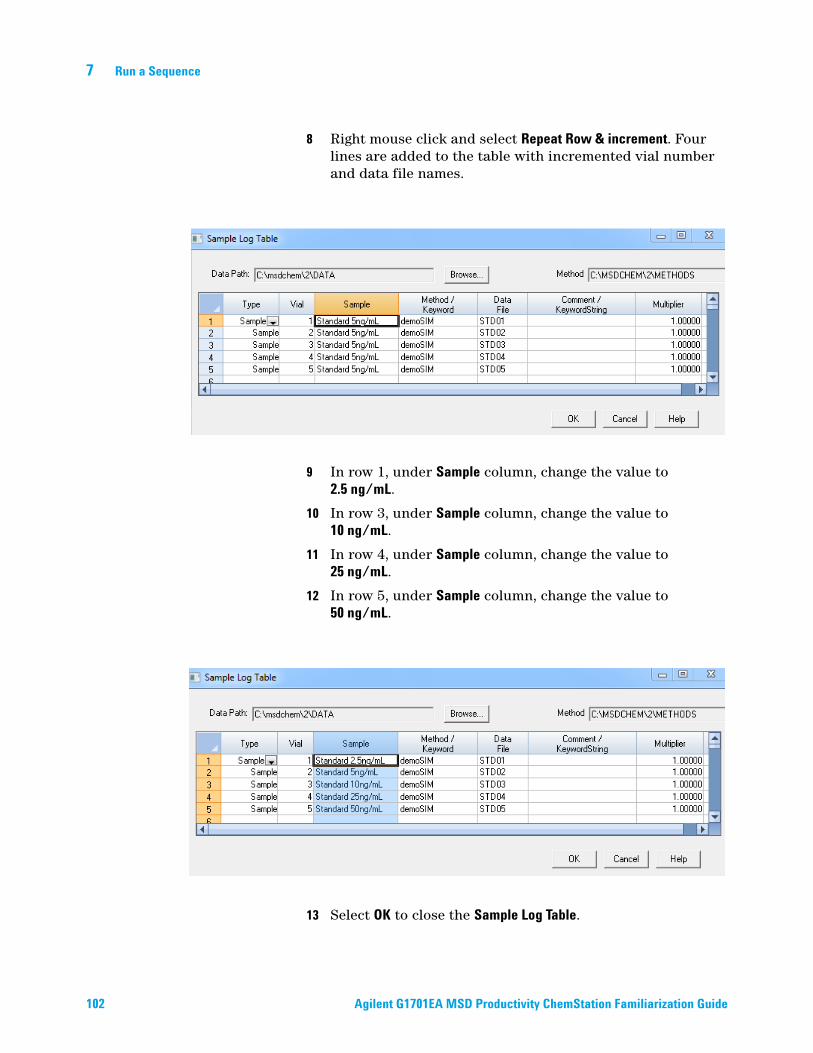
8 Right mouse click and select Repeat Row & increment. Four lines are added to the table with incremented vial number and data file names.
9 In row 1, under Sample column, change the value to 2.5 ng/mL.
10 In row 3, under Sample column, change the value to 10 ng/mL.
11 In row 4, under Sample column, change the value to 25 ng/mL.
12 In row 5, under Sample column, change the value to 50 ng/mL.
13 Select OK to close the Sample Log Table.
Agilent G1701EA MSD Productivity ChemStation Familiarization Guide

Run a Sequence 7
Save the Sequence
Agilent G1701EA MSD Productivity Che
1 Select the Save Sequence As… button, . The Save Sequence dialog box opens.
2 In the File name field, enter eval.
3 Select Save. The dialog box closes and the sequence is saved.
mStation Familiarization Guide 103

7 Run a Sequence
Load the Sequence
104
1 Select the Load Sequence button, . The Load Sequence dialog box opens.
2 In the File Name field, enter eval.s.
3 Click Select to close the dialog box and load the sequence.
Agilent G1701EA MSD Productivity ChemStation Familiarization Guide

Run a Sequence 7
Run the Sequence
Agilent G1701EA MSD Productivity Che
1 Select the Run Sequence button, . The Start Sequence dialog box opens.
2 In the Method Sections to Run area, select Full Method.
3 In the Sequence Comment field, enter a description of the sequence.
4 In the Operator Name field, enter your name.
5 In the Data File Directory field, add demosim to the path.
6 Select Run Sequence.
The Sequence Status bar is displayed. During the sequence run, you can monitor the number of the samples run, the number of samples remaining, and the current sample vial being processed. Use the controls on the bar to pause the sequence, access data analysis, or edit sequence sample entries that have not yet run.
Figure 43 The sequence status bar
mStation Familiarization Guide 105

7 Run a Sequence
Print the Sequence Log
106
1 Select the Print button, . The Select Items to Print dialog box opens.
2 Mark the Sequence Log checkbox.
3 Select OK. The Sequence log is displayed for printing.
Agilent G1701EA MSD Productivity ChemStation Familiarization Guide

Agilent G1701EA MSD Productivity ChemStationFamiliarization Guide
8Set Up a Quantitation Database
Add Compound Entries for the Database 108
Add the Calibration Curve 115
View or Edit an Existing Database 120
This chapter describes how to add compounds to the database. After a compound is identified, quantitative data analysis determines the amount of the compound in your sample by comparing the response from an unknown amount of compound with the response from a known measured amount of the compound stored in the quantitation database.
107Agilent Technologies

8 Set Up a Quantitation Database
Add Compound Entries for the Database
108
1 Start the Enhanced Data Analysis program.
2 Select the Load Method button, . A confirmation message dialog box may open. If so, select Yes. The Load Method window opens.
3 Select the demosim method and click OK.
4 Select the Load Data File button, . The Select Data File dialog box opens.
5 Select Change Path. The Browse for Folder window opens.
6 Navigate to and select C:\msdchem\1\data\demosim.
7 Select OK. The path is displayed in the Path field.
Agilent G1701EA MSD Productivity ChemStation Familiarization Guide

Set Up a Quantitation Database 8
Agilent G1701EA MSD Productivity Che
8 From the list of files, select DEMOSIM01.D.
Later we will use the load next file function. It remembers this data directory and the last file selected from it and automatically loads the next data file with the click of an icon.
9 Select OK. The TIC window opens.
10 Select the Setup Quant button, . A confirmation message may appear. Select OK.
mStation Familiarization Guide 109

110
8 Set Up a Quantitation Database
11 Select OK. The standard right mouse buttons are enabled.
12 The Quantitation Database Globals dialog box opens.
13 Enter the following information to set parameters that will initially be set for all compounds in this database. If some compounds need different parameters they can be changed later in the database.
a Calibration Title-MSD Sample.
b Units of Concentration - ng/uL
c Select Use RTEINT. The RTE integrator is recommended for MS data.
Agilent G1701EA MSD Productivity ChemStation Familiarization Guide

Set Up a Quantitation Database 8
Agilent G1701EA MSD Productivity Che
14 Select OK to save the settings and open the Edit Compounds dialog box.
mStation Familiarization Guide 111

8 Set Up a Quantitation Database
Identify compounds
112
The first part of setting up a Quantitation database is identifying and naming the compounds by selecting target and qualifier ions from a known sample.
1 From the Edit Compounds dialog box, select Insert Above. The Quant Setup dialog box opens.
2 In the name field, enter the first compound name, biphenyl.
3 In the TIC window, enlarge the biphenyl peak (near RT 4.7).
4 Position the cursor at the highest point of the peak and double right mouse click. The RT is added to the Ret. Time field. The Scan is displayed in the lower window and the RT is displayed for the Ret. Time in the Quant Setup dialog box.
Target is selected in the Quant Setup dialog box.
Agilent G1701EA MSD Productivity ChemStation Familiarization Guide

Set Up a Quantitation Database 8
Agilent G1701EA MSD Productivity Che
5 In the scan window, position the bulls eye cursor on the target ion (154) and click both mouse buttons simultaneously. The m/z is displayed for the Target.
Q1 is selected in the Quant Setup dialog box.
6 In the scan window, position the cursor on the first qualifier ion (153) and click both mouse buttons simultaneously. The m/z is added to the Q1 field and the ratio is calculated and added to the Ratio field.
To clear an incorrect ion selection, select the radio button for that ion. Next, simultaneously click both mouse buttons with the cursor positioned on an area not containing an ion.
7 Select Save to add the biphenyl peak to the database and clear the Quant Setup dialog box.
8 Add the remaining compounds using the target and qualifier ions identified in qualitative analysis.
9 When all compounds are added, select Exit to return to the Edit Compounds dialog box.
10 Review the compound list. If any corrections need to be made, double-click on the compound and reenter the information in the Quant Setup dialog box.
Table 6 Target and qualifier ion selections
Compound Target Ion Qualifier Ion Dwell time
Biphenyl 154 153 60
Dodecane 170 85 60
Chlorobiphenyl 188 152 60
Methyl pamitate 270 87 60
mStation Familiarization Guide 113

114
8 Set Up a Quantitation Database
11 Select Exit. A confirmation message appears.
This procedure continues with the next section “Add the Calibration Curve” on page 115.
Agilent G1701EA MSD Productivity ChemStation Familiarization Guide

Set Up a Quantitation Database 8
Add the Calibration Curve
Agilent G1701EA MSD Productivity Che
The second part of setting up a Quantitation database is entering the compound concentrations from a group of samples. Each sample in the group contains a different compound concentration used to create the calibration curve.
Add calibrator level 1
1 Select Yes to the confirmation message that appears in step 11 of “Identify compounds” above. The Update Calibration dialog box opens.
2 For the first calibrator,
a Select Add Level.
b Compound Concentration enter 2.500000.
c In the Level IDs area, enter 2.5 in the New Level ID field.
3 Select Do Update. The Edit Compounds dialog box opens and displays the first calibration point.
mStation Familiarization Guide 115

8 Set Up a Quantitation Database
Figure 44 The first calibration point is added to the calibration curve
116
4 Select the Identification tab.
5 In the Quantitation Options area, select:
a Identify by - All Hits
b Subtraction Method - Avg first & last
6 Select OK. A confirmation message appears.
7 Select OK to save the changes.
Agilent G1701EA MSD Productivity ChemStation Familiarization Guide

Set Up a Quantitation Database 8
Agilent G1701EA MSD Productivity Che
The Quantitation Report window opens. To add additional calibration levels, see the next section.
Add calibrator levels 5, 10, 25, and 50 to the calibration curve
Repeat this procedure for DEMOSIM02 (level = 5), DEMOSIM03 (level = 10), DEMOSIM04 (level = 25), and DEMOSIM05 (level = 50).
1 Select the Load Next Data File button, . The next data file is automatically loaded.
2 Select the Update Calibration button, . The Select Update Option dialog box opens.
3 Select Update One Level and OK. A confirmation message appears.
4 Select Yes. The Update Calibration dialog box opens.
5 For this calibrator,
a Select Add Level.
b Compound Concentration for DEMOSIM02 (level = 5), DEMOSIM03 (level = 10), DEMOSIM04 (level = 25), and DEMOSIM05 (level = 50).
c In the Level IDs area, enter for DEMOSIM02 (level = 5), DEMOSIM03 (level = 10), DEMOSIM04 (level = 25), and DEMOSIM05 (level = 50) the New Level ID field.
mStation Familiarization Guide 117

118
8 Set Up a Quantitation Database
6 Select Do Update. The Edit Compounds dialog box opens and displays the new calibration point.
7 Select the Identification tab.
8 In the Quantitation area, select:
a Identify by - All Hits
b Subtraction Method - Avg first & last
9 Continue with the above steps under “Add calibrator levels 5, 10, 25, and 50 to the calibration curve” until all concentration levels are added. The completed calibration curve is shown in Figure 45.
Figure 45 The completed quant database
10 Select OK to close the window.
Agilent G1701EA MSD Productivity ChemStation Familiarization Guide

Set Up a Quantitation Database 8
Save the database
Agilent G1701EA MSD Productivity Che
1 Select the Save Method button, . The Save Method As dialog box opens with the name of the current method displayed in the Method Path and Method File fields.
2 Select OK.
mStation Familiarization Guide 119

8 Set Up a Quantitation Database
View or Edit an Existing Database
120
1 Select the Edit Compounds button, . The Edit Compounds dialog box opens.
2 Select a compound in the navigation tree. The corresponding information is displayed in each tab.
3 To copy the calibration curve to your clipboard for use in another application, select Copy Calibration Curve.
4 To print the calibration curve, select Print Calibration Curve.
Identification tab
• Name of the compound
• Concentration units
• Compound type
• Retention time information
• Signals to be used for quantitation
• Calibration information
• Quantitation parameters
Calibration tab
• Concentration units
• Response for each level ID
User-Defined tab
• A1 through A3 - alphanumeric items with a maximum of 19 characters
• N5 through N9 - numeric items
Advanced tab
• Area Correction Mass
• Correction Factor
• Integration parameter files for target and qualifier compound quantitation. The Sum? field allows you to add the response of the designated qualifier ion to the response of the target ion. This method is valid only in area quantitation using the extended area quantitation method.
Agilent G1701EA MSD Productivity ChemStation Familiarization Guide

Set Up a Quantitation Database 8
Agilent G1701EA MSD Productivity Che
Reporting tab
• CAS # - designed for a Chemical Abstract Service number. However, you may use this for any other number or information about the compound.
• Surrogate / Matrix Spike Amount
• Matrix A and B concentrations
• Signal level minimum and maximum
• MS database name
• Reference Spectrum number
mStation Familiarization Guide 121

122
8 Set Up a Quantitation Database
Agilent G1701EA MSD Productivity ChemStation Familiarization Guide
Agilent G1701EA MSD Productivity ChemStationFamiliarization Guide
9Generate a Report
Generate a Report Automatically After the Run 124
Generate a Detailed Report for Previously Acquired Data 129
This chapter explains how to modify your method to generate a report at the end of each sample run and how to interactively generate a report from the Data Analysis view.
123Agilent Technologies

9 Generate a Report
Generate a Report Automatically After the Run
Load the method
124
1 From the Instrument View, select the Load Method button,
. The Load Method window opens.
2 Navigate to and select demosim.m.
3 Select OK to close the dialog box and load the method.
Edit the method to generate a report
1 From the Instrument View, select the Edit Entire Method…
button, . The Edit Method dialog box opens.
2 Mark the Method Information and Data Analysis check boxes only. Clear the Instrument/Acquisition check box.
3 Select OK. The Method Information dialog box opens.
Agilent G1701EA MSD Productivity ChemStation Familiarization Guide

Generate a Report 9
Agilent G1701EA MSD Productivity Che
4 In the Method Comments field, enter a description of this method.
5 In the Method Sections To Run area, mark the Data Acquisition and Data Analysis check boxes, and clear the Post-Run Macro/Commands check box.
6 Select OK. The Select Reports dialog box opens.
7 Mark the Quant Report check box and clear all other check boxes.
8 Select OK. The Quant Report Options dialog box opens.
mStation Familiarization Guide 125

126
9 Generate a Report
9 From the Style drop down list, select Summary.
10 In the Destination area, mark the Printer check box and clear all the other check boxes.
11 Select OK. The Select RUNMETHOD printer dialog box opens.
12 Select a printer and click Select. The Save Method As dialog box opens.
13 Select OK to save the setting to the current method or enter a new file name for the method.
Agilent G1701EA MSD Productivity ChemStation Familiarization Guide

Generate a Report 9
Run the method and generate the report
Agilent G1701EA MSD Productivity Che
1 With the method modified to print a quantitation summary report loaded, click on the green arrow to display the Start Run dialog box.
2 In the Data Path field, add eval1 to the path.3 In the Data File Name field, enter evalunkn.d.
4 In the Operator Name field, enter your name.
5 In the Sample Name field, enter a sample name.
6 Enter the Vial number for your sample location in the ALS.
7 In the Method Sections to Run area, select Data Acquisition and Data Analysis.
mStation Familiarization Guide 127

128
9 Generate a Report
8 Select OK and Run Method. The method is run and the summary quantitation report is automatically generated after the run is completed.
Figure 46 Summary quantitation report
Agilent G1701EA MSD Productivity ChemStation Familiarization Guide

Generate a Report 9
Generate a Detailed Report for Previously Acquired Data
Load the method
Agilent G1701EA MSD Productivity Che
1 Start the data analysis program by using the desktop icon,
.
2 From the Instrument View, select the Load Method button.
. The Load Method dialog box opens.
3 Navigate to and select demosim.M and then OK.
Load the data file
1 From the tool bar select the Load Data File button, . The Select Data File dialog box.
2 From the list, select evalunkn.d.
3 In the Path field, enter C:\msdchem\1\DATA\eval1.
4 Select OK to load the file and close the dialog box.
Generate a detailed quantitation report
1 Select the Generate Reports button, . The Quant Reports Options dialog box opens.
2 From the Style drop down list, select Detailed.
3 In the Destination area, mark the Printer check box and clear all the other check boxes.
4 Select OK. The dialog box closes and the report is printed.
mStation Familiarization Guide 129

130
9 Generate a Report
Figure 47 Detailed quantitation report
Agilent G1701EA MSD Productivity ChemStation Familiarization Guide

Agilent G1701EA MSD Productivity ChemStationFamiliarization Guide
10Recalibrate and Quantitate Unknowns
Create a Recalibration Sequence 132
Save the Sequence 134
Run the Sequence 135
Regular recalibration is required to account for changes in your system. The ChemStation can perform this recalibration automatically using the recalibration sequence described here. This is normally done on a scheduled basis that precedes the running of samples.
131Agilent Technologies

10 Recalibrate and Quantitate Unknowns
Create a Recalibration Sequence
132
1 Select the Edit Sequence button, . The Sample Log
Table opens.
2 In sample row 1 under the Type column, click in the cell to activate the drop down list and select Calibration.
3 Under the Vial column, enter 1 if you place the lowest concentration sample in the ALS tray position 1.
4 Under the Sample column, enter Std 2.5ng.
5 Under the Method/Keyword column:
a Right mouse click and select Browse for Method. The Browse for Folder dialog box opens.
b Navigate to and select demosim.M.
c Select OK. The method name appears in the column.
6 Under the Data File column, enter Stdupdate01.
7 Under Level column, enter 2.5.
8 Under Update RF column, click in the cell to activate the drop down list and select Replace.
9 Under Update RT column, click in the cell to activate the drop down list and select Replace.
10 Under Update QI column, click in the cell to activate the drop down list and select Replace.
11 Highlight rows 1 to 5.
Agilent G1701EA MSD Productivity ChemStation Familiarization Guide

Recalibrate and Quantitate Unknowns 10
Agilent G1701EA MSD Productivity Che
12 Right mouse click and select Repeat Row & increment. Four lines are added to the table with incremented vial number and data file names.
13 In row 2, under Sample column, change the value to Std 5 ng.
14 In row 3, under Sample column, change the value to Std 10 ng.
15 In row 4, under Sample column, change the value to Std 25 ng.
16 In row 5, under Sample column, change the value to Std 50 ng.
17 In row 2, under Level column, change the value to 5.
18 In row 3, under Level column, change the value to 10.
19 In row 4, under Level column, change the value to 25.
20 In row 5, under Level column, change the value to 50.
21 In row 6, enter an unknown sample for analysis as shown in the figure.
22 Select OK to close the Sample Log Table.
mStation Familiarization Guide 133

10 Recalibrate and Quantitate Unknowns
Save the Sequence
134
1 Select the Save Sequence As… button, . The Save Sequence dialog box opens.
2 In the File name field, enter updatequant.
3 Select Save. The dialog box closes and the sequence is saved.
Agilent G1701EA MSD Productivity ChemStation Familiarization Guide

Recalibrate and Quantitate Unknowns 10
Run the Sequence
Agilent G1701EA MSD Productivity Che
1 Select the Run Sequence button, . The Start Sequence dialog box opens.
2 In the Method Sections to Run area, select Full Method.
3 In the Sequence Comment field, enter a description of the sequence.
4 In the Operator Name field, enter your name.
5 In the Data File Directory field, add eval2 to the path.
6 Select Run Sequence. The calibration table of the demoSIM method is updated and the unknown sample results are calculated/reported with the recalibrated calibration curve.
mStation Familiarization Guide 135

136
10 Recalibrate and Quantitate Unknowns
Agilent G1701EA MSD Productivity ChemStation Familiarization Guide

Agilent G1701EA MSD Productivity ChemStationFamiliarization Guide
11Create a Cool Down Method
Create the Cool Down Method 138
Use the Cool Down Method 139
This chapter describes how to create and store a method to use for instrument maintenance tasks. Using this type of method helps prevent damage to the instrument electronics and columns and avoid injuries such as burns or shocks.
137Agilent Technologies

11 Create a Cool Down Method
Create the Cool Down Method
138
1 Select View > Instrument Control.
2 Select the GC Edit Parameters button, . The GC Edit Parameters window opens.
3 Select the Oven button, . The oven parameters are displayed.
4 In the Oven Ramp table, clear the Rate and Value entries.
5 Select the Inlets button, . The inlet parameters are displayed.
6 Select the front or back tab, depending on your hardware configuration.
7 Mark the Heater check box and enter 35°C in the corresponding field.
8 Mark the Pressure check box. Column flow must be maintained to prevent damage to the column when hot.
9 Select the AUX button, .
10 Clear the On check box for the Aux 2 Heater.
Agilent G1701EA MSD Productivity ChemStation Familiarization Guide

Create a Cool Down Method 11
Agilent G1701EA MSD Productivity Che
11 Select OK.
12 Select the Save Method button, . The Save Method As dialog box opens.
13 In the Method File field, enter cool down.
14 Select OK.
Use the Cool Down Method
To use the cool down method, load the method, access the Edit GC Parameters window, and right mouse click in the right panel. Select Download Method to GC from the context menu. A confirmation message is displayed.
Select OK to close the message and return to the GC Edit Parameters window.
When the GC enters the Ready state, perform the maintenance.
mStation Familiarization Guide 139

140
11 Create a Cool Down Method
Agilent G1701EA MSD Productivity ChemStation Familiarization Guide

Agilent G1701EA MSD Productivity ChemStationFamiliarization Guide
12Shut Down the System
Shut Down the MS 142
Shut Down the GC 143
This chapter describes how to shut down the MS and GC.
141Agilent Technologies

12 Shut Down the System
Shut Down the MS
142
1 Select View > Tune and Vacuum Control….
2 Select Vacuum > Vent... A confirmation message appears.
3 Select OK.
4 The Vent Cycle dialog status window opens and remains open until the vent is complete. You can close the dialog box by selecting Exit, however, the process continues. To reopen the Vent Cycle status window, select View > Vacuum Status.
5 Select OK to close the dialog box.
Agilent G1701EA MSD Productivity ChemStation Familiarization Guide

Shut Down the System 12
Agilent G1701EA MSD Productivity Che
Do not turn off the MS at this time if you are first cooling down the instrument. The Instrument Control window will close when a configured instrument is powered off.
6 Select Close.
Shut Down the GC
1 In Instrument Control, load the GC cool down method.
2 Access the Edit GC Parameters window.
3 Right mouse click in the right panel and select Download Method to GC from the context menu. A confirmation message is displayed.
4 Select OK to close the message and return to the GC Edit Parameters window.
5 Close the Edit GC Parameters window and exit the ChemStation.
6 When the GC enters the Ready state turn off the power to the GC and the MS.
7 Turn off the carrier gas.
8 Power off the PC and all peripheral equipment.
mStation Familiarization Guide 143

144
12 Shut Down the System
Agilent G1701EA MSD Productivity ChemStation Familiarization Guide

Agilent G1701EA MSD Productivity ChemStationFamiliarization Guide
13Frequently Asked QuestionsQ. How often should the MSD be tuned?
A. Perform an Autotune on a regular basis: weekly or monthly depending on use of the MSD. Perform a Check Tune daily to validate the performance of your instrument. If needed, perform a Quick Tune.
Q. There are two autotune options: Tune MSD and Quick Tune. What are the differences between them?
A. The Tune MSD maximizes the instrument sensitivity over the calibrant (PFTBA) mass range (69, 219, and 502). Quick Tune updates the peak width, mass assignment, and abundance.
Q. An analyte elutes before the solvent peak. How can data be acquired before the solvent peak as well as after?
A. Method parameters that control the MSD can be modified to update the method to capture data prior to the solvent peak. To update the method, use the timed events table to turn off the filament and data detection after the analyte elutes but before the solvent elutes. Set an event to turn the filament and the detector back on after the solvent peak has eluted.
Q. The sensitivity for some analytes has become reduced while some are not being detected at all. How can this be corrected?
A. Decreased sensitivity with the GC/MSD system may be caused by the following situations:
• Sample: Analytes have evaporated or deteriorated in the sample.
• Column: Column may be contaminated; column maintenance is recommended.
• GC Inlet: Inlet liner, split vent, or septum may be dirty, damaged or contaminated; inlet maintenance is required.
• Column Connection: Loose injection port ferrule or MSD transfer line ferrule, column installed incorrectly at the inlet or transfer line.
• Injector: The syringe is plugged with septum material or is using an incorrect sampling volume.
145Agilent Technologies

146
13 Frequently Asked Questions
• Ion Source: The ion source has become contaminated or dirty; clean the source or replace the necessary parts.
• Method Parameters:
• MSD Parameters: Incorrect mass assignments are being used with your method.
• GC Parameters: Method uses incorrect split ratio or requires a longer purge time.
To improve your sensitivity:
• Perform autotune to verify MSD performance.
• Refer to the hardware manual for step by step troubleshooting procedures.
• Call Agilent Technologies Customer Support.
Q. When loading a data file, the error message “No MS Data” appears. What does this mean and what is the cause?
A. “No MS Data” means that the data file selected does not contain the data.ms within the datafile.d. Typically this occurs when the user forgets to save the MS data file within the method parameters, the remote start/stop cable is not connected, or the acquisition was aborted or terminated.
Q. When right-clicking on the TIS, the spectrum does not display, and the cursor is a (+) instead of a line. What causes this?
A. This is generally caused by the manual integration feature turned ON in Data Analysis. In this mode, to turn OFF manual integration, use the Manual Integration option in the data analysis option dialog box. The cursor in the chromatogram window should return to a vertical line.
Q. How does the Match Quality of library search results relate to the compound?
A. The Match Quality of the unknown is identified as the reference. Values greater than 90 are very good matches. Values less than 50 mean that substantial differences exist between the unknown and reference and the match should be regarded as uncertain. Differences in probability values of ±5 are generally not significant. An asterisk (*) before the probability value indicates that the molecular ion was used in the match. Because many factors affect the match quality and ordering of the compounds in the hit list, the list should be viewed as an interpretative guide to the unknown's identity. It is the chemist's responsibility to
Agilent G1701EA MSD Productivity ChemStation Familiarization Guide

Frequently Asked Questions 13
Agilent G1701EA MSD Productivity Che
determine whether the match identity is correct. For example, graphical comparison of the unknown's mass spectrum with that of an authentic sample, knowledge of the sample's history, and other pertinent information should be considered.
Q. Why does the library search list different spectra for the same compound?
A. Commercially available databases such as NIST or WILEY libraries contain MSD data for instruments from several manufacturers for one compound. This means search results may list duplicate compounds. To avoid this duplication, edit your Search Strategy to remove duplicate CAS numbers. See the online help for instructions on how to do this.
Q. Can a compound in a spectral library be viewed manually?
A. Yes it can. The Parametric Retrieval feature allows you to manually specify search criteria for your spectra. It retrieves a spectrum from the specified library based on those criteria and displays the results. The online help contains instructions for how to set up the criteria for your manual search.
Q. Can a chromatogram be redrawn to a different scale? How?
A. There are three ways to redraw the image of a chromatogram:
• Zoom in the area of interest in the existing chromatogram. Click within the area of interest and drag the cursor to define the area for the new chromatogram.
• Using the Data Analysis menu, click Chromatogram > Chromatogram Scaling... Select the chromatogram to be rescaled, and specify the scaling method to be used.
• Use the DRAW command to rescale the chromatogram and define the window location of the image. Refer to the online help for more detailed instructions on how to perform this action.
Q. After column maintenance or replacement, the chromatographic peak is missing. How can the peak be recovered?
A. The chromatographic peak is normally determined by the retention time window where the peak of interest would display. After a column change or maintenance, this retention time will shift. Perform a retention time update.
mStation Familiarization Guide 147

148
13 Frequently Asked Questions
Q. Why would an Extracted Ion Chromatogram (EIC) be used instead of a Total Ion Chromatogram (TIC) for quantitation?
A. An EIC gives more stable results compared to the TIC.
Q. If autointegration does not work on a peak, can it still be integrated?
A. Yes, the peak can be integrated manually. For some cases, manual integration mode is the only method to use. Turn on manual integration under Tools > Options > A/B. Select the area of the peak that you would like to integrate. Refer to the online help for complete instructions on how to manually integrate.
Q. How can integration results be exported?
A. Click Chromatogram > Integration Results... Tabulation of the integration results associated with the current data file is displayed. Click the Copy button to save tabulated data to the clipboard. Now the results can be pasted into another application package.
Q. How can chromatogram graphics be exported?
A. To copy a selected Data Analysis window to the clipboard use the Tools > Copy Window menu. Answer the prompt for the number of the graphics window to be copied ('1' for spectrum, '2' for TIC). Click OK to copy the selected window to the clipboard. Now the graphics can be pasted into another application package. Alternatively, right-click Data Analysis, right-click in the window of interest, and copy and paste the image into another application.
Q. Why are the integration results on the quantitation report and my integration results different?
A. Integration results on the quantitation report are generated using the extracted ion chromatogram (EIC) of the target ion specified in the compound on the first page of the quantitation database while the integration results generated manually are based on the total ion chromatogram (TIC). Specific integration events can be used to integrate if the compound data file is specified on the third page of the quantitation results database. If the extracted ion chromatogram and the total ion chromatogram use the same integration event file, you may get the same integration results.
Q. Why would the chromatogram show a peak if the quantitation report shows a N.D?
Agilent G1701EA MSD Productivity ChemStation Familiarization Guide

Frequently Asked Questions 13
Agilent G1701EA MSD Productivity Che
A. There are two possible reasons. First, incorrect integration events may be used for quantitation. To check this, open the Edit Compound dialog with Calibration >Edit Compound....Select the compound of interest on the left panel. Click the Advanced tab to show the Integration Parameter File being used. The second cause may be that the concentration of the peak was lower than the quantitation limit. Integration parameters are set to integrate at least the lowest concentration standard sample peak. The area reject or other event may restrict small peaks from being integrated. In this case, the peak is lower than the quantitation limit; therefore, N.D. is appropriate. Please refer to the online help for additional information.
Q. Why does the quantitated data file show different results for the qualifier ion ratio?
A. The qualifier ion ratio on the first page of the quantitation database is calculated using the abundance of the qualifier ion relative to the abundance of the target ion when the compound was registered (=abundance ratio). The qualifier ion ratio can also be calculated using the integration of the spectrum (area of the curve) of the qualifier ion relative to the integration of the target ion spectrum (=area ratio). You can specify which way you would like the qualifier ion ratio to be calculated. See the online help for instructions.
mStation Familiarization Guide 149

150
13 Frequently Asked Questions
Agilent G1701EA MSD Productivity ChemStation Familiarization Guide


Agilent Technologies
© Agilent Technologies, Inc.
Printed in USA, June 2012
*G1701-90070*G1701-90070