Embed Size (px)
Citation preview
Department of Economics and Finance
Working Paper No. 15-12
http://www.brunel.ac.uk/economics
Eco
nom
ics
and F
inance
Work
ing P
aper
Series
Dimitrios Gounopoulos, Arthur Kraft and Frank Skinner
Voluntary vs. Mandatory Management Earnings Forecasts in IPOs
May 2015
1
Voluntary vs. Mandatory Management Earnings Forecasts
in IPOs
Dimitrios Gounopoulos, Arthur Kraft, Frank Skinner1
April 2015
Abstract
Until 2001 companies making initial public offerings in Greece were obliged to include a forecast of
next year’s profit in the new issue prospectuses; however in 2001 the regulations changed and
made the inclusion of earnings forecasts in the prospectuses voluntary. This study takes advantage
of these two regulatory regimes and compares the accuracy of earnings forecasts under both
mandatory and voluntary disclosure environments. Findings indicate a change in the properties of
the earnings forecasts, as pessimistic earnings forecasts during the mandatory era turn optimistic in
the voluntary period. The comparison of these two regimes suggests that mandatory earnings
forecasts may force firms to forecast that have neither the incentives nor the ability to do so.
Furthermore, the results imply that regulations penalizing IPOs for providing highly inaccurate
forecasts appear to be a more appropriate regulatory strategy. Accuracy of earnings improves after
the introduction of voluntary disclosures where firms that provide forecasts are characterized as
mature, with high demand multiple and low retained ownership.
Keywords: Earnings management, Mandatory and Voluntary disclosure environments, Forecast
accuracy, IPOs
JEL classification: G24 G30 M41
Dimitrios Gounopoulos is from School of Business, Management and Economics, University of Sussex; Arthur Kraft is from
Cass Business School, City University London; and Frank Skinner is from School of Economics and Finance, University of
Brunel; We thank Michael Firth, Dimitrios Ghikas, Chinmoy Ghosh, Bikki Jaggi, Alexandros Kontonikas, Kevin Keasey, S.P.
Kothari, Paul McGuinness, John McKernan, Stephen Penman, Theodore Sougiannis, Stavros Thomadakis, Evangelos
Vagenas Nanos, Nikos Vafeas and conference participants at the American Accounting Association Annual Meeting, the
European Accounting Association the 2012 FMA Meeting and University of Glasgow and Imperial College Business School
for valuable comments.
2
1. Introduction
In Greece initial public offerings (hereafter IPOs) need approval from the Securities Commission
before going public. The Securities Commission, in considering the proposal for entering the stock
exchange, takes into account the overall suitability of the company undertaking the IPO. Once
approved, the company is required to issue a prospectus outlining the history, operations and the
accounts of the firm and how it has fared and expects to perform in the future. The amount of
information that can be found in a prospectus is immense but one aspect that has attracted the
attention of academic researchers is the inclusion of a management earnings forecast figure (see, e.g.,
Jaggi (1997); Chan, (1996); Chen et al. (2001); Cheng & Firth (2000); and McGuinness (2005),
Ciconte et al., (2014)).
The disclosure of an earnings forecast in the prospectuses is either voluntary or mandatory,
depending on the institutional framework of every country, so the relevant empirical literature does
not provide results on both regulatory regimes (see, e.g., Firth et al, (1995); Jaggi, (1997); Pedwell et
al. (1994); Chan et al, (1996); Chen and Firth, (1999); Chen et al. (2001); Baginski et al. (2004);
Baber et al. (2006); Dechow et al. (2010) and Horton et al. (2013)). However, Greece offers an
opportunity to study both regimes due to its unique regulatory switch from mandatory to voluntary
earnings forecast disclosure in 2001, a time when most developed markets only followed voluntary
disclosure. This alteration in regulation allows us to answer several interesting questions, including
whether or not the properties of the earnings forecasts change after the switch in the disclosure
environment from mandatory to voluntary? How many firms chose not to publish an earnings forecast
under the voluntary regime? What are the determinants of the firms that voluntarily choose to
disclose earnings forecasts? Do other governance reforms (i.e. price cap, bookbuilding) affect the
earnings forecast? And finally is the level of underpricing lower after the switch to voluntary
disclosure?
The literature proposes several theoretical arguments to understand the relation between
earnings forecast, information retrieval and firm performance. Voluntary disclosure theory (VDT)
claims that disclosure is used as a tool for reducing information asymmetry between managers and
investors (see, e.g., Scott (1994); Clarkson et al, (2008); Aerts and Cormier (2009); Guidry and
Patten, (2012)). Specifically, providing an earnings forecast under a voluntary disclosure environment
can reduce uncertainty by signaling IPO quality through various mechanisms such as retaining a large
proportion of ownership by insiders (owners and managers) in the post IPO period (Hughes (1986),
3
Datar et al., (1991), Trezevant (1992) and Li and McConomy (2004))2, by appointing high quality
auditors (Beatty (1989), Ritter (2002), Ghikas et al., (2008) and using highly reputable investment
bankers as underwriters (Beatty and Ritter (1986), Clarkson et al. (1992), Jo et al. (2007)). To
mitigate the costs caused by information uncertainty, market participants3, and regulatory bodies’
desire the disclosure of additional material information such as the voluntary4 earnings forecast
during the IPO process.
Motivated by the importance of management earnings forecasts (Hutton et al. (2003),
Baginski et al. (2004), Karamanou and Vafeas (2005), Hirst et al. (2007), Ciconte et al., (2014)) and
inspired by the credibility puzzle, we argue that an alteration of a regulation is a potential channel
through which earnings forecast improvement (i.e. decrease of forecast error measured as the
difference between the annual report and prospectus figures) should enhance the credibility of
management. Indeed, the regulatory change to a voluntary regime increases the management's
freedom to make decisions whether to include a forecast. We expect that under the voluntary regime,
management will chose to provide a forecast when the have the ability to provide an accurate
forecast, partly because they wish to enhance their credibility. We therefore expect a positive
relationship between the improvement in communication among management and investors with
earnings forecast accuracy.
We believe the results for IPO studies are of interest for two reasons. First, because IPO firms
undergo a transition from private to public status, they offer a unique insight into the enhanced
market as well as regulatory standards expected of reports from public firms (Ball and Shivakumar
(2008)). Our objective is to understand the determinants of forecast credibility and evaluate the
usefulness of earnings forecast disclosures to investors. The previous literature on the disclosures
included in the offering prospectus has focused on managerial earnings forecasts alone (Clarkson et
al., (1992), Jog and McConomy, (2003)), on the number of risk factors listed and discussed, Clarkson
(1994), on the use of the IPO proceeds without providing proprietary information to competitors
(Beatty and Ritter (1986), Leone et al. (2007)) or in relation with other forecasts such as detailed
revenues and expense estimates, planned capital expenditure and multi period forecasts earnings.
Second, as investors understand that managers benefit from higher stock prices, they are
naturally skeptical about good news earnings forecasts. Hutton et al. (2003) document that if
2 The substitution effect hypothesis, (Trezevant, 1992) also indicates that retained ownership and the provision of management
earnings forecasts are credible value-relevant signal. 3 Baber et al (2006) suggest that market participants are aware of incentives to manage reported earnings, and accordingly, they
adjust for earnings management when they are provided the information required to do so. 4 Within the context of contracting theory and in line with Cormier and Martinez (2006) we characterize voluntary forecast
disclosure as a reporting environment where managers may be pressured to engage in earnings management in the year following
the IPO.

4
managers decide to release good news forecasts to increase their firms' stock prices, those forecasts
must be credible to investors. We investigate whether the forecast error, i.e. the difference between
actual reported earnings (after the IPO) and the forecasted earnings, is affected by the details of
forecast information in the financial statements under the mandatory and voluntary disclosure
regimes. Overall the incremental contribution of this study in the IPO and management earnings
forecasts literature is the examination of the informational content of the regulatory change and the
quality signal by newly listed firms to multiple user groups including market makers and investors,
within an international driven framework. Our findings also have important implications for future
empirical studies. Specifically, we provide justification that when managers jointly apply multiple
options, it is important to consider the interaction of these options. Ignoring these interactions may
lead to overstatement of the marginal impact of individual signals. In sum, our results may be of
interest to managers, securities regulators, investors and IPO researchers, by providing evidence of
which variables and firm-specific factors affect managers’ choices among the two mechanisms.
Furthermore, understanding the determinants of forecast credibility is important for a number
of reasons. First, it helps managers to choose forecast characteristics that optimize the value of their
voluntary disclosures. Managers and investor relation professionals tasked with managing the
disclosure process should be interested in how they can enhance the credibility of their forecasts to
reap cost of capital benefits (Coller and Yohn (1997)), mitigate the cost of information asymmetry
(Verrecchia (2001)), and enhance stock liquidity (Healy, Hutton, and Palepu (1999)). Second, an
improved understanding makes researchers more aware of the reasons for cross-sectional variation in
market reactions to management's earnings forecasts. This issue is of concern to those studying
voluntary disclosure as well as those who use these forecasts as control variables. Finally, standard
setters and regulators often struggle with how to make financial reports more reliable. Understanding
the link between disaggregation and credibility offers them insight into how to strengthen financial
disclosures.
We use a sample of 306 hand collected IPOs from 1993 to 2014 to assess the effect of earning
forecast disclosure under different regulatory environments. Those firms listing prior to January 1,
2001 are listing during the mandatory regime and after that date firms are listing under the voluntary
regime. We find that 100% of firms in the mandatory forecast regime issue forecasts, compared with
70.9% of firms in the voluntary regime. Next we measure the effect of the change in regulations
from mandatory to voluntary earnings forecast disclosure on earnings forecast accuracy. Surprisingly,
our results indicate that earnings forecasts during the mandatory disclosure era are on average
pessimistic while the average earnings forecast during voluntary disclosure period is
optimistic. Specifically, on average forecasts in the mandatory regime were conservative as the
5
average forecast was 8.65% below actual earnings whereas during the voluntary regime forecasts
were more optimistic being 9.58% above actual earnings. One theoretical justification for the
pessimistic forecast during the mandatory disclosure environment is due to the lack of confidence of
management as many of the IPOs that were forced to provide forecasts did not have the ability or the
knowledge to provide an accurate forecast.
We also document that under the mandatory disclosure environment, large IPOs are
associated with high forecast error. This appears to change in the voluntary period as large companies
provide more accurate earnings forecast. Given this change in the behavior of management, the
natural question to ask is why large firms have not been able to provide accurate earnings during the
mandatory period? Moreover, an increase in the quantity of forecasts does not guarantee an
improvement in shareholders’ informational environment if forecasts are untimely, imprecise, and
inaccurate. Therefore, the usefulness of mandatory forecasts is an empirical issue. We find that
investors react to the news in mandatory forecasts as if they are useful. When financial reports are
subsequently released, investors also respond to the earnings surprise benchmarked to the previous
forecast, suggesting that mandatory forecasts do not fully pre-empt the information contained in the
financial reports.
In order to explore the determinants of forecast credibility we include several control
variables. We uncover a positive relation between firm age and forecast accuracy. However, this
positive association is driven by listed firms during voluntary disclosure environment. This provides
robust evidence that ΙPΟs with short operating history are unable to provide accurate earnings
forecast. For firms classified as industrial the management forecast error is statistically significant at
conventional levels. This indicates that industries subject to cyclical earnings are less willing or able
to provide an accurate earnings forecast.
Following our exploration of the factors related to forecast error, we investigate how IPOs
react under a different disclosure conditions. The switch from mandatory to voluntary disclosure
means that newly listed companies have more flexibility to decide whether to provide earnings
forecast. We find a strong association between the demand for shares, as measured by the demand
multiple, and more accurate earnings forecasts during the voluntary regime. Finally, more closely
held firms provide more accurate forecasts.
After documenting an improvement in the accuracy of the earnings forecast for firms going
public during the voluntary disclosure period, we investigate the channel through which
improvements in the earnings forecasts translates into IPO underpricing. We find that IPOs with
accurate forecasts experience lower levels of underpricing. A further implication is that firms unable
to provide an accurate earnings forecast also underprice their issue – possibly in order to attract
6
investors. Collectively, our results support the view that the method by which management discloses
earnings forecast affects the properties of management earnings forecasts, because pessimism in the
mandatory regime is replaced by optimism during the voluntary regime. Moreover, the disclosure of
an earnings forecast during voluntary period allows firms to signal their quality. Our study implies
that an accurate management provided earnings forecast is highly valuable, particularly for firms who
aim to reduce information asymmetry with investors.
We further perform three complementary tests in order to provide evidence on the role of
increasing regulatory disclosure as a channel through which governmental intervention does not
translate into a superior or more accurate management earnings forecast. We first study the effect of
stock exchange imposed price limits on forecast accuracy. Daily limits on price variation were
imposed by the Athens Stock Exchange for the first time in 1992 and lasted until the end of the
decade. Although targeted at achieving general market stability, price limits had collateral
consequences for the early IPO aftermarket. Loughran, Ritter and Rydqvist (1994) have advanced the
conjecture that regulatory intervention appears to distort market function. In line with this, evidence
from the important process of market liberalization in China has also furnished clear signs that early
overregulation caused very serious market imperfections which abated as regulations were phased
out. We therefore expect that the accuracy of management provided earnings forecasts are inversely
related to excess regulatory interference for IPOs, as it does not allow IPOs to reach their equilibrium
price. This is exactly what we find using the price cap and cumulative limits on price increases as
measurements of regulatory intervention. More precisely, we report that the price cap phenomenon
across time is associated with increasing management forecast error.
Our second complementary test uses the change in regulations in the process of generating,
capturing, and recording investor demand for shares from the fixed offer mechanism to the book
building method as a shock to the management earnings forecast. Several papers have compared the
two methods in a theoretical setting and found that book building requires, on average, a lower
discount. Indeed, if information revelation is the key driver which will affect management’s ability to
provide an accurate forecast, then the reduction in information asymmetry will benefit earnings
forecast accuracy. Our results fail to confirm this intuition as we find that management earnings
forecasts deteriorate following the switch to the book building method of price discovery. A possible
explanation is that despite the narrowing of information gaps, reflecting better regulation, and
consistent with Chambers and Dimson (2009), any marginal benefit from better regulation,
disclosure, and certification were outweighed by other developments in the IPO market. Among such
developments are the deterioration of the level of trust between investors, issuers, and sponsors.

7
Consistent with the erosion of trust, investment banks have increased their market power and
managerial incentives have been realigned as IPO investment became more institutionalized.
Our third complementary test assesses the effect of institutional allocation on earnings
forecast accuracy as an excessively aggressive allocation policy might increase firm risk. In the US,
Rock’s (1986) winner’s curse theory is indirectly tested by several papers under the assumption that
institutional investors are better informed. Michaely and Shaw (1994) show that for IPOs with little
participation by institutional investors, there is less underpricing as investors know they are not
competing with informed investors. Aggrawal, Prabhala and Puri (2002) and Boehme, Boehme and
Fishe (2006) use data on the proportion of the issue that is allocated to institutional investors and
retail investors. They find that institutional investors receive a larger proportion of new issues in IPOs
that are more underpriced and earn more than retail investors, thereby largely avoiding ‘‘lemons’’ in
the IPO market. Amihud, Hauser and Kirsh (2003) document negative returns earned by uninformed
investors which means that their demand for new issues is, on average, too high. To assess whether
the institutional allocation drives our results, we regress earnings forecast errors on institutional
allocation once the management earning forecast was announced. In line with our expectations, we
uncover a positive relation between forecast error and excess institutional allocation. This provides
robust evidence that institutional investors heavily participate in low quality IPOs (i.e. using
management forecast error as a metric) as they expect they will be rewarded by underwriters for their
participation.
Overall, this study provides a comprehensive analysis which develops our knowledge of
management earnings forecast across diverse disclosure environments. Our findings shed light on a
number of issues that have not been addressed in the past. We examine the improvement of the
accuracy of earnings forecast following the introduction of a voluntary disclosure environment. In
particular, we uncover a trend in the forecast from pessimistic to optimistic after the regime change.
Additionally, we document the number of firms feeling confident to provide an earnings forecast in
their prospectuses after the regulatory change, the comparative characteristics which appears after the
creation of the mandatory and voluntary regime samples and the amendments IPOs have to make in
order to provide crucial information to investors. Our empirical framework simultaneously controls
for industry and year effects and unlike most previous studies which use contemporaneous variables,
the study explores other regulatory changes which took place in the same period and control for the
interconnections. The results have major implications on how financial market valuation affects
corporate actions and managerial behavior, in particular the managerial incentive to make accurate
forecasted earnings (see Teoh et al. (1998), Abarbanell and Lehavy, (2003), Fischer and Stocken
(2004), Gupta et al. (2008), Chi and Gupta (2009)).
8
The rest of the paper is organized as follows: section 2 presents the related literature review.
Section 3 provides the methodology and proceeds with the hypothesis development. Section 4
describes our sample while section 5 presents the findings of our empirical analysis. We present
further robustness checks of our results in Section 6 while in section 7 we explain how our results fit
in an international setting. Section 8 concludes the paper.
2. Theoretical Framework, Literature Implications and Institutional Background
There are few studies5 that examine the issues concerning the mandatory provision of a
forecast of earnings. The voluntary disclosure environment requires firms to weigh the costs and
benefits of providing an earnings forecast and then for investors to interpret this decision; while in the
mandatory disclosure environment all firm disclose an earnings forecast so it is up to the investor to
determine the reliability of that forecast. Therefore, compared to voluntary supplied forecasts, one
major distinction of mandatory disclosure is that it allows savvy investors to expose low quality IPOs
and separate them from promising firms. In general, the mandatory period in Greece for new firms to
provide management earnings forecasts provides a unique opportunity for the ongoing debate on the
usefulness of the management earnings forecasts in the market valuation of IPOs.
2.1 Theoretical Framework
The research on earnings forecasts have generally focused on forecasts disclosed by already
listed firms (e.g. Pownall and Waymire (1989), Ruland et al. (1990), Hutton et al. (2003)) while we
concentrate on the management profit forecast included in the IPO prospectus.
There have been a number of theories that shed light on the inefficiencies that exist in the IPO
market. Hughes (1986) notes the informational asymmetry between investors and the issuer of an
initial public offering concerning the value of the security. To avoid market failure, Hughes (1986)
suggests the issuer should make a disclosure about firm value that is verified by an investment
banker. She sets up a bivariate signaling model and derives testable implications from comparative
statics analysis. Consistent with Hughes (1986) bivariate signaling model, Li and McConomy (2004)
empirically test the substitution effect hypothesis and show that retained ownership and the provision
of management earnings forecasts are credible value-relevant signals. Their analysis indicates that the
manager’s choices of the earnings forecast and retained ownership signals are jointly determined after
controlling for other factors that affect each decision independently and that a substitution effect
exists among these managerial choices.
5 Jaggi (1993) document that in countries other than New Zealand, forecast information is disclosed in IPOs on a voluntary basis.
Voluntary disclosure countries include the UK, Australia, Singapore, and Korea.

9
Regulatory authorities mainly worry about the accuracy of forecasts included in the IPO
prospectuses. Accurate forecasting is a demanding task, especially when it is prepared by newly
established companies that lack historical data and prior experience. Also, forecasts are affected by
external factors that are out of the control of the firm such as currency exchange rates, political
climate, oil prices and inflation. Brown et al. (1987) report that the ex-ante uncertainty of the forecast
will increase by any sudden change in these external factors. Lee et al. (1993) report that managers
claim that changes in the external factors explains their failure to achieve the forecasted targets.
There is an extensive literature on the determinants of management absolute forecast error at
the time of IPOs but almost all of them are in commonwealth countries (Firth and Smith (1992); Jelic
et al. (1998); Cheng and Firth (2000) among others).6 Few prior studies have concentrated on the
forecast/non-forecast dichotomy and its relationship to future performance (Jaggi and Grier, (1980)).
Moreover, we are not aware of any existing study that investigates the association between mandatory
vs voluntary forecast disclosure and their associated earnings forecast error.
2.2 Management Earnings Forecast in a Voluntary Environment
In some countries, firms are allowed to voluntarily disclose earnings forecasts in their IPO
prospectuses. Karamanou and Vafeas (2005) report that the importance and usefulness of
management forecasts as a disclosure tool is likely to be determined by the incentives managers have
to protect shareholders. In deciding whether to issue a forecast, the management of every firm has to
weight the forecast costs against the forecast benefits. Other studies suggest several reasons why
earnings forecast can be beneficial to the firm.
Sami and Zhou (2004) reports that managers worry that inaccurate forecasts can lead to a
negative stock market reaction because investors can then view the firm as unstable and risky.
Trueman (1986) argues that accurate forecasts give investors a favorable assessment of the managers’
ability to anticipate economic events and thus translate into higher market values. Frankel et al.(1995)
provide evidence that management earnings forecasts aid the firm in eliciting funds from the capital
markets. Skinner (1994) propose that managers most probably will make a forecast to deliver bad
news to investors7.
Kasznik and Lev (1995) find that managers will provide a voluntary earnings forecast mainly
before a significant negative rather than a significant positive earnings surprise. Voluntary disclosure
6 Jaggi, (1997), Cheng and Firth, (2000), Hartnett and Romcke (2000) have examined the association between the forecast
accuracy and the firm’s characteristics such as the retained equity (REQ), auditor’s reputation (AUD) and size (SZ). The results of
these studies are mixed regarding the significance of some of the characteristics. 7 Skinner (1994) suggests that a bad news warning protects management against the potential danger of litigation and reduces
reputation costs.
10
theory8 supports this especially because managers have incentives to provide voluntary disclosure of
earnings forecast to reduce information asymmetry and the firm’s cost of external financing. Coller
and Yohn (1997) report that management forecasts are linked with information asymmetry among
investors and management, as captured by bid-ask spreads, whereas Clement et al. (2003) find that
uncertainty about future earnings decrease only when forecasts confirm market beliefs about the
earnings.
Kasznik (1999) and Gramlich and Sorensen (2004) indicate that managers who publish
earnings forecasts in the IPO year manage earnings to meet their reported forecasts. Thus voluntary
disclosure of earnings forecasts motivates managers to manipulate earnings during the year following
the public offering. Teoh et al. (1998) describe this behavior as opportunistic management earnings
forecast. Cormier and Martinez (2006) report that firms who voluntarily include earnings forecasts in
their offering prospectuses are expected to differ from non-forecasters in their level of earnings
management during the year following the public offering.
Dutta and Gigler (2002) and Call et al. (2009) model earnings forecasts as the manager’s
communication of the firm’s future cash flows. Dutta and Gigler (2002) show that it is easier to
prevent the manager from managing earnings if the earnings forecast is voluntary. They also show
that management earnings forecasts are more likely to provide high earnings forecasts than low
earnings forecasts. Similarly, Cormier and Martinez (2006) suggests that the magnitude of earnings
management is much higher for forecasters than for non-forecasters in the year following an IPO.
Karamanou and Vafeas (2005) document that the great majority of firms do not issue
forecasts because heightened disclosure entails costs as well as benefits. Costs mainly arise from the
disclosure of proprietary information to competitors and a greater risk of litigation, Levi (2008)9.
Francis et al. (1994) find that the risk of litigation is inversely related to the likelihood of issuing a
forecast whereas Bamber and Chen (1998) and Baginski et al. (2004) find that lower forecast
specificity is associated with litigation risk.
2.3 Regulatory Switch
By 2000, it was obvious that Greece would abandon the Drahma and join the Euro along with
many other countries of the European Union. This provided an opportunity for the Hellenic Capital
Market Commission to harmonize their regulations with other countries joining the new currency.
One of those regulations was the mandatory vs voluntary disclosure basis for prospectus forecasts. In
contrast to other countries in the Euro zone, Greece required disclosure of earnings forecasts in the
8 Voluntary disclosure theory mainly hypothesize that given the risk accompanying poor stocks and earnings performance,
managers rely in corporate disclosure to reduce the likelihood of undervaluation. 9 Levi (2008) report that voluntary disclosure in earnings is likely to follow higher investor demand for the information
11
IPO prospectus. Newly listed firms were complaining about compliance costs and about their
inability to provide accurate management earnings forecasts.10
The regulatory switch from mandatory to voluntary management earnings forecasts was
motivated by its supposed contribution to the efficient and cost-effective functioning of the capital
market. The protection of investors and the maintenance of confidence in the Greek financial market
were also important issues. This regulatory change was also intended to reinforce the freedom of
movement of capital in the internal market and to help small family companies to go public.
It is clear that the regulatory switch from mandatory to voluntary disclosure of management
earnings forecast was inspired by and looking forward to the introduction of the more strict
international accounting standards (IAS). IAS require three tests of any regulation, firstly that it meets
the basic requirement of the Council Directives, that is to say that its application results in a true and
fair view of the financial position and performance of an enterprise, secondly that, in accordance with
the conclusions of the Council of 17 July 2000, it is conducive to the European public good and
thirdly that it meets basic criteria as to the quality of information required for financial statements,
specifically that it is useful to users. It became clear that inaccurate forecasts under the mandatory
forecast regime would be a major problem for the trustworthiness of Greek IPOs.
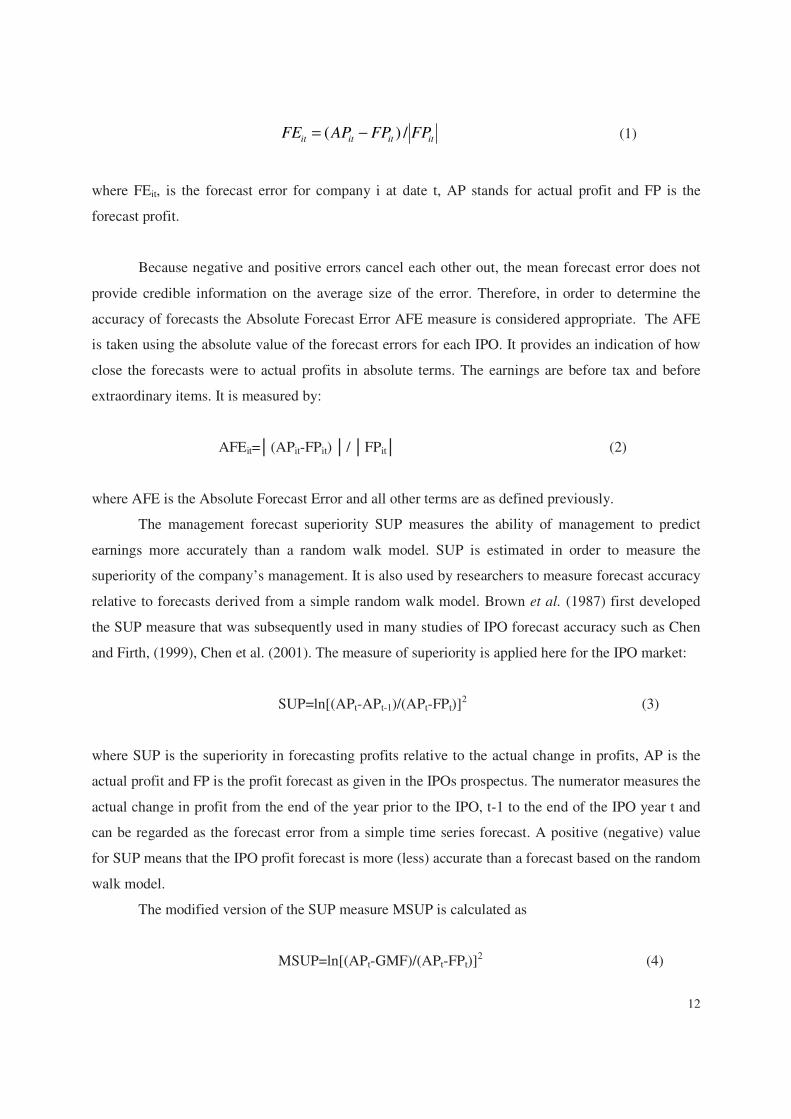
3 Methodology and Hypothesis Development
The forecast error measure reflects the difference between the actual and predicted figures for
the same time period. The forecast error measures (FE) evaluates the bias in the forecasts, which
mainly shows whether managers have been optimistic or pessimistic in their forecasts (see, e.g., Jaggi
(1997); Chan, (1996); Chen et al. (2001); Cheng & Firth (2000); and McGuinness (2005) and can be
calculated with or without the sign of the error. Self-selection theory addresses this issue and partially
explains why earnings forecasts are generally overoptimistic. McNichols et al. (1997) investigate the
relation between analysts’ recommendations and earnings forecast and find that there is selectively in
the analysts’ recommendations depending on whether information about a firm is favorable or
unfavorable. A positive value for the mean forecast error (MFE) implies that, on average, IPO
companies have a pessimistic bias (actuals are higher than IPOs forecasts) while a negative value for
MFE represents an optimistic bias (actuals are lower than IPOs forecasts).
The forecast error for the IPO’s is calculated as follows:
10
See Cox (1992) for additional discussion of compliance cost complaints.
12
itititit FPFPAPFE /)( −= (1)
where FEit, is the forecast error for company i at date t, AP stands for actual profit and FP is the
forecast profit.
Because negative and positive errors cancel each other out, the mean forecast error does not
provide credible information on the average size of the error. Therefore, in order to determine the
accuracy of forecasts the Absolute Forecast Error AFE measure is considered appropriate. The AFE
is taken using the absolute value of the forecast errors for each IPO. It provides an indication of how
close the forecasts were to actual profits in absolute terms. The earnings are before tax and before
extraordinary items. It is measured by:
AFEit=│(APit-FPit) │/ │FPit│ (2)
where AFE is the Absolute Forecast Error and all other terms are as defined previously.
The management forecast superiority SUP measures the ability of management to predict
earnings more accurately than a random walk model. SUP is estimated in order to measure the
superiority of the company’s management. It is also used by researchers to measure forecast accuracy
relative to forecasts derived from a simple random walk model. Brown et al. (1987) first developed
the SUP measure that was subsequently used in many studies of IPO forecast accuracy such as Chen
and Firth, (1999), Chen et al. (2001). The measure of superiority is applied here for the IPO market:
SUP=ln[(APt-APt-1)/(APt-FPt)]2 (3)
where SUP is the superiority in forecasting profits relative to the actual change in profits, AP is the
actual profit and FP is the profit forecast as given in the IPOs prospectus. The numerator measures the
actual change in profit from the end of the year prior to the IPO, t-1 to the end of the IPO year t and
can be regarded as the forecast error from a simple time series forecast. A positive (negative) value
for SUP means that the IPO profit forecast is more (less) accurate than a forecast based on the random
walk model.
The modified version of the SUP measure MSUP is calculated as
MSUP=ln[(APt-GMF)/(APt-FPt)]2 (4)

13
where the growth model forecast GMF is measured as GM= APt-1(APt-1- APt-3)1/2.
3.1 Research Design and development of Hypothesis.
As outlined in the literature review, there are a variety of factors that affect earnings-forecast
behavior. Accordingly, we select several variables and explain a number of influences to construct
hypotheses concerning the behavioral response to the change in regulatory regime. A central
hypothesis concerning the regulatory change from a mandatory to a voluntary disclosure regime is
that earnings forecasts in the prospectuses of IPOs improve.
A. Comparability Effect
A major potential benefit of the global move towards the reform of public company
accounting is the increase in accounting comparability. Prior studies suggest that adopting voluntary
disclosure regulations leads to an improvement in the information environment (Ashbaugh and Pincus
(2001); Bae et al. (2008)). In contrast, recent studies investigating the effect of mandatory adoption
on the accuracy of forecasts have produced inconclusive results. More recent evidence, especially
Byard et al. (2001), suggest that after IFRS was adopted, forecast accuracy for some European and
Australian firms improved. (see, e.g., Byard et al. (2011); Tan et al. (2011)).
Daske et al. (2008 ) directly test comparability in the context of financial reporting adoption
and report more pronounced capital market benefits for firms that voluntarily adopt financial
reporting. Other studies (see, e.g., Beneish, Miller, and Yohn (2012 ); Cascino and Gassen (2013) and
Brochet et al., (2013)) argue and find that cultural, political, and business differences continue to
impose significant obstacles to increasing the comparability of accounting information. Specifically,
earlier studies report that accounting comparability does not improve for those subject to mandatory
adoption relative to a control group of non-adopters and conclude that there is little evidence that
IFRS adoption increases comparability.
We expect the properties of the management forecast to differ under the mandatory and
voluntary regime. Given the choice, a firm’s disclosure decision is often a result of weighing the
benefits of disclosure against the costs, including revealing proprietary information in a competitive
market and providing a significant effort to generate accurate projections of future earnings, such as
communicating clear strategies to divisional managers, carefully budgeting internal expenses, and
analyzing large amounts of external information. The benefits associated with disclosure include a
lower cost of capital as a result of improved transparency. Managers who issue forecasts because they
are compelled to do so may exert less effort to predict future earnings than managers who are
motivated by a desire to provide timely and accurate information to market participants. Managers
14
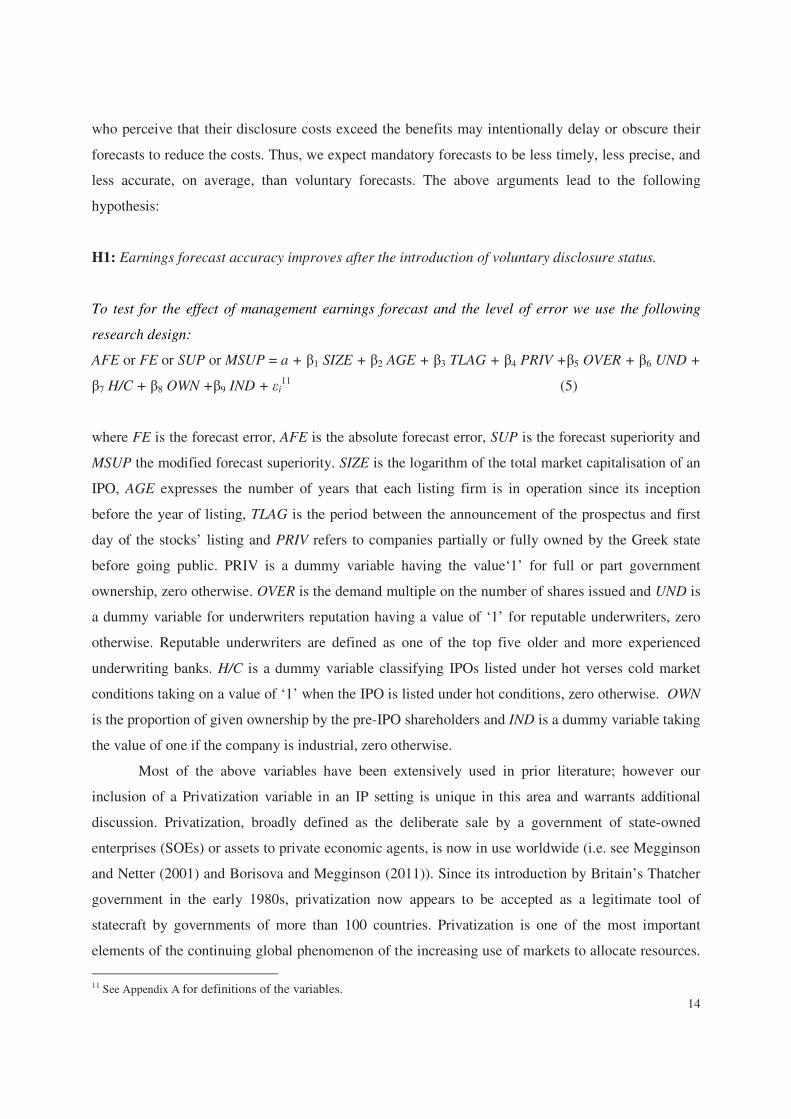
who perceive that their disclosure costs exceed the benefits may intentionally delay or obscure their
forecasts to reduce the costs. Thus, we expect mandatory forecasts to be less timely, less precise, and
less accurate, on average, than voluntary forecasts. The above arguments lead to the following
hypothesis:
H1: Earnings forecast accuracy improves after the introduction of voluntary disclosure status.
To test for the effect of management earnings forecast and the level of error we use the following
research design:
AFE or FE or SUP or MSUP = a + β1 SIZE + β2 AGE + β3 TLAG + β4 PRIV +β5 OVER + β6 UND +
β7 H/C + β8 OWN +β9 IND + εi11
(5)
where FE is the forecast error, AFE is the absolute forecast error, SUP is the forecast superiority and
MSUP the modified forecast superiority. SIZE is the logarithm of the total market capitalisation of an
IPO, AGE expresses the number of years that each listing firm is in operation since its inception
before the year of listing, TLAG is the period between the announcement of the prospectus and first
day of the stocks’ listing and PRIV refers to companies partially or fully owned by the Greek state
before going public. PRIV is a dummy variable having the value‘1’ for full or part government
ownership, zero otherwise. OVER is the demand multiple on the number of shares issued and UND is
a dummy variable for underwriters reputation having a value of ‘1’ for reputable underwriters, zero
otherwise. Reputable underwriters are defined as one of the top five older and more experienced
underwriting banks. H/C is a dummy variable classifying IPOs listed under hot verses cold market
conditions taking on a value of ‘1’ when the IPO is listed under hot conditions, zero otherwise. OWN
is the proportion of given ownership by the pre-IPO shareholders and IND is a dummy variable taking
the value of one if the company is industrial, zero otherwise.
Most of the above variables have been extensively used in prior literature; however our
inclusion of a Privatization variable in an IP setting is unique in this area and warrants additional
discussion. Privatization, broadly defined as the deliberate sale by a government of state-owned
enterprises (SOEs) or assets to private economic agents, is now in use worldwide (i.e. see Megginson
and Netter (2001) and Borisova and Megginson (2011)). Since its introduction by Britain’s Thatcher
government in the early 1980s, privatization now appears to be accepted as a legitimate tool of
statecraft by governments of more than 100 countries. Privatization is one of the most important
elements of the continuing global phenomenon of the increasing use of markets to allocate resources.
11 See Appendix A for definitions of the variables.
15
The Greek government, in its effort to minimise state ownership and its desire to raise capital,
conducted many privatization IPOs during 1994-2002 period. We expect that the more control a state
has on a firm at the time it goes public (privatizations), the greater the accuracy of the forecast, and
the lower the forecast error.
Of course, one potential reason for the change in accuracy after the introduction of voluntary
earnings forecasts in IPO prospectuses is that firms self-select whether or not they disclose an
earnings forecast. This choice is unlikely to be random as firms will base their decision on a variety
of factors. For example, firms with high information asymmetry might choose to issue an earnings
forecast in an attempt to reduce the asymmetry. Conversely, firms where the cost of issuing a forecast
might be relatively higher due to their smaller size or firms where the forecast is likely to be less
accurate (e.g. younger firms with less earnings history or firms in non-industrial industries) are
expected to be less likely to disclose an earnings forecast. To address this issue we develop and
estimate the following probit model of disclosure choice:
Disclosure_Choice = a + β1 SIZE + β2 AGE + β3 TLAG + β4 PRIV +β5 OVER + β6 UND + β7 H/C +
β8 OWN +β9 IND + εi (6)
Where Disclosure_Choice has the value of 1 if the firm included an earnings forecast in their IPO
prospectus (and is otherwise 0) and all of the other variables are as described above.
B. Sentiment Effect
Investor sentiment can be defined as investor opinion, usually influenced by emotion. It has
more impact in developed than developing countries (Chang et al. (2012)). Higher quality legal and
corporate governance environments intensifies the sentiment effect (Schmeling (2009). Interpreting
sentiment as the propensity to speculate, Baker & Wurgler (2006) find that sentiment increases the
relative demand for stocks whose earnings forecast are subjective, are vulnerable to speculation and
whose contemporaneous returns are higher than is justifiable. Specifically, small stocks, extreme
growth stocks, distressed stocks, young stocks and non-dividend-paying stocks, should be the most
difficult to provide accurate earnings forecast, therefore, the most vulnerable to investor sentiment.
Sentiment expressed as a result of optimism or pessimism in forecast earnings will be uniform and
therefore independent of the disclosure regime. Thus we hypothesize that:
H2: The optimistic/pessimistic earnings forecasts during the mandatory disclosure era do not change
after the switch to the voluntary disclosure era.

16
C. Regulatory Effect
Leuz and Wysocki (2008) suggests that to justify its existence, regulations must function as a
low-cost commitment device for preventing market failures. Arguments suggesting as well as casting
doubt on the net benefit of regulation are well documented, and the extant empirical evidence is
largely mixed (see Healy and Palepu, (2001); Shleifer, (2005); Hail and Leuz (2006); Mulherin,
(2007); Zingales, (2009)). Despite this voluminous literature, very little is known about the efficacy
of regulatory reforms in emerging economies (Leuz and Wysocki, 2008). Baker and Wurgler [(2006),
(2007)] report that a regulatory intervention in the form of restriction on daily variation may produce
a ‘cooling off’ effect so that overall underpricing will be moderated. Baker and Wurgler (2006) argue
that higher information asymmetry intensifies the appearance of investor sentiment. If early investor
sentiment, whether spontaneous or managed by underwriters, is responsible for earnings forecast
accuracy (or some portion thereof), it is plausible that its manifestation will be hampered by limits on
price variation.
H3: Other regulatory and governance reforms (i.e. price cap, green shoe, book building) are
positively related to the level of the earnings forecast error.
D. Information effect
Champers and Dimson (2009) document a narrowing of information gaps, reflecting better
regulation and disclosure as well as the benefits of certification. However, they suggest that any
marginal benefit from better regulation, disclosure, and certification are being outweighed by other
developments in the IPO market. Amongst other developments, there is the deterioration in the level
of trust between investors, issuers, and sponsors. This has a direct effect on the level of underpricing
because in spite of improvements in regulation and disclosure, the prestige of IPO underwriters is
increasing. Consistent with the erosion of trust, investment banks are increasing their market power,
managers’ incentives are being realigned as investment is becoming more institutionalized, and
winner’s curse is exacerbated as investors are becoming more heterogeneous.
The purpose of a mandatory earnings forecast is to supply investors with useful information
that they would not otherwise receive. Despite the fact that the mandatory earnings forecast certainly
increases the quantity of information, we expect that the accuracy of forecasts will decline. The
rationale is that mandatory forecasts, in many occasions, are provided by management who are unable
to provide an accurate forecast or are unwilling to do so as it would reveal too much proprietary
information. Whether investors view mandatory forecasts as useful is an empirical issue.
17
Furthermore, it is unclear whether or not investors can distinguish the quality of the earnings forecast
at the time of the IPO or do they have to wait until the earnings announcement post-IPO to determine
the quality of the forecast. If investors are able to discern the quality in advance of the earnings
announcement then we would expect the earnings quality to be related to the IPO pricing.
Alternatively, a lack of a market reaction to underpricing in the mandatory forecast regime would cast
doubt on the effectiveness of the forecast, the ability of investors to infer the quality of the forecast, or
both. Therefore we hypothesize:
H4a: Underpricing is lower over time following the transformation from mandatory to voluntary
earnings forecasts.
H4b: Companies with high forecast error are associated with a high level of underpricing.
Consistent with Daske et al. (2008), we control for the impact of potentially confounding
events using IPOs that do not provide an earnings forecast as our control sample. Any change in
forecast accuracy for non-providers will likely reflect the impact of concurrent economic and
regulatory changes.
An extended version of the previous model including additional control variables is the
following:
AFE or FE or SUP = a + β1 SIZE + β2 AGE + β3 TLAG + β4 PRIV +β5 OVER + β6 UND + β7 H/C +
β8 OWN +β9 IND + β10 MAR+ β11 RET + β12 NUIPO + β13 MAIR + β14 BB + β15 PC + β16 PR + β17
GS+ β18 CLU + β19 InAl + εi (7)
where RET is the quarterly market rate of return divided by the overall quarterly average, NUIPO is
the quarterly number of IPOs divided by the average number of IPOs in all quarters, MAIR is the
return to investors at the end of the first day of trading adjusted by the returns on the market and BB is
a dummy variable that takes on the value of ‘1’ if the IPO was sold via book building, zero otherwise.
Book-building is the process of generating, capturing, and recording investor demand for shares
during an IPO in order to support efficient price discovery. PC is a dummy variable that takas on the
value of ‘1’ if the IPO is subject to a price limit of ±8%. IPOs were listed on the ASE with a price cap
limitation of ±8% during Nov. 1993 – Nov. 1996 period. GS is a dummy variable that tales on the
value of ‘1’ if the IPO was subject to a Green Shoe regulation, zero otherwise. Green Shoe is an
overallotment allocation that allows underwriters to short sell shares in a registered securities
offering at the offering price. CLU or Consecutive Limit Up is the number of Consecutive Limit
18
Up's an IPO has achieved as a result of the Price Cap Limit and finally, InAl is the percentage of
shares allocated to institutional investors during the public offering process.
4. Sample and Data
The sample consists of 306 IPOs that occurred during the January 1st, 1993 to December
31st, 2014 time period.12 A great effort was made to collect the data relating all the firms listed on the
Athens Stock Exchange (ASE) during this period except for insurance and investment companies.
Thus, a variety of sources are used to make sure we have the maximum amount of information.
Specifically, accounting data is from Compustat, the returns of firms are from DataStream and
specific control variables are from Thomson FSDC. Forecast earnings for the IPO year t are also
retrieved from the IPO prospectus and from the official statistical Bulletin of the ASE. Actual
earnings are manually collected from the first published annual report. We confirm most of the
professional databases information with hand collected information from prospectuses, annual reports
and publicly available financial statements, as we would like to verify the accuracy of our data. Stock
prices, market returns and the Athens Stock Exchange General Index (ASEGI) are retrieved from the
ASE database. IPO share prices, ASEGI prices and the corresponding returns are collected for the
first three years of trading (765 trading days) subsequent to the IPO. Appropriate adjustments are
made for stock splits and stock dividends. Firms are included in the sample if the following items are
available: a prospectus, financial statements for the year prior to the offering and stock prices for at
least 36 months or 756 trading days following the IPO for all years except for an IPO listed during
2009 where we have a minimum of 504 trading days following the listing.
Historical accounting information is derived from published financial statements at the end of
fiscal year t–1 prior to the IPO year t. The institutional framework is well described in the Greek
Presidential Decree No. 348 of 1985 and can be seen in Ghicas et al. (2000). Information related to
variables that can affect the earnings forecast such as market capitalization of the IPOs at the IPO
date, operating history of the firm prior to going public, the time period between the offer price day
and the first day of trading, the demand multiple of the number of shares issued and the proportion of
retained ownership by the initial shareholders, is from the IPO prospectus.
Table 1 Panel A lists the sample’s 306 IPOs by year and by mandatory and voluntary
disclosure regime. For the first eight years of our sample, Greek IPOs are obliged to provide earnings
forecasts while since 2001 forecasted earnings are provided voluntarily. Of the total sample of 86
IPOs issued during the voluntary period, 25 IPOs chose not to provide an earnings forecast. We can
12
There is no waiting list for firms scheduled to go public in the A.S.E.
19
confirm that no IPOs were listed on the Athens Stock Exchange in the years 2008, 2010, 2011, 2012,
2013 and 2014, most likely as a result of the global financial crisis.
In contrast to U.S. firms that they are less likely to provide earnings forecast in the
corresponding US voluntary disclosure environment, 100% of Greek IPOs issue forecasts during the
mandatory forecast regime, compared with 70.9% of firms during the voluntary regime. We find that
following the voluntary reporting regime, the average age of firms going public and choosing not to
provide earnings forecasts drop from 17.29 to 5.92 years, thereby providing an initial signal that
young, immature companies choose to omit this information.
[Please Insert Table 1 About Here]
Table 1 Panel B provides summary statistics for 281 IPOs that have an earnings forecast
figure in their prospectuses. Prior to the IPO, firms have an average (median) total market
capitalization of €42.6 million (€33.3 million) and an average (median) age of 17.2 years (14 years)
by the year of listing. The time lag between the announcement of the prospectus and first day of the
stocks’ listing averages (median) 29.7 days (28 days) while the demand multiple relative to the
number of shares issued averages (median) 91.5 times (25 times). The proportion of given ownership
by the initial shareholders is on average 20%.
Table 1 Panel C provides summary statistics for the 25 IPOs that selected not to provide an
earnings forecast during the voluntary period. Amongst other characteristics, IPOs choosing not to
disclose an earnings forecast are considerably smaller - with average (median) total market
capitalization of €31.6 million (€28.5 million) - than the total sample of firms and are much younger
at the time they go public with an average (median) age of 5.82 years (4 years).13 The much lower
demand multiple average (median) of 5.08 (2.58) compared to all firms that provide an earnings
forecast indicates the lower level of investors’ interest for these IPOs.
The summary statistics of forecast errors, absolute forecast errors, and forecasting superiority
measures, are in Table 2. The means, medians and standard deviations of errors are broken down by
mandatory and voluntary disclosure environments. The mean (median) forecast error for the total
sample is 3.66 (-0.38%)14. The positive mean indicate that, on average, the forecast profits are less
13
In contrast the average (median) age of the 61 IPOs that elected to provide an earnings forecast during the voluntary period is
20.16 years (14 years). This is a point that we will return to in section 5. 14 The mean forecast error for the total sample in the Greek case is substantially less than the comparable statistics from Australia
(Lee et al. (1993) and Hartnett and Romcke (2000)), Canada, Pedwell et al. (1994), China, Chen and Firth (1999) and New
Zealand, Firth and Smith, (1992) but similar to the errors reported in Hong Kong (Chan et al. (1996), Jaggi (1997), Cheng and
Firth (2000), Chen et al. (2001), Malaysia, Jelic et al. (1998), Singapore, Firth et al. (1995), Thailand, Firth and Lonkani (2005))
and in UK, (Keasey and McGuinness (1991)).

20
than the actual and so the forecasts are pessimistic. Breaking down the mean forecast error by
mandatory and voluntary environments, the results reveal a positive mean of 8.65% for IPOs
providing an earnings forecast during the mandatory period and a negative mean of -9.58% for IPOs
providing a forecast of earnings during the voluntary period. This tells us that firms are very
conservative when compelled to provide a forecast and therefore actual profit are typically higher
than forecast. Once the disclosure environment turns voluntary, Greek IPOs behave more liberally
and the forecast error sign typically changes indicating more optimistic forecasts. This gives great
support to the self-selection theory, which in part states that earnings forecasts during voluntary
periods are generally overoptimistic. It also opposes hypothesis H2 which claims that there should be
no change in level of optimism or pessimism of the earnings forecasts as the regulatory regime
changes from mandatory to voluntary disclosure. Interestingly, we note that in both cases the average
forecast error is below ±10% which is one of the lowest ever reported in an international study.
However the picture is different when we examine the absolute forecast error (AFE). The
mean (median) AFE for the total sample is 39.72% (31.03%), much larger than the mean forecast
error. The mean AFE for the total sample is more than the errors reported in Hong Kong (Chan et al.
(1996), Jaggi (1997), Cheng and Firth (2000), Chen et al. (2001)), Malaysia (Jelic et al. (1998)),
Singapore (Firth et al. (1995)) the UK, (Keasey and McGuinness (1991)) and is similar to China
(Chen and Firth (1999)) and Thailand (Firth and Lonkani (2005)) but less than the comparable
statistics from Australia (Lee et al. (1993)), Canada (Pedwell et al. (1994)) and New Zealand (Mak
(1989), Firth and Smith (1992)).
[Please Insert Table 2 About Here]
Negative values are observed for the means and medians of the SUP scores. Voluntary
disclosure IPOs experience lower SUP and MSUP scores than mandatory disclosure IPO’s, but
nevertheless they still have positive signs for MSUP. The MSUP means are larger than the SUP
means suggesting that the growth model is a less accurate benchmark for assessing management’s
ability to forecast accurately than the pure random walk model. Finally, the MSUP score for
mandatory forecasts is significantly larger than the MSUP score for voluntary forecasts. The
correlation matrix of the above variables is presented in Table 3.
[Please Insert Table 3 About Here]
21
5. Empirical Analysis: Mandatory vs Voluntary Period listed Public Offerings
The regression results for all 281 firms that provide a forecast appear in table 4. For each
disclosure regime (mandatory, voluntary and overall sample) we run four regressions, one each for
absolute forecast error, forecast error, superiority of management forecasts and superiority of
management forecasts adjusted for growth of earnings. All twelve regressions are well specified and
statistically significant at conventional levels. Adjusted R2 are sometimes low15 but for the mandatory
sample of IPOs they are similar to the related literature and are somewhat higher for IPOs with
voluntary earnings forecast disclosure. The models are estimated using robust standard errors.
[Please Insert Table 4 About Here]
The size control variable is positive for the mandatory earnings forecast and for the total
sample of IPOs implying that larger companies have higher forecast errors. In contrast, the size
coefficient for IPOs that voluntarily provide an earnings forecast is negative, suggesting that larger
companies have lower forecast errors. All size coefficients for the AFE regressions are statistically
significant. In other words, we find compelling evidence that larger firms provide more accurate
forecasts under the voluntary earnings forecast regime and more inaccurate forecasts under the
mandatory regime. Our results are in line with Firth-Smith (1992) for New Zealand, Jaggi (1997) for
Hong Kong, Firth and Lonkani (2005) for Thailand companies and opposite to Chen et al. (2001) for
Hong Kong and Cormier and Martinez (2006) for French companies. The results of other studies,
such as Firth et al. (1995) for Singapore and Harnett and Romcke (2000) for Australian companies
find no significant association between company size and forecast accuracy.
Company age has the expected negative sign and for the AFE regressions, it is highly
significant, for our total sample and for the mandatory disclosure environment. This indicates that
companies with a long operational history before listing have lower forecast errors indicating that the
accuracy of their profit forecasts are comparatively high. The sign of the coefficient is consistent with
the results of some earlier studies that show a significant association between forecast accuracy and
company’s age e.g. Jaggi (1997) and Jelic et al.(1998). The results of earlier studies for China, Chen
and Firth, (1999) and Hong Kong companies, Chen et al. (2001) did not show any significant
association between accuracy and the company’s age. The results of this study are interpreted to mean
that Greek companies that are in existence for a longer time can expect to have more accurate
15
The adjusted R2s are quite similar to studies on earnings forecast. Chen and Firth (1999) report poor explanation power of
between 6.6 percent and 1.8 percent. Chen et al. (2001) obtains R2s of 1.6 percent (AFE), 11.5 percent (SUP) and 9.3 percent
(MSUP). A third study by Firth and Lonkani (2005) obtains an R2 of 2 percent.
22
forecasts than younger companies. These findings are in accordance with Jaggi (1997) and could
reflect the enthusiasm of younger companies in providing an over optimistic picture of future
performance and thus inaccurate forecasts. Another explanation could be that companies with more
experience have a better knowledge of the market environment and have better control over their
operations compared to younger companies.
The time lag variable for all Greek IPOs that provide an earnings forecast is positive as
expected and in the case of the AFE regression for the overall sample, the coefficient is statistically
significant. Therefore, companies make more accurate predictions when the time period between the
offer price and first day of trading is comparatively short. The positive sign of our time lag coefficient
is in accordance with previous studies for time horizon which shows a significant relation between
‘TIME’ of forecast and forecast accuracy, e.g. Firth, et al. (1995) for Singapore companies, Jaggi
(1997) for Hong Kong companies and Chen and Firth (1999) for Chinese companies. However, Chan
et al. (1996) and Cheng and Firth (1999) for Hong Kong and Jelic et al. (1998) for Malaysia find no
significant association between time and forecast accuracy for Hong Kong companies.16 Our results
indicate that forecast accuracy improves with shorter time lags. The significant AFE coefficient for
the overall sample supports the view that Greek companies with shorter time lags will have more
accurate IPO forecasts.
The result for privatization is unexpectedly positive indicating that privatized firms
experience higher absolute forecast error. The sign is statistically significant in the case of the AFE
regression under the mandatory reporting environment. Obviously, our finding does not provide
support to the proposition that privatized companies tend to provide more accurate forecasts. Instead,
it appears as though newly privatized firms behave as if they were young companies without much
experience in the newly privatized environment and so provide inaccurate earnings forecasts,
especially when forced to do so under the mandatory earnings forecast regime.
The over subscription (demand multiple) variable is unexpectedly positive. The coefficients
are statistically significant in many cases, particularly for the voluntary disclosure environment and
the overall sample. The positive coefficients suggest that companies with greater investor demand
experience higher average forecast errors meaning that their forecasts are less accurate. This does not
confirm our expectation that investors express greater demand for shares of IPOs with greater
earnings accuracy. Instead, the direction of the errors seems to be the operative influence because for
the overall period, the FE coefficients are statistically significant at the 5% level. This positive
association between IPO share demand and forecasts of earnings that are too low suggests that
16
Also Firth and Smith (1992) did not report any significant association between forecast accuracy and forecast
horizon for New Zealand companies

23
investors can detect when the company is too pessimistic or conservative in their earnings forecasts
and so increase the demand for the shares.
The company’s underwriter reputation variable has the expected sign for the full sample of
IPOs that provide earnings forecasts with the coefficient for the AFE regression significant at 1%
level. This result supports the view that IPOs forecast accuracy is higher if a “Big-Five” underwriter
advises the company going public. The results of earlier studies sometimes find an association
between forecast accuracy and the company’s underwriter. Cheng and Firth (2000) report that IPOs
underwritten with reputable underwriters are associated high forecast error for Hong Kong
companies. However, just one year later, Chen et al. (2001) could not find any association between
forecast accuracy and the company’s underwriter for the same market. Chen and Firth (1999) and Jog
and McConomy (2003) also could not find any association between underwriter reputation and
forecast accuracy for Chinese and Canadian companies respectively. Therefore our results confirm
the findings of earlier studies in that underwriter reputation is important, but we find that employing
reputable underwriters increases rather than decreases earnings forecast accuracy.
The coefficient for market condition H/C (Hot or cold) is positive only for the voluntary
disclosure environment. Furthermore, while the FE coefficient is statistically significant at the 5%
level, the AFE coefficient is not significant. This suggests that the errors during ‘hot’ market
conditions are caused by forecasts that are too conservative. Moreover the SUP coefficient is also
significantly negative at the 1% level clearly indicating that management could reduce these forecast
errors by merely extrapolating from the past. This suggests that management is understating their
forecast earnings during ‘hot’ market conditions. Overall, these results suggest that for voluntary
disclosures during ‘hot’ market conditions firms provide conservative and therefore inaccurate
earnings forecasts.
The company’s given ownership variable is negative for all three sets of AFE regressions and
are statistically significant in the cases of voluntary disclosure. However, the MSUP for voluntary and
SUP for mandatory disclosures are also significantly negative, clearly indicating that management
provides forecasts that are inferior to a simple extrapolation from past earnings. Overall, the results
confirm that the larger the portion of the firm sold via IPO the more accurate and credible are the
earnings forecasts, especially when earnings forecasts are voluntary, thereby supporting the
substitution effect hypothesis discussed in section 2.1. We interpret this result to mean that when a
large portion of the firm is sold via IPO, management makes some effort to provide accurate earnings
forecasts in an attempt to encourage demand for their shares. Thus managers’ choices of the earnings
forecast and given ownership signals are jointly determined after controlling for other factors that

24
affect each decision independently, and that a substitution effect exists between managers’ choices of
the two signals.
The MSUP coefficients suggest that there is some room for improvement in these
management forecasts. Interestingly, this relation is not statistically significant for mandatory
disclosures suggesting that forcing firms to provide earnings forecasts when they are unwilling or
unable to provide an accurate forecast could obscure this relation. The direction of the coefficients is
consistent with the findings of some previous studies that have shown a significant positive
association between forecast errors and a high portion of retained ownership. The results by Cormier
and Martinez (2006) for France show a significant positive association between forecast errors and a
high proportion of retained ownership. Jelic et al. (1998) for Malaysia did not find any association
between retained equity and forecast error. Contrary to their own hypothesis and our results, Chen
and Firth (1999) for China and Chen et al. (2001) for Hong Kong report the percentage of shares sold
to the public has an unexpected positive sign in explaining AFE.
We interpret the significantly negative given ownership variable to mean that Greek
companies that sell a large piece of their capital will provide more accurate forecasts, especially when
they have the choice to do so, than IPOs that decide to sell just a small proportion. An explanation
could be that companies that sell a large share of their capital are more anxious than companies that
retain a large proportion of their ownership to achieve a successful IPO so they make an effort to
acquire a better understanding of market conditions and invest more money to get a better picture of
their accounts.
The industry control AFE coefficients for all three sets of regressions are of the expected sign
and the coefficient for IPOs that have to provide earnings forecasts are statistically significant. The
positive coefficients suggest that industrial firms make less accurate profit forecasts. However, we
find that the industry control variable is positive and significant under the voluntary regime for the
SUP and MSUP regressions suggesting that when industrial firms are allowed to voluntarily provide
an earnings forecast they are able to make a forecast that is more accurate than a simple random walk
or geometric growth average extrapolation from past results. The sign of the coefficients is consistent
with the findings of earlier studies that show a significant association between forecast error and the
company’s industrial classification. The results by Jelic et al. (1998) for Malaysia show significant
association between industrial IPOs and forecast errors. They also report that unexpected industry
activity appears to be a useful proxy for forecasting errors. Finally Chan et al. (1996), Jaggi (1997)
and Chen et al. (2001) for Hong Kong and Chen and Firth (1999) for China do not find any
association between industrial classification and forecast error.
25
[Please Insert Table 4 About Here]
To capture the effect of mandatory vs voluntary earnings forecast, we propose the 'mandatory'
variable, which separates those IPOs that were forced to provide earnings forecast during the listing
period with those that voluntarily decided to announce their expected earnings. Specifically, in the
case where the issuer is uncertain about future operations, there is the option under the voluntary
regime to avoid announcing a forecast of earnings whereas in the case where the issuer has clear
understanding of the operations and the returns on investment, the company can make a forecast of
earnings.
Table 5 presents the results for this analysis. In specification (1) the mandatory coefficient is
positive and statistically significant at the 1% level. This result confirms our prediction that absolute
forecast error among public offerings will increase when the earnings forecast is mandatory.
Moreover, in specification (2) we run the same analysis for forecast error and the coefficient on the
'mandatory' variable is again positive and significant at the 1% level. Overall, the results imply that
the disclosure of a forecast of earnings in a mandatory regime provides more, but not necessarily
more useful information to investors as the accuracy of the information is suspect.
[Please Insert Table 5 About Here]
In order to shed further light on the relationship between the earnings forecast and the level of
underpricing in the immediate aftermarket, we investigate the impact of forecast accuracy by
employing the market adjusted initial returns of the new listed firm as the dependent variable. If IPOs
have lower levels of forecast error and have a wider access to investors, then it is plausible that
merely providing the forecast itself can signal the quality of the IPO. Table 6 reports the results. In
both specifications (1) and (2) we incorporate the absolute forecast error as the main control variable
for the whole sample and for those firms which provide mandatory earnings forecast. Note that AFE
carries a positive and significant coefficient at the 10% significance level in specifications (1). In
economic terms, having a large forecast error increases the likelihood of underpricing by 12.23% over
our sample average. Overall, the results of this analysis add further support to our hypothesis that
firms with higher forecast error are more likely to be associated with higher levels of underpricing.
[Please Insert Table 6 About Here]
26
5.1. Endogeneity Control
It is possible that our results can be affected by endogeneity so we apply 2SLS, with the probability
of providing a forecast as the dependent variable in the reduced form equation, and the absolute
forecast error as the dependent variable in the structural form equation. Table 7 shows the results for
this analysis. In the reduced model (1) our time lag instrument is highly statistically significant and
carries the expected coefficients. In the structural equation (2) the variable of provide forecast error
PFE, is statistically significant at the 5% level. Additionally, in the second lower panel of Table 7 the
results from the Hausman endogeneity test shows that the forecast error is endogenous to our model.
Therefore, we correct for endogeneity for the earnings forecast by including the PFE in our structural
regressions. Overall, the findings support our hypothesis of an inverse association between absolute
forecast error and providing a forecast of earnings.
[Please insert Table 7 about here]
We further employ a two-step treatment effect model which we estimate via a maximum
likelihood and the two-stage least squares method. The first stage equation is a probit regression that
estimates the probability of forecast error based on specific independent variables and the second
stage estimates the effect of forecast error on market adjusted initial returns. To estimate this model
we require an instrument that is correlated with the variable that is considered endogenous but has no
effect on the outcome. We construct the variable ‘provide forecast earnings’ in order to satisfy the
required identification restriction. This variable identifies the IPOs that are able to announce an
earnings forecast in their prospectus. We argue that public offerings that have been able to provide an
earnings forecast are of better quality.
Table 8 presents the output of this inquiry. Interestingly, we observe that after controlling for
the endogenous nature of underpricing, companies listed during the mandatory period are now
significantly related to absolute forecast error AFE at the 10% level. Similarly, forecast error FE
appears to significantly decline (at the 1% level) during the voluntary period. The results show that
the degree of forecast error is significantly smaller for firms that provide earnings forecast during the
voluntary period. The estimated coefficients of Mand1Vol0 are negative across two columns with
MAIR as treatment effect in Table 8. The results are consistent with the information revelation theory
and suggest that voluntary status reduce information asymmetry between the issuer and informed
investors. As for the control variables, the more uncertainty regarding the firm value, the more
chances an unrepeatable underwriters will lead in the process. Consistent with this conjecture, we find

27
that less reputable underwriters are associated with larger forecast error. To the extent that issues
traded on parallel (secondary) market and companies listed during the cold period are riskier, they
have significantly larger degree of inaccurate earnings forecast. In addition, the coefficient of the
TLAG is significantly positive.
[Please insert Table 8 about here]
6. Further Robustness Checks
In the previous analysis, we provided evidence of the impact of regulations on the disclosure
and on the accuracy of an earnings forecast in IPOs when the disclosure environment changes from a
mandatory to voluntary disclosure setting. We discover that new listed companies which provide an
earnings forecast after the switch to voluntary disclosure are more likely to provide an accurate
forecast, while we document the opposite for companies which are obliged to provide an earnings
forecast under the mandatory regulatory regime. In this section, we offer additional auxiliary tests to
check the validity of our findings.
6.1 Self-Selection Bias Control
Heckman (1979) argues that self-selection produces a specification error that leads to biased
estimators; and proposes a two stage method to control for it. Earlier in our preliminary discussion,
we report significant differences in the mean of specific characteristics of IPOs among firms that are
forced to provide an earnings forecast under the mandatory regime and those that select to voluntarily
provide their expected earnings under the voluntary regime. Therefore, we employ the two-stage
Heckman method in order to determine whether selection bias is affecting our results. As with the
treatment effect estimation model, we employ the variable ‘Market adjusted initial returns’ to run the
first stage probit regressions. This variable as shown in Table 9 is always significant at the 5% level
across all types of qualifications indicating that, as we expect, IPO-firms with high levels of forecast
error are likely to experience high levels of underpricing. We extract the inverse Mills ratio from the
first stage and include it in the second stage regressions. The coefficient of the Inverse Mills Ratio is
always found to be insignificant which means that selection bias is most likely not affecting our
results.
[Please insert Table 9 about here]

28
6.2 Price Cap and Management Earnings Forecast (Continues Limit Ups)
In order to shed further light on the relationship between voluntary and mandatory disclosure
environments and earnings forecast accuracy, we investigate the impact of other regulatory changes
that took place during our sample period. Baker and Wurgler (2006) argue that higher information
asymmetry intensifies the appearance of investor sentiment. If early investor sentiment, whether
spontaneous or managed by underwriters, is responsible for earnings forecast accuracy (or some
portion thereof), it is plausible that its manifestation will be hampered by limits on price variation.
Thus, we create the dummy variable price cap that is 1 for firms listed with a price cap, and 0
otherwise. Note that the price limit regulations were operative only during the mandatory regime.
Table 10 reports the results.
In specification (1) we incorporate the price cap PC control variable to explain the level of
forecast error FE and in specification (7) we include the control variable continuous limit ups CLU.
This variable is the number of times the price cap limit was applied for a given IPO. In both
specifications, the coefficients of price cap and continuous limit ups are positive and significant at the
10% level. In economic terms, going public with a restriction on daily variation increases the level of
error of the earnings forecast during the mandatory disclosure period. Overall, the result of this
analysis adds further support to our hypothesis that the obligation to provide earnings forecasts drive
firms to forecast inaccurately.
[Please Insert Table 10 About Here]
6.3 Returns and Management Earnings Forecast
Consistent with the above analysis we examine the relation between management earnings
forecast and the returns to investors. Our main variable of interest is the market adjusted initial return
and the control variables are the same as above. The results are interesting as they indicate a positive
relation between highly underpriced IPOs and management earnings forecast error with a significant
coefficient at the 5% significance level. This result has a strong economic significance as it indicates
that investors are able to distinguish between good and bad companies prior to listing and they require
higher returns for lower quality firms that are unable to provide accurate earnings forecasts. Other
metrics which we employ to account for returns include RET (i.e. quarterly market rate of return
divided by the average return across all quarters) in specification (2). Consistent with our prediction,
the higher the rate of return, the larger the forecast error at the 1% significance level. The significance
disappears when we concentrate on IPOs listed under the voluntary disclosure environment.
29
[Please Insert Table 11 About Here]
6.4 Bookbuilding and Management Earnings Forecast
Next, we test the relation between the management earnings forecast and the book building
mechanism, the process of generating, capturing, and recording investor demand for shares during an
Initial Public Offering (IPO) (see Cornelli and Goldreich [(2001; 2003)]; Sherman and Titman
(2002); Derrien and Womack, (2003); Busaba and Chang (2010)). In specification (6), which
explores only IPOs listed under the mandatory disclosure environment, the bookbuilding mechanism
is positive and significant at the 1% significance level, and in specifications (8) and (9), which
comprises IPOs listed under the voluntary disclosure environment, the bookbuilding is also positive
and significant at the 1% significance level. That is, companies which select the book building
mechanism to go public experience high forecast error. Overall the results support our hypothesis that
regulatory and governance reforms (i.e. price cap, green shoe, book building) adversely affects the
earnings forecast.
7. Discussion
A. Why do pessimistic earnings forecasts during the mandatory era turn optimistic in the
voluntary period?
A natural question that arises from our findings is why there is a change in the bias of earnings
forecasts following the change of forecast regime. We argue that forecast behavior is not homogenous
across the two disclosure environments.
The disclosure of corporate forecasts of projected annual earnings has been a topic of
intensive debate within the investment community during the years 1970-75 (Patel 1976). Questions
of accuracy, objectivity, independent certification, and investment utility have been examined from a
number of theoretic and pragmatic viewpoints. Most of these inquiries appear to assume that an
investor's beliefs and/or actions may be affected by the disclosure of a management forecast and
several researchers explore the possible rewards and sanctions that a firm may experience as a result
of forecast accuracy.
Our view on management behavioral change is that, initially, it is the aftermarket uncertainty
surrounding the company's future operations that lead many issuers to understate their earnings
forecasts during the mandatory regime and to provide conservative (pessimistic) earnings forecasts.
Those managers facing uncertain future operations choose not to disclose earnings forecast during the
voluntary period thereby allowing more optimistic views to dominate. This confirms the self-

30
selection theory stated by McNichols and O’Brien (1997) regarding the coverage decisions as it
indicates that issuers with a relatively pessimistic view–compared to other issuers–are more reluctant
to issue their earnings forecasts, and as a result they tend to defer revealing their earnings forecasts
until later in the forecasting period.
B. How generalizable are the results from this relatively small country to settings in
larger countries?
The Greek market has been underestimated for decades due to its relative small size and
peripheral location. The recent European sovereign debt crisis indicates that Greece has a dynamic
market and that events taking place there have a significant impact on the European and Global
markets. An important fact, not well known to the public, is that Greek companies are highly exposed
to countries in South-eastern Europe having investments totalling more than €15 billion Euros in the
area. Greek entrepreneurs are among the pioneers and claim the role of key regional players,
especially in Bulgaria, Romania, Serbia and Turkey where Greek businesses are among the three
largest foreign investors17. Thus Greece does not stand alone in the world arena but has an important
regional presence in an area containing more than 100 million people.
Further, following the general election in October 2009, the then new elected government
in Greece announced a revised 2009 budget deficit forecast of 12.7 percent of GDP—more than
double the previous estimate of 6.0 percent. The Greek fiscal accounts for previous years were
also revised to show significantly larger deficits. These adverse developments were reflected in
rising spreads on the nation’s sovereign bonds with Greece being the first country to be shut out
of the bond market. Recent Greek economic events that affect the world stage includes the
destabilization of the Euro in comparison with other currencies, the corresponding domino effect
which was created and affected by many more Mediterranean countries and the rising value of
precious and industrial metals to historical high levels. In this political arena the triumph of
Angela Merkel in the German Elections in 2013 has been mainly driven by her actions on the
Greek Sovereign Debt Crisis.
17 The markets of Romania, Turkey, Bulgaria, Serbia and Albania, where the Greek banks are activated, present a challenge for
Greek bankers because of their strong growth rates. In such a high-growth environment it comes as no surprise that the National
Bank, Alpha Bank, Eurobank and Piraeus Bank will seek to consolidate their presence in the region during the next few years, in
order to become major players in a market with a population of more than 100 million, including Turkey.

31
8. Conclusion
The main purpose of this study is to provide, for the first time, a direct comparison between
IPOs that were obliged to provide an earnings forecast in their prospectuses with those that were
allowed to voluntarily disclose an earnings forecast. We find that earnings forecast accuracy increases
following the introduction of voluntary disclosure but still perhaps not to the level that would satisfy
regulators and investors. This behavioral change implies that managerial confidence increases under
the voluntary regime resulting in higher and more accurate figures in the earnings forecast.
The voluntary disclosure mechanism allows twenty-four out of a total sample of eighty one
Greek IPOs to avoid disclosing earnings forecast information for reasons such as a lack of confidence
in their ability to forecast, poor income expectations, prohibitively high proprietary costs and high
costs of acquiring information. For those that do voluntarily provide earnings forecasts, we find that
younger firms with a long time lag between the forecast and the IPO issue date provides inaccurate
forecasts. Errors decrease with the age of the issuing firm, the size of the issue and the shorter time
lag between forecast and IPO issue dates.
Four metrics are employed to model earnings forecast accuracy and reveal differences
between the mandatory and voluntary earnings forecast regimes. Large IPOs that must provide
earnings forecasts experience higher absolute forecast errors while those that voluntarily announce
earnings forecasts experience lower errors. We interpret this as, under the voluntary regime, larger
firms that can provide accurate forecasts do so while firms that are unable to provide a reliable
forecast chose not to disclose. Moreover the age and the privatization variables indicate that
inexperienced companies have difficulties in providing earnings forecasts as they obtain larger errors
than older and private companies. These three instances of self-selection could explain why the
absolute earnings forecast errors decrease under the voluntary regime.
Demand multiples are positively related to forecast errors under the voluntary disclosure
regime. Examining this coefficient for the combined sample we discover that it is the direction of the
forecast errors rather than the level which is the operative influence. Together, these findings suggest
that investors can detect when the company is being too conservative in their earnings forecasts and
so increase the demand for the shares. The last finding indicates an opportunity for improving the IPO
market for uninformed investors. If IPOs choose to make a greater effort and provide more accurate
figures, they will reduce the cost of information for uninformed investor’s thereby increasing demand
for their initial share offering. Further, we are in the position to document a perverse inverse relation
between ‘hot’ market conditions and forecast errors under the voluntary disclosure environment. The
direction of the errors seems to be operative influence suggesting that during the voluntary
32
disclosure period when market conditions are ‘hot”, firms understate earnings forecasts to avoid
the possibility of disappointing investors.
Overall, forecast errors decrease on average during the voluntary regime as firms that choose
to disclose earnings forecast are more accurate. This is especially evident for large firms and for IPOs
that need to sell a large portion. However, that does not prevent firms from manipulating their
forecasts by deliberately understating their forecasts when they wish to signal the quality of their IPO,
noticeably so when market conditions are ‘hot’. These results suggest that allowing for a voluntary
disclosure of earnings forecasts is a good idea which benefits young firms that otherwise would have
difficulties in providing private information directly to the capital market. On the basis of these
findings we conclude that earnings forecasts disclosed in the prospectuses of Greek IPOs are reliable
to a large extent. Stock exchange directors appear to have made a good decision by changing the
regulations from a mandatory to a voluntary earnings disclosure as there is a reduction in the level of
absolute forecast error. Investment banks should encourage newly listed companies to provide
earnings forecast information in their prospectuses as voluntary disclosure contributes to the
transparency of market operation and minimizes information asymmetry.
In response to the questions raised in the introduction, the finding of this study indicates that
earnings forecast improve after the change of the disclosure environment from a mandatory to
voluntary regime. This is mainly attributed to the 30% of IPOs that chose to forego announcing
earnings forecast due to low confidence and ability to disclose an accurate forecast. Surprisingly,
pessimistic forecasts during the mandatory era turn optimistic in the voluntary era revealing a change
to more liberal management behavior. Our results have also important corporate policy implications.
Given the magnitude of the forecast, initial public offering managers should put particular emphasis
on improving forecast accuracy to benefit their stakeholders. In particular, our findings imply that
managers of new issues should avoid being too optimistic during the voluntary era and target an
optimum level of accuracy.
References
Abarbanell, J., and R. Lehavy, 2003, Biased forecasts or biased earnings? The role of earnings management in explaining apparent
optimism and inefficiency in analysts' earnings forecasts, Journal of Accounting and Economics 36, 105-146.
Aerts, W., and D. Cormier, 2009, Media legitimacy and corporate environmental communication. , Accounting, Organizations and Society
34, 1-27.
Aggarwal, R. , N. Prabhala, and N. Puri, 2002, Institutional allocation in initial public offering: Empirical evidence, Journal of Finance 57,
1421-1442.
Amihud, Y., S. Hauser, and A. Kirsh, 2003, Allocations, adverse selection, and cascades in IPOs: Evidence from the tel aviv stock exchange,
Journal of Financial Economics, 68, 137-158.
Ashbaugh, H., and M. Pincus, 2001, Domestic accounting standards, international accounting standards, and the predictability of earnings,
Journal of Accounting Research 39, 417-434.
Baber, W., S. Chen, and S.H. Kang, 2006, Stock price reaction to evidence of earnings management: Implications for supplementary
financial disclosure, Review of Accounting Studies 11, 5-19.
Bae, K., H. Tan, and M. Welker, 2008, International GAAP differences: The impact on foreign analysts, The Accounting Review 83, 593-628.
33
Baginski, S., J. Hassell, and M. Kimbrough, 2004, Why do managers explain their earnings forecasts, Journal of Accounting Research 42, 1–
29.
Baker, M., and J. Wurgler, 2006, Investor sentiment and the cross-section of stock returns Journal of Finance 61, 1645-1680.
Baker, M., and J. Wurgler, 2007, Investor sentiment in the stock market, Journal of Economic Perspectives 21, 129-152.
Ball, R., and L. Shivakumar, 2008, Earnings quality at initial public offerings, Journal of Accounting and Economics 45, 324–349.
Bamber, L., and Y. Cheon, 1998, Discretionary management earnings forecast disclosures: Antecedents and outcomes associated with
forecast venue and forecast specificity choices, Journal of Accounting Research 36, 167–90.
Beatty, R., 1989, Auditor reputation and the pricing of IPO's, Accounting Review 64, 693-709.
Beatty, R., and J. Ritter, 1986, Investment banking, reputation, and the underpricing of initial public offerings, Journal of Financial
Economics 15, 213-232.
Beneish, M.D., B.P. Miller, and T.L. Yohn, 2012 The effect of IFRS adoption on cross-border investment in equity and debt markets,
Working paper, Indiana University.
Boehmer, B., E. Boehmer, and R. Fishe, 2006, Do institutions receive more favorable allocations in IPOs with with better long run return?,
Journal of Financial and Quantitative Analysis 41, 809-828.
Borisova, G., and W. Megginson, 2011. Does Government Ownership Affect the Cost of Debt? Evidence from Privatization, Review of
Financial Studies 24, 2693-2737
Brochet, F., A. D. Jagolinzer, and E. J. Riedl, 2013. Mandatory IFRS adoption and financial statement comparability, Contemporary
Accounting Research 30, 1373-1400.
Brown, P., G. Richardson, and J. Schwager, 1987, An information interpretation of financial analyst superiority in forecasting earnings,
Journal of Accounting Research 15, 49-67.
Butler, M., A. Kraft, and I.S Weiss, 2007, The effect of reporting frequency on the timeliness of earnings: The cases of voluntary and
mandatory interim reports, Journal of Accounting and Economics, 43(2), 181-217.
Busaba, W., and C. Chang, 2010, Bookbuilding vs. Fixed price revisited: The effect of aftermarket trading, Journal of Corporate Finance 16,
370-381.
Byard, D., Y. Li, and Y. Yu, 2011, The effect of mandated ifrs adoption on analysts’ forecast errors, Journal of Accounting Research 49, 69-
96.
Call, A., S. Chen, and Y. Tong, 2009, Are analysts’ earnings forecasts more accurate when accompanied by cash flow forecasts?, Review of
Accounting Studies 14, 358-391.
Cascino, S., and J. Gassen, 2015, Mandatory IFRS adoption and accounting comparability, Review of Accounting Studies 20, 242-282.
Chambers, D., and E. Dimson, 2009, IPO underpricing over the very long run, Journal of Finance 64, 1407-1443.
Chan, A, S. Cora, T. Millie, Wong D., and Chan R., 1996, Possible factors of the accuracy of prospectus earnings forecasts in Hong Kong,
International Journal of Accounting 31, 381-398.
Chang, Y.Y., R. Faff, and C.-Y. Hwang, 2012, Local and global sentiment effects, and the role of legal, information and trading, Working
Paper.
Chen, G., and M. Firth, 1999, The accuracy of profit forecasts and their roles and associations with IPO firm valuations, Journal of
International Financial Management and Accounting 10, 202-226.
Chen, G., M. Firth, and G. Krishnan, 2001, Earnings forecast errors in IPO prospectuses and their associations with initial stock returns,
Journal of Multinational Financial Management 11, 225-240.
Cheng, Q., and T.D. Warfield, 2005, Equity incentives and earnings management, The Accounting Review 80, 441-476.
Cheng, T., and M. Firth, 2000, An empirical analysis of the bias and rationality of profit forecasts published in new issue prospectuses,
Journal of Business Finance & Accounting 27, 423-446.
Chi, J., and M. Gupta, 2009, Overvaluation and earnings management Journal of Banking and Finance 33, 1652-1663
Ciconte, W., M. Kirk, and J. Tucker, 2014. Does the midpoint of range earnings forecasts represent managers’ expectations, Review of
Accounting Studies 19, 628-660.
Clarkson, P., A. Donoth, G. Richardson, and S. Sefcik, 1992, The voluntary inclusion of earnings forecasts in IPO prospectuses,
Contemporary Accounting Research 8, 601-626.
Clarkson, P., and D. Simunic, 1994, The association between audit quality, retained ownership, and firm-specific risk in U.S. Vs. Canadian
IPO markets, Journal of Accounting and Economics 17, 207-228.
Clarkson, P.M., Y. Li, G.D. Richardson, and F.P. Vasvari, 2008, Revisiting the relation between environmental performance and
environmental disclosure: An empirical analysis, Accounting, Organizations and Society 33, 303-327.
Clement, M., R. Frankel, and J. Miller, 2003, Confirming management earnings forecasts, earnings uncertainty, and stock returns., Journal
of Accounting Research 41, 653–79.
Coller, M., and T. Yohn, 1997, Management forecasts and information asymmetry: An examination of bid-ask spreads, Journal of
Accounting Research 35 181-191.
Cormier, D., and I. Martinez, 2006, The association between management earnings forecasts, earnings management, and stock market
valuation: Evidence from French IPOs, International Journal of Accounting 41, 209-236.
Cornelli, F., and Goldreich D., 2003, Bookbuilding: How informative is the order book?, Journal of Finance 58, 1415-1443.
Cornelli, F., and D. Goldreich, 2001, Bookbuilding and strategic allocation, Journal of Finance 56, 2337-2369.
Daske, H., L. Hail, C. Leuz, and R. Verdi, 2008 Mandatory ifrs reporting around the world: Early evidence on the economic consequences,
Journal of Accounting Research 46, 1085-1142.
Datar, S., G. Feltham, and T. Hughes, 1991, The role of audits and audit quality in valuing new issues, Journal of Accounting and Economics
14, 3-50.
Dechow, P., W. Ge, and C. Schrand, 2010, Understanding earnings quality: A review of the proxies, their determinants and their
consequences, Journal of Accounting & Economics 50, 344-401.
Derrien, F., and K. Womack, 2003, Auction vs book-building and the control of underpricing in hot IPO markets, Review of Financial
Studies 16, 31-61.
Dutta, S., and F. Gigler, 2002, The effect of earnings forecasts on earnings management, Journal of Accounting Research 40, 631-655.
Firth, M., B. Kwok, Liau-Tan C., and G. Yeo, 1995, Accuracy of profit forecasts in IPO prospectus, Accounting and Business Review 2, 55-83.
Firth, M., and R. Lonkani, 2005, The accuracy of IPO earnings forecasts in thailand and their relationships with stock market valuation,
Accounting and Business Research 35, 269-286.
Firth, M., and A. Smith, 1992, The accuracy of profits forecasts in initial public offerings prospectuses, Accounting and Business Research
22, 239-247.
34
Fischer, P. , and P. Stocken, 2004, Effect of investor speculation on earnings management, Journal of Accounting Research 42, 843-870.
Francis, J., D. Philbrick, and K. Schipper, 1994, Shareholder litigation and corporate disclosures, Journal of Accounting Research 32, 137–
64.
Frankel, R., M. McNichols, and G.P. Wilson, 1995, Discretionary disclosure and external financing, Accounting Review 70, 135-150.
Ghikas, D., A. Papadaki, G. Siougle, and T. Sougiannis, 2008, The relevance of quantifiable audit qualifications in the valuation of IPOs,
Review of Accounting Studies 13, 512-550.
Gramlich, J., and O. Sorensen, 2004, Voluntary management earning forecasts and discretionary accruals: Evidence from Danish IPOs,
European Accounting Review 13, 235-259.
Guidry, R.P., and D.M. Patten, 2012, Voluntary disclosure theory and financial control variables: An assessment of recent environmental
disclosure research, Accounting Forum 36, 81-90.
Gupta, M., I. Khurana, and R. Pereira, 2008, Legal enforcement, short maturity debt, and the incentive to manage earnings, Journal of Law
and Economics 51, 619–639.
Hail, L., and C. Leuz, 2006, International differences in the cost of equity capital: Do legal institutions and securities regulation matter? ,
Journal of Accounting Research 44, 485-531.
Healy, P., and K. Palepu, 2001, Information asymmetry, corporate disclosure, and the capital markets: A review of the empirical disclosure
literature, Journal of Accounting and Economics 31, 405-440.
Healy, P., Hutton A.P., and K. Palepu, 1999, Stock performance and intermediation changes surrounding sustained increases in disclosure,
Contemporary Accounting Research 16, 485-520.
Heckman, J., 1979. Sample selection bias as a specification error, Econometrica 47, 153-161.
Hirst, E.D., L. Koonce, and S. Venkataraman, 2007, How disaggregation enhances the credibility of management earnings forecasts, Journal
of Accounting Research 45, 811-837.
Horton, J., G. Serafeim, and I. Serafeim, 2013, Does mandatory ifrs adoption improve the information environment, Contemporary
Accounting Research 30, 388-423.
Hughes, P., 1986, Signalling by direct disclosure under asymmetric information, Journal of Accounting and Economics 8, 199-242.
Hutton, A., G. Miller, and D. Skinner, 2003, The role of supplementary statements with management earnings forecast, Journal of
Accounting Research 41, 867-890
Jaggi, B., 1980, Further evidence on the accuracy of management forecasts vis-a-vis analysts forecasts, The Accounting Review 55, 96-101.
Jaggi, B., 1997, Accuracy of forecast information disclosed in the IPO prospectuses of Hong Kong companies, International Journal of
Accounting 32, 301-319.
Jelic, R., B. Saadouni, and R. Briston, 1998, The accuracy of earnings forecast in IPO prospectuses on the kuala lumpur stock exchange
1984-1995, Accounting and Business Research 29, 57-72.
Jennings, R., 1987, Unsystematic security price movements, management earnings forecasts, and revisions in consensus analyst earnings
forecasts, Journal of Accounting Research 25, 90-110.
Jog, V., and B. McConomy, 2003, Voluntary disclosures of management earnings forecast in IPOs and the impact on underpricing and post
- issue return performance, Journal of Business Finance & Accounting 30, 125-167.
Karamanou, I., and N. Vafeas, 2005, The association between corporate boards, audit committees, and management earnings forecasts: An
empirical analysis, Journal of Accounting Research 43, 453-486.
Kasznik, R., 1999, On the association between corporate voluntary disclosure and earnings management, Journal of Accounting Research
37, 58-81.
Kasznik, R., and B. Lev, 1995, To warn or not to warn: Management disclosures in the face of an earnings surprise, The Accounting Review
70, 113–34.
Keasey, K., and P. McGuiness, 2008, Firm value and its relation to equity retention levels, forecast earnings disclosures and underpricing
initial public offerings in Hong Kong, International Business Review 17, 642-662.
Kothari, S.P., X. Li, and J. Short, 2009, The effect of disclosures by management, analysts, and business press on cost of capital, return
volatility, and analyst forecasts: A study using content analysis, The Accounting Review 84, 1639-1670.
Kross, W. J., B. T. Ro, and I. Suk, 2011. Consistency in meeting or beating earnings expectations and management earnings forecasts,
Journal of Accounting and Economics 51, 37-57.
Lee, I., N. Taylor, C. Yee, and M. Yee, 1993, Prospectus forecast earning: Evidence and explanations australia, Australian Accounting Review
3, 21-32.
Leone, A., S. Rock, and M. Willenborg, 2007, Disclosure of intended use of proceeds and underpricing in initial public offerings, Journal of
Accounting Research 45, 1081-1114.
Leuz, C., D. Nanda, and P. Wysocki, 2003, Earnings management and investor protection: An international comparison, Journal of Financial
Economics 69, 505-527.
Leuz, C., and P. Wysocki, 2014, Economic consequences of financial reporting and disclosure regulation: A review and suggestions for
future research Working Paper, University of Chicago.
Levi, S., 2008, Voluntary disclosure of accruals in earnings press releases and the pricing of accruals, Review of Accounting Studies 13, 1-
21.
Li, Y., and B. McConomy, 2004, Simultaneous signaling in IPOs via management earnings forecasts and retained ownership: An empirical
analysis of the substitution effect, Journal of Accounting, Auditing and Finance. 19, 1-28.
Loughran, T., J. Ritter, and K. Rydqvist, 1994, Initial public offerings: International insights, Pacific-Basin Finance Journal (An update is
available on Jay Ritter’s web site) 2, 165-199.
McGuinness, P. B., 2005, A re-examination of the disclosure of discretionary earnings forecasts: The case of initial public offerings in Hong
Kong, Quarterly Bulletin, Summer 10–31.
McNichols, M., and P. O'Brien, 1997, Self selection and analyst coverage, Journal of Accounting Research 35, 167-199.
Megginson, W.L., and J.M. Netter, 2001. From state to market: A survey of empirical studies on Privatization, Journal of Economic
Literature 39, 321-389.
Michaely, R, and W. Shaw, 1994, The pricing of initial public offerings: Tests of adverse-selection and signaling theories, Review of
Financial Studies 7, 279-319.
Mulherin, J.H., 2007, Measuring the costs and benefits of regulation: Conceptual issues in securities markets, Journal of Corporate Finance
13, 421-437.
Pedwell, K., H. Warsame, and D. Neu, 1994, The accuracy of canadian and new zealand's earnings forecasts: A comparison of voluntary vs
compulsory disclosures, Journal of International Accounting, Auditing and Taxation 3, 221-236.
35
Pownall, G., C. Wasley, and G. Waymire, 1989, Alternative forms of management earnings forecasts: Incidence and stock prices effects,
Accounting Review 68, 896-912.
Ritter, J., and I. Welch, 2002, A review of IPO activities, pricing and allocation, Journal of Finance 57, 1795-1828.
Rock, K., 1986, Why new issues are underpriced, Journal of Financial Economics 15, 187-212.
Ruland, W., S. Tung, and N. George, 1990, Factors associated with the disclosure of managers forecast, Accounting Review 65, 710-721.
Sami, H., and H. Zhou, 2004, Do auditing standards improve the accounting disclosure and information environment of public companies?
Evidence from the emerging markets in china, International Journal of Accounting 39, 403-427.
Schmeling, Maik, 2009, Investor sentiment and stock returns: Some international evidence, Journal of Empirical Finance 16, 394-408.
Scott, T.W., 1994 Incentives and disincentives for financial disclosure: Voluntary disclosure of defined benefit pension plan information by
canadian firms, Accounting Review 94, 26-43.
Sherman, A., and S. Titman, 2002, Building the IPO order book: Underpricing and participation limits with costly information, Journal of
Financial Economics 65, 3-29.
Shleifer, A., 2005, Understanding regulation, European Financial Management 11, 439–451.
Skinner, D., 1994, Why firms voluntarily disclose bad news, Journal of Accounting Research 32, 38-60.
Tan, H., S. Wang, and M. Welker, 2011, Analyst following and forecast accuracy after mandated IFRS adoptions, Journal of Accounting
Research 49, 1307-1357.
Teoh, S., T. Wong, and G. Rao, 1998, Are accruals during initial public offerings opportunistic?, Review of Accounting Studies.
Trezevant, Robert., 1992, Debt financing and tax status: Test of the substitution effect and the tax exhaustion hypothesis using businesses’
responses to the economic recovery tax act of 1981, Journal of Finance 47, 1557-68.
Trueman, B., 1986, Why do managers voluntarily release earnings forecast?, Journal of Accounting and Economics 8, 53-71.
Verrechia, R., 2001, Essays on disclosure, Journal of Accounting and Economics 32, 97-180.
Zingales, L., 2009, The future of securities regulation, Journal of Accounting Research 47, 391-425.

36
Appendix A. Variable Definitions
Variable Definition
Panel A: Measures of Earnings Forecast
Absolute Forecast Error
Absolute Forecast Error. Measures the relative deviation of actual earnings (published in the Annual
Report) from forecast earnings (announced in the prospectus of the firm). It is based on forecast of the next
annual earnings.
Forecast Error The percentage difference between earnings announced in the first annual report of the firm with the
earnings forecast as this has been announced in the prospectus.
Superiority
Superiority of forecasting profits (SUP) relative to the actual changes in profits. Management forecast
superiority measures the ability of management to anticipate earnings more accurately than time series
models.
Market Adj. Initial Returns
Returns to investors in the end of first day of trading adjusted with the returns of the market. Raw initial
returns (RIR) are adjusted for market changes taking into account the Athens Stock Exchange General
Index (ASEGI) between the offer price closing date and the end of first day of trading.
Panel B:IPOs Characteristics
Size of the IPO Market capitalization measured by the log of the total number of outstanding shares after the IPO
multiplied by price per share.
Age of the IPO Age of the firm starting from the year of its establishment until the year it goes public.
Time Lag Period between the announcement of the prospectus and first day of the stocks’ listing.
Privatizations Companies owed by the State before going public. State sells part of its holdings on those companies in the
market.
Oversubscription Oversubscription on the number of shares issued.
Underwriter Reputation Dummy variable: 1 for reputable underwriters (major banks), 0 otherwise
Hot/Cold Classifies IPOs listed under hot market conditions with a dummy value ‘1’ and IPOs listed under cold
market conditions with a ‘0’
Market Classification Dummy variable: 1 if an IPO is listed in Main Market and ‘0’ if listed in Parallel or New Market.
Herfindahl Index The Herfindahl index (HHI) is a measure of the size of firms in relation to the industry and an indicator of
the amount of competition.
Share Overhang Proportion of given ownership (OWN) during the going public process
Industry classification Dummy variable: 1 for industrial classified companies, 0 otherwise.
Panel C: Market Characteristics
RET Quarterly market rate of return divided by overall quarterly average.
NUIPO Quarterly number of IPOs divided by the average number of IPOs in all quarters.
Institutional Allocation The percentage of shares allocated to institutional investors during the public offering process.
Green Show Green Shoe or overallotment allows underwriters to short sell shares in a registered securities offering at
the offering price.
Bookbuilding Book-building is the process of generating, capturing, and recording investor demand for shares during an
IPO in order to support efficient price discovery.
Consecutive Limit Ups The number of Consecutive Limit Up's an IPO has achieved as a result of the Price Cap Limit.
Panel D: Price Limit Characteristics
Price Cap ±8% Dummy variable: 1 IPOs listed with a price cap limitation of ±8%, otherwise 0
Cap ±8%: IPOs listed in ASE with a price cap limitation of ±8% during Nov. 1993 – Nov. 1996 period.
Price Cap ±99% Dummy variable: 1 IPOs listed with a price cap limitation of ±99%, otherwise 0
Cap ±99%: IPOs listed in ASE during Dec 1996 to Dec. 1999 period.
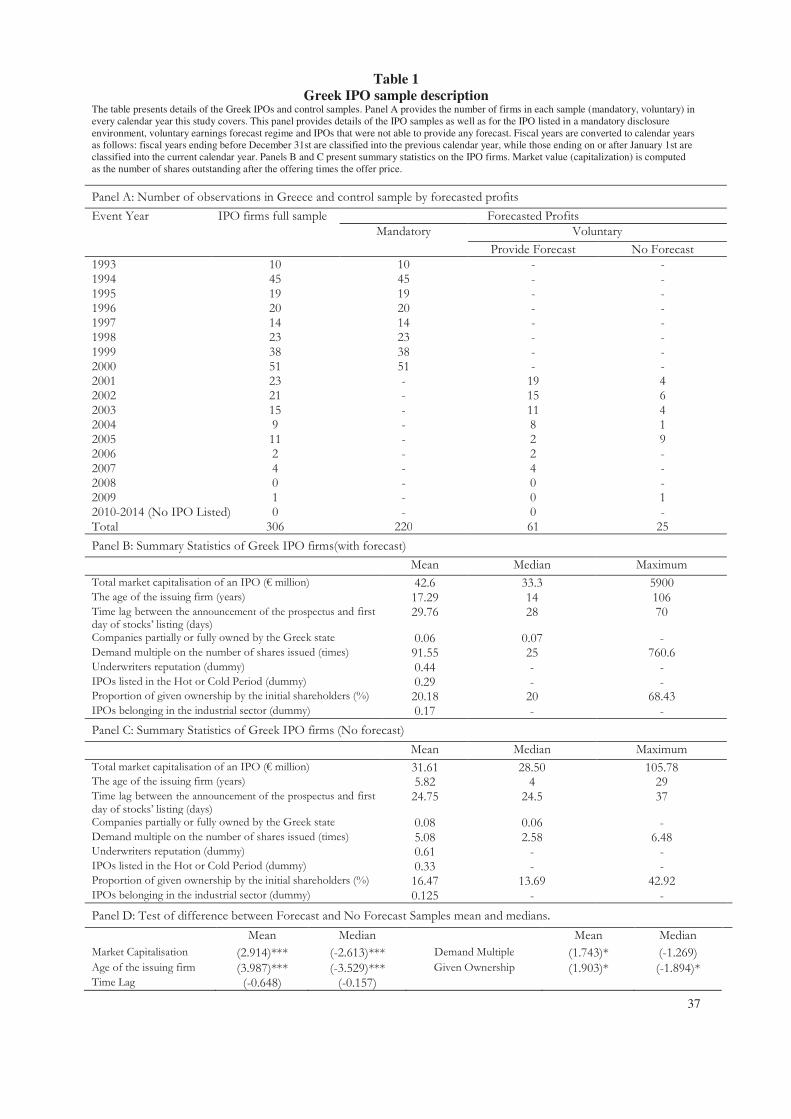
37
Table 1
Greek IPO sample description The table presents details of the Greek IPOs and control samples. Panel A provides the number of firms in each sample (mandatory, voluntary) in
every calendar year this study covers. This panel provides details of the IPO samples as well as for the IPO listed in a mandatory disclosure
environment, voluntary earnings forecast regime and IPOs that were not able to provide any forecast. Fiscal years are converted to calendar years
as follows: fiscal years ending before December 31st are classified into the previous calendar year, while those ending on or after January 1st are
classified into the current calendar year. Panels B and C present summary statistics on the IPO firms. Market value (capitalization) is computed
as the number of shares outstanding after the offering times the offer price.
Panel A: Number of observations in Greece and control sample by forecasted profits Event Year IPO firms full sample Forecasted Profits Mandatory Voluntary Provide Forecast No Forecast 1993 10 10 - - 1994 45 45 - - 1995 19 19 - - 1996 20 20 - - 1997 14 14 - - 1998 23 23 - - 1999 38 38 - - 2000 51 51 - - 2001 23 - 19 4 2002 21 - 15 6 2003 15 - 11 4 2004 9 - 8 1 2005 11 - 2 9 2006 2 - 2 - 2007 4 - 4 - 2008 0 - 0 - 2009 1 - 0 1 2010-2014 (No IPO Listed) 0 - 0 - Total 306 220 61 25 Panel B: Summary Statistics of Greek IPO firms(with forecast)
Mean Median Maximum Total market capitalisation of an IPO (€ million) 42.6 33.3 5900 The age of the issuing firm (years) 17.29 14 106 Time lag between the announcement of the prospectus and first day of stocks’ listing (days)
29.76 28 70
Companies partially or fully owned by the Greek state 0.06 0.07 - Demand multiple on the number of shares issued (times) 91.55 25 760.6 Underwriters reputation (dummy) 0.44 - - IPOs listed in the Hot or Cold Period (dummy) 0.29 - - Proportion of given ownership by the initial shareholders (%) 20.18 20 68.43 IPOs belonging in the industrial sector (dummy) 0.17 - - Panel C: Summary Statistics of Greek IPO firms (No forecast)
Mean Median Maximum Total market capitalisation of an IPO (€ million) 31.61 28.50 105.78 The age of the issuing firm (years) 5.82 4 29 Time lag between the announcement of the prospectus and first day of stocks’ listing (days)
24.75 24.5 37
Companies partially or fully owned by the Greek state 0.08 0.06 - Demand multiple on the number of shares issued (times) 5.08 2.58 6.48 Underwriters reputation (dummy) 0.61 - - IPOs listed in the Hot or Cold Period (dummy) 0.33 - - Proportion of given ownership by the initial shareholders (%) 16.47 13.69 42.92 IPOs belonging in the industrial sector (dummy) 0.125 - -
Panel D: Test of difference between Forecast and No Forecast Samples mean and medians.
Mean Median Mean Median Market Capitalisation (2.914)*** (-2.613)*** Demand Multiple (1.743)* (-1.269) Age of the issuing firm (3.987)*** (-3.529)*** Given Ownership (1.903)* (-1.894)* Time Lag (-0.648) (-0.157)
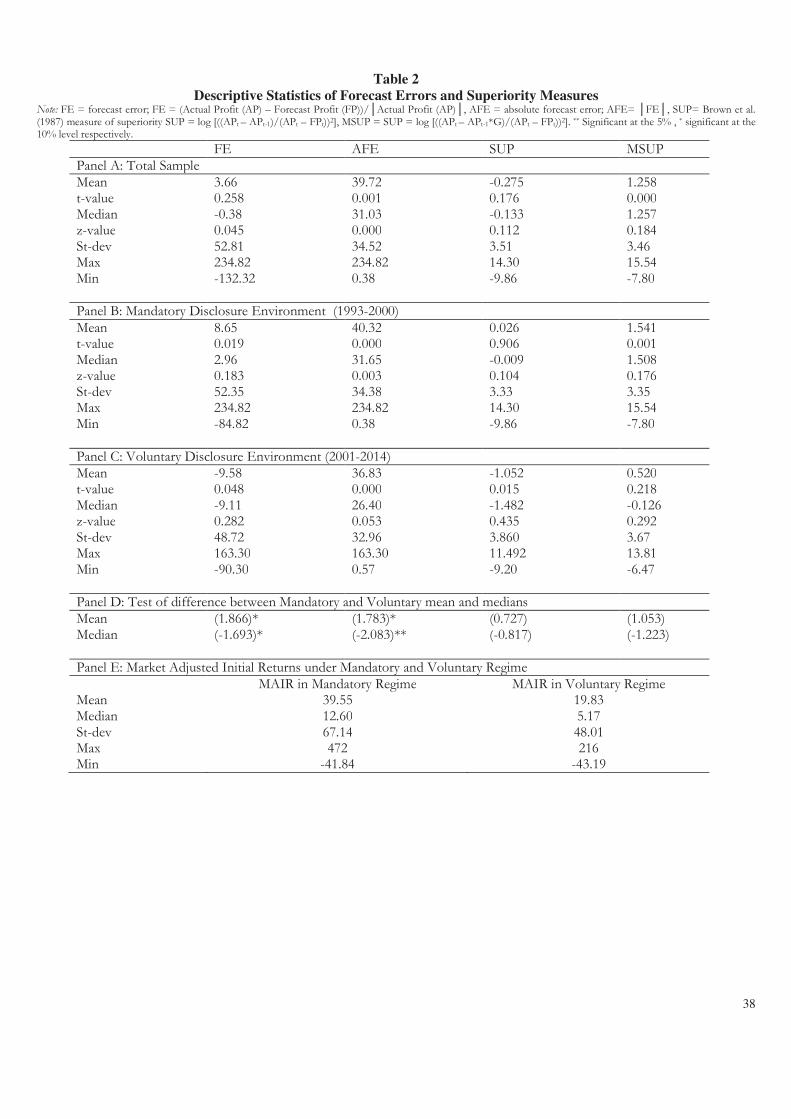
38
Table 2
Descriptive Statistics of Forecast Errors and Superiority Measures Note: FE = forecast error; FE = (Actual Profit (AP) – Forecast Profit (FP))/│Actual Profit (AP)│, AFE = absolute forecast error; AFE= │FE│, SUP= Brown et al. (1987) measure of superiority SUP = log [((APt – APt-1)/(APt – FPt))2], MSUP = SUP = log [((APt – APt-1*G)/(APt – FPt))2]. ** Significant at the 5% , * significant at the 10% level respectively.
FE AFE SUP MSUP Panel A: Total Sample Mean 3.66 39.72 -0.275 1.258 t-value 0.258 0.001 0.176 0.000 Median -0.38 31.03 -0.133 1.257 z-value 0.045 0.000 0.112 0.184 St-dev 52.81 34.52 3.51 3.46 Max 234.82 234.82 14.30 15.54 Min -132.32 0.38 -9.86 -7.80 Panel B: Mandatory Disclosure Environment (1993-2000) Mean 8.65 40.32 0.026 1.541 t-value 0.019 0.000 0.906 0.001 Median 2.96 31.65 -0.009 1.508 z-value 0.183 0.003 0.104 0.176 St-dev 52.35 34.38 3.33 3.35 Max 234.82 234.82 14.30 15.54 Min -84.82 0.38 -9.86 -7.80 Panel C: Voluntary Disclosure Environment (2001-2014) Mean -9.58 36.83 -1.052 0.520 t-value 0.048 0.000 0.015 0.218 Median -9.11 26.40 -1.482 -0.126 z-value 0.282 0.053 0.435 0.292 St-dev 48.72 32.96 3.860 3.67 Max 163.30 163.30 11.492 13.81 Min -90.30 0.57 -9.20 -6.47 Panel D: Test of difference between Mandatory and Voluntary mean and medians Mean (1.866)* (1.783)* (0.727) (1.053) Median (-1.693)* (-2.083)** (-0.817) (-1.223) Panel E: Market Adjusted Initial Returns under Mandatory and Voluntary Regime MAIR in Mandatory Regime MAIR in Voluntary Regime Mean 39.55 19.83 Median 12.60 5.17 St-dev 67.14 48.01 Max 472 216 Min -41.84 -43.19
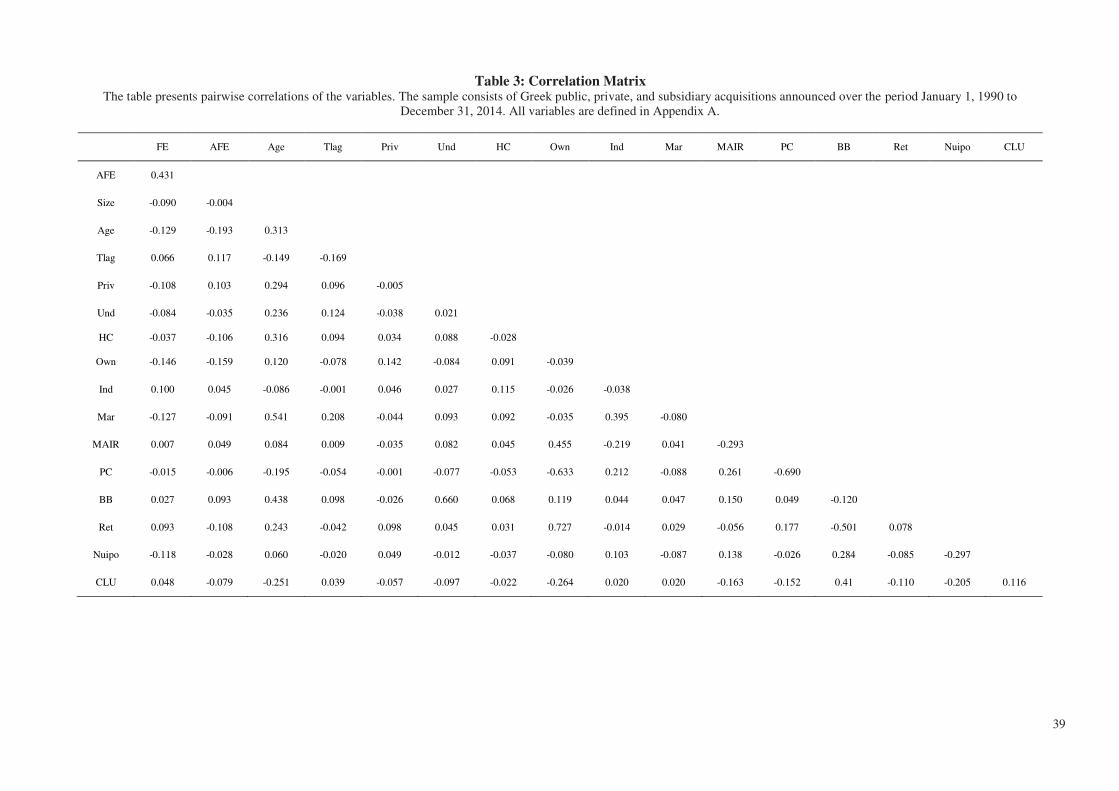
39
Table 3: Correlation Matrix
The table presents pairwise correlations of the variables. The sample consists of Greek public, private, and subsidiary acquisitions announced over the period January 1, 1990 to
December 31, 2014. All variables are defined in Appendix A.
FE AFE Age Tlag Priv Und HC Own Ind Mar MAIR PC BB Ret Nuipo CLU
AFE 0.431
Size -0.090 -0.004
Age -0.129 -0.193 0.313
Tlag 0.066 0.117 -0.149 -0.169
Priv -0.108 0.103 0.294 0.096 -0.005
Und -0.084 -0.035 0.236 0.124 -0.038 0.021
HC -0.037 -0.106 0.316 0.094 0.034 0.088 -0.028
Own -0.146 -0.159 0.120 -0.078 0.142 -0.084 0.091 -0.039
Ind 0.100 0.045 -0.086 -0.001 0.046 0.027 0.115 -0.026 -0.038
Mar -0.127 -0.091 0.541 0.208 -0.044 0.093 0.092 -0.035 0.395 -0.080
MAIR 0.007 0.049 0.084 0.009 -0.035 0.082 0.045 0.455 -0.219 0.041 -0.293
PC -0.015 -0.006 -0.195 -0.054 -0.001 -0.077 -0.053 -0.633 0.212 -0.088 0.261 -0.690
BB 0.027 0.093 0.438 0.098 -0.026 0.660 0.068 0.119 0.044 0.047 0.150 0.049 -0.120
Ret 0.093 -0.108 0.243 -0.042 0.098 0.045 0.031 0.727 -0.014 0.029 -0.056 0.177 -0.501 0.078
Nuipo -0.118 -0.028 0.060 -0.020 0.049 -0.012 -0.037 -0.080 0.103 -0.087 0.138 -0.026 0.284 -0.085 -0.297
CLU 0.048 -0.079 -0.251 0.039 -0.057 -0.097 -0.022 -0.264 0.020 0.020 -0.163 -0.152 0.41 -0.110 -0.205 0.116

40
Table 4: Cross Sectional Regression Results Explaining AFE, FE, SUM, MSUP Accuracy Measures of Greek IPOs Multivariate regression analysis of cross-sectional variation in earnings management subsequent to listing for 281 Greek initial public offers of ordinary equity made between January 1993 and December 2014. The dependent variables are
forecast error FE absolute forecast error AFE, forecast superiority SUP and modified forecast superiority MSUP. The independent variables are, SIZE - the logarithm of the total market capitalisation of an IPO, AGE - the number of years that
each listing firm is in operation since its inception before the year of listing, TLAG - time lag is the period between the announcement of the prospectus and first day of the stocks’ listing, PRIV - companies partially or fully owned by the Greek
state before going public have the value‘1’ and fully private companies have the value‘0’, OVER - demand multiple on the number of shares issued, UND - underwriters reputation: ‘1’ for reputable underwriters defined as one of the five older
and more experienced underwriting banks and ‘0’ for non-reputable underwriters, H/C - IPOs listed under hot market conditions have the value ‘1’ and IPOs listed under cold market conditions have the value ‘0’, OWN - proportion of given
ownership by the pre-IPO shareholders, IND - dummy variable taking the value of one if the company is industrial otherwise IND zero. *** Significant at the one per cent level. **Significant at the five per cent level *Significant at the ten per
cent level, t-statistics are robust for heteroskedasticity using the Newey-West HAC Standard Errors & Covariance process
Specifications
(1) AFE
Mandatory
(2) FE
Mandatory
(3) SUP
Mandatory
(4) MSUP
Mandatory
(5) AFE
Voluntary
(6) FE
Voluntary
(7) SUP
Voluntary
(8)MSUP
Voluntary
(9) AFE
1993-2014
(10) FE
1993-2014
(11) SUP
1993-2014
(12)MSUP
1993-2014
Constant -27.08 -34.04* 0.973 5.264 153.56 56.27 2.36 4.74 -18.21 -53.00 -8.79 2.120
SIZE (-) 0.150 3.483 0.0482 -0.069 -0.293 -0.215 -0.115 -0.125 3.184 0.082 0.224 -0.018
(1.954)* (0.032)** (0.847) (0.800) (-2.163)** (-1.039) (-0.917) (-0.876) (0.0541)* (0.949) (2.043)** (0.635)
AGE (-) -0.138 -0.105 -0.020 -0.019 0.013 0.055 0.371 0.387 -0.119 -0.077 -0.033 0.0036
(-2.627)** (0.670) (0.262) (0.074) * (0.093) (0.306) (2.852) (3.969) (0.365) (-1.272) (-0.410) (0.394)
Time Lag (+) 0.157 0.276 -0.016 -0.039 0.071 0.030 0.007 0.066 0.468 0.090 0.034 -0.020
(1.485) (0.282) (0.053)* (0.466) (0.628) (0.188) (0.068) (0.680) (0.007)*** (1.451) (0.548) (0.336)
PRIV (-) 0.128 -15.62 0.0124 -1.439 0.137 0.076 -0.120 0.001 -0.119 0.22 -0.062 -0.764
(1.682)* (0.646) (0.977) (0.304) (1.177) (0.510) (-0.986) (-0.005) (0.990)** (0.322) (-1.002) (0.023)**
OVER (-) 0.078 0.0256 0.0008 0.0009 0.344 0.022 0.031 0.077 0.0294 0.128 0.109 0.003
(0.778) (0.296) (0.776) (0.002)*** (2.556)** (0.145) (0.240) (0.523) (0.0439) (2.005)** (1.864)* (0.054)*
UND (-) 0.027 -12.98 -0.281 -0.744 -0.049 0.028 0.212 0.091 -3.136 0.034 0.017 -0.286
(0.453) (0.007)*** (0.307) (0.027)** (-0.439) (0.204) (2.549)** (0.972) (0.434)*** (0.762) (0.262) (0.366)
HC (+) -0.029 -9.130 0.0171 0.848 0.251 0.309 -0.253 -0.025 -15.7 0.018 -0.016 0.151
(-0.388) (0.0851)* (0.981) (0.528) (1.770) (2.137)** (-2.957)*** (-0.224) (0.0023) (0.319) (0.257) (0.265)
OWN (+) -0.062 -0.735 -0.038 -0.030 -0.243 0.233 -0.109 -0.281 -0.280 -0.030 -0.070 -0.005
(-0.918) (0.083)* (0.015)** (0.738) (-2.516)** (1.632) (-1.023) (-2.549)** (0.282) (-0.243) (-1.092) (0.398)
IND (+) 0.119 10.59 -0.175 -0.422 0.177 0.148 0.335 0.385 3.795 0.062 -0.001 -0.059
(1.826)* (0.308) (0.163) (0.417) (1.489) (1.074) (2.671)*** (3.348)*** (0.455) (1.005) (0.026) (0.632)
Adj. R2 0.094 0.053 0.070 0.104 0.259 0.235 0.209 0.263 0.066 0.061 0.060 0.048
No. of IPOs 220 220 220 220 61 61 61 61 281 281 281 281
F-statistic 2.78 2.36 2.57 2.73 3.37 3.25 3.11 3.95 2.49 2.43 2.33 2.21

41
Table 5: Cross Sectional Regression Analysis on the Method of Management Earnings Forecast
The table presents the results of the cross sectional regression analysis on the method, the management of the firm follows to provide earnings
forecast, for a sample of Greek IPOs over the period 1993-2014. In all models the variable 'mandatory' takes the value of 1 for IPOs where the
management provide mandatory earnings forecast, and 0 for IPOs which voluntarily provide earnings forecast. See Appendix A for definitions of
the variables. The symbols ***, ** and * denote statistical significance at the 1%, 5%, and 10% levels, respectively. The z-statistics reported in
parentheses are adjusted for heteroskedasticity. N denotes the number of observations.
Specifications (1) AFE (2) FE (3) SUP (4) MSUP
Constant -33.70 -95.05 -1.26 4.89 Mandatory 0.174 0.181 0.140 0.135
(2.784)*** (2.817)*** (1.999)** (1.983)**
SIZE 0.151 0.115 0.046 -0.068 (2.456)** (1.696)* (0.308) (-0.907) AGE -0.176 -0.096 0.000 0.019 (-2.785)*** (-1.424) (0.005) (0.252) Time Lag 0.064 0.032 -0.065 -0.138 (1.052) (0.543) (-0.986) (-2.321)** PRIV 0.056 0.026 -0.012 -0.034 (0.952) (0.333) (-0.199) (-0.478) OVER 0.061 0.136 0.047 0.063 (1.006) (2.021)** (0.662) (0.800) UND 0.071 0.073 0.020 -0.001 (1.263) (1.107) (0.261) (-0.032) HC -0.092 -0.042 0.012 0.026 (-1.546) (-0.601) (0.162) (0.444) OWN -0.083 -0.001 -0.032 -0.055 (-1.354) (-0.030) (-0.545) (-0.871) IND 0.068 0.073 -0.005 -0.014 (1.166) (1.185) (-0.070) (-0.271) R2 Adjusted 0.098 0.080 0.059 0.051 F-value 2.92 2.24 1.53 1.46 N 281 281 281 281

42
Table 6: Cross Sectional Regressions of Forecast effect on Market Adjusted Initial Returns
The table presents the results of the cross sectional regression analysis on the impact of various forms of forecast error on the adjusted initial
returns of the public offering, for a sample of Greek IPOs over the period 1993-2014. See Appendix A for definitions of the variables. The
symbols ***, ** and * denote statistical significance at the 1%, 5%, and 10% levels, respectively. The z-statistics reported in parentheses are
adjusted for heteroskedasticity. N denotes the number of observations.
MAIR (1)
MAIR (2)
MAIR (3)
MAIR (4) Variables
Constant 43.93*** 67.03*** 63.27*** 64.16*** (0.006) (0.007) (0.000) (0.001) AFE 0.545* 0.142 - - (0.067) (0.598) - - FE - - 0.424* 0.130 - - (0.098) (0.320) AGE 0.172 0.104 0.0606 0.180 (0.662) (0.853) (0.894) (0.741) TLAG -0.288 -0.473* -0.362 -0.398 (0.189) (0.0578) (0.120) (0.119) PRIV -19.27* -14.60 -17.03 -12.68 (0.0711) (0.363) (0.142) (0.405) UND -2.096 -3.692 -0.407 -0.714 (0.798) (0.728) (0.962) (0.943) HC 23.05*** 29.04*** 24.14*** 26.06*** (0.001) (0.0003) (0.003) (0.002) OWN -0.795** -1.248** -1.111*** -1.239** (0.019) (0.012) (0.004) (0.016) IND 6.744 13.76 9.480 17.57 (0.538) (0.340) (0.449) (0.275) Observations 301 219 266 207 R2 Adjusted 0.053 0.071 0.058 0.080

43
Table 7: Endogeneity Control for Earnings Forecast Existence
Results of instrumental variable probit regression to determine the probability of providing a forecast in the voluntary era for
IPOs listed on ASE over the sample period. Specification (1) is the reduced regression of accuracy in the mandatory regime using
Earnings Forecast Error as the dependent variable. Specification (2) is the structural regression for the IV Probit method. See
Appendix A for definitions of the variables. The symbols ***, ** and * denote statistical significance at the 1%, 5%, and 10%
levels, respectively. N denotes the number of observations.
Variable Reduced
(1)
Structural
(2)
Const. -0.112 -14.94
(0.695) (0.663)
PFE - -72.52**
- (0.0395)
SIZE 0.0299* 4.889**
(0.097) (0.0491)
AGE -0.001 -0.195
(0.329) (0.270)
Tlag -0.006*** -
(0.001) - PRIV 0.0854 5.233
(0.429) (0.680)
UND -0.103** -10.64*
(0.025) (0.0965)
HC -0.111* -22.38***
(0.057) (0.00431)
OWN -0.005* -0.0129
(0.085) (0.971)
IND 0.0891 10.38
(0.126) (0.155)
N 301 301
Pseudo (Adjusted) R^2 (0.0725)
Hausman (Wald) Test 7.355
(P-value) 0.007
44
Table 8: Treatment Effect: Maximum Likelihood & Two Stage model The table presents regression output of AFE and FE on 'Market Adjusted Initial Returns' based on returns to the investors and on
the possibility of an IPO to provide forecast. The reported shows the obtained results from the treatment effect method of
estimation for each individual qualification. Specifications (1) - (3) are estimated via maximum likelihood and specifications (4) -
(6) are estimated with two stage least square model. See Appendix A for definitions of the variables. The symbols ***, ** and *
denote statistical significance at the 1%, 5%, and 10% levels, respectively. N denotes the number of observations.
VARIABLES (1) AFE (2) FE (3) AFE (4) AFE (5) FE (6) AFE
Treatment Effect MAIR PFE MAIR PFE
Constant -33.71 -69.38*** 25.00*** -64.15 -45.23 5.893
(0.221) (0.0005) (0.009) (0.102) (0.311) (0.826)
SIZE 3.406** 3.453* 1.866 3.298** 2.069 2.385
(0.036) (0.092) (0.113) (0.042) (0.415) (0.139)
AGE -0.132 -0.112 -0.184*** -0.117 -0.0679 -0.188
(0.307) (0.111) (0.000) (0.371) (0.750) (0.128)
TLAG 0.408** 0.160 0.239*** 0.418** 0.0707 0.365**
(0.0221) (0.464) (0.008) (0.020) (0.804) (0.029)
PRIV 0.904 -6.421 -0.452 1.341 -3.731 1.561
(0.922) (0.514) (0.867) (0.882) (0.809) (0.871)
OVER 0.011 0.024*** 0.005*** 0.0004 - 0.013
(0.459) (0.000) (0.000) (0.980) - (0.335)
UND -3.743 -10.64*** -3.567*** -3.882 -10.18 -2.791
(0.345) (0.003) (0.000) (0.326) (0.121) (0.471)
HC -15.11*** -10.90*** -5.775*** -15.53*** -10.60 -10.23**
(0.002) (0.001) (0.000) (0.002) (0.247) (0.036)
OWN -0.209 -0.173 -0.314*** -0.206 -0.193 -0.355
(0.418) (0.692) (0.000) (0.416) (0.661) (0.168)
IND 4.316 6.972 3.129 4.381 7.577 3.396
(0.384) (0.151) (0.158) (0.374) (0.358) (0.496)
MAR -4.865* -9.235*** -2.457*** -5.314** -9.195* -2.908
(0.096) (0.000) (0.000) (0.0491) (0.0701) (0.393)
Mand1Vol0 23.40* 36.61* -15.47*** 68.35* 44.99* -33.80**
(0.076) (0.076) (0.000) (0.097) (0.069) (0.012)
Observations 300 265 300 300 266 300
45
Table 9: Heckman Two-Stage Model - AFE and FE The table presents the results of Heckman Two stage method for Absolute Forecast Error and Forecast Error. Specification A presents the results
on the Absolute Forecast Error. Specification B presents the results for Forecast Error. In this two stage procedure the first stage selection
equation is estimated by a probit regression from which the Inverse Mills Ratio is estimated. This ratio is the add to the second stage equation
which controls for the presence of selection bias in the sample. Panel A: Heckman Two-Stage Model for self-selection bias AFE FE
VARIABLES Selection Outcome Selection Outcome
Constant 0.507*** -52.64 0.489*** -51.86
(0.000) (0.175) (0.0005) (0.380)
SIZE 3.232** 2.428
(0.044) (0.334)
AGE -0.0594 -0.0490
(0.653) (0.810)
TLAG 0.424** 0.155
(0.017) (0.576)
PRIV 3.137 -4.605
(0.727) (0.747)
OVER -0.0012 0.0133
(0.947) (0.636)
UND -4.572 -10.20*
(0.245) (0.0935)
HC -15.70*** -7.046
(0.0016) (0.367)
OWN -0.212 -0.247
(0.398) (0.526)
IND 2.943 5.726
(0.549) (0.457)
MAR -4.799* -6.788
(0.075) (0.124)
HHI -146.2** -166.2*
(0.018) (0.0923)
Mand1Vol0 66.87* 53.52
(0.097) (0.385)
MAIR 0.0037** 0.00340** (0.017) (0.0339) Inv. Mills Ratio -35.65 -24.97 (0.134) (0.493) Observations 303 303 291 291
46
Table 10: Robustness and Auxiliary Tests Results of multivariate regression analysis of cross sectional variation with Earnings Forecast Error as dependent variable for IPOs listed on ASE
over the sample period between January 1, 1993 and December 31, 2014. Specification (1) tests for newly introduced variables RET and NUIPO.
Specification (2) challenges the influence of market adjusted initial return. Specification (3) explore IPOs listed with a price cap limitation of
±8% and ±9%. Specification (4) tests the Green Shoe effect. Specifications (5) - (9) See Appendix A for definitions of the variables. All variables
are winsorized at the 1% on both tails, with the exception of binary variables. Results have been corrected for Heteroskedasticity-robust clustered
standard errors. The symbols *, **, and *** denote statistical significance at the 10%, 5%, and 1% level, respectively.
Variable (1) FE 1993-2014
(2) FE 1993-2014
(2) FE 1993-2014
(4) FE 1993-2014
(5) FE 1993-2014
(6) FE Mandatory
(7) FE Mandatory
(8) FE Voluntary
(9) FE Voluntary
Const. -69.48 -57.77 -44.07 -61.12 -77.00 -7.909 -31.83 -212.4 -339.8 (0.189) (0.249) (0.386) (0.253) (0.134) (0.910) (0.667) (0.154) (0.141) SIZE 5.043 4.661 3.167 4.478 5.224* 2.095 4.090 4.556 8.910 (0.117) (0.129) (0.301) (0.168) (0.096) (0.641) (0.412) (0.598) (0.461) AGE -0.127 -0.114 -0.0718 -0.0943 -0.098 -0.006 -0.460 -0.479 -0.428 (0.568) (0.596) (0.712) (0.664) (0.611) (0.976) (0.135) (0.382) (0.459) Tlag 0.231 0.151 0.322 0.265 0.124 0.072 0.309 1.121 1.000 (0.499) (0.655) (0.341) (0.434) (0.721) (0.865) (0.429) (0.300) (0.508) PRIV -9.827 -7.646 -7.149 -7.796 -10.27 -42.44** -33.75* -9.293 -17.27 (0.494) (0.590) (0.618) (0.578) (0.478) (0.048) (0.0604) (0.694) (0.667) OVER 0.0441 0.0442 0.0006 0.0401 0.0257 0.0231 -0.0406 -0.0367 -0.0178 (0.158) (0.221) (0.983) (0.194) (0.494) (0.587) (0.376) (0.962) (0.986) UND -10.31 -12.52* -9.459 -10.74 -9.476 -13.02* -8.128 -5.690 15.34 (0.125) (0.066) (0.149) (0.113) (0.152) (0.092) (0.332) (0.735) (0.546) HC -8.342 -34.79*** -13.25* -11.92 -24.56** -32.40** 1.081 -42.91* -28.35 (0.323) (0.001) (0.091) (0.119) (0.015) (0.018) (0.920) (0.0967) (0.320) OWN -0.241 -0.184 -0.077 -0.0756 -0.379 -0.650 -1.054** 2.016** 2.100* (0.525) (0.620) (0.838) (0.849) (0.293) (0.130) (0.010) (0.037) (0.060) IND 6.160 3.645 2.328 5.642 4.077 5.318 14.54 -16.91 -6.124 (0.481) (0.668) (0.771) (0.519) (0.603) (0.587) (0.186) (0.222) (0.764) MAR -11.98** -11.66** -12.70** -11.57** -15.74*** -15.64 -6.476 3.440 -18.57 (0.0143) (0.023) (0.011) (0.0208) (0.006) (0.137) (0.558) (0.857) (0.549) PC 18.82* - - - 19.50** 12.64 - - - (0.068) - - - (0.040) (0.250) - - - RET - 4.460*** - - 4.621*** 5.233*** - 3.527 1.232 - (0.001) - - (0.002) (0.006) - (0.430) (0.815) NUIPO - 1.377 - - 1.264 -2.142 - 27.64 28.07 - (0.743) - - (0.787) (0.680) - (0.303) (0.506) MAIR - - 0.156** - 0.123 0.089 - 0.0487 -0.103 - - (0.0279) - (0.148) (0.382) - (0.790) (0.694) BB - - - - 17.47 66.36** - 54.39*** 80.05*** - - - - (0.140) (0.012) - (0.008) (0.005) GS - - - -17.55 - - - - -15.80 - - - (0.364) - - - - (0.703) CLU - - - - - - 3.328* - - - - - - - - (0.098) - - PR - - - - - - - - 0.156 - - - - - - - - (0.811) InAl - - - - - - - - 0.650* - - - - - - - - (0.086) R2 Adj. 0.063 0.082 0.081 0.083 0.095 0.148 0.103 0.173 0.193 N 270 270 270 270 270 220 160 82 80

47
Table 11: Robustness and Auxiliary Tests (continue...)
Results of multivariate regression analysis of cross sectional variation with Absolute Earnings Forecast Error as dependent variable for IPOs
listed on ASE over the sample period between January 1, 1993 and December 31, 2014. Specification (1) challenges the influence of market
adjusted initial return. Specification (2) tests for all additional control variables Specification (3) focus on a reduced sample of IPOs listed in the
mandatory period making use of all additional control variables. Specification (4) concentrate on IPOs listed during the voluntary period making
use of some additional control variables. Specification (5) is a probit regression where we include variables which would influence the firms
decision to issue a voluntary earnings forecast. See Appendix A for definitions of the variables. All variables are winsorized at the 1% on both
tails, with the exception of binary variables. Results have been corrected for Heteroskedasticity-robust clustered standard errors. The symbols *,
**, and *** denote statistical significance at the 10%, 5%, and 1% level, respectively.
Variable (1) AFE 1993-2014
(2) AFE 1993-2014
(3) AFE Mandatory
(4) AFE Voluntary
(5) Probit Voluntary Period
Const. 10.65 2.837 -109.2 67.64 -8.110** (0.730) (0.931) (0.188) (0.459) (0.0248) SIZE 2.064 2.068 8.077* 0.208 0.559** (0.289) (0.306) (0.0614) (0.965) (0.0225) AGE -0.176 -0.169 0.430* 0.206 0.0347 (0.313) (0.286) (0.0995) (0.538) (0.148) Tlag 0.370* 0.402* 0.569* 0.0202 -0.0112 (0.0533) (0.0522) (0.0949) (0.976) (0.677) PRIV 2.469 -1.729 -24.14 14.45 -0.694 (0.783) (0.855) (0.119) (0.162) (0.393) OVER 0.00187 0.0160 0.00200 0.825** 0.0861*** (0.919) (0.425) (0.961) (0.0218) (0.00130) UND -3.017 -1.800 -7.754 -4.425 -0.911** (0.463) (0.663) (0.361) (0.660) (0.0328) HC -11.00** -10.49 -1.086 -2.764 -1.081** (0.0308) (0.173) (0.949) (0.862) (0.0277) OWN -0.406* -0.472** 0.617 -1.007* -0.00276 (0.0862) (0.0398) (0.618) (0.0675) (0.933) IND 2.944 1.559 -0.124 2.864 0.0682 (0.544) (0.742) (0.988) (0.813) (0.872) MAR -2.846 -5.226 -23.94 -16.98 - (0.435) (0.188) (0.153) (0.168) - RET - 0.660 -2.573 1.574 - - (0.538) (0.213) (0.543) - NUIPO - 0.124 -11.69** 0.969 - - (0.967) (0.0384) (0.936) - MAIR 0.0371 0.0371 0.117 -0.0885 - (0.561) (0.549) (0.350) (0.386) - BB - 17.35** 19.94 -16.32 - - (0.0480) (0.144) (0.454) - PC - 8.288 16.11 - - - (0.209) (0.249) - - InAl - - 0.286* - - - - (0.0599) - - R2 Adj. 0.049 0.078 0.282 0.258 0.374 N 280 280 75 82 82