Embed Size (px)
Citation preview

Gro
up
Present and future
orki
ng G Present and future
IGS Ionospheric products
eric
Wo
Andrzej Krankowski, Manuel Hernández-Pajares,
Joachim Feltens Attila Komjathy Stefan Schaer
nosp
he Joachim Feltens, Attila Komjathy, Stefan Schaer,
Alberto García-Rigo, Pawel Wielgosz
IGS
Ion
I
Krankowski et al.

OutlineG
roup
Introduction
orki
ng G
IGS IONO WG activities
Current performance of IGS global TEC maps
eric
Wo Current performance of IGS global TEC maps
Updates and future plans
nosp
he
Summary
p p
IGS
Ion
I
Krankowski et al.

IntroductionInternational GNSS Service - IGSG
roup
orki
ng G
eric
Wo
nosp
he
IGS directly manages ~400 permanent GNSS stations
IGS
Ion y g p
observing 4-12 satellites at 30 s rate: more than 250,000 STEC observations/hour worldwide, but there is lack of
stations at some areas (e g over the oceans)I
Krankowski et al. 3
stations at some areas (e.g., over the oceans)

IGS IONO WG activities
Th IGS I h W ki
Gro
up
The IGS Ionosphere Working groupstarted its activities in June 1998 withthe main goal of a routinelyproducing IGS Global TEC maps.
The IGS ionosphere product is aresult of the combination of TECmaps derived by different AnalysisCenters by using weights
orki
ng G p g p
This is being done now with a latencyof 11 days (final product) and with alatency of less than 24 hours (rapid
d t)
Centers by using weightscomputed by Validation Center, inorder to get a more accurateproduct.
eric
Wo product). IGS
GNSS data
JASONTEC dataThis has been done under the
direct responsibility of the
nosp
he
IGSIonosphere
Analysis Centers IGS
Ionosphere
CODEESAJPLUPC
d po b y oIono-WG chairmans:
1. Dr Joachim Feltens, ESA1998–2002,
IGS
Ion Ionosphere
Validation Center
IGSIonosphere UPC
,
2. Dr Manuel Hernández-Pajares, UPC, 2002–2007
3 Dr Andrzej KrankowskiI
Krankowski et al.
IGSIonosphere
CombinationCenter
pMaps
UWM
UPC3. Dr. Andrzej Krankowski,UWM, 2008-

Determining VTEC in a global network: main problem: lack of data - South and Oceans
Gro
upIt can be seen thatthe typical “holes” appearing at the first
orki
ng Gpp g
stage of the global maps computation (each 2 hours). This requires an optimum
eric
Worequires an optimum
spatial-temporal interpolation technique to cover all the
nosp
heIonosphere.
IGS
Ion
Lack of data over the equatorial Africa and Atlantic and inI
Krankowski et al. 5
Lack of data over the equatorial Africa and Atlantic, and in part over equatorial and southern Pacific, hamper the detection of the equatorial anomalies (June 13, 2004).

Example of IGS Final GIM: 2010-141 DOYTEC map
Gro
up 4 Analysis Centers (CODE, ESA,JPL, and UPC) and a ValidationCenter (UPC) have been
idi ( t 2 h 5
orki
ng G providing maps (at 2 hours x 5
deg. x 2.5 deg in UT x Lon. xLat.), weights and external(altimetry-derived) TEC data.
eric
Wo
RMS map
nosp
he From such maps andweights the CombinationCenter (at first ESA, thenUPC, and since 2008 -
IGS
Ion UPC, and since 2008
UWM) has produced theIGS TEC maps in IONEXformat.
I
Krankowski et al.
Units: TECU

Example of IGS RAPID GIM: 2010-141 DOYTEC maps RMS maps
Gro
up
TEC maps RMS maps
orki
ng G
eric
Wo
nosp
heIG
S Io
nI
Krankowski et al.
Units: 0.1 TECUs

The IONEX format bodyG
roup
1 START OF TEC MAP 2004 4 27 0 0 0 EPOCH OF CURRENT MAP87.5-180.0 180.0 5.0 450.0 LAT/LON1/LON2/DLON/H
123 123 123 124 125 125 126 126 126 126 126 126 125 125 125 128125 125 125 126 126 125 124 124 124 124 124 123 123 122 122 121120 120 119 118 118 118 118 118 117 117 116 116 115 114 114 113
orki
ng G 113 113 114 114 114 114 115 115 115 116 116 117 117 118 119 120
120 121 121 122 123 123 123 123 12385.0-180.0 180.0 5.0 450.0 LAT/LON1/LON2/DLON/H
129 129 130 131 132 132 133 133 134 134 134 134 134 134 134 136135 136 130 129 129 129 128 128 128 127 126 124 123 122 121 120119 118 117 117 117 117 116 116 115 115 114 113 112 111 110 109109 110 109 109 109 110 111 111 112 112 113 113 115 116 117 118
The IONEX(IONosphere interEX h ) f t
eric
Wo 109 110 109 109 109 110 111 111 112 112 113 113 115 116 117 118
120 122 123 125 126 127 128 129 129...
-87.5-180.0 180.0 5.0 450.0 LAT/LON1/LON2/DLON/H87 88 88 90 90 91 92 93 93 94 94 95 94 93 91 8987 86 85 84 83 82 81 81 80 80 79 78 78 78 77 7776 76 76 75 75 76 77 77 76 79 79 79 80 81 82 83
EXchange) format allows to store the VTEC and its error estimates in a grid
nosp
he 83 84 85 85 85 85 85 85 85 86 87 87 87 88 88 8787 87 87 88 87 87 87 87 871 END OF TEC MAP 2 START OF TEC MAP
...
...13 END OF TEC MAP
gformat.
IGS
Ion 13 END OF TEC MAP
1 START OF RMS MAP 2004 4 27 0 0 0 EPOCH OF CURRENT MAP87.5-180.0 180.0 5.0 450.0 LAT/LON1/LON2/DLON/H7 7 7 7 7 7 7 7 7 7 8 8 9 9 9 68 8 8 6 6 7 7 7 7 6 6 6 6 6 6 66 6 7 7 7 6 7 6 6 7 7 7 7 8 8 9I
Krankowski et al. 8
10 9 8 8 8 8 7 7 8 8 8 8 7 7 7 77 6 6 7 6 7 6 6 7
...13 END OF RMS MAP
END OF FILE

Overall validation of VTEC maps during more than 10 years of IGS Iono WG operations
Example of comparison of IGS vs JASON: 2003-347
Gro
up
01-03UT 07-09UT
U it 10 TECU
orki
ng G Units: 10 TECUs
Red: Jason-1 TEC
Green: IGS final TEC
eric
Wo
JASON dual frequency altimeter provides a direct and i d d t VTEC
nosp
he independent VTEC below its orbit (1300 km) over the oceans (the worst case for GPS)
13-15UT 19-21UT
IGS
Ion GPS).
I
Krankowski et al.
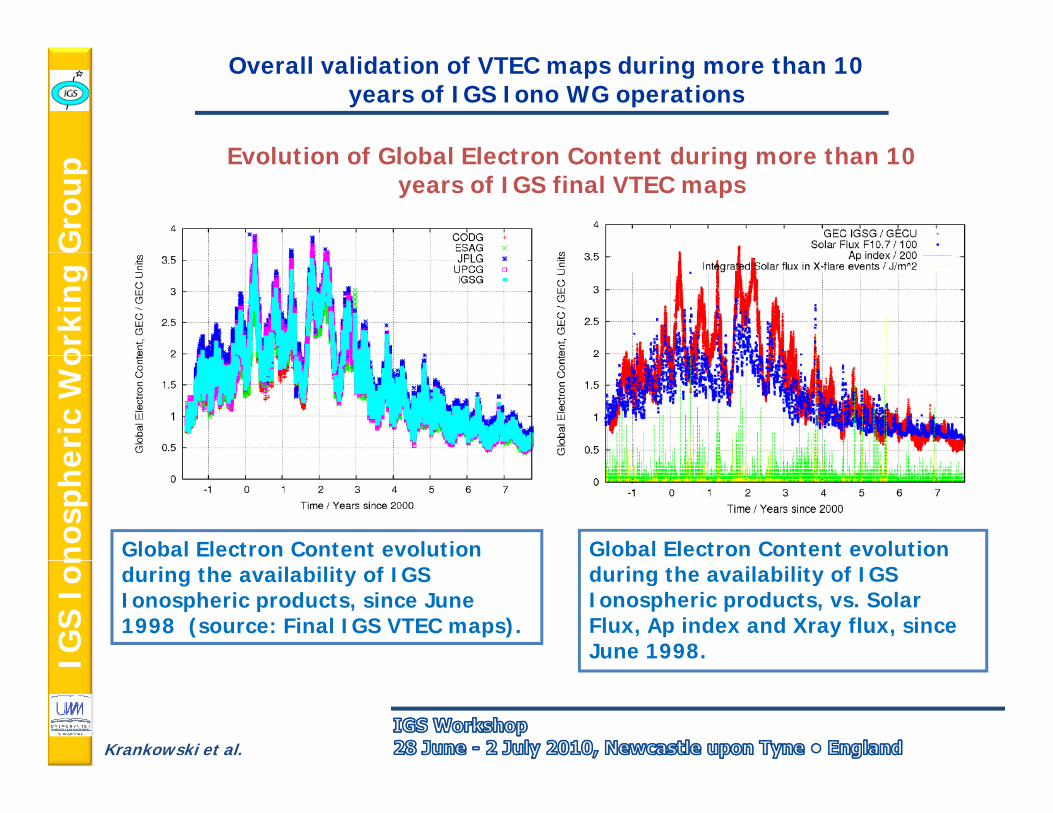
Overall validation of VTEC maps during more than 10 years of IGS Iono WG operations
E l ti f Gl b l El t C t t d i th 10
Gro
up
Evolution of Global Electron Content during more than 10years of IGS final VTEC maps
orki
ng G
eric
Wo
nosp
he
Global Electron Content evolution Global Electron Content evolution
IGS
Ion
during the availability of IGS Ionospheric products, since June 1998 (source: Final IGS VTEC maps).
during the availability of IGS Ionospheric products, vs. Solar Flux, Ap index and Xray flux, since June 1998.I
Krankowski et al.

IGS IONEX usage statistics for both final (IGSG) and rapid (IGRG) VTEC maps
80,000
Gro
up
40,000
50,000
60,000
70,000
.GOV
orki
ng G
0
10,000
20,000
30,000
,GSFC.NAS
AIGS rapid IONEX
eric
Wo
250,000
0
2005 2006 2007 2008 2009
m CDDIS.G
nosp
he
100,000
150,000
200,000
wnloa
ds fro
IGS final IONEX
IGS
Ion
0
50,000
100,000
# do
w IGS final IONEX
I
Krankowski et al.
2005 2006 2007 2008 2009

Current updatesCurrent updates and future plans of IGS IWGand future plans of IGS IWG
The following actions to be considered:
Gro
up
The following actions to be considered:
- Higher temporal resolution < 1 hour (asap)
orki
ng G - Predicted TEC maps – 1 and 2 days ahead
- since October 2009 UPC and ESA have provide predicted maps
bi d d t t b t t d ( d f 2010)
eric
Wo - combined product to be started (end of 2010)
- The old procedures have been rewritten (perl) and currently running in parallel
nosp
he
running in parallel
-Cooperation with International Reference Ionosphere (IRI)
IGS
Ion
- Cooperation with National Central University (Taiwan) on application of COSMIC occultation data
I
Krankowski et al.
- Space Weather monitoring over polar regions
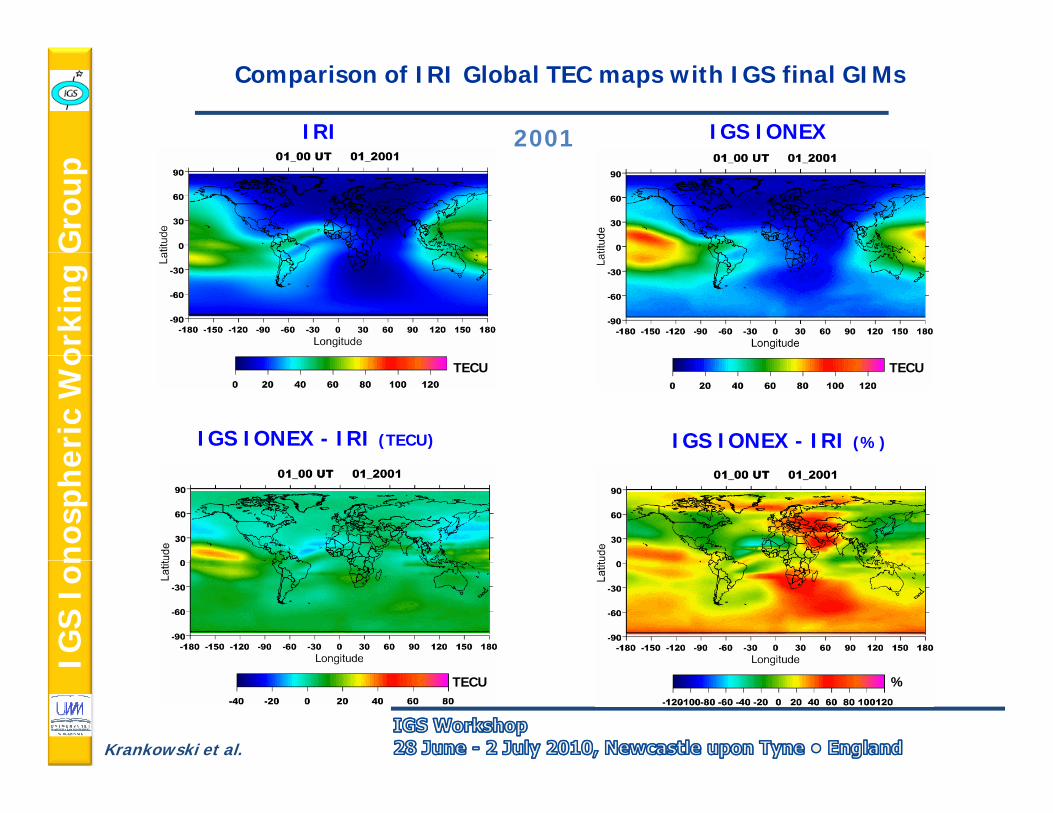
Comparison of IRI Global TEC maps with IGS final GIMs
IRI IGS IONEX 2001
Gro
upor
king
Ger
icW
o TECU TECU
IGS IONEX - IRI (TECU) IGS IONEX - IRI (%)
TECU TECU
nosp
heIG
S Io
nI
Krankowski et al.
TECU %

Comparison of IRI Global TEC maps with IGS final GIMs
IRI IGS IONEX 2008
Gro
upor
king
G
TECU TECU
eric
Wo TECU TECU
IGS IONEX - IRI (TECU) IGS IONEX - IRI (%)
TECU TECU
nosp
heIG
S Io
nI
Krankowski et al.
TECU %TECU %

FORMOSAT-3/COSMICG
roup • FORMOSAT-3/COSMIC
Constellation was launch at 01 40 UTC A il 14 2006
orki
ng G 01:40 UTC, April 14, 2006
(Taiwan Time: April 15 2006) at Vandenberg Air Force Base, CA Minotaur Launch
eric
Wo CA. Minotaur Launch
• Maneuvered into six different bit l l (i li ti 72°)
nosp
he orbital planes (inclination ~72°) for optimal global coverage (at ~800 km altitude).
IGS
Ion
• All satellites are in good health and providing science d tI
Krankowski et al.
data.

Occultation locations for COSMIC, 24 Hrs (28.03.2008)G
roup
orki
ng G
eric
Wo
nosp
heIG
S Io
nI
Krankowski et al.
16

Comparison of IRI profiles with COSMIC and ionosonde data (DIAS)
1000
19.06.07 08.19 UT601000
18.03.07 13.51 UT60
Gro
up
200
400
600
800
1000cosmicionosondeIRI 2007
40
50pr
ebro
h,km
ch
ju
ar200
400
600
800cosmicionosondeIRI 2007
40
50 pr
ebro
ch
ju
ar
h,km
orki
ng G
0 1 2 30
200
-10 0 10 2030
Ne·105 el/cm30 1 2 30
200
-10 0 10 2030
Ne·105 el/cm3
1000cosmic
19.06.07 08.39 UT60
h,1000
cosmic
21.06.07 15.29 UT60
h,ju
eric
Wo
200
400
600
800ionosondeIRI 2007
40
50pr
ebro
km
ch
ju
ar 200
400
600
800
cos cionosondeIRI 2007
40
50pr
ebro
km
ch
ju
ar
nosp
he
800
1000cosmicionosondeIRI 2007
17.12.07 01.32 UT60
h,kmju
800
1000cosmicionosondeIRI 2007
21.09.07 19.45 UT60
h,kmju
0 1 2 30
-10 0 10 2030
Ne·105 el/cm3 0 1 2 30
-10 0 10 2030
Ne·105 el/cm3
IGS
Ion
0
200
400
600
IRI 2007
30
40
50pr
ebro
ch
ar
0
200
400
600
IRI 2007
30
40
50 pr
ebro
ch
ar
I
Krankowski et al.
0 0.5 1 1.50
-10 0 10 2030
Ne·105 el/cm30 1 2 3
0-10 0 10 20
30 Ne·105 el/cm3

Ex. Geomagnetic Disturbance in October 2008G
roup
3
6
9
16.6
23.0
23.3
17.4
8.2
6.4
3.0
2.7
0.6
4.7
30.2
21.3
15.1
5.6
14.8
7.0
2.6
1.0
15.4
6.3
Kp
in
de
x a)
Kp
20
25Juliusruh (54, 13)DRES (51, 13)
orki
ng G
1 2 3 4 5 6 7 8 9 10 11 12 13 14 15 16 17 18 19 20
0
-150
-100
-50
0
50
Dst
, n
T
b)
0 6 12 180
5
10
15
0 6 12 18 0 6 12 18 0 6 12 18 0 6 12 18 0 6 12 1808 09 10 11 12 13
30
TECU
eric
Wo
1 2 3 4 5 6 7 8 9 10 11 12 13 14 15 16 17 18 19 20
-200
October 2008
1211-15 UT9 TECU 0
51015202530
Athens (38, 23)ORID (41, 20)
TECU
nosp
he
4
8
TEC
TECU
9 TECU 0 6 12 180
0 6 12 18 0 6 12 18 0 6 12 18 0 6 12 18 0 6 12 1808 09 10 11 12 13
Diurnal variations of TEC (red line) overDRES and ORID IGS GPS stations. Thecrossed line indicates variations of
IGS
Ion
7 8 9 10 11 12 13 14 15October 2008
0
crossed line indicates variations of(foF2)2/3 over Juliusruh and Athensionosondes. Blue line corresponds to theaverage TEC variation
I
Krankowski et al.

Comparison F3/COSMIC electron densitywith IGS final TEC maps
9 October 2008 – quiet day 11 October 2008 – disturbed day
Gro
up
9 October 2008 – quiet day 11 October 2008 – disturbed day
12 UT
orki
ng G
eric
Wo
nosp
heIG
S Io
nI
Krankowski et al.

Comparison F3/COSMIC electron densitywith IGS final TEC maps
9 October 2008 – quiet day 11 October 2008 – disturbed day
Gro
up
9 October 2008 – quiet day 11 October 2008 – disturbed day14 UT
orki
ng G
eric
Wo
nosp
heIG
S Io
nI
Krankowski et al.

Space Weather monitoring over polar regionsG
roup
High latitude TEC fluctuations
For fast detecting phase fluctuation occurrence the rate of TEC
orki
ng G
ROT = 9.52 1016 el/m (i ‐ k)
(dTEC/dt) is more preferred:
eric
Wo
ki ‐ differential carrier phase sample with 30 sec interval
t = tk – t i= 1 min.
nosp
he
k i
As a measure of ionospheric activity we used also the Rate of TEC Index(ROTI) based on standard deviation of ROT:
IGS
Ion ( )
22 ROTROTROTI
I
Krankowski et al.

Oval of irregularitiesquiet daydisturbed day
Gro
up
q y
orki
ng G
eric
Wo
di t b d d di t b d di t d
nosp
he disturbed day disturbed dayquiet day
IGS
Ion
I
Krankowski et al. Dynamic of the irregularity oval for quiet and disturbed days.

Summary of Summary of IonoIono WG activitiesWG activitiesG
roup 1. Long series of IGS VTEC maps offers a very good source of
information about the ionosphere with high spatial and temporal resolution
orki
ng G
2. Future improvements are determined by users’ requirements (the number of users has significantly increased during the last 10 years)
eric
Wo increased during the last 10 years)
A good example is the recent interest of ESA SMOS mission in using IGS final and predicted VTEC maps
nosp
he 3. 12 years of continuous time series of TEC measurements may be applied to update ionospheric models, e.g., IRI model
IGS
Ion
4. COSMIC occultation data gives a new opportunity to study/model the ionosphere and to validate IGS TEC maps
I
Krankowski et al.

Summary of Summary of IonoIono WG activitiesWG activitiesG
roup 5. A long time series of accurate global VTEC values are freely
available since 1998 for scientific or technical use, with
orki
ng G latencies of about 12 days (final product) or 1 day (rapid
product). Thanks to the cooperative effort developed within the IGS framework and the international scientific
eric
Wo community this open service will hopefully continue its
evolution during the next years, sensitive to both new user needs and scientific achievements.
nosp
heIG
S Io
nI
Krankowski et al.


![IonSAT M. Hernández-Pajares, on behalf of IGS RT WG (1)UPC-IonSAT, Barcelona (Spain) [contact e-mail : manuel@ma4.upc.edu] Inputs received from Ionospheric](https://img.dokumen.tips/doc/110x75/56649c7d5503460f949324d5/ionsat-m-hernandez-pajares-on-behalf-of-igs-rt-wg-1upc-ionsat-barcelona.jpg)