Embed Size (px)
Citation preview
Programme Support UnitOdisha tribal Empowerment and Livehoods Programme
2nd Floor, TDCCOL Building, Bhoi Nagar, Bhubaneswar - 751022Ph. : 0674-2542709, Fax : 2541772
E-mail : [email protected]
ww
w.o
telp
.org
Annual Outcome Survey 2015-16
OdishaTribal Empowerment and Livelihoods Programme (OTELP)ST & SC Development, Minorities & Backward
Classes Welfare DepartmentGovernment of Odisha

Annual Outcome Survey 2015-16
2
OdishaTribal Empowerment and Livelihoods ProgrammeST & SC Development, Minorities & Backward
Classes Welfare DepartmentGovernment of Odisha
Annual Outcome Survey 2015-16
Annual Outcome Survey 2015-16
Odisha Tribal Empowerment And Livelihoods Programme (OTELP)
3
Guidance :Srikanta Prusty, IASProgramme Director, OTELP
Compilation & EditingSukanta Kumar MohapatraManager(MIS)
Goutam Kumar MohantyAdditional PO (PM & E)
Published by:Programme Support UnitOdisha Tribal Empowerment and Livelihoods ProgrammeST & SC Development DepartmentGovernment of Odisha
Primary Data Collection By:ISWARBalasore
Designed & Printed at :Maa Kali Stationery WorksBhubaneswar, Ph.: 0674 - 2572233E-mail : [email protected]
Odisha Tribal Empowerment And Livelihoods Programme (OTELP)

Annual Outcome Survey 2015-16
4
ContentsSl. No. Particulars of Content Page No.
1 Introduction 1
2 Objective and Methodology 2
3 BeneficiaryProfile&ParticipationinProject 3
4 Livelihoods 10
5 Food Security 14
6 Land Tenure 18
7 Agriculture Production and Irrigation 20
8 Access to Market 30
9 Access to Rural Financial Services 34
10 Access and productivity of common property resources 36
11 Annexure I: Block wise list of villages and number of 39
beneficiaryandnonbeneficiaryhouseholds
12 Annexure II: Schedule of Focused Group Discussion and 41
Key informant interview; Copy of the questionnaire used
forbeneficiaryandnonbeneficiaryhouseholds
Annual Outcome Survey 2015-16Annual Outcome Survey 2015-16
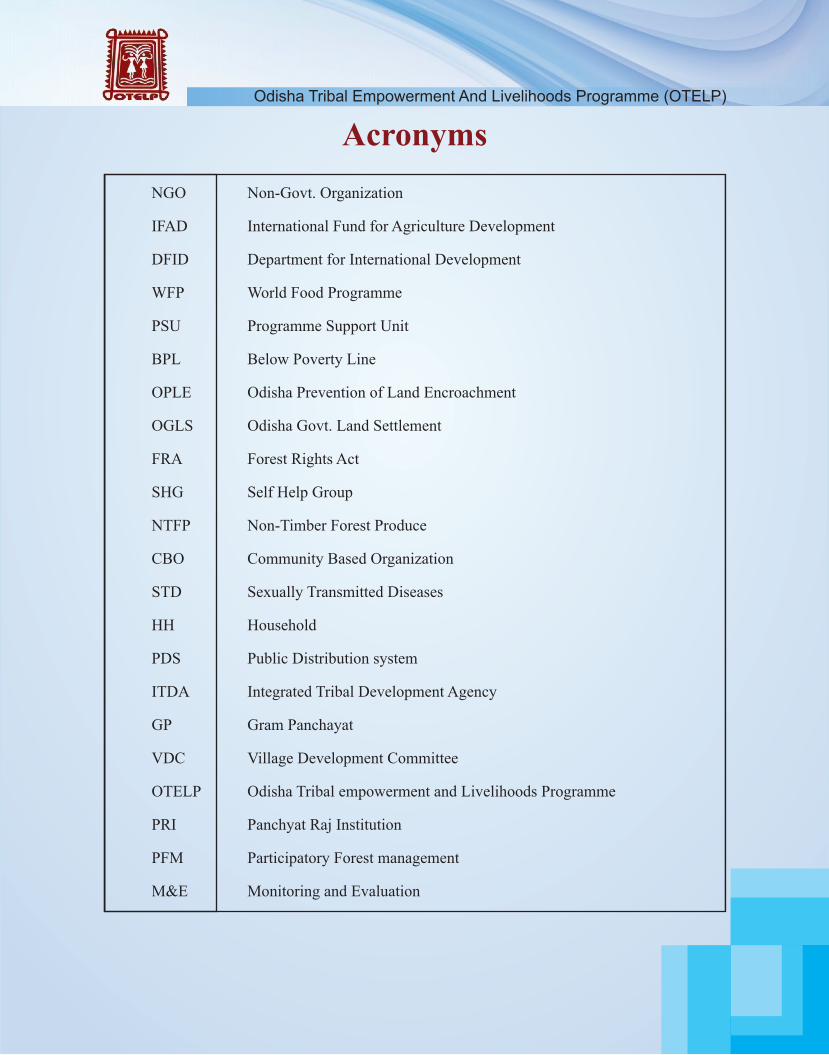
Acronyms NGO Non-Govt. Organization
IFAD International Fund for Agriculture Development
DFID Department for International Development
WFP World Food Programme
PSU Programme Support Unit
BPL Below Poverty Line
OPLE Odisha Prevention of Land Encroachment
OGLS Odisha Govt. Land Settlement
FRA Forest Rights Act
SHG Self Help Group
NTFP Non-Timber Forest Produce
CBO Community Based Organization
STD Sexually Transmitted Diseases
HH Household
PDS Public Distribution system
ITDA Integrated Tribal Development Agency
GP Gram Panchayat
VDC Village Development Committee
OTELP Odisha Tribal empowerment and Livelihoods Programme
PRI Panchyat Raj Institution
PFM Participatory Forest management
M&E Monitoring and Evaluation
Odisha Tribal Empowerment And Livelihoods Programme (OTELP) Odisha Tribal Empowerment And Livelihoods Programme (OTELP)
Odisha Tribal Empowerment And Livelihoods Programme (OTELP)
1
1. Introduction
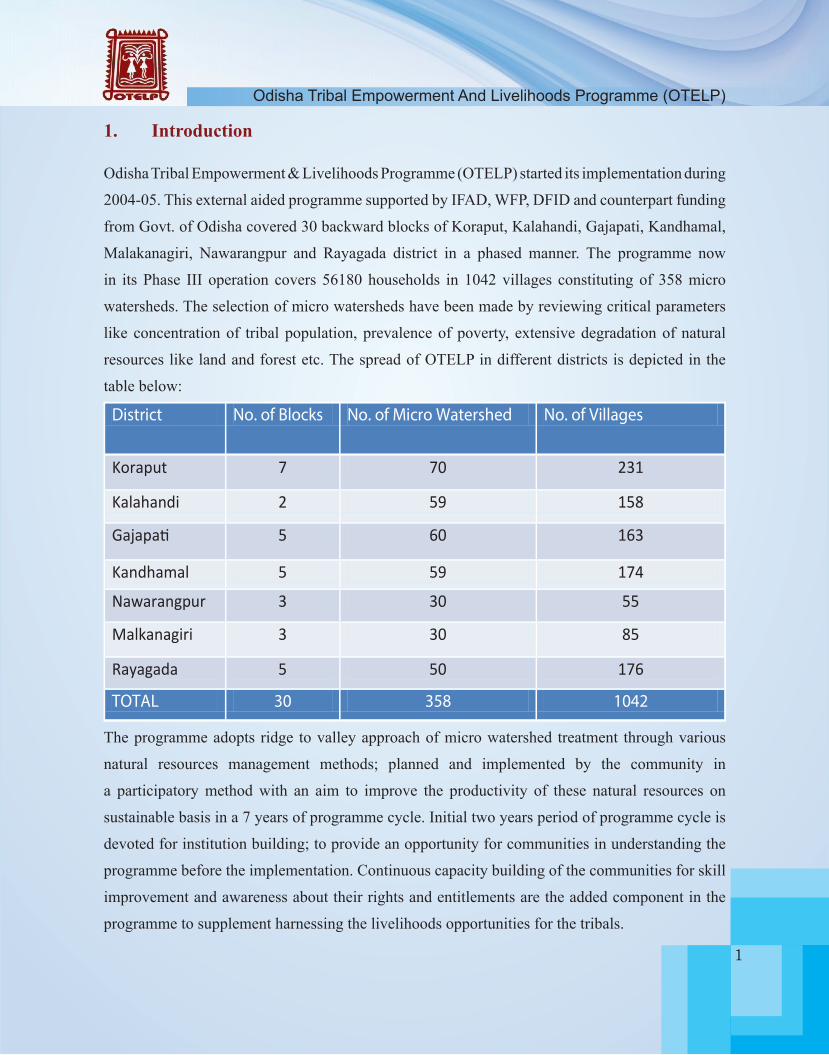
Odisha Tribal Empowerment & Livelihoods Programme (OTELP) started its implementation during
2004-05. This external aided programme supported by IFAD, WFP, DFID and counterpart funding
from Govt. of Odisha covered 30 backward blocks of Koraput, Kalahandi, Gajapati, Kandhamal,
Malakanagiri, Nawarangpur and Rayagada district in a phased manner. The programme now
in its Phase III operation covers 56180 households in 1042 villages constituting of 358 micro
watersheds. The selection of micro watersheds have been made by reviewing critical parameters
like concentration of tribal population, prevalence of poverty, extensive degradation of natural
resources like land and forest etc. The spread of OTELP in different districts is depicted in the
table below:
District No. of Blocks No. of Micro Watershed No. of Villages
Koraput 7 70 231
Kalahandi 2 59 158
Gajapati 5 60 163
Kandhamal 5 59 174
Nawarangpur 3 30 55
Malkanagiri 3 30 85
Rayagada 5 50 176
TOTAL 30 358 1042
The programme adopts ridge to valley approach of micro watershed treatment through various
natural resources management methods; planned and implemented by the community in
a participatory method with an aim to improve the productivity of these natural resources on
sustainable basis in a 7 years of programme cycle. Initial two years period of programme cycle is
devoted for institution building; to provide an opportunity for communities in understanding the
programme before the implementation. Continuous capacity building of the communities for skill
improvement and awareness about their rights and entitlements are the added component in the
programme to supplement harnessing the livelihoods opportunities for the tribals.

Odisha Tribal Empowerment And Livelihoods Programme (OTELP)Annual Outcome Survey 2015-16
2
Providing livelihoods support system for the vulnerable people within the community and creating
community infrastructures like storage structures, drying yard and drinking water at the door step
are improving the quality of life of the tribal community in an inclusive manner. Organizing the
communities into various community based institutions, strengthening their capacity in participatory
planning and implementing various livelihoods promotion activities is the key strength of the
programme design. The funds meant for the development of the village resources are directly
utilized by these community institutions. This approach enables the tribal community in improving
their capacity for governance with proper control measures ensuring high level of transparency
and sustainability. Continuous and need based capacity building interventions for management of
programme have been ensured by partner NGOs at the grass root level.
Assessment of programme performance though Annual Outcome Survey is a part of the IFAD’s
evaluation policy where the IFAD assisted project conducts an outcome survey every year to assess
the status of implementation of the programme and achievements of key output and outcome
parameters. This evaluation is done with the overall framework of the IFAD’s Annual Outcome
Survey design. The Programme Support Unit (PSU) of the programme executed the primary data
collection element of the survey through independent agency to ensure collection of unbiased
data from the selected sample households from the programme as well as from non programme
villages. During the current year, non programme villages were selected from the villages where
implementation of OTELP Plus started in recent past.
2. Objective and Methodology
The basic objective of the study is to
i. Measure changes happening at the household level in terms of livelihoods and
food security during the project period.
ii. Assesstargetingefficiency
iii. Provide evidences of success or failure of the project.
iv. Provide timely performance information necessary to undertake corrective actions.
Odisha Tribal Empowerment And Livelihoods Programme (OTELP)
3
90 randomly selected villages representing each programme district and each phase of village
(phase I and II) were taken as programme villages for conducting the survey. Similarly, 45 control
villages were selected from nearby non programme villages (randomly selected from OTELP Plus
areas&other villages). Fromeach village, 10 beneficiary familieswere selected in a random
basis based on the well being ranking table already available with the villages to ensure that each
category of families are included in the sample households for administering the questionnaire.
Similar event was done for selection of families in control villages. However, sampling on the
basis of well being ranking was not considered for control villages. The list of sample programme
villages and control villages covered in each district are attached as Annexure I.
The primary data collection exercise of the survey was done by independent enumerators for
non-biased data collection process. IFAD prescribed questionnaire schedule was adopted with
minormodification considering the local context. Schedule of questions and discussion points
were prepared and provided to the enumerators for conducting focused group discussions and key
informants interview. The checklists are at Annexure II.
Datafromthecompletedquestionnairesforbothbeneficiaryandnonbeneficiaryhouseholdswere
entered in to the excel template designed by IFAD for the purpose. Based on the data, the previously
designed analysis charts were prepared. These results from the primary data were triangulated with
the results from focused group discussions and key informants interview. The report is based on
the analysis of results together from each data set.
3. Beneficiaryprofileandparticipationintheproject
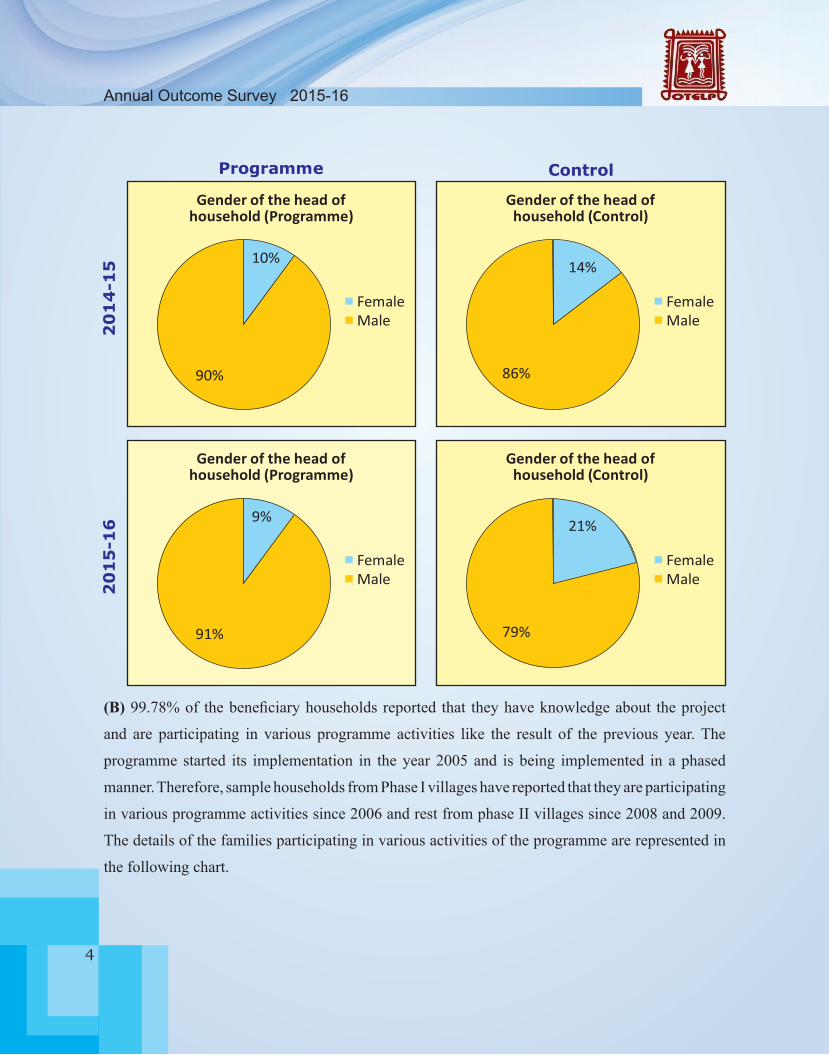
(A) 91% of the total respondant households are male in case of programme villages in comparision
to 79 in the control villages. In the society in the tribal regions where the project is operating,
male is mostly treated as the head of the family. In cases where females have reported as head of
household, they are mostly single women or widow. The number of women headed households
have increased in comparision to the previous year in both the programme and control villages.
However,thisbearsverylittlesignificanceintheoutcomeoftheproject.
Odisha Tribal Empowerment And Livelihoods Programme (OTELP)Annual Outcome Survey 2015-16
4
Programme Control
20
14
-15
2
01
5-1
6
Gender of the head of Gender of the head of household (Programme) household (Control)
Female Male
Female Male
9%
91%
21%
79%
Gender of the head of Gender of the head of household (Programme) household (Control)
Female Male
Female Male
10%
90%
14%
86%
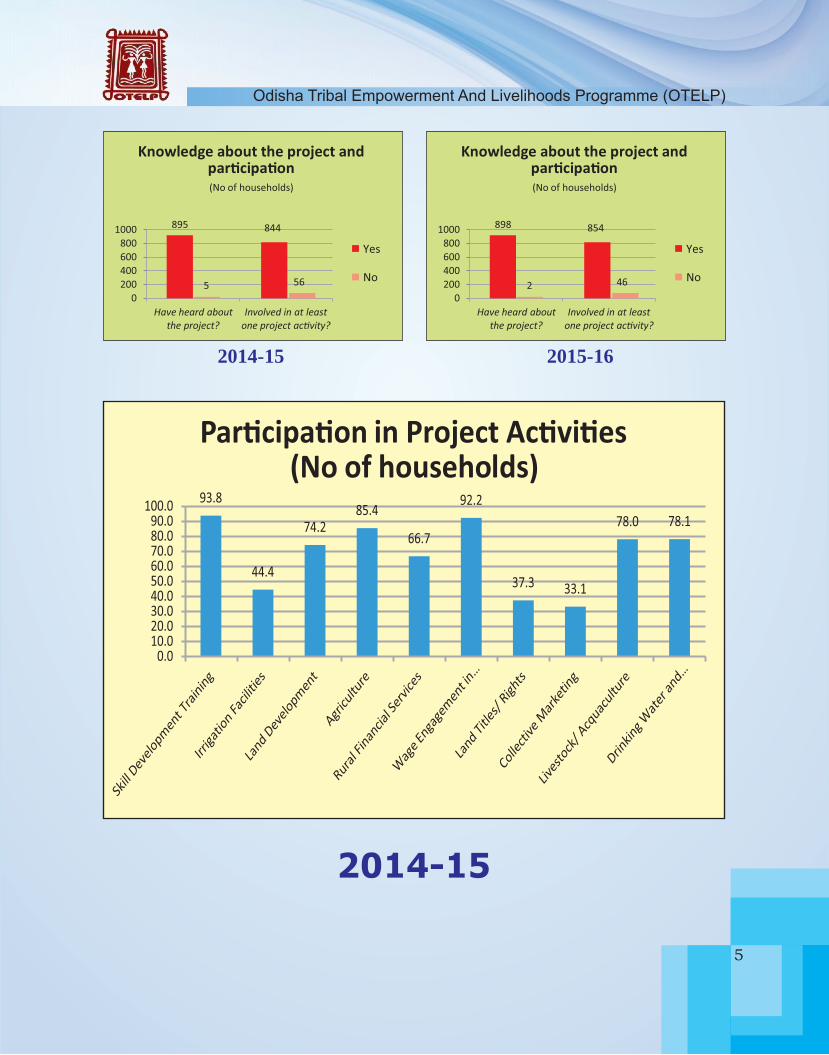
(B) 99.78%of thebeneficiaryhouseholdsreported that theyhaveknowledgeabout theproject
and are participating in various programme activities like the result of the previous year. The
programme started its implementation in the year 2005 and is being implemented in a phased
manner. Therefore, sample households from Phase I villages have reported that they are participating
in various programme activities since 2006 and rest from phase II villages since 2008 and 2009.
The details of the families participating in various activities of the programme are represented in
the following chart.
Odisha Tribal Empowerment And Livelihoods Programme (OTELP)
5
2015-15
898 854
2 46
0
200 400 600
800
1000
Have heard about the project?
Involved in at least one project ac�vity?
Knowledge about the project and par�cipa�on
(No of households)
Yes
No
2014-15
895 844
5 56
0
200 400 600
800
1000
Have heard about the project?
Involved in at least one project ac�vity?
Knowledge about the project and par�cipa�on
(No of households)
Yes
No
2015-16
P�r�ci���on in Project �c��i�es(No of households)
94.9
47.4
62.8
72.0
67.7
94.9
45.4 41.4
75.6 81.3
0.010.020.030.040.050.060.070.080.090.0
100.0
2014-15
P�r�ci���on in Project �c��i�es(No of households)
93.8
44.4
74.2
85.4
66.7
92.2
37.3
33.1
78.0 78.1
0.010.020.030.040.050.060.070.080.090.0
100.0
2014-15 2015-16

Odisha Tribal Empowerment And Livelihoods Programme (OTELP)Annual Outcome Survey 2015-16
6
2015-16
P�r�ci���on in Project �c��i�es(No of households)
94.9
47.4
62.8
72.0
67.7
94.9
45.4 41.4
75.6 81.3
0.010.020.030.040.050.060.070.080.090.0
100.0
2014-15
P�r�ci���on in Project �c��i�es(No of households)
93.8
44.4
74.2
85.4
66.7
92.2
37.3
33.1
78.0 78.1
0.010.020.030.040.050.060.070.080.090.0
100.0
Odisha Tribal Empowerment And Livelihoods Programme (OTELP)
7
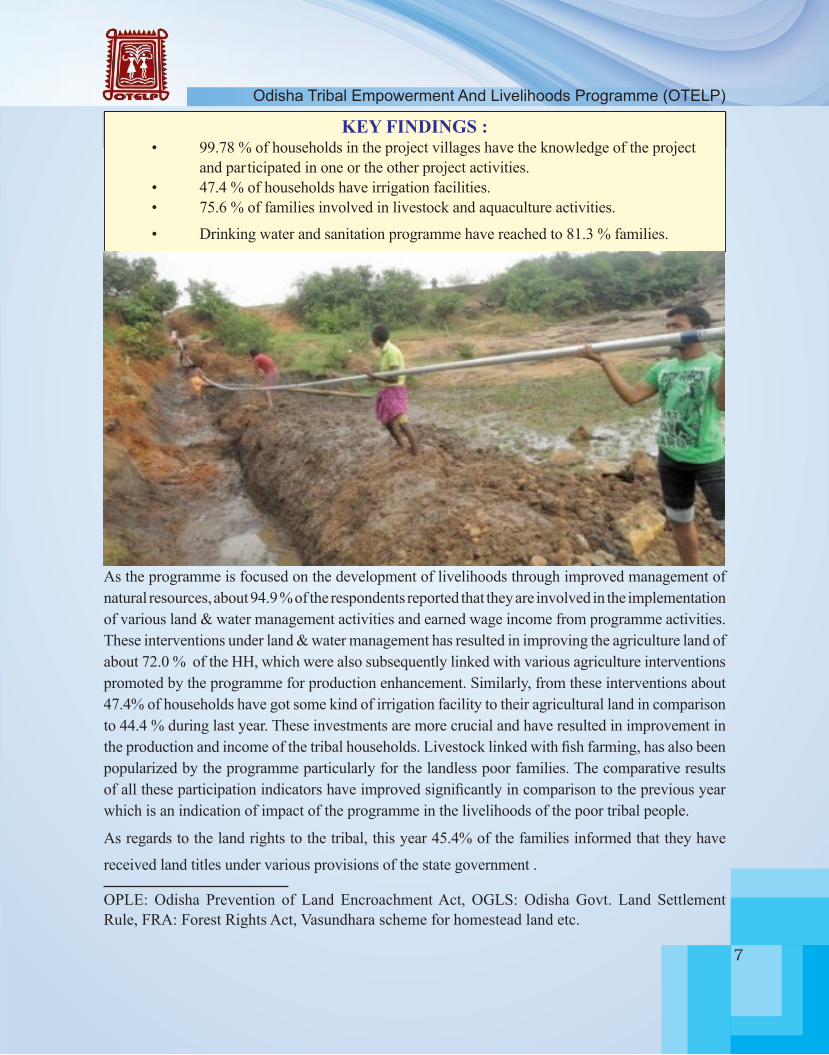
KEY FINDINGS : • 99.78%ofhouseholdsintheprojectvillageshavetheknowledgeoftheproject and par ticipated in one or the other project activities. • 47.4%ofhouseholdshaveirrigationfacilities. • 75.6%offamiliesinvolvedinlivestockandaquacultureactivities.
• Drinkingwaterandsanitationprogrammehavereachedto81.3%families.
As the programme is focused on the development of livelihoods through improved management of natural resources, about 94.9 % of the respondents reported that they are involved in the implementation of various land & water management activities and earned wage income from programme activities. These interventions under land & water management has resulted in improving the agriculture land of about 72.0 % of the HH, which were also subsequently linked with various agriculture interventions promoted by the programme for production enhancement. Similarly, from these interventions about 47.4% of households have got some kind of irrigation facility to their agricultural land in comparison to 44.4 % during last year. These investments are more crucial and have resulted in improvement in theproductionandincomeofthetribalhouseholds.Livestocklinkedwithfishfarming,hasalsobeenpopularized by the programme particularly for the landless poor families. The comparative results ofalltheseparticipationindicatorshaveimprovedsignificantlyincomparisontothepreviousyearwhich is an indication of impact of the programme in the livelihoods of the poor tribal people.
As regards to the land rights to the tribal, this year 45.4% of the families informed that they have
received land titles under various provisions of the state government .
OPLE: Odisha Prevention of Land Encroachment Act, OGLS: Odisha Govt. Land Settlement Rule, FRA: Forest Rights Act, Vasundhara scheme for homestead land etc.
Odisha Tribal Empowerment And Livelihoods Programme (OTELP)Annual Outcome Survey 2015-16
8
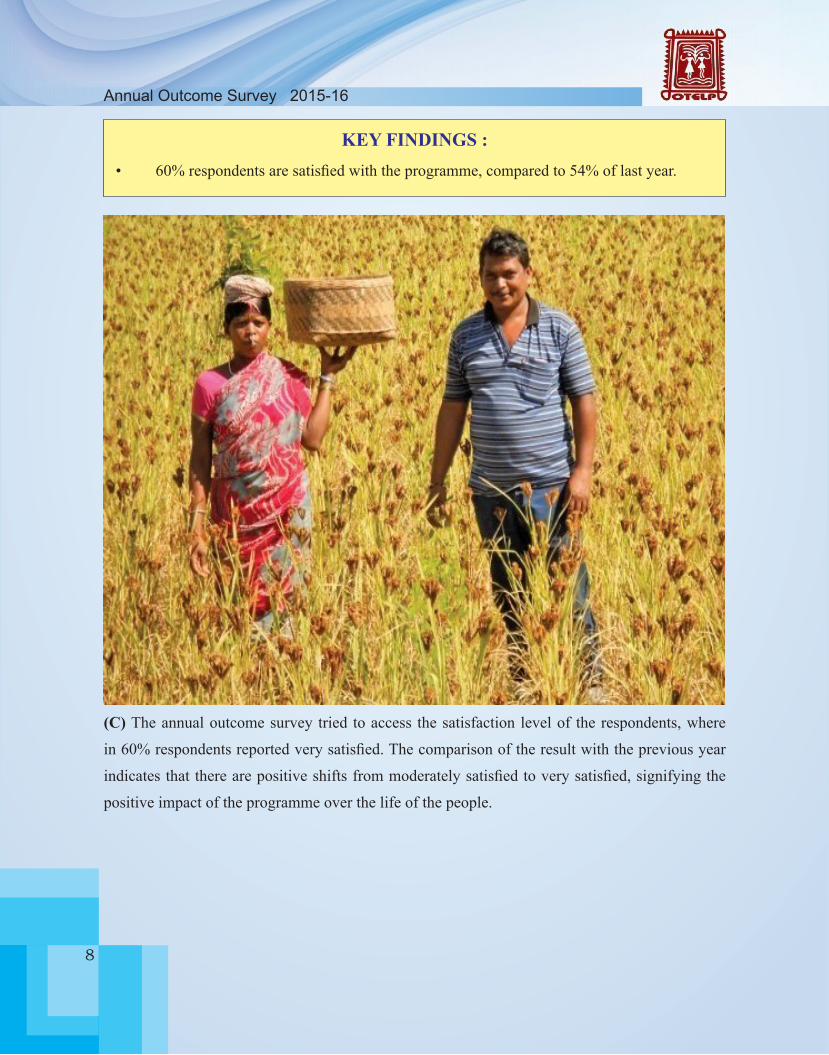
KEY FINDINGS : • 60%respondentsaresatisfiedwiththeprogramme,comparedto54%oflastyear.
(C) The annual outcome survey tried to access the satisfaction level of the respondents, where
in60%respondentsreportedverysatisfied.Thecomparisonoftheresultwiththepreviousyear
indicatesthattherearepositiveshiftsfrommoderatelysatisfiedtoverysatisfied,signifyingthe
positive impact of the programme over the life of the people.

Odisha Tribal Empowerment And Livelihoods Programme (OTELP)
9
Very satised
Moderately satised
Not satised
2015-16
2%
38%60%
Sa�sfac�on about the Project Ac�v��es
2014-15
0%
46% 54%
6335
2 0
50
100
Frequently Occasionally Rarely
2015-16
45 54
0 0
20
40
60
Frequently Occasionally Rarely
Frequency of visits by project staff (Nb of households)
2014-15
Frequency of visits by project staff (Nb of households)
6335
2 0
50
100
Frequently Occasionally Rarely
2015-16
45 54
0 0
20
40
60
Frequently Occasionally Rarely
Frequency of visits by project staff (Nb of households)
2014-15
Frequency of visits by project staff (Nb of households)
The above mentioned chart depicts the positive trend in the satisfaction level of beneficiaryhouseholds during last 2 years indicating the effectiveness of programme. About 60% respondents havereportedthattheyareverysatisfiedincomparisonto54%asincaseoflastyear.
To improve the quality of works and interventions promoted under the programme, the management ensures timely and quality visit of the programme personnel to the villages. However, 63% of respondents said that frequent visits are made by the programme staff where as 35% said occasional visits whereas 2% of the respondent reported rare visit of programme staffs. This minor downward trend may be due to overlapping of phase-I, II and OTELP plus during last year. However, the programmewillfindoutreasonsofitandwillcontinueitsstressonfrequentvisittoreachallthe
communities to ensure qualitative implementation of the programme.

Odisha Tribal Empowerment And Livelihoods Programme (OTELP)Annual Outcome Survey 2015-16
10
KEY FINDINGS :
• 82%offamiliesaredependingonmorethanfoursourcesofincome
compared to 48% last year.
• 99%offamiliesaredependingonatleast2sourcesofincome.
Agriculture and wage employment in agriculture are the primary sources of income for both project and control villages. About 63% of the project households primarily depend upon agriculture and rest on wage employment. Others are landless who earn from wages created through the various government supported projects or working as agriculture labourer during the agriculture season and depends on NTFP.
The other key sources of livelihoods as found out from the study are from the forest and other natural resources which are the tertiary and subsequent income sources of these families. However, the poor families primarily depend upon multiple sources of income to meet annual demand for food and other expenditures. This dependency on multiple sources also works as a coping mechanism
by the poor to reduce the risk of loss of income from any one of the sources.
4. Livelihoods
Odisha Tribal Empowerment And Livelihoods Programme (OTELP)
11
4
144
265
85
0
50
100
150
200
250
300
Main Source 2nd Source 3rd Source 4th Source
Livestock as source of income
20
15
-16
Project
Control
No of income sources per household
0%
20%
40%
60%
80%
100%
At least one source
Two sources
Three sources
Four sources
% h
ouse
hold
s
Number of income sources
No of income sources per household
0%
50%
100%
At least one
source
Two sources
Three sources
Four sources
% h
ouse
hold
s
Number of income sources
99%
99% 96% 78%
100%
99% 94% 82%
20
14
-15
Project
Control
No of income sources per household
0%
20%
40%
60%
80%
100%
At least one source
Two sources
Three sources
Four sources
100%
90% 75%
48%
% h
ouse
hold
s
Number of income sources
No of income sources per household
0%
50%
100%
At least one
source
Two sources
Three sources
Four sources
100%
82% 56%
18%
% h
ouse
hold
s
Number of income sources
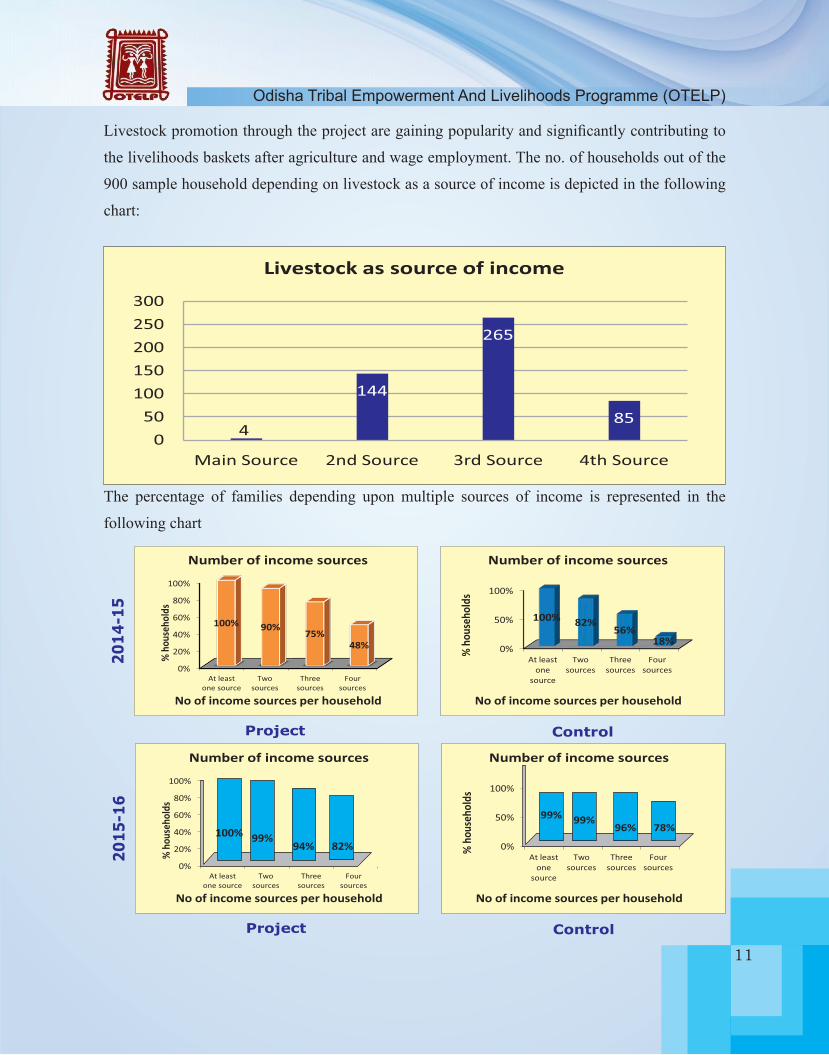
Livestockpromotionthroughtheprojectaregainingpopularityandsignificantlycontributingto
the livelihoods baskets after agriculture and wage employment. The no. of households out of the
900 sample household depending on livestock as a source of income is depicted in the following
chart:
The percentage of families depending upon multiple sources of income is represented in the
following chart

Odisha Tribal Empowerment And Livelihoods Programme (OTELP)Annual Outcome Survey 2015-16
12
In both the project as well as non project villages, though families are depending upon multiple
sources of income, the percentage of families depending upon two, three , four or more sources
in case of programme villages are quite encouraging and indication on adoption of interventions
made by the programme.
KEY FINDINGS :• 99%ofthefamiliesarehavingsurpluscashincomecomparedto97%in2014-15.

Odisha Tribal Empowerment And Livelihoods Programme (OTELP)
13
0
20
40
60
80
100
120
0 1 2 3 4 5
% o
f HH
s
Year 2012-13 from origin
Number of income sources
At least one source ofincome
Two sources
Three sources
Four sources
3%
97%
Households with cash income?
Yes
No
1%
99%
Households with cash income?
Yes
No
2014-15 2015-16
There is also a positive trend of increase in no. of sources of income from various sources over
last5yearsreflectingtheimpactofprojectinterventionswhichcanbeobservedfromthechart
provided below:
Secondly, the cash income at the family level in project villages has also increased over the
years.Followingarethechartsreflectingtheimpactoftheprojectincashincometothefamilyin
comparison to the control villages.
Odisha Tribal Empowerment And Livelihoods Programme (OTELP)Annual Outcome Survey 2015-16
14
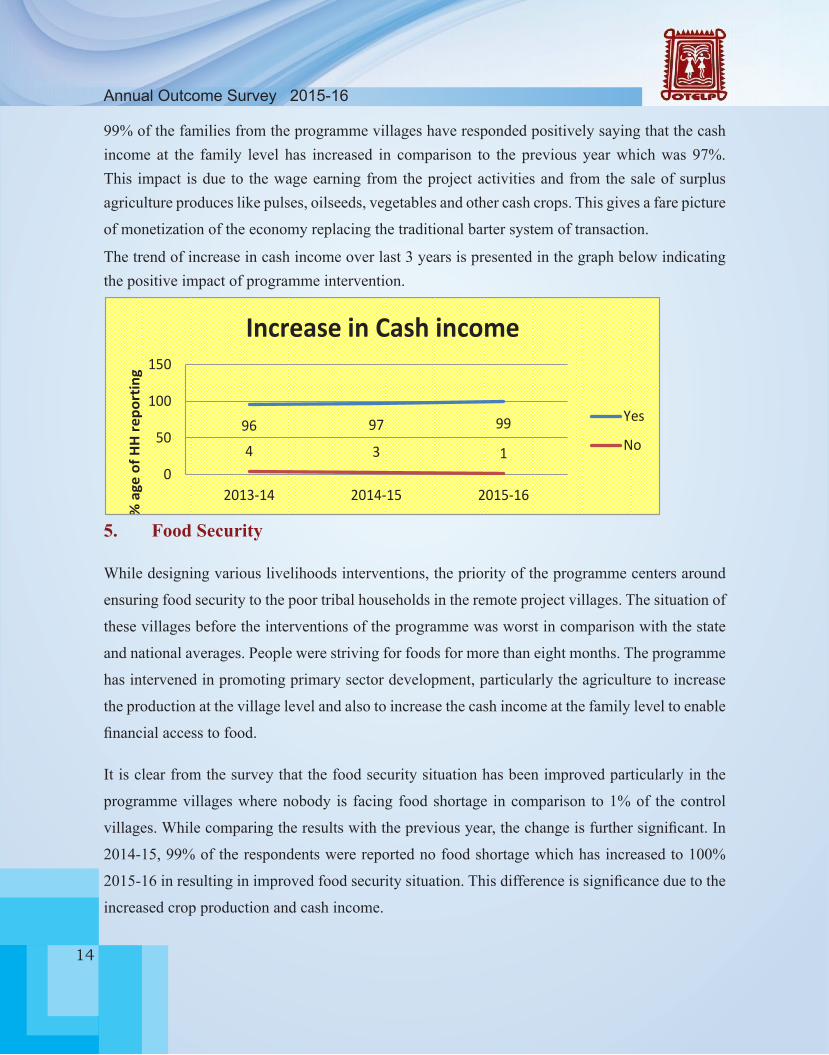
99% of the families from the programme villages have responded positively saying that the cash income at the family level has increased in comparison to the previous year which was 97%. This impact is due to the wage earning from the project activities and from the sale of surplus agriculture produces like pulses, oilseeds, vegetables and other cash crops. This gives a fare picture
of monetization of the economy replacing the traditional barter system of transaction.
The trend of increase in cash income over last 3 years is presented in the graph below indicating the positive impact of programme intervention.
96 97 99
4 3 1 0
50
100
150
2013-14 2014-15 2015-16
% a
ge o
f HH
rep
orti
ng
Increase in Cash income
Yes
No
5. Food Security
While designing various livelihoods interventions, the priority of the programme centers around
ensuring food security to the poor tribal households in the remote project villages. The situation of
these villages before the interventions of the programme was worst in comparison with the state
and national averages. People were striving for foods for more than eight months. The programme
has intervened in promoting primary sector development, particularly the agriculture to increase
the production at the village level and also to increase the cash income at the family level to enable
financialaccesstofood.
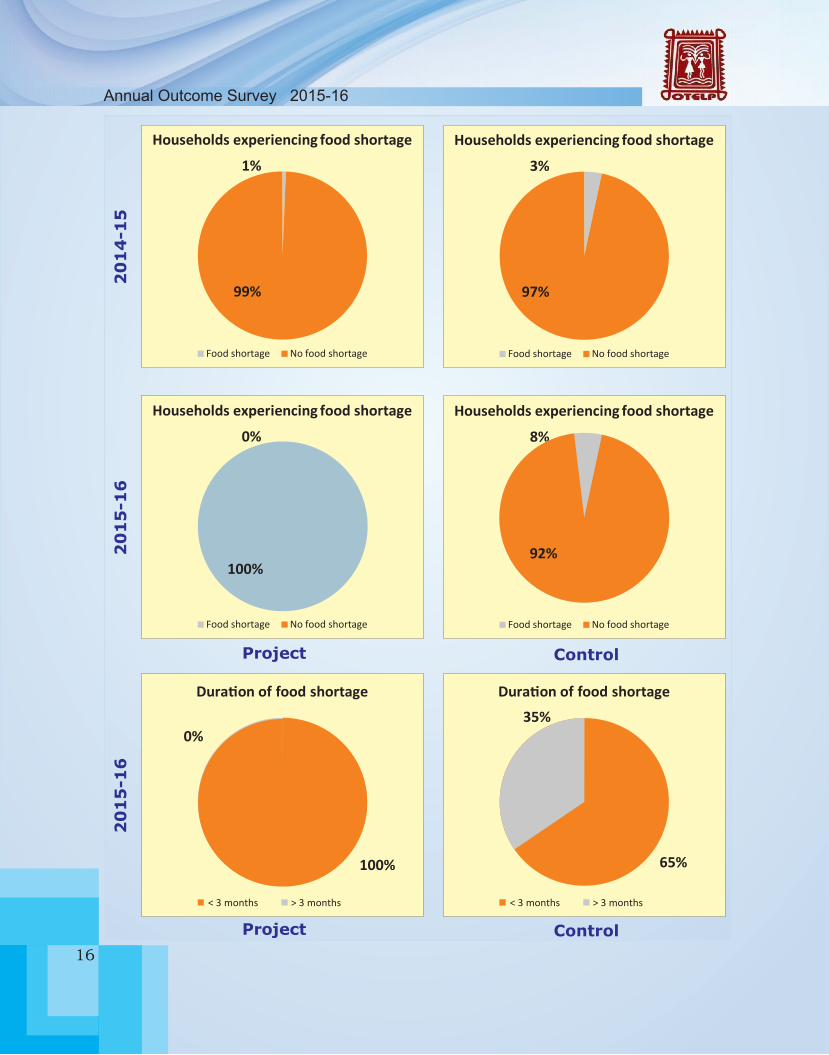
It is clear from the survey that the food security situation has been improved particularly in the
programme villages where nobody is facing food shortage in comparison to 1% of the control
villages.Whilecomparingtheresultswiththepreviousyear,thechangeisfurthersignificant.In
2014-15, 99% of the respondents were reported no food shortage which has increased to 100%
2015-16inresultinginimprovedfoodsecuritysituation.Thisdifferenceissignificanceduetothe
increased crop production and cash income.
Odisha Tribal Empowerment And Livelihoods Programme (OTELP)
15
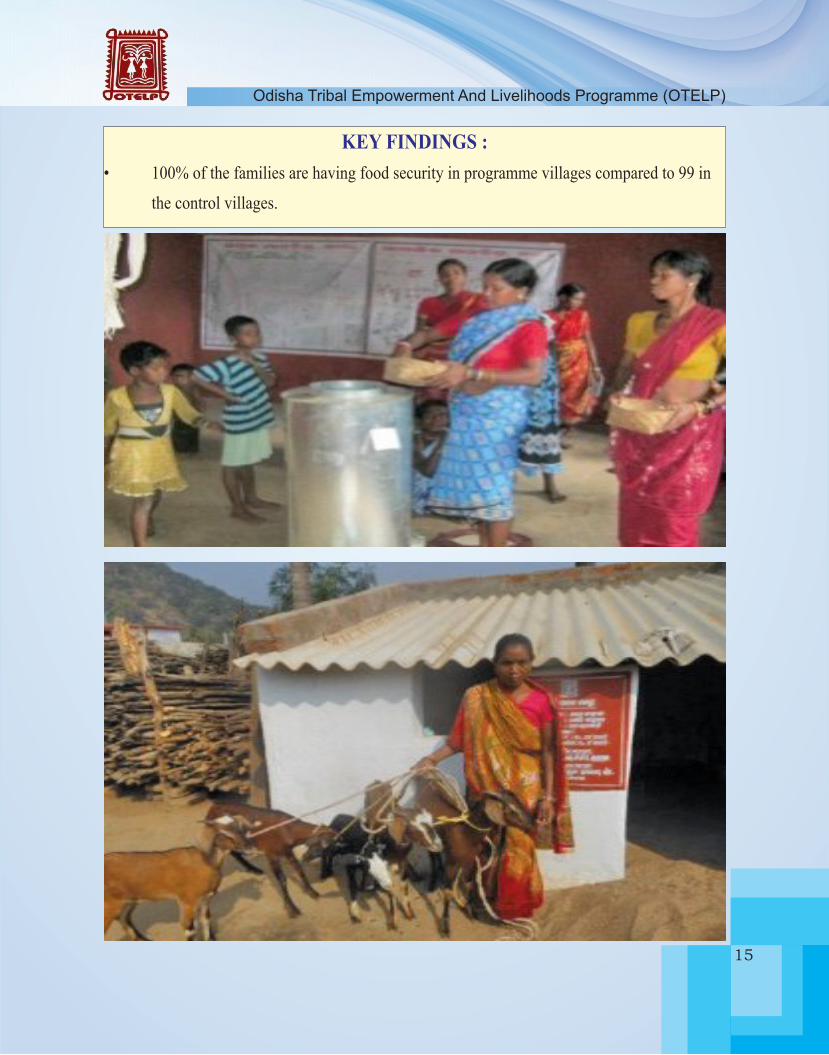
KEY FINDINGS :• 100%ofthefamiliesarehavingfoodsecurityinprogrammevillagescomparedto99in
the control villages.
Odisha Tribal Empowerment And Livelihoods Programme (OTELP)Annual Outcome Survey 2015-16
16
Du on of food shortage
20
15
-16
Households experiencing food shortage
Food shortage No food shortage
20
1-1
4
5
1%
99%
Food shortage No food shortage
3%
97%
Households experiencing food shortage
100% 65%
0% 35%
< 3 months > 3 months < 3 months > 3 months
Project Control
Households experiencing food shortage
Food shortage No food shortage
20
15
-16
0%
Project Control
Food shortage No food shortage
8%
100%
Households experiencing food shortage
Du on of food shortage
92%

Odisha Tribal Empowerment And Livelihoods Programme (OTELP)
17
There is no food shortage with the families in the programme villages, rather it happens in control
villages.Theprogrammehastakensufficientstepsforaddressingfoodinsecuritybylinkingthe
mainstream food and nutritional programmes to these poorest households. These segments of the
family are particularly landless and destitute families, primarily depending upon purchased food.
The project has taken an initiativefor creation of grain banks at SHG level which would address
these households in accessing food.
Becauseofallkindsofefforts,theprogrammecouldmeetthefooddeficitissuesintheprogramme
villages.AsreportedalltheHHsarehavingfoodtoeatwithouthavingfooddeficit.Thefollowing
chart depicts the food security situation in both programme and control villages over past 12
months.
Project
Control
Change in food security situa�on over past 12 months
20%
80%
0%
Improvement
Same
Sit�a�on worse
Change in food security situa�on
over past 12 months
Improvement
Same
Sit�a�on worse
5% 4%
91%
Control
No.
of W
eeks
/Yea
r
Project
No.
of W
eeks
/Yea
r
0.00.00.0
3

Odisha Tribal Empowerment And Livelihoods Programme (OTELP)Annual Outcome Survey 2015-16
18
The below mentioned chart clearly indicates positive trend over last years in food security position,
duration of food shortage and change in food security situation over past 12 months.
6. Land Tenure
Land is the only productive asset for the poor to earn food and income. And ownership over productive land is a crucial factor for secured livelihoods. Programme facilitates the security on land tenure to the poor landless families to ensure that all families have a piece of productive land
to cultivate.
95 99 100
5 1 0 0
50
100
150
%ag
e of
HH
. Rep
orti
ng
Food security
No foodshortage
Foodshortage
50 61
0
50 47
0 0
20406080
%ag
e of
HH
rep
ortin
g
Duration of food shortage
Less than 3weeks
More than3 weeks
32
20 21
9 1 1 -10
0
10
20
30
40
50
60
70
80
90
2013-14 2014-15 2015-16
%ag
e of
HH
rep
orti
ng
Change in food security situation
Improvement
Same
Situation worse
Linear (Situationworse)
Expon. (Situationworse)

Odisha Tribal Empowerment And Livelihoods Programme (OTELP)
19
The ownership over productive land in programme villages are 91% in comparison with control villages where the ownership is about 84%. However when it comes to rights over the property, 86% of respondents of the programme villages replied affirmatively,whereas only 70% fromcontrol villages have reported about their rights. The programme’s continuous effort in addressing issues of landlessness and ensuring property rights to the tribal households is visualized from the following chart showing the positive trend over last 3 years.The second issue on ownership over land is the size of land holding. It was observed from the primary data that in both programme and control conditions the average land holding size is
Land ownership (% hhs owning someproduc�ve land)
91%
9%
Some land
No land
Land ownership (% hhs owning someproduc�ve land)
86%
14%
Some land
No land
Land ownership (% hhs owning someproduc�ve land)
84%
16%
Some land
No land
Households with property rights? Households with property rights?
Yes 86%
No 14%
Yes70%
No30%
Project
Control
93 87 91
7 13 9
020406080
100
%ag
e of
HH
repo
rtin
g Land tenure
Someland
No land
89 86 86
11 14 14
0
50
100
%ag
e of
HH
repo
rtin
g
Households with property rights
Yes
No
Odisha Tribal Empowerment And Livelihoods Programme (OTELP)Annual Outcome Survey 2015-16
20
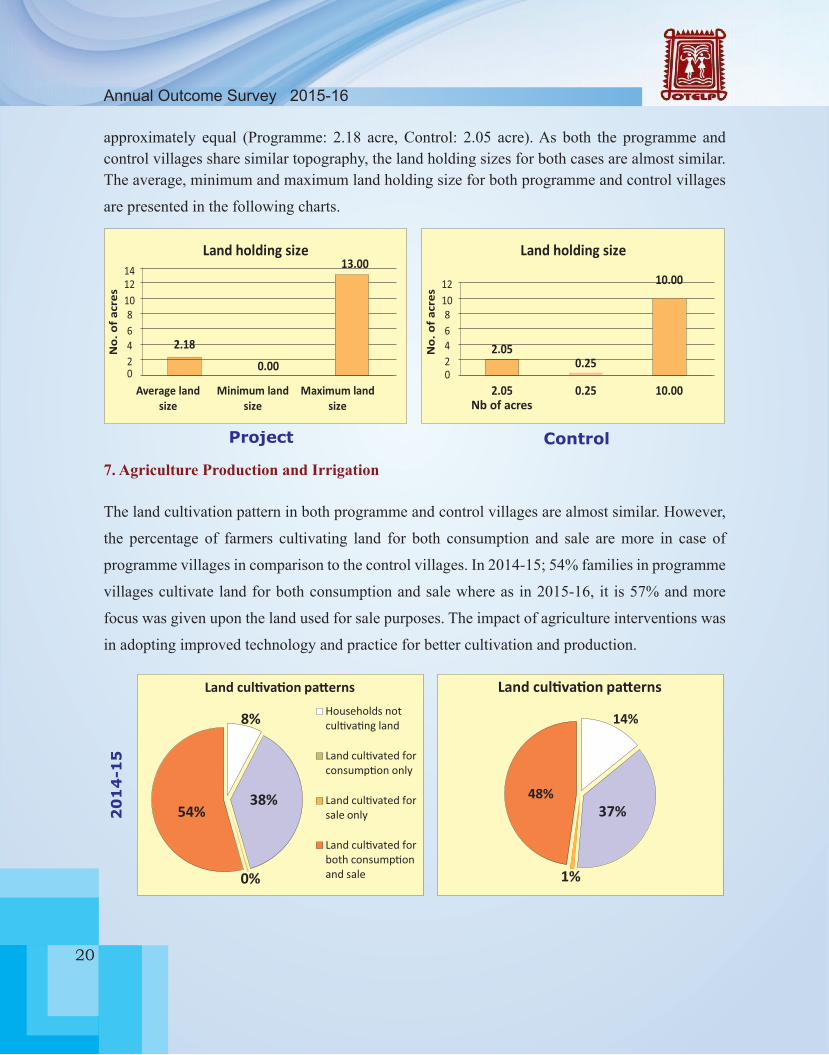
approximately equal (Programme: 2.18 acre, Control: 2.05 acre). As both the programme and control villages share similar topography, the land holding sizes for both cases are almost similar. The average, minimum and maximum land holding size for both programme and control villages
are presented in the following charts.
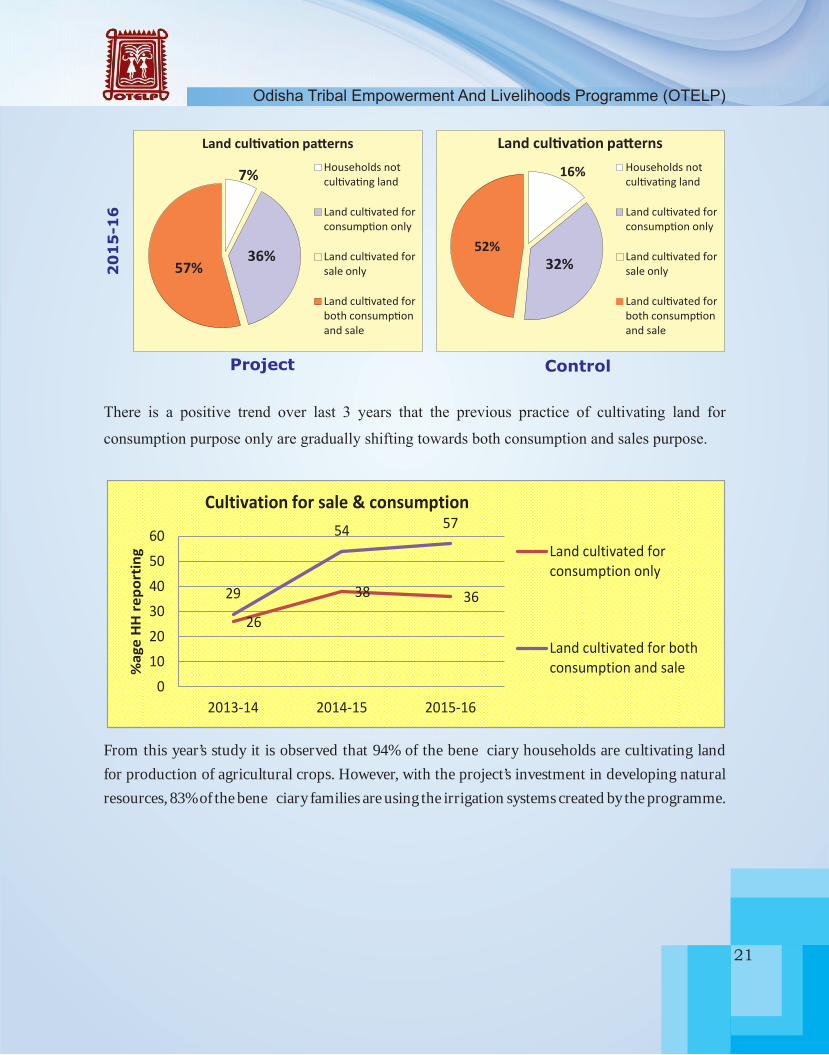
7. Agriculture Production and Irrigation
The land cultivation pattern in both programme and control villages are almost similar. However,
the percentage of farmers cultivating land for both consumption and sale are more in case of
programme villages in comparison to the control villages. In 2014-15; 54% families in programme
villages cultivate land for both consumption and sale where as in 2015-16, it is 57% and more
focus was given upon the land used for sale purposes. The impact of agriculture interventions was
in adopting improved technology and practice for better cultivation and production.
20
15
-16
Households not cul�va�n� land
Land cul�vated for consump�on only
Land cul�vated for sale only
Land cul�vated for both consump�on and sale
Households not cul�va�n� land
Land cul�vated for consump�on only
Land cul�vated for sale only
Land cul�vated for both consump�on and sale
Land �����a��n pa��rns Land �����a��n pa��rns
7%
36% 57%
16%
32% 52%
Project
Control
20
14
-15
Households not cul�va�n� land
Land cul�vated for consump�on only
Land cul�vated for sale only
Land cul�vated for both consump�on and sale
Land �����a��n pa��rns Land �����a��n pa��rns
8%
38%
0%
54%
14%
37%
1%
48%
10.00
0
64
2
8
12
10
0.25
0.25
2.05
2.05 10.00
No
. o
f a
cre
s
Land holding size
Nb of acres
Average land size
Minimum land size
Maximum land size
64
20
8
1214
10
0.00
13.00
2.18
No
. o
f a
cre
s
Land holding size
20
15
-16
Households not cul�va�n� land
Land cul�vated for consump�on only
Land cul�vated for sale only
Land cul�vated for both consump�on and sale
Households not cul�va�n� land
Land cul�vated for consump�on only
Land cul�vated for sale only
Land cul�vated for both consump�on and sale
Land �����a��n pa��rns Land �����a��n pa��rns
7%
36% 57%
16%
32% 52%
Project
Control
20
14
-15
Households not cul�va�n� land
Land cul�vated for consump�on only
Land cul�vated for sale only
Land cul�vated for both consump�on and sale
Land �����a��n pa��rns Land �����a��n pa��rns
8%
38%
0%
54%
14%
37%
1%
48%
Odisha Tribal Empowerment And Livelihoods Programme (OTELP)
21
20
15
-16
Households not cul�va�n� land
Land cul�vated for consump�on only
Land cul�vated for sale only
Land cul�vated for both consump�on and sale
Households not cul�va�n� land
Land cul�vated for consump�on only
Land cul�vated for sale only
Land cul�vated for both consump�on and sale
Land �����a��n pa��rns Land �����a��n pa��rns
7%
36% 57%
16%
32% 52%
Project
Control
20
14
-15
Households not cul�va�n� land
Land cul�vated for consump�on only
Land cul�vated for sale only
Land cul�vated for both consump�on and sale
Land �����a��n pa��rns Land �����a��n pa��rns
8%
38%
0%
54%
14%
37%
1%
48%
There is a positive trend over last 3 years that the previous practice of cultivating land for
consumption purpose only are gradually shifting towards both consumption and sales purpose.
26
38 36 29
54 57
0
10
20
30
40
50
60
2013-14 2014-15 2015-16
%ag
e H
H r
epor
ting
Cultivation for sale & consumption
Land cultivated forconsumption only
Land cultivated for bothconsumption and sale
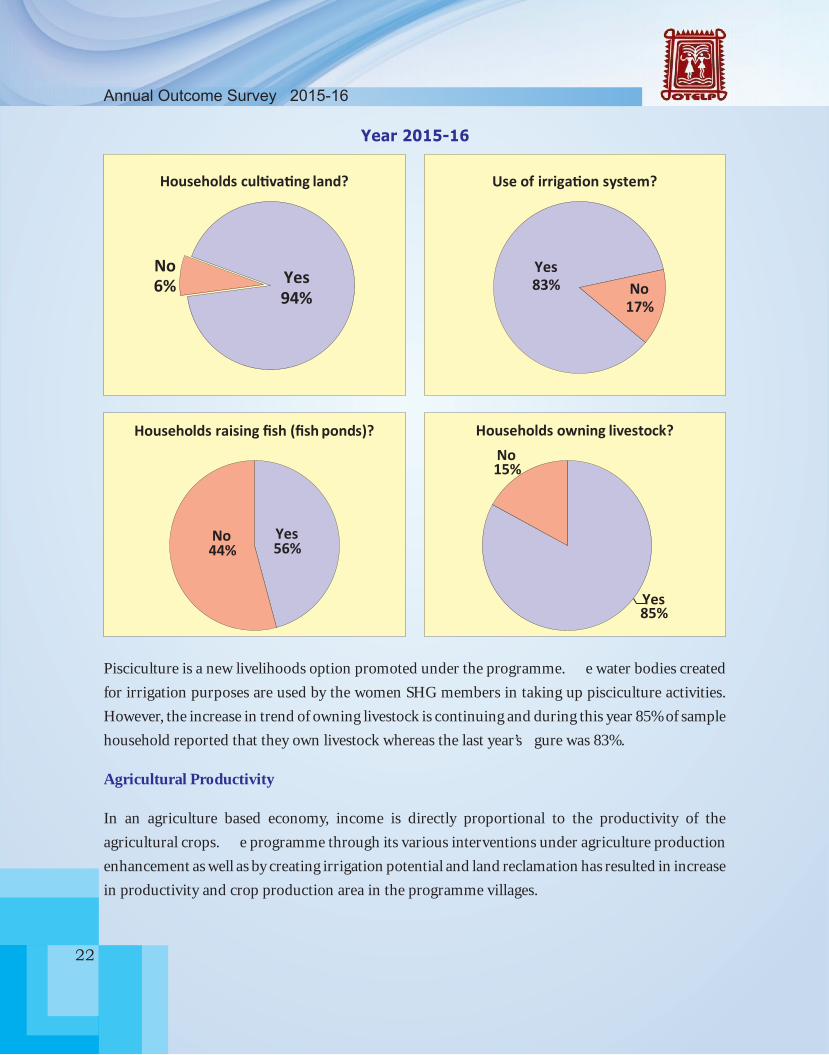
From this year’s study it is observed that 94% of the beneficiary households are cultivating land for production of agricultural crops. However, with the project’s investment in developing natural resources, 83% of the beneficiary families are using the irrigation systems created by the programme.
Odisha Tribal Empowerment And Livelihoods Programme (OTELP)Annual Outcome Survey 2015-16
22
Yes
94%
No
6%
Households cul�va�ng land? Use of irriga�on system?
Yes
83% No17%
Year 2015-16
Households raising fish (fish ponds)? Households owning livestock?
Yes 56%
No 44%
Yes 85%
No 15%
Pisciculture is a new livelihoods option promoted under the programme. The water bodies created for irrigation purposes are used by the women SHG members in taking up pisciculture activities. However, the increase in trend of owning livestock is continuing and during this year 85% of sample household reported that they own livestock whereas the last year’s figure was 83%.
Agricultural Productivity
In an agriculture based economy, income is directly proportional to the productivity of the agricultural crops. The programme through its various interventions under agriculture production enhancement as well as by creating irrigation potential and land reclamation has resulted in increase in productivity and crop production area in the programme villages.

Odisha Tribal Empowerment And Livelihoods Programme (OTELP)
23
KEY FINDINGS :• 78%oftherespondentreportedincreaseinproductivityofvariousAgriculturalcrops
compared to 68% of last year.

Odisha Tribal Empowerment And Livelihoods Programme (OTELP)Annual Outcome Survey 2015-16
24
KEY FINDINGS :• For79%familiesreportedtherehasbeenanincreaseincropproductionarea.
• 90%offamiliesreportedincreaseincropproductionareaduetoprojectintervention.
The data from the primary survey indicates that about 78% of the respondent families have clearly mentioned that there are increases in productivity of various agricultural crops during the past years as against 68% of last year and 87% of the above farmers mentioned this increase has been realized due to the programme interventions on agriculture productivity.
Reported increase in agricultural produc�vity
(% of farmers repor�ng)
22%
37%
33%
8%
No increase
Small increase
Medium increase
Large increase
Increase in crop produc�vity due to project ac�vi�es?
Yes 86%
No 13%
It is also essential to correlate the agriculture productivity with the increase in crop production area and irrigation potential. The programme is creating various land development activities for reclaiming the non cultivated lands. These lands primarily owned by the poor families with no or very low yield from these lands.

Odisha Tribal Empowerment And Livelihoods Programme (OTELP)
25
Similarly, life saving irrigation, particularly in erratic weather condition helps the farmers a lot to secure their crops. Various water bodies, irrigation canals and micro irrigation systems have been created by the programme to create irrigation potential in the programme villages. This provides life saving irrigation during kharif (Rainy) season when there is a dry spell for 10 – 15 days during the season. Besides, the farmers are now taking rabi (winter) crops with the available water from these sources and take second and third crop in one year of time. About 79% of the farmers are reporting that there is an increase in crop production area and 90% of them opine that it’s due to the programme activities.
However it is very interesting to note that 68% of the farmers have reported that the irrigation has been increased and most of them (88%) have said that it’s due to the programme interventions. This impact not only increases the crop production and productivity in these remote tribal villages rather saves the crop loss due to uneven weather conditions and other environmental effects.
Reported increase in crop produc�on area
(% of farmers repor�ng)
21%
37%
42%
No increase
Small increase
Medium increase
Large increase
Increase in crop produc�on area due to project ac��i�es?
No
Yes 90%
10%
Reported increase in size ofirrigated areas
(% of farmers repor�ng)
No increase
Small increase
Medium increase
Large increase
Increase in size of irrigated area due toproject ac��i�es?
Yes 88%
No 12%
32%
2%
22%
44%

Odisha Tribal Empowerment And Livelihoods Programme (OTELP)Annual Outcome Survey 2015-16
26
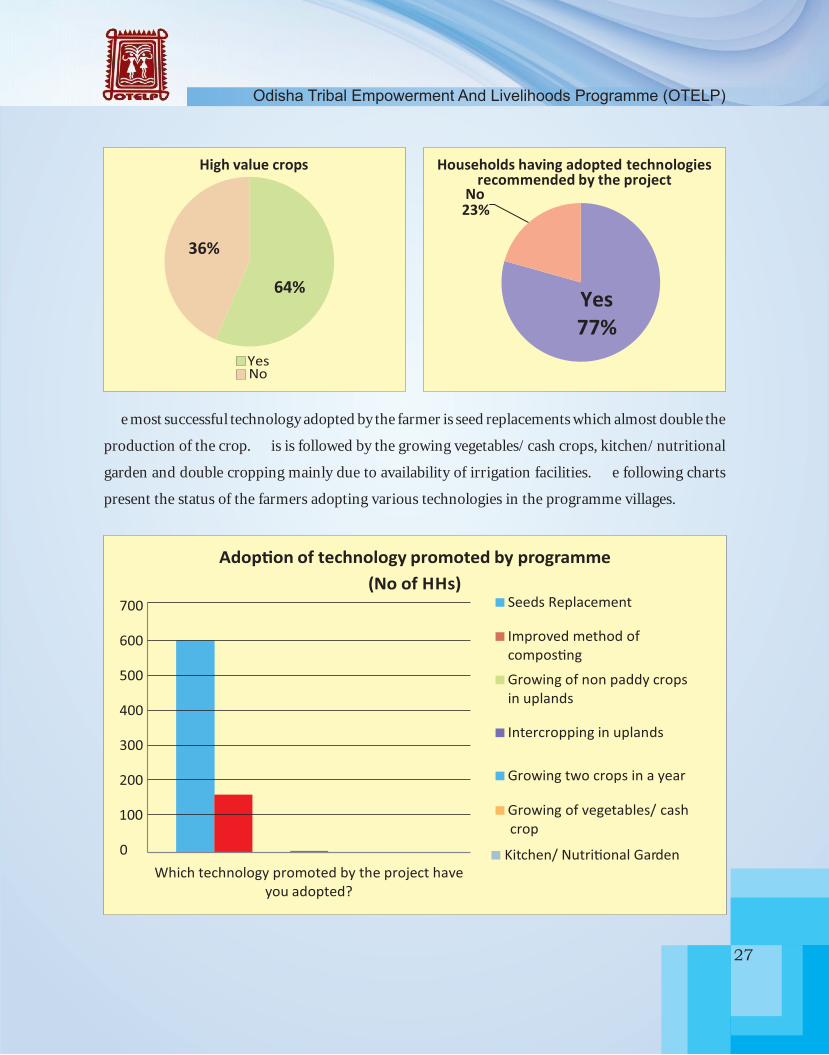
KEY FINDINGS :• 64%farmershaveadoptedgrowingcash/highvaluecrops,inadditiontotheirfoodcrop
compared to only 56% during last year.
Cash crops and high value crops
Just not crop production or productivity, the practice of growing cash/ high value crops by the
farmers have been very encouraging in the programme area. About 64% of the farmers have
adopted growing cash/ high value crops along with their food crop this year in comparison to 56%
during last year. The preferred crops in this category are vegetables, ground nut, sun flower and
cowpea etc. Besides, it is encouraging to observe that 77% of the farmers are now adopting various
agriculture technology promoted by the programme in comparison to 79% during last year.
Odisha Tribal Empowerment And Livelihoods Programme (OTELP)
27
High value crops
YesNo
64%
36%
Households having adopted technologiesrecommended by the project
Yes
77%
No
23%
The most successful technology adopted by the farmer is seed replacements which almost double the
production of the crop. This is followed by the growing vegetables/ cash crops, kitchen/ nutritional
garden and double cropping mainly due to availability of irrigation facilities. The following charts
present the status of the farmers adopting various technologies in the programme villages.
100
0
200
300
400
500
600
700
Which technology promoted by the project have you adopted?
�dop�on of technology promoted by programme
(No of HHs)
Seeds Replacement
Improved method of compos�ng
Growing of non paddy crops in uplands
Intercropping in uplands
Growing two crops in a year
Growing of vegetables/ cash crop
Kitchen/ �utri�onal Garden
Odisha Tribal Empowerment And Livelihoods Programme (OTELP)Annual Outcome Survey 2015-16
28
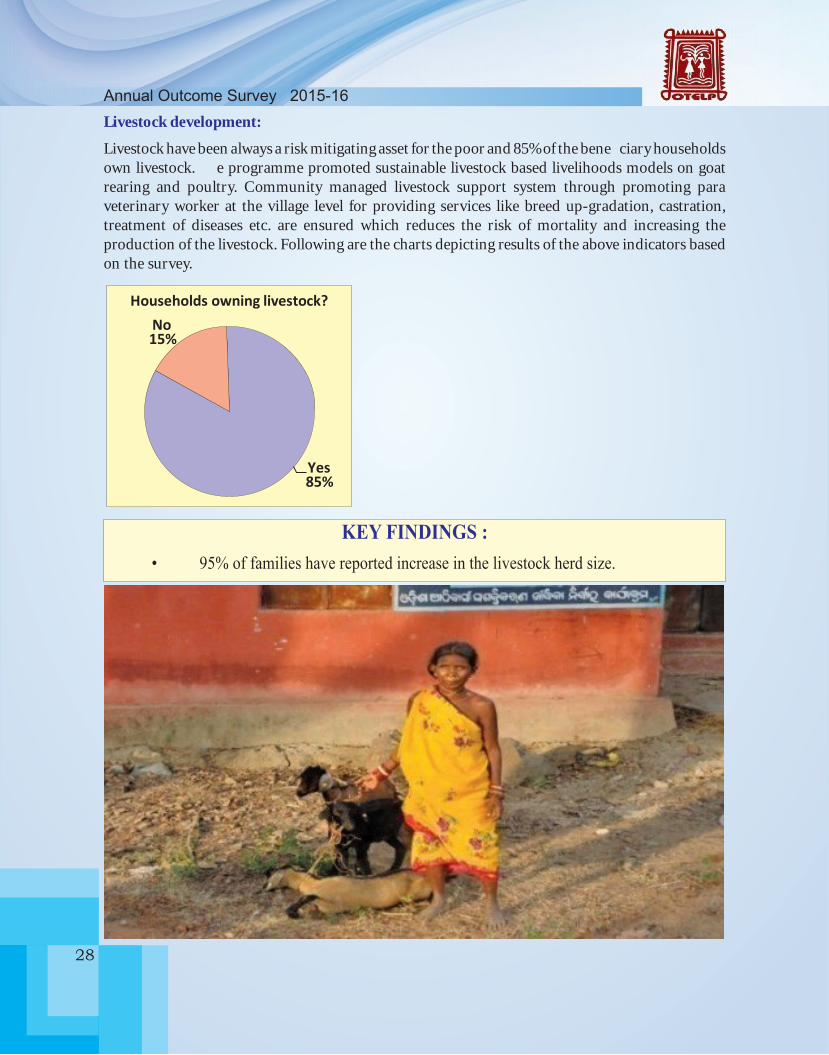
Livestock development:
Livestock have been always a risk mitigating asset for the poor and 85% of the beneficiary households own livestock. The programme promoted sustainable livestock based livelihoods models on goat rearing and poultry. Community managed livestock support system through promoting para veterinary worker at the village level for providing services like breed up-gradation, castration, treatment of diseases etc. are ensured which reduces the risk of mortality and increasing the production of the livestock. Following are the charts depicting results of the above indicators based on the survey.
Yes 85%
No 15%
Households owning livestock?
KEY FINDINGS : • 95%offamilieshavereportedincreaseinthelivestockherdsize.
Odisha Tribal Empowerment And Livelihoods Programme (OTELP)
29
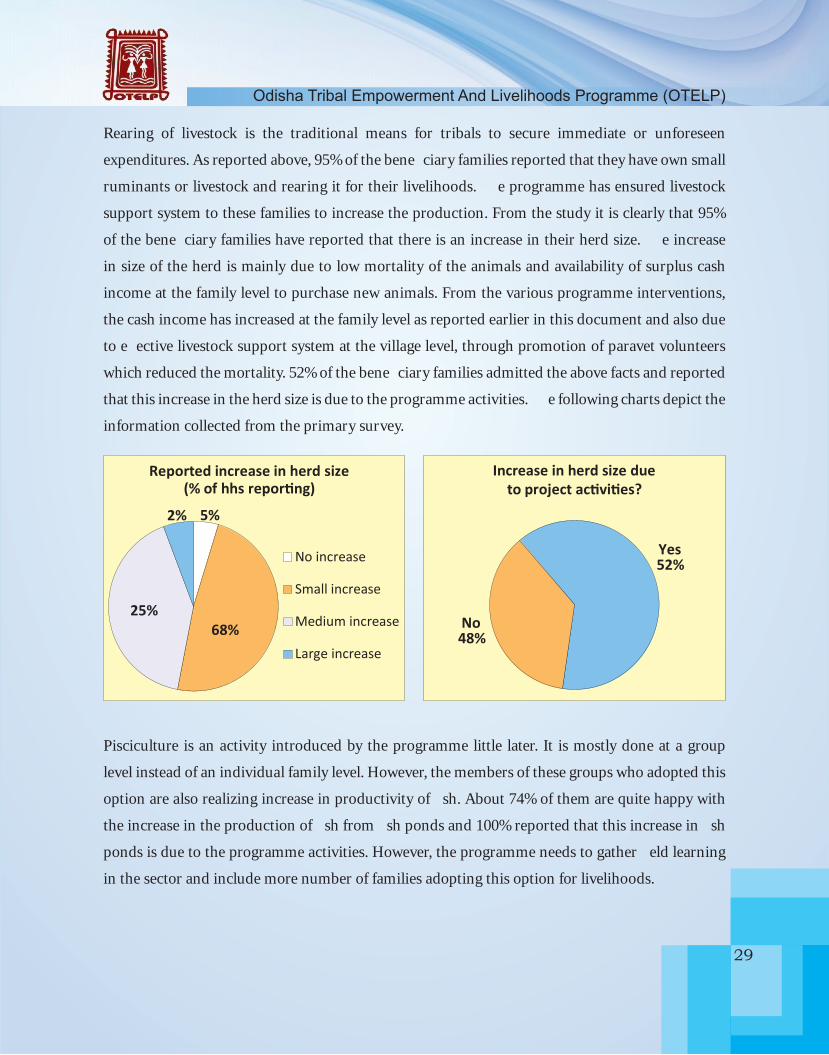
Rearing of livestock is the traditional means for tribals to secure immediate or unforeseen
expenditures. As reported above, 95% of the beneficiary families reported that they have own small
ruminants or livestock and rearing it for their livelihoods. The programme has ensured livestock
support system to these families to increase the production. From the study it is clearly that 95%
of the beneficiary families have reported that there is an increase in their herd size. The increase
in size of the herd is mainly due to low mortality of the animals and availability of surplus cash
income at the family level to purchase new animals. From the various programme interventions,
the cash income has increased at the family level as reported earlier in this document and also due
to effective livestock support system at the village level, through promotion of paravet volunteers
which reduced the mortality. 52% of the beneficiary families admitted the above facts and reported
that this increase in the herd size is due to the programme activities. The following charts depict the
information collected from the primary survey.
Reported increase in herd size(% of hhs repor�n�)
68% 25%
5% 2%
No increase
Small increase
Medium increase
Large increase
Increase in herd size due to project ac��i�es�
Yes52%
No48%
Pisciculture is an activity introduced by the programme little later. It is mostly done at a group
level instead of an individual family level. However, the members of these groups who adopted this
option are also realizing increase in productivity of fish. About 74% of them are quite happy with
the increase in the production of fish from fish ponds and 100% reported that this increase in fish
ponds is due to the programme activities. However, the programme needs to gather field learning
in the sector and include more number of families adopting this option for livelihoods.

Odisha Tribal Empowerment And Livelihoods Programme (OTELP)Annual Outcome Survey 2015-16
30
No increase
Small increase
Medium increase
Large increase
27%
24% 37%
12%
Reported increase in fish ponds produc vity (% of hhs ng)
Yes 86%
No 14%
Increase in fish ponds due
to proj
2014-15
No increase
Small increase
Medium increase
Large increase
Reported increase in fish ponds produc vity (% of hhs ng)
Yes 86%
No 14%
Increase in fish ponds due
to proj
2015-16
25%
7%
42%
4%
8. Access to Market
Not only the production, rather the sale of the surplus agriculture produces and other horticulture
or forest produces have been facilitated by the programme to ensure increased income to the
poor tribal families. Collective Marketing as a strategy have been facilitated by the programme to
promote the sale of surplus agriculture produces in a consolidated manner by ensuring volume
which not only brings down the logistic expenditure but also provides the tribals a better platform
to bargain with the market. This has motivated the farmers to grow particularly more vegetables
and other high value crops which in turn increase the income at the household level.
Odisha Tribal Empowerment And Livelihoods Programme (OTELP)
31
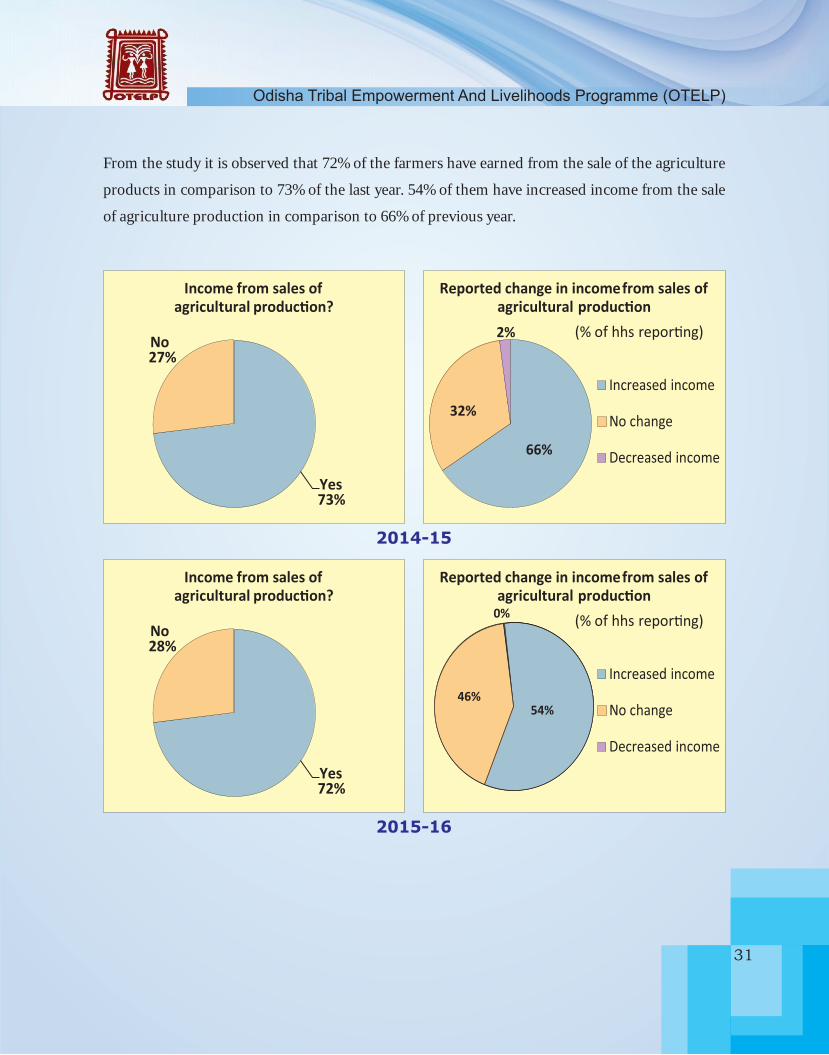
From the study it is observed that 72% of the farmers have earned from the sale of the agriculture
products in comparison to 73% of the last year. 54% of them have increased income from the sale
of agriculture production in comparison to 66% of previous year.
27%
24%
37%
2014-15
Income from sales of agricultural produc�on?
Yes 73%
No 27%
(% of hhs repor�ng)
66%
32%
2%
Increased income
No change
Decreased income
Reported change in income from sales ofagricultural produc�on
2015-16
Income from sales of agricultural produc�on?
46% 54%
0%
Yes 72%
No 28%
(% of hhs repor�ng)
Increased income
No change
Decreased income
Reported change in income from sales ofagricultural produc�on

Odisha Tribal Empowerment And Livelihoods Programme (OTELP)Annual Outcome Survey 2015-16
32
The following chart depicts positive trend in increase in income from sale of agricultural produces
over last three years which has resulted due to continuous effort of programme for productivity
enhancement and linking the surpluses for marketing.
74 73 72
26 27 28
0
20
40
60
80
2013-14 2014-15 2015-16
%ag
e o
f H
H r
ep
ort
ing Increae in income from sale of agricultural produces
Yes
No
Physical access to market for sale of agriculture and other produces by the farmers is a key concern
in the programme locations. These are mostly remote villages where the traders or middle man
visits villages and collect produces from the farmers at the doorstep/ farm gate. This practice not
only restricts the farmer to know the market price of the produces but also being cheated by these
traders in volume and trading in exchange of low value products like salt and other cheap quality
cosmetics. With continuous exposure to market, dissemination of market price information at the
village level the status of such exploitations is reduced and the physical as well as information access
to the market have been improved.
Odisha Tribal Empowerment And Livelihoods Programme (OTELP)
33
27%
24%
37%
20
14
-1
5
Yes 45%
No
55%
Physical access to market improved?Advance sales' contracts
Yes 358
Yes 255
No 324 No
267
0 50
100 150 200 250 300 350 400
Contract for selling pro��c�on?
Contract impro�e� opera�n con�i�ons ?
Advance sales' contracts
Yes
354 Yes 314
No158
No
176
0 50
100 150 200 250 300 350 400
Contract for selling pro��c�on?
Contract impro�e� opera�n con�i�ons ?
20
15
-1
6
Physical access to market i mproved?
Yes59%
Yes41%
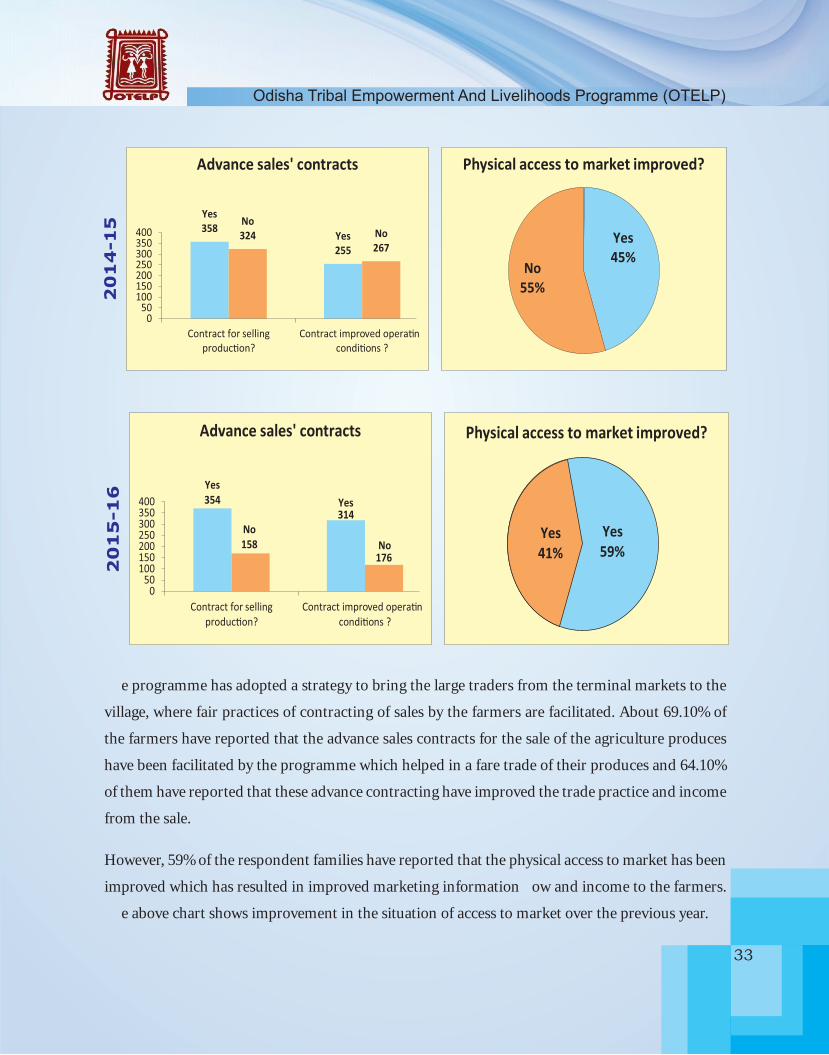
The programme has adopted a strategy to bring the large traders from the terminal markets to the
village, where fair practices of contracting of sales by the farmers are facilitated. About 69.10% of
the farmers have reported that the advance sales contracts for the sale of the agriculture produces
have been facilitated by the programme which helped in a fare trade of their produces and 64.10%
of them have reported that these advance contracting have improved the trade practice and income
from the sale.
However, 59% of the respondent families have reported that the physical access to market has been
improved which has resulted in improved marketing information flow and income to the farmers.
The above chart shows improvement in the situation of access to market over the previous year.
Odisha Tribal Empowerment And Livelihoods Programme (OTELP)Annual Outcome Survey 2015-16
34
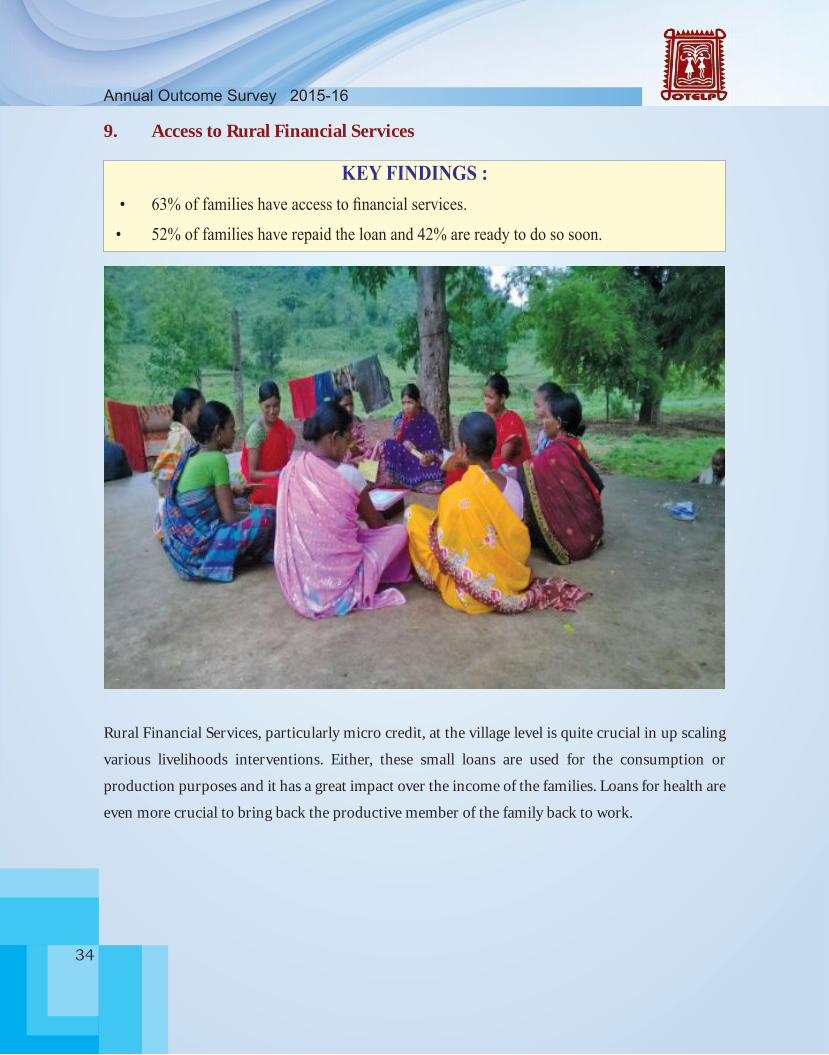
KEY FINDINGS :• 63%offamilieshaveaccesstofinancialservices.
• 52%offamilieshaverepaidtheloanand42%arereadytodososoon.
Rural Financial Services, particularly micro credit, at the village level is quite crucial in up scaling
various livelihoods interventions. Either, these small loans are used for the consumption or
production purposes and it has a great impact over the income of the families. Loans for health are
even more crucial to bring back the productive member of the family back to work.
9. Access to Rural Financial Services

Odisha Tribal Empowerment And Livelihoods Programme (OTELP)
35
27%
24%
37%
Access to credit over past 12 months?
Yes
74%
No
26%
Improved access to credit?
Yes63%
No
37%
Access to credit improved thanksto project ac�vi�es?
Source of credit
Informal Formal
33%
67%
No18%
Yes
82%
No18%
Yes
82%
63% of the households have reported that, in past 12 months they have taken loan from the rural
financial services. 74% of the households have improved access to credit and 82% of them have
reported that due to the programme interventions, the access to credit over past years have been
improved. However, 67% of the households have taken loan from the informal sources.
27%
24%
37%
No18%
Yes
82%
29131.74603
200
10000
0 2000 4000 6000 8000
10000 12000
Average amount of
creditUSD
Mininimum amount
borrowed
Maximum amount
borrowed
Average, minimum and maximum amounts borrowed over past 12 months
Consump�on
21% Income genera�ng
ac�vi�es 68%
Other
investments
7%
Educa�on
2% Health 2%
Main use of credit
Odisha Tribal Empowerment And Livelihoods Programme (OTELP)Annual Outcome Survey 2015-16
36
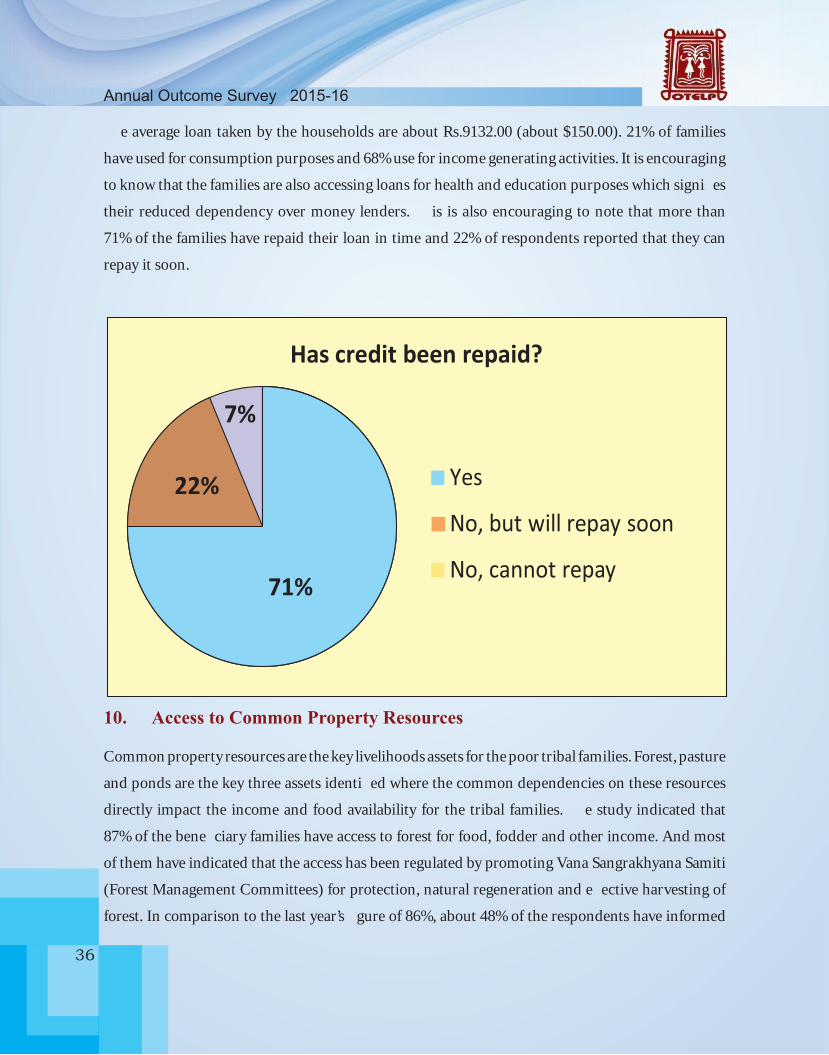
The average loan taken by the households are about Rs.9132.00 (about $150.00). 21% of families
have used for consumption purposes and 68% use for income generating activities. It is encouraging
to know that the families are also accessing loans for health and education purposes which signifies
their reduced dependency over money lenders. This is also encouraging to note that more than
71% of the families have repaid their loan in time and 22% of respondents reported that they can
repay it soon.
27%
24%
37%
Has credit been repaid?
Yes
No, but will repay soon
71%
7%
22%
No, cannot repay
10. Access to Common Property Resources
Common property resources are the key livelihoods assets for the poor tribal families. Forest, pasture
and ponds are the key three assets identified where the common dependencies on these resources
directly impact the income and food availability for the tribal families. The study indicated that
87% of the beneficiary families have access to forest for food, fodder and other income. And most
of them have indicated that the access has been regulated by promoting Vana Sangrakhyana Samiti
(Forest Management Committees) for protection, natural regeneration and effective harvesting of
forest. In comparison to the last year’s figure of 86%, about 48% of the respondents have informed

Odisha Tribal Empowerment And Livelihoods Programme (OTELP)
37
that during the year, the access has been improved and almost all the respondent said that the
productivity from the forest has been increased over a period of one years’ time. However, various
activities like forest demarcation, silvicultural operations, plantation and protection for natural
regeneration has fostered the forest growth and also availability of forest produces for the poor
tribal families.
27%
24%
37%
Yes
87%
No 13%
Access to forests
50%
0%
10%
20%
30%
70%
80%
90%
100%
40%
60%
% h
ou
seh
old
s �
�h
acc
ess
Is this access regulated?
Has your access
improved?
Produc�vity of forests
increased this year?
Improvement thanks to project
ac�vi�es?
No Yes
Forest resources: access and produc�vity
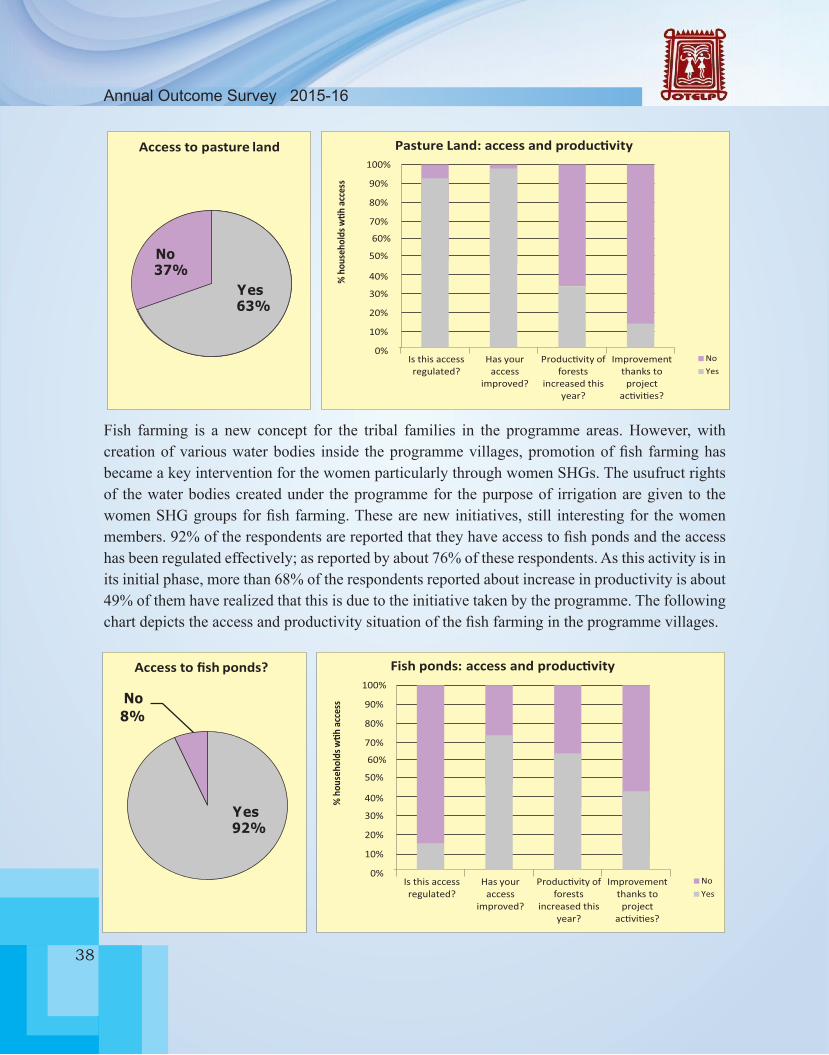
The second key resource for the poor is the pasture land for grazing of cattle and other domestic
animals. Development of the pasture land for increased availability of fodder for the animals is
one of the key interventions of the programme. Promoting improved varieties of fodder with
improved practices of harvesting has increased the fodder availability at the village level. 87% of
the respondents’ families have said that they are accessing forest land for the collection of fodder
for their animals and most of them again reported that the better management practices have been
effectively regulated the access. However, about 46% of the respondents reported that the access has
been improved along with the productivity of the forest land. However, the free grazing practice
after the kharif (rain) agriculture season among the tribal is an issue to be addressed. The change
of practice from free grazing to the control grazing would further improve the situation in the
management of the pasture land and its productivity. The following chart presents the status of the
access and productivity of the pasture land. 63% reported that they have access to pasture land and
out of them 99% said access has been improved and it s due to project.
Odisha Tribal Empowerment And Livelihoods Programme (OTELP)Annual Outcome Survey 2015-16
38
27%
24%
37%
50%
0%
10%
20%
30%
70%
80%
90%
100%
40%
60%
% h
ouse
hold
s �
�h
acce
ss
Is this access regulated?
Has your access
improved?
Produc�vity of forests
increased this year?
Improvement thanks to project
ac�vi�es?
No Yes
Pasture Land: access and produc�vityAccess to pasture land
Yes
No
63%
37%
Fish farming is a new concept for the tribal families in the programme areas. However, with creationofvariouswaterbodies inside theprogrammevillages,promotionoffish farminghasbecame a key intervention for the women particularly through women SHGs. The usufruct rights of the water bodies created under the programme for the purpose of irrigation are given to the womenSHGgroupsforfishfarming.Thesearenewinitiatives,still interestingfor thewomenmembers.92%oftherespondentsarereportedthattheyhaveaccesstofishpondsandtheaccesshas been regulated effectively; as reported by about 76% of these respondents. As this activity is in its initial phase, more than 68% of the respondents reported about increase in productivity is about 49% of them have realized that this is due to the initiative taken by the programme. The following chartdepictstheaccessandproductivitysituationofthefishfarmingintheprogrammevillages.
27%
24%
37%
50%
0%
10%
20%
30%
70%
80%
90%
100%
40%
60%
% h
ouse
hold
s �
�h
acce
ss
Is this access regulated?
Has your access
improved?
Produc�vity of forests
increased this year?
Improvement thanks to project
ac�vi�es?
No Yes
Fish ponds: access and produc�vityAccess to fish ponds?
Yes
No
92%
8%

Odisha Tribal Empowerment And Livelihoods Programme (OTELP)
39
Annexure I
SL NO
DISTRICT ITDA BLOCK NO. OF SAMPLE VILLAGE
NO. OF CONTROL VILLAGE
TOTAL
1 Gajapati Paralakhemundi Gumma 3 2 5 2 Gajapati Paralakhemundi Mohana 3 1 4 3 Gajapati Paralakhemundi Nuagada 3 2 5 4 Gajapati Paralakhemundi R.Udayagiri 3 1 4 5 Gajapati Paralakhemundi Rayagada 3 2 5
Gajapati Total 5 15 8 23 6 Kalahandi Th. Rampur Lanjigarh 8 4 12 7 Kalahandi Th. Rampur Th.Rampur 9 5 14
Kalahandi Total 2 17 9 26 8 Kandhamal Baliguda Balliguda 4 2 6 9 Kandhamal Baliguda Daringibadi 2 1 3
10 Kandhamal Baliguda K.Nuagaon 4 2 6 11 Kandhamal Baliguda Kotagarh 3 1 4 12 Kandhamal Baliguda Tumudibandha 4 2 6 13 Kandhamal Baliguda Chakapada 0 14 Kandhamal Baliguda Raikia 0 15 Kandhamal Baliguda Tikabali 0
Kandhamal Total 5 17 8 25
16 Koraput Koraput Bandhugaon 2 1 3 17 Koraput Koraput Dasamantpur 2 1 3 18 Koraput Koraput Laxmipur 1 1 2 19 Koraput Koraput Nandapur 6 3 9 20 Koraput Koraput Narayanpatna 3 1 4 21 Koraput Koraput Pottangi 4 2 6 22 Koraput Koraput Semiliguda 4 2 6
Koraput Total 7 22 11 33 23 Malkanagiri Malkangiri Khairput 2 1 3 24 Malkanagiri Malkangiri Kudumuluguma 4 2 6 25 Malkanagiri Malkangiri Mathili 1 0 1
Malkanagiri Total 3 7 3 10
26 Nabarangpur Nabarangpur Jharigaon 2 1 3 27 Nabarangpur Nabarangpur Kosagumuda 0 28 Nabarangpur Nabarangpur Papdahandi 1 1 2 29 Nabarangpur Nabarangpur Tentulikhunti 0
Nabarangpur Total 3 3 2 5
30 Rayagada Gunpur Bissamcuttack 2 1 3 31 Rayagada Gunpur Chandrapur 2 1 3 32 Rayagada Gunpur Gudari 1 0 1 33 Rayagada Gunpur Kasipur 1 0 1 34 Rayagada Gunpur Muniguda 3 2 5
Rayagada Total 5 9 4 13
Grand Total 30 90 45 135
BLOCK WISE ABSTRACT OF SAMPLE AND CONTROL VILLAGES
DISTRCT WISE ABSTRACT OF SAMPLE & CONTROL VILLAGES FOR ANNUAL OUTCOME SURVEY: 2015-16
SL NO ITDA NO. OF
BLOCKS
NO. OF SAMPLE VILLAGE
NO. OF CONTROL VILLAGE
TOTAL
NO OF HHS IN SAMPLE
VILLAGES
NO OF HHS IN SAMPLE
VILLAGES
TOTAL
1 KORAPUT 7 22 11 33 220 110 330
2 MALKANGIRI 3 7 3 10 70 30 100
3 NABARANGPUR 3 3 2 5 30 20 50
4 TH. RAMPUR 2 17 9 26 170 90 260
5 RAYAGADA 5 9 4 13 90 40 130
6 BALIGUDA 5 17 8 25 170 80 250
7 PARALAKHEMUNDI 5 15 8 23 150 80 230
Grand Total 30 90 45 135 900 450 1350
Odisha Tribal Empowerment And Livelihoods Programme (OTELP)Annual Outcome Survey 2015-16
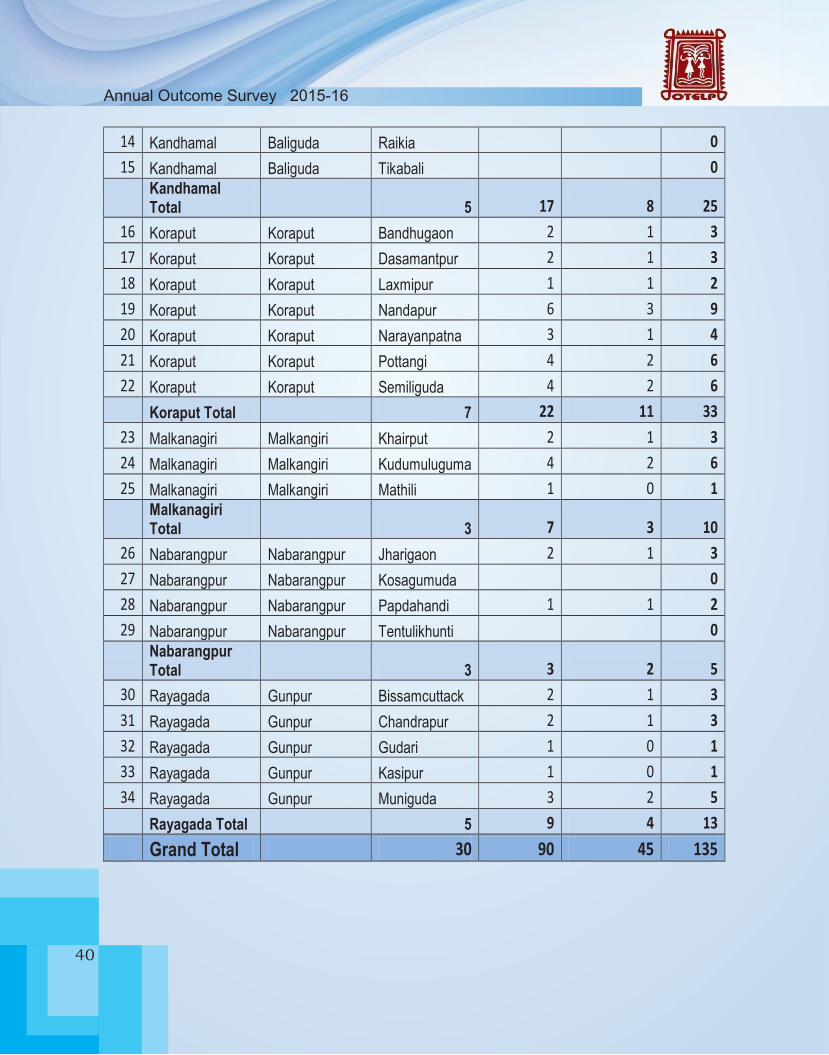
40
SL NO
DISTRICT ITDA BLOCK NO. OF SAMPLE VILLAGE
NO. OF CONTROL VILLAGE
TOTAL
1 Gajapati Paralakhemundi Gumma 3 2 5 2 Gajapati Paralakhemundi Mohana 3 1 4 3 Gajapati Paralakhemundi Nuagada 3 2 5 4 Gajapati Paralakhemundi R.Udayagiri 3 1 4 5 Gajapati Paralakhemundi Rayagada 3 2 5
Gajapati Total 5 15 8 23 6 Kalahandi Th. Rampur Lanjigarh 8 4 12 7 Kalahandi Th. Rampur Th.Rampur 9 5 14
Kalahandi Total 2 17 9 26 8 Kandhamal Baliguda Balliguda 4 2 6 9 Kandhamal Baliguda Daringibadi 2 1 3
10 Kandhamal Baliguda K.Nuagaon 4 2 6 11 Kandhamal Baliguda Kotagarh 3 1 4 12 Kandhamal Baliguda Tumudibandha 4 2 6 13 Kandhamal Baliguda Chakapada 0 14 Kandhamal Baliguda Raikia 0 15 Kandhamal Baliguda Tikabali 0
Kandhamal Total 5 17 8 25
16 Koraput Koraput Bandhugaon 2 1 3 17 Koraput Koraput Dasamantpur 2 1 3 18 Koraput Koraput Laxmipur 1 1 2 19 Koraput Koraput Nandapur 6 3 9 20 Koraput Koraput Narayanpatna 3 1 4 21 Koraput Koraput Pottangi 4 2 6 22 Koraput Koraput Semiliguda 4 2 6
Koraput Total 7 22 11 33 23 Malkanagiri Malkangiri Khairput 2 1 3 24 Malkanagiri Malkangiri Kudumuluguma 4 2 6 25 Malkanagiri Malkangiri Mathili 1 0 1
Malkanagiri Total 3 7 3 10
26 Nabarangpur Nabarangpur Jharigaon 2 1 3 27 Nabarangpur Nabarangpur Kosagumuda 0 28 Nabarangpur Nabarangpur Papdahandi 1 1 2 29 Nabarangpur Nabarangpur Tentulikhunti 0
Nabarangpur Total 3 3 2 5
30 Rayagada Gunpur Bissamcuttack 2 1 3 31 Rayagada Gunpur Chandrapur 2 1 3 32 Rayagada Gunpur Gudari 1 0 1 33 Rayagada Gunpur Kasipur 1 0 1 34 Rayagada Gunpur Muniguda 3 2 5
Rayagada Total 5 9 4 13
Grand Total 30 90 45 135

Odisha Tribal Empowerment And Livelihoods Programme (OTELP)
41
Annexure - IIKey Informant Interview
Participants:a. VDC Secretaryb. VLSCLeaders/VDCMemebrKey Questionsa. What is the background of the village – Demography, social structure, tribe, migration etc.b. How do the people in the village live - What are the key sources of income?c. When OTELP started in your village?d. What are the processes of planning for the implementation of the programme?e. Whoarethebeneficiariesoftheprogramme?f. What are the major activities you have planned and implemented under the programme?g. Howdoyouidentifyactivitiesandbeneficiariesforaparticularactivity?h. Whatarethebenefitscommunityisgettingoutoftheimplementationoftheprogramme?i. What are the key impacts of the programme on people and on your village?j. Is the programme interventions has improved the income of the people in the village?k. How many families in your village have improved their living conditions – Food Security, Drinking Water, Sanitation, Housing, Road, Education, Health etc.l. What are the activities you could not cover under this programme?m. How do you plan to cover the pending activities?n. Who manages the programme on your behalf?o. How your VDC and VLSC meetings are organised?p. Do you know about Village Social and Financial Audit Sub Committee? How does that function?q. Does the poorest of the poor in your village have covered under the programme intervention? If yes how and how many? Please indicate the key activities?r. Didyourvillagehaveimprovedinaccessingthebenefitsfrommainstreamgovernment runprogrammes(NREGA/PDS/Anganwadi/MDM/ANM/ASHAetc)?Ifyes,howand how many families?s. Who monitors the activities in your village for better implementation?t. After the intervention of the programme weather any member/ person from your village have promoted as a leader in PRI systems?
Odisha Tribal Empowerment And Livelihoods Programme (OTELP)Annual Outcome Survey 2015-16
42
Focused Group Discussion (FGD)a. Theme 1: Participatory Planning and Implementation (Capacity Building, promoting leadership etc.) Key Participants: VDC members, SHG members, Village Volunteers etc.i. How do you indentify the activities to be implemented in your village under the programme?ii. Who are the stakeholders involved in the process of preparation of the plan?iii. Does women and poorest of the poor in the village are included or not?iv. What are the tools you adopted for the preparation of the plan?v. Have the proposals from women and vulnerable section are included in the plan or not?vi. Is anyone from your village are attended any training from the programme? If yes, what are the trainings and how many persons?vii. After the training how are they helping the community in identifying issues and resolving these?viii. Does anyone from your VDC/ VLSC members have participated in previous GP election? If yes, weather he/ she owned or lost? b. Theme 2: Livelihoods Improvement and Food security (Agriculture+ Livestock + NRM) Key Participants: Farmers, Village Agriculture Volunteer, Village Livestock Volunteers, SHG members doing agriculture etc.i. What are the crops farmers used to grow before the programme and what is the productivity of those crops?ii. What was the productivity of paddy (primary food crop) before start of OTELP and present productivity per acre. iii. What new crop and/ or practices the programme brought to the farmers?iv. Does the farmers are adopting these technologies promoted by the programme? If yes, which are mostly adopted and why?v. What was the % of land in the village covered under Rabi cropping
Odisha Tribal Empowerment And Livelihoods Programme (OTELP)
43
(2ndcrop) before the start of OTELP and present status.vi. How many % of households have enough food throughout the year before start of the OTELP and present status.vii. How many % of households access their entitlement from PDS.viii. How many % of households were replacing their seeds with quality/ certified seeds before start of OTELP and present status.ix. How many % of households engaged in livestock rearing and what is the average income per household before start of OTELP and present status.x. How does the OTELP programme supports families with livestock for better rearing and income?xi. Does irrigation and other land development activities helped farmers in producing more crops? If yes, how and how much?xii. Does the community from the programme villages have adopted better management practices of livestock such as backyard poultry, goat rearing, fish farming etc.xiii. How the village livestock volunteer helps the community in delivering services?xiv. What is the average annual income per household from all sources?
c. Theme 3: Land rights and increase of income Key participants: Landless families, VDC Secretary, Village Volunteers etc.i. How many landless families are living in your village before the programme intervention?ii. Does these families have encroached land in village or nearby?iii. Does these families have got any land after the programme interventions from various schemes such as OPLE, OGLS, Forest Rights Act, Vasundhara etc.iv. Are the families who received land rights are on possession over these lands?v. Are they cultivating these lands or keeping it fallow?vi. Does the programme has invested in development of those lands like bunding, levelling, irrigation, plantation etc.?
Odisha Tribal Empowerment And Livelihoods Programme (OTELP)Annual Outcome Survey 2015-16
44
vii. Does the income of these families increased after settlement of their land?viii. Does these families changed to improved agriculture practices after settlement of land?ix. Does any family still remain landless at this point of time.
d. Theme 4: Value Addition and Marketing. Key participants: SHG Members, Farmers, Village Traders, owner of village micro enterprise etc.i. What are the key agriculture products (Ragi, Niger, Paddy, Maize etc.), horticulture products (cashew, mango, tamarind, pineapple, jackfruit etc.) and Minor Forest Products (Mahua, char seeds, Harida, Bahada, Honey, Broom, Siali Leaf etc.) does people of the village collect/ produce?ii. Are the productions/ collection of these products are for own consumption or sale?iii. If you sale, what percentage of the total products you sale?iv. Does the traders come to village to buy your products or you go to market for selling?v. Are the products sold in raw form or you add value to it (cleaning, grading, packaging, processing etc.)?vi. If you do value addition then what are those?vii. Does the value addition made to all produces or for the share of produces you sold?viii. Does your village have facility for storing? If yes, how much it can store and who controls the storage?ix. Does programme promoted any selling or value addition event in your village?x. How many women SHGs are involved in this process?xi. Does it giving any profit to the SHGs and to its Members?xii. What is your future planning for organising marketing events promoted by the programme?
Odisha Tribal Empowerment And Livelihoods Programme (OTELP)
45
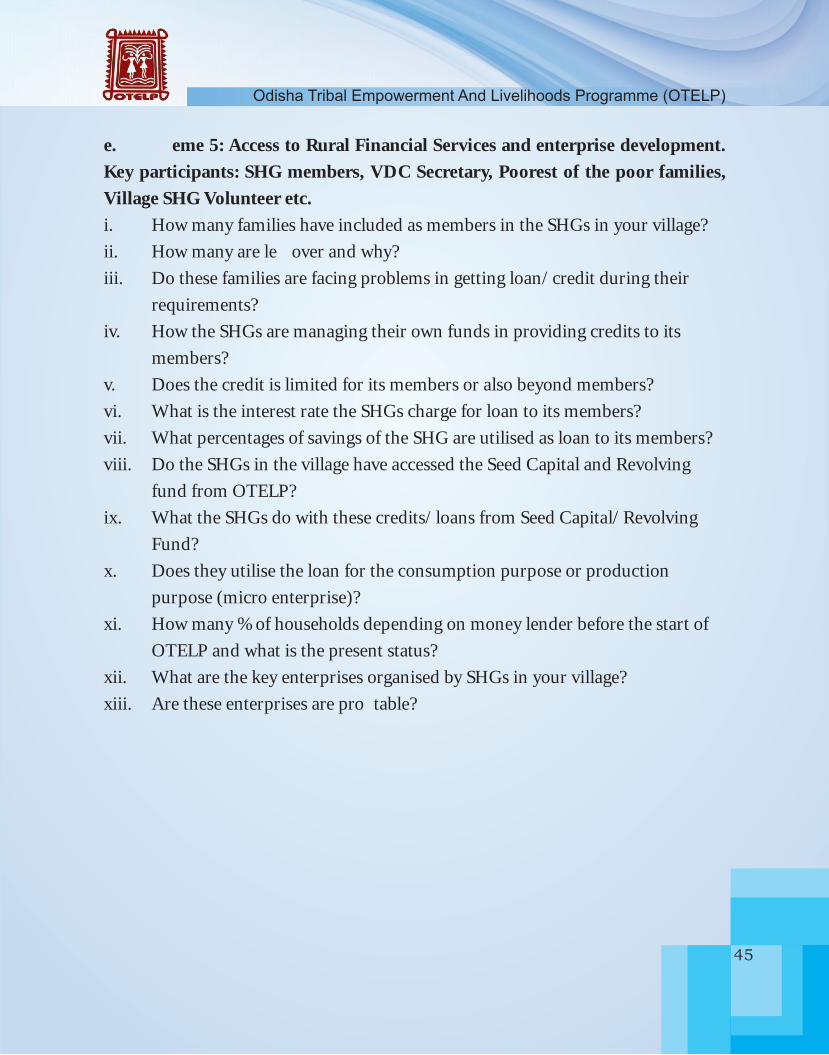
e. Theme 5: Access to Rural Financial Services and enterprise development. Key participants: SHG members, VDC Secretary, Poorest of the poor families, Village SHG Volunteer etc. i. How many families have included as members in the SHGs in your village?ii. How many are left over and why?iii. Do these families are facing problems in getting loan/ credit during their requirements? iv. How the SHGs are managing their own funds in providing credits to its members?v. Does the credit is limited for its members or also beyond members?vi. What is the interest rate the SHGs charge for loan to its members?vii. What percentages of savings of the SHG are utilised as loan to its members?viii. Do the SHGs in the village have accessed the Seed Capital and Revolving fund from OTELP?ix. What the SHGs do with these credits/ loans from Seed Capital/ Revolving Fund?x. Does they utilise the loan for the consumption purpose or production purpose (micro enterprise)?xi. How many % of households depending on money lender before the start of OTELP and what is the present status?xii. What are the key enterprises organised by SHGs in your village?xiii. Are these enterprises are profitable?
Odisha Tribal Empowerment And Livelihoods Programme (OTELP)Annual Outcome Survey 2015-16
46
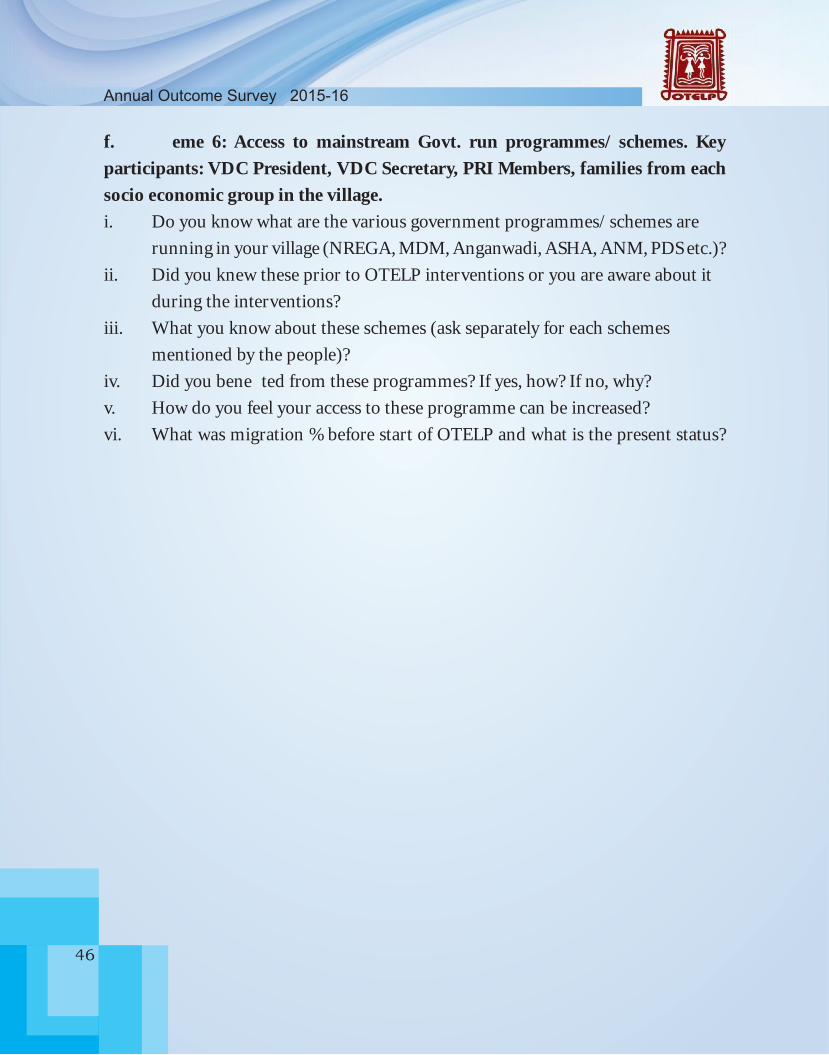
f. Theme 6: Access to mainstream Govt. run programmes/ schemes. Key participants: VDC President, VDC Secretary, PRI Members, families from each socio economic group in the village.i. Do you know what are the various government programmes/ schemes are running in your village (NREGA, MDM, Anganwadi, ASHA, ANM, PDS etc.)?ii. Did you knew these prior to OTELP interventions or you are aware about it during the interventions?iii. What you know about these schemes (ask separately for each schemes mentioned by the people)?iv. Did you benefited from these programmes? If yes, how? If no, why?v. How do you feel your access to these programme can be increased?vi. What was migration % before start of OTELP and what is the present status?
Odisha Tribal Empowerment And Livelihoods Programme (OTELP)
47
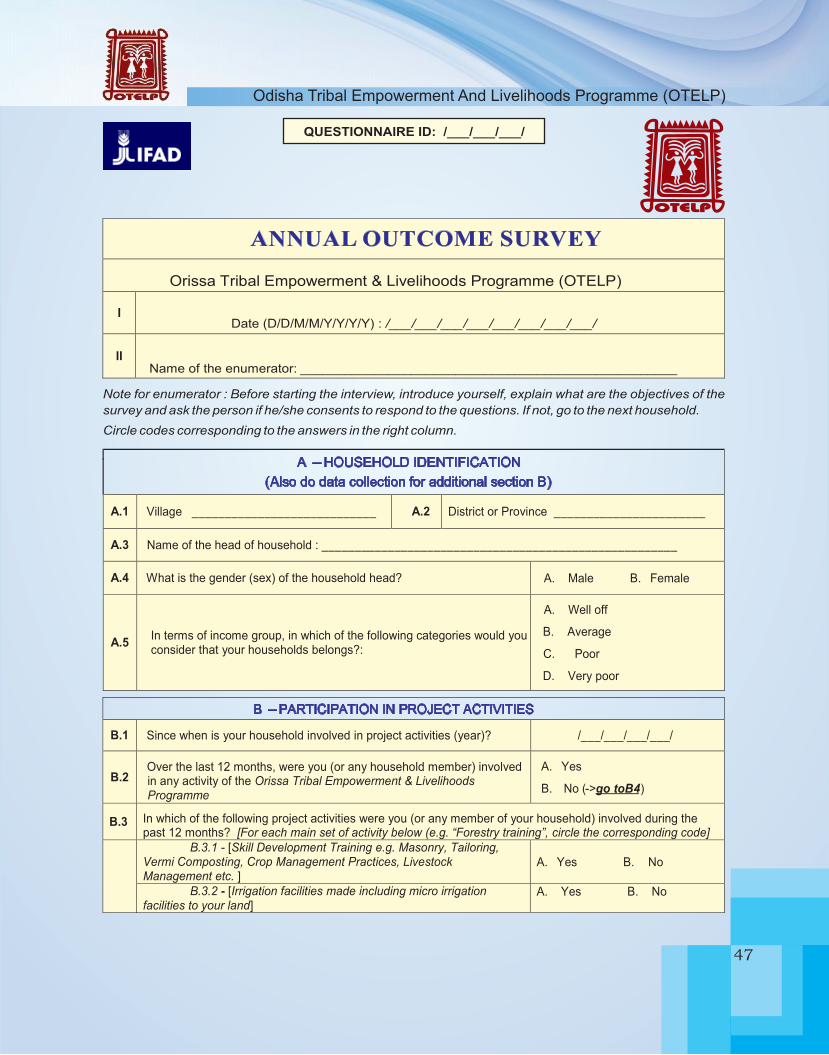
QUESTIONNAIRE ID: /___/___/___/
I
II
ANNUAL OUTCOME SURVEY
Orissa Tribal Empowerment & Livelihoods Programme (OTELP)
Date (D/D/M/M/Y/Y/Y/Y) : /___/___/___/___/___/___/___/___/
Name of the enumerator: ___________________________________________________
Note for enumerator : Before starting the interview, introduce yourself, explain what are the objectives of the
survey and ask the person if he/she consents to respond to the questions. If not, go to the next household.
Circle codes corresponding to the answers in the right column.

Odisha Tribal Empowerment And Livelihoods Programme (OTELP)Annual Outcome Survey 2015-16
48
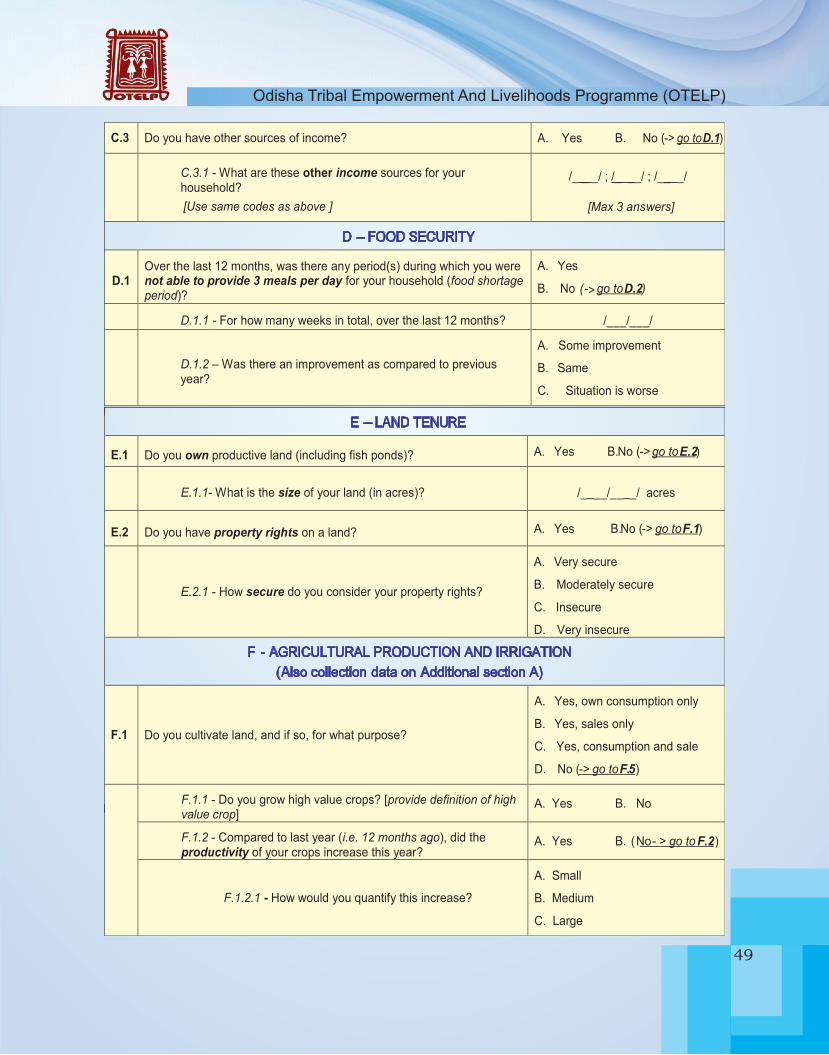
Odisha Tribal Empowerment And Livelihoods Programme (OTELP)
49
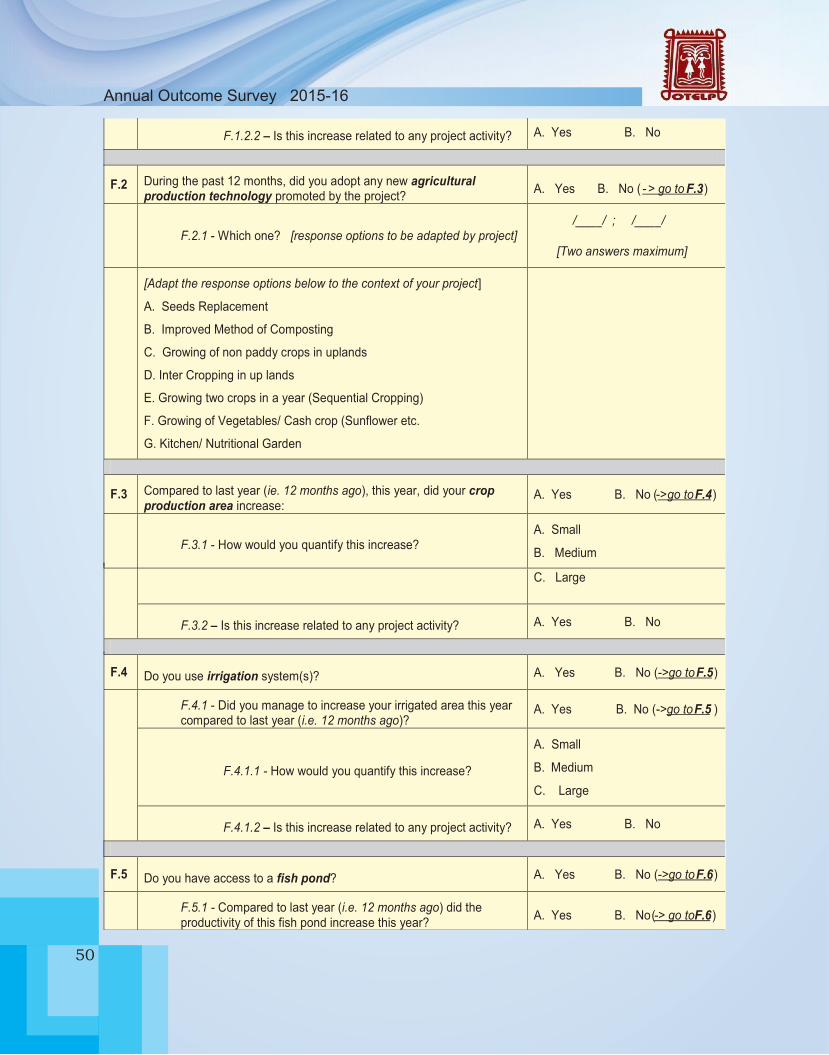
Odisha Tribal Empowerment And Livelihoods Programme (OTELP)Annual Outcome Survey 2015-16
50
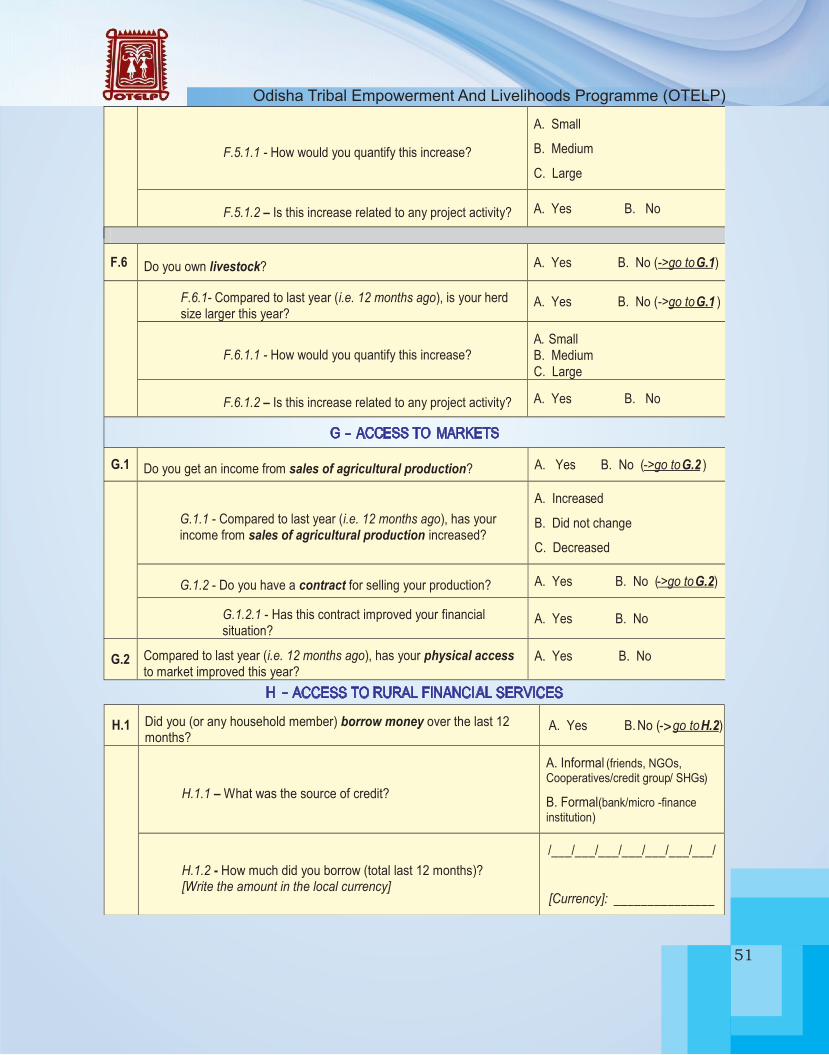
Odisha Tribal Empowerment And Livelihoods Programme (OTELP)
51
>
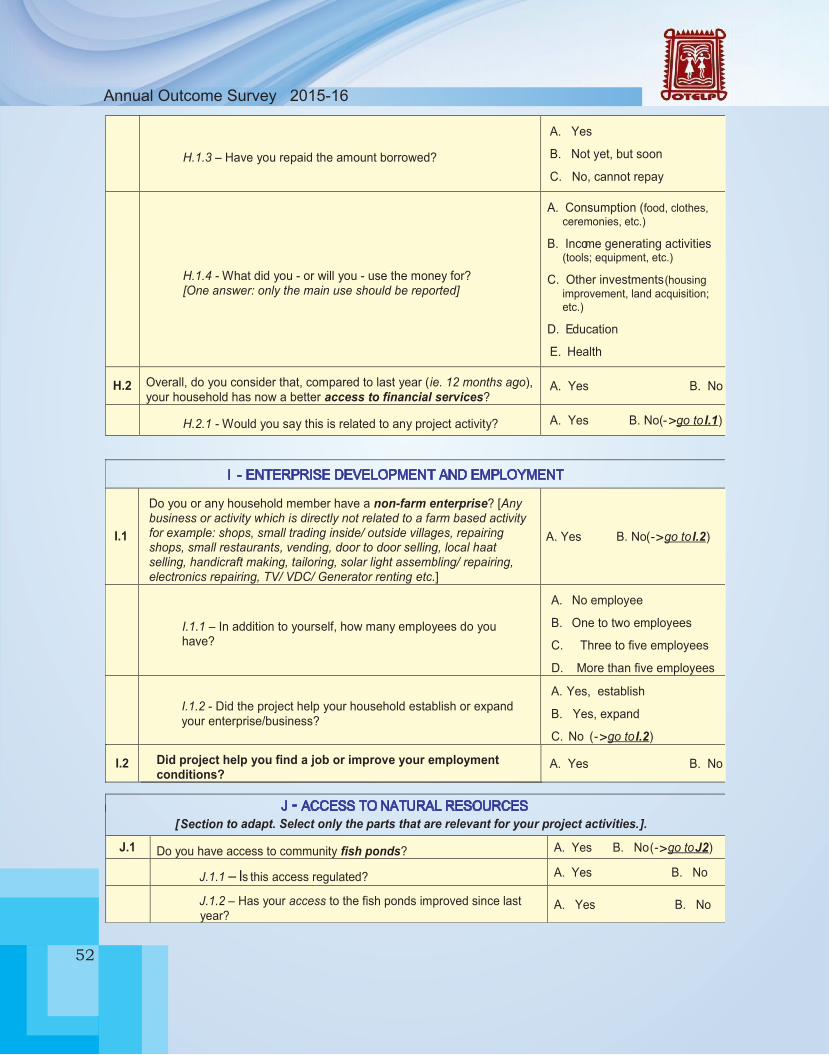
Odisha Tribal Empowerment And Livelihoods Programme (OTELP)Annual Outcome Survey 2015-16
52
>
>
>
>

Odisha Tribal Empowerment And Livelihoods Programme (OTELP)
53
>
>
>
>
>
>
>
>

Odisha Tribal Empowerment And Livelihoods Programme (OTELP)Annual Outcome Survey 2015-16
54
2011201220132014
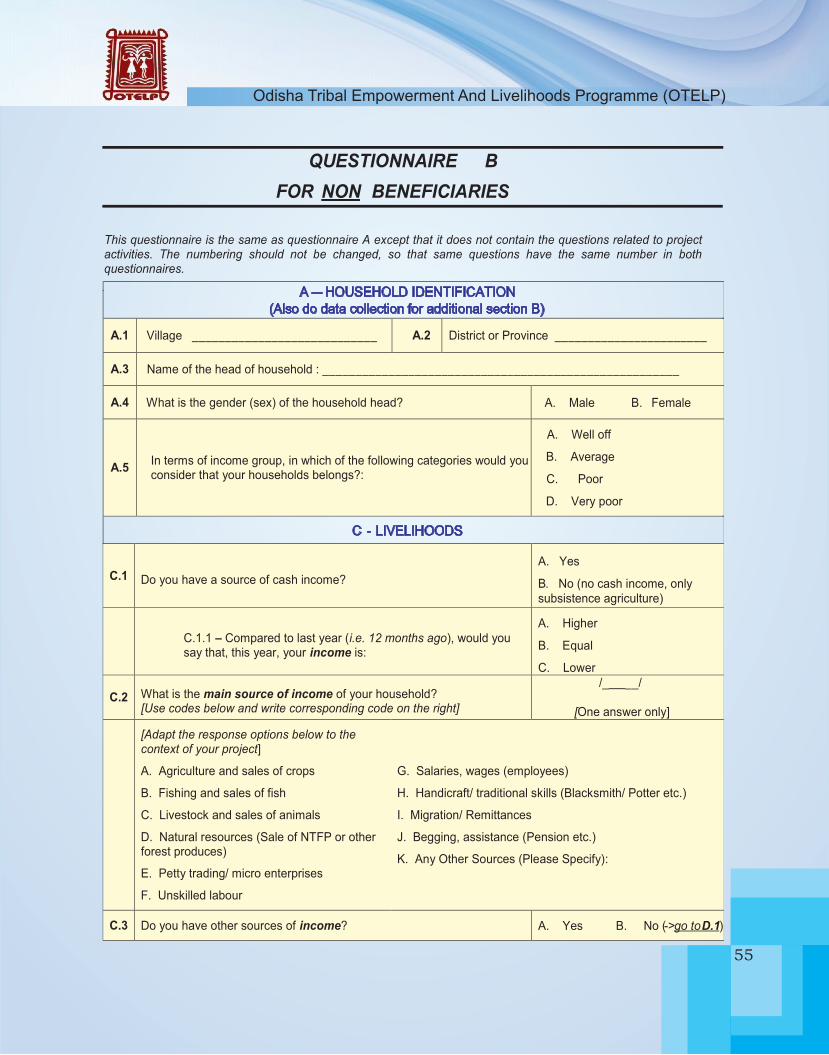
Odisha Tribal Empowerment And Livelihoods Programme (OTELP)
55

Odisha Tribal Empowerment And Livelihoods Programme (OTELP)Annual Outcome Survey 2015-16
56
>
>

Odisha Tribal Empowerment And Livelihoods Programme (OTELP)
57

Odisha Tribal Empowerment And Livelihoods Programme (OTELP)Annual Outcome Survey 2015-16
58
>

Odisha Tribal Empowerment And Livelihoods Programme (OTELP)
59
>
>

Odisha Tribal Empowerment And Livelihoods Programme (OTELP)Annual Outcome Survey 2015-16
60
2011201220132014
Odisha Tribal Empowerment And Livelihoods Programme (OTELP)
61
Programme Support UnitOdisha tribal Empowerment and Livehoods Programme
2nd Floor, TDCCOL Building, Bhoi Nagar, Bhubaneswar - 751022Ph. : 0674-2542709, Fax : 2541772
E-mail : [email protected]
ww
w.o
telp
.org
Annual Outcome Survey 2015-16
OdishaTribal Empowerment and Livelihoods Programme (OTELP)ST & SC Development, Minorities & Backward
Classes Welfare DepartmentGovernment of Odisha