Embed Size (px)
Citation preview

1 / 20
Supplementary Experimental Methods
Chemicals. MoB powder (~325 mesh, 99.5%) was purchased from Sigma-Aldrich Chemical
Cor. (St. Louis, USA), and stored in an argon-filled glove box. Melamine (C3H6N6, 99%) and
potassium hydroxide (KOH, 95%) were purchased from Aladdin Industrial Inc. (Shanghai,
China). All the chemicals were used without further purification. Deionized water was used
throughout the whole experiment.
Synthesis of g-C3N4 powder. g-C3N4 powder was prepared by thermal polymerization of
melamine under high temperature. In details, 10 g of melamine was placed in a ceramic cru-
cible and heated at 550 °C for 4 h in a tube furnace at a ramp rate of 5 °C min−1
under argon
atmosphere. After being cooled down to room temperature, the obtained yellow solid was
collected and fully ground, yielding the powder samples (denoted as g-C3N4).
Synthesis of MoB/g-C3N4 Schottky catalyst. A series of MoB/g-C3N4 Schottky catalysts
were prepared by physical mixing, kneading and grinding of different weight ratio of com-
mercial MoB and g-C3N4 powders in an agate mortar.
Characterization. Phase identification was performed by a Bruker AXS D8 Advance pow-
der X-ray diffractometer (Bruker, Germany) using Cu Kα radiation (λ = 1.5418 θ
angular range of 20-60° with a velocity of 0.02° in 4 s. Temperature-dependent resistivity
plots were recorded in the temperature range from 20 to 300 K in steps of 5 K using a
Keithley 4200-SCS semiconductor analyzer (Keithley, USA) by a standard four-probe meth-
od. To determine the C/N molar ratio, X-ray photoelectron spectroscopy were performed on
an ESCALAB 250 Xi spectrometer (VG Scientific Co., UK) with an Al Kα X-ray radiation
(1486.6 eV) for excitation, and otherwise elemental combustion analysis was accomplished
using an Elementar Vario Micro Cube system (Hanau, Germany). Ultr v olet−v s ble bsorp-
tion spectra were measured on a Lambda 35 spectrometer (Perkin–Elmer Instruments, USA).
Geometric morphology and element distribution were divulged by JEOL JSM-7100F scan-
ning electron microscope (JEOL, Japan) coupled with an Oxford IE250 energy-dispersive X-
ray spectrometer (Oxford Instruments, UK). Energy-loss near-edge structure spectra were
obtained using a Hitachi HF-2000 field-emission transmission electron microscope (Hitachi,
Japan) operating at 200 kV, equipped with a cold field emission gun and a Gatan PEELS 666
parallel electron spectrometer (Gatan Inc., USA). Steady-state photoluminescence spectra
were measured on a FluoroLog3-21 spectrofluorimeter (HORIBA Jobin Yvon, France) with
the excitation light at 325 nm. Ultraviolet photoemission spectroscopy was also carried out
on an ESCALAB 250 Xi spectrometer using He I resonance lines (21.2 eV).
Electrochemical measurements. All HER measurements were performed on a CHI 760D
electrochemical workstation (Chenhua, China), using a five-necked glass cell containing ro-
tating disk working electrode, saturated calomel reference (SCE) electrode, and graphite rod
counter electrode (Pine Instrument Co., USA). The electrodes were prepared by drop-casting
catalyst inks including catalyst powders onto a polished glassy carbon electrode (0.196 cm2),
and the electrode surface was finally loaded with HER catalyst of 0.25 mgcat/cmdisk2 and a
mass ratio of 5:5:1 of catalyst to carbon Vulcan XC72R to Nafion. The as-prepared elec-
trodes were tested in 1 M KOH or 0.5 M H2SO4 solution after several repeated cyclic volt-
ammetries for electrochemical surface activation. Polarization curves were recorded by linear
sweep voltammetry with a scan rate of 5 mV/s under an electrode rotation rates of 1 600 rpm
for gas diffusion, and then replotted as overpotential (η) versus log current (log j) to obtain
the Tafel plots. The Nyquist plots were measured with frequencies ranging from 100 kHz to
0.1 Hz at an overpotential of 150 mV. All the potentials were calibrated to a reversible hy-
drogen electrode (RHE). IR drop correction was used in all the experiments.

2 / 20
DFT computations. A periodic slab model of the MoB (112)–p(3 ×2) surface consisting of
14 Å × 17 Å slab and a 18 Å vacuum layer was used to compute the electronic structure and
electrochemical mechanism of HER at the atomic and molecular level. The bottom 132 Mo
and B atoms were frozen while the remaining atoms (from 108 to 259) were allowed to relax
without constraint. Another periodic slab model of the g-C3N4 (001)–p(1 × 1) surface consist-
ing of a 13Å × 23 Å slab and a 18 Å vacuum thickness was constructed. Three layers of wa-
ter with ~50 H2O molecules were introduced inside the vacuum layer to simulate the electri-
cal double layer formation during cathodic HER. The initial geometric structures were re-
laxed to a local minimum, and an ab initio molecular dynamic (AIMD) simulation was car-
ried out to equilibrate the interaction between water molecules and the interface using the
CP2K package.[1]
We used Nose–Hoover thermostat to sample the canonical ensemble.[2]
The
relatively short timescales of AIMD limit the sampling step size to 1.0 fs; therefore, simula-
tions were run for 10 ps. For rapidly exploring a large volume of phase-space volume of wa-
ter network configurations without destroying the hydrogen bonding, a statistical sampling
temperature of 300 K was chosen. The generalized-gradient approximation (GGA), as pa-
rameterized by Perdew, Burke and Ernzerhof,[3]
was utilized to compute the exchange-
correlation energy. Dispersion interaction was considered in calculations by using empirical
parameterized Grimme (D3) method.[4]
The elemental valence electrons were described using
hybrid Gaussian and plane-wave basis sets, and the cutoff energy of 500 Rydberg of auxiliary
plane-wave basis sets were adopted. We employed special double-ζ v le ce plus pol r z t o
basis sets optimized to minimize the basis set superposition errors. Core electrons were de-
scribed with the norm-conserving and separable Goedecker–Teter–Hutter pseudopotentials.[5]
Brillouin zone integration was performed in reciprocal space, with the k-space sampling at
the gamma point only. Transition states were investigated using climbing image nudged-
elastic-band method (CI-NEB) with convergence criterion of 0.05 eV/Å.[6]
3 / 20
Supplementary Figures
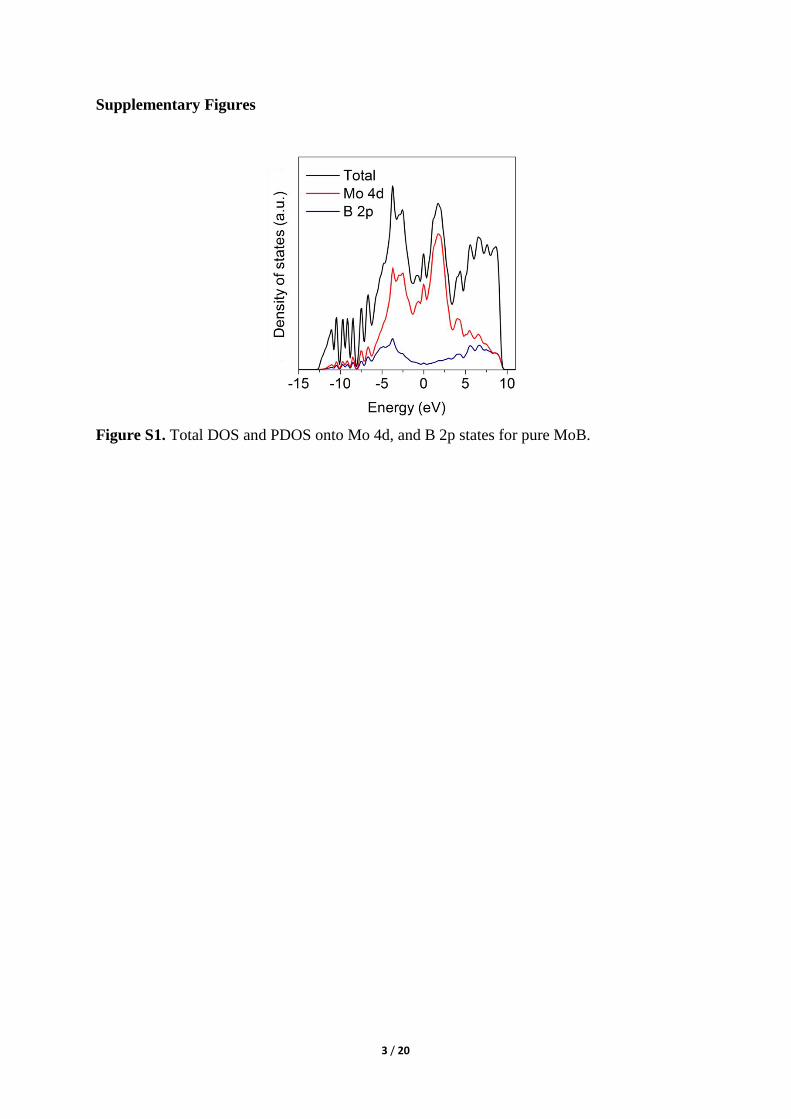
Figure S1. Total DOS and PDOS onto Mo 4d, and B 2p states for pure MoB.

4 / 20
Figure S2. C/N molar ratios of g-C3N4 powders obtained by CHNS and XPS analysis.
5 / 20
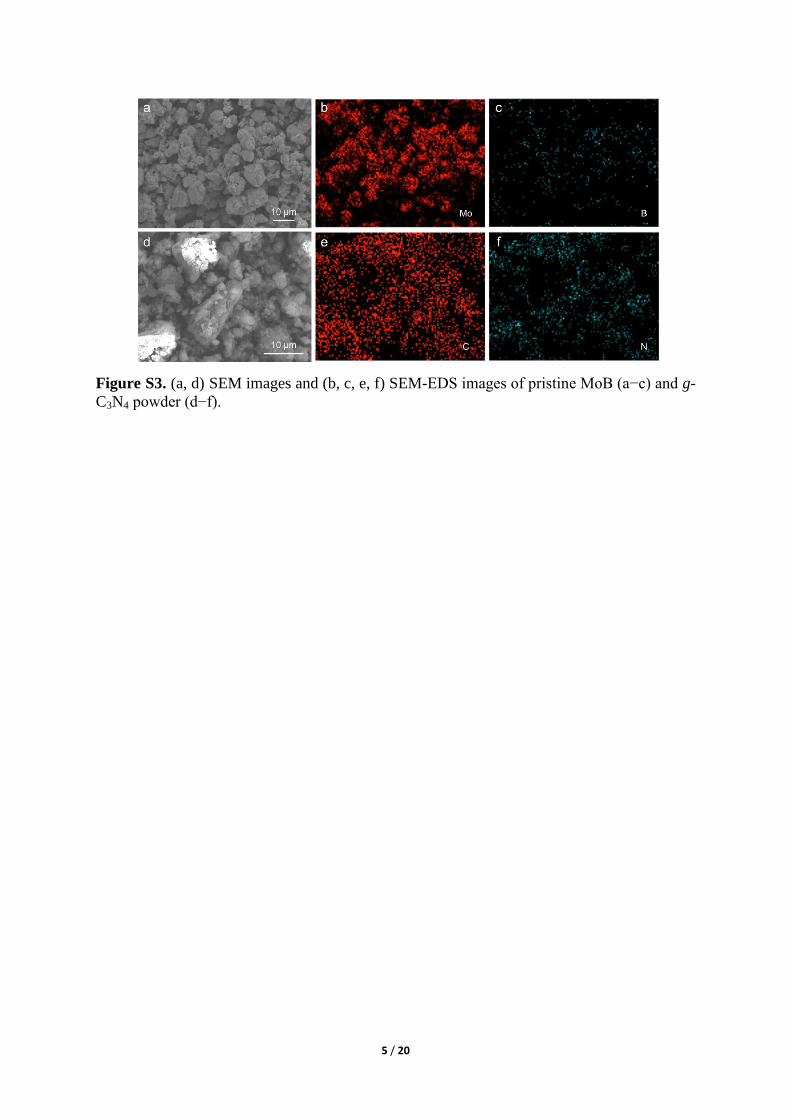
Figure S3. (a, d) SEM images and (b, c, e, f) SEM-EDS m ges of pr st e MoB ( −c d g-
C3N4 powder (d−f .

6 / 20
Figure S4. (a) SEM image, (b) SEM-EDS mapping images, (c) TEM images, and (d) EDS
spectra of MoB/g-C3N4 Schottky catalyst.
7 / 20
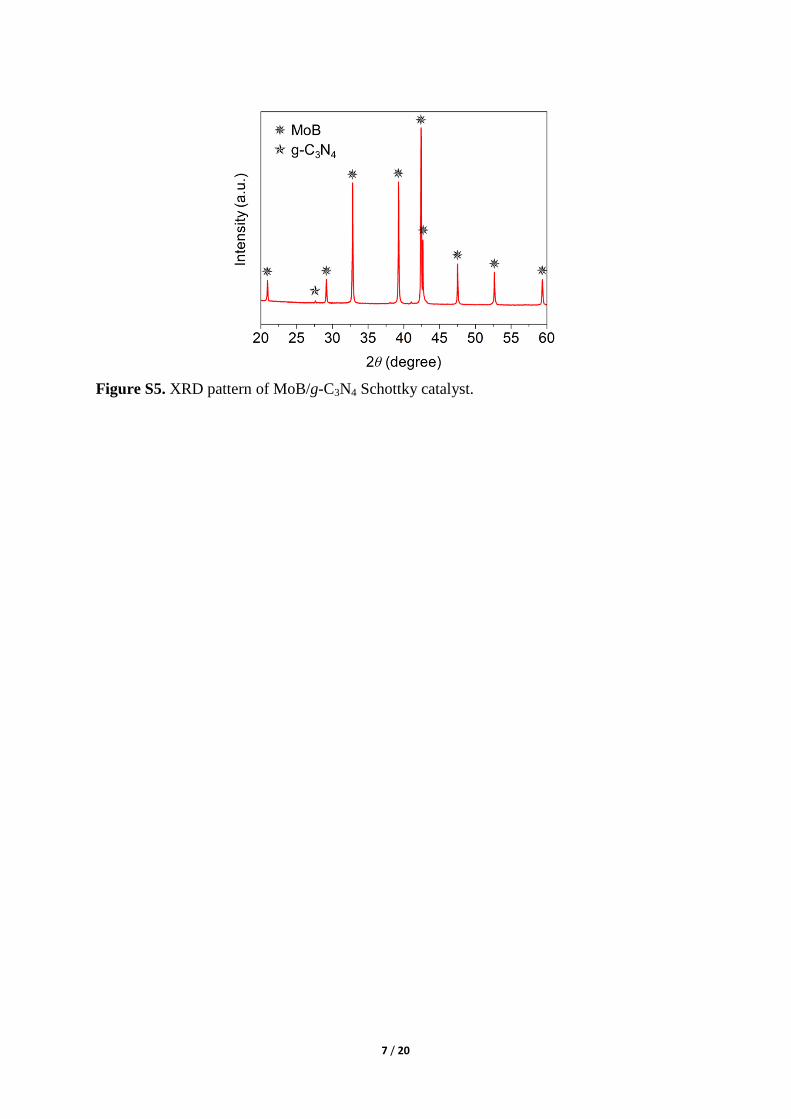
Figure S5. XRD pattern of MoB/g-C3N4 Schottky catalyst.
8 / 20
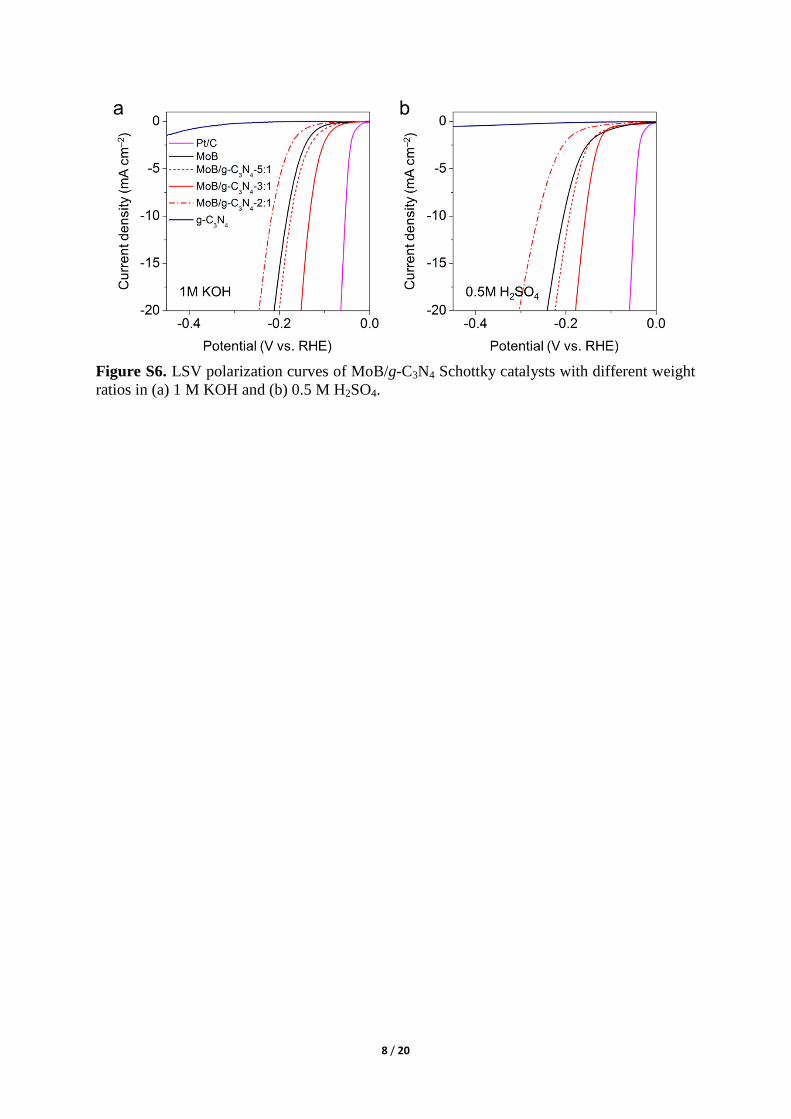
Figure S6. LSV polarization curves of MoB/g-C3N4 Schottky catalysts with different weight
ratios in (a) 1 M KOH and (b) 0.5 M H2SO4.
9 / 20
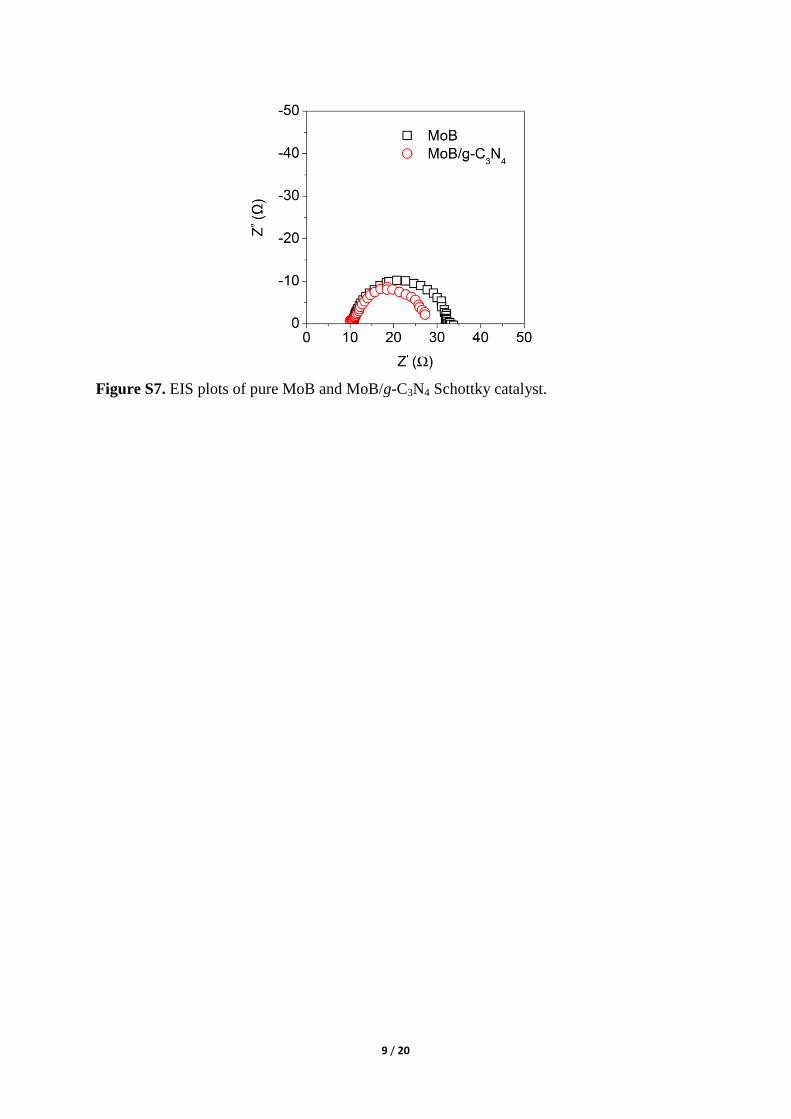
Figure S7. EIS plots of pure MoB and MoB/g-C3N4 Schottky catalyst.
10 / 20
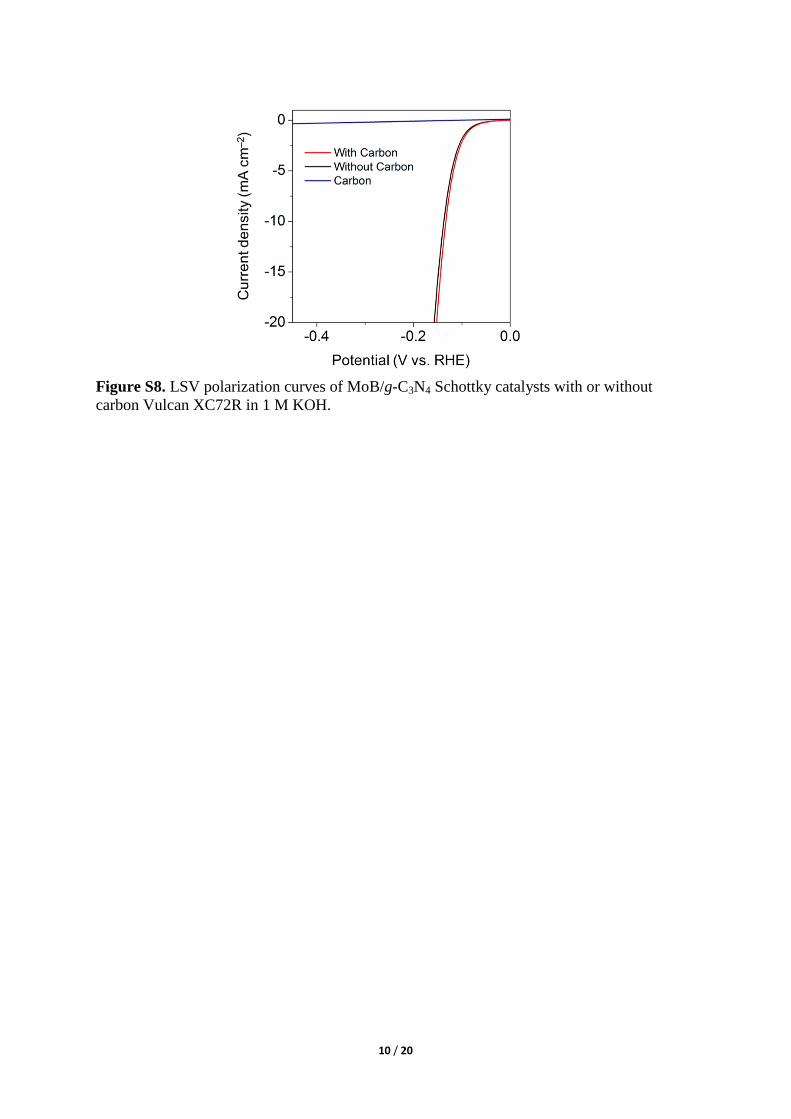
Figure S8. LSV polarization curves of MoB/g-C3N4 Schottky catalysts with or without
carbon Vulcan XC72R in 1 M KOH.

11 / 20
Figure S9. SEM image of hand-grinded MoB powder.
12 / 20
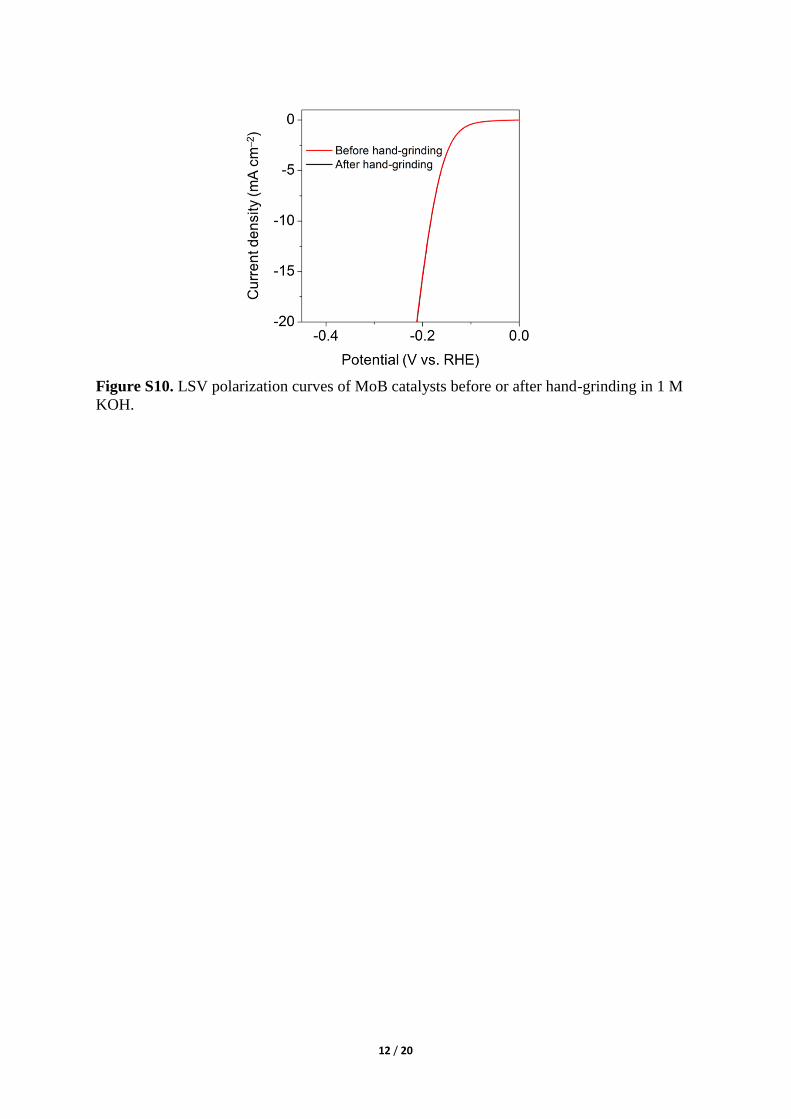
Figure S10. LSV polarization curves of MoB catalysts before or after hand-grinding in 1 M
KOH.

13 / 20
Figure S11. Chronoamperometric current–time (i–t) tests for pristine MoB powder.
14 / 20
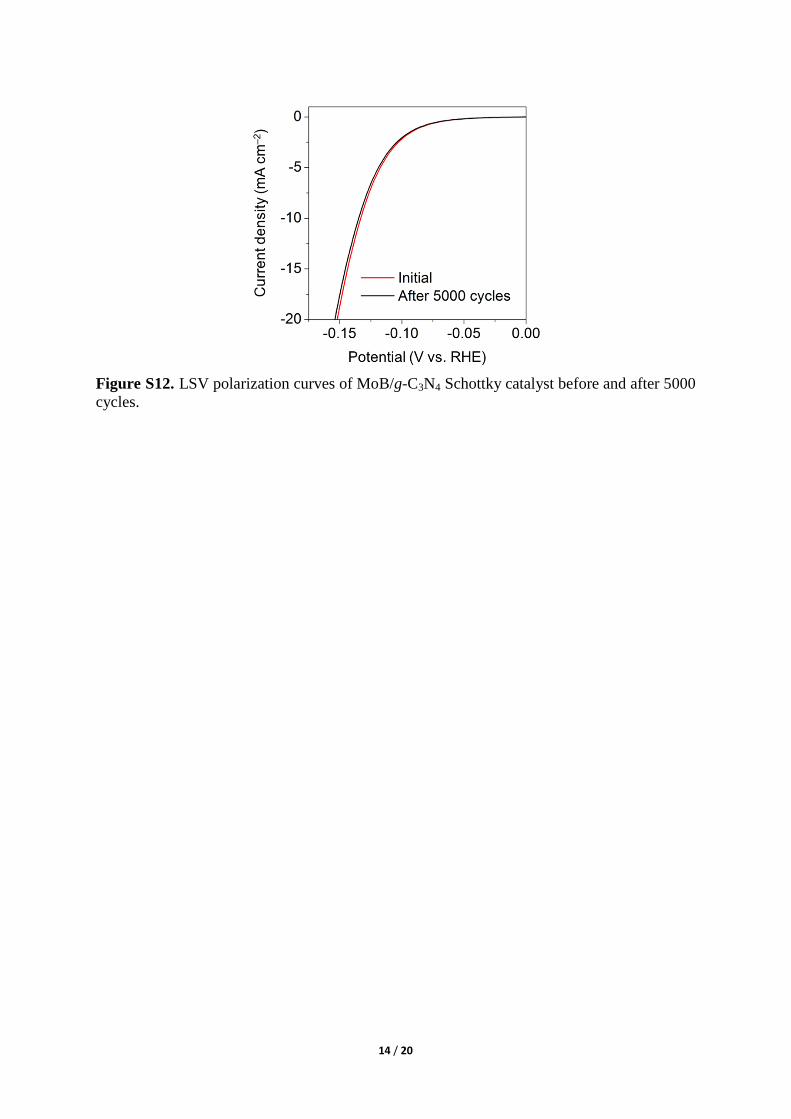
Figure S12. LSV polarization curves of MoB/g-C3N4 Schottky catalyst before and after 5000
cycles.

15 / 20
Figure S13. Mo 3d XPS spectra of (a) pristine MoB and (b) MoB/g-C3N4 Schottky catalyst.
16 / 20
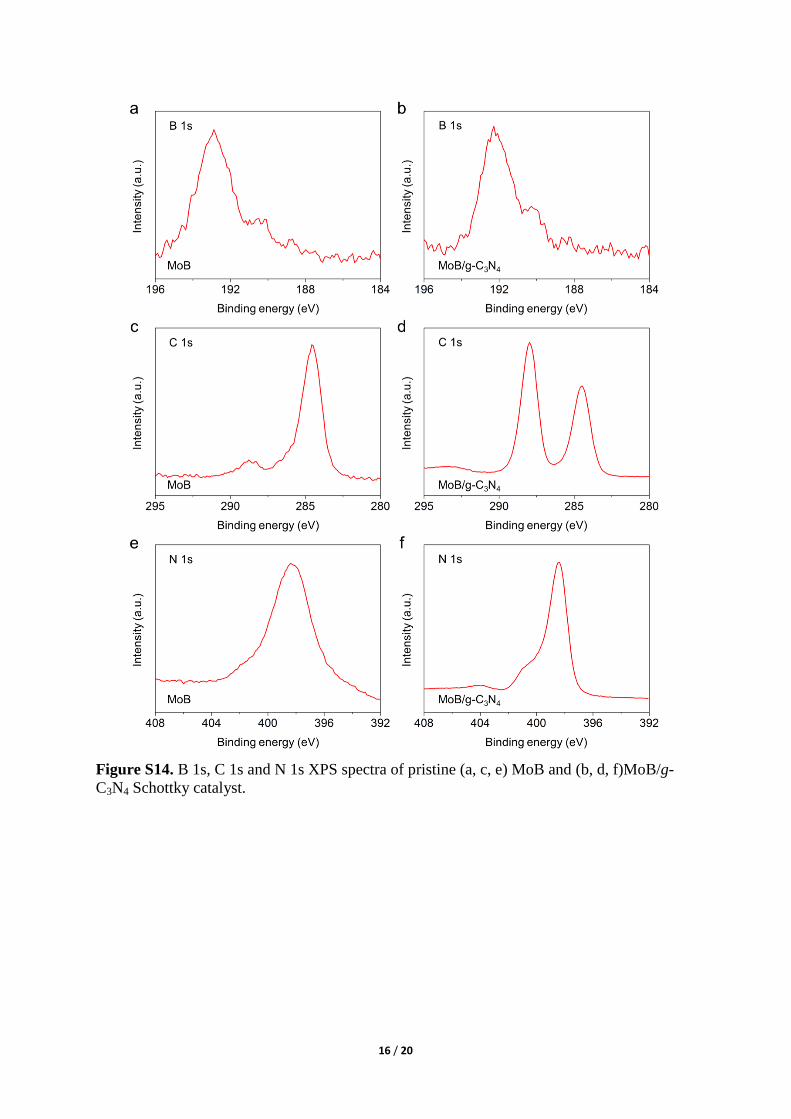
Figure S14. B 1s, C 1s and N 1s XPS spectra of pristine (a, c, e) MoB and (b, d, f)MoB/g-
C3N4 Schottky catalyst.

17 / 20
Figure S15. Side views (a, b) and top view (c) of the optimized geometry of MoB(112)/g-
C3N4 Schottky catalyst.
18 / 20
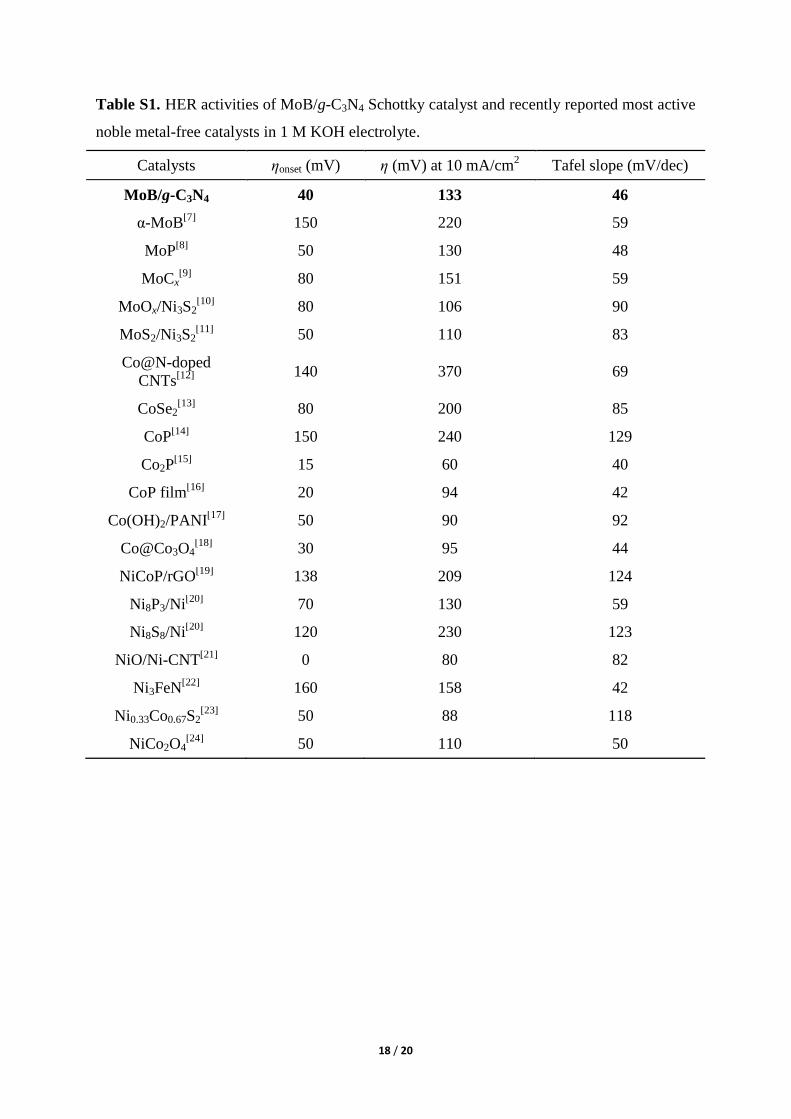
Table S1. HER activities of MoB/g-C3N4 Schottky catalyst and recently reported most active
noble metal-free catalysts in 1 M KOH electrolyte.
Catalysts ηonset (mV) η (mV) at 10 mA/cm2 Tafel slope (mV/dec)
MoB/g-C3N4 40 133 46
α-MoB[7]
150 220 59
MoP[8]
50 130 48
MoCx[9]
80 151 59
MoOx/Ni3S2[10]
80 106 90
MoS2/Ni3S2[11]
50 110 83
Co@N-doped
CNTs[12]
140 370 69
CoSe2[13]
80 200 85
CoP[14]
150 240 129
Co2P[15]
15 60 40
CoP film[16]
20 94 42
Co(OH)2/PANI[17]
50 90 92
Co@Co3O4[18]
30 95 44
NiCoP/rGO[19]
138 209 124
Ni8P3/Ni[20]
70 130 59
Ni8S8/Ni[20]
120 230 123
NiO/Ni-CNT[21]
0 80 82
Ni3FeN[22]
160 158 42
Ni0.33Co0.67S2[23]
50 88 118
NiCo2O4[24]
50 110 50

19 / 20
Table S2. Bru uer−Emmett−Teller (BET surf ce re d electrochem c l surf ce re
(ECSA) of MoB/g-C3N4 Schottky catalysts with different weight ratios.
MoB MoB/g-C3N4-5:1 MoB/g-C3N4-3:1 MoB/g-C3N4-2:1 MoB*
BET
(m2 g–1
) 3.46 3.12 3.51 3.85 3.37
ECSA
(μF cm–2
) 40 56 89 32 41
* The sample was hand-grinded for 0.5 h in an agate mortar before the measurements.

20 / 20
References
[1] J. Vande Vondele, M. Krack, F. Mohamed, M. Parrinello, T. Chassaing, J. Hutter,
Comput. Phys. Commun. 2005, 167, 103–128.
[2] a) S. Nosé, J. Chem. Phys. 1984, 81, 511–519; b) W. G. Hoover, Phys. Rev. A 1985,
31, 1695.
[3] a) J. P. Perdew, Phys. Rev. B 1986, 33, 8822–8824; b) J. P. Perdew, K. Burke, M.
Ernzerhof, Phys. Rev. Lett. 1996, 77. 3865–3868.
[4] S. Grimmea, J. Antony, S. Ehrlich, H. Krieg, J. Chem. Phys. 2010, 132, 154104.
[5] S. Goedecker, M. Teter, J. Hutter, Phys. Rev. B 1996, 54, 1703.
[6] G. Henkelman, H. Jónsson, J. Chem. Phys. 2000, 113, 9978.
[7] H. Vrubel, X. Hu, Angew. Chemie - Int. Ed. 2012, 51, 12703–12706.
[8] P. Xiao, M. A. Sk, L. Thia, X. Ge, R. J. Lim, J.-Y. Wang, K. H. Lim, X. Wang, Energy
Environ. Sci. 2014, 7, 2624–2629.
[9] H. Bin Wu, B. Y. Xia, L. Yu, X.-Y. Yu, X. W. Lou, Nat. Commun. 2015, 6, 6512.
[10] Y. Wu, G. Li, Y. Liu, L. Yang, X. Lian, T. Asefa, X. Zou, Adv. Funct. Mater. 2016, 26,
4839.
[11] J. Zhang, T. Wang, D. Pohl, B. Rellinghaus, R. Dong, S. Liu, X. Zhuang, X. Feng,
Angew. Chemie- Int. Ed. 2016, 128, 6814–6819.
[12] X. Zou, X. Huang, A. Goswami, R. Silva, B. R. Sathe, T. Asefa, Angew. Chemie - Int.
Ed. 2014, 126, 4461–4465.
[13] P. Chen, K. Xu, S. Tao, T. Zhou, Y. Tong, H. Ding, L. Zhang, W. Chu, C. Wu, Y. Xie,
Adv. Mater. 2016, 28, 7527–7532.
[14] J. Tian, Q. Liu, A. M. Asiri, X. Sun, J. Am. Chem. Soc. 2014, 136, 7587–7590.
[15] Y. Tan, H. Wang, P. Liu, C. Cheng, F. Zhu, A. Hirata, M. Chen, Adv. Mater. 2016, 28,
2951–2955.
[16] N. Jiang, B. You, M. Sheng, Y. Sun, Angew. Chemie - Int. Ed. 2015, 54, 6251–6254.
[17] J. X. Feng, L. X. Ding, S. H. Ye, X. J. He, H. Xu, Y. X. Tong, G. R. Li, Adv. Mater.
2015, 27, 7051–7057.
[18] X. Yan, L. Tian, M. He, X. Chen, Nano Lett. 2015, 15, 6015–6021.
[19] J. Li, M. Yan, X. Zhou, Z. Huang, Z. Xia, Adv. Funct. Mater. 2016, 26, 6785–6796.
[20] G. Chen, T. Y. Ma, Z. Liu, N. Li, Y. Su, K. Davey, S. Qiao, Adv. Funct. Mater. 2016,
26, 3314–3323.
[21] M. Gong, W. Zhou, M. Tsai, J. Zhou, M. Guan, M. Lin, B. Zhang, Y. Hu, D. Wang, J.
Yang, et al., Nat. Commun. 2014, 5, 4695.
[22] X. Jia, Y. Zhao, G. Chen, L. Shang, R. Shi, X. Kang, G. I. N. Waterhouse, L. Wu, C.
Tung, T. Zhang, Adv. Energ. Mater. 2016, 6, 1502585.
[23] Z. Peng, D. Jia, A. M. Al-enizi, A. A. Elzatahry, G. Zheng, Adv. Energ. Mater. 2015, 5,
1402031.
[24] X. Gao, H. Zhang, Q. Li, X. Yu, Z. Hong, X. Zhang, C. Liang, Z. Lin, Angew. Chemie
- Int. Ed. 2016, 55, 1–6.


![Supporting Information...[8] Z. Wang, H. Yu, C. Long, M. Chen, J. Cao, W. Ho, S. Lee, In situ g-C3N4 self-sacrificial synthesis of a g-C 3 N 4 /LaCO 3 OH heterostructure with strong](https://img.dokumen.tips/doc/110x75/6144ddae34130627ed509fa9/supporting-information-8-z-wang-h-yu-c-long-m-chen-j-cao-w-ho.jpg)


![N-doped graphitic carbon-incorporated g-C3N4 for ... · [7]), to photocatalysis for solar water splitting and pollutants photodegradation [8], etc. Besides, g-C3N4 can be applied](https://img.dokumen.tips/doc/110x75/5f0aa6f97e708231d42cac08/n-doped-graphitic-carbon-incorporated-g-c3n4-for-7-to-photocatalysis-for.jpg)

![Au nanorods/ g-C3N4 composite based biosensor for ... · CLL is ZAP-70 in B-cells [4, 18]. Two major types of CLL with different survival times are distinguished with DNA analysis](https://img.dokumen.tips/doc/110x75/5f6cea27cf341d446f6bb2b0/au-nanorods-g-c3n4-composite-based-biosensor-for-cll-is-zap-70-in-b-cells-4.jpg)