Embed Size (px)
Citation preview

GROWING ALIKE OR GROWING APART? INDUSTRIAL SPECIALISATION OF EU COUNTRIES
by Marius Brülhart
University of Lausanne
January 2001
Paper for UNU/WIDER Project “EMU and Its Impact on Europe and Developing Countries”
Published in Wyplosz, C. (ed.) “The Impact of EMU on Europe and the Developing
Countries”, Oxford University Press, 2001. Abstract: This paper documents specialisation trends in 32 manufacturing industries across 13 European countries over the 1972-1996 period. We find that sectoral employment specialisation measured by locational Gini indices has been generally increasing, and that the dissimilarity of industrial structures among the sample countries has grown. Specialisation is most pronounced in “traditional” resource- and labour-intensive sectors, but there are signs of increasing clustering in technology-intensive industries since the mid-1980s. Specialisation of exports, whilst decreasing on average, is stronger than specialisation of employment. A continuation of the observed specialisation trend might reduce the scope for cyclical convergence of EMU countries and increase the pressure for greater market flexibility in the face of asymmetric fluctuations. Contents: 1. Introduction 2. Theoretical and Empirical Background 3. Employment Specialisation in Europe 4. Export Specialisation in Europe 5. Determinants of Specialisation Patterns 6. Conclusions and Conjectures Author details: Marius Brülhart, Ecole des HEC, University of Lausanne, CH - 1015 Lausanne. Email: [email protected]. Web: http://www.hec.unil.ch/mbrulhar/. Acknowledgement: I would like to thank Charles Wyplosz and seminar participants at WIDER, Helsinki, for useful suggestions.

2
1. INTRODUCTION
The architects of EMU envisaged a strong link between the introduction of a single
currency and the convergence of the EU’s economies. According to the Maastricht
Treaty, monetary union is “to promote throughout the Community a harmonious and
balanced development of economic activities (…), a high degree of convergence of
economic performance, (…) and economic and social cohesion and solidarity among
Member States”. Convergence is seen as both a precondition for, and a consequence
of, monetary integration.
On the face of it, economic theory supports such insistence on the relationship
between EMU and economic convergence. Mundell’s (1961) model of an optimal
currency area (OCA) suggests that exchange rates should only be fixed among
countries that experience similar macroeconomic shocks. The degree of
synchronisation of real economic fluctuations, and the effectiveness of non-monetary
adjustment mechanisms among participating countries, should be the main criteria by
which to judge the desirability of monetary union. Kenen (1969) pointed out that
business cycles will be more in step between economies with diversified and similar
sectoral structures.
However, the implementation rules of EMU paid scant regard to the real convergence
that takes centre stage in OCA theory. They were concerned instead with
predominantly nominal and fiscal measures of convergence (Wyplosz, 1997). There
are sound theoretical arguments for nominal convergence as a precondition for EMU
(e.g. Winkler, 1995), but the neglect of real convergence criteria has attracted
criticism (e.g. Buiter, Corsetti and Roubini, 1993). It should be noted, though, that
real convergence has not been ignored completely by policy makers. The Maastricht
criterion of two years’ trouble-free participation in the ERM, for instance, implies an
absence of excessive adverse country-specific shocks. Similarly, the “wait-and-see”
stance of successive British governments is explicitly predicated on insufficient
business cycle synchronisation.
The discussion of real convergence as a desirable condition for EMU might now seem
purely “academic”, since the single currency has become an irrevocable reality.

3
However, if we reverse the causal direction of the link between convergence and
EMU, the issue remains highly relevant. Whilst the question “how much real
convergence should exist for a beneficial monetary union?” has been overtaken by
events, the question “how will monetary union affect convergence?” remains crucially
important. If EMU were to foster divergence of industrial structures and greater
asymmetry of shocks across “euroland” regions, then the need for alternative
macroeconomic stabilisers will become acute. On the other hand, if EMU were to turn
out as force for structural and cyclical convergence, then the anticipated pressures on
fiscal policy and labour-market policy might not materialise.
The theoretical predictions are far from clear-cut. Recent “new economic geography”
models resemble neoclassical location theory in that all these approaches emphasise
forces of industrial specialisation that relate negatively to spatial transaction costs. If
the thrust of these models captures the main determinants of industrial specialisation
in Europe, then monetary union will stimulate regional clustering of industries. On the
other hand, economic geography models are typically characterised by multiple
equilibria and path dependency, and an inherited dispersed industrial structure might
reveal itself to be a locally stable equilibrium. In addition, if we take into account that
endowment differences across EU countries are relatively small, neoclassical models
would seem to favour the industrial dispersion story. Clearly, the theory can
accommodate predictions either way, and empirical work is called for to shed light on
the question.
In this paper, we focus on the patterns of sectoral specialisation in European
manufacturing. Insofar as shocks are sector specific, sectoral specialisation is
associated with asymmetry of real shocks. We do not analyse this link explicitly, but
the importance of sectoral specialisation for regional macroeconomic convergence is
undisputed.1 Our aim is to document the broad specialisation trends in Western
Europe since the 1970s and to distil some conjectures on likely future developments.
1 According to Krugman (1997, p. 13), “sophisticated EMU supporters point out with considerable justice that European countries are highly diversified economies with quite similar product mixes, and argue that, as a result, large ‘asymmetric’ shocks requiring major changes in relative wages will be few and far between”. For empirical studies of the relationship between sectoral specialisation and the symmetry of macroeconomic fluctuations, see Bayoumi and Prasad (1997), Clark and van Wincoop (1999) and Imbs (1999). The policy implications of an increase in geographical specialisation in EMU are discussed in Buti and Sapir (1998).

4
Sectoral specialisation patterns are described in a consistent fashion across 14
European countries for the 1972-1996 period, based on employment and export data
for 32 manufacturing sectors.
The paper is organised as follows. Section 2 reviews the theoretical literature on the
relationship between industrial specialisation and monetary integration, and it
summarises the results of prior empirical work on specialisation patterns in the EU. In
Sections 3 and 4, we document specialisation patterns using employment and export
data respectively. Section 5 seeks evidence on the determinants of observed
specialisation trends, through sector-level grouped analysis. Section 6 concludes.
2. THEORETICAL AND EMPIRICAL BACKGROUND
Theory: Is EMU a Force for Specialisation or Dispersion?
The literature on OCAs establishes an intuitively compelling link between sectoral
specialisation and monetary regimes. In essence, it posits that, in the presence of
industry-specific shocks, a higher degree of specialisation entails greater asymmetry
of macroeconomic fluctuations and therefore a stronger case for monetary
decentralisation. In so far as the current eleven euro members are concerned, this type
of reasoning might now be considered redundant. The single currency is a fact, and its
architects have paid little attention to the criteria implied in OCA theory. Yet, there
are good reasons to think that the sectoral specialisation of countries still matters in
the EMU context. Now that exchange-rate adjustments can no longer serve to absorb
asymmetric shocks within the EU, other adjustment mechanisms will come into
sharper focus. The main concern is that unemployment will end up acting as the
principal buffer, since labour markets are too inflexible and fiscal transfers too small.
Hence, increasing asymmetries could drive up structural unemployment, reinforce
pressures to deregulate labour markets and to decentralise labour-market bargaining,
and/or fuel demands for greater EU-wide transfer payments. It seems clear that the
study of sectoral specialisation patterns has lost none of its policy relevance even now
that the euro has been launched.
5
The key question thus becomes how the adoption of a single currency, combined with
the EU’s other integration moves, will impact on the sectoral specialisation of
member countries. There is a rich body of theoretical work that has examined this
type of question. In fact, most theorising in international trade is precisely about this
issue, i.e. about the patterns and welfare effects of countries’ sectoral specialisation
triggered by a reduction in trade barriers. And most models in trade theory predict the
same outcome: specialisation. Loosely speaking, neoclassical models associate a
reduction in trade costs with increased specialisation of countries in their sectors of
comparative advantage, while the “new” theories of trade and geography predict
concentration of industries driven by locational scale economies. Hence,
specialisation is the prediction of all the theories in contest.2 Monetary integration can
be considered like any other policy change that facilitates cross-border integration of
product markets. In addition, however, a single currency is likely to stimulate more
integrated and deeper capital markets, which in turn can provide better insurance
against heightened production risk in a more specialised economy. If international
capital markets are sufficiently developed, countries can hedge against country-
specific risks and thus afford to specialise more (Helpman and Razin, 1978; Kalemli-
Ozcan, Sorensen and Yosha, 1999). Monetary integration, through the stimulus it
provides to capital market integration, would thus seem a particularly effective
catalyst of sectoral specialisation.
Based on such theoretical foundations, many economists, including Eichengreen
(1992) and Krugman (1993), have predicted that EMU will trigger further sectoral
specialisation of participating EU countries. That outcome would have considerable
welfare and policy relevance. Locational concentration of industries is the source of
virtually all the welfare gains associated with trade liberalisation, but in the context of
monetary integration, specialisation is also associated with the complicating effects
outlined above. Therefore, the predicted increase in specialisation has been interpreted
as increasing the costs of monetary union. In this view, the adoption of a single
currency undermines its own desirability in an endogenous process that turns on
sectoral specialisation.
2 This observational equivalence of competing theories makes it difficult to distinguish them in empirical work. For a useful discussion, see Davis and Weinstein (1998).
6
Yet, the opposite scenario, whereby monetary integration decreases specialisation,
and the formation of an OCA is endogenous, also has its proponents. Perhaps the most
prominent formulation of this view is in the European Commission’s official ex ante
assessment of EMU, the “One Market One Money” report, published in 1990. That
study does not explicitly consider issues of sectoral specialisation, but it concludes
that EMU will reduce the incidence of country-specific shocks. Against a neoclassical
background, one can argue that, given the similarity in productive endowments of
most EU countries, differences in factor-costs are unlikely to induce very pronounced
specialisation. In a “new economic geography” setting, Ricci (1997) has provided a
formal underpinning of the view that monetary integration might favour industrial
dispersion. He showed in a general-equilibrium model with two identical countries,
price rigidities, endogenous exchange-rate determination and exogenous demand or
supply shocks, that flexible exchange rates will minimise the variability of sales, and
hence maximise profits, of firms located in the country that is more specialised in
their sector of activity. Hence, flexible exchange rates promote specialisation and
fixed exchange rates favour dispersion of sectors. OCAs form endogenously in a
move from flexible to fixed exchange rates. This model hinges on a number of
assumptions, probably the most important of which is that sectors are defined
sufficiently broadly so that sector-specific exogenous shocks have noticeable effects
on exchange rates if countries are unequally specialised.
More generally, one might invoke the “new economic geography” family of models
in arguing against a deterministic link between integration and specialisation (Fujita,
Krugman and Venables, 1999). These models abstract from comparative advantage
and are typically characterised by multiple equilibria and path dependency. In such a
setting, it may well be that the inherited pre-integration pattern of sectoral
specialisation in the EU is a locally stable equilibrium, unlikely to be dislodged by
falling trade costs. When combined with comparative advantage, variants of “new
economic geography” models can predict a unique but non-monotonic association
between integration and specialisation, whereby industries concentrate in core

7
countries at early integration stages but re-disperse once integration progresses
beyond a certain threshold (Fujita et al., 1999, ch. 16).3
In sum, it is difficult to distil a dominant set of theoretical priors about the effect of
integration on sectoral specialisation, and empirical work is clearly called for.
Empirics 1: Does Manufacturing Specialisation Matter?
Frankel and Rose (1998) have found empirical evidence that is consistent with the
Ricci (1997) scenario. They show a robust positive link between the intensity of trade
between two countries and the correlation of their business cycles. Their analysis,
however, is univariate, and it does not explicitly consider sectoral specialisation. Imbs
(1999) has argued that this suffers from omitted-variables bias and estimated
multivariate models of business-cycle correlations. He found that the statistically and
economically most significant determinant of GDP co-fluctuations is a measure of
sectoral similarity, both in a worldwide country sample and among OECD countries
only. In the OECD sample, for example, sectoral specialisation accounts for 9.2% of
the variation of co-fluctuations, while none of the other variables considered,
including trade intensity, explains more than 2% of variations in the dependent
variable.4 These results are particularly encouraging in the context of this paper,
because the Imbs (1999) measure of sectoral specialisation is based on data for 18
sectors in manufacturing, to the exclusion of primary and tertiary activities. Similarly,
Clark and van Wincoop (1999) find that sectoral specialisation has a significantly
negative effect on international growth correlations; and in Europe this effect is more
pronounced when specialisation is computed only for manufacturing than when it is
defined across all economic sectors. Manufacturing specialisation patterns thus seem
to have a significant impact on the correlation of business cycles, which validates the
main motivation of our empirical explorations below.
3 Forslid, Haaland and Midelfart Knarvik (1999) provide empirical evidence of such u-shaped evolutions in some industries across four groups of European countries on the basis of a CGE model calibrated on 1992 data. 4 The full set of explanatory variables contains measures of the similarity of sectoral specialisation, trade openness, the combined income level of the two countries, the difference in income levels between the two countries, geographical distance and a dummy for a common border.

8
Empirics 2: Industrial Specialisation in the EU
Most empirical papers dealing with location at an international level are based on
trade data. Many of these analyses are concerned with the pattern of trade flows per
se, but the majority draw on trade data as an indicator of specialisation patterns in
production. Trade data are popular because they are widely available, relatively
reliable and highly disaggregated. A large number of researchers have analysed
patterns of intra-industry trade (IIT), the simultaneous importing and exporting of
goods which belong to the same industrial sector. If we assume export propensities
that are similar across countries and stable over time, then high and growing shares of
IIT are an indicator of sectoral dispersion. Indeed, IIT shares have shown a secular
rise throughout the post-war years in most countries. This is true for the EU
(Fontagné, Freudenberg and Péridy, 1997; Brülhart and Elliott, 1998) as well as for
most industrialised countries world-wide (OECD, 1994). Using a different set of
measures on trade data up to 1992, Sapir (1996) also diagnosed an “apparent lack of
transformation in the structure of EC manufacturing”.
Trade statistics may be considered a second-best indicator of locational patterns. An
uninitiated commentator would likely opt for employment, output or value-added data
as the correct gauge of specialisation. Therefore, empirical researchers have recently
made efforts to measure specialisation patterns on the basis of production data.
Krugman (1991) conducted a rough comparison of industrial specialisation indices
between the United States (split into four regions) and the four largest EU economies.
This exercise suggested that the European Union has a more dispersed, less
specialised industrial geography than the United States. Confirmation of
comparatively low specialisation in the EU is found in Bini Smaghi and Vori (1993)
and in Kalemli-Ozcan et al. (1999), who compared specialisation levels based on data
for the 1980s. However, Krugman’s (1991) results also indicated that the U.S.
economy had become less regionally specialised over the post-war period. Indeed,
Kim (1995) found that U.S. industry concentration and regional specialisation had
reached its high-water mark in the 1920s. This may explain why some recent studies
no longer found a significant difference in specialisation across major EU countries
and U.S. census regions at the two-digit level (Peri, 1998; Clark and van Wincoop,
1999).

9
Looking at data for EU countries and regions alone, Brülhart and Torstensson (1996)
and Brülhart (1998) have reported locational Gini indices for 1980 and 1990. An
increase in the Gini index calculated from employment data, indicating a rise in
industry concentration, was found for 14 of the 18 industries. These 14 industries
accounted for 77.3 percent of manufacturing employment in 1990. Similar results
were obtained by Amiti (1997). Using several specialisation measures and production
data sets, she found evidence of a general increase in manufacturing specialisation
among EU countries over the 1968-90 period. The upward trend in specialisation
manifested itself with particular consistency in the second half of this time interval,
i.e. during the 1980s.
There is an apparent contradiction between the specialisation results based on trade
data, which show rising IIT, and those based on production data, which suggest
increasing specialisation. Furthermore, some studies using production data (Helg,
Manasse, Monocelli and Ravelli, 1995; and De Nardis, Goglio and Malgarini, 1996)
suggest that the number of dispersing sectors roughly equalled that of concentrating
sectors in the EU during the 1980s. However, we still do not avail of a consistent and
comprehensive description of specialisation trends in the EU. On the basis of the
existing studies one cannot, therefore, conclusively accept as a stylised empirical fact
that EU industry has become more localised in recent years.
3. EMPLOYMENT SPECIALISATION IN EUROPE
Data
Employment is probably the most directly policy relevant and intuitive measure of the
size of an industrial sector. The first part of this analysis therefore draws on payroll
data. Traditionally, however, the study of international specialisation patterns has
drawn mainly on trade data. Hence, this paper also reports results calculated from
export data in order to facilitate comparability with other studies. In particular, the
juxtaposition of employment and trade specialisation measures should shed some light
on the apparent contradiction between increasing specialisation trends previously

10
observed in production data and decreasing specialisation trends suggested by the
analysis of trade statistics.
The analysis draws on the OECD’s STAN database, which provides a balanced panel
of annual employment figures for 32 ISIC manufacturing sectors (two- to four-digit)
covering the period 1972-1996 and 13 countries.5 We thereby have a data set that
encompasses the most important periods of EU market integration, starting with the
1973 enlargement and culminating in the completion of the Single Market in 1992.
The EU-15 countries not included in that database are Belgium, Ireland and
Luxembourg. On the other hand, our analysis considers data for Norway, which,
albeit not a full member of the EU, has enjoyed effectively free access to the EU
market in most manufacturing goods since 1973 (WTO, 1995). Whilst, for a
comprehensive analysis of industrial concentration patterns, it would be desirable to
use regional data, country-level statistics are more appropriate in the context of this
paper, since they coincide geographically with the pre-EMU European currency areas.
The Locational Gini Index
We have calculated locational Gini indices for each country-year observation. This
index reports the share of an area between the Lorenz curve and the 45-degree line in
the total area below the 45-degree line. It ranges from zero to one and relates
positively to specialisation.
* FIGURE 1 HERE *
The construction of the locational Gini index is illustrated in Figure 1 with an
example based on Finnish manufacturing exports in 1996.6 The cumulative shares of
exports are measured on the vertical axis, while the cumulative shares of all
5 The 1999 edition of the STAN database provides a full set of export data for the period of our investigation. On the employment side, however, some gaps remain. Two changes have been made in order to obtain a balanced panel. First, some sectors with patchy coverage at the disaggregated level were amalgamated. Second, the gaps that remained were filled using extrapolation of trends based on contemporaneous output, value added and/or export data. This was used for a significant part of 1995, and most of 1996, data, as well as for Spain, 1972-77. Note that the filling-in of 1995 and 1996 values likely biases observed specialisation in favour of a continuation of previous trends, so that these results should be interpreted with greater caution than those for earlier years. 6 Note that the example is based on exports, but the results reported in this section are calculated from employment data.

11
countries’ exports are reported along the horizontal axis. The horizontal ordering of
industries is crucial. In terms of Figure 1, industries are lined up so that the slope of
the Lorenz curve, which links all industry observations, increases continuously as one
moves away from the origin. This ordering can be neatly described with reference to
the Hoover-Balassa index of “revealed comparative advantage”:
t
i cic
iic
cic
ic
ict
E
E
E
E
BALASSA )(
��
�
�� , (1)
where E stands for exports (or employment, output etc.); and the subscripts i, c, t
denote industries, countries and years respectively. This measure takes values
between zero and infinity and relates positively to a country’s specialisation in the
particular industry. In a locational Lorenz diagram of specialisation by country,
industries are lined up in increasing order of their Balassa index. Hence, Figure 1
shows that, in terms of 1996 exports, Finland was most specialised in paper products,
and least in transport equipment. The Gini index, by measuring the area between the
45-degree line and the Lorenz curve, therefore also amounts to a measure of
dispersion of Balassa indices. If Finland had exported each product in equal
proportion to the average over our country sample, then its Balassa indices would all
equal one, the Lorenz curve would coincide with the 45-degree line, and Finnish
export specialisation as measured through the locational Gini coefficient would be
zero. On the other hand, the greater the deviation of Finnish export shares from the
sample means, the greater will be the dispersion of Balassa indices, the stronger will
be the curvature of the Lorenz curve, and the higher will be specialisation as
measured by the Gini coefficient. A discussion of the properties of the Gini index in
the context of international specialisation can be found in Amiti (1997), and Cowell
(1999) gives a thorough appraisal of the coefficient’s usefulness as a measure of
inequality.7
7 Other studies that have reported locational Gini indices include Krugman (1991), Helg et al. (1995) and Brülhart (1998).
12
Locational Gini Indices for EU Countries
The first step of our analysis was to compute locational Gini indices for the full
country sample. Figure 2 graphs the results, reporting three-year averages for the start,
mid and end point of the 1972-1996 interval. The first striking feature is that there are
marked differences in specialisation levels across the 14 countries, and that these
differences vary systematically with country size. The large economies UK, France
and Germany are least specialised, whilst the three small countries Greece, Portugal
and Norway display the highest average Gini indices. This is not surprising, since
large countries are likely to have more heterogeneous economic and natural
endowments, and scale economies may be a exhausted for a larger number of
industries. Second, it becomes immediately apparent from Figure 2 that the long-term
specialisation trend in employment terms is upwards. The unweighted average Gini
increased from 0.26 in 1972-4 to 0.28 in 1994-6. A clear increasing trend in
specialisation is discernible in Figure 2 for seven countries, whilst a continuous
downward trend only appears in two cases (Finland, UK).
* FIGURE 2 HERE *
* TABLE 1 HERE *
The same results are reported more formally in Table 1, which lists time-averaged
Gini coefficients as well as OLS regressions of annual Ginis (in logs) on a time trend.
A statistically significant increasing trend in the Gini index is found for eight
countries, whilst a significantly decreasing trend appears for only three (Denmark,
Finland, UK). On average, the Gini coefficient increased by 0.3% per year. The
strongest increases in specialisation appear for Italy (1.4% annually), Germany
(1.2%), Greece (0.9%) and Sweden (0.7%). The fact that this is a rather mixed group
of countries sounds a warning signal against sweeping generalisations about the
underlying forces that drive the apparent specialisation process. It should also be
noted that the observed trends do not appear to be the outcome of some mechanistic
mean-reversion process, whereby relatively highly specialised countries would tend to
witness decreases in their specialisation measures, and vice versa. The point can be
made simply with two illustrative examples: the UK, which had the second lowest
base-year Gini, witnessed a significant decrease in specialisation; and Greece, with

13
the second highest base-year Gini, displayed the most pronounced increase of all
sample countries.
Structural Dissimilarity Measures
The finding that manufacturing employment specialisation of EU countries has
generally increased is important in its own right. If this trend were to continue, the
EU’s industrial geography might become more clustered and prone to region- and
country-specific shocks. The picture revealed by Gini indices is, however, incomplete,
since it says nothing about the similarity of countries. One cannot, for example, infer
from the low Ginis of France and Germany and from the high Ginis of Greece and
Portugal, that sector-specific shocks will be shared more symmetrically in the former
country pair than in the latter. What matters is not only the degree of specialisation,
but also the ordering of industries along the specialisation spectrum (i.e. along the
horizontal axis of a Lorenz diagram). The similarity of industrial specialisation
structures across country pairs can be captured with the following simple index, due
to Krugman (1991)8:
� ��i
iF
iHHF ssS , (2)
where H and F denote the two countries, i refers to sectors, and s is the share of a
particular sector in total manufacturing employment of that country. This measure
varies between zero and two; with a value of zero obtaining if the two economies
have identical sector compositions, and two indicating perfect dissimilarity of sectoral
structures.
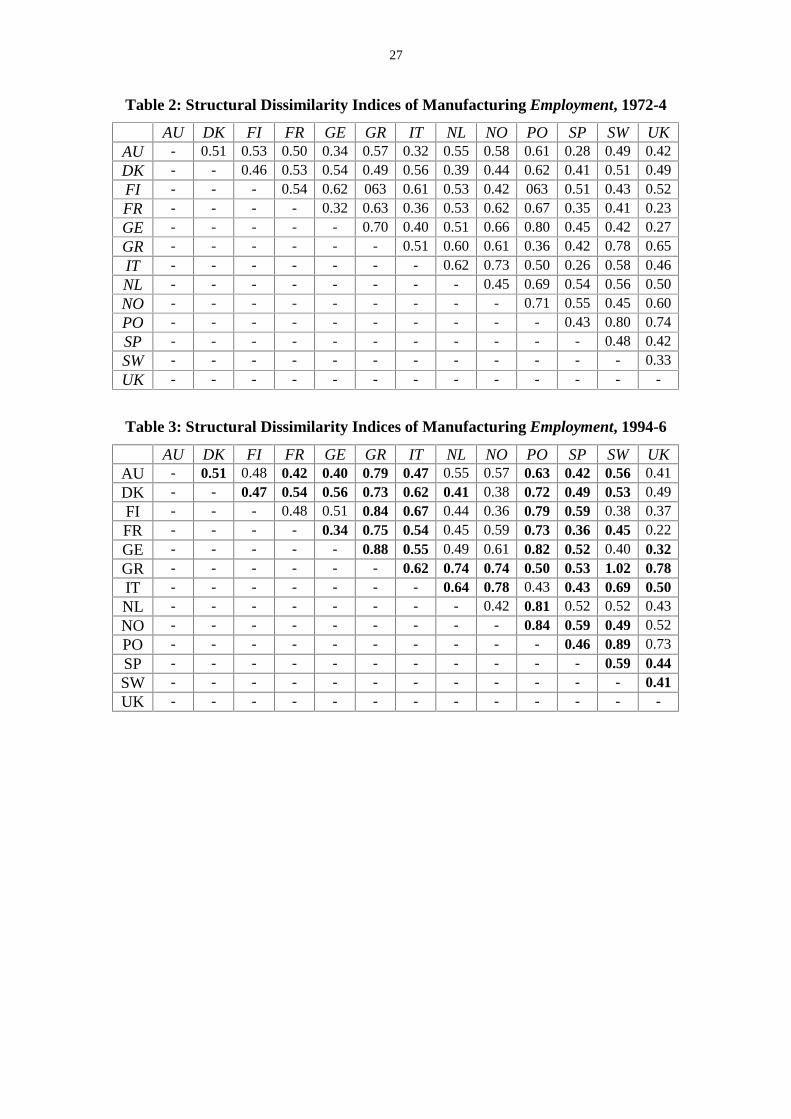
* TABLE 2 HERE *
* TABLE 3 HERE *
We have computed similarity indices for all country pairs and sample years in the
dataset. A snapshot is presented in Tables 2 and 3, which report base- and end-period
results respectively. Again, we find significant dispersion in the indices across
observations. In the base period, the index ranges from 0.23 (France-UK) to 0.80
(Portugal-Sweden), the average is at 0.53 and the standard deviation is 0.13. More

14
strikingly still, the results confirm that EU countries have become more dissimilar
over time in terms of the composition of their manufacturing employment. In the end
period, the index ranges from 0.22 (France-UK) to 1.02 (Greece-Sweden), and the
mean and standard deviation have risen to 0.56 and 0.16 respectively. The rise in the
average is evident from Table 3, where all observations which represent increases
over the base-period values are in bold print. In 53 out of the 78 country pairs
industrial employment structures became more dissimilar between the early 1970s and
the mid-1990s. It thus appears that increased specialisation, as apparent from the rise
in average Gini coefficients, was such that it also resulted in growing sectoral
dissimilarity of EU countries.
In the context of EMU, it is similarity (or “convergence”) with one particular
economy, Germany, that has long dominated discussions. We have therefore
computed dissimilarity indices with Germany for each sample country. One might
object that the European Central Bank now considers a weighted average of the
eleven euro countries in its computation of monetary indicators, and that it would for
that reason be more appropriate to compute dissimilarity indices with a weighted
average of our sample countries. Whilst this is a valid concern, we nevertheless opt
for using exclusively German data as the “anchor”, because this allows a more clear-
cut interpretation of results. If dissimilarity measures were computed vis-à-vis a
basket of countries, it would be difficult to distinguish cross-country differences that
are due to individual country features from those that are merely driven by the
differing weights of countries in the basket. In addition, in its calculation of euro-zone
price indices, the ECB accords by far the largest country weight to Germany (35%).9
* TABLE 4 HERE *
We report time-averaged dissimilarity indices with Germany, and time trends of those
measures, in Table 4. In terms of its industrial composition, the UK, maybe
surprisingly, resembles Germany most closely, followed by France, Austria and
8 This index has also been applied by Clark and van Wincoop (1999) in an interesting comparison of US and EU data, albeit at a less sectorally disaggregated level than that used here. 9 The combined weight of Germany and France in the ECB’s calculations is 56%. Since these countries are very similar in industrial structure (Figure 4), our “anchor” could be deemed in fact to represent over half of the economic weight of the Euro-11.

15
Sweden. Greatest structural dissimilarity with Germany is displayed by Greece,
Portugal and Norway. In terms of trends, all countries bar Finland, Norway, Sweden
and the Netherlands saw their industrial structures diverge from that of Germany.
In sum, a pretty stark picture emerges from the employment data. The structural
composition of manufacturing sectors has become more diverse across EU countries
over the last three decades. Most countries have become more specialised, and more
dissimilar from Germany. Given that these trends are observed over a period with
strong and almost continuous reductions in cross-border transaction costs among EU
countries, one might reasonably expect EMU to stimulate a continuation of this
pattern. However, for an argument along these lines, one needs some understanding of
the underlying forces that shape the observed trends. We will discuss this issue in
Section 5. First, however, we replicate the description of specialisation patterns, using
data for exports instead of employment.
4. EXPORT SPECIALISATION IN EUROPE
As outlined in Section 2, there are good practical reasons why most previous studies
of international specialisation have been conducted of the basis of trade data. In the
context of monetary integration, one can also invoke a more fundamental argument in
favour of looking at trade statistics. Namely, in so far as issues of risk and transaction
costs are concerned, the introduction of a single currency will impact most strongly on
the most open sectors of the economy. One way of taking this point into account is to
work with trade data. The replication of the analysis carried out in Section 4 on export
data instead of employment data amounts to weighting industries by their export
propensity, which in turn can stand as a proxy for openness to trade.
This exercise draws on statistics for the same country, industry and year sample as
above, and the same measures are used. Countries’ exports to the world as a whole are
retained, rather than exports within the sample or to the Euro-11 countries. The
principal motivation for this choice is that, over the time period covered by the data,
barriers to international transactions have been falling not only within the EU, but

16
between the sample countries and the overwhelming majority of trade partners
worldwide.
Gini Indices
Annual country-level Gini indices are again reported in a bar chart (Figure 3) and in
tabular form (Table 5). First, we can note that specialisation levels in terms of exports
significantly exceed those calculated with employment data. The overall average Gini
of exports is 0.39 (Table 5), whilst that of employment is 0.27 (Table 1). This finding
is consistent with incomplete specialisation in a comparative-advantage world and
homogeneous products. It could also point to the existence of non-traded goods in
heterogeneous sectors, resulting from prohibitive trade costs or from home bias in
expenditure. Given the relatively high level of aggregation in our data, the second
interpretation looks particularly plausible.
* FIGURE 3 HERE *
* TABLE 5 HERE *
In terms of relative specialisation levels across countries, roughly the same rankings
emerge from export data as from employment data. Large countries are relatively less
specialised (France, Germany, UK), whilst the highest specialisation measures are
found for small countries (Finland, Greece, Norway). This may be explained both by
comparative advantage, where large countries are likely to have a richer factor mix,
and by increasing returns, through which the size of the economy limits the range of
activities that it can efficiently accommodate.
Most importantly, we find confirmation of the pattern that has emerged in prior
empirical studies. Whilst specialisation in employment terms has been increasing,
export specialisation has tended downwards. Eight of our 13 sample countries show
significant negative export specialisation trends, whilst only two show significant
positive time trends (Greece and Italy). Hence, countries appear to have become more
specialised in the sectoral distribution of their manufacturing employment, but at the
same time they have diversified their manufacturing exports.

17
Structural Dissimilarity Measures
Tables 6 and 7 report bilateral indices measuring how similar countries are in terms of
the sectoral composition of their manufacturing exports. A comparison with the
identically constructed results on employment data in Tables 2 and 3 confirms the
results we obtained from the comparison of Gini coefficients. On the one hand, most
dissimilarity indices are higher in export terms than in employment terms. In other
words, countries are more dissimilar from one another in terms of their composition
of exports than in terms of their composition of employment in manufacturing sectors.
On the other hand, we find more evidence of the “puzzle” that specialisation
decreased in export terms even though it increased in employment terms. Over the
sample period the bilateral export dissimilarity index rose for a mere 19 out of 78
country pairs.
* TABLES 6 AND 7 HERE *
Table 8 reports export dissimilarity indices vis-à-vis Germany. Eight of the 12 sample
countries became gradually more similar to Germany in terms of manufacturing
export composition, while only three countries became significantly more dissimilar
UK, Greece, Italy).
* TABLE 8 HERE *
For a summarising picture of patterns in dissimilarity indices with Germany, we have
constructed Figure 4. This illustrates levels and changes in both export and
employment dissimilarity indices. The clustering of data points along the diagonal
shows that, in terms of levels, employment and export dissimilarity coefficients are
positively correlated, as one would expect. A ranking of countries in terms of their
structural similarity to Germany also emerges. Closest to the origin are the proximate
and similarly large countries France and the UK, which have the lowest dissimilarity
indices. Furthest away from the origin appear the relatively remote and small
countries Greece and Portugal, whose composition of manufacturing activity differs
most from that of Germany.

18
* FIGURE 4 HERE *
In half of the sample countries, the arrows also point roughly along the 45-degree line,
meaning that export and employment similarity measures have evolved in the same
direction. This is the case for the UK, Italy and Greece, who have become more
dissimilar from Germany both in employment and in export terms, and for Finland,
Norway and Sweden, who have become more similar to Germany on both counts. In
the other half of our country sample, the evolution is orthogonal to the 45-degree line,
meaning that the changes in employment and export indices have different signs. In
all of these cases, the “puzzle” emerges: employment dissimilarity from Germany
increased, while export dissimilarity decreased. Note, however, that over the entire
period nine of the twelve sample countries have become more dissimilar from
Germany in employment terms.
5. DETERMINANTS OF SPECIALISATION PATTERNS
Looking at Figures 1 to 3, some regularities appear. The three large and relatively
central economies of Germany, France and the UK have the most diverse, and
correspondingly the most similar, composition of manufacturing sectors. Conversely,
the three relatively small and peripheral countries Greece, Portugal and Norway have
the most specialised manufacturing sectors and differ most from Germany. As
mentioned above, this pattern is consistent with predictions of both comparative-
advantage and increasing-returns models.
In considering changes rather than levels, one finds that three countries show the most
clear-cut dynamics in terms of their structural similarity to Germany. Italy, which
moved from being one of the most similar countries to becoming markedly more
dissimilar, Greece, which was one of the least similar countries at the start of the
period and grew even more dissimilar, and Finland, which became significantly more
similar to Germany. These patterns tie in with changes in those countries’ Gini
indices: Italy and Greece became more, and Finland less, specialised over time. Such
idiosyncrasies in specialisation dynamics across EU countries suggest that simple
generalisations are impossible on the basis of country-level measures. Since
19
differences in locational determinants are more likely to apply across industries than
across countries, we turn to the analysis of industry-level Gini coefficients, calculated
across the 13 sample countries.
In Section 2, we have outlined the difficulties faced by empirical studies that seek for
evidence on competing theoretical approaches. There is no aspiration in this paper to
deliver a rigorous quantitative evaluation of the forces that shape observed industrial
specialisation.10 Nevertheless, we want to probe deeper than describing country-level
patterns and trends, by considering some salient industry characteristics and
examining their impact on specialisation outcomes.
For information on industry characteristics, we draw on three sources. First, the
OECD (1987, p. 272ff.) have produced a useful classification of industries “on the
basis of the primary factors affecting the competitive process in each activity”. We
distinguish four categories:
1. resource-intensive industries, where the main competitive factor is “access to
abundant natural resources” (9 sectors in our sample),
2. labour-intensive industries, where the main competitive factor is labour costs (6
sectors),
3. scale-intensive industries, where the main competitive factor is the “length of
production runs” (10 sectors), and
4. technology-intensive industries, where the main competitive factors are “rapid
application of scientific advance” and “tailoring products to highly varied demand
characteristics” (7 sectors).11
In addition, we consider trade costs in the form of pre-Single-Market non-tariff
barriers, drawing on the categorisation by Buigues, Ilzkovitz and Lebrun (1990),
which classified industries according to three levels of sensitivity to the Single-
Market measures: high, intermediate and low.
10 For recent empirical work on testing theoretical paradigms in data on international specialisation, see Davis and Weinstein (1998), Head and Ries (1999) and Brülhart and Trionfetti (1999). 11 The OECD (1987) report subdivides our “technology intensive” category into “science-based industries” and “differentiated goods”. We have amalgamated the two sectors, because we had to aggregate up from some ISIC 4-digit headings to 3-digit sectors. Aggregation did not pose a problem for the other three industry categories.
20
The simplest approach is to group industries according to the classifications at hand,
and to compute group-wise average Gini coefficients. Such analysis lends itself to
graphical representation. We have plotted the evolution of group-level Gini indices
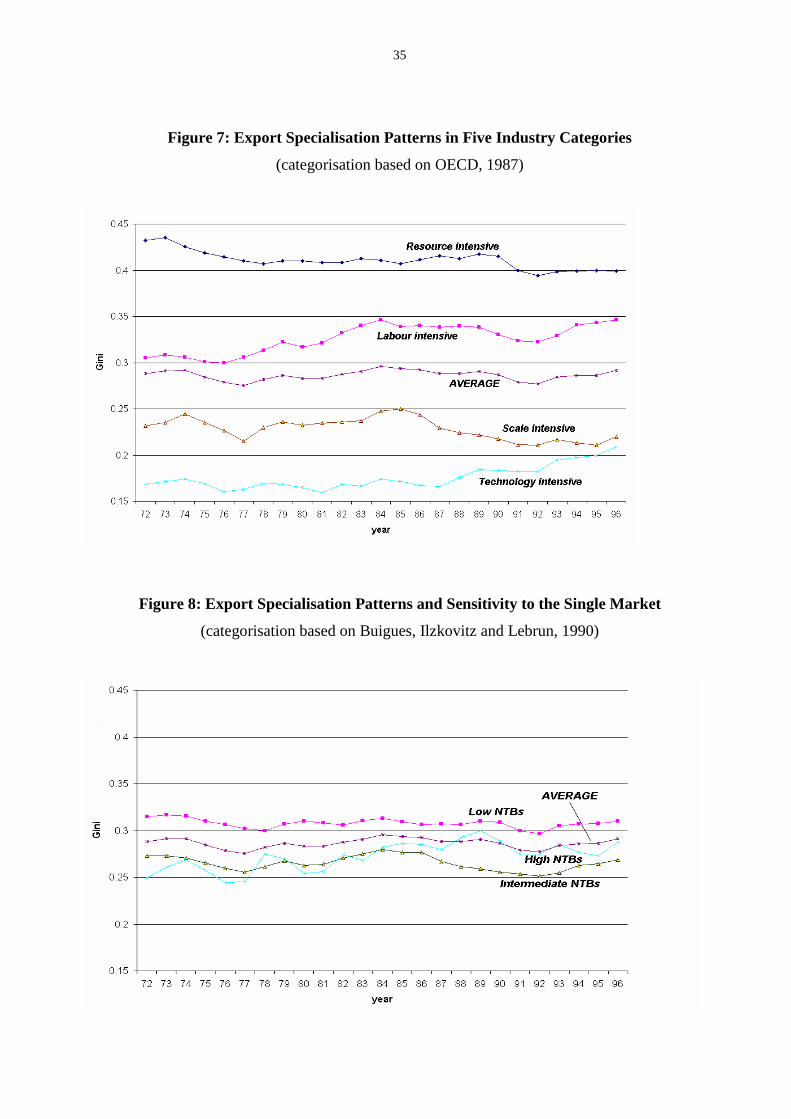
over the entire 1972-96 time period (Figures 5-8). Rather than commenting on each
graph individually, we can list the most salient findings.
� The strongest specialisation appears in traditional, low-tech industries. In the
employment data, the labour-intensive category shows the highest average
specialisation levels, while in the export data it is the resource-intensive industries
that appear most geographically specialised. In both employment and export
statistics, the labour-intensive industries display the most pronounced rate of
increase in specialisation.
� In employment as well as export data, it is the technology-intensive industries that
appear least geographically concentrated. However, specialisation in those
industries has increased since 1986, i.e. during the implementation period of the
Single Market programme.
� Specialisation in the scale-intensive industries on average is neither particularly
high nor particularly low. There is no evidence of an increase in specialisation in
those sectors relative to the manufacturing mean.
� Employment specialisation has consistently been strongest in sectors protected by
high non-tariff barriers, but non-tariff barriers do not appear to have significantly
affected export specialisation.12
* FIGURES 5, 6, 7 AND 8 HERE *
Each of the four stylised findings seems at odds with expectations often associated
with “new” models, whereby trade liberalisation unleashes agglomeration forces in
increasing-returns industrial sectors. The results reported here suggest instead that the
highest degree of specialisation is in traditional, low-tech sectors; and that industries
with liberalised intra-EU trade regimes were less rather than more localised than the
average.
12 Analysis of variance on the group means in Figure 8 shows them not to differ significantly from the overall mean in any of the sample years.

21
Some results might be driven by data limitations. For instance, the low observed
specialisation levels in high-tech sectors might be a result of excessively broad and
inadequate product classifications. Another conceivable limitation of this exercise is
misspecification through omitted variables. In particular, theory suggests that
specialisation outcomes are the effect simultaneously of industry characteristics, such
as those that inform the OECD (1987) classification, and of the magnitude of trade
costs, such as proxied by our classification by non-tariff barriers. Multivariate
analysis is clearly called for.
We have converted the industry classifications into sets of dummy variables, and
regressed the specialisation measures on all industry characteristics jointly. Table 9
reports the results. It is apparent that our principal conclusions from Figures 5-8
survive in the regressions. Labour- and resource-intensive industries are significantly
more geographically concentrated than the average, technology-intensive industries
are less concentrated, and the scale-sensitivity of industries has only a weak impact on
specialisation. Furthermore, when we control for other locational determinants, the
degree of both employment and export specialisation increases in the level of intra-
EU non-tariff barriers. The magnitudes of these effects are important. For instance,
employment specialisation in technology-intensive sectors is 30% lower, and in high-
NTB sectors it is 45% higher, ceteris paribus.
* TABLE 9 HERE *
6. CONCLUSIONS AND CONJECTURES
This paper documents specialisation trends in 32 manufacturing industries across 13
European countries over the 1972-1996 period. Employment and export data are used
concurrently to compute specialisation measures. In line with the existing literature,
we find that specialisation has been generally increasing in employment terms, whilst
export data point towards a slight decrease in average specialisation. These opposing
overall trends appear irrespective of the specialisation measure used.

22
Whilst it is clearly impossible to give a simple and general answer to the “growing
alike or growing apart” question, we are not left in complete confusion. First, for a
number of countries, employment and trade data tell the same story. The structural
composition of manufacturing in two countries, Italy and Greece, has consistently
become more specialised as well as more dissimilar from most fellow EU countries.
The opposite is true for Denmark, Finland and the Netherlands. These countries have
diversified their manufacturing bases and become more similar to most EU countries,
in particular Germany. Sweden, whilst specialising in employment terms, has also
become more similar over time to Germany.
Have there been two converging groups of countries, a northern and a southern
“club”? Our results do not permit such a simple generalisation. Data for Spain and
Portugal, as well as for Austria, produce the picture that emerges also for the overall
average: increasing specialisation and structural dissimilarity of employment but
decreasing specialisation and dissimilarity of exports. The explanation of this
apparent puzzle probably lies in the different speeds of two processes that are
triggered by the fall in trade barriers. One process is an increase in the export
propensity across industries, including ones that were previously “non-traded”. The
other process is that of sectoral specialisation in an evolving international division of
labour. If economic integration triggers the first process more quickly than the second
(which seems plausible), then contradicting specialisation trends in employment and
trade patterns may well emerge. And if this is the explanation for our apparently
contradictory specialisation results for some countries, then employment data should
probably be interpreted as a more reliable indicator of long-term trends than trade
data.
We have also produced some evidence that “traditional” labour-intensive and natural
resource-intensive sectors represent the most concentrated activities among EU
countries. This might be in line with the growing specialisation, at least in
employment terms, observed for Greece, Italy, Spain and Portugal. On the other hand,
an acceleration of geographical concentration in technology-intensive sectors since
the mid-1980s cautions against the interpretation that increased specialisation is
merely the result of low-tech industries disappearing faster in the northern than in the
southern member countries. Considering the fact that obsolete statistical

23
classifications probably lead to a downward bias in the estimated specialisation levels
of high-tech sectors, the observed increase might well reflect strong clustering
tendencies in those industries.
In conclusion, an answer to the question posed in the title of this paper clearly must be
subject to some qualifications. Nonetheless, given that employment data are probably
a more reliable gauge of long-term specialisation trends than trade data, we can state
that our results for the last three decades by and large favour the “growing apart”
hypothesis. The average country-level Gini index on sectoral employment has risen
from 0.26 in the early 1970s to 0.28 in the mid-1990s, and there are no discernible
signs of a trend reversal. Is this a bad omen for EMU? In the strict context of OCA
theory, the implication is that the incidence of asymmetric fluctuations and the
corresponding adjustment costs must be rising. Yet, two reasons caution against
pessimism. First, extrapolation of historical trends is particularly hazardous when
facing as large a change in policy regime as the introduction of a single currency. For
example, the strong divergent tendencies of industrial sectors in Italy and Greece may
well have been influenced by those countries’ particular inflation records and
exchange-rate movements. The Lucas critique must be borne in mind. Second, the
efficiency gains from adopting the single currency are positively correlated with a
country’s openness, and thus, small countries are likely to benefit most. On balance,
this may well make up for the fact that we find the smaller countries to be the most
specialised, and hence most prone to asymmetric shocks.

24
BIBLIOGRAPHY Amiti, Mary (1997) “Specialisation Patterns in Europe”. CEP Discussion Paper, No. 363,
London School of Economics. Bayoumi, Tamim and Prasad, Eswar (1997) “Currency Unions, Economic Fluctuations,
and Adjustment - Some New Empirical Evidence”. IMF Staff Papers, vol. 44. Bini Smaghi, Lorenzo and Vori, Silvia (1993) “Rating the EC as an Optimal Currency
Area”. Bank of Italy Discussion Papers, No. 187, Rome. Brülhart, Marius (1998) “Trading Places: Industrial Specialisation in the European Union”.
Journal of Common Market Studies, vol. 36, No. 3, pp. 319-346. Brülhart, Marius and Elliott, Robert (1998) “Adjustment to the European Single Market:
Inferences from Intra-Industry Trade Patterns”. Journal of Economic Studies, vol. 25., pp. 225-247.
Brülhart, Marius and Torstensson, Johan (1996) “Regional Integration, Scale Economies and Industry Location in the European Union”. CEPR Discussion Paper, No. 1435, Centre for Economic Policy Research, London.
Brülhart, Marius and Trionfetti, Federico (1999) “Home -Biased Demand and International Specialisation: A Test of Trade Theories”. Mimeo, University of Lausanne and London School of Economics.
Buigues, Pierre; Ilzkovitz, Fabienne and Lebrun, Jean-François (1990) “The Impact of the Internal Market by Industrial Sector: The Challenge for the Member States”. In: The European Economy - Social Europe (Special Edition), Commission of European Communities, Brussels.
Buiter, Willem H.; Corsetti, Giancarlo and Roubini, Nouriel (1993) “Sense and Nonsense in the Treaty of Maastricht” Economic Policy, vol. 16, pp. 57-90.
Buti, Marco and Sapir, André (1998) Economic Policy in EMU. Oxford University Press. Clark, Todd and van Wincoop, Eric (1999) “Borders and Business Cycles”. Mimeo,
Federal Reserve Bank of New York. Commission of the European Communities (1990) “One Market, One Money”. European
Economy, No. 44. Cowell, Frank A. (1999) “Measurement of Inequality”. In: Bourguignon, F. and Atkinson,
A.B. (eds.) Handbook of Income Distribution. North-Holland, Amsterdam, forthcoming. Davis, Donald R. and Weinstein, David E. (1998) “Market Access, Economic Geography
and Comparative Advantage: An Empirical Assessment”. Mimeo, Harvard University. De Nardis, Sergio; Goglio, Alessandro and Malgarini, Marco (1996) “Regional
Specialization and Shocks in Europe: Some Evidence from Regional Data”. Weltwirtschaftliches Archiv, vol. 132, pp. 197-214.
Eichengreen, Barry (1992) “Should the Maastricht Treaty be Saved?” Princeton Studies in International Finance, No. 74, Princeton University.
Fontagné, Lionel; Freudenberg, Michael and Péridy, Nicolas (1997) “Trade Patterns Inside the Single Market”. Document de travail, no. 97-07, CEPII, Paris.
Forslid, Rikard; Haaland, Jan I. and Midelfart Knarvik, Karen Helene (1999) “A U-Shaped Europe?” CEPR Discussion Papers, No. 2247.
Frankel, Jeffrey A. and Rose, Andrew K. (1998) “The Endogeneity of the Optimum Currency Area Criteria”. Economic Journal, vol. 108, pp. 1009-1025.
Fujita, Masahisa; Krugman, Paul and Venables, Anthony (1999) The Spatial Economy: Cities, Regions and International Trade, MIT Press: Cambridge, MA.
Head, Keith and Ries, John (1999) “Armington Vs. Krugman: A Test of Two Trade Models”. International Business, Trade and Finance Working Papers, No. 99/02, University of British Columbia, Vancouver.
Helg, Rodolfo; Manasse, Paolo; Monocelli, Tommaso and Rovelli, Riccardo (1995) “How much (A)symmetry in Europe? Evidence from Industrial Sectors”. European Economic Review, vol. 39, pp. 1017-1041.
Helpman, Elhanan and Razin, Assaf (1978) “Uncertainty and International Trade in the Presence of Stock Markets”. Review of Economic Studies, vol. 45, pp. 239-250.

25
Imbs, Jean (1999) “Co-Fluctuations”. DEEP Cahiers de recherches économiques, No. 89/19, University of Lausanne.
Kalemli-Ozcan, Sebnem; Sorensen, Bent E. and Oved, Yosha (1999) “Risk Sharing and Industrial Specialisation: Regional and International Evidence”. Mimeo, Brown University.
Kenen, Peter B. (1969) “The Theory of Optimum Currency Areas: An Eclectic View”. In: Mundell, R. and Swoboda, A.K., Monetary Problems of the International Economy, pp. 41-60, University of Chicago Press.
Kim, Sukkoo (1995) “Expansion of Markets and the Geographic Distribution of Economic Activities: The Trends in U.S. Regional Manufacturing Structure, 1860-1987”. Quarterly Journal of Economics, vol. 110, pp. 881-908.
Krugman, Paul (1991) Geography and Trade. Cambridge (Mass.), MIT Press. Krugman, Paul (1993) “Lessons of Massachusetts for EMU”. In: Torres, F. and Giavazzi, F.
(ed.) Adjustment and Growth in the European Monetary Union. Cambridge University Press.
Krugman, Paul (1997) “The Practical Theorist: Peter Kenen’s Contribution to International Economics”. In: Cohen, B., International Trade and Finance: New Frontiers for Research, Cambridge University Press.
Mundell, Robert (1961) “A Theory of Optimum Currency Areas”. American Economic Review, vol. 51, pp. 657-665.
OECD (1987) Structural Adjustment and Economic Performance. Organisation for Economic Co-operation and Development, Paris.
OECD (1994) The OECD Jobs Study (Part I: Labour Market Trends and Underlying Forces of Change). Organisation for Economic Co-operation and Development, Paris.
Peri, Giovanni (1998) “Technological Growth and Economic Geography”. IGIER Working Paper, No. 139, Bocconi University, Milan.
Pratten, Cliff (1988) “A Survey of the Economies of Scale”. In: Commission of the European Communities, Research on the “Cost of Non-Europe”, Volume 2: Studies on the Economics of Integration, Luxembourg.
Ricci, Luca A. (1997) “Exchange Rate Regimes and Location”, IMF Working Paper, No. 97/69, International Monetary Fund, Washington DC.
Sapir, André (1996) “The Effects of Europe’s Internal Market Programme on Production and Trade: A First Assessment”. Weltwirtschaftliches Archiv, vol. 132.
Winkler, Bernhard (1995) “Reputation for EMU: An Economic Defence of the Maastricht Criteria”. European University Institute Working Paper, No. 95/18, EUI Florence.
WTO (1995) Regionalism and the World Trading System. World Trade Organisation Secretariat, Geneva.
Wyplosz, Charles (1997) "EMU: Why and How It Might Happen", Journal of Economic Perspectives, vol. 11, p. 3-22.

26
Table 1: Country-Level Gini Indices of Manufacturing Employment, 1972-1996
Country Mean Gini OLS Regression on Time Trend: ln(GINI)t=�1+�2*YEARt+�t, YEAR={72,…,96}
�2 t statistic* R2 Austria 0.20 0.0061 8.24 0.73 Denmark 0.32 -0.0015 -3.57 0.36 Finland 0.32 -0.0053 -9.95 0.79 France 0.13 0.0093 7.82 0.77 Germany 0.18 0.0119 11.58 0.84 Greece 0.42 0.0091 23.91 0.97 Italy 0.23 0.0136 15.46 0.92 Netherlands 0.33 -0.0023 -1.76 0.12 Norway 0.38 -0.0002 -0.53 0.00 Portugal 0.40 0.0026 2.91 0.29 Spain 0.20 0.0047 4.85 0.55 Sweden 0.28 0.0073 14.64 0.92 UK 0.13 -0.0032 -5.86 0.43 PANEL# 0.27 0.0033 16.12 0.38 * calculated from White-adjusted standard errors. # OLS with country fixed-effects. R2 only for “within” variation.
27
Table 2: Structural Dissimilarity Indices of Manufacturing Employment, 1972-4
AU DK FI FR GE GR IT NL NO PO SP SW UK AU - 0.51 0.53 0.50 0.34 0.57 0.32 0.55 0.58 0.61 0.28 0.49 0.42 DK - - 0.46 0.53 0.54 0.49 0.56 0.39 0.44 0.62 0.41 0.51 0.49 FI - - - 0.54 0.62 063 0.61 0.53 0.42 063 0.51 0.43 0.52 FR - - - - 0.32 0.63 0.36 0.53 0.62 0.67 0.35 0.41 0.23 GE - - - - - 0.70 0.40 0.51 0.66 0.80 0.45 0.42 0.27 GR - - - - - - 0.51 0.60 0.61 0.36 0.42 0.78 0.65 IT - - - - - - - 0.62 0.73 0.50 0.26 0.58 0.46 NL - - - - - - - - 0.45 0.69 0.54 0.56 0.50 NO - - - - - - - - - 0.71 0.55 0.45 0.60 PO - - - - - - - - - - 0.43 0.80 0.74 SP - - - - - - - - - - - 0.48 0.42 SW - - - - - - - - - - - - 0.33 UK - - - - - - - - - - - - -
Table 3: Structural Dissimilarity Indices of Manufacturing Employment, 1994-6
AU DK FI FR GE GR IT NL NO PO SP SW UK AU - 0.51 0.48 0.42 0.40 0.79 0.47 0.55 0.57 0.63 0.42 0.56 0.41 DK - - 0.47 0.54 0.56 0.73 0.62 0.41 0.38 0.72 0.49 0.53 0.49 FI - - - 0.48 0.51 0.84 0.67 0.44 0.36 0.79 0.59 0.38 0.37 FR - - - - 0.34 0.75 0.54 0.45 0.59 0.73 0.36 0.45 0.22 GE - - - - - 0.88 0.55 0.49 0.61 0.82 0.52 0.40 0.32 GR - - - - - - 0.62 0.74 0.74 0.50 0.53 1.02 0.78 IT - - - - - - - 0.64 0.78 0.43 0.43 0.69 0.50 NL - - - - - - - - 0.42 0.81 0.52 0.52 0.43 NO - - - - - - - - - 0.84 0.59 0.49 0.52 PO - - - - - - - - - - 0.46 0.89 0.73 SP - - - - - - - - - - - 0.59 0.44 SW - - - - - - - - - - - - 0.41 UK - - - - - - - - - - - - -

28
Table 4: Structural Dissimilarity of Employment Compared to Germany, 1972-96 Country Time-Averaged
Dissimil. Index w.r.t. Germany
OLS Regression on Time Trend: ln(S)t=�1+�2*YEARt+�t, YEAR={72,…,96}
�2 t statistic* R2 Austria 0.39 0.0095 8.53 0.78 Denmark 0.54 0.0018 3.81 0.49 Finland 0.62 -0.0068 -3.80 0.52 France 0.32 0.0047 3.43 0.28 Greece 0.81 0.0113 13.57 0.92 Italy 0.48 0.0164 17.10 0.92 Netherlands 0.53 -0.0007 -0.47 0.01 Norway 0.62 -0.0025 -3.62 0.35 Portugal 0.80 0.0035 4.38 0.40 Spain 0.51 0.0086 6.70 0.77 Sweden 0.41 0.0004 0.59 0.02 UK 0.30 0.0109 8.39 0.74 * calculated from White-adjusted standard errors.
Table 5: Country-Level Gini Indices of Manufacturing Exports, 1972-1996
Country Mean Gini OLS Regression on Time Trend: ln(GINI)t=�1+�2*YEARt+�t, YEAR={72,…,96}
�2 t statistic* R2 Austria 0.31 -0.0202 -18.11 0.95 Denmark 0.45 -0.0033 -4.96 0.53 Finland 0.57 -0.0088 -10.12 0.81 France 0.16 0.0003 0.16 0.00 Germany 0.19 -0.0064 -5.21 0.51 Greece 0.65 0.0034 2.79 0.26 Italy 0.28 0.0064 5.99 0.60 Netherlands 0.38 -0.0082 -6.53 0.59 Norway 0.55 -0.0017 -1.56 0.08 Portugal 0.56 -0.0037 -3.96 0.31 Spain 0.30 -0.0068 -2.41 0.27 Sweden 0.38 -0.0057 -6.97 0.71 UK 0.23 0.0033 1.79 0.11 PANEL 0.39 -0.0040 -6.59 0.15 * calculated from White-adjusted standard errors. # OLS with country fixed-effects. R2 only for “within” variation.

29
Table 6: Structural Dissimilarity Indices of Manufacturing Exports, 1972-4
AU DK FI FR GE GR IT NL NO PO SP SW UK AU - 0.92 0.97 0.59 0.65 1.03 0.57 0.85 0.99 0.76 0.79 0.61 0.68 DK - - 1.15 0.76 0.81 1.01 0.77 0.68 1.00 1.05 0.70 0.91 0.78 FI - - - 1.16 1.21 1.37 1.16 1.20 0.98 1.07 1.09 0.72 1.21 FR - - - - 0.40 0.94 0.46 0.63 0.91 0.88 0.54 0.70 0.37 GE - - - - - 1.19 0.46 0.72 1.02 1.14 0.79 0.57 0.37 GR - - - - - - 1.01 0.81 1.04 0.96 0.86 1.37 1.15 IT - - - - - - - 0.76 1.13 0.94 0.59 0.74 0.40 NL - - - - - - - - 0.89 0.97 0.67 0.99 0.73 NO - - - - - - - - - 1.13 0.85 0.87 1.07 PO - - - - - - - - - - 0.94 1.08 1.02 SP - - - - - - - - - - - 0.89 0.75 SW - - - - - - - - - - - - 0.69 UK - - - - - - - - - - - - -
Table 7: Structural dissimilarity Indices of Manufacturing Exports, 1994-6
AU DK FI FR GE GR IT NL NO PO SP SW UK AU - 0.74 0.67 0.48 0.40 1.15 0.44 0.79 0.90 0.73 0.60 0.40 0.55 DK - - 0.92 0.71 0.73 0.92 0.69 0.63 0.88 1.05 0.84 0.84 0.74 FI - - - 0.87 0.85 1.30 0.93 0.95 0.82 1.02 0.94 0.51 0.83 FR - - - - 0.36 1.06 0.60 0.54 0.87 0.85 0.44 0.64 0.35 GE - - - - - 1.21 0.50 0.62 0.93 0.89 0.47 0.52 0.42 GR - - - - - - 1.00 0.85 0.92 0.82 1.02 1.33 1.16 IT - - - - - - - 0.84 1.06 0.75 0.60 0.74 0.60 NL - - - - - - - - 0.70 1.03 0.73 0.90 0.49 NO - - - - - - - - - 1.14 0.91 0.91 0.98 PO - - - - - - - - - - 0.84 0.89 0.94 SP - - - - - - - - - - - 0.72 0.65 SW - - - - - - - - - - - - 0.64 UK - - - - - - - - - - - - -

Table 8: Structural Dissimilarity of Exports Compared to Germany, 1972-1996 Country Time-Averaged
Dissimil. Index w.r.t. Germany
OLS Regression on Time Trend: ln(S)t=�1+�2*YEARt+�t, YEAR={72,…,96}
�2 t statistic* R2 Austria 0.51 -0.0218 -26.58 0.96 Denmark 0.76 -0.0045 -6.65 0.69 Finland 0.99 -0.0157 -16.29 0.91 France 0.33 -0.0008 -0.23 0.00 Greece 1.24 0.0034 2.49 0.21 Italy 0.49 0.0032 2.10 0.15 Netherlands 0.68 -0.0095 -7.50 0.66 Norway 0.95 -0.0035 -3.27 0.28 Portugal 1.04 -0.0085 -4.93 0.64 Spain 0.56 -0.0221 -8.65 0.80 Sweden 0.52 -0.0044 -2.80 0.26 UK 0.39 0.0107 5.79 0.60 * calculated from White-adjusted standard errors.
Table 9: Determinants of Specialisation
(OLS with year fixed effects; dependent variable = log of Gini; 775 observations)
Employment data Export data
(1) (2) (4) (5) Labour intensity dummy (OECD, 1987)
0.151 (2.10)**
0.149 (2.12) **
0.217 (3.13) ***
0.196 (3.12) ***
Technology intensity dummy (OECD, 1987)
-0.106 (-2.67)***
-0.295 (-8.08) ***
-0.224 (-6.97) ***
-0.374 (-8.60) ***
Resource intensity dummy (OECD, 1987)
0.087 (2.03)**
0.101 (2.09) **
0.571 (14.2) ***
0.655 (17.5) ***
Scale intensity (Pratten, 1988)
-0.002 (-0.52)
0.001 (0.26)
0.008 (1.75) *
0.011 (2.74) ***
Intermed. NTB dummy (Buigues et al., 1990)
0.088 (2.17) **
0.222 (5.80) ***
High NTB dummy (Buigues et al., 1990)
0.449 (9.63) ***
0.426 (9.14) ***
Adj. R2 0.084 0.204 0.432 0.512
Notes: � t-values from White-adjusted standard errors; confidence levels: *** 99%, ** 95%, * 90%. � In order to avoid perfect multicollinearity, we dropped the OECD (1987) dummy for scale-intensive
industries and replaced it by the classification of Pratten (1988) who ranked industries in descending order by their estimated minimum efficient plant scales.

Figure 1: A Locational Lorenz Curve
(Manufacturing specialisation of Finland, 1996)
cumulative share of Finnish manufacturing exports
cumulative share of manuf. exports in all sample countries
a… Transport equipment n.e.c. b… Pharmaceuticals c… Motor vehicles d… Food products e… Professional and scientific equipment f… Industrial chemicals g… Machinery n.e.c. h… Iron and steel i… Radio, TV and telecom equipment j… Shipbuilding k… Wood products l… Paper products

Figure 2: Country Specialisation in Manufacturing Employment, 1972-1996 (Gini indices, unweighted averages)
Figure 3: Country Specialisation in Manufacturing Exports, 1972-1996
(Gini indices, unweighted averages)
0
0.05
0.1
0.15
0.2
0.25
0.3
0.35
0.4
0.45
Austri
a
Denm
ark
Finlan
d
Franc
e
Germ
any
Greec
eIta
ly
Nethe
rland
s
Norway
Portu
gal
Spain
Sweden UK
AVERAGE
1972-4
1984-6
1994-6
0.00
0.10
0.20
0.30
0.40
0.50
0.60
0.70
Austri
a
Denm
ark
Finlan
d
Franc
e
Germ
any
Greec
eIta
ly
Nethe
rland
s
Norway
Portu
gal
Spain
Sweden UK
AVERAGE
1972-4
1983-5
1994-6

Fig
ure
4: S
truc
tura
l Dis
sim
ilari
ty F
rom
Ger
man
y in
Em
ploy
men
t an
d E
xpor
t T
erm
s, 1
972-
1996
(dat
a po
ints
: 197
2-4,
198
3-5,
199
4-6)

Figure 5: Employment Specialisation Patterns in Five Industry Categories
(categorisation based on OECD, 1987)
Figure 6: Employment Specialisation Patterns and Sensitivity to the Single Market
(categorisation based on Buigues, Ilzkovitz and Lebrun, 1990)
35
Figure 7: Export Specialisation Patterns in Five Industry Categories
(categorisation based on OECD, 1987)
Figure 8: Export Specialisation Patterns and Sensitivity to the Single Market
(categorisation based on Buigues, Ilzkovitz and Lebrun, 1990)

36