Embed Size (px)
Citation preview

FYE March 31, 2016
Third Quarter Results
February 5, 2016

2
FY2015 3Q (Apr-Dec, 2014)
FY2016 3Q (Apr-Dec, 2015)
YoY YoY(%)
Net Sales 210,348 211,360 +1,012 + 0.5%
Operating
Income 13,780 15,248 +1,468 +10.7%
Recurring
Profit 15,228 17,094 +1,865 +12.2%
Profit attributable
to owners of the
parent 10,456 10,754 + 297 + 2.8%
(mm of yen)
Consolidated Results
Note: “FY2016” refers to the fiscal year ending March 31, 2016 and all other fiscal years are referred to in the same manner.
3
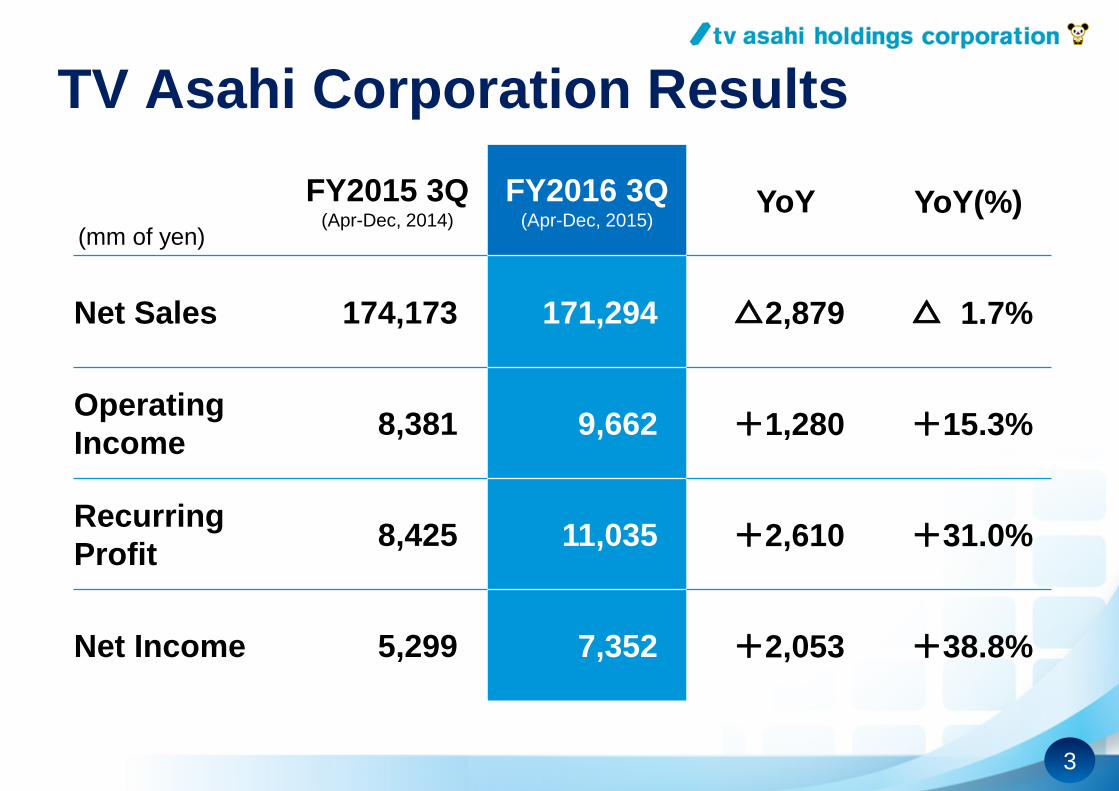
FY2015 3Q (Apr-Dec, 2014)
FY2016 3Q (Apr-Dec, 2015)
YoY YoY(%)
Net Sales 174,173 171,294 △2,879 △ 1.7%
Operating
Income 8,381 9,662 +1,280 +15.3%
Recurring
Profit 8,425 11,035 +2,610 +31.0%
Net Income 5,299 7,352 +2,053 +38.8%
TV Asahi Corporation Results
(mm of yen)
4
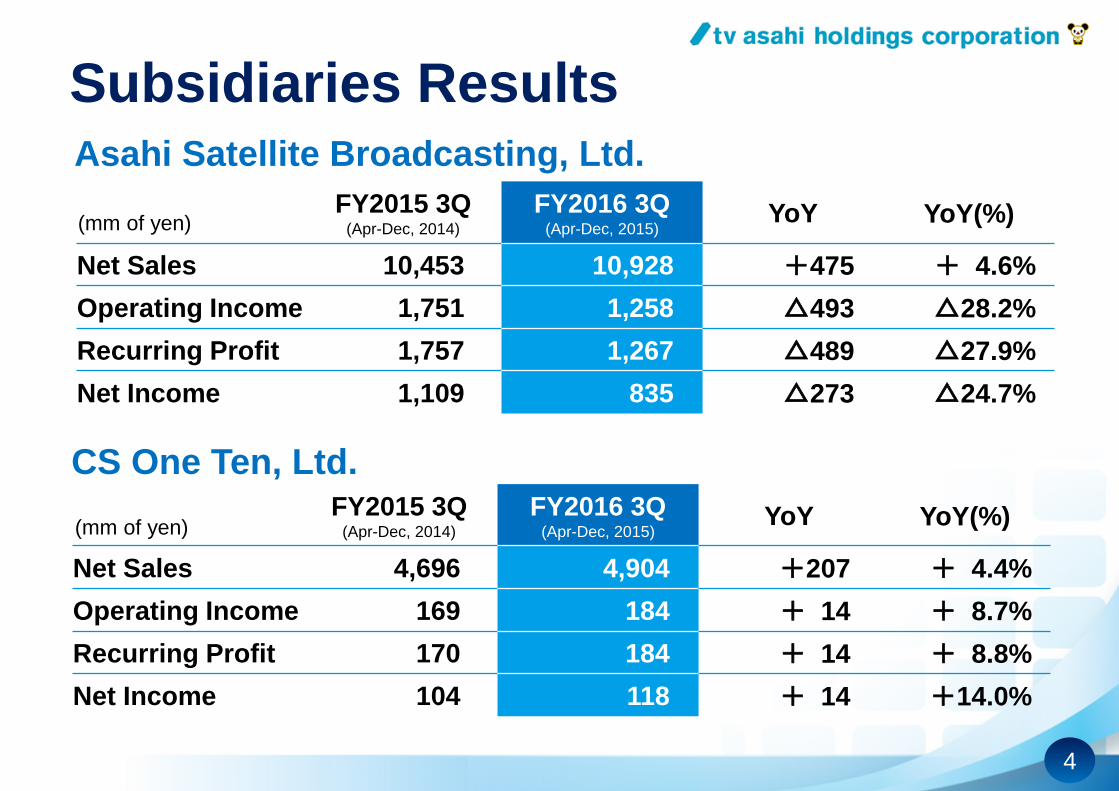
FY2015 3Q (Apr-Dec, 2014)
FY2016 3Q (Apr-Dec, 2015)
YoY YoY(%)
Net Sales 4,696 4,904 +207 + 4.4%
Operating Income 169 184 + 14 + 8.7%
Recurring Profit 170 184 + 14 + 8.8%
Net Income 104 118 + 14 +14.0%
FY2015 3Q (Apr-Dec, 2014)
FY2016 3Q (Apr-Dec, 2015)
YoY YoY(%)
Net Sales 10,453 10,928 +475 + 4.6%
Operating Income 1,751 1,258 △493 △28.2%
Recurring Profit 1,757 1,267 △489 △27.9%
Net Income 1,109 835 △273 △24.7%
Asahi Satellite Broadcasting, Ltd.
CS One Ten, Ltd.
Subsidiaries Results
(mm of yen)
(mm of yen)

5
Sales and Income by Segment (Consolidated)
Segment
Net Sales Operating Income
FY2016 3Q (Apr-Dec, 2015)
YoY YoY (%) FY2016 3Q
(Apr-Dec, 2015) YoY YoY (%)
TV Broadcasting
Business 182,243 △3,467 △ 1.9% 13,396 +1,360 +11.3%
Music Publication
Business 10,077 +3,883 +62.7% 1,163 + 471 +68.0%
Other Businesses 27,220 + 400 + 1.5% 658 △ 373 △36.2%
Adjustments △8,179 + 195 △ 2.3% 29 + 10 +52.7%
Total 211,360 +1,012 + 0.5% 15,248 +1,468 +10.7%
TV
Broadcasting
Music
Publication
Other
Businesses Adjustments
INC
DEC
INC
DEC
Net Sales YoY Operating Income YoY
+3,883
△3,467
+1,360
(mm of yen)
TV
Broadcasting Music
Publication
Other
Businesses Adjustments +400 +471
△373

6
FY2015 3Q (Apr-Dec, 2014)
FY2016 3Q (Apr-Dec, 2015)
YoY YoY(%)
Net Sales 185,710 182,243 △3,467 △ 1.9%
Time Sales 67,480 67,312 △ 167 △ 0.2%
Spot Sales 77,875 74,066 △3,808 △ 4.9%
Program Sales 9,434 9,437 + 3 + 0.0%
BS & CS 18,148 18,743 + 594 + 3.3%
Other 12,771 12,681 △ 89 △ 0.7%
Operating Income 12,036 13,396 +1,360 +11.3%
TV Broadcasting Business
(mm of yen)

7
FY2015 FY2016 YoY YoY(%)
1Q 23,006 21,903 △1,103 △ 4.8%
2Q 21,865 22,399 + 534 + 2.4%
1H 44,871 44,302 △ 569 △ 1.3%
3Q (Oct.-Dec.) 22,608 23,009 + 401 + 1.8%
3Q (Apr.-Dec.) 67,480 67,312 △ 167 △ 0.2%
Time Sales Revenue (Terrestrial)
(%)
Year on Year Growth
FY2015
-10
-5
0
5
10
1Q 2Q 3Q 4Q 1Q 2Q 3Q
(mm of yen)
FY2016

8
Spot Sales Revenue (Terrestrial)
FY2015 FY2016 YoY YoY(%)
1Q 27,168 24,686 △ 2,482 △ 9.1%
2Q 23,683 22,436 △ 1,246 △ 5.3%
1H 50,852 47,123 △ 3,729 △ 7.3%
3Q (Oct.-Dec.) 27,022 26,943 △ 79 △ 0.3%
3Q (Apr.-Dec.) 77,875 74,066 △ 3,808 △ 4.9%
-30
-20
-10
0
10
Oct. Jan. Apr. Jul. Oct.
3Q(Apr.-Dec.): 22.2% (YoY △0.9%)
(%)
FY2015
Year on Year Growth
(mm of yen)
Share in
the Tokyo Spot Sales Market
FY2016

9
FY2016 3Q (Oct-Dec, 2015) FY2015 3Q (Oct-Dec, 2014)
YoY Share YoY Share
Source of Energy & Industrial Machines 231.6% 0.9% 40.7% 0.4%
Foods 108.1% 10.8% 98.1% 9.9%
Beverages & Liquors 102.4% 6.4% 92.6% 6.2%
Pharmaceuticals & Medical Supplies 115.7% 10.7% 109.8% 9.3%
Cosmetics & Toiletries 108.0% 6.6% 98.7% 6.1%
Clothing & Wear Accessories 88.1% 2.6% 107.9% 2.9%
Business Machines & Office Supplies 77.3% 1.4% 124.3% 1.7%
Consumer Electronics 90.7% 3.4% 101.1% 3.7%
Automobiles 73.6% 5.9% 100.5% 8.0%
Homeware 96.4% 2.1% 130.7% 2.2%
Game & Software&Sporting Goods 88.0% 5.2% 85.1% 5.9%
Housing & Housing Materials 95.2% 2.4% 129.3% 2.5%
Publishing 89.6% 1.0% 73.4% 1.2%
Communications Media & Internet Devices 108.7% 14.7% 94.1% 13.5%
Retail 95.2% 5.0% 80.4% 5.3%
Finance & Insurance 98.5% 8.3% 108.1% 8.5%
Transportation & Movies & Leisure 105.5% 5.8% 122.9% 5.5%
Food-service & Various Services 88.1% 5.0% 107.9% 5.6%
Government & Public Institution 84.7% 0.6% 212.3% 0.7%
Education & Medical-service & Religion 118.0% 1.0% 109.4% 0.9%
Other 403.3% 0.0% 21.4% 0.0%
Total 99.7% 100.0% 100.1% 100.0%
Spot Sales Industry Information (Terrestrial)
10
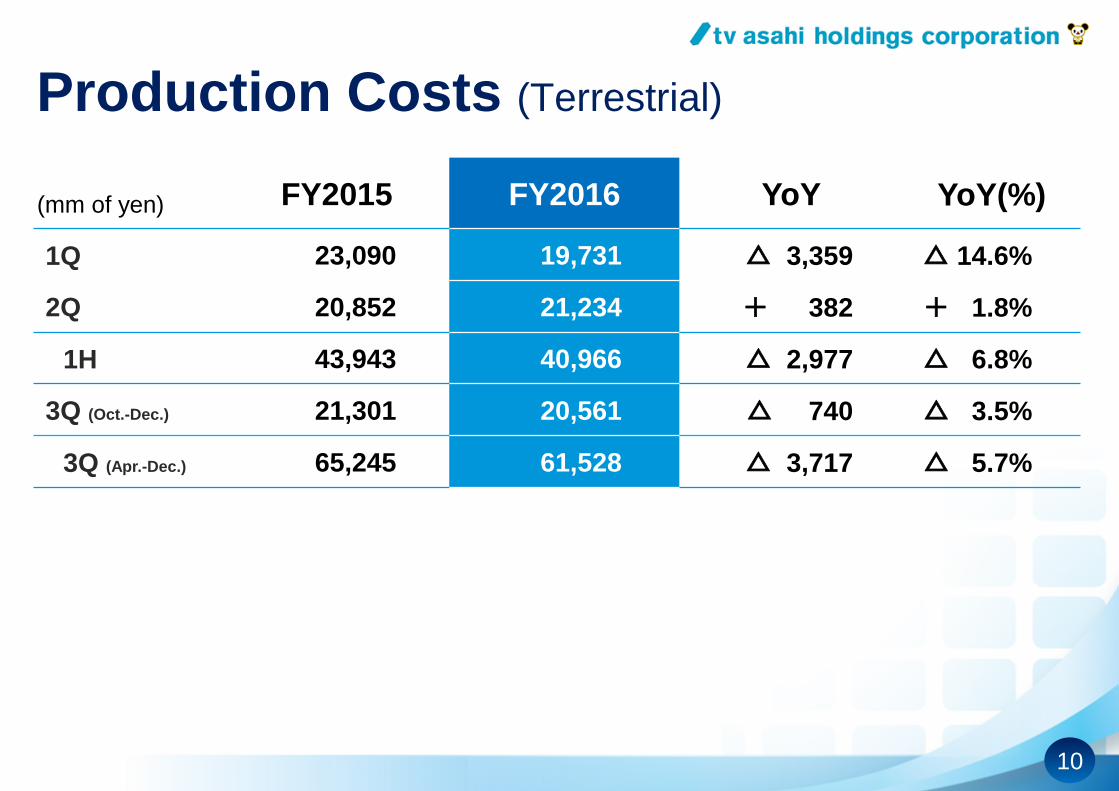
FY2015 FY2016 YoY YoY(%)
1Q 23,090 19,731 △ 3,359 △ 14.6%
2Q 20,852 21,234 + 382 + 1.8%
1H 43,943 40,966 △ 2,977 △ 6.8%
3Q (Oct.-Dec.) 21,301 20,561 △ 740 △ 3.5%
3Q (Apr.-Dec.) 65,245 61,528 △ 3,717 △ 5.7%
Production Costs (Terrestrial)
(mm of yen)
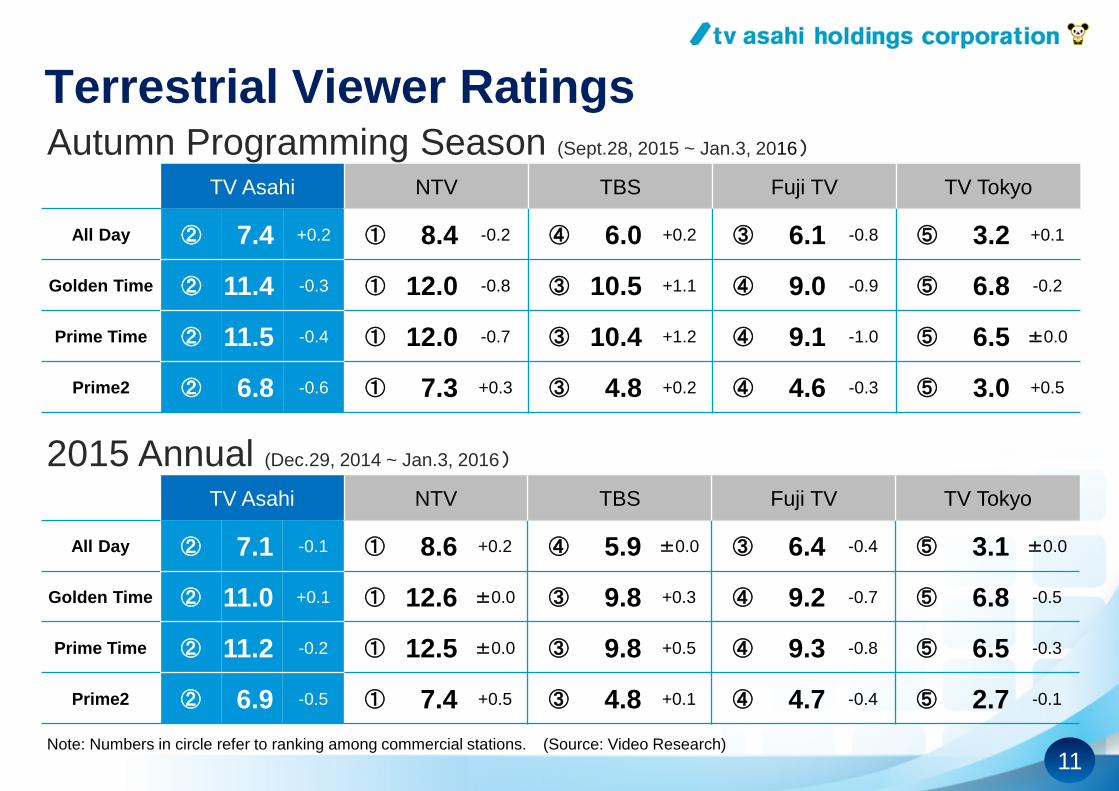
11 Note: Numbers in circle refer to ranking among commercial stations.
TV Asahi NTV TBS Fuji TV TV Tokyo
All Day ② 7.4 +0.2 ① 8.4 -0.2 ④ 6.0 +0.2 ③ 6.1 -0.8 ⑤ 3.2 +0.1
Golden Time ② 11.4 -0.3 ① 12.0 -0.8 ③ 10.5 +1.1 ④ 9.0 -0.9 ⑤ 6.8 -0.2
Prime Time ② 11.5 -0.4 ① 12.0 -0.7 ③ 10.4 +1.2 ④ 9.1 -1.0 ⑤ 6.5 ±0.0
Prime2 ② 6.8 -0.6 ① 7.3 +0.3 ③ 4.8 +0.2 ④ 4.6 -0.3 ⑤ 3.0 +0.5
(Source: Video Research)
Terrestrial Viewer Ratings Autumn Programming Season (Sept.28, 2015 ~ Jan.3, 2016)
TV Asahi NTV TBS Fuji TV TV Tokyo
All Day ② 7.1 -0.1 ① 8.6 +0.2 ④ 5.9 ±0.0 ③ 6.4 -0.4 ⑤ 3.1 ±0.0
Golden Time ② 11.0 +0.1 ① 12.6 ±0.0 ③ 9.8 +0.3 ④ 9.2 -0.7 ⑤ 6.8 -0.5
Prime Time ② 11.2 -0.2 ① 12.5 ±0.0 ③ 9.8 +0.5 ④ 9.3 -0.8 ⑤ 6.5 -0.3
Prime2 ② 6.9 -0.5 ① 7.4 +0.5 ③ 4.8 +0.1 ④ 4.7 -0.4 ⑤ 2.7 -0.1
2015 Annual (Dec.29, 2014 ~ Jan.3, 2016)
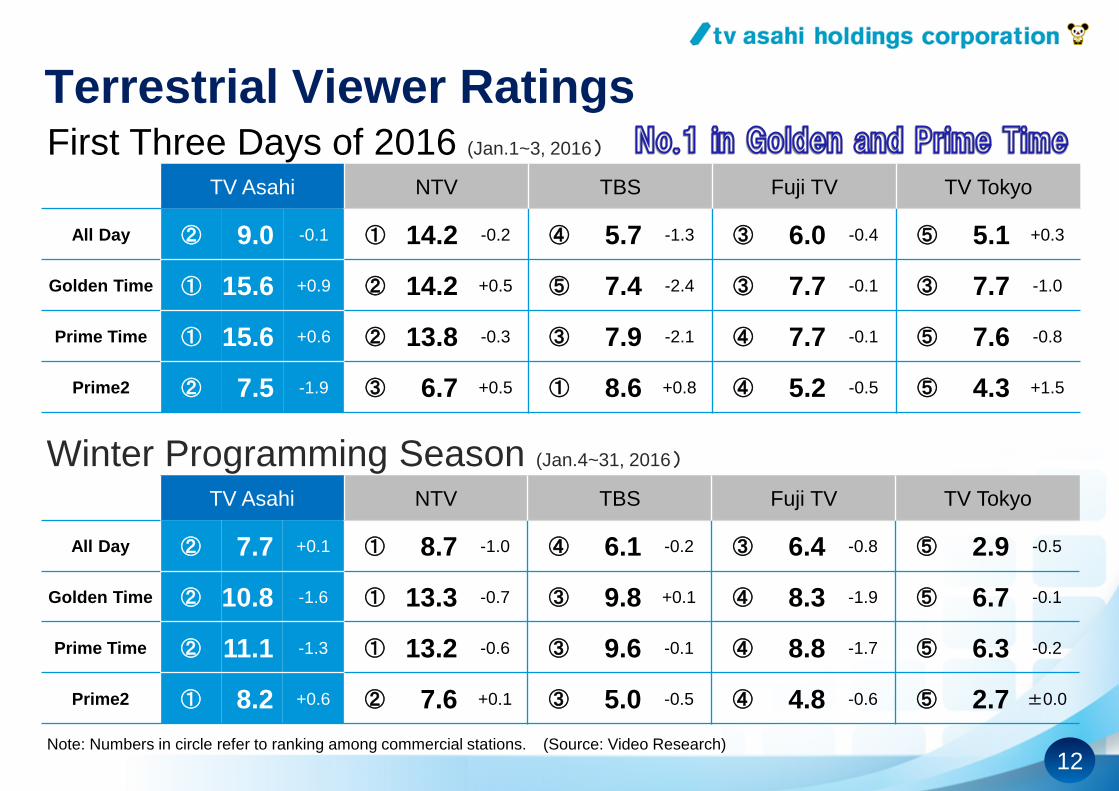
12 Note: Numbers in circle refer to ranking among commercial stations.
TV Asahi NTV TBS Fuji TV TV Tokyo
All Day ② 9.0 -0.1 ① 14.2 -0.2 ④ 5.7 -1.3 ③ 6.0 -0.4 ⑤ 5.1 +0.3
Golden Time ① 15.6 +0.9 ② 14.2 +0.5 ⑤ 7.4 -2.4 ③ 7.7 -0.1 ③ 7.7 -1.0
Prime Time ① 15.6 +0.6 ② 13.8 -0.3 ③ 7.9 -2.1 ④ 7.7 -0.1 ⑤ 7.6 -0.8
Prime2 ② 7.5 -1.9 ③ 6.7 +0.5 ① 8.6 +0.8 ④ 5.2 -0.5 ⑤ 4.3 +1.5
(Source: Video Research)
Terrestrial Viewer Ratings First Three Days of 2016 (Jan.1~3, 2016)
TV Asahi NTV TBS Fuji TV TV Tokyo
All Day ② 7.7 +0.1 ① 8.7 -1.0 ④ 6.1 -0.2 ③ 6.4 -0.8 ⑤ 2.9 -0.5
Golden Time ② 10.8 -1.6 ① 13.3 -0.7 ③ 9.8 +0.1 ④ 8.3 -1.9 ⑤ 6.7 -0.1
Prime Time ② 11.1 -1.3 ① 13.2 -0.6 ③ 9.6 -0.1 ④ 8.8 -1.7 ⑤ 6.3 -0.2
Prime2 ① 8.2 +0.6 ② 7.6 +0.1 ③ 5.0 -0.5 ④ 4.8 -0.6 ⑤ 2.7 ±0.0
Winter Programming Season (Jan.4~31, 2016)

13
Terrestrial Viewer Ratings Trend (%)
(Source: Video Research)

14
Music Publication Business
FY2015 3Q (Apr-Dec, 2014)
FY2016 3Q (Apr-Dec, 2015)
YoY YoY(%)
Net Sales 6,193 10,077 +3,883 +62.7%
Operating
Income 692 1,163 + 471 +68.0%
<SHONAN NO KAZE>
NATIONAL TOUR 2015
(mm of yen)
<KETSUMEISHI>
LIVE DVD

15
Other Businesses
Sales of Major Other Businesses
FY2015 3Q (Apr-Dec, 2014)
FY2016 3Q (Apr-Dec, 2015)
YoY YoY(%)
Special Events 4,534 6,030 +1,495 +33.0%
Shopping 5,142 5,916 + 774 +15.1%
Internet Related 3,669 4,339 + 669 +18.3%
Equipment/Lease 2,762 2,912 + 150 + 5.4%
DVD 1,957 1,363 △ 594 △30.4%
Motion Pictures 2,803 1,022 △1,781 △63.5%
FY2015 3Q (Apr-Dec, 2014)
FY2016 3Q (Apr-Dec, 2015)
YoY YoY(%)
Net Sales 26,819 27,220 +400 + 1.5%
Operating
Income 1,031 658 △373 △36.2%
(mm of yen)
(mm of yen)

16
Future Topics for Other Businesses
Special
Events
1/29-2/14 Stage:Watashi no Host-chan THE FINAL
2/25-3/7 Art Takeshi Exhibition
2/26-3/6 Paranoia ★ Circus
5/14,15,21,22 TOKYO・OSAKA METROPOLITAN ROCK FESTIVAL2016
DVD
2/10 Ame Talk vol.34,35,36
3/16 Isan Souzoku
3/16 DEMPA NO KAMIGAMI BIRI SIX
3/23 Shikujiri Sensei vol.4,5,6
Motion
Pictures
3/5 36th Doraemon the Movie :
NOBITA AND THE BIRTH OF JAPAN 2016
3/12 Kazoku wa Tsuraiyo
4/16 Crayon Shin-chan The Movie : Bakusui! Yumemi World Daitoppa
4/29 SCANNER : Kioku no Kakera wo Yomu Otoko
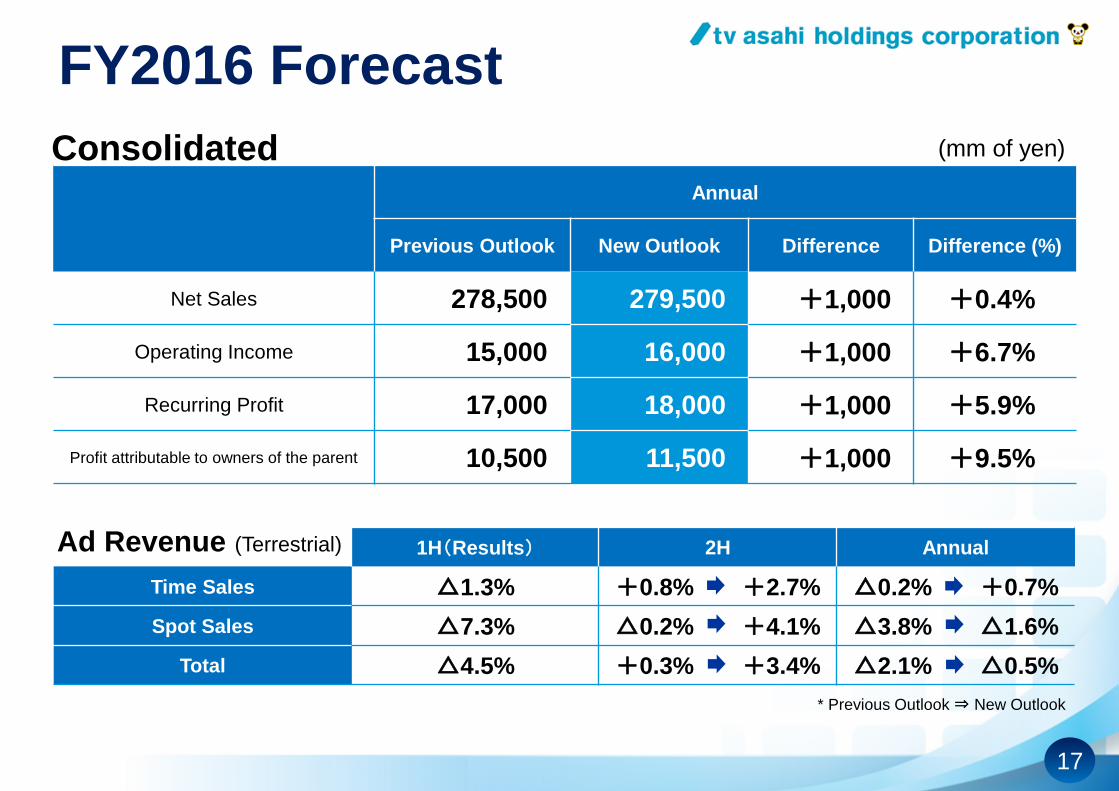
17
1H(Results) 2H Annual
Time Sales △1.3% +0.8% +2.7% △0.2% +0.7%
Spot Sales △7.3% △0.2% +4.1% △3.8% △1.6%
Total △4.5% +0.3% +3.4% △2.1% △0.5%
FY2016 Forecast
(mm of yen) Consolidated
Ad Revenue (Terrestrial)
Annual
Previous Outlook New Outlook Difference Difference (%)
Net Sales 278,500 279,500 +1,000 +0.4%
Operating Income 15,000 16,000 +1,000 +6.7%
Recurring Profit 17,000 18,000 +1,000 +5.9%
Profit attributable to owners of the parent 10,500 11,500 +1,000 +9.5%
* Previous Outlook ⇒ New Outlook

18
Capex and Depreciation
Capex
Depreciation
(bn of yen)
FY2015 3Q (Apr-Dec, 2014)
FY2016 3Q (Apr-Dec, 2015)
YoY YoY(%) Outlook for
FY2016
Consolidated 5.31 6.17 +0.85 +16.1% 11.46
TV Asahi
Corporation 4.75 5.55 +0.80 +16.9% 10.76
FY2015 3Q (Apr-Dec, 2014)
FY2016 3Q (Apr-Dec, 2015)
YoY YoY(%) Outlook for
FY2016
Consolidated 7.16 7.70 +0.53 +7.5% 10.28
TV Asahi
Corporation 6.57 6.94 +0.37 +5.7% 9.34
(bn of yen)
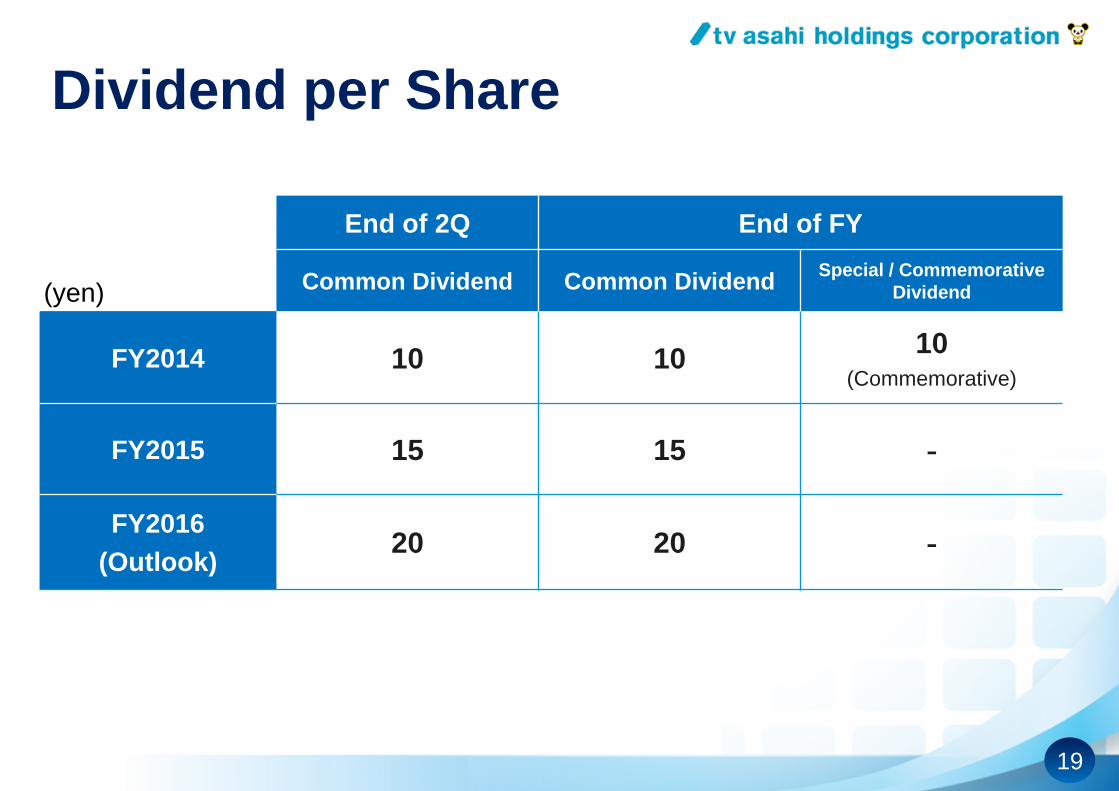
19
Dividend per Share
End of 2Q End of FY
Common Dividend Common Dividend Special / Commemorative
Dividend
FY2014 10 10 10
(Commemorative)
FY2015 15 15 -
FY2016
(Outlook) 20 20 -
(yen)

20
Financial outlooks and other figures that are not historical facts are based on
information available at the time of announcement. Please be informed that actual
results may differ due to various factors in the business environment. As such, actual
results may differ from the forecasts given in this document and guarantees are not
made to achieving the announced results.
For further information regarding this document, please contact:
Investor Relations, Corporate Strategy Department
TV Asahi Holdings Corporation
Tel: +81-3-6406-1115
Homepage Address: http://www.tv-asahihd.co.jp/e/contents/IR/index.html