Embed Size (px)
Citation preview

“FYE in 180 Days”Sauk Valley Community
College
Jon Mandrell, Dean of Instruction, SVCC
Steve Nunez, Dean of Institutional Research, SVCC
Dr. Andrea Wirgau,Assistant Director, DCCLFerris State University

Background•2-Year Community College
•Located in Dixon, IL(90 miles west of Chicago)
•4000 students annually•700 new students in the fall•300 in the spring

Where we stood…
College success course required
Could be taken anytime in 2 years
Taught by counselors – no faculty
A change in format and curriculum was a common cry
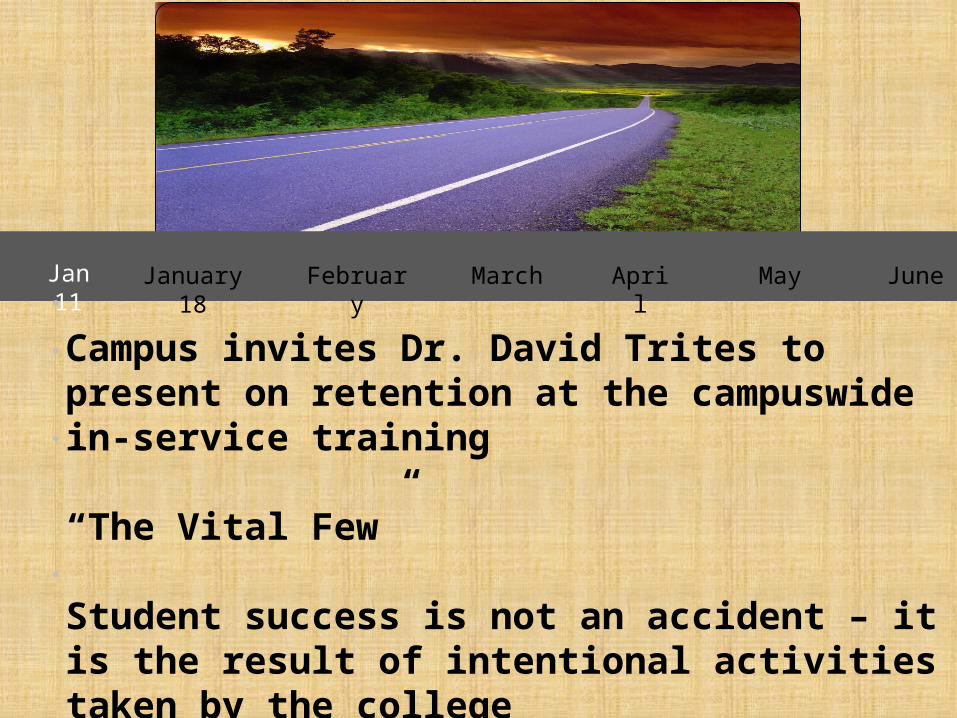
January 18 February March April May June
Campus invites Dr. David Trites to present on retention at the campuswide in-service training
“The Vital Few”
Student success is not an accident – it is the result of intentional activities taken by the college
Jan 11

The Vital Few at SVCC1. Mandatory FYE class in first semester
2. Mandatory Orientation
3. No late registration for new students (once class has met, the student cannot register)
4. Full time retention coordinator (student success coordinator)
5. Course based placement/pre-requisites and developmental
6. Tutoring/additional support for course repeaters.
7 Require a college success program for all remedial students
8. Interactive web site
9. More Bridge programs
10 Partnership with local employers for curriculum and placement
11. More productive designated faculty hours
12. More full time faculty

One Week Later….• Proposal developed by CAO
• President grants approval
• Diverse Committee Created
• Model Schools Targeted to Visit
• Conferences Targeted

February 2013Visit four colleges with elite programs
Attend Gardner Conference
Establish framework of FYE(Mandated Orientation and College Success Course)
Create course outcomes

March April May June JulyFebruary
• Framework Established
• Late Registration Removed
• Create two subgroups to work on orientation and college success course
• Build syllabus and outline

April 2013Weekly Meetings
Subcommittee Recommendations•Curriculum and textbook•Faculty development•Policy and procedures•Assessment

April 2013:Mandatory Orientation
First-time, degree-seeking students•Send orientation assignments to students -15 sessions offered in summer
3-4 hours long•Sessions provide and overview to:
•Services•Tours of campus•Campus log-ins •Faculty panels

April 2013FYE 101
Course title established•One curriculum is set•16 weeks
•Built into Moodle - Allows data to be tracked in all sections of FYE 101
Don’t forget to pick a logo! (Warning: This can get complicated!)

March April May June July AugustFebruary
Policies and procedures created-Absences, withdrawing
Course approved by State
Instructor training days planned
Instructor recruitment begins…

March April May
June July August
Continue campus visits
Establish class sizes (30 max)
Build sections (24)
Continue recruiting instructors!
February

August 2013Instructor development
Full-time and adjunct faculty
Anyone with a Master’s currently employed by college
The more diverse, the better!

March April May June July August
Send invites for mandated orientation
Have a mock orientation
Adjust!
Host orientation June - August
February

March April May June July August
Continue refining FYE course
Continue to educate public on new mandates!
Keep everyone informed -Address concerns
February

After It Begins..• Frequent contact with instructors• Feedback and sharing – online and
face-to-face• Listen to students“Do I have to take this??”“This class is worthless.”“Is this just a way to make money?”• Make FYE data accessible• Monitor student progress and grades

FYE Student Demographics Numbers
556 first-time, degree seeking students
Gender
56.5% female
43.5% male
Age
86% 23 years or younger (“traditional”)
14% 24 years or older (“nontraditional”)
Ethnicity
85% Caucasian
9% Hispanic
3% African American
Degree seeking type
69.4% A.S. or A.A. (transfer)
30.6% A.A.S. or certificate (CTE)
Enrollment status
66% full-time
34% part-time
Average number of college classes
3.82 (excluding FYE)
HS academic record
2.88 HS GPA
19.9 ACT composite

Impact on Enrollment
➔ Mandates “should” negatively affect enrollment➔ At SVCC, a 1% drop in credit hours would shrink
tuition/fee revenue by $50,000➔ Must have “courage” to do what’s right➔ Fall 2013 “10th day” enrollment numbers
◆ headcount was down 0.4%◆ Illinois community college headcount down 2.2%

Retention Data% Completed Course
PSY 100 (2010-2013) >>>> 94.9 - 95.4%
FYE (2014) >>>> 77.7%
Fall to Spring Retention
PSY 100 (2010-2013) >>>> 76.5 - 82.2%
FYE (2014) >>>> 77.7%
Fall GPA
PSY 100 (2011-2012) >>>> 2.71 GPA for completers
FYE (2013) >>>> 2.83 GPA for completers
http://www.discovercarlisle.co.uk/business/profile/

Can FYE provide an “early alert?”
➔ Common wisdom suggests that early identification of at-risk students can help the college intervene earlier and improve retention.
➔ Ways to predict at-risk students?◆ analyze their high school transcript◆ review early semester data from FYE◆ use both!
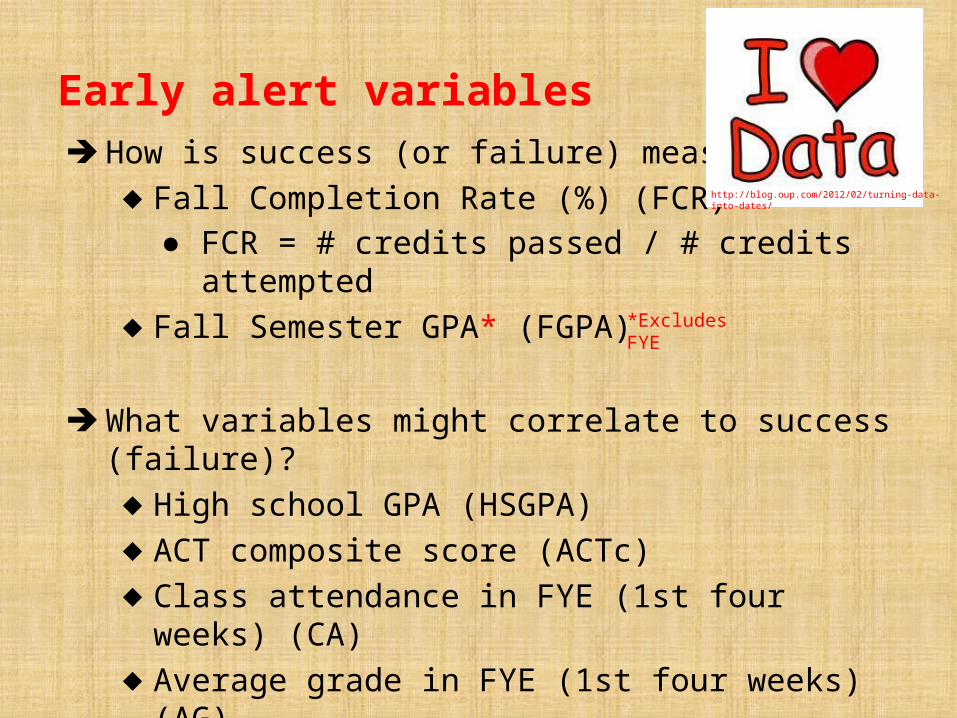
Early alert variables➔ How is success (or failure) measured?
◆ Fall Completion Rate (%) (FCR)*● FCR = # credits passed / # credits attempted
◆ Fall Semester GPA* (FGPA)
➔ What variables might correlate to success (failure)?◆ High school GPA (HSGPA)◆ ACT composite score (ACTc)◆ Class attendance in FYE (1st four weeks) (CA)◆ Average grade in FYE (1st four weeks) (AG)
*Excludes FYE
http://blog.oup.com/2012/02/turning-data-into-dates/

Predicting Fall Completion Rateusing linear regression
Independent Variables Dependent Variable Statistical Significance R2 (variance accounted for)
HS ModelHSGPA*
FCR p<0.001 0.147(15%)
FYE ModelCA & AG
FCR p<0.001 0.392(39%)
Combined ModelCA, AG, and HSGPA
FCR P<0.001 0.388(39%)
*ACTc was not significant and not included within the model.
Google Images

Predicting Fall Completion Ratecross tabulations (1)# classes attended
samplesize
FCR %
CA n 100% 80-99% 60-79% 1-59% 0%
0-1 5 0 0 0 20% 80%
2 18 27.8% 0 0 16.7% 55.6%
3 70 38.6% 4.3% 16% 18.2% 22.9%
4 375 62.1% 3.8% 15.3% 12.7% 6.1%
Google Images

Predicting Fall Completion Ratecross tabulations (2)
Average grade on first 4 FYE assignments
sample size FCR %
AG n 100% 80-99% 60-79% 1-59% 0%
A 241 77.2% 3.3% 11.2% 5.6% 1.7%
B 50 62.0% 4% 16% 14% 4.0%
C 84 51.2% 2.4% 28.8% 17.6% 0%
D 30 53.3% 3.3% 26.6% 11.1% 6.7%

Predicting Fall GPA (FGPA)
Independent Variables
Dependent Variable
Statistical Significance of
model
R2 (variance accounted for)
HS modelHSGPA & ACTc
Fall GPA p<0.001 0.289(29%)
FYE modelAG*
Fall GPA p<0.001 0.288(29%)
Combined modelHSGPA, ACTc, & AG
Fall GPA P<0.001 0.411(41%)
*CA was not significant and not included in any models.

Conclusion & Advice•Start somewhere – whatever fits your institution best
•Visit others•Attend conferences•Set up a data accessible FYE program
•FYE data may be used as an early alert
•Continually reassess and improve