Embed Size (px)
Citation preview

November 12, 2021
FY22/3 H1 Corporate Presentation

Copyright 2021 Japan Display Inc. All Rights Reserved. Slide 2
PersonalTechFor A Better World

FY22/3 Q2 Overview

Copyright 2021 Japan Display Inc. All Rights Reserved. Slide 4
FY22/3 H1 Overview
Managed semiconductor shortage, grew customer business, & passed on increased costs to selling prices, driving higher sales & reducing operating loss to significantly outperform forecast
Strong progress in new product roll-out & development of leading-edge, next-generation technology roadmap
Further strengthened sustainability & decarbonization activities. Joined United Nations Global Compact & Apple's 100% renewable energy initiative
Repaid INCJ JPY 20B loan to reduce debt & strengthen financial position
Increased capital via Ichigo Trust exercising additional stock acquisition rights

Copyright 2021 Japan Display Inc. All Rights Reserved. Slide 5
Robust demand, but severe impact from semiconductor shortage, input inflation, & global supply chain disruptions
Market Environment
Non-Mobile• Impacts from semiconductor shortage, but strong
demand for wearable OLED and VR LCD driven by lifestyle changes & personal health management ☁ ☀
☁ ☁Mobile(US/Euro)
• Declining LCD smartphone demand on expanding OLED use
Current Forecast
Mobile(China/Other)
• Semiconductor shortage increasing LCD smartphone demand uncertainty
Automotive • Despite semiconductor shortage, JDI is growing sales, led by high value-add products ☁ ☀☁
☀☁ Prev. ☀☁☀☁

Copyright 2021 Japan Display Inc. All Rights Reserved. Slide 6
Managed semiconductor shortage, grew customer business, & passed on increased costs to selling prices to significantly decrease Q2 operating loss
Significant Decrease in Q2 Operating Loss
Q2 Operating Loss: JPY +6.8B Improvement vs. Initial Forecast
Upward Revision (Oct 26)
FY22/3 Q2 Actual (Today)
Initial Forecast (Aug 5)
JPY -8.0B
JPY -2.0B
JPY-1.2B

Copyright 2021 Japan Display Inc. All Rights Reserved. Slide 7
Significant EBITDA improvement QoQ driving EBITDA profitability
Q2 EBITDA Profitable
Q2 EBITDA: JPY +4.7B Improvement vs. Q1
JPY-3.7B
FY22/3 Q1 Results (Aug 5)
JPY1.0B
FY22/3 Q2 Results (Today)

Copyright 2021 Japan Display Inc. All Rights Reserved. Slide 8
Second consecutive upward revision
Upward Revision of Full-Year Sales Forecast
Full-Year Sales Forecast: +16.9% vs. Initial Forecast
JPY254B
JPY280B
Initial Forecast (May 14)
Previous Forecast(Aug 5)
JPY297B
Current Forecast(Today)
+10.2%
+6.1%

Copyright 2021 Japan Display Inc. All Rights Reserved. Slide 9
Working towards the realization of a sustainable society by actively engaging SDGs & other important social issues
Sustainability & Decarbonization Initiatives
United Nations Global Compact Renewable Energy
Joined United Nations Global Compact (UNGC) on August 2, 2021
Also joined Global Compact Network Japan (GCNJ), which consists of Japanese companies and organizations that have signed the UNGC
UNGC (English): https://www.unglobalcompact.org/GCNJ (Japanese): http://ungcjn.org/ Supplier Clean Energy Commitments
https://www.apple.com/environment/Apple_Supplier_Clean_Energy_Commitments_October-2021.pdf
Joined Apple's 100% renewable energy initiative
Copyright 2021 Japan Display Inc. All Rights Reserved. Slide 10
34.4 57.9 69.0+16.6 +8.3 -1.4 +11.1
(‘21/6)Net Assets
9/22Exercise
(‘21/9)Net Assets
Unexercised Amount
ShareClasses
Shares(thousand)
Voting Rights(thousand)
Ichigo Trust ownership
Common 846,166 8,461Class B Preferred 672,000 6,720 YesClass D Preferred 0.5 0 YesClass E Preferred 4.4 0 Yes
Total 15,181
44.27%
N/A
Additional JPY 16.6B Exercised, Unexercised Amount JPY 11.1B
7/30 Exercise
Other
Ichigo Trust Equity Financing (Exercise of 12th Stock Acquisition Rights)
Rights exercised 12th Stock Acquisition Rights (issued Aug. 2020)
Total amount JPY 55.4BExercise date September 22, 2021Exercise price JPY 10mn/shareExercised amount JPY 8.3BClass of shares issued Class E Preferred SharesUnexercised amount JPY 11.1B
◆Ichigo Trust Shareholding◆Exercise Details
(JPY billion)Note: (Post-Exercise) Net Assets
in the left graph does not reflect future P&L and thus could be materially different from actual net assets.(Post-Exercise)
Net Assets
Ichigo voting rights (as of 9/30/21)

Copyright 2021 Japan Display Inc. All Rights Reserved. Slide 11
Towards Structural Profitability: Fixed Cost Reductions
Relentless cost reduction & pursuit of operating efficiencies
Fixed Costs
149.7
122.6 118.5
FY20/3 FY21/3 FY22/3FCST
FY22/3 Full-Year Fixed Costs:
-21% vs. FY20/3– Manufacturing: Maximized throughput by improving
productivity and yields
– Company-Wide: Reduced SG&A and indirect expenses & improve operating efficiency
*Fixed costs defined broadly and include factory power and maintenance costs, transport costs, etc.
(JPY billion)

Copyright 2021 Japan Display Inc. All Rights Reserved. Slide 12
504.0341.7 297.0
580.1
401.4330.3
FY20/3 FY21/3 FY22/3FCST
SalesBreak-Even Point
Towards Structural Profitability: Breakeven Point Reduction
Have sharply reduced Breakeven Point on increased product profitability & cost reductions
Reduced Breakeven Point by c. JPY 250B(JPY billion)

Copyright 2021 Japan Display Inc. All Rights Reserved. Slide 13
Towards Structural Profitability: Diversified, Strong Product Portfolio
Absorbing sharp decline in Mobile (US/Euro) & growing profitable product portfolio
312.9
162.6
76.4
FY20/3 FY21/3 FY22/3FCST
Mobile (US/Euro)
(JPY billion)
Sales (Mobile (US/Euro))
49.6 56.2 68.0
103.5 88.1112.8
37.9 34.9
39.7
FY20/3 FY21/3 FY22/3FCST
Non-Mobile Automotive Mobile (China/Other)
(JPY billion)
Sales (Excl. Mobile (US/Euro))

Copyright 2021 Japan Display Inc. All Rights Reserved. Slide 14
JDI Strategy
KPIStrategic Focus
1) Strengthen Existing Businesses Rethink, Reposition, & Rebuild JDI
Delegate Authority, Move Quickly Strengthen Sales & Marketing
Massively Increase Profitability Strengthen Competitiveness by Radically Cutting Costs &
Liquidating Unprofitable Businesses Win with the Customer: Superior Products & Superior
Technology
EBITDA Positive in FY22/3 Q4
Leveraging Our Key Device Technologies, Launch Multiple Service, Solution, Platform Businesses This Year
2) Build New Businesses Go Beyond Existing Business Models & Go Direct
to the Customer Drive New Business Growth Monetize Our R&D
Commercialize High Value-Add Technologies that Address Key Customer Needs

FY22/3 H1 Earnings ReviewFY22/3 Full-Year Forecast

Copyright 2021 Japan Display Inc. All Rights Reserved. Slide 16
FY21/3 Q2 and H1 Financial Results
Sharp drop in sales YoY, but improved profitability due to a better product mix and cost reductions. Excluding semiconductor shortage impact, JDI OP Profitable in Q2
Sales fell sharply YoY due to a continued demand slide for smartphone displays & the impact of a chip shortage. Sharp YoY decline to ease from Q3
Big improvement in profitability due lower breakeven point due to improved product mix & cost cuts, & decreased non-operating expenses and extraordinary losses
Vs. Aug 5 forecast, sales JPY +3.9B & operating loss JPY +6.8 improvement, mainly due to increased customer demand and limiting the impact of chip shortage
• EBITDA = Operating Profit + Depreciation + Goodwill amortization
Copyright 2021 Japan Display Inc. All Rights Reserved. Slide 17
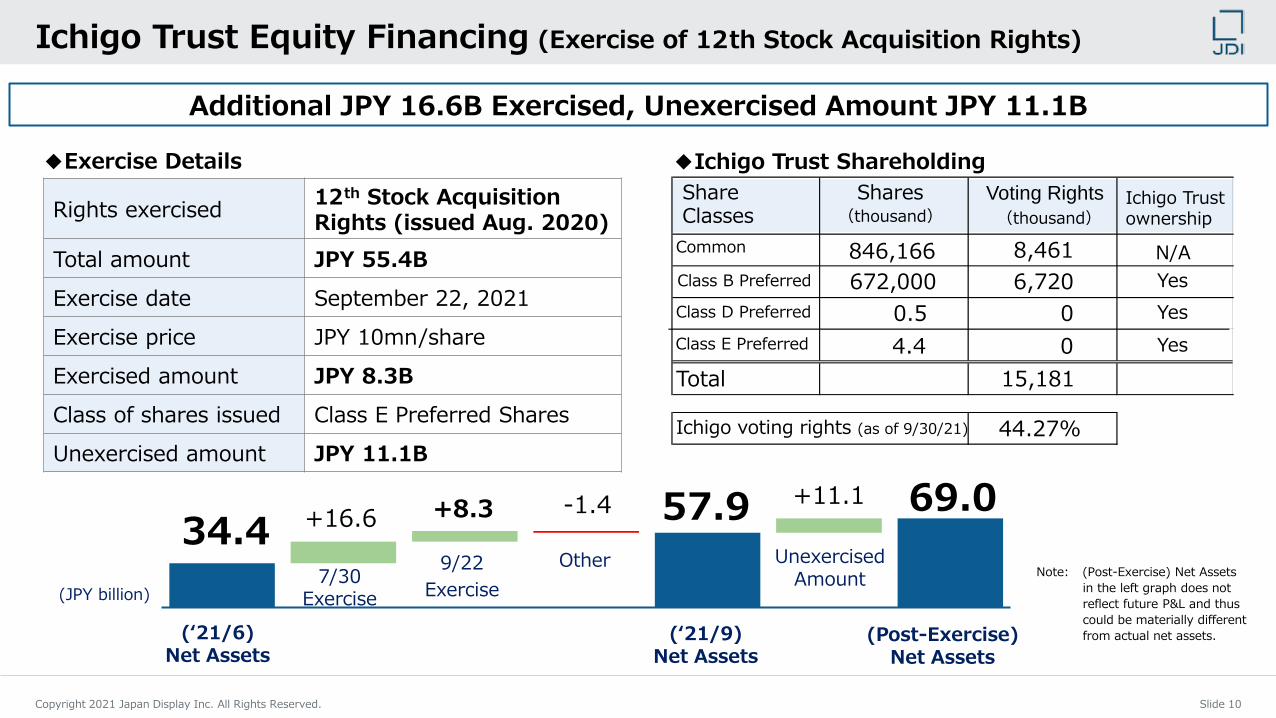
Quarterly Sales by Product Sales by Product
Sales by Product
Mobile (YoY -56%, QoQ + 6%)• Demand for LCDs fell due to expanding
customer use of OLED in smartphones, resulting in a big drop YoY, but the sharp decline will ease from Q3
• Vs. Aug 5 forecast: JPY +4B
Automotive (YoY -1%, QoQ + 14%)• Despite strong demand, chip shortage had
big impact, so sales were even YoY• Vs. Aug 5 forecast: JPY -1.1B
Non-Mobile (YoY + 3%, QoQ + 7%)• Increase led by wearable OLED and VR LCD• Vs. Aug 5 forecast: JPY +1B
15.5 16.0
24.1 23.9
9.1 10.0
63.1
22.0
111.8
71.9
FY20 Q2 FY21 Q2
Mobile (US/Euro)
Mobile (China/Other)
Automotive
Non-Mobile56%
31%
(JPY billion)
Copyright 2021 Japan Display Inc. All Rights Reserved. Slide 18
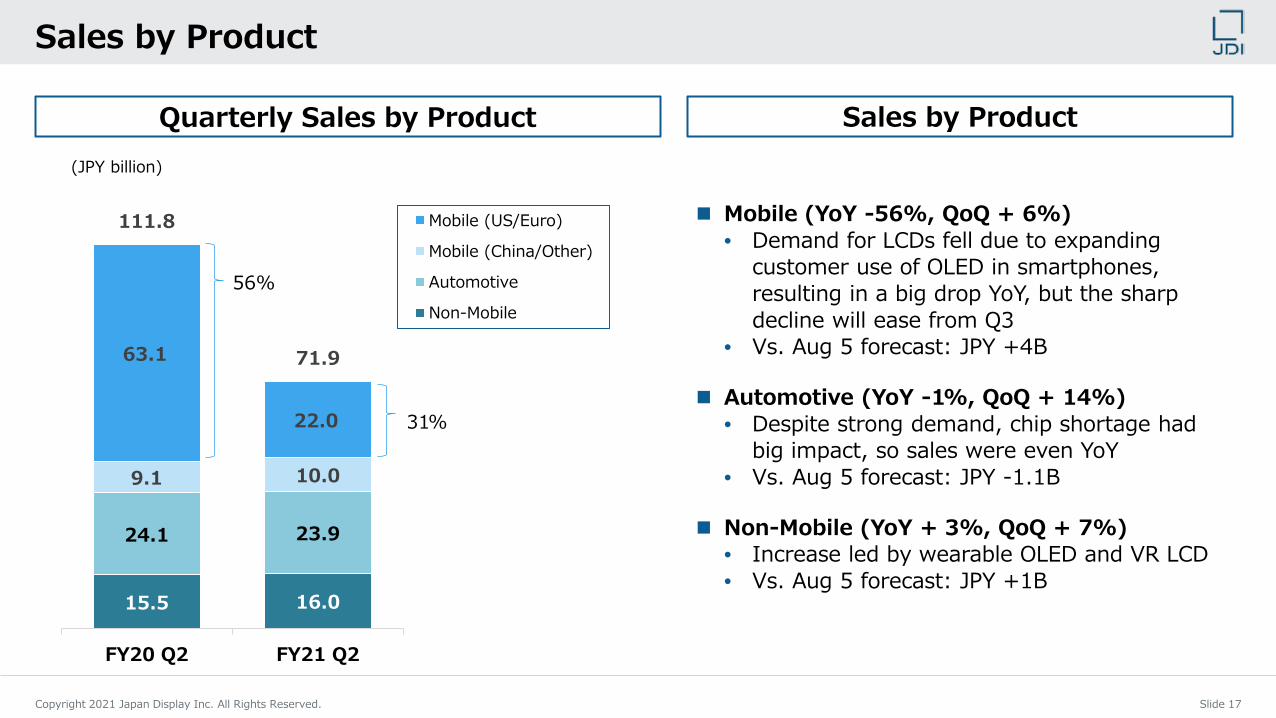
FY22/3 Q2 Operating Loss +/- Factors
Manufacturing Fixed Cost
SG&A Other
OperatingLoss
FY22/3 Q2
-1.2
Sales: 71.9
FY21/3 Q2
-2.9
Sales: 111.8
(JPY billion)
OperatingLoss
ShipmentVol. &
Product Mix
Manufacturing Fixed Cost SG&A Other
OperatingLoss
FY22/3 Q2
-1.2
Sales: 71.9
FY22/3 Q1
-5.9
Sales: 66.0
OperatingLoss
ShipmentVol. &
Product Mix
Operating Loss +/- Factors(YoY) Operating Loss +/- Factors (QoQ)
+1.3
-3.1
+0.2
+3.3 +4.8 +0.1 +0.1 -0.3
Inventory gains & lower inventory valuation loss, etc.

Copyright 2021 Japan Display Inc. All Rights Reserved. Slide 19
FY22/3 Full-Year Forecast
Full-year sales forecast revised upward JPY +17B due to shrinking impact of chip shortage in Automotive, increased demand in Mobile, and yen depreciation
Q3 is expected to worsen QoQ due to higher energy costs and increased inventory in Q2, but Q4 is expected to improve due to higher sales and cost reductions. Maintaining Q4 EBITDA profitability target
<ref.>(JPY billion) FY20/3 FY21/3 FY22/3 FY22/3 FY22/3
Q1 Q2 Q3 Q4 Excl. chip shortage impact
Act Act Prec. FCST ACT ACT New FCST New FCST New FCST Estimate (impact)
Sales 504.0 341.7 280.0 66.0 71.9 73.0 86.0 297.0 319.9 (23.0)
Mobile (US/Euro) - 162.6 69.0 21.4 22.0 13.0 20.0 76.4 - -Mobile (China/other) - 34.9 35.0 8.7 10.0 12.0 9.0 39.7 - -Automotive - 88.1 106.0 20.9 23.9 31.0 37.0 112.8 - -Non-Mobile - 56.2 70.0 15.0 16.0 17.0 20.0 68.0 - -
EBITDA (19.5) (12.5) - (3.7) 1.0 (2.0) 0.3 (4.4) 3.9 (8.3)
Operating Profit (Loss) (38.5) (26.2) - (5.9) (1.2) (4.0) (2.1) (13.1) (4.8) (8.3)
Recurring Profit (Loss) (57.9) (32.7) - (6.4) (1.2) (4.4) (2.6) (14.5) (6.2) (8.3)
Net Income (Loss) (101.4) (42.7) - (7.0) (1.8) (5.7) (4.0) (18.4) (10.1) (8.3)

Appendix

Copyright 2021 Japan Display Inc. All Rights Reserved. Slide 21
Quarterly Sales by Product
Sales Breakdown by Product
11.5 15.5 15.0 14.1 15.0 16.014.8
24.1 24.0 25.3 20.9 23.96.3
9.1 8.5 11.0 8.7 10.0
55.4
63.1
25.3 18.7 21.422.0
88.0
111.8
72.7 69.2 66.071.9
FY21/3 Q1 FY21/3 Q2 FY21/3 Q3 FY21/3 Q4 FY22/3 Q1 FY22/3 Q2
Mobile (US/Euro)
Mobile (China/Other)
Automotive
Non-Mobile
(JPY billion)

Copyright 2021 Japan Display Inc. All Rights Reserved. Slide 22
Consolidated B/S
*
FY21/3Q2
FY21/3Q4
FY22/3Q2 YoY QoQ
Cash and deposits 49.8 55.7 49.3 -0.4 -6.4 Accounts receivable - trade 42.3 31.2 29.9 -12.4 -1.3 Accounts receivable - other 32.8 15.3 19.7 -13.1 +4.4 Inventories 41.5 39.7 49.5 +8.0 +9.8 Other 5.8 4.3 4.6 -1.1 +0.3Total current assets 172.1 146.3 153.1 -19.0 +6.8
Total non-current assets 143.3 78.7 77 -66.3 -1.7Total Assets 315.4 225 230 -85.4 +5.0
Accounts payable - trade 66.5 37.4 43.2 -23.3 +5.8Interest-bearing debt 97.4 97.1 76.9 -20.5 -20.3Advances received 81.5 1.9 6.6 -74.9 +4.8Other liabilities 46.8 46.7 45.4 -1.4 -1.3
Total Liabilities 292.3 183.2 172.2 -120.2 -11.0Total Net Assets 23.1 41.8 57.9 +34.8 +16.1
Shareholders Equity Ratio 6.6% 17.6% 24.1% +17.5pts +6.5pts
(JPY billion)
Note. Difference in balances of “cash & equivalents” in cash flow statement and “cash and deposits” in balance sheet as of FY21/3 Q2 and FY22/3 Q2 are “Deposits.”
Copyright 2021 Japan Display Inc. All Rights Reserved. Slide 23
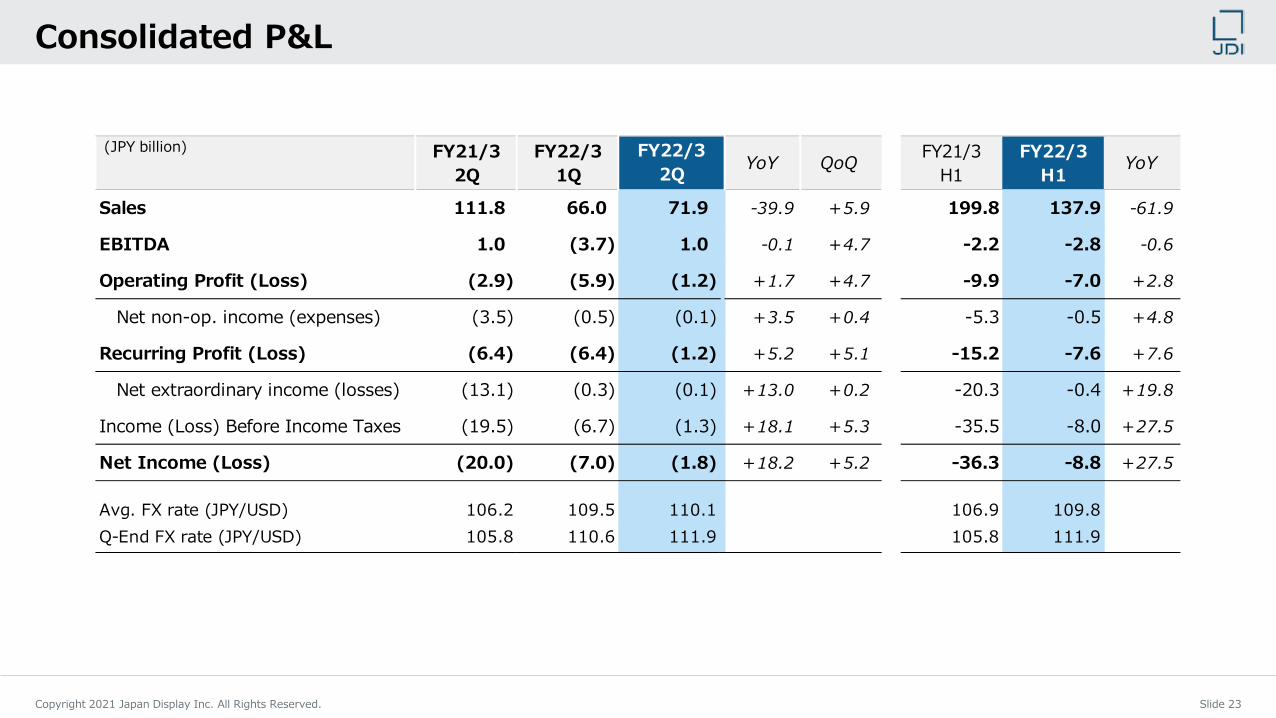
Consolidated P&L
(JPY billion) FY21/32Q
FY22/31Q YoY FY21/3
H1FY22/3
H1 YoY
Sales 111.8 66.0 71.9 -39.9 +5.9 199.8 137.9 -61.9
EBITDA 1.0 (3.7) 1.0 -0.1 +4.7 -2.2 -2.8 -0.6
Operating Profit (Loss) (2.9) (5.9) (1.2) +1.7 +4.7 -9.9 -7.0 +2.8
Net non-op. income (expenses) (3.5) (0.5) (0.1) +3.5 +0.4 -5.3 -0.5 +4.8
Recurring Profit (Loss) (6.4) (6.4) (1.2) +5.2 +5.1 -15.2 -7.6 +7.6
Net extraordinary income (losses) (13.1) (0.3) (0.1) +13.0 +0.2 -20.3 -0.4 +19.8
Income (Loss) Before Income Taxes (19.5) (6.7) (1.3) +18.1 +5.3 -35.5 -8.0 +27.5
Net Income (Loss) (20.0) (7.0) (1.8) +18.2 +5.2 -36.3 -8.8 +27.5
Avg. FX rate (JPY/USD) 106.2 109.5 110.1 106.9 109.8Q-End FX rate (JPY/USD) 105.8 110.6 111.9 105.8 111.9
FY22/32Q QoQ

Copyright 2021 Japan Display Inc. All Rights Reserved. Slide 24
Consolidated Cash Flow Statement
Free Cash Flow = Cash Flow from Operating Activities less Capex (Fixed asset investments)
FY21/3Q2
FY22/3Q1 YoY QoQ FY21/3
H1 YoY
Income before income taxes (19.5) (6.7) (1.3) +18.1 +5.3 (35.5) (8.0) +27.5
Dep. & Amort. 4.4 2.2 2.1 -2.3 +0.0 8.8 4.3 -4.5
Working capital 10.2 (4.4) (3.2) -13.4 +1.2 17.7 (7.6) -25.3
Advances received (1.0) 3.0 1.6 +2.7 -1.4 (7.5) 4.6 +12.2
Structural reform cost 2.5 0.0 0.0 -2.5 +0.0 10.2 0.0 -10.2
Other 4.9 (2.8) 2.7 -2.2 +5.5 (7.3) (0.1) +7.2
Cash Flow from Operating Activities 1.5 (8.7) 1.9 +0.4 +10.6 (13.6) (6.8) +6.8
Fixed asset investments (1.0) (2.3) (2.1) -1.1 +0.2 (3.2) (4.4) -1.2
Other (0.5) 0.1 0.0 +0.5 -0.1 (1.4) 0.1 +1.5
Cash Flow from Investing Activities (1.5) (2.2) (2.1) -0.6 +0.1 (4.6) (4.3) +0.3
Cash Flow from Financing Activities 4.5 (0.3) 4.7 +0.2 +5.0 1.3 4.4 +3.1
Ending Balance, Cash & Equiv. 49.4 44.4 49.0 -0.4 +4.6 49.4 49.0 -0.4
Free Cash Flow 0.5 (11.0) (0.2) -0.7 +10.8 (16.8) (11.2) +5.5
FY22/3Q2
FY22/3H1
(JPY billion)

Copyright 2021 Japan Display Inc. All Rights Reserved. Slide 25
PersonalTechFor A Better World

Copyright 2021 Japan Display Inc. All Rights Reserved. Slide 26
THANK YOU
Any information related to market trends or industries mentioned in this document is based on information available at present and JDI does not guarantee that this informationis accurate or complete.Any plan, estimation, calculation, quotation, evaluation, prediction, expectation or other forward-looking information in this document is based on the current assumptions andbeliefs of JDI in light of the information currently available to it, and involves known and unknown risks, uncertainties, and other factors. Such risks, uncertainties and otherfactors may cause JDI’s actual results, performance, achievements or financial position to be materially different from any future results, performance, achievements or financialposition expressed or implied by such forward-looking information. Such risks, uncertainties and other factors include, without limitation: economic conditions and individualconsumption trends in Japan and overseas, currency exchange rate movements, trends in the market for smartphones and other electronic equipment, the management policiesof our major business partners and fluctuations in the price of raw materials.