Embed Size (px)
Citation preview

Copyright © 2020 JETRO. All rights reserved.
Americas Division, Overseas Research Department
Japan External Trade Organization (JETRO)
February 2020
FY2019 JETRO Survey on Business Conditions for
Japanese Companies in Canada
(30th Annual Survey)
Copyright © 2020 JETRO. All rights reserved.
Survey on Business Conditions for Japanese Companies in Canada
Contents
2
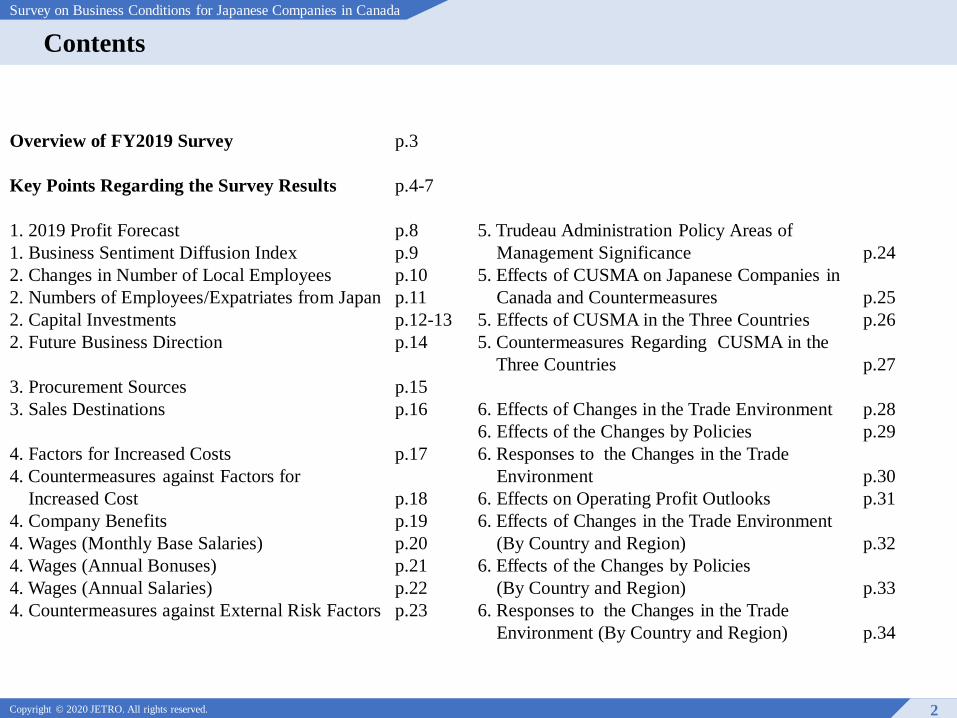
Overview of FY2019 Survey p.3
Key Points Regarding the Survey Results p.4-7
1. 2019 Profit Forecast p.8
1. Business Sentiment Diffusion Index p.9
2. Changes in Number of Local Employees p.10
2. Numbers of Employees/Expatriates from Japan p.11
2. Capital Investments p.12-13
2. Future Business Direction p.14
3. Procurement Sources p.15
3. Sales Destinations p.16
4. Factors for Increased Costs p.17
4. Countermeasures against Factors for
Increased Cost p.18
4. Company Benefits p.19
4. Wages (Monthly Base Salaries) p.20
4. Wages (Annual Bonuses) p.21
4. Wages (Annual Salaries) p.22
4. Countermeasures against External Risk Factors p.23
5. Trudeau Administration Policy Areas of
Management Significance p.24
5. Effects of CUSMA on Japanese Companies in
Canada and Countermeasures p.25
5. Effects of CUSMA in the Three Countries p.26
5. Countermeasures Regarding CUSMA in the
Three Countries p.27
6. Effects of Changes in the Trade Environment p.28
6. Effects of the Changes by Policies p.29
6. Responses to the Changes in the Trade
Environment p.30
6. Effects on Operating Profit Outlooks p.31
6. Effects of Changes in the Trade Environment
(By Country and Region) p.32
6. Effects of the Changes by Policies
(By Country and Region) p.33
6. Responses to the Changes in the Trade
Environment (By Country and Region) p.34

Copyright © 2020 JETRO. All rights reserved.
Survey on Business Conditions for Japanese Companies in Canada
Overview of FY2019 Survey
3
Survey Period
October 29 – November 29, 2019
Valid Responses
82.0%
(146 of 178 companies)
Scope of Survey
Japanese manufacturers and non-
manufacturers operating in Canada
that are at least 10% owned by a
Japanese parent company, directly or
indirectly.
Note
This is the 30th annual survey
initiated since 1981 (not conducted
in 2004).
Survey Objectives
The purpose of this survey was to ascertain
the management situations and changes in
the local business environments of Japanese
companies operating in Canada, and to
contribute to the formulation of Japanese
companies’ overseas business strategies and
of policy planning for related organizations.
(1) The totals in the surveys in this report may not be 100 because the numbers are rounded off to the first decimal point.
(2) The firms participating in this survey may not have answered all questions. The rates are calculated based on the numbers of answers collected.
(3) From the following page onward, in cases where no particular details are written in the charts, the numerals in parentheses indicate the number of respondents.
(4) In cases where the denominator of the number of respondents for a given field did not meet a certain number, that industry/field was excluded from the chart.
Respondents by Industry and Region
TotalComposition
Ratio
All Industries 146 100
By Industry
ManufacturingTotal
Comp.
Ratio Non-ManufacturingTotal
Comp.
Ratio
69 47.3 77 52.7
Transportation equipment parts
(motor vehicles, motorcycles) 14 9.6 Sales company 25 17.1
Food, processed food, agricultural or fishery products 7 4.8 Wholesale and retail trade 12 8.2
General-purpose and production machinery
(including molds and machine tools)6 4.1 Accommodations, travel, restaurant 9 6.2
Plastic products 5 3.4 Mining 9 6.2
Electrical machinery, electronic devices
(including parts)5 3.4
Information and communications
(including software)4 2.7
Transportation equipment (motor vehicles, motorcycles) 5 3.4 Transport activities, warehouse 3 2.1
Fabricated metal products (including plated products) 4 2.7 Professional and technical services 2 1.4
Non-ferrous metals 4 2.7 Finance and insurance 1 0.7
Business-oriented machinery 3 2.1 Construction, plant 1 0.7
Rubber products 2 1.4 Real estate 1 0.7
Textile apparel, textile products 2 1.4 Miscellaneous non-manufacturing industries 10 6.8
Lumber, wood products 2 1.4 By Region
Chemical and allied products/petroleum products 1 0.7 Ontario 92 63.0
Iron and steel (including cast and wrought products) 1 0.7 British Columbia 32 21.9
Transportation equipment parts (railroad vehicles, ships,
aircraft, industrial trucks)1 0.7 Quebec 11 7.5
Ceramic, stone, clay products 1 0.7 Alberta 9 6.2
Miscellaneous manufacturing industries 6 4.1 Manitoba 1 0.7
Saskatchewan 1 0.7
(Unit: companies, %)

Copyright © 2020 JETRO. All rights reserved.
Survey on Business Conditions for Japanese Companies in Canada
Key Points Regarding the Survey Results: 1. Percentage of Profitable Japanese Companies Active in Canada and Their Business Sentiment DI
4
For 2019, 77.1% of the respondents expect to generate a positive operating profit (p.8). With the robust Canadian economy, the percentage of companies
that responded with expectations for a positive operating profit (profitability ratio) increased 2.3 percentage points from the previous year (74.8%). The
profitability ratio remained above 70% for an eighth straight year since the fiscal 2012 survey, and marked the highest since 2000 (81.6%). By industry,
food/agricultural products, plastic products (100%) and sales companies (88.0%) recorded high profitability ratios.
Meanwhile, the DI indicating business sentiment for 2019 (obtained by subtracting the percentage of companies expecting a “decrease” in operating profits
vs. last year from the percentage of those expecting an “increase”) came to -2.1, falling significantly from last year’s figure of 16.8 (p.9).
The industries of electrical machinery, electronic devices and plastic products recorded DI of -80.0, sliding deep into negative territory.
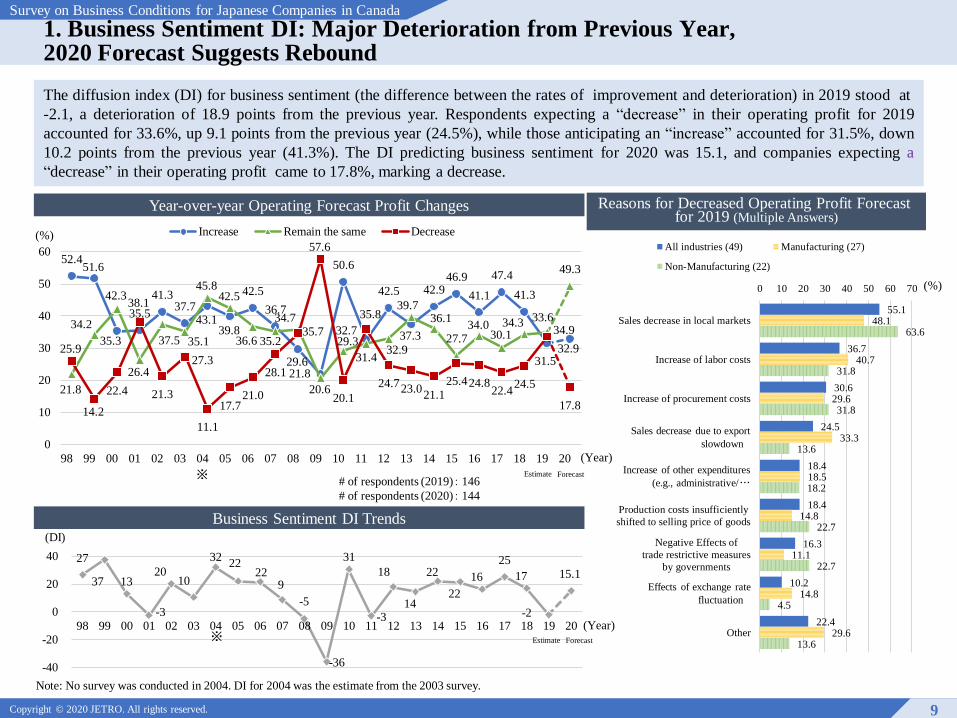
Among factors for forecasting a drop in the 2019 operating profit, top answers included “sales decrease in local market” (55.1%), as well as cost increases,
such as “increase of labor costs”(36.7%) and “increase of procurement costs”(30.6%).
The percentage of profitable Japanese companies active in Canada came to 77.1%, the highest since 2000 and remaining above 70% for an eighth
straight year since the FY2012 survey. Meanwhile, the DI indicating business sentiment was at -2.1 points, falling into the negative range for the
first time in eight years since the FY2011 survey.
Trends in Percentage of Profitable Japanese Companies Active in Canada and Their Business Sentiment DI (1998 - 2020)
# of respondents (2019): 146
# of respondents (2020): 144
Estimate
(Year)
Forecast
72.3 71.3
78.2
81.6
72.5
67.564.9
74.1 73.175.8
67.0
51.5
65.264.2
75.9 75.4 74.476.0
72.3
75.3 74.877.1
27.8 26.5
37.4
12.9
△ 2.6
20.0
10.4
32.0
22.1 21.5
8.6
△ 5.1
△ 35.8
30.5
△ 3.1
17.814.3
21.8 21.516.3
25.016.8
△ 2.1
-60
-40
-20
0
20
40
60
80
100
40
50
60
70
80
90
97 98 99 00 01 02 03 04※
05 06 07 08 09 10 11 12 13 14 15 16 17 18 19 20
Profit Difussion Index (Right axis)
Note: No survey was conducted in 2004. DI for 2004 was the estimate from the 2003 survey.
15.1
(%) (DI)
Copyright © 2020 JETRO. All rights reserved.
Survey on Business Conditions for Japanese Companies in Canada
Key Points Regarding the Survey Results: 2. Wages and Benefits
5
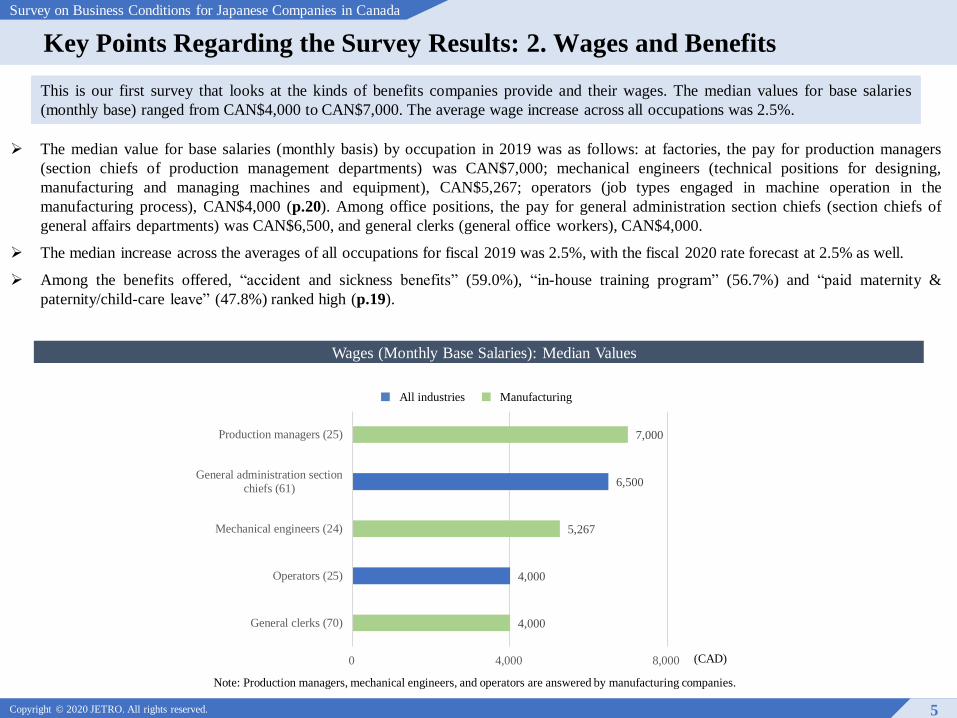
The median value for base salaries (monthly basis) by occupation in 2019 was as follows: at factories, the pay for production managers
(section chiefs of production management departments) was CAN$7,000; mechanical engineers (technical positions for designing,
manufacturing and managing machines and equipment), CAN$5,267; operators (job types engaged in machine operation in the
manufacturing process), CAN$4,000 (p.20). Among office positions, the pay for general administration section chiefs (section chiefs of
general affairs departments) was CAN$6,500, and general clerks (general office workers), CAN$4,000.
The median increase across the averages of all occupations for fiscal 2019 was 2.5%, with the fiscal 2020 rate forecast at 2.5% as well.
Among the benefits offered, “accident and sickness benefits” (59.0%), “in-house training program” (56.7%) and “paid maternity &
paternity/child-care leave” (47.8%) ranked high (p.19).
This is our first survey that looks at the kinds of benefits companies provide and their wages. The median values for base salaries
(monthly base) ranged from CAN$4,000 to CAN$7,000. The average wage increase across all occupations was 2.5%.
Wages (Monthly Base Salaries): Median Values
Note: Production managers, mechanical engineers, and operators are answered by manufacturing companies.
7,000
6,500
5,267
4,000
4,000
0 4,000 8,000
Production managers (25)
General administration sectionchiefs (61)
Mechanical engineers (24)
Operators (25)
General clerks (70)
■ All industries ■ Manufacturing
(CAD)

Copyright © 2020 JETRO. All rights reserved.
Survey on Business Conditions for Japanese Companies in Canada
Key Points Regarding the Survey Results: 3. Effects of Changes in the Trade Environment
6
In terms of the impact felt at present from the changes in the
trade environment, 38.1% reported experiencing “no
impact,” followed by 29.1% that were “not sure,” while
22.4% reported experiencing “negative effects” (p.28). The
main area where negative effects are being felt were said to
be “import/procurement cost” (53.3%), “sales in Canadian
market” (33.3%) and “production cost” (20.0%).
Asked which specific policies were having an impact on their
business, 57.7% of respondents cited “additional tariffs of the
U.S. imposed on steel and aluminum (Section 232 of
the Trade Expansion Act in 1962,” followed by 34.6% that
answered “Canada’s retaliatory tariffs against additional U.S.
tariffs,” indicating that the effects of additional tariffs
between the U.S. and Canada were greater than the
retaliatory tariffs between the U.S. and China (p.29).
(Note) The U.S. imposed additional tariffs on Canadian iron, steel and
aluminum under Section 232 of the Trade Expansion Act between June 1, 2018
to May 19, 2019; Canada imposed retaliatory tariffs against the U.S. between
July 1, 2018 to May 19, 2019.
Some 20% of companies reported “negative effects," with more than half answering that the main area where negative effects are being felt
was “import/procurement cost.” The specific policies having an impact were said to be “additional tariffs of the U.S. imposed on steel and
aluminum (Section 232 of the Trade Expansion Act in 1962” and “Canada’s retaliatory tariffs against additional U.S. tariffs.” The responses
showed that Japanese companies operating in Canada were affected more by the retaliatory additional tariffs between the U.S. and Canada
than those between the U.S. and China.
(%)
Note: Graph lists only those industries in which valid responses were received from 5 or more companies.
Current Impact Due to Changes in the Trade Environment
22.4
26.6
60.0
33.3
28.6
20.0
20.0
16.7
18.6
36.4
28.0
12.5
9.0
9.4
20.0
14.3
20.0
16.7
8.6
9.1
8.0
12.5
1.5
3.1
7.1
38.1
34.4
66.7
28.6
40.0
66.7
41.4
27.3
40.0
83.3
44.4
25.0
29.1
26.6
20.0
21.4
60.0
40.0
31.4
27.3
24.0
16.7
55.6
50.0
0 20 40 60 80 100
All industries (134)
Manufacturing (64)
Transportation equipment
(motor vehicles, motorcycles) (5)
Food, processed food,
agricultural or fishery products(6)
Transportation equipment parts
(motor vehicles, motorcycles) (14)
General-purpose and
production machinery (5)
Plastic products (5)
Miscellaneous manufacturing
industries (6)
Non-Manufacturing (70)
Wholesale and retail trade (11)
Sales company (25)
Accommodations, travel, restaurant (6)
Mining (9)
Miscellaneous non-manufacturing
industries (8)
Negative impact Positive impact
Both positive and negative impact No impact
Not sure
Copyright © 2020 JETRO. All rights reserved.
Survey on Business Conditions for Japanese Companies in Canada
In terms of procurement sources for raw materials and parts, procurement from within Canada (procurement rate 31.5%) and
within the NAFTA region (U.S. and Mexico: total 24.6%) decreased from the previous year (36.1% and 66.1%), while
procurement from Asia increased (p.15). In particular, procurement from Japan grew to 22.6%, up 4.6 points from the previous
year (18.0%). Procurement from China, ASEAN, and South Korea/Hong Kong/Taiwan came to 8.2%, 4.4%, and 4.3%,
respectively, all increasing year-on-year.
Key Points Regarding the Survey Results: 4. Other Notable Trends
7
In terms of management challenges (factors for increased costs), “labor costs (including salaries and bonuses)” emerged at the top
at 60.9%, up 6.0 points from the previous year (54.9%), followed by “recruiting workers (regular workers and engineers)” at
53.6% (p.17). The unemployment rate has remained low (in the 5% range since September 2018) in Canada, making recruiting
difficult for Japanese companies as well.
(1) Management challenges: Labor costs (including salaries and bonuses) of
employees the top factor for increased costs
(2) Procurement from Asia grew, particularly from Japan
Copyright © 2020 JETRO. All rights reserved.
Survey on Business Conditions for Japanese Companies in Canada
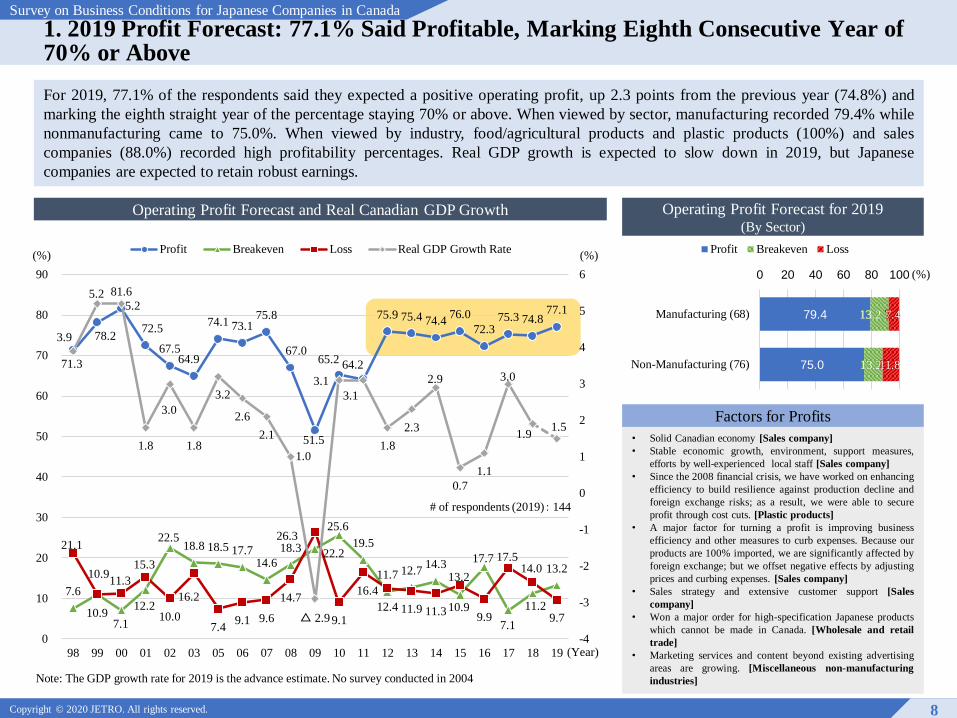
For 2019, 77.1% of the respondents said they expected a positive operating profit, up 2.3 points from the previous year (74.8%) and
marking the eighth straight year of the percentage staying 70% or above. When viewed by sector, manufacturing recorded 79.4% while
nonmanufacturing came to 75.0%. When viewed by industry, food/agricultural products and plastic products (100%) and sales
companies (88.0%) recorded high profitability percentages. Real GDP growth is expected to slow down in 2019, but Japanese
companies are expected to retain robust earnings.
1. 2019 Profit Forecast: 77.1% Said Profitable, Marking Eighth Consecutive Year of 70% or Above
8
• Solid Canadian economy [Sales company]
• Stable economic growth, environment, support measures,
efforts by well-experienced local staff [Sales company]
• Since the 2008 financial crisis, we have worked on enhancing
efficiency to build resilience against production decline and
foreign exchange risks; as a result, we were able to secure
profit through cost cuts. [Plastic products]
• A major factor for turning a profit is improving business
efficiency and other measures to curb expenses. Because our
products are 100% imported, we are significantly affected by
foreign exchange; but we offset negative effects by adjusting
prices and curbing expenses. [Sales company]
• Sales strategy and extensive customer support [Sales
company]
• Won a major order for high-specification Japanese products
which cannot be made in Canada. [Wholesale and retail
trade]
• Marketing services and content beyond existing advertising
areas are growing. [Miscellaneous non-manufacturing
industries]
Operating Profit Forecast and Real Canadian GDP Growth Operating Profit Forecast for 2019(By Sector)
Factors for Profits
71.3
78.2
81.6
72.5
67.564.9
74.1 73.175.8
67.0
51.5
65.2 64.2
75.9 75.4 74.476.0
72.375.3 74.8
77.1
7.6
10.9
7.1
12.2
22.518.8 18.5 17.7
14.6
18.3 22.2
25.6
19.5
11.7 12.714.3
10.9
17.7
7.1
11.2
13.2
21.1
10.9
11.3
15.3
10.0
16.2
7.49.1 9.6
14.7
26.3
9.1
16.4
12.4 11.9 11.3
13.2
9.9
17.514.0
9.7
3.9
5.25.2
1.8
3.0
1.8
3.2
2.6
2.1
1.0
△ 2.9
3.1
3.1
1.8
2.3
2.9
0.7
1.1
3.0
1.91.5
-4
-3
-2
-1
0
1
2
3
4
5
6
0
10
20
30
40
50
60
70
80
90
98 99 00 01 02 03 05 06 07 08 09 10 11 12 13 14 15 16 17 18 19
Profit Breakeven Loss Real GDP Growth Rate
79.4
75.0
13.2
13.2
7.4
11.8
0 20 40 60 80 100
Manufacturing (68)
Non-Manufacturing (76)
Profit Breakeven Loss(%) (%)
# of respondents (2019): 144
(%)
(Year)
Note: The GDP growth rate for 2019 is the advance estimate. No survey conducted in 2004
Copyright © 2020 JETRO. All rights reserved.
Survey on Business Conditions for Japanese Companies in Canada
The diffusion index (DI) for business sentiment (the difference between the rates of improvement and deterioration) in 2019 stood at
-2.1, a deterioration of 18.9 points from the previous year. Respondents expecting a “decrease” in their operating profit for 2019
accounted for 33.6%, up 9.1 points from the previous year (24.5%), while those anticipating an “increase” accounted for 31.5%, down
10.2 points from the previous year (41.3%). The DI predicting business sentiment for 2020 was 15.1, and companies expecting a
“decrease” in their operating profit came to 17.8%, marking a decrease.
1. Business Sentiment DI: Major Deterioration from Previous Year, 2020 Forecast Suggests Rebound
9
Year-over-year Operating Forecast Profit Changes Reasons for Decreased Operating Profit Forecast for 2019 (Multiple Answers)
Business Sentiment DI Trends
Note: No survey was conducted in 2004. DI for 2004 was the estimate from the 2003 survey.
52.4 51.6
35.3
35.5
41.3 37.7
43.1 39.8
42.5
36.7
29.6 21.8
50.6
32.7
42.5
37.3
42.9 46.9
41.1
47.4
41.3
31.5 32.9
21.8
34.2
42.3
26.4
37.5 35.1
45.8 42.5
36.6 35.2 35.7
20.6
29.3
31.4 32.9
39.7 36.1
27.7 34.0
30.1 34.3
34.9
49.3
25.9
14.2
22.4
38.1
21.3
27.3
11.1
17.7 21.0
28.1
34.7
57.6
20.1
35.8
24.7 23.0 21.1
25.4 24.8 22.4
24.5
33.6
17.8
0
10
20
30
40
50
60
98 99 00 01 02 03 04 05 06 07 08 09 10 11 12 13 14 15 16 17 18 19 20
Increase Remain the same Decrease
# of respondents (2019): 146
# of respondents (2020): 144
27
37 13
-3
20 10
32 22
22 9
-5
-36
31
-3
18
14
22
22
16
25
17
-2
15.1
-40
-20
0
20
40
98 99 00 01 02 03 04 05 06 07 08 09 10 11 12 13 14 15 16 17 18 19 20
(Year)
※
(%)
※ (Year)
(DI)
(%)
55.1
36.7
30.6
24.5
18.4
18.4
16.3
10.2
22.4
48.1
40.7
29.6
33.3
18.5
14.8
11.1
14.8
29.6
63.6
31.8
31.8
13.6
18.2
22.7
22.7
4.5
13.6
0 10 20 30 40 50 60 70
Sales decrease in local markets
Increase of labor costs
Increase of procurement costs
Sales decrease due to export
slowdown
Increase of other expenditures
(e.g., administrative/…
Production costs insufficiently
shifted to selling price of goods
Negative Effects of
trade restrictive measures
by governments
Effects of exchange rate
fluctuation
Other
All industries (49) Manufacturing (27)
Non-Manufacturing (22)
Estimate Forecast
Estimate Forecast

Copyright © 2020 JETRO. All rights reserved.
Survey on Business Conditions for Japanese Companies in Canada
60.8 79.2
59.7 52.9 59.9 68.5 65.2 58.6
67.6 62.7 56.6 56.6 66.0
50.7 51.5 61.5
30.1 4.0
30.1 37.0 27.4 13.9 24.8 29.9 26.1
26.2 34.9 34.9 28.4
42.8 40.9 31.5
0
20
40
60
80
100
03 05 06 07 08 09 10 11 12 13 14 15 16 17 18 19
No change Increase
46.9 58.1 53.0 53.9 49.0 53.5 49.4 44.7
61.8 61.6
57.1 51.5 51.5 56.3
48.4 54.0 56.8
30.2 24.5 27.6 28.9
28.9 29.0
10.8 24.8
19.7 28.1
26.2 31.1 31.1 28.2 36.6 33.8 28.8
0
20
40
60
80
100
02 03 05 06 07 08 09 10 11 12 13 14 15 16 17 18 19
No change Increase
Only 28.8% of the respondents had “increased” their number of local employees in the past one-year period, down 5.0 points from the
previous year (33.8%) and falling below 30% for the first time in three years (since the fiscal 2016 survey (28.2%)). When viewed by
sector, among non-manufacturers, more than 30% (32.5%) had “increased” local staff. Asked about their plans going forward, 31.5%
said they planned an “increase,” down 9.4 points from the previous year (40.9%) and the lowest in three years (since the fiscal 2016
survey (28.4%)).
2. Changes in Number of Local Employees: Only around 30% “Increased” the Number over the Past Year; Those with Plans to “Increase” also Declined to around 30%
10
Trends in Change in Number of Local Employees (Change over Past Year)
Changes in Number of Local Employees (Change over Past Year, By Industry)
Trends in Change in Number of Local Employees (Plans)
(%)
(%)
(%)
(%)
(Year)
(Year)
Note: Graph lists only those industries in which valid responses were
received from five or more companies.
Note: Graph lists only those industries in which valid responses were
received from five or more companies. Note: 2002 reflects changes over previous three years; no survey conducted in 2004
Note: 2002 reflects changes over previous three years; no survey conducted in 2004
28.8 24.6
50.0 40.0 40.0
28.6 14.3
16.7 32.5
44.0 22.2
16.7
50.0
56.8 62.3
33.3 60.0 60.0
71.4 57.1
100 83.3 51.9 36.0
44.4 75.0
100 30.0
14.4 13.0 16.7
28.6
15.6 20.0
33.3 8.3
20.0
0 20 40 60 80 100
All industries (146)
Manufacturing (69)
General-purpose and production machinery (6)
Electrical machinery, electronic devices (5)
Transportation equipment (motor vehicles, motorcycles) (5)
Food, processed food, agricultural or fishery products (7)
Transportation equipment parts (motor vehicles, motorcycles) (14)
Plastic products (5)
Miscellaneous manufacturing industries (6)
Non-Manufacturing (77)
Sales company (25)
Accommodations, travel, restaurant (9)
Wholesale and retail trade (12)
Mining (9)
Miscellaneous non-manufacturing industries (10)
Increase No change Decrease
Changes in Number of Local Employees (Plans, By Industry)
31.5 35.3
60.0 57.1
33.3 21.4 20.0 16.7
28.0 28.0
22.2 16.7
11.1 30.0
61.5 55.9
40.0 42.9
50.0 57.1
80.0 83.3 66.7
60.0 77.8
83.3 88.9
60.0
7.0 8.8
16.7 21.4
5.3 12.0
10.0
0 20 40 60 80 100
All industries (143)
Manufacturing (68)
Transportation equipment (motor vehicles, motorcycles) (5)
Food, processed food, agricultural or fishery products (7)
General-purpose and production machinery (6)
Transportation equipment parts (motor vehicles, motorcycles) (14)
Plastic products (5)
Miscellaneous manufacturing industries (6)
Non-Manufacturing (75)
Sales company (25)
Accommodations, travel, restaurant (9)
Wholesale and retail trade (12)
Mining (9)
Miscellaneous non-manufacturing industries (10)
Increase No change Decrease

Copyright © 2020 JETRO. All rights reserved.
Survey on Business Conditions for Japanese Companies in Canada
1118 15
11 11
2
18
21
15
15
5
1
(29)
(39)
(30)
(26)
(16)
(1) (2)
0
10
20
30
40
50
0 1 2 3-5 6-10 11-20 21 or over
Manufacturing Non-Manufacturing
(# of employees)
9
18 12 13 10
6 1
24
19
11 12
9
2
(33)
(37)
(23) (25)
(19)
(8)
(1)
0
10
20
30
40
50
10 or less 11-50
51-100
101-300
301-1000
1001-3000
3001 or over
Manufacturing Non-Manufacturing
The 146 respondents had approximately 40,000 employees in total, with the per-company average coming to 269 and the median value,
58. Among manufacturers, 26.1% (18 companies) said they had “11-50 persons,” with the median value being 72. Among non-
manufacturers, 31.2% (24 companies) had “10 persons or fewer,” with the median value coming to 41. The 143 respondents had 363
expatriates from Japan in total, with the average coming to three and the median value, two. When viewed by sector, among
manufacturers, 26.5% (18 companies) had “one person,” with the median value being two. The most common answer among non-
manufacturers was also “one person” at 28.0% (21 companies), with the median value of one.
2. Numbers of Employees and Expatriates from Japan: Median Values per Company Were 58 and Two, Respectively.
11
Breakdown of Numbers of Employees by Sector Breakdown of Numbers of Expatriates by Sector
Numbers of Employees: Average and Median Values Numbers of Expatriates from Japan: Average and Median Values
(# of respondents)
(Unit: Expatriates)
(# of respondents)
(Unit: Employees)
SectorTotal Number of
EmployeesAverage Median
All industries (146) 39,310 269 58
Manufacturing (69) 27,190 394 72
Non-Manufacturing (77) 12,120 157 41
SectorTotal number of
ExpatriatesAverage Median
All industries (143) 363 3 2
Manufacturing (68) 208 3 2
Non-Manufacturing (75) 155 2 1
# of respondents: 143# of respondents: 146
Note: The number in ( ) indicates the total number of respondents in all industry types (manufacturers + non-manufacturers).
(# of employees)
Copyright © 2020 JETRO. All rights reserved.
Survey on Business Conditions for Japanese Companies in Canada
51.7
32.2
25.4
24.6
15.3
11.0
8.5
9.3
58.7
17.5
33.3
23.8
17.5
11.1
15.9
7.9
43.6
49.1
16.4
25.5
12.7
10.9
10.9
0 10 20 30 40 50 60
Maintenance and/or repair of
existing equipment
Application of ICT such as AI and IoT
Labor-saving or streamlining measures
Strengthening productivity and/or sales
Launch of new business, production of new
products or improvement of existing products
Research and development
Environmental measures
Other
All industries (118) Manufacturing (63) Non-Manufacturing (55)
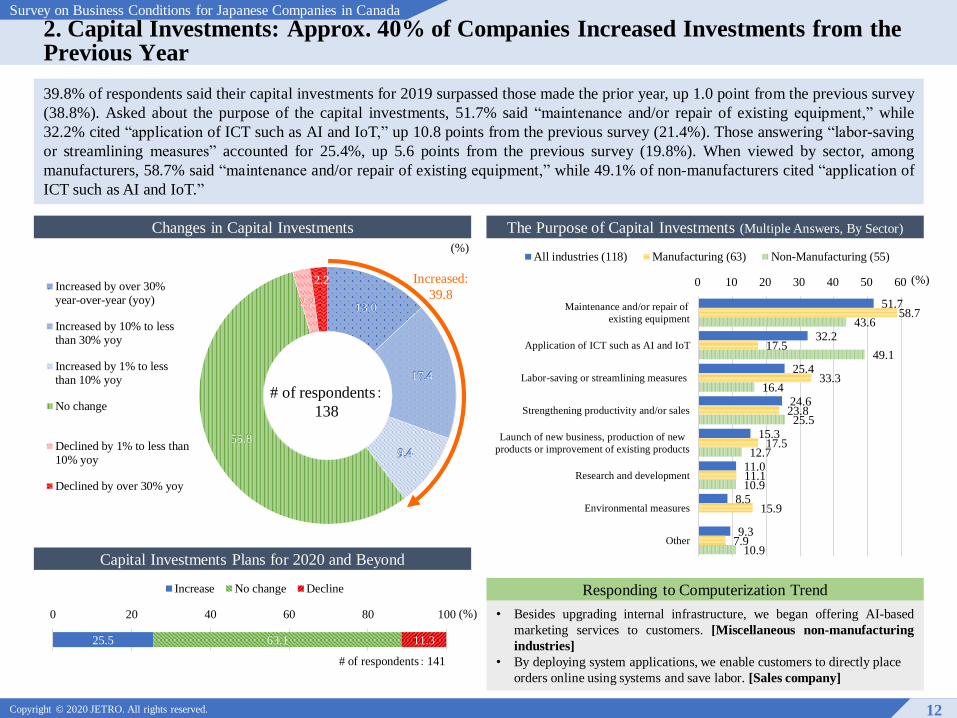
2. Capital Investments: Approx. 40% of Companies Increased Investments from the Previous Year
12
39.8% of respondents said their capital investments for 2019 surpassed those made the prior year, up 1.0 point from the previous survey
(38.8%). Asked about the purpose of the capital investments, 51.7% said “maintenance and/or repair of existing equipment,” while
32.2% cited “application of ICT such as AI and IoT,” up 10.8 points from the previous survey (21.4%). Those answering “labor-saving
or streamlining measures” accounted for 25.4%, up 5.6 points from the previous survey (19.8%). When viewed by sector, among
manufacturers, 58.7% said “maintenance and/or repair of existing equipment,” while 49.1% of non-manufacturers cited “application of
ICT such as AI and IoT.”
• Besides upgrading internal infrastructure, we began offering AI-based
marketing services to customers. [Miscellaneous non-manufacturing
industries]
• By deploying system applications, we enable customers to directly place
orders online using systems and save labor. [Sales company]
The Purpose of Capital Investments (Multiple Answers, By Sector)Changes in Capital Investments
Capital Investments Plans for 2020 and Beyond
Responding to Computerization Trend
13.0
17.4
9.4
55.8
2.2
2.2 Increased by over 30%year-over-year (yoy)
Increased by 10% to lessthan 30% yoy
Increased by 1% to lessthan 10% yoy
No change
Declined by 1% to less than
10% yoy
Declined by over 30% yoy
25.5 63.1 11.3
0 20 40 60 80 100
Increase No change Decline
# of respondents: 141
(%)
(%)
(%)
# of respondents:138
Increased:
39.8
Copyright © 2020 JETRO. All rights reserved.
Survey on Business Conditions for Japanese Companies in Canada
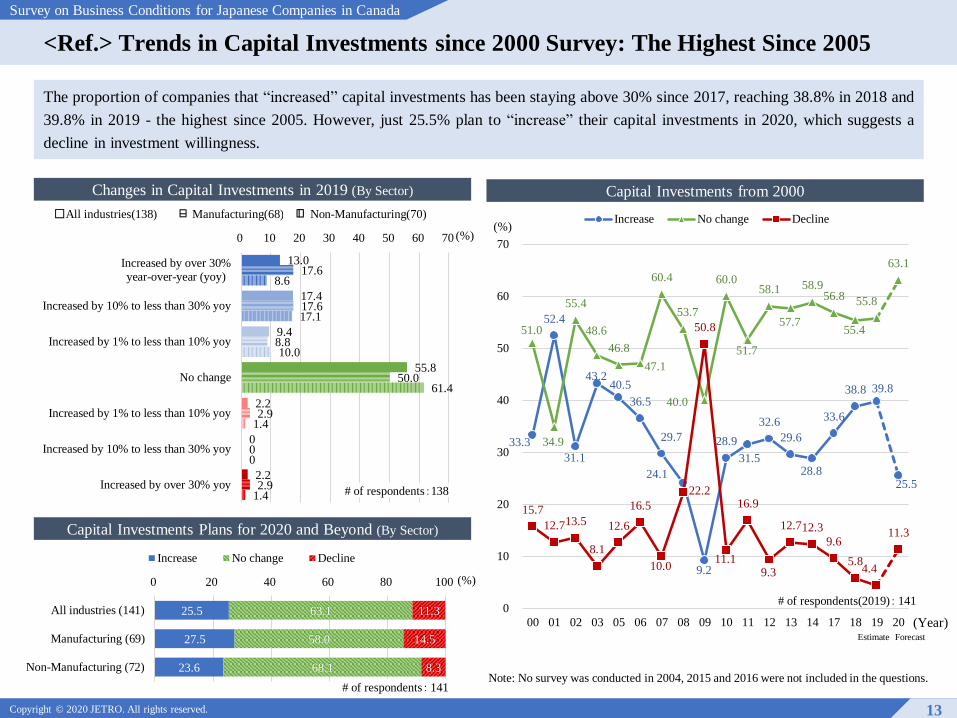
<Ref.> Trends in Capital Investments since 2000 Survey: The Highest Since 2005
13
The proportion of companies that “increased” capital investments has been staying above 30% since 2017, reaching 38.8% in 2018 and
39.8% in 2019 - the highest since 2005. However, just 25.5% plan to “increase” their capital investments in 2020, which suggests a
decline in investment willingness.
Note: No survey was conducted in 2004, 2015 and 2016 were not included in the questions.
Capital Investments from 2000Changes in Capital Investments in 2019 (By Sector)
Capital Investments Plans for 2020 and Beyond (By Sector)
1.4
0
1.4
61.4
10.0
17.1
8.6
2.9
0
2.9
50.0
8.8
17.6
17.6
2.2
0
2.2
55.8
9.4
17.4
13.0
0 10 20 30 40 50 60 70
Increased by over 30% yoy
Increased by 10% to less than 30% yoy
Increased by 1% to less than 10% yoy
No change
Increased by 1% to less than 10% yoy
Increased by 10% to less than 30% yoy
Increased by over 30%year-over-year (yoy)
25.5
27.5
23.6
63.1
58.0
68.1
11.3
14.5
8.3
0 20 40 60 80 100
All industries (141)
Manufacturing (69)
Non-Manufacturing (72)
Increase No change Decline
33.3
52.4
31.1
43.2 40.5
36.5
29.7
24.1
9.2
28.9
31.5
32.6
29.6
28.8
33.6
38.8 39.8
51.0
34.9
55.4
48.6
46.8
47.1
60.4
53.7
40.0
60.0
51.7
58.1
57.7
58.9 56.8
55.4
55.8
15.7
12.7 13.5
8.1
12.6
16.5
10.0
22.2
50.8
11.1
16.9
9.3
12.7 12.3
9.6
5.8 4.4
25.5
63.1
11.3
0
10
20
30
40
50
60
70
00 01 02 03 05 06 07 08 09 10 11 12 13 14 17 18 19 20
Increase No change Decline
# of respondents:138
# of respondents: 141
(%)
(%)
(%)
# of respondents(2019): 141
(Year)
□All industries(138) Manufacturing(68) Non-Manufacturing(70)
Estimate Forecast

Copyright © 2020 JETRO. All rights reserved.
Survey on Business Conditions for Japanese Companies in Canada
35.6% of respondents said they had their sights on business expansion in the next year or two, down 10.6 points from the previous
survey (46.2%). When viewed by sector, the figure was 36.2% for manufacturers, down 13.1 points from the previous survey (49.3%),
and 35.1% for non-manufacturers, down 8.0 points from the previous survey (43.1%). Top reasons for expansion were “sales increase
in local markets” (69.2%) and “high growth potential” (38.5%); specific functions they plan to expand that ranked high were the “sales
function” (61.5%) and “production (high-value added products)” (26.9%).
Reasons for Expansion (Multiple Answers)
2. Future Business Direction: Fewer Companies (36%) Planning “Expansion”
14
Business Direction
in the Next 1-2 Years (By Sector)
Specific Functions to Expand(Multiple Answers, By Sector)
Changes in Business Direction
in the Next 1-2 Years
35.6
36.2
35.1
61.6
62.3
61.0
2.7
1.4
3.9
0 20 40 60 80 100
All industries (146)
Manufacturing (69)
Non-Manufacturing (77)
Expansion Remaining the same Reduction
37.4 38.9 46.3 41.5 40.850.3 46.2
35.6
59.2 55.649.3 53.1 54.9
47.1 49.0 61.6
2.7 4.8 3.7 3.1 3.5 1.9 4.9 2.7
0
20
40
60
80
100
12 13 14 15 16 17 18 19
Expansion Remaining the same Reduction
69.2
38.5
30.8
23.1
17.3
17.3
9.6
3.8
5.8
72.0
36.0
16.0
24.0
24.0
16.0
20.0
0
0
66.7
40.7
44.4
22.2
11.1
18.5
0
7.4
11.1
0 20 40 60 80
Sales increase in local markets
High growth potential
High receptivity for high-
value added products/services
Reviewing production and
distribution networks
Sales increase due to export
expansion
Relationship with clients
Reduction of costs (e.g.,
procurement/labor costs)
Ease in securing labor force
Other
All industries (52) Manufacturing (25)
Non-Manufacturing (27)
61.5
26.9
19.2
11.5
9.6
3.8
3.8
5.8
52.0
36.0
40.0
12.0
0
8.0
0
0
70.4
18.5
0
11.1
18.5
0
7.4
11.1
0 20 40 60 80
Sales function
Production
(high-value added products)
Production
(general-purpose products)
R&D
Administrative functions in
providing services (e.g., shared
service center, call center)
Logistics function
Function of regional
headquarters
Other
All industries (52) Manufacturing (25)
Non-Manufacturing (27)(%)
(%)
(%) (%)
(Year)

Copyright © 2020 JETRO. All rights reserved.
Survey on Business Conditions for Japanese Companies in Canada
The rate of procurement from within Canada was 31.5%, down 4.6 points from the previous year (36.1%); the rate of procurement from
within the NAFTA region, combined with those from the U.S. (23.2%) and Mexico (1.4%), came to 56.1%, down 10.0 points from the prior
year (66.1%). Procurement from Japan was 22.6%, up 4.6 points from the prior year (18.0%); procurement from China was 8.2% (5.9% the
prior year), ASEAN, 4.4% (3.6% the prior year), and South Korea, Hong Kong and Taiwan, 4.3% (2.2% the prior year), showing strong
increases for procurement from Asia. As for procurement going forward, respondents generally planned to retain the current levels, but
some indicated policies to expand procurement from ASEAN and Mexico. Meanwhile, others mentioned plans to reduce procurement from
China and Japan. Among reasons for the change, fluctuations in procurement costs (34.8%) ranked high.
Future Policies for Procurement Sources of
Raw Materials/Parts
3. Procurement Sources: Procurement Rate Fell for NAFTA Region, Rose for Asia
15
Sources of Procurement of Raw Materials/Parts (By Country/Region)
Note: Respondents calculated their ratios in these countries and regions based on monetary amounts.
Total sales equals 100%. The chart indicates the average.
10.3
18.7
2.5
23.2
1.4
1.1
22.6
8.2
4.3 4.4
0.4 2.1
0.7
Canada (Japanese companies inCanada)
Canada (Canadian companies)
Canada (Other foreign affiliatedcompanies in Canada)
U.S.
Mexico
Central and South America(excluding Mexico)
Japan
China
Korea, Hong Kong, Taiwan
ASEAN
Other countries of Asia andOceania
EU
Other
3.8
10.5
9.1
12.8
30.0
14.3
13.3
25.0
50.0
50.0
14.3
20.0
92.3
86.8
90.9
83.0
70.0
100
69.0
66.7
75.0
42.9
50.0
85.7
80.0
3.8
2.6
4.3
16.7
20.0
7.1
0 20 40 60 80 100
Canada (Japanese
companies in Canada) (26)
Canada (Canadian companies) (38)
Canada (Other foreign affiliated
companies in Canada) (11)
U.S. (47)
Mexico (10)
Central and South America
(excluding Mexico) (6)
Japan (42)
China (15)
Korea, Hong Kong, Taiwan (12)
ASEAN (14)
Other countries of
Asia and Oceania (6)
EU (14)
Africa (5)
Increase Stay the same Decrease(%)
(%) Increase (# of
respondents)
1
4
1
6
3
0
6
2
3
7
3
2
1
Canada:
31.5
U.S., Mexico:
24.6
# of respondents:90
Note: Graph lists only those countries or regions in which valid responses
were received from five or more companies.
Copyright © 2020 JETRO. All rights reserved.
Survey on Business Conditions for Japanese Companies in Canada
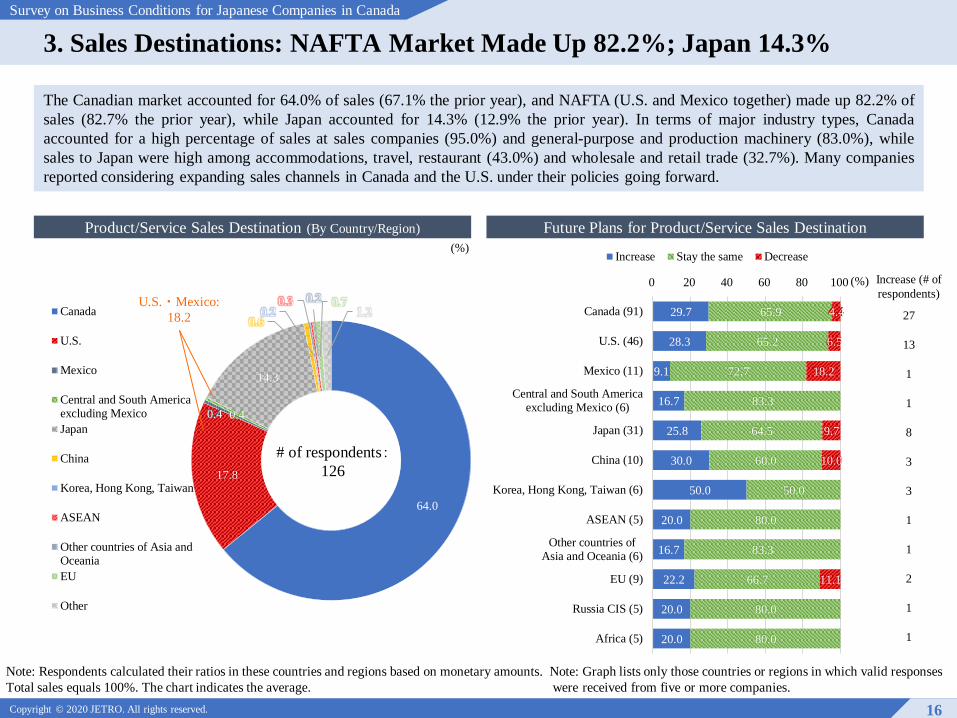
The Canadian market accounted for 64.0% of sales (67.1% the prior year), and NAFTA (U.S. and Mexico together) made up 82.2% of
sales (82.7% the prior year), while Japan accounted for 14.3% (12.9% the prior year). In terms of major industry types, Canada
accounted for a high percentage of sales at sales companies (95.0%) and general-purpose and production machinery (83.0%), while
sales to Japan were high among accommodations, travel, restaurant (43.0%) and wholesale and retail trade (32.7%). Many companies
reported considering expanding sales channels in Canada and the U.S. under their policies going forward.
Future Plans for Product/Service Sales Destination
3. Sales Destinations: NAFTA Market Made Up 82.2%; Japan 14.3%
16
Product/Service Sales Destination (By Country/Region)
64.0
17.8
0.4 0.4
14.3
0.6 0.2
0.3 0.2 0.7 1.2 Canada
U.S.
Mexico
Central and South Americaexcluding Mexico
Japan
China
Korea, Hong Kong, Taiwan
ASEAN
Other countries of Asia andOceania
EU
Other
29.7
28.3
9.1
16.7
25.8
30.0
50.0
20.0
16.7
22.2
20.0
20.0
65.9
65.2
72.7
83.3
64.5
60.0
50.0
80.0
83.3
66.7
80.0
80.0
4.4
6.5
18.2
9.7
10.0
11.1
0 20 40 60 80 100
Canada (91)
U.S. (46)
Mexico (11)
Central and South Americaexcluding Mexico (6)
Japan (31)
China (10)
Korea, Hong Kong, Taiwan (6)
ASEAN (5)
Other countries ofAsia and Oceania (6)
EU (9)
Russia CIS (5)
Africa (5)
Increase Stay the same Decrease
Increase (# of
respondents)
27
13
1
1
8
3
3
1
1
2
1
1
(%)
(%)
U.S.・Mexico:
18.2
# of respondents:126
Note: Graph lists only those countries or regions in which valid responses
were received from five or more companies.
Note: Respondents calculated their ratios in these countries and regions based on monetary amounts.
Total sales equals 100%. The chart indicates the average.

Copyright © 2020 JETRO. All rights reserved.
Survey on Business Conditions for Japanese Companies in Canada
54.5
76.9
66.7
78.3
66.7
50.0
37.5
90.0
57.6
69.2
50.0
52.2
77.8
20.0
25.0
40.0
0 20 40 60 80 100
Manufacturing (66)
Transportation equipment (motor vehicles, motorcycles) (13)
Non-Manufacturing (72)
Sales company (23)
Accommodations, travel, restaurant (9)
Wholesale and retail trade (10)
Mining (8)
Miscellaneous non-manufacturing industries (10)
Labor costs (including salaries and bonuses)Recruiting workers (regular workers and engineers)
In terms of management challenges (Factors for Increased Costs), “labor costs (including salaries and bonuses)” took the top place at 60.9%,
up 6.0 points from the prior year (54.9%), followed by “recruiting workers” at 53.6% (the prior year 59.2%). When viewed by industry,
“labor costs (regular workers and engineers)” was a common answer among sales companies (78.3%) and transportation equipment parts
(motor vehicles, motorcycles, 76.9%), while “recruiting workers” was widely cited by accommodations, travel, restaurants (77.8%) and
transportation equipment parts (motor vehicles, motorcycles, 69.2%).
4. Factors for Increased Costs: “Labor Costs,” “Recruiting Workers” Presented Continued Challenges
17
• Wages are increasing due to seniority of workers. Even though the rate of increase is not that high, the
pool is large, and this results in increased costs. Wages rose 2.5% from the previous year.
[Sales company]
• Difficult to recruit IT engineers and those with experience in AI and other cutting-edge technology.
Wages rose 4-5% from the previous year. [Information and communications]
• Recruiting is difficult across nearly all positions, particularly for salespeople and factory workers.
Wages increased about 11% from the previous year. [Food/agricultural products]
• Recruiting is challenging for forklift operators, off-shift operators, and engineers. Wages increased
about 2.3% from the previous year (for full-time staff) and about 20% (for contract employees).
[Plastic products]
• Recruiting is a challenge for experienced air/conditioning sales staff/sales engineers. [Sales company]
• Recruiting is difficult for staff who are well versed in trading who can also talk about technical matters
with engineers at customer sites. Wages rose about 5% from the previous year. [Wholesale and retail
trade]
• Difficult to recruit Japanese-English bilingual phone staff with a valid visa. Wages increased about 10%
from the previous year. [Miscellaneous non-manufacturing industries]
Management Challenges: Factors for Increased Costs (Multiple Answers)
Higher Wages, Recruiting of Workers (By Sector/Industry)
Occupations for Which Recruiting Is Challenging, Wage Increase Rates
60.9
53.6
38.4
34.8
29.7
28.3
16.7
15.9
10.1
9.4
8.7
8.0
5.8
6.5
0 10 20 30 40 50 60 70
Labor costs (including
salaries and bonuses)
Recruiting workers (regular
workers and engineers)
Foreign exchange risks
(U.S/Canadian dollar)
Retention of workers
Raw material, natural resource
and/or commodity prices
Transportation costs
(including gasoline price)
Cost of dispatching Japanese expats
(such as setting up living conditions)
Foreign exchange risks
(yen/Canadian dollar)
Increase of tariffs
(Trade-restrictive measures)
Related regulations
Travel expenses (including airfare)
Healthcare costs
Financing costs
Other # of respondents: 138
(%)(%)
Note: Graph lists only those industries in which valid responses were received from eight or
more companies.

Copyright © 2020 JETRO. All rights reserved.
Survey on Business Conditions for Japanese Companies in Canada
44.4
37.8
34.8
28.9
28.1
24.4
17.0
14.1
11.9
11.1
8.9
8.1
7.4
5.2
4.4
4.4
3.0
3.0
2.2
1.5
5.2
10.4
0 10 20 30 40 50
Reducing expenses other than payroll
Enhancing internal communication
Improving the working environment
(enhancing benefits, etc.)
Encouraging automation
and power conservation
Increasing wages
Increasing prices of products (or services)
Reviewing suppliers of raw materials
and procurement content
Encouraging recruitment of local staff
Reviewing production
(improvement, adding of value)
Concluding temporary contracts
and outsourcing contracts
Exchange reservation,
change of payment method
Using web conferences
Reviewing delivery contracts
and delivery methods
Cost-cutting through mass production
and volume sales
Increasing local procurement rate
Reviewing medical insurance policy
Introducing remote work
Reviewing financing methods
Utilizing experts
Shifting production/service capabilities
to third country/areas
Other
No particular measures
In terms of countermeasures, “reducing expenses other than payroll” (44.4%), “enhancing internal communication” (37.8 %), “improving
the working environment (enhancing benefits, etc.)” (34.8%) were the answers most often given. When viewed by industry, “reducing
expenses other than payroll” was the most frequent response in the fields of sales companies (66.7%), while “enhancing internal
communication” and “improving the working environment (enhancing benefits, etc.)” were the top answers in transportation equipment
(motor vehicles, motorcycles) (76.9% each).
4. Countermeasures against Factors for Increased Costs: “Reducing Expenses Other than Payroll” the Top Response
18
• Share materials and change suppliers, review logistics providers. [Miscellaneous manufacturing
industries]
• Review warehouse storage and transport schemes. [Sales company]
• Increase handling of products not subject to import restrictions, diversify suppliers. [Wholesale and
retail trade]
• Make a capital investment so that product packaging lines that have been performed manually use less
human labor. [Sales company]
• Product branding and marketing in the sales market [Food/agricultural products]
• Annual review of sales prices [Wholesale and retail trade]
• Consider and deploy IoT/AI. [Sales company]
• Review product lineup and business model. [Information and communications]
• Promote use of IT for work that can use less human labor. [Sales company]
• Standardize production structure. [General-purpose and production machinery]
• We have primarily sold hardware, but are considering focusing on sales of technical support and other
services going forward. [Sales company]
• Standardize changes in fees. [Transport activities, warehouse]
• Reduce business trips and other expenses, increase repair and maintenance margins, lower health
insurance contribution ratio, contracts with distributors. [Sales company]
• Automation for reducing both labor costs and injuries [Transportation equipment parts (motor
vehicles, motorcycles)]
• Effective use of sales and advertisement spending [Sales company]
• Reduce personnel through early retirement, curb the number of full-timers by using contract staff and
interns, improve logistics efficiency. [Sales company]
• Promote hiring of local staff, increase outsourced operations. [Accommodations, travel,
restaurants]
• Increase opportunities for information sharing. [Mining]
• Maintain wage competitiveness to improve retention [Construction, plant]
• Hold internal events to foster a sense of belonging among employees. [Transportation equipment
parts (motor vehicles, motorcycles)]
• Pay market-competitive salaries and flexible work structure. [Wholesale and retail trade]
• Expand benefits menu, including health insurance.[Accommodations, travel, restaurants]
Note: Top specific measures for “reducing expenses other than payroll” were “encouraging automation and power conservation” and “reviewing suppliers of law materials and procurement content.”
Specific CountermeasuresCountermeasures for Factors for Increased Costs (Multiple Answers)
# of respondents: 135
(%)

Copyright © 2020 JETRO. All rights reserved.
Survey on Business Conditions for Japanese Companies in Canada
Asked about the benefits they offered, respondents commonly answered “working environment/housing” (76.1%), “education” (76.1%)
and “health/medical” (73.9%). In terms of specific items, more than half cited “accident and sickness benefits” (59.0%) and “in-house
training program” (56.7%). The survey found that companies offer a wide range of benefits from various allowances to on-site/off-site
training.
4. Company Benefits: “Working Environment/Housing,” “Education,” “Health/Medical” Most Cited
19
Benefits Given to Local Employees/Specific Items (Multiple Answers)Benefits Given to Local Employees (Multiple Answers, By Sector)
76.1
76.1
73.9
35.8
14.2
2.2
78.1
76.6
78.1
34.4
14.1
4.7
74.3
75.7
70.0
37.1
14.3
0
0 10 20 30 40 50 60 70 80
Working environment/housing
Education
Health/medical
Asset-building
Other
Nothing special provided
59.0
56.7
47.8
47.0
45.5
41.8
39.6
32.8
32.8
23.9
16.4
12.7
11.9
3.0
3.0
0 10 20 30 40 50 60 70
Accident and sickness benefits
In-house training program
Paid maternity & paternity/child-care leave
Life insurance
External training program
Assistance for personal development and
qualification acquisition
Flex time
401(k) plan
Company car/commuter allowance
Work-from-home options
Health savings account
Free meals and snacks
Assistance for school tuition
Stock options
Company housing/housing assistance # of respondents: 134
(%) (%)□All industries(134) Manufacturing(64) Non-Manufacturing(70)

Copyright © 2020 JETRO. All rights reserved.
Survey on Business Conditions for Japanese Companies in Canada
The median value for monthly base salaries at factories etc. by occupation was CAN$4,000 for operators, CAN$5,267 for mechanical
engineers, and CAN$7,000 for production managers. The median value for monthly base salaries for office work etc. according to
occupation was CAN$4,000 for general clerks and CAN$6,500 for general administration section chiefs.
4. Wages (Monthly Base Salaries): Median Values Were CAN$4,000 - CAN$7,000
20
General Clerks General Administration Section Chiefs
Production Managers
Operators
Mechanical Engineers
1. The occupation answer options for manufacturers were operators (job types engaged in machine operation in the manufacturing process), mechanical engineers (technical positions for designing,
manufacturing and managing machines and equipment), production managers (section chiefs of production management departments), general clerks (general office workers) and general
administration section chiefs (section chefs of general affairs departments). The options for non-manufacturers were general clerks and general administration section chiefs.
2. This chart lists only the industry types for which valid responses were received from at least three companies.
(CAD)
(CAD)
(CAD)
(CAD) (CAD)
4,000
4,000
3,442
0 4,000 8,000
Manufacturing (25)
Food, processed food,
agricultural or fishery
products (3)
Transportation equipment
parts (motor vehicles,
motorcycles) (8)
5,267
5,400
5,000
0 4,000 8,000
Manufacturing (24)
Transportation equipment
parts (motor vehicles,
motorcycles) (8)
Food, processed food,
agricultural or
fishery products (3)
7,000
7,250
7,000
0 4,000 8,000
Manufacturing (25)
Transportation equipment
parts (motor vehicles,
motorcycles) (8)
Food, processed food,
agricultural or
fishery products (3)
4,000
3,875
4,000
3,700
3,520
4,245
4,000
5,500
4,000
4,000
3,000
4,400
0 4,000 8,000
All industries (70)
Manufacturing (32)
Food, processed food,
agricultural or
fishery products (3)
Transportation equipment
parts (motor vehicles,
motorcycles) (9)
Non-ferrous metals (3)
Miscellaneous
manufacturing
industries (4)
Non-Manufacturing (38)
Information and
communications (4)
Wholesale and
retail trade (5)
Sales company (14)
Accommodations, travel,
restaurant (7)
Miscellaneous
non-manufacturing
industries (4)
6,500
7,000
7,917
7,000
8,000
6,275
9,100
7,500
5,500
4,000
5,600
0 4,000 8,000
All industries (61)
Manufacturing (29)
Transportation equipment
(motor vehicles,
motorcycles) (9)
Food, processed food,
agricultural or
fishery products (3)
Miscellaneous manufacturing
industries (3)
Non-Manufacturing (32)
Information and
communications (3)
Information and
communications (5)
Sales company (12)
Accommodations, travel,
restaurant (5)
Miscellaneous non-
manufacturing industries (3)

Copyright © 2020 JETRO. All rights reserved.
Survey on Business Conditions for Japanese Companies in Canada
4. Wages (Annual Bonuses): Median Values Were 0.3 - 1.0 Month’s Pay
21
The median value of annual bonuses at factories, etc. by occupation was 0.3 month’s pay for operators, 0.3 month’s pay for mechanical
engineers, and one month’s pay for production managers. Meanwhile, the median value of annual bonuses for office work etc.
according to occupation was 0.8 month’s pay for general clerks and one month’s pay for general administration section chiefs.
General Clerks General Administration Section Chiefs
Production Managers
Operators
Mechanical Engineers
0.3
0.0
0.0 0.5 1.0 1.5 2.0
Manufacturing (22)
Transportation equipment
parts (motor vehicles,
motorcycles) (7)
0.3
0.0
0.0 0.5 1.0 1.5 2.0
Manufacturing (21)
Transportation equipment
parts (motor vehicles,
motorcycles) (7)
1.0
1.0
0.0 0.5 1.0 1.5 2.0
Manufacturing (20)
Transportation equipment
parts (motor vehicles,
motorcycles) (5)
0.8
0.5
0.5
0.1
1.0
1.0
1.8
1.0
1.0
0.7
0.0 0.5 1.0 1.5 2.0
All industries (60)
Manufacturing (28)
Non-ferrous metals (3)
Transportation equipment
parts (motor vehicles,
motorcycles) (7)
Miscellaneous
manufacturing
industries (4)
Non-Manufacturing (32)
Wholesale and
retail trade (4)
Information and
communications (4)
Accommodations, travel,
restaurant (7)
Sales company (12)
(Month(s))
(Month(s))
(Month(s))
(Month(s)) (Month(s))
1. The occupation answer options for manufacturers were operators (job types engaged in machine operation in the manufacturing process), mechanical engineers (technical positions for
designing, manufacturing and managing machines and equipment), production managers (section chiefs of production management departments), general clerks (general office workers) and
general administration section chiefs (section chefs of general affairs departments). The options for non-manufacturers were general clerks and general administration section chiefs.
2. This chart lists only the industry types for which valid responses were received from at least three companies.
1.0
1.0
0.1
1.4
1.0
2.0
1.0
1.0
0.0 0.5 1.0 1.5 2.0
All industries (51)
Manufacturing (25)
Transportation equipment
parts (motor vehicles,
motorcycles) (7)
Miscellaneous
manufacturing
industries (3)
Non-Manufacturing (26)
Wholesale and
retail trade (4)
Sales company (10)
Accommodations, travel,
restaurant (5)
Copyright © 2020 JETRO. All rights reserved.
Survey on Business Conditions for Japanese Companies in Canada
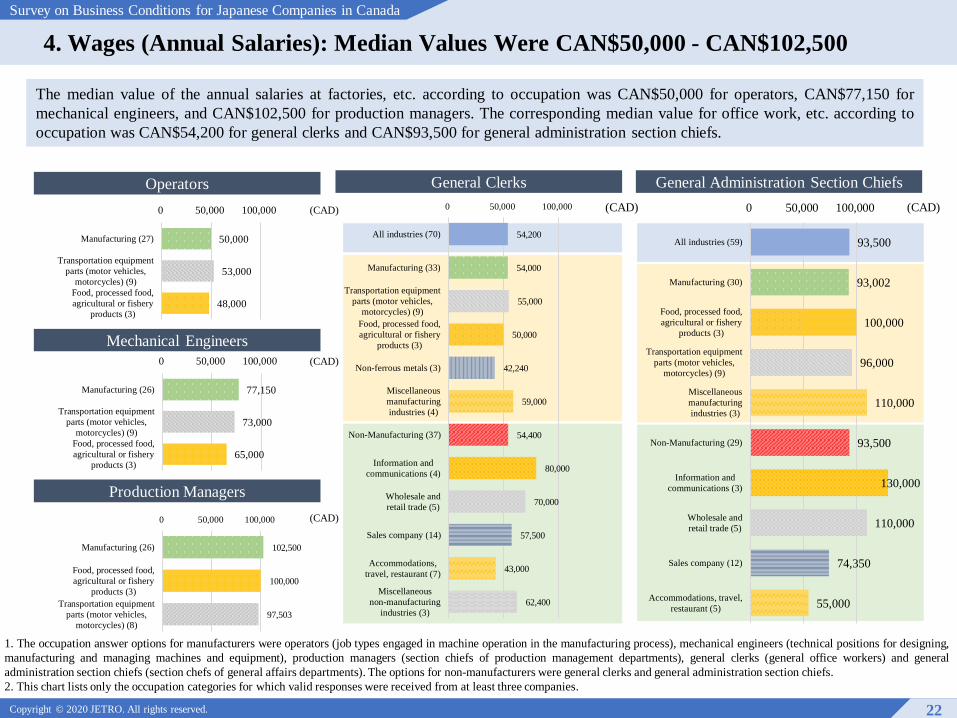
4. Wages (Annual Salaries): Median Values Were CAN$50,000 - CAN$102,500
22
The median value of the annual salaries at factories, etc. according to occupation was CAN$50,000 for operators, CAN$77,150 for
mechanical engineers, and CAN$102,500 for production managers. The corresponding median value for office work, etc. according to
occupation was CAN$54,200 for general clerks and CAN$93,500 for general administration section chiefs.
General Clerks General Administration Section Chiefs
Production Managers
Operators
Mechanical Engineers
(CAD)
(CAD)
(CAD)
(CAD) (CAD)
54,200
54,000
55,000
50,000
42,240
59,000
54,400
80,000
70,000
57,500
43,000
62,400
0 50,000 100,000
All industries (70)
Manufacturing (33)
Transportation equipment
parts (motor vehicles,
motorcycles) (9)
Food, processed food,
agricultural or fishery
products (3)
Non-ferrous metals (3)
Miscellaneous
manufacturing
industries (4)
Non-Manufacturing (37)
Information and
communications (4)
Wholesale and
retail trade (5)
Sales company (14)
Accommodations,
travel, restaurant (7)
Miscellaneous
non-manufacturing
industries (3)
50,000
53,000
48,000
0 50,000 100,000
Manufacturing (27)
Transportation equipment
parts (motor vehicles,
motorcycles) (9)
Food, processed food,
agricultural or fishery
products (3)
77,150
73,000
65,000
0 50,000 100,000
Manufacturing (26)
Transportation equipment
parts (motor vehicles,
motorcycles) (9)
Food, processed food,
agricultural or fishery
products (3)
102,500
100,000
97,503
0 50,000 100,000
Manufacturing (26)
Food, processed food,
agricultural or fishery
products (3)
Transportation equipment
parts (motor vehicles,
motorcycles) (8)
93,500
93,002
100,000
96,000
110,000
93,500
130,000
110,000
74,350
55,000
0 50,000 100,000
All industries (59)
Manufacturing (30)
Food, processed food,
agricultural or fishery
products (3)
Transportation equipment
parts (motor vehicles,
motorcycles) (9)
Miscellaneous
manufacturing
industries (3)
Non-Manufacturing (29)
Information and
communications (3)
Wholesale and
retail trade (5)
Sales company (12)
Accommodations, travel,
restaurant (5)
1. The occupation answer options for manufacturers were operators (job types engaged in machine operation in the manufacturing process), mechanical engineers (technical positions for designing,
manufacturing and managing machines and equipment), production managers (section chiefs of production management departments), general clerks (general office workers) and general
administration section chiefs (section chefs of general affairs departments). The options for non-manufacturers were general clerks and general administration section chiefs.
2. This chart lists only the occupation categories for which valid responses were received from at least three companies.

Copyright © 2020 JETRO. All rights reserved.
Survey on Business Conditions for Japanese Companies in Canada
52.2
43.4
35.3
32.4
25.7
21.3
14.7
14.0
3.7
2.2
2.2
1.5
16.2
0 10 20 30 40 50 60
Differentiation from competing products
Strengthening customer service
Review of product pricing
Review and strengthening of sales method
Development of new products
Review of production and supply system
Utilizing advertisements and SNS
Shortening delivery time
Acquisition of rights such as trademark rightsand design rights
Investigation of damages regarding piratedand counterfeit products
Legal measures against pirated andcounterfeit goods manufacturers
Other
No particular measures
In terms of countermeasures against external risk factors such as competing products and price wars with competitors, the top
responses were “differentiation from competing products” (52.2%), “strengthening customer service” (43.4%) and “review of product
planning” (35.3%). When viewed by industry, “differentiation from competing products” ranked high among food/agricultural products
and general-purpose and production machinery (83.3%), while “strengthening customer service” and “review of product planning”
were common answers among sales companies (66.7% and 58.3%, respectively).
4. Countermeasures against External Risk Factors: Majority Cited “Differentiation from Competing Products”
23
Countermeasures against External Risk Factors (Multiple Answers)
• Shift to products with relatively high added value and set competitive prices.
Emphasize high quality. [Transportation equipment parts (motor vehicles,
motorcycles)]
• Sales strategy of specializing in products with little competition. Bolster
marketing of high-quality materials in areas that did not use such products in
the past [Wholesale and retail trade]
• Differentiate from other companies through enhanced quality and stable
supply; improve cost competitiveness through automation. [Transportation
equipment parts (motor vehicles, motorcycles)]
• Improve convenience through deployment of B2B portal-based ordering
system, and differentiation through same-day delivery straight from
warehouse. [Sales company]
• Rather than product differentiation, we focus on building communities and
contributing to communities. [Accommodations, travel, restaurants]
• Emphasize customer service. [Transport activities, warehouse]
• Price adjustment during intense competitions [Miscellaneous
manufacturing industries]
• Increase accuracy of manufacturing cost table for reasonable pricing.
[Plastic products]
• Change to optimal sales channels in response to changes in the market.
[Sales company]
• Marketing and branding in the sales market using media, advertisement and
pilot stores, etc. [Food/agricultural products]
• Review warehouse and customer service work, quicker delivery through
simplification and increased efficiency, strengthen sales structure through
stepped-up training of salesforce, and bolster marketing using social media.
[Sales company]
• Deploying ordering systems. [General-purpose and production
machinery]
• Consider e-commerce not only for BtoB but also for BtoC. [Sales company]
• Increase service outsourcing, improve sales activities. [Miscellaneous non-
manufacturing industries]
• Use partnership with the parent company to optimize procurement and sales
activity workload. [Fabricated metal products]
Specific Countermeasures
# of respondents: 136
(%)
Copyright © 2020 JETRO. All rights reserved.
Survey on Business Conditions for Japanese Companies in Canada
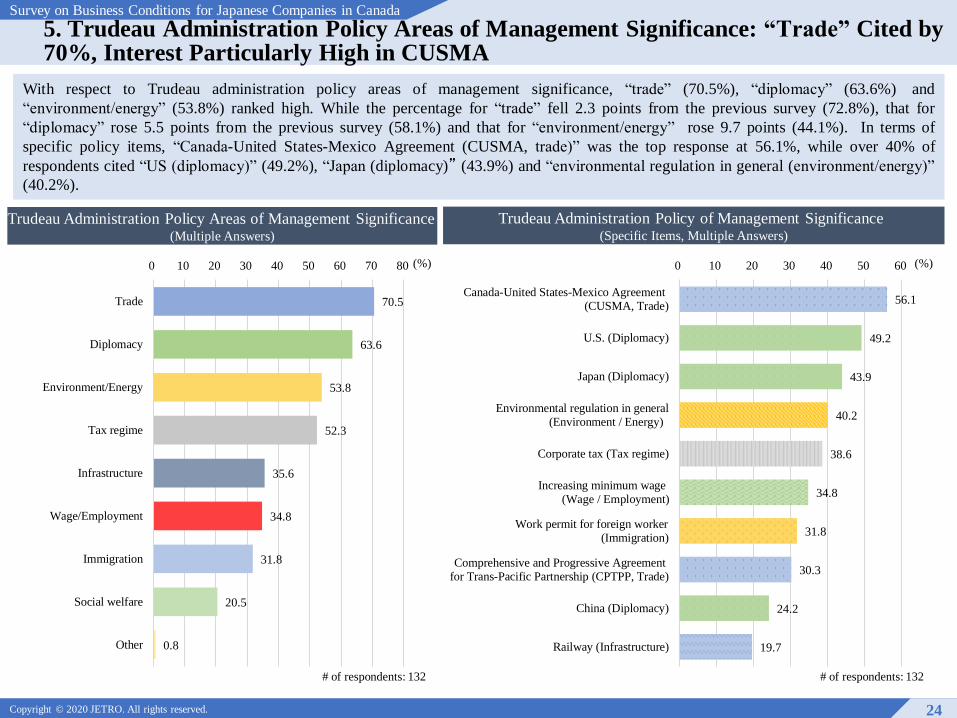
With respect to Trudeau administration policy areas of management significance, “trade” (70.5%), “diplomacy” (63.6%) and
“environment/energy” (53.8%) ranked high. While the percentage for “trade” fell 2.3 points from the previous survey (72.8%), that for
“diplomacy” rose 5.5 points from the previous survey (58.1%) and that for “environment/energy” rose 9.7 points (44.1%). In terms of
specific policy items, “Canada-United States-Mexico Agreement (CUSMA, trade)” was the top response at 56.1%, while over 40% of
respondents cited “US (diplomacy)” (49.2%), “Japan (diplomacy)” (43.9%) and “environmental regulation in general (environment/energy)”
(40.2%).
5. Trudeau Administration Policy Areas of Management Significance: “Trade” Cited by 70%, Interest Particularly High in CUSMA
24
Trudeau Administration Policy Areas of Management Significance(Multiple Answers)
Trudeau Administration Policy of Management Significance(Specific Items, Multiple Answers)
70.5
63.6
53.8
52.3
35.6
34.8
31.8
20.5
0.8
0 10 20 30 40 50 60 70 80
Trade
Diplomacy
Environment/Energy
Tax regime
Infrastructure
Wage/Employment
Immigration
Social welfare
Other
56.1
49.2
43.9
40.2
38.6
34.8
31.8
30.3
24.2
19.7
0 10 20 30 40 50 60
Canada-United States-Mexico Agreement (CUSMA, Trade)
U.S. (Diplomacy)
Japan (Diplomacy)
Environmental regulation in general (Environment / Energy)
Corporate tax (Tax regime)
Increasing minimum wage (Wage / Employment)
Work permit for foreign worker (Immigration)
Comprehensive and Progressive Agreementfor Trans-Pacific Partnership (CPTPP, Trade)
China (Diplomacy)
Railway (Infrastructure)
# of respondents: 132 # of respondents: 132
(%) (%)
Copyright © 2020 JETRO. All rights reserved.
Survey on Business Conditions for Japanese Companies in Canada
5. Effects of CUSMA on Japanese Companies in Canada and Countermeasures: 54.0% Reported “No Impact”
25
Degree of Impact from the Enactment of CUSMA
IndustryBefore
Change
After
Change
Wholesale and
retail trade
North
America→ Europe
China → Mexico
Sales company U.S. → Japan
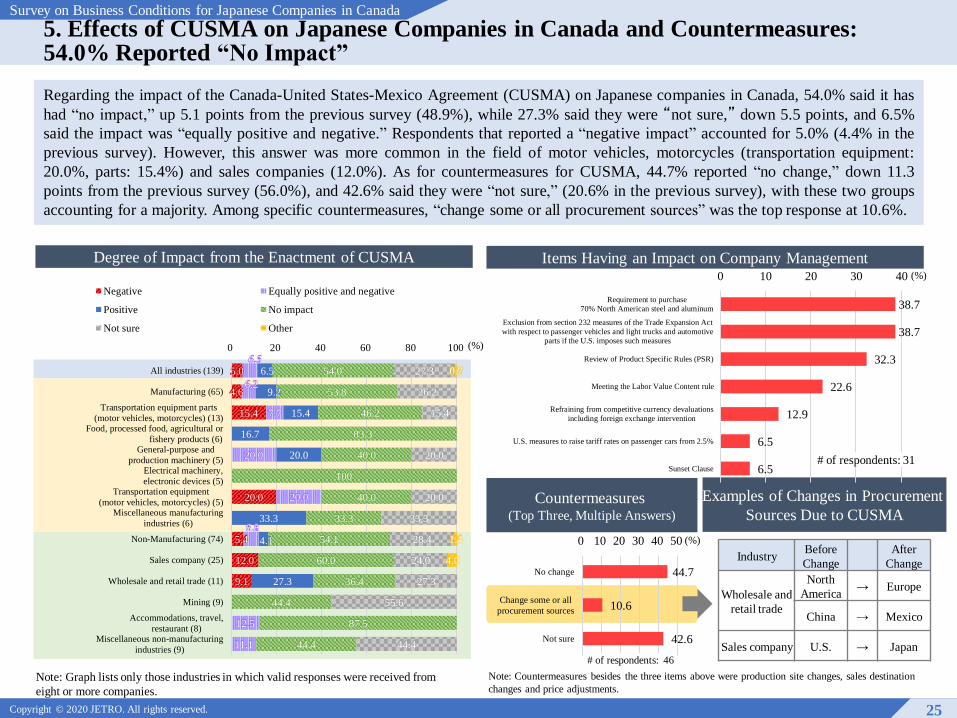
Regarding the impact of the Canada-United States-Mexico Agreement (CUSMA) on Japanese companies in Canada, 54.0% said it has
had “no impact,” up 5.1 points from the previous survey (48.9%), while 27.3% said they were “not sure,” down 5.5 points, and 6.5%
said the impact was “equally positive and negative.” Respondents that reported a “negative impact” accounted for 5.0% (4.4% in the
previous survey). However, this answer was more common in the field of motor vehicles, motorcycles (transportation equipment:
20.0%, parts: 15.4%) and sales companies (12.0%). As for countermeasures for CUSMA, 44.7% reported “no change,” down 11.3
points from the previous survey (56.0%), and 42.6% said they were “not sure,” (20.6% in the previous survey), with these two groups
accounting for a majority. Among specific countermeasures, “change some or all procurement sources” was the top response at 10.6%.
Note: Graph lists only those industries in which valid responses were received from
eight or more companies.
(%)
(%)
Note: Countermeasures besides the three items above were production site changes, sales destination
changes and price adjustments.
Examples of Changes in Procurement
Sources Due to CUSMACountermeasures
(Top Three, Multiple Answers)
44.7
10.6
42.6
0 10 20 30 40 50
No change
Change some or all
procurement sources
Not sure
# of respondents: 46
(%)
Items Having an Impact on Company Management
38.7
38.7
32.3
22.6
12.9
6.5
6.5
0 10 20 30 40
Requirement to purchase
70% North American steel and aluminum
Exclusion from section 232 measures of the Trade Expansion Act
with respect to passenger vehicles and light trucks and automotive
parts if the U.S. imposes such measures
Review of Product Specific Rules (PSR)
Meeting the Labor Value Content rule
Refraining from competitive currency devaluations
including foreign exchange intervention
U.S. measures to raise tariff rates on passenger cars from 2.5%
Sunset Clause# of respondents: 31
5.0
4.6
15.4
20.0
5.4
12.0
9.1
6.5
6.2
7.7
20.0
20.0
6.8
12.5
11.1
6.5
9.2
15.4
16.7
20.0
33.3
4.1
27.3
54.0
53.8
46.2
83.3
40.0
100
40.0
33.3
54.1
60.0
36.4
44.4
87.5
44.4
27.3
26.2
15.4
20.0
20.0
33.3
28.4
24.0
27.3
55.6
44.4
0.7
1.4
4.0
0 20 40 60 80 100
All industries (139)
Manufacturing (65)
Transportation equipment parts
(motor vehicles, motorcycles) (13)Food, processed food, agricultural or
fishery products (6)General-purpose and
production machinery (5)Electrical machinery,
electronic devices (5)Transportation equipment
(motor vehicles, motorcycles) (5)Miscellaneous manufacturing
industries (6)
Non-Manufacturing (74)
Sales company (25)
Wholesale and retail trade (11)
Mining (9)
Accommodations, travel,
restaurant (8)Miscellaneous non-manufacturing
industries (9)
Negative Equally positive and negative
Positive No impact
Not sure Other

Copyright (C) 2020 JETRO. All rights reserved.
Survey on Business Conditions for Japanese Companies in the United States
49.5
41.3
33.9
32.1
25.7
11.9
8.3
2.8
1.8
36.2
36.2
37.9
36.2
27.6
10.3
5.2
3.4
5.2
44.4
22.2
27.8
38.9
5.6
16.7
5.6
0
11.1
0 10 20 30 40 50
Exclusion from section 232 measures of
the Trade Expansion Act with respect to passenger
vehicles and light trucks and automotive parts
Requirement to purchase 70%
North American steel and aluminum
Meeting the Labor Value Content rule
Review of Product Specific Rules(PSR)
U.S. measures to raise tariff rates
on passenger cars from 2.5%
Refraining from competitive currency devaluations
including foreign exchange intervention
Increase in De Minimis levels of
cross-border online orders
Introduction of disciplines on digital trade
Sunset Clause
U.S. (109) Mexico (58) Canada (18)
23.1
10.0
20.0
7.7
10.0
20.0
7.7 38.5
30.0
40.0
23.1
50.0
20.0
0 20 40 60 80 100
U.S. (13)
Mexico (10)
Canada (5)
8.1
36.8
15.4
5.1
8.8
7.7
4.0
15.4
42.4
21.1
46.2
40.4
33.3
15.4
0 20 40 60 80 100
U.S. (99)
Mexico (57)
Canada (13)
With regard to the effects of CUSMA, a comparison of the survey results with those for separately conducted surveys of the U.S. and
Mexico revealed that respondents engaged in manufacturing in Mexico cited a “negative impact” at the highest rate proportionally
(24.5%), whereas the only 4.6% of respondents in Canada and 4.3% of respondents in the U.S. reported the same. In the field of
transportation equipment (motor vehicles, motorcycles), more respondents in the U.S. and Canada cited negative impacts (23.1%,
20.0%), while in transportation equipment parts (motor vehicles, motorcycles), more respondents in Mexico said they had experienced
a negative impact (36.8%). In terms of items having an impact on company management in the manufacturing industry, “exclusion
from Section 232 measures of the Trade Expansion Act with respect to passenger vehicles and light trucks and automotive parts if the
U.S. imposes such measures” was the top response in the U.S. (49.5%) and in Canada (44.4%), whereas in Mexico it was “meeting the
labor value content rule” (37.9%).
Items Having an Impact on Company Management (U.S., Mexico, Canada; Multiple Answers)
5. Effects of CUSMA in the Three Countries: “Negative Impact” Most Reported in Mexico by 25% of Respondents
26
Degree of Impact from the Enactment of CUSMA(U.S., Mexico, Canada)
(%)
(%)
(%)
(%)
4.3
24.5
4.6
3.6
5.8
6.2
4.1
7.1
9.2
54.1
24.5
53.8
33.5
38.1
26.2
0.5
0 20 40 60 80 100
U.S. (442)
Mexico (155)
Canada (65)
Negative Positive Equally positive and negative No impact Not sure Other
Manufactures
Transportation equipment (motor vehicles, motorcycles)
Transportation equipment parts (motor vehicles, motorcycles)
Note: From the manufacturing industry in the U.S., companies engaged in “Manufacturing” were sampled.

Copyright (C) 2020 JETRO. All rights reserved.
Survey on Business Conditions for Japanese Companies in the United States
5. Countermeasures Regarding CUSMA in the Three Countries: Changes in Procurement Sources the Highest in the U.S. and Mexico
27
Note: From manufacturing and various industries in the U.S., companies engaged in “Manufacturing” were sampled.
Regarding countermeasures following CUSMA, in a comparison with the survey results for the U.S. and Mexico, “no change” accounted for
approximately 40-50% of the respondents’ answers (Mexico 49.0%, Canada 47.8%, U.S. 39.2%). However, “change some or all procurement
sources” was a more common response in the U.S. (14.4%) and in Mexico (14.2%), and “transfer some or all production sites here from other
locations” was a more common response in Mexico (14.8%) than elsewhere. When viewed by industry, the results showed that changing
procurement sources was proportionally high in Mexico in the field of iron and steel at 36.4%, while transferring production sites to the local
country from other locations was a more common response in the U.S. in transportation equipment (motor vehicles, motorcycles) at 42.9%, whereas
29.8% of respondents in Mexico engaged in transportation equipment parts (motor vehicles, motorcycles) cited this change.
Countermeasures Regarding CUSMA (U.S., Mexico, Canada; Multiple Answers)
ManufacturesTransportation equipment parts
(motor vehicles, motorcycles)Iron and steel
Transportation equipment
(motor vehicles, motorcycles)
14.4
10.5
8.5
13.1
5.9
4.6
2.0
39.2
35.9
14.2
14.8
2.6
10.3
3.9
4.5
1.9
49.0
22.6
8.7
8.7
8.7
4.3
8.7
0
0
47.8
39.1
0 20 40 60 80 100
Change some or all
procurement sources
Transfer some or all
production sites to
the country where
your company is located
Transfer some or all
production sites from the
country where your company
is located to other places
Adjust sales prices
Change some or all
sales destinations
Decide to make
additional investment
Other
No change
Not sure
U.S. (153) Mexico (155) Canada (23)
11.9
9.5
9.5
7.1
0
4.8
0
47.6
33.3
21.1
29.8
3.5
17.5
7.0
8.8
1.8
33.3
19.3
0
16.7
16.7
16.7
16.7
0
0
83.3
0
0 20 40 60 80 100
Change some or all
procurement sources
Transfer some or all
production sites to
the country where
your company is located
Transfer some or all
production sites from the
country where your company
is located to other places
Adjust sales prices
Change some or all
sales destinations
Decide to make
additional investment
Other
No change
Not sure
U.S. (42) Mexico (57) Canada (6)
27.3
9.1
0
27.3
0
9.1
0
36.4
18.2
36.4
18.2
18.2
27.3
18.2
9.1
0
36.4
27.3
0 20 40 60 80 100
Change some or all
procurement sources
Transfer some or all
production sites to
the country where
your company is located
Transfer some or all
production sites from the
country where your company
is located to other places
Adjust sales prices
Change some or all
sales destinations
Decide to make
additional investment
Othre
No change
Not sure
U.S. (11) Mexico (11)
28.6
42.9
28.6
28.6
28.6
14.3
14.3
14.3
28.6
20.0
10.0
0
0
0
0
10.0
40.0
30.0
0 20 40 60 80 100
Change some or all
procurement sources
Transfer some or all
production sites to
the country where
your company is located
Transfer some or all
production sites from the
country where your company
is located to other places
Adjust sales prices
Change some or all
sales destinations
Decide to make
additional investment
Other
No change
Not sure
U.S. (7) Mexico (10)
(%)(%)(%)(%)

Copyright © 2020 JETRO. All rights reserved.
Survey on Business Conditions for Japanese Companies in Canada
53.3
33.3
20.0
16.7
13.3
3.3
0 10 20 30 40 50 60
Import/procurement cost
Sales in Canadian market
Production cost
Sales in overseas (out of export sales)
Administrative cos
Other
Concerning the impact at present from changes in the trade environment, such as additional tariffs, “no impact” was the most common response
at 38.1% (51 companies), followed by “not sure” at 29.1% (39 companies) and “negative impact” at 22.4% (30 companies). By major industry
type, “negative impact” was a leading answer in the fields of transportation equipment parts (motor vehicles, motorcycles, 60.0%), wholesale
and retail trade (36.4%) and food/agricultural products (33.3%). The main areas where this negative impact is being felt included
“import/procurement cost” at 53.3% (16 companies), “domestic sales (sales in the Canadian market )” at 33.3% (10 companies) and “production
cost” at 20.0% (6 companies). “Import/procurement cost” was cited by 70.6% of manufacturers, with the proportion reaching 100% among
those in the field of transportation equipment parts (motor vehicles, motorcycles).
Areas to be Negatively Affected by Changes
in the Trade Environment (Multiple Answers)
6. Effects of Changes in the Trade Environment: 20% of Respondents Reported Negative Impact
28
Current Impact Due to Changes in Trade Environment
# of respondents: 30
(%)
(%)
Note: Only industries for which at least five companies gave valid responses are listed.
22.4
26.6
60.0
33.3
28.6
20.0
20.0
16.7
18.6
36.4
28.0
12.5
9.0
9.4
20.0
14.3
20.0
16.7
8.6
9.1
8.0
12.5
1.5
3.1
7.1
38.1
34.4
66.7
28.6
40.0
66.7
41.4
27.3
40.0
83.3
44.4
25.0
29.1
26.6
20.0
21.4
60.0
40.0
31.4
27.3
24.0
16.7
55.6
50.0
0 20 40 60 80 100
All industries (134)
Manufacturing (64)
Transportation equipment
(motor vehicles, motorcycles) (5)
Food, processed food, agricultural or
fishery products (6)
Transportation equipment parts
(motor vehicles, motorcycles) (14)
General-purpose and
production machinery (5)
Plastic products (5)
Miscellaneous manufacturing
industries (6)
Non-Manufacturing (70)
Wholesale and retail trade (11)
Sales company (25)
Accommodations, travel, restaurant (6)
Mining (9)
Miscellaneous non-manufacturing
industries (8)
Negative Equally positive and negative Positive No impact Not sure

Copyright © 2020 JETRO. All rights reserved.
Survey on Business Conditions for Japanese Companies in Canada
Of the companies that reported experiencing a “negative impact," 57.7% (15 companies) said that the specific policy having such
impact on them was “additional U.S. tariffs on steel and aluminum,” while 34.6% (nine companies) said it was “retaliatory tariffs of
Canada in response to additional U.S. tariffs on steel and aluminum.” In terms of major industry type, these policies were each cited by
66.7% (4 companies) of sales companies.
6. Effects of the Changes by Policies: “Additional U.S. Tariffs on Steel and Aluminum”the Top Response
Specific Policies Having a Negative Impact (Multiple Answers)
• As iron and steel products made in China (both the world’s biggest market
and biggest manufacturer for such products) face diminished demand and
flood other regions, this could result in a global downturn. [Fabricated
metal products]
• Experienced high management burden relating to steel and aluminum tariffs,
but the problem was resolved recently. [Transportation equipment (motor
vehicles, motorcycles)]
• With respect to the additional tariffs on iron, steel and aluminum,
procurement costs were negatively affected in our transactions of parts with
a U.S. group company. [Transportation equipment parts (motor vehicles,
motorcycles)]
• 2018 was a tough year due to the additional tariffs on iron, steel and
aluminum, etc. Canada’s retaliatory tariffs against the U.S. roughly doubled
import duties on U.S. products beyond our absorbable extent; this forced us
to pass higher prices on to customers. [General-purpose and production
machinery]
• In terms of business related to the U.S., after the retaliatory tariffs on imports
from the U.S. took effect in 2018, costs of importing U.S. products rose, and
we had no choice but to pass that portion on to customers. [Sales company]
• Part of our products processed in Canada that use Chinese raw materials are
not recognized as Canadian products by U.S. customs and are subject to U.S.
additional tariffs on Chinese goods. So the processing site will be moved to
another group location, meaning that the Canada office will lose part of its
operations. [Food/agricultural products]
• China’s retaliatory tariffs on U.S. goods have effects on seafood products.
We handle U.S. products as well, but China does not buy U.S. goods, so we
have switched to Canadian goods and taken other measures.
[Wholesale and retail trade]
Specific Effects of Changes in the Trade Environment
# of respondents: 26
(%)
29
57.7
34.6
23.1
11.5
7.7
3.8
11.5
0 10 20 30 40 50 60
Additional tariffs of the U.S. imposed onsteel and aluminum (Section 232 of the
Trade Expansion Act in 1962)
Retaliatory tariffs of Canada againstadditional tariffs of the U.S. imposed onsteel and aluminum (Section 232 of the
Trade Expansion Act in 1962)
Retaliatory tariffs by China toward the U.S.in response to additional tariffs imposed by
Section 301 of the Trade Act in 1974
Additional tariffs imposed onChinese products based on
Section 301 of the US Trade Act
US national security investigation ofimports of automobiles and automobile parts
(Section 232 ofthe Trade Expansion Act in 1962)
Export control and strengthening regulationson investment by the US government
Not sure
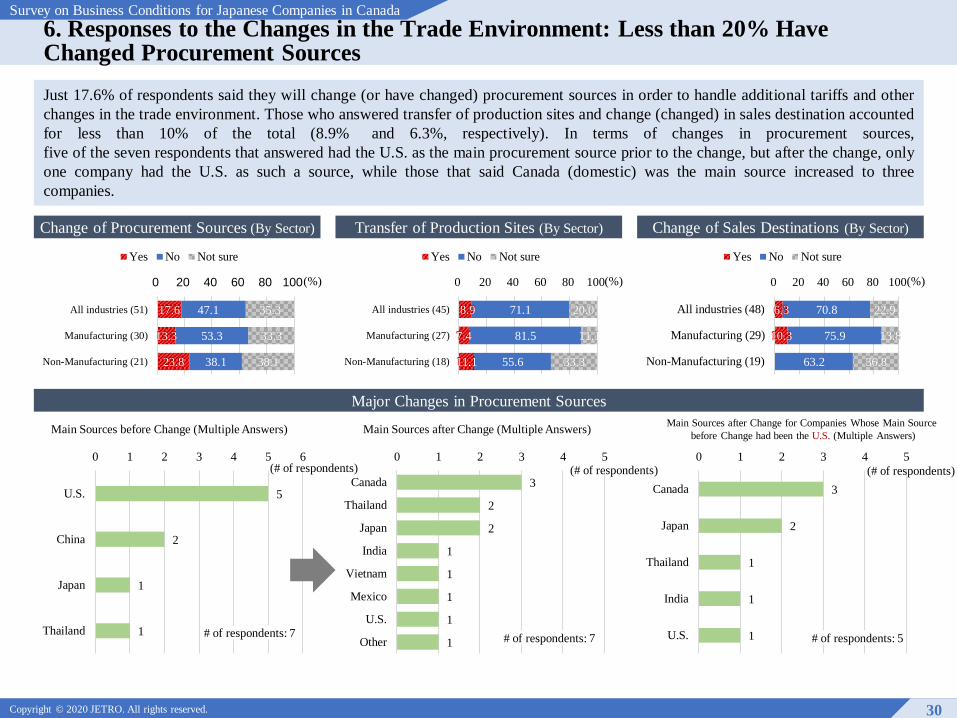
Copyright © 2020 JETRO. All rights reserved.
Survey on Business Conditions for Japanese Companies in Canada
Just 17.6% of respondents said they will change (or have changed) procurement sources in order to handle additional tariffs and other
changes in the trade environment. Those who answered transfer of production sites and change (changed) in sales destination accounted
for less than 10% of the total (8.9% and 6.3%, respectively). In terms of changes in procurement sources,
five of the seven respondents that answered had the U.S. as the main procurement source prior to the change, but after the change, only
one company had the U.S. as such a source, while those that said Canada (domestic) was the main source increased to three
companies.
Change of Sales Destinations (By Sector)
6. Responses to the Changes in the Trade Environment: Less than 20% Have Changed Procurement Sources
30
Change of Procurement Sources (By Sector) Transfer of Production Sites (By Sector)
Major Changes in Procurement Sources
17.6
13.3
23.8
47.1
53.3
38.1
35.3
33.3
38.1
0 20 40 60 80 100
All industries (51)
Manufacturing (30)
Non-Manufacturing (21)
Yes No Not sure
8.9
7.4
11.1
71.1
81.5
55.6
20.0
11.1
33.3
0 20 40 60 80 100
All industries (45)
Manufacturing (27)
Non-Manufacturing (18)
Yes No Not sure
6.3
10.3
70.8
75.9
63.2
22.9
13.8
36.8
0 20 40 60 80 100
All industries (48)
Manufacturing (29)
Non-Manufacturing (19)
Yes No Not sure
5
2
1
1
0 1 2 3 4 5 6
U.S.
China
Japan
Thailand # of respondents: 7
3
2
2
1
1
1
1
1
0 1 2 3 4 5
Canada
Thailand
Japan
India
Vietnam
Mexico
U.S.
Other # of respondents: 7
3
2
1
1
1
0 1 2 3 4 5
Canada
Japan
Thailand
India
U.S. # of respondents: 5
(%) (%) (%)
(# of respondents) (# of respondents) (# of respondents)
Main Sources before Change (Multiple Answers) Main Sources after Change (Multiple Answers)Main Sources after Change for Companies Whose Main Source
before Change had been the U.S. (Multiple Answers)

Copyright © 2020 JETRO. All rights reserved.
Survey on Business Conditions for Japanese Companies in Canada
Regarding the changes in the trade environment and their effects on prospective operating profit, 63.8% said they saw “no change” for
2019 and 56.8% responded the same for 2020. Companies that expected a “decrease” were less than 5% for both 2019 and 2020.
Meanwhile, less than 30% said they were “not sure” for 2019, but about 40% answered the same for 2020, indicating uncertainty going
forward.
Changes in Trade Environment and Their Effects
on Prospective Operating Profit (2020)
6. Changes in the Trade Environment and Their Effects on Operating Profit:Impact Expected to Be Limited
31
Changes in Trade Environment and Their Effects
on Prospective Operating Profit (2019)
• The U.S.-China trade conflict has not had much impact, directly or indirectly. [Transportation equipment parts (motor vehicles, motorcycles)]
• The U.S.-China trade conflict has had almost no direct impact, but China’s import restrictions on Canadian agricultural products, triggered by the arrest of a Huawei executive,
are having effects on the market. [Sales company]
• Canada’s retaliatory tariffs on U.S. iron, steel and aluminum increased tariffs on imports from the U.S. This forced us to pass higher costs on to customers, but because our
customers are affluent, it did not affect sales significantly. [General-purpose and production machinery]
• The effects of President Trump’s tariff policy are not necessarily entirely negative, and may enable a third party to profit, but the concern is that predicting is impossible with
these tariffs. If we know tariffs will remain high, we would move ahead and review the supply chain, but no one knows how things will turn out. [Wholesale and retail trade]
5.43.8
63.8
26.9
Increase
Decrease
No impact
Not sure
4.5 3.0
56.8
35.6 Increase
Decrease
No impact
Not sure
Specific Effects of Changes in Trade Environment
(%) (%)
# of respondents:
130
# of respondents:
132

Copyright © 2020 JETRO. All rights reserved.
Survey on Business Conditions for Japanese Companies in Canada
40.8
35.4
24.7
22.4
14.4
14.2
21.8
9.7
11.2
8.7
9.0
11.2
8.0
6.7
2.1
1.5
5.1
1.5
4.0
3.1
1.9
21.0
26.2
26.2
38.1
25.6
32.9
40.4
26.4
25.7
35.3
29.1
44.8
41.9
29.3
0 20 40 60 80 100
U.S. (618)
China (618)
Mexico (275)
Canada (134 )
ASEAN (2,874)
Europe (678)
(Ref.) Japan (3,286)
Negative impact Both positive and negative impact
Positive impact No impact
Not sure
39.2
34.8
23.6
21.5
14.3
14.1
26.3
8.2
7.9
10.9
4.6
9.0
8.2
5.6
2.0
1.5
5.1
2.3
4.0
2.5
1.6
17.2
21.9
16.4
29.2
21.0
25.6
18.9
33.3
33.9
44.0
42.3
51.7
49.6
47.6
0 20 40 60 80 100
U.S. (609)
China (607)
Mexico (275)
Canada (130)
ASEAN (2,854)
Europe (678)
(Ref.) Japan (3,136)
Negative impact Both positive and negative impact
Positive impact No impact
Not sure
The effects at present of changes in the trade environment differ depending on the country and region. Whereas a “negative impact”
was most often cited in the case of the U.S. and China, “no impact” was the most frequent response for Canada and Japan, while “not
sure” was most cited for Mexico, ASEAN, and Europe. As for what effects the changes in the trade environment may have going
forward, there were fewer responses of “no impact” versus the effects at present, regardless of region, and the proportion of those who
were “not sure” increased. There was a slight decrease in the response rate overseas for those citing a “negative impact," while as a
point of reference, the percentage of respondents in Japan who gave this answer was up 4.5 points (110 companies) at 26.3%.
6. Effects of Changes in the Trade Environment (By Country and Region)
32
Current Impact Due to Changes in Trade Environment
(%) (%)
Future Impact Due to Changes in Trade Environment

Copyright (C) 2020 JETRO. All rights reserved.
Survey on Business Conditions for Japanese Companies in the United States
Effects of the Changes by Policies (By Country and Region)
33
Country or
Region1st most common 2nd most common 3rd most common
U.S.
Additional tariffs imposed on Chinese
products based on Section 301 of the US
Trade Act (First to fourth tranche) (51.1%)
Additional tariffs of the U.S. imposed on steel
and aluminum (42.7%)
Retaliatory tariffs by China against additional
tariffs imposed on Chinese products based on
Section 301 of the US Trade Act (24.6%)
CanadaAdditional tariffs of the U.S. imposed on steel
and aluminum (47.5%)
Retaliatory tariffs against additional tariffs of
the U.S. imposed on steel and aluminum
(22.5%)
Retaliatory tariffs by China against additional
tariffs imposed on Chinese products based on
Section 301 of the US Trade Act (17.5%)
MexicoAdditional tariffs of the U.S. imposed on steel
and aluminum (36.8%)
US national security investigation of imports
of automobiles and automobile parts (33.0%)
Export control and strengthening regulations
on investment by the US government (22.6%)
China
Additional tariffs imposed on Chinese
products based on Section 301 of the US
Trade Act (First to third tranche) (40.4%)
Additional tariffs imposed on Chinese
products based on Section 301 of the US
Trade Act (Fourth tranche) (27.8%)
Retaliatory tariffs by China against additional
tariffs imposed on Chinese products based on
Section 301 of the US Trade Act (24.2%)
ASEAN
Retaliatory tariffs by China against additional
tariffs imposed on Chinese products based on
Section 301 of the US Trade Act (26.5%)
Additional tariffs imposed on Chinese
products based on Section 301 of the US
Trade Act (First to third tranche) (25.5%)
Additional tariffs imposed on Chinese
products based on Section 301 of the US
Trade Act (Fourth tranche) (17.3%)
Europe
Retaliatory tariffs against additional tariffs of
the U.S. imposed on steel and aluminum
(27.3%)
Additional tariffs of the U.S. imposed on steel
and aluminum (20.1%)
Retaliatory tariffs by EU against US national
security investigation of imports of
automobiles and automobile parts (20.1%)
(Ref.) Japan
Additional tariffs imposed on Chinese
products based on Section 301 of the US
Trade Act (First to third tranche) (40.4%)
Additional tariffs imposed on Chinese
products based on Section 301 of the US
Trade Act (Fourth tranche) (36.4%)
Retaliatory tariffs by China against additional
tariffs imposed on Chinese products based on
Section 301 of the US Trade Act (25.1%)
Note: Questions regarding the effects of additional tariffs imposed on Chinese products based on Section 301 of the U.S. Trade Act are divided into two - the first to third tranches,
and the fourth tranche. However, tranches are not divided in the U.S. and Canada questionnaire.
The E.U.’s retaliatory tariffs against the U.S. national security investigation of imports of automobiles and automobile parts have not been implemented.
The effects of the specific policies having an impact on companies are multi-faceted (imports/exports, domestic transactions, etc.), multi-
layered (multiple taxation on the same goods), and multi-tiered (every level of the supply chain), and they vary significantly across different
countries and regions. For the U.S., the greatest number of companies cited “additional tariffs imposed on Chinese products based on
Section 301 of the U.S. Trade Act (First to fourth tranche)” as having an impact on their procurement costs (51.1%), followed by “additional
tariffs of the U.S. imposed on steel and aluminum” (42.7%) and “retaliatory tariffs by China against additional tariffs imposed on Chinese
products based on Section 301 of the U.S. Trade Act (24.6%)." The number of companies in the U.S. exporting to China was just 74
companies (12.8%), compared to 169 companies (31.0%) procuring goods from China.
Specific Policies Having an Impact in Each Country and Region (Multiple Answers)
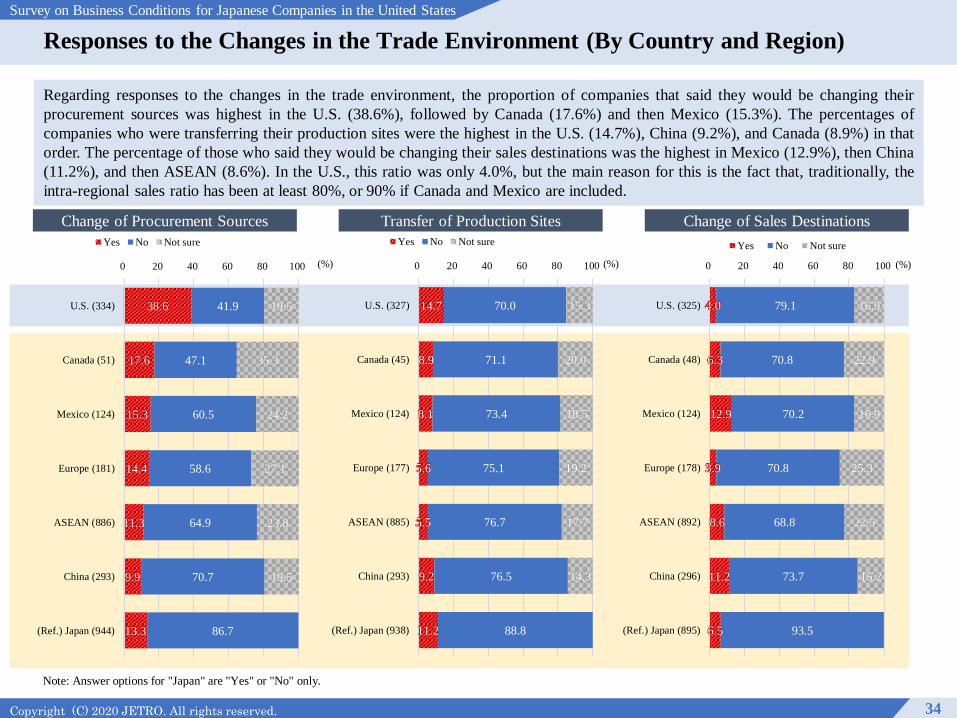
Copyright (C) 2020 JETRO. All rights reserved.
Survey on Business Conditions for Japanese Companies in the United States
Regarding responses to the changes in the trade environment, the proportion of companies that said they would be changing their
procurement sources was highest in the U.S. (38.6%), followed by Canada (17.6%) and then Mexico (15.3%). The percentages of
companies who were transferring their production sites were the highest in the U.S. (14.7%), China (9.2%), and Canada (8.9%) in that
order. The percentage of those who said they would be changing their sales destinations was the highest in Mexico (12.9%), then China
(11.2%), and then ASEAN (8.6%). In the U.S., this ratio was only 4.0%, but the main reason for this is the fact that, traditionally, the
intra-regional sales ratio has been at least 80%, or 90% if Canada and Mexico are included.
Responses to the Changes in the Trade Environment (By Country and Region)
34
Transfer of Production Sites
(%)
Change of Procurement Sources
4.0
6.3
12.9
3.9
8.6
11.2
6.5
79.1
70.8
70.2
70.8
68.8
73.7
93.5
16.9
22.9
16.9
25.3
22.5
15.2
0 20 40 60 80 100
U.S. (325)
Canada (48)
Mexico (124)
Europe (178)
ASEAN (892)
China (296)
(Ref.) Japan (895)
Yes No Not sure
Change of Sales Destinations
(%) (%)
38.6
17.6
15.3
14.4
11.3
9.9
13.3
41.9
47.1
60.5
58.6
64.9
70.7
86.7
19.5
35.3
24.2
27.1
23.8
19.5
0 20 40 60 80 100
U.S. (334)
Canada (51)
Mexico (124)
Europe (181)
ASEAN (886)
China (293)
(Ref.) Japan (944)
Yes No Not sure
14.7
8.9
8.1
5.6
5.5
9.2
11.2
70.0
71.1
73.4
75.1
76.7
76.5
88.8
15.3
20.0
18.5
19.2
17.7
14.3
0 20 40 60 80 100
U.S. (327)
Canada (45)
Mexico (124)
Europe (177)
ASEAN (885)
China (293)
(Ref.) Japan (938)
Yes No Not sure
Note: Answer options for "Japan" are "Yes" or "No" only.

Copyright © 2020 JETRO. All rights reserved.
Contact details for inquiries:
Japan External Trade Organization (JETRO)Americas Division, Overseas Research Department
TEL:+81-3-3582-5545
E-mail:[email protected]
Responsibility for any decisions made based on or in relation to the information provided in this material shall rest solely on the reader. Although JETRO strives to
provide accurate information, JETRO will not be responsible for any loss or damage incurred by readers through the use of such information in any manner.


![index [] · index p 02—09 comp. 175 p 10—19 comp. 176 p 20—25 comp. 177 p 26—31 comp. 178 p 32—37 comp. 179 p 38—43 comp. 180 p 44—49 comp. 181 p 50—55 comp. 182 p](https://img.dokumen.tips/doc/110x75/5c66627e09d3f252168c4378/index-index-p-0209-comp-175-p-1019-comp-176-p-2025-comp-177.jpg)

![Application-Driven Bandwidth Guarantees in Datacenterskaichen/courses/spring2015/comp... · the ratio. Redis [19] and VoltDB [20] benchmarks report transactions-per-second; we converted](https://img.dokumen.tips/doc/110x75/5f0ba5127e708231d4318534/application-driven-bandwidth-guarantees-in-kaichencoursesspring2015comp.jpg)