Embed Size (px)
Citation preview

FY2016 First Half Results andFull-Year Forecast
August 9, 2016
Masahiko UotaniPresident and Group CEO

1
FY2016
1H Results
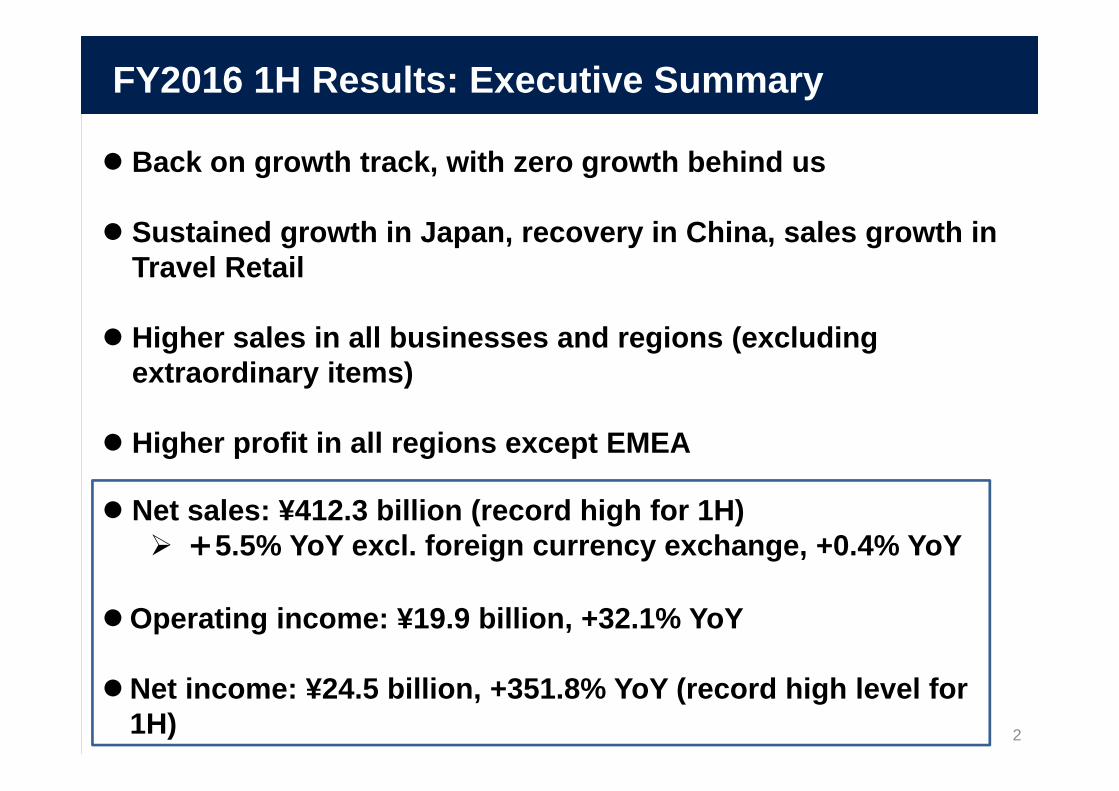
FY2016 1H Results: Executive Summary
2
Back on growth track, with zero growth behind us
Sustained growth in Japan, recovery in China, sales growth in Travel Retail
Higher sales in all businesses and regions (excluding extraordinary items)
Higher profit in all regions except EMEA
Net sales: ¥412.3 billion (record high for 1H)+5.5% YoY excl. foreign currency exchange, +0.4% YoY
Operating income: ¥19.9 billion, +32.1% YoY
Net income: ¥24.5 billion, +351.8% YoY (record high level for 1H)

Summary of FY2016 1H Results
Exchange rates: USD 1 = JPY 111.9 (-7.0%), EUR 1 = JPY 124.7 (-7.1%), CNY 1 = JPY 17.1 (-11.6%)
*Effective from FY2016, the “+” and “-” symbols are used to indicate increase and decrease in amount, respectively.
(Billion yen)
FY2016 FY2015 (Adjusted)YoY
Change* YoY Change %YoY Change
in Local Currency
Difference from May 2016
Announcement% of Net
Sales% of Net
Sales
Net Sales 412.3 100% 410.6 100% +1.7 +0.4% +5.5% -7.7
Operating Income 19.9 4.8% 15.1 3.7% +4.8 +32.1% +38.7% +3.9
Ordinary Income 18.3 4.4% 15.5 3.8% +2.8 +18.4% +2.3
Extraordinary Income/Loss (net) 16.7 4.1% 5.2 1.3% +11.5 +222.2% -0.8
Net IncomeAttributable to
Owners of Parent24.5 5.9% 5.4 1.3% +19.1 +351.8% +1.0
EBITDA 54.5 13.2% 38.1 9.3% +16.4 +42.9%
3

Japan+10.6
(+5.5%)
Asia Pacific+2.3
(+9.1%)
Americas+1.3
(+1.7%)
YoY change excl. impact of
Jean Paul GAULTIER
license termination
+6.0%
Travel Retail+4.4
(+52.2%)
Impact of foreign
currency exchange
-21.0
1H FY2015 1H FY2016
412.3+1.7
(+5.5%)410.6
Top: YoY change (Billion yen)Bottom: (YoY change in local currency)*
China+9.3
(+15.5%)
4* Year-on-year change and year-on-year change in local currency for each business were calculated based on the actual exchange rates.
Higher Sales in All Regions Except EMEA
Change in Net Sales by Reportable Segment (Region)
EMEA-5.3
(-11.0%)

1H FY2015 1H 2016
2,198+95
(+4%)
Top: YoY change (Billion yen)Bottom: (YoY change)
5
China and Travel Retail Drove Earnings GrowthChange in Operating Income by Reportable Segment (Region)
Japan+0.2
(+0.7%)
Asia Pacific+0.3(–)
Americas+0.0(–)
EMEA-4.1(–)
Travel Retail+1.9
(+176.7%)
Adjustments+1.3
China+5.2(–)
15.1
19.9+4.8
(+32.1%)

1H FY2015 1H FY2016
Japan: Inbound Demand and Brand Innovation Supported Growth
*Subject businesses are Prestige, Cosmetics Specialty Stores and Cosmetics of the Japan Business (excluding impact of the transfer of three brands to Personal Care)
6
Factors supporting growth in Shiseido store sales
Inbound*+6%
1H FY2016 market growth (Shiseido estimate)
+2%
1H FY 2016 Shiseido store sales growth
+9%
Brand innovation and Marketing enhancements
+5%Non-focus brands
-2%

7
Launch new products that address consumer needs and elicit empathy
ELIXIR Sleeping Gel Pack (July 2016)SHISEIDO Cushion Compact (Autumn 2016)
Enhance low-priced product rangeLaunch renewed INTEGRATE, etc.
Increase consumer interfaces and promotionsHold PRIOR “Mirai no Hanasaku Party” (blossoming future party) for seniors in seven cities nationwidePlanning collaboration with youth-oriented Tokyo Girls Collection
MAQuillAGE, INTEGRATE, MAJOLICA MAJORCAEnhance ability to create attractive sales corners and strengthen alliances
Strengthen cooperation with major accountsImprove capabilities of trade marketing organization
Capture inbound demandEnhance cross-border marketing and e-commerce
Japan: Maintain Growth Potential by Continuing to Strengthen Marketing
8
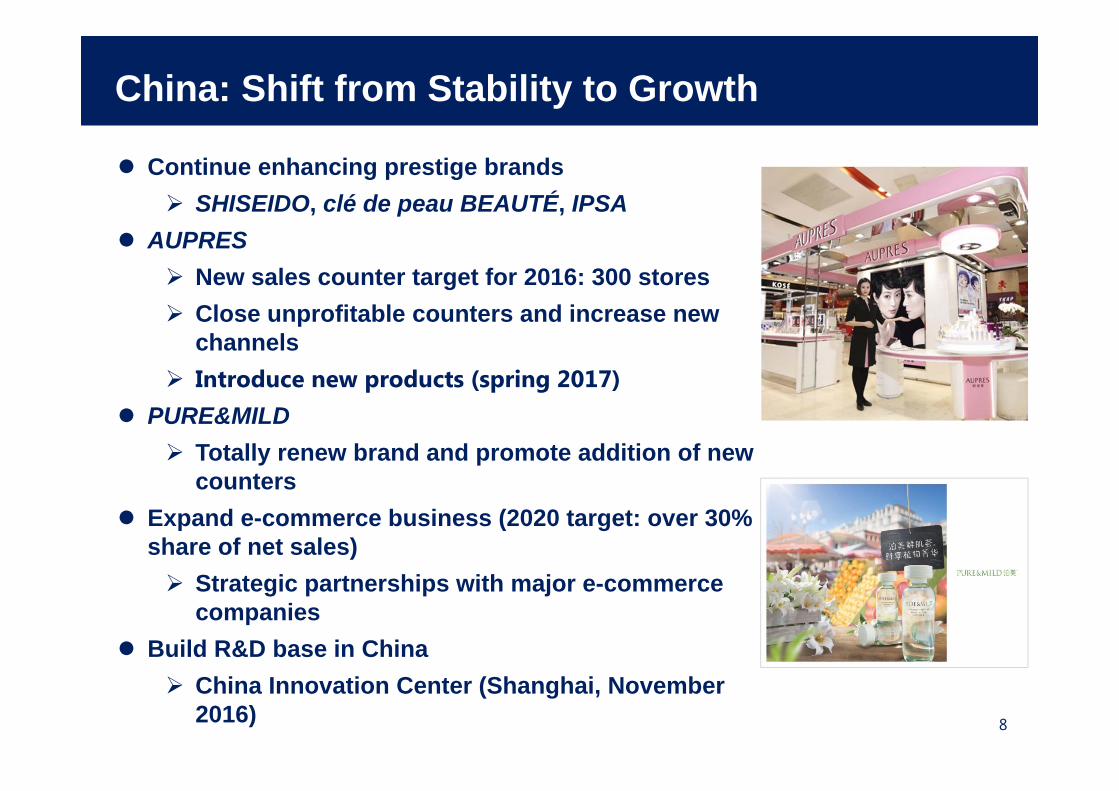
China: Shift from Stability to Growth
Continue enhancing prestige brands SHISEIDO, clé de peau BEAUTÉ, IPSA
AUPRESNew sales counter target for 2016: 300 storesClose unprofitable counters and increase new channelsIntroduce new products (spring 2017)
PURE&MILDTotally renew brand and promote addition of new counters
Expand e-commerce business (2020 target: over 30% share of net sales)
Strategic partnerships with major e-commerce companies
Build R&D base in ChinaChina Innovation Center (Shanghai, November 2016)

9
FY2016
Full-Year Forecast
and Initiatives

VISION 2020: Roadmap and Current Status
10
New Strategy to Accelerate Growth
Rebuild Business Foundation
2014/2015 2016 2017 20192018 2020
Become a Truly Global Growth
Company
Reduce store inventoryIntegrate organization and raise efficiencyWithdraw from unprofitable businessesPromote structural reforms in EMEA and the Americas
Implement strategies for brand selection, concentration and enhancementInvest in marketing and innovationCost reformsDevelop personnel and reform organizationAcquire new brands through M&A, etc. Build a global management organization
Address and Resolve Legacy Issues
Create a Virtuous Cycle

July 2016Acquired the Laura Mercier
and RéVive brands and integrated
the businesses
October 2016
Scheduled to begin business
as licensee of DOLCE&GABBANA
11
Enhance Our Brand Portfolio through M&A

12
Brand Embodying Italian Tradition and Mediterranean Culture
Domenico Dolce and Stefano Gabbana founded the brand in Milan, Italy in 1985Stylish luxury fashion brand with unique designsA leading brand in the global fashion and beauty industry

Exercise Group Synergy for Intense Brand Building
Sales Growth Expectations
13
Develop NewProducts:
FragrancesMakeupSkincare
IncreaseGeographicCoverage
StrengthenOverall
NegotiationCapabilities
From October 2016
Transfer toShiseido
Group

14
Bare Escentuals: Structural Reforms Are Proceeding Smoothly
Head office relocation project started (Completion planned for April 2017) Integrate organization and back office; raise efficiency of supply chainRestructure and innovate managementInnovate marketing and aggressively launch new productsWithdraw from unprofitable stores and raise efficiencyAggressively open stores in advantageous locations
Increase sales and restore profitability

Realistic Forecast of Foreign Currency Exchange ImpactUSD Exchange Rate
15
JPY/USD
FY2015 Actual (average market rate) 121.05
FY 2016 Plan (planned rate at start of fiscal year) 119.00
1Q FY2016 Actual (average market rate Jan-Mar 2016) 115.45
2Q FY2016 Actual (average market rate Jan-Jun 2016) 111.85
2H FY2016 Forecast Rate 102.00
Forecast Impact on FY2016 ResultsAverage rate for
the year106.90
Impact vs. Initial Plan(Billion yen)
Net Sales-50.0
OperatingIncome
-7.0

FY2016: Full-Year Forecast for Net Sales
Sales growthin existingbusinesses
+9.0
Sales of brandsacquired through
M&A, etc.+17.0
Impact ofForeign
Currency Exchange
-50.0
Initial(Feb. 9,
2016)872.0(+3%)
Revised848.0(+6%)
(Billion yen)
16
881.0(+4%)
(YoY change in local currency)

FY2016: Full-Year Forecast for Operating Income
Bare EscentualsStructural
reform-5.0
Higher marginal incomeIn existing businesses Due to cost structure
reforms+10.0
Investments inGrowth (new
brands)-6.0
Impact ofForeign
CurrencyExchange
-7.0
Initial(Feb. 9,
2016)38.0
Revised30.0
(Billion yen)
17
48.0

FY2016: Full-Year Forecast
18
Expected ROE:Exchange Rates:
Dividend:
7.5%FY2016 Full year USD 1 = JPY 106.9 (-12%), EUR 1 = JPY 118.8) (-12%), CNY 1 = JPY 16.1 (-16%)FY2016 2H USD 1 = JPY 102 (-16%), EUR 1 = JPY113 (-16%), CNY 1 = JPY 15.2 (-20%)Interim ¥10, Year-end ¥ 10 (planned)
(Billion yen)
FY2016May
Announcement
Difference from the Previous
Forecast
Initial Forecast
YoY Change after Adjustment YoY Change
in Local Currency
after Adjustment
YenExcl.
Impact of Foreign
Currency Exchange
Difference from the
Initial Forecast
ForeignCurrency Exchange
Net Sales 848.0 -1.8% +6% +4% -24.0 +10.0 872.0 -24.0
Operating Income 30.0 -32.3% -8.0 38.0 -8.0
Ordinary Income 29.0 -34.5% -9.0 38.0 -9.0
Extraordinary Income (Expenses)
14.5 +64.1% -1.0 6.0 +8.5
Net Income Attributable to Owners of Parent
30.0 +1.8% -4.5 28.0 +2.0

FY2016: Full-Year Forecast Highlights
19
Change in exchange rate forecast: 2H USD 1 = JPY 102 Full-year = JPY 106.9
Net sales: ¥848.0 billion ¥24.0 billion below initial forecast
Operating income: ¥30.0 billion ¥8.0 billion below initial forecast
Net income: ¥30.0 billion ¥2.0 billion above initial forecast
Aggressive investment to achieve steady growth with a long-term perspectiveImpact on Net Sales
Existing businesses: +¥9.0 billion (effect of marketing reforms, inbound demand in Japan, etc.)Impact of brand acquisitions: +¥17.0 billion (brand portfolio enhancementImpact of foreign exchange: -¥50.0 billion
Impact on Operating IncomeIncreased marginal income in existing businesses due to effect of cost structure reforms: +¥10.0 billionImpact of foreign exchange: -¥7.0 billionStructural reforms at Bare Escentuals: -¥5.0 billionInvestment in newly acquired brands for growth: -¥6.0 billion


このイメージは、現在表示できません。
In this document, statements other than historical facts are forward-looking statements that reflect our plans and expectations. These forward-looking statements involve risks, uncertainties and other factors that may cause actual results and achievements to differ from those anticipated in these statements.

22
Fiscal YearFY2016(First Half)
FY2015 (Adjusted)1
(First Half)
FY2015(First Half)
1. Adjusted figures have not been audited by the auditing firm. They are provided as reference for comparison.
2. Excluding some subsidiaries
: Jan.-Dec. 2016(Jan.-Jun. 2016)
Overseas : Jan.-Dec. 2015(Jan.-Jun. 2015)
Overseas :Jan-Dec 2015(Jan.-Jun. 2015)
Domestic : Jan.-Dec. 2016(Jan.-Jun. 2016)
Domestic : Jan.-Dec. 2015(Jan.-Jun. 2015)
Domestic2 : Apr.-Dec. 2015(Apr.-Sep. 2015)
Please note that the previous year’s period for comparison has changed due to the change in the fiscal year end.
Overseas

(Billion yen)
FY2016 FY2015 (Adjusted)
YoY Change YoY Change %
YoY Change in Local
Currency% of Net Sales
% of Net Sales
Japan 202.9 49.2% 192.3 46.8% +10.6 +5.5% +5.5%
China 61.5 14.9% 59.7 14.5% +1.8 +3.1% +15.5%
Asia Pacific 24.5 5.9% 25.6 6.2% -1.2 -4.5% +9.1%
Americas 72.4 17.6% 76.8 18.8% -4.4 -5.8% +1.7%
EMEA 39.0 9.5% 47.7 11.6% -8.7 -18.2% -11.0%*
Travel Retail 12.0 2.9% 8.5 2.1% +3.5 +41.5% +52.2%
Total 412.3 100% 410.6 100% +1.7 +0.4% +5.5%
Supplemental Data 1: 1H Sales by Reportable Segment
1. *Year-on-year percentage change is +6% excluding the effect of the termination of the license agreement for Jean Paul GAULTIER.2 . See Supplemental Data 7 for details about changes in reportable segment. 23

(Billion yen)
FY2016 FY2015 (Adjusted)YoY Change YoY Change %
Operating Profitability
Operating Profitability
Japan 26.7 11.9% 26.5 12.4% +0.2 +0.7%
China 2.4 3.9% -2.8 -4.7% +5.2 ー
Asia Pacific 0.0 0.2% -0.3 -1.2% +0.3 ー
Americas -5.5 -7.1% -5.5 -6.7% +0.0 ー
EMEA -2.1 -5.2% 2.0 3.9% -4.1 ー
Travel Retail 3.0 24.8% 1.1 12.7% +1.9 +176.7%
All Regions 24.5 5.6% 21.0 4.8% +3.6 +17.0%
Adjustments -4.6 ー -5.9 ー +1.3 ー
Total 19.9 4.8% 15.1 3.7% +4.8 +32.1%
Supplemental Data 2: 1H Operating Income by Reportable Segment
24*Operating profitability is calculated using net sales including intersegment transactions.

(Billion yen)
FY2016
YoY Change % YoY Change
Change Excluding Impact of Foreign
Currency Exchange% of Net Sales
YoY Change%
Cost of Sales 98.6 23.9% -0.6% -1.9% -1.9 -
SG&A 293.7 71.3% -0.5% -0.4% -1.3 +11.5
Marketing Costs 151.1 36.7% -0.8% -1.9% -2.9 +4.2
Brand Development Cost and
R&D Expenses17.4 4.2% +0.3% +9.5% +1.5 +1.7
Personnel Expenses 56.1 13.6% -0.2% -1.2% -0.7 +1.9
Other Expenses 69.2 16.8% +0.2% +1.2% +0.8 +3.8
Supplemental Data 3: 1H 2016 SG&A
1. In FY2016, the personnel expenses for BCs were reclassified from Personnel Expenses to Marketing Costs.2. The “+” and “-” symbols are used to indicate increase and decrease in amount, respectively. 25

Supplemental Data 3: Capital Expenditures, Depreciation and Amortization
26*Investments in capital expenditures; property, plant and equipment; intangible fixed assets (excl. goodwill); and long-term prepaid expenses
(Billion yen)1H FY2016
1H FY2015(Adjusted)
FY2016 Outlook
Capital Expenditures* 24.9 15.3 61.0
Property, Plant and Equipment 18.4 7.5 45.2
Intangible Assets, etc. 6.5 7.8 15.8
Depreciation and Amortization 16.7 17.5 34.1
Property, Plant and Equipment 8.7 9.3 17.6
Intangible Assets, etc. 8.0 8.2 16.5
R&D Expenses 8.7 8.1 18.7
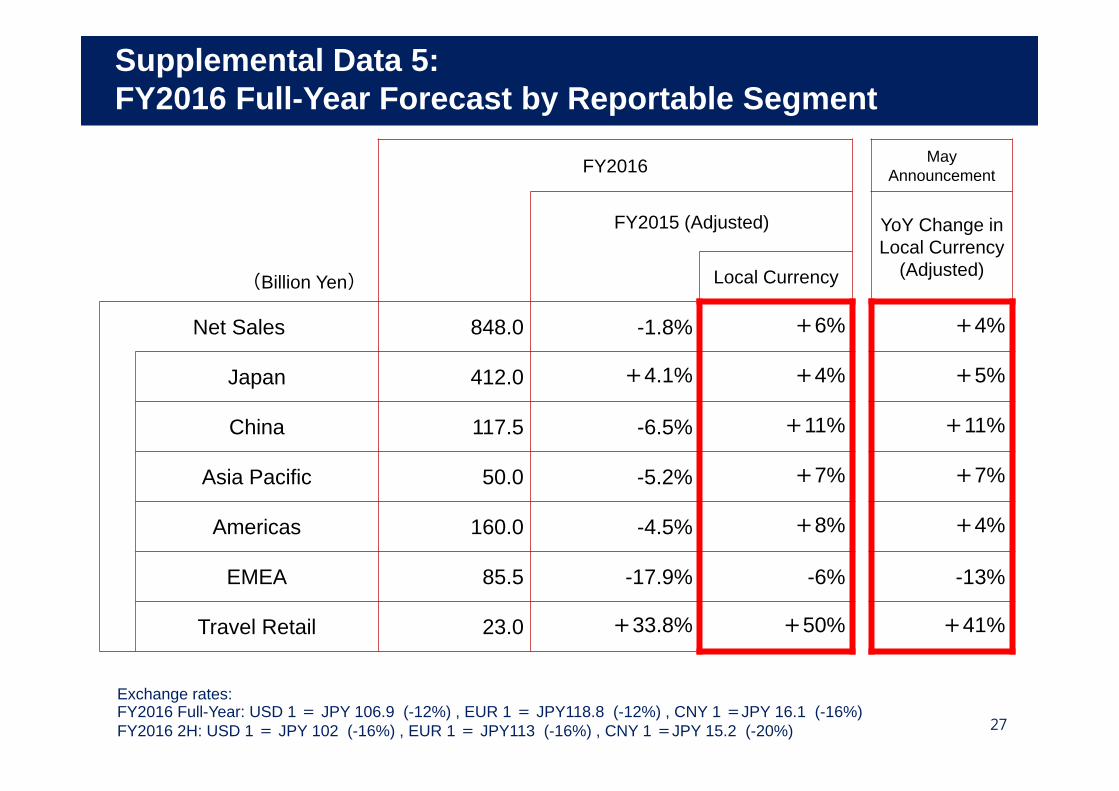
Supplemental Data 5:FY2016 Full-Year Forecast by Reportable Segment
27
(Billion Yen)
FY2016 May Announcement
FY2015 (Adjusted) YoY Change in Local Currency
(Adjusted)Local Currency
Net Sales 848.0 -1.8% +6% +4%
Japan 412.0 +4.1% +4% +5%
China 117.5 -6.5% +11% +11%
Asia Pacific 50.0 -5.2% +7% +7%
Americas 160.0 -4.5% +8% +4%
EMEA 85.5 -17.9% -6% -13%
Travel Retail 23.0 +33.8% +50% +41%
Exchange rates: FY2016 Full-Year: USD 1 = JPY 106.9 (-12%) , EUR 1 = JPY118.8 (-12%) , CNY 1 =JPY 16.1 (-16%) FY2016 2H: USD 1 = JPY 102 (-16%) , EUR 1 = JPY113 (-16%) , CNY 1 =JPY 15.2 (-20%)

28
● Jul. 2016 Notice of Completing the Acquisition of Gurwitch Products, LLC
● Jul. 2016 Notice of Signing a License Agreement with DOLCE&GABBANA S.R.L.
● Jun. 2016 Notice of acquisition of Gurwitch Products, LLC-Addition of Laura Mercier and RéVive to Shiseido’s Global Portfolio-
● May 2016 Shiseido Enhances Global R&D Structure-Unveiling of Americas Innovation Center Reinforces Commitment to Consumer-Centered
Product Development-● Mar. 2016 Shiseido Awarded World’s Most Ethical Companies Designation Five Years in a Row
News Releases
Supplemental Data 6: Major Public Announcements

29
Supplemental Data 7: Main Constituents of Former and New Segments
2016 Segments Major Businesses
JapanOverall business in Japan, TR2 in Japan(Excluding BE2)
China Overall business in China(Excluding BE and TR2)
Asia PacificOverall business in Asia and Oceania excluding Japan and China(Excluding BE and TR2)
AmericasOverall business in the Americas, BE2, and ZOTOS(Excluding TR2)
EMEAOverall business in EMEA3 and BPI2(Excluding BE and TR2)
Travel RetailOverall business at duty-free shops worldwide outside Japan(Excluding BPI2)
2015Segments Major Businesses
JapanPrestige, Cosmetics,Personal Care, Digital,Healthcare, etc.
Global
Cosmetics
China, Asia Pacific,Americas, EMEA3
(TR2
included in all regions)
Professional1 Japan, Global
OthersTHE GINZA, FrontierScience, ShiseidoParlour, etc.
1. Starting from FY2016, the Professional Business, which was included in the Global Business in FY2015, is included in all regions excluding Travel Retail.
2. BE: Bare EscentualsBPI: Beauté Prestige InternationalTR: Travel Retail Business
3. EMEA (Europe, the Middle East and Africa)