Embed Size (px)
Citation preview

May 8, 2015 Company Name : Fuji Heavy Industries Ltd. (Tokyo Stock Exchange First Section, Code No.: 7270) URL : http://www.fhi.co.jp/english/ir/ Representative : Yasuyuki Yoshinaga, President and CEO Contact for Inquiries : Katsuo Saito, General Manager of Administration Department Phone +81-3-6447-8825 Scheduled date of annual meeting of stockholders : June 23, 2015 Scheduled date for dividend payment : June 24, 2015Scheduled date of submitting Security Report : June 24, 2015 Annual earnings supplementary explanatory documents : Yes Holding of annual financial results meeting : Yes (for investment analysts and institutional investors)
(All amounts have been rounded off to the nearest million yen, unless otherwise specified)
1. Performance in FY2015 (April 1, 2014 to March 31, 2015) (1)Consolidated Results of Operations (for twelve-month period)
(In Japanese yen rounded to million, except for per share figures, percentage figures indicate a change from the previous fiscal year / period)
Net sales Operating income Ordinary income Net income
FY2015 2,877,913 19.5% 423,045 29.6% 393,648 25.2% 261,873 26.7%
FY2014 2,408,129 25.9% 326,489 171.1% 314,437 212.5% 206,616 72.8%
Note: Comprehensive income FY2015: 309,271 million yen (46.7%) FY2014: 210,757 million yen (38.6%)
Net income per
share, basic (Yen) Net income per
share, diluted (Yen)Return on
equity
Ratio of ordinary income (loss) to
total assets
Ratio of operating income
(loss) to sales
FY2015 335.57 - 29.3% 19.3% 14.7%
FY2014 264.76 - 30.4% 18.1% 13.6% Reference: Equity income from affiliates FY2015: 499 million yen FY2014: 320 million yen (2) Consolidated Financial Position (Unit: Millions of yen, except for per share figures)
Total assets Net assets Shareholders’ equity to
total assets (%) Net assets per share (Yen)
FY2015 2,199,714 1,030,719 46.5% 1310.15
FY2014 1,888,363 770,071 40.5% 980.98 Reference: Shareholders’ equity FY2015: 1,022,417 million yen FY2014: 765,544 million yen (3) Consolidated Cash Flows (Unit: Millions of yen)
Net cash provided by operating activities
Net cash provided by investment activities
Net cash provided by financing activities
Cash & cash equivalents at end of period
FY2015 311,543 (172,780) (110,546) 612,085
FY2014 313,024 (33,903) (63,011) 557,870 2. Dividends
Cash dividends per share (yen)
1st Quarter
2nd Quarter
3rd Quarter
Year-end
Annual
Amount of dividends
paid (Annual)
Dividend payout ratio
(consolidated)
Ratio of dividends to
net assets (consolidated)
FY 2014 - 20.00 - 33.00 53.00 41,382 20.0% 6.1% FY 2015 - 31.00 - 37.00 68.00 53,093 20.3% 5.9% FY 2016 (Forecast)
- - - - - -
Note: Amount of dividends for FY2016 is not yet determined.
3. Projection of Consolidated Results for Fiscal Year 2016 (April 1, 2015 to March 31, 2016) (In Japanese yen rounded to million, except for per share figures, percentage figures indicate a change from the previous fiscal year / period)
Net sales Operating income Ordinary income Net income attributable to owners of parent
Net income per share,basic(Yen)
1st half 1,475,000 12.6% 244,000 31.4% 240,000 36.4% 163,000 44.2% 208.87
Full year 3,030,000 5.3% 503,000 18.9% 495,000 25.7% 337,000 28.7% 431.84
FY2015 Consolidated Financial Results For the Year Ended March 31, 2015
(Japan GAAP)

4. Others (1) Changes of significant subsidiaries in fiscal year 2015
(Transfer of subsidiaries resulting in changes in the scope of consolidation) : No
(2) Changes in accounting policies, procedures and methods of presentation for preparing the consolidated financial statements
[1] Changes due to revisions of accounting standards : Yes [2] Changes due to other reasons : No [3] Changes of estimation due to accounting issues : No [4] Restatements : No
(3) Number of outstanding shares (Common Stock) [1] Number of outstanding shares
(including treasury stock) As of March 31,2015: 782,865,873 shares As of March 31,2014: 782,865,873 shares
[2] Number of treasury stock As of March 31,2015: 2,483,395 shares As of March 31,2014: 2,477,430 shares
[3] Average number of shares ( for twelve-month period )
FY2015: 780,385,747 shares FY2014: 780,401,864 shares
(Reference) Non-consolidated Financial Results Highlights Performance in FY2015(April 1, 2014 to March 31, 2015) (1)Non-consolidated Results of Operations (for twelve-month period)
(In Japanese yen rounded to million, except for per share figures, percentage figures indicate a change from the previous fiscal year / period)
Net sales Operating income Ordinary income Net income FY2015 1,910,677 13.1% 318,390 28.2% 314,819 24.8% 219,684 26.9%FY2014 1,689,639 25.7% 248,428 196.6% 252,323 221.2% 173,111 75.5%
Net income per share, basic (Yen)
Net income per share, diluted (Yen)
FY2015 281.36 -FY2014 221.71 -
(2) Non-consolidated Financial Position
Total assets Net assets Shareholders’ equity to total assets (%)
Net assets per share (Yen)
FY2015 1,503,879 804,736 53.5% 1,030.68FY2014 1,354,411 628,021 46.4% 804.34
Reference: Shareholders’ equity FY2015: 804,736 million yen FY2014: 628,021 million yen
*The status of the implementation of the annual audit This earnings report is exempt from audit procedure based upon of the Financial Instruments and Exchange Act. It is under the audit procedure process at the time of disclosure of this report.
*Proper use of projection of operating results, and other information The performance projections were based on the information available as of the date when this document was released. Therefore, actual results may differ considerably due to various factors that might occur in the future.Please refer to page 3 in the attachments for assumptions used for the performance projection and other notes.
- 1 -
Index of the attachments
1. Analysis of Operating and Financial Results ............................................................................... 2
(1) Analysis of Operating Results................................................................................................................. 2
(2) Analysis of Financial Results .................................................................................................................. 4
(3) Basic Policy Regarding the Distribution of Profits ............................................................................... 4
2. Management Policies ...................................................................................................................... 5
(1) Basic Management Policies ..................................................................................................................... 5
(2) Issues That Must Be Addressed .............................................................................................................. 5
3. Basic policy about the adoption of Accounting standards .......................................................... 6
4. Consolidated Financial Statements ............................................................................................... 7
(1) Consolidated Balance Sheet .................................................................................................................... 7
(2) Consolidated Statements of (Comprehensive) Income ......................................................................... 9
Consolidated Statements of Income (for twelve-month period) ..............................................................................9
Consolidated Statements of Comprehensive Income (for twelve-month period).................................................10
(3) Consolidated Statements of Changes in Net Assets..............................................................................11
(4) Consolidated Statements of Cash Flows .............................................................................................. 13
(5) Notes to Consolidated Financial Statements ....................................................................................... 15
(Accounting Change) ................................................................................................................................................15
(Consolidated Balance Sheet) ...................................................................................................................................15
(Consolidated Statements of income).......................................................................................................................15
(Segment Information)..............................................................................................................................................16
(Per Share information)............................................................................................................................................18
(Subsequent event) ....................................................................................................................................................18
5. Non-consolidated Financial Statements...................................................................................... 19
(1) Non-consolidated Balance Sheet........................................................................................................... 19
(2) Non-consolidated Statements of Income (for twelve-month period) ................................................. 22
(3) Non-consolidated Statements of Changes in Net Assets ..................................................................... 23

- 2 -
1. Analysis of Operating and Financial Results
(1) Analysis of Operating Results
1) Operating Results for the Current Period under Review
The Japanese economy in the period under review, although still under the impact of the consumption tax rate increase, displayed a mild recovery centered on improving corporate earnings. On a global scale, the world economy showed signs of a moderate upturn driven by the U.S. economy despite weak growth in Europe and in the emerging economies including China.
In this environment, the FHI Group worked on a new stage of raising the Group’s competitive strength and maintaining its business platforms, implemented the mid-term management vision “Prominence 2020” aimed at the Group’s sustained growth and development, and engaged in efforts to realize growth strategies with the automotive operations “Subaru” at the core.
In the period under review, the U.S. market, a key market of FHI, was the driving force of global sales continuing from the previous fiscal year, taking Subaru unit sales to the highest result on record. With the sustained popularity of the Forester, the Group succeeded in resonating strongly with customers’ wishes and achieved steady results through the sales launches of new models comprised of the Legacy, Outback, Levorg, and WRX, and the introduction of models equipped with the driving assist system EyeSight (ver. 3) with its further advanced preventive safety and driving support functions. Moreover, in order to resolve the waiting times encountered by customers, efforts were made to increase and strengthen capacities at vehicle assembly plants in Japan and overseas.
Based on the foregoing, consolidated results for the period under review were as follows. Net sales increased ¥469.8 billion (19.5%) compared with the previous fiscal year to ¥2,877.9 billion,
thanks to higher automobile unit sales and higher sales revenues owing to foreign exchange rate fluctuations.
Regarding the profit, operating income increased ¥96.6 billion (29.6%) compared with the previous fiscal year to ¥423.0 billion, consistent with higher sales. Ordinary income increased ¥79.2 billion (25.2%) compared with the previous fiscal year to ¥393.6 billion. Net income increased ¥55.3 billion (26.7%) compared with the previous fiscal year to ¥261.9 billion.
Results by Business Segment
(Automobile Division)
As to overall automobile demand in Japan in the period under review, compared with the previous fiscal year, passenger cars decreased 8.9% and minicars decreased 3.9% mainly due to the demand backlash after the consumption tax rate increase at the end of the previous fiscal year. As a result, overall automobile unit sales in Japan were 5.297 million units (a decrease of 6.9% compared with the previous fiscal year).
Amid this overall demand trend, unit sales of Subaru passenger cars in Japan increased 2 thousand (1.4%) units compared with the previous fiscal year to 128 thousand units thanks to favorable sales of new models centered on the Levorg launched this fiscal year. Meanwhile, unit sales of minicars decreased 21 thousand (37.1%) units compared with the previous fiscal year to 35 thousand units. This was mainly due to the effects of the demand backlash after the consumption tax rate increase as well as intensified competition caused by car manufacturers’ new model launches. As a result, automobile unit sales in Japan decreased 19 thousand (10.4%) units compared with the previous fiscal year to 163 thousand units.
Overseas total unit sales increased 104 thousand (16.2%) units compared with the previous fiscal year to 748 thousand units. In addition to favorable conditions surrounding sales of the Forester as well as the all-new Legacy and Outback in North America, the key market of FHI, the all-new WRX contributed to higher unit sales.
By region, sales in North America increased 92 thousand (19.3%) units from the previous fiscal year to 570 thousand units, sales in Europe including Russia remained unchanged from the previous fiscal year at 47 thousand units, sales in China increased 9 thousand (20.1%) units from the previous fiscal year to 54 thousand units, sales in Australia decreased 1 thousand (1.6%) units from the previous fiscal year to 39 thousand units, and sales in other areas increased 4 thousand (10.4%) units from the previous fiscal year to 38 thousand units.

- 3 -
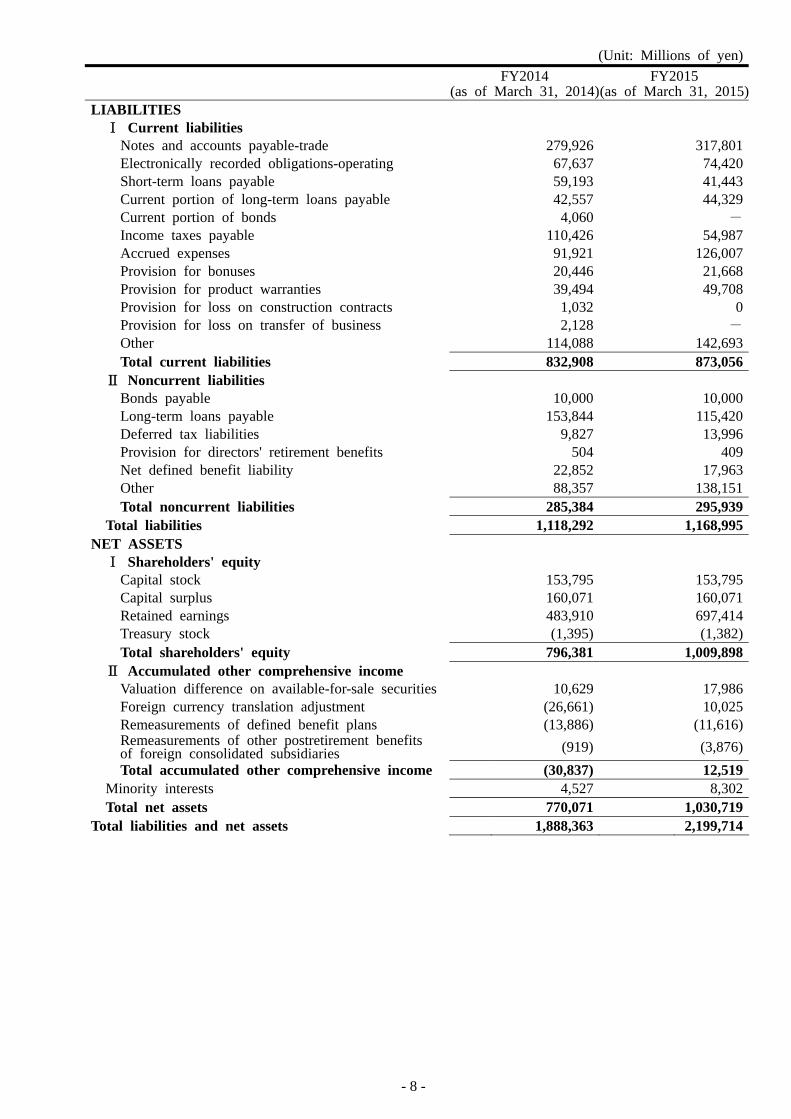
Combined domestic and overseas unit sales therefore increased 86 thousand (10.4%) units compared with the previous fiscal year to a historical high of 911 thousand units. The net sales for the overall Automobile Division, affected also by foreign exchange rate fluctuations, increased ¥452.4 billion (20.1%) compared with the previous fiscal year to ¥2,699.0 billion. Segment income also increased ¥91.9 billion (29.7%) compared with the previous fiscal year to ¥400.9 billion.
(Aerospace Division)
Sales of products to the Ministry of Defense saw net sales increase compared with the previous fiscal year thanks to higher sales of the transport aircraft C-2. Moreover, sales to the commercial sector increased compared with the previous fiscal year thanks to factors such as higher sales revenues owing to foreign exchange rate fluctuations and higher unit production of Boeing 787.
As a result, overall net sales increased ¥18.4 billion (14.8%) compared with the previous fiscal year to ¥142.8 billion. Segment income also increased ¥4.8 billion (33.7%) compared with the previous fiscal year to ¥18.9 billion.
(Industrial Products Division)
Net sales decreased ¥0.7 billion (2.5%) compared with the previous fiscal year to ¥29.0 billion as a net result of increased sales of engines for leisure equipment and general-purpose in North America and decreased sales of general-purpose engines in Europe. Segment income increased ¥0.1 billion (23.3%) compared with the previous fiscal year to ¥0.8 billion.
(Other Businesses)
Net sales decreased ¥0.2 billion (2.5%) compared with the previous fiscal year to ¥7.1 billion. Segment income also decreased ¥0.2 billion (10.2%) compared with the previous fiscal year to ¥1.9 billion.
2) Forecast for the Fiscal 2016
For the fiscal year ending March 2016, FHI plans to further expand sales in overseas market centered on the North America, taking automobile unit sales to an all-time high. Based on this outlook, full-year consolidated net sales are projected to mark a historical high of ¥3,030.0 billion. Moreover, consolidated income, reflecting the effects from foreign exchange rate fluctuations, increased automobile unit sales, and cost reduction in spite of a rise in experiment and research expenses and other expenses such as SG&A, is expected to post new historical records at all levels, with operating income of ¥503.0 billion, ordinary income of ¥495.0 billion, and net income attributable to shareholders of the parent company of ¥337.0 billion.
The projections of full-year consolidated results are based on assumed foreign exchange rates of ¥118/US$ (previously ¥108/US$) and ¥125/EUR (previously ¥140/EUR).
(Consolidated forecast for the full fiscal year)
Net sales ¥3,030.0 billion (up 5.3% year-on-year) Operating income ¥503.0 billion (up 18.9% year-on-year) Ordinary income ¥495.0 billion (up 25.7% year-on-year) Net income attributable to owners of parent ¥337.0 billion (up 28.7% year-on-year)

- 4 -
(2) Analysis of Financial Results
1) Assets, Liabilities, and Net Assets
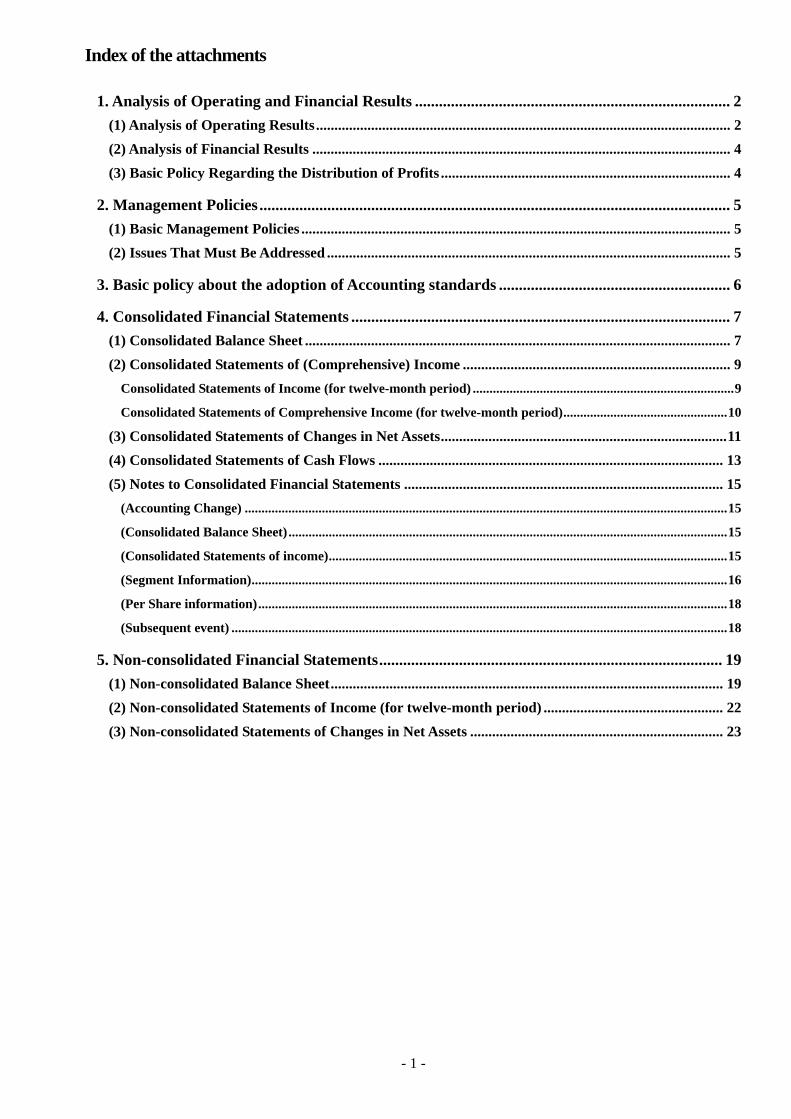
Total assets increased ¥311.4 billion compared with the end of the previous fiscal year to ¥2,199.7 billion. Main factors included a ¥88.7 billion increase in combined funds on hand comprised of cash, deposits, and short-term investment securities, a ¥43.8 billion increase in merchandise and finished goods, and a ¥53.9 billion increase in property, plant, and equipment.
Liabilities increased ¥50.7 billion compared with the end of the previous fiscal year to ¥1,169.0 billion. Main factors included a ¥44.7 billion increase in trade accounts payable comprised of notes and accounts payable-trade and electronically recorded obligations, a ¥34.1 billion increase in accrued expenses, and a ¥38.4 billion decrease in long-term loans payable.
Net assets increased ¥260.6 billion compared with the end of the previous fiscal year to ¥1,030.7 billion. Main factors included a ¥213.5 billion increase in retained earnings from net income recognized for the current fiscal year.
2) Cash Flow
Cash and cash equivalents (hereinafter “Cash”) at the end of the period under review totaled ¥612.1 billion.
(Net cash provided by operating activities) Net cash provided by operating activities was ¥311.5 billion (compared with ¥313.0 billion provided by
operating activities in the previous fiscal year). Main factors included ¥392.2 billion in income before income taxes and ¥193.1 billion in income taxes paid.
(Net cash used in investment activities) Net cash used in investment activities was ¥172.8 billion (compared with ¥33.9 billion used in
investment activities in the previous fiscal year). Main factors included ¥25.5 billion in expenditures for the purchase of short-term investment securities (net basis against proceeds from sales of short-term investment securities) and ¥113.6 billion in expenditures for the purchase of property, plant and equipment as well as intangible assets (net basis against proceeds from sales of property, plant and equipment).
(Net cash used in financing activities) Net cash used in financing activities was ¥110.5 billion (compared with ¥63.0 billion used in financing
activities in the previous fiscal year). Main factors included ¥36.7 billion in repayment of long-term loans payable (net basis against proceeds from long-term loans payable) and ¥49.9 billion in expenditures for cash dividends paid.
(3) Basic Policy Regarding the Distribution of Profits
FHI treats shareholder interests as a vital management issue and applies a results-linked concept that considers each fiscal year’s earnings, investment plans, business environments, is committed to sustained dividend payment. Moreover, dividend payments for each fiscal year are determined with consideration of various circumstances predicated on a 20–40% standard range for the consolidated dividend payout ratio.
It is proposed to distribute a year-end dividend of ¥37.0 per share for the current fiscal year, which is ¥6.0 higher than the previous projection. As a result, including the interim dividend of ¥31.0 per share already distributed, this raises the per-share dividend for the full fiscal year by ¥15.0 compared with the previous fiscal year to ¥68.0.
Forecasted dividend amounts for the next fiscal year are undecided at this time.

- 5 -
2. Management Policies
(1) Basic Management Policies
As there has been no significant change from the details announced in the Consolidated Financial Results for the Year Ended March 31, 2011 (released on May 10, 2011), the disclosure of this part is omitted.
The relevant consolidated financial results are available for viewing at the following URL. (Fuji Heavy Industries company website) http://www.fhi.co.jp/english/ir/index.html (Japan Exchange Group website (for the search of information on listed companies)) http://www.jpx.co.jp/english/listing/co-search/index.html
(2) Issues That Must Be Addressed
The FHI Group worked on a new stage of raising the Group’s competitive strength and maintaining its business platforms and, in May 2014, announced the mid-term management vision “Prominence 2020” aimed at the Group’s sustained growth and development. “Prominence 2020” defines that the shape that the FHI Group aspires to attain by 2020 as “a company
not big in size but a high quality company with distinctive strength”, aiming to become a company that achieves an overwhelming brand power so as to be appreciated as “the number one for customer trust” and attains the industry’s top-flight profit margins. In order to realize this shape, the Group is engaging in specific efforts concentrated on two areas of activity, firstly, “Enhancing the Subaru brand” to further promote high-added value business management, and secondly, “Building a strong business structure” to increase resilience against fluctuations in the business environment and ensure sustainable growth by bringing to bear the characteristics obtainable only through the distinctive operations of Subaru.
The Group will in all of its business operations continue to make all-out efforts at resolving the following issues, based on the guiding principle entitled “Confidence in Motion”.
(Production capacity enhancement) In order to create production frameworks to support favorable sales centered on North America, the
Group, in fiscal year 2014, made investments in capacity increases comprised of 30 thousand units at the U.S. production site, Subaru of Indiana Automotive Inc. (SIA), and 29 thousand units at the domestic production site, Gunma plant, for a total of 59 thousand units, raising the combined domestic and overseas production capacities to a total of 829 thousand units. Moreover, in fiscal year 2016 a further capacity increase of 194 thousand units will be made at SIA for a combined domestic and overseas production capacity projected at 1,026 thousand units. At the same time, the production of the existing Legacy and Outback will be increased at SIA along with plans calling for the production start of the Impreza followed by a New North American SUV. Through these and other measures, every effort will be made to deliver Subaru cars to the customers around the world waiting for their car.
(Action in response to sales expansion) Together with maintaining strong sales in the U.S., a key market of Subaru, the Group will implement
measures to further increase the Subaru fan-base in individual markets with their regional differences in the conditions surrounding automobile sales, specifically in Japan but also in China, Russia, and Europe, among others. Moreover, in order to provide the many new Subaru customers with driving safety and win first-time buyers as repeat customers, centered on the U.S. and Japan, the Group will work to strengthen its service frameworks and continue enhancing its service offerings for customers. Based on these measures, the Group plans to reach global sales of 928 thousand units in fiscal year 2015.
(Proliferation of the Subaru-distinctive products) As to products, in fiscal year 2016, the Group plans to introduce new models using a newly-designed
platform, the “Subaru Global Platform”, in further pursuit of the “Enjoyment and Peace of Mind” that make up the identity of Subaru cars. With regard to safety features, the Group will aim the position as “The number one brand for overall safety” and firmly maintain top-class safety ratings by independent

- 6 -
institutions in the U.S., Japan and Europe. Especially, the Group will further advance the driving assist system “Eyesight” with an eye to the future automated driving system for expressways. Meanwhile, in relation to environmental measures, in order to accommodate the environmental regulations of countries worldwide, specifically the ZEV regulations of the U.S., the Group will move forward with environmental responses based on internal-combustion engines, and, through the active use of the alliance with Toyota group, advance the development of plug-in hybrid vehicles (PHV). In order to accommodate increasingly severe environmental regulations, the Group will advance its research into the deployment of electroactuation and keep aiming at the top level of environmental performance. Through these efforts, the Group will continue to work for the proliferation of products conceived in the pursuit of the safety and environmental soundness that are characteristics of Subaru.
(Human resources development and reform of organization structures and corporate culture) The Group regards human resources development and the reform of organization structures and
corporate culture as essential for supporting sustained growth. Priority initiatives in human resources development include the development of leadership strata capable of opening up the future alongside young and mid-level employee strata capable of overcoming obstacles, as well as the creation of frameworks capable of effectively deploying diverse human resources. Through these efforts, the Group will create a corporate culture that values a sense of challenge, individuality, and creative power. In the same vein, the Group regards promoting the active career participation of female employees as an important issue, and, through career building support and by helping reconciliation of family life and work, aims to become a company where conditions allow female employees to work at their full potential.
(CSR activities) Based on the management principle of the Group of aiming to be “a compelling company with strong
market presence”, the Group looks to implement CSR activities anchored in its management strategy and aims to provide the value that is encapsulated in “Enjoyment and Peace of Mind” to our stakeholders, specifically shareholders and customers. Moreover, the Group aims to contribute to achieving a sustainable society by incorporating into its management strategy the wishes and opinions conveyed to the Group from stakeholders. Notably, in order to strengthen the corporate governance frameworks of the Group and with a view to further heightening management transparency, it is planned to propose at the 84th Ordinary General Meeting of Shareholders to increase the number of outside directors and outside auditors along with proposals for the appointment of directors and auditors.
3. Basic policy about the adoption of Accounting standards The consolidated financial statements of the group are prepared in accordance with Japanese GAAP.
The Group will consider its future adoption of International Financial Reporting Standards (IFRS), observing the trend of the adoption among Japanese companies.

- 7 -
4. Consolidated Financial Statements
(1) Consolidated Balance Sheet
(Unit: Millions of yen)
FY2014 (as of March 31, 2014)
FY2015 (as of March 31, 2015)
ASSETS Ⅰ Current assets Cash and deposits 351,125 228,821 Notes and accounts receivable-trade 181,646 164,540 Lease investment assets 23,633 24,098 Short-term investment securities 233,766 444,737 Merchandise and finished goods 159,536 203,347 Work in process 51,659 52,734 Raw materials and supplies 33,008 39,569 Deferred tax assets 64,214 78,789 Short-term loans receivable 122,681 157,070 Other 53,375 80,796 Allowance for doubtful accounts (862) (1,233) Total current assets 1,273,781 1,473,268 Ⅱ Noncurrent assets 1. Property, plant and equipment Buildings and structures, net 114,810 128,225 Machinery, equipment and vehicles, net 113,519 130,433 Land 175,808 177,075 Vehicles and equipment on operating leases, net 11,512 8,765 Construction in progress 24,116 28,611 Other, net 21,048 41,588 Total property, plant and equipment 460,813 514,697 2. Intangible assets Other 14,712 16,850 Total intangible assets 14,712 16,850 3. Investments and other assets Investment securities 76,788 111,558 Net defined benefit asset 1,222 3,659 Deferred tax assets 18,332 13,113 Other 76,312 99,648 Allowance for doubtful accounts (33,597) (33,079) Total investments and other assets 139,057 194,899 Total noncurrent assets 614,582 726,446 Total assets 1,888,363 2,199,714
- 8 -
(Unit: Millions of yen)
FY2014 (as of March 31, 2014)
FY2015 (as of March 31, 2015)
LIABILITIES Ⅰ Current liabilities Notes and accounts payable-trade 279,926 317,801 Electronically recorded obligations-operating 67,637 74,420 Short-term loans payable 59,193 41,443 Current portion of long-term loans payable 42,557 44,329 Current portion of bonds 4,060 - Income taxes payable 110,426 54,987 Accrued expenses 91,921 126,007 Provision for bonuses 20,446 21,668 Provision for product warranties 39,494 49,708 Provision for loss on construction contracts 1,032 0 Provision for loss on transfer of business 2,128 - Other 114,088 142,693 Total current liabilities 832,908 873,056 Ⅱ Noncurrent liabilities Bonds payable 10,000 10,000 Long-term loans payable 153,844 115,420 Deferred tax liabilities 9,827 13,996 Provision for directors' retirement benefits 504 409 Net defined benefit liability 22,852 17,963 Other 88,357 138,151 Total noncurrent liabilities 285,384 295,939 Total liabilities 1,118,292 1,168,995NET ASSETS Ⅰ Shareholders' equity Capital stock 153,795 153,795 Capital surplus 160,071 160,071 Retained earnings 483,910 697,414 Treasury stock (1,395) (1,382) Total shareholders' equity 796,381 1,009,898 Ⅱ Accumulated other comprehensive income Valuation difference on available-for-sale securities 10,629 17,986 Foreign currency translation adjustment (26,661) 10,025 Remeasurements of defined benefit plans (13,886) (11,616) Remeasurements of other postretirement benefits of foreign consolidated subsidiaries (919) (3,876)
Total accumulated other comprehensive income (30,837) 12,519 Minority interests 4,527 8,302 Total net assets 770,071 1,030,719Total liabilities and net assets 1,888,363 2,199,714

- 9 -
(2) Consolidated Statements of (Comprehensive) Income
Consolidated Statements of Income (for twelve-month period)
(Unit: Millions of yen)
FY2014
(April 1, 2013 to March 31, 2014)
FY2015 (April 1,2014 to March 31, 2015)
Ⅰ Net sales 2,408,129 2,877,913Ⅱ Cost of sales 1,728,271 2,017,490Gross profit 679,858 860,423Ⅲ Selling, general and administrative expenses 353,369 437,378Operating income 326,489 423,045Ⅳ Non-operating income Interest income 1,689 2,320 Dividends income 1,225 1,807 Equity in earnings of affiliates 320 499 Real estate rent 541 532 Gain on valuation of derivatives 7,414 - Other 1,467 1,803 Total non-operating income 12,656 6,961Ⅴ Non-operating expenses Interest expenses 2,804 2,903 Foreign exchange losses 16,924 24,277 Loss on valuation of derivatives - 2,003 Depreciation 1,024 985 Other 3,956 6,190 Total non-operating expenses 24,708 36,358Ordinary income 314,437 393,648Ⅵ Extraordinary income Gain on sales of noncurrent assets 712 638 Gain on sales of investment securities 47,333 1,052 Insurance income 10 1,355 Other 966 833 Total extraordinary income 49,021 3,878Ⅶ Extraordinary loss Loss on sales and retirement of noncurrent assets 3,408 3,943 Provision of allowance for doubtful accounts 29,624 - Other 1,561 1,377 Total extraordinary losses 34,593 5,320Income before income taxes and minority interests 328,865 392,206Income taxes-current 134,315 133,256Income taxes-deferred (13,435) (6,199)Total income taxes 120,880 127,057Income before minority interest 207,985 265,149Minority interests in income 1,369 3,276Net income 206,616 261,873

- 10 -
Consolidated Statements of Comprehensive Income (for twelve-month period)
(Unit: Millions of yen)
FY2014
(April 1, 2013 to March 31, 2014)
FY2015 (April 1,2014 to March 31, 2015)
Income before minority interest 207,985 265,149Other comprehensive income Valuation difference on available-for-sale securities (17,253) 7,357 Foreign currency translation adjustment 19,855 37,321 Remeasurements of defined benefit plans - 2,270 Remeasurements of other postretirement benefits of foreign consolidated subsidiaries - (2,957) Share of other comprehensive income of associates accounted for using equity method 170 131
Total other comprehensive income 2,772 44,122Comprehensive income 210,757 309,271Comprehensive income attributable to Comprehensive income attributable to owners of the parent 209,150 305,229 Comprehensive income attributable to minority interests 1,607 4,042

- 11 -
(3) Consolidated Statements of Changes in Net Assets
FY 2014 (April 1, 2013 to March 31, 2014) (Unit: Millions of yen)
Shareholders' equity
Capital stock Capital surplus Retained earnings Treasury stock Total shareholders' equity
Balance at the beginning of current period
153,795 160,071 301,357 (1,292) 613,931
Cumulative effects of changes in accounting policies
- - - - -
Restated balance 153,795 160,071 301,357 (1,292) 613,931
Changes of items during the period
Dividends from surplus - - (23,424) - (23,424)
Net income - - 206,616 - 206,616
Purchase of treasury stock - - - (103) (103)
Disposal of treasury stock - 0 - 0 0
Other - - (639) - (639)
Net changes of items other than shareholders’ equity - - - - -
Total changes of items during the period - 0 182,553 (103) 182,450
Balance at the end of current period
153,795 160,071 483,910 (1,395) 796,381
Accumulated other comprehensive income
Valuation
difference on available-for-sale
securities
Foreign currency
translation adjustment
Remeasurements of defined benefit
plans
Remeasurements of other postretirement benefits of foreign
consolidated subsidiaries
Total accumulated
other comprehensive
income
Minority interests
Total net assets
Balance at the beginning of current period
27,882 (46,448) - - (18,566) 1,448 596,813
Cumulative effects of changes in accounting policies
- - - - - - -
Restated balance 27,882 (46,448) - - (18,566) 1,448 596,813
Changes of items during the period
Dividends from surplus - - - - - - (23,424)
Net income - - - - - - 206,616
Purchase of treasury stock - - - - - - (103)
Disposal of treasury stock - - - - - - 0
Other - - - - - - (639)
Net changes of items other than shareholders' equity (17,253) 19,787 (13,886) (919) (12,271) 3,079 (9,192)
Total changes of items during the period (17,253) 19,787 (13,886) (919) (12,271) 3,079 173,258
Balance at the end of current period 10,629 (26,661) (13,886) (919) (30,837) 4,527 770,071

- 12 -
FY 2015 (April 1, 2014 to March 31, 2015) (Unit: Millions of yen)
Shareholders' equity
Capital stock Capital surplus Retained earnings Treasury stock Total shareholders' equity
Balance at the beginning of current period
153,795 160,071 483,910 (1,395) 796,381
Cumulative effects of changes in accounting policies
- - 1,385 - 1,385
Restated balance 153,795 160,071 485,295 (1,395) 797,766
Changes of items during the period
Dividends from surplus - - (49,970) - (49,970)
Net income - - 261,873 - 261,873
Purchase of treasury stock - - - (22) (22)
Disposal of treasury stock - - - - -
Other - - 216 35 251
Net changes of items other than shareholders' equity - - - - -
Total changes of items during the period - - 212,119 13 212,132
Balance at the end of current period 153,795 160,071 697,414 (1,382) 1,009,898
Accumulated other comprehensive income
Valuation
difference on available-for-
sale securities
Foreign currency
translation adjustment
Remeasurements of defined benefit
plans
Remeasurements of other postretirement benefits of foreign
consolidated subsidiaries
Total accumulated
other comprehensive
income
Minority interests
Total net assets
Balance at the beginning of current period
10,629 (26,661) (13,886) (919) (30,837) 4,527 770,071
Cumulative effects of changes in accounting policies
- - - - - - 1,385
Restated balance 10,629 (26,661) (13,886) (919) (30,837) 4,527 771,456
Changes of items during the period
Dividends from surplus - - - - - - (49,970)
Net income - - - - - - 261,873
Purchase of treasury stock - - - - - - (22)
Disposal of treasury stock - - - - - - -
Other - - - - - - 251
Net changes of items other than shareholders' equity 7,357 36,686 2,270 (2,957) 43,356 3,775 47,131
Total changes of items during the period 7,357 36,686 2,270 (2,957) 43,356 3,775 259,263
Balance at the end of current period
17,986 10,025 (11,616) (3,876) 12,519 8,302 1,030,719

- 13 -
(4) Consolidated Statements of Cash Flows
(Unit: Millions of yen)
FY2014
(April 1, 2013 to March 31, 2014)
FY2015 (April 1,2014 to March 31, 2015)
Ⅰ Net cash provided by (used in) operating activities
Income (loss) before income taxes 328,865 392,206
Depreciation and amortization 61,486 71,821
Increase (decrease) in allowance for doubtful accounts 29,512 (146)
Interest and dividends income (2,914) (4,127)
Interest expenses 2,804 2,903
Loss (gain) on sales and retirement of noncurrent assets 2,696 3,305
Loss (gain) on sales and valuation of investment securities (47,149) (953)
Decrease (increase) in operating loans receivable (25,478) (23,112)
Decrease (increase) in notes and accounts receivable-trade (49,129) 19,283
Decrease (increase) in inventories 16,095 (27,180)
Increase (decrease) in notes and accounts payable-trade 39,814 38,223
Other, net (10,304) 30,920
Subtotal 346,298 503,143
Interest and dividends income received 2,936 4,361
Interest expenses paid (2,742) (2,839)
Income taxes paid (33,468) (193,122)
Net cash provided by (used in) operating activities 313,024 311,543
ⅡNet cash provided by (used in) investing activities
Net decrease (increase) in time deposits (7,215) (11,944)
Purchase of short-term investment securities (12,408) (43,424)
Proceeds from sales of short-term investment securities 19,237 17,905
Purchase of non-current assets (72,855) (115,173)
Proceeds from sales of non-current assets 1,643 1,540
Purchase of investment securities (28,687) (47,031)
Proceeds from sales of investment securities 65,344 26,364
Payments of loans receivable (95,589) (104,891)
Collection of loans receivable 97,409 108,065
Other, net (782) (4,191)
Net cash provided by (used in) investing activities (33,903) (172,780)

- 14 -
FY2014
(April 1, 2013 to March 31, 2014)
FY2015 (April 1,2014 to March 31, 2015)
Ⅲ Net cash provided by (used in) financing activities
Net increase (decrease) in short-term loans payable (2,893) (18,811)
Proceeds from long-term loans payable 8,995 6,190
Repayments of long-term loans payable (45,893) (42,858)
Redemption of bonds (10) (4,060)
Cash dividends paid (23,350) (49,887)
Proceeds from stock issuance to minority shareholders 1,280 -
Other, net (1,140) (1,120)
Net cash provided by (used in) financing activities (63,011) (110,546)
Ⅳ Effect of exchange rate change on cash and cash equivalents 12,691 25,998
Ⅴ Net increase (decrease) in cash and cash equivalents 228,801 54,215
Ⅵ Cash and cash equivalents at beginning of period 328,947 557,870
Ⅶ Increase (decrease) in cash and cash equivalents resulting from change of scope of consolidation 122 -
Ⅷ Cash and cash equivalents at end of period 557,870 612,085

- 15 -
(5) Notes to Consolidated Financial Statements
(Accounting Change)
The Company has applied Accounting Standard for Retirement Benefits (ASBJ Statement No. 26, May 17, 2012 (hereinafter, the “Statement No.26”)) and Guidance on Accounting Standard for Retirement Benefits (ASBJ Guidance No. 25, May 17, 2012 (hereinafter, the “Guidance No.25”)) from the first quarter of fiscal year 2015 in accordance with the article 35 of the Statement No.26 and the article 67 of the Guidance No.25.
The Company has reviewed the method of calculating retirement benefit obligations and current service costs and has changed the method of attributing expected benefits to periods from a straight-line basis to a benefit formula basis, and the method of determination of discount rate from the method using discount rate based on the average remaining service period for employees to the method using a single weighted average discount rate reflecting the expected payment periods and the amounts for each expected payment period.
In accordance with the article 37 of the Statement No.26, the effect of changes in the calculation method of retirement benefit obligations and current service costs has been recognized in retained earnings at the beginning of the first quarter of fiscal year 2015.
The effect of application of the Statement No.26 and the Guidance No.25 is not material. In addition, the influence to Per share information refers to the concerned note.
(Consolidated Balance Sheet)
Accumulated depreciation on property, plant and equipment
FY2014 (as of March 31, 2014)
FY2015 (as of March 31, 2015)
Accumulated depreciation on property, plantand equipment 817,421million yen 882,752million yen
(Consolidated Statements of income)
1 Research and development cost included in general and administrative expenses and cost of sales
FY2014
(April 1, 2013 to March 31, 2014)
FY2015 (April 1, 2014 to March 31, 2015)
Research and development cost 60,092million yen 83,535million yen
2 Extraordinary income
FY2014 (April 1, 2013 to March 31, 2014) Gain on sales of investment securities includes 47,118 million yen, the profit related to the sales of stock of Polaris
Industries Inc. owned by FHI 3 Extraordinary loss
FY2014 (April 1, 2013 to March 31, 2014)
Allowances for doubtful accounts, the loss is associated with initial investment fees related to the AH-64D combat helicopter for the Japan Ministry of Defense as a precaution for the case that the ruling is upheld.

- 16 -
(Segment Information)
1. Outline of business segment
The business segments the Company reports are the business units for which the Company is able to obtain respective financial information separately in order for the Board of Directors to conduct periodic investigation to determine distribution of management resources and evaluate their business result.
The Company places Automobile at the center of the whole businesses, and introduces an internal company system into Aerospace, Industrial products and divisions. This framework makes clearer the responsibility of each division and accelerates business execution. The Company manages the subsidiaries on the basis of this classification. Therefore, the business segments consist of Automobile, Aerospace, Industrial products, and Other which does not belong to any division.
Automobile segment manufactures and sells vehicles and related products. Aerospace segment manufactures aircrafts, parts of space-related devices. Industrial products segment manufactures and sells Robin engines and related products.
2. Method of calculating sales and income(loss), identifiable assets, and other items by business segment reported
Accounting method for business segment reported is almost the same as the accounting method to prepare for consolidated financial statements.
Segment income by business segment reported is calculated based on operating income.
Net sales - Inter-segment are calculated based on current market prices.
- 17 -
3. Information on sales and income(loss) by business segment reported
FY 2014 (April 1, 2013 to March 31, 2014) (Unit: Millions of yen)
Business segment reported
Automobiles AerospaceIndustrial
Products
Sub-
Total
Other
*1 Total
Adjustment
*2
Consolidated
Statement of
income *3
Ⅰ. Net sales (1) Outside customers 2,246,624 124,436 29,776 2,400,836 7,293 2,408,129 - 2,408,129
(2) Inter-segment 3,261 - 567 3,828 14,642 18,470 (18,470) -
Total sales 2,249,885 124,436 30,343 2,404,664 21,935 2,426,599 (18,470) 2,408,129
Segment income 308,973 14,148 632 323,753 2,099 325,852 637 326,489
Identifiable assets by
business segment 1,639,760 182,123 29,692 1,851,575 53,533 1,905,108 (16,745) 1,888,363
Ⅱ. Other items
Depreciation 56,265 3,758 411 60,434 1,052 61,486 - 61,486
Investment to equity-
method affiliates 6 - 520 526 - 526 - 526
Increase of property,
plant and equipment
and intangible assets
90,782 4,074 533 95,389 3,148 98,537 - 98,537
Notes: *1. Other means the category which is not included into any business segment reported. It consists of
real estate lease, etc. *2. Adjustment of segment income refers to elimination of intersegment transaction. *3. Segment income is adjusted on the operating income of the consolidated statements of income.
FY 2015 (April 1, 2014 to March 31, 2015) (Unit: Millions of yen)
Business segment reported
Automobiles AerospaceIndustrial
products
Sub-
Total
Other
*1 Total
Adjustment
*2
Consolidated
Statement of
income *3
Ⅰ. Net sales (1) Outside customers 2,698,974 142,801 29,029 2,870,804 7,109 2,877,913 - 2,877,913
(2) Inter-segment 4,236 - 207 4,443 15,744 20,187 (20,187) -
Total sales 2,703,210 142,801 29,236 2,875,247 22,853 2,898,100 (20,187) 2,877,913
Segment income 400,874 18,912 779 420,565 1,884 422,449 596 423,045
Identifiable assets by
business segment 1,944,178 186,292 32,926 2,163,396 59,735 2,223,131 (23,417) 2,199,714
Ⅱ. Other items
Depreciation 65,342 4,583 429 70,354 1,467 71,821 - 71,821
Investment to equity-
method affiliates 589 - 775 1,364 - 1,364 - 1,364
Increase of property,
plant and equipment
and intangible assets
122,689 4,509 985 128,183 7,163 135,346 - 135,346
Notes: *1. Other means the category which is not included into any business segment reported. It consists of
real estate lease, etc. *2. Adjustment of segment income refers to elimination of intersegment transaction. *3. Segment income is adjusted on the operating income of the consolidated statements of income.
- 18 -
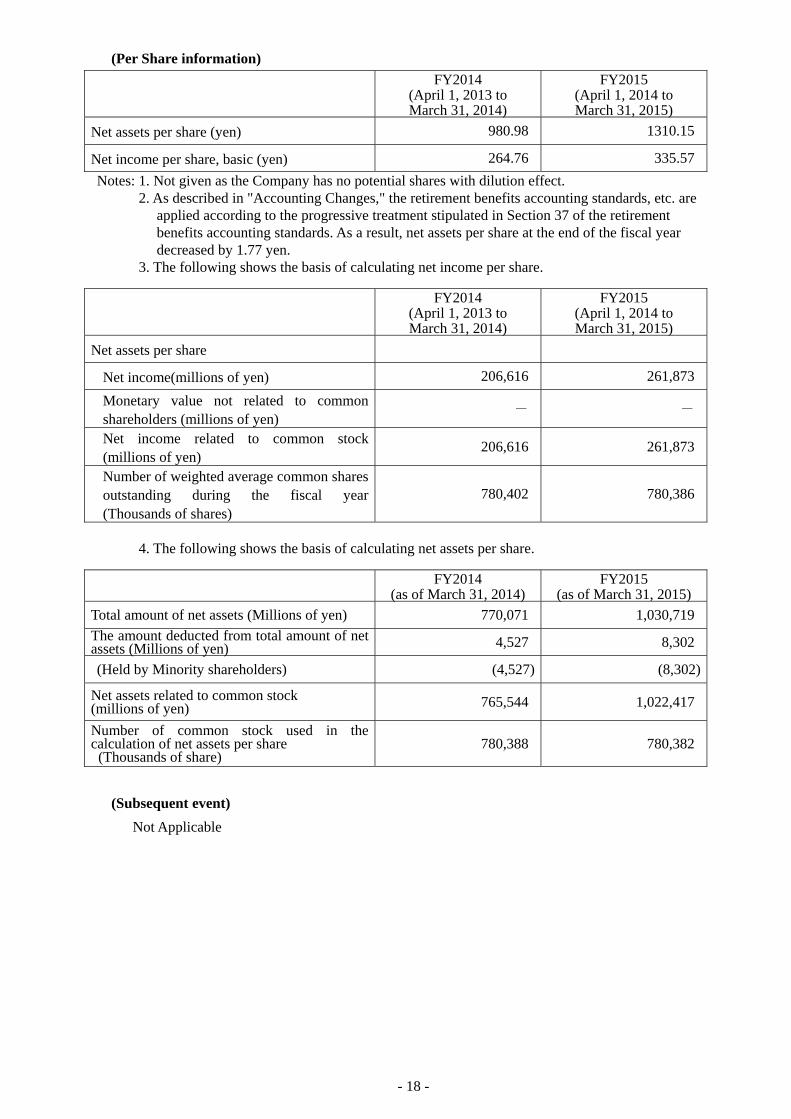
(Per Share information)
FY2014
(April 1, 2013 to March 31, 2014)
FY2015 (April 1, 2014 to March 31, 2015)
Net assets per share (yen) 980.98 1310.15
Net income per share, basic (yen) 264.76 335.57
Notes: 1. Not given as the Company has no potential shares with dilution effect. 2. As described in "Accounting Changes," the retirement benefits accounting standards, etc. are
applied according to the progressive treatment stipulated in Section 37 of the retirement benefits accounting standards. As a result, net assets per share at the end of the fiscal year decreased by 1.77 yen.
3. The following shows the basis of calculating net income per share.
FY2014
(April 1, 2013 to March 31, 2014)
FY2015 (April 1, 2014 to March 31, 2015)
Net assets per share
Net income(millions of yen) 206,616 261,873
Monetary value not related to common shareholders (millions of yen)
- -
Net income related to common stock (millions of yen)
206,616 261,873
Number of weighted average common shares outstanding during the fiscal year (Thousands of shares)
780,402 780,386
4. The following shows the basis of calculating net assets per share.
FY2014 (as of March 31, 2014)
FY2015 (as of March 31, 2015)
Total amount of net assets (Millions of yen) 770,071 1,030,719
The amount deducted from total amount of net assets (Millions of yen) 4,527 8,302
(Held by Minority shareholders) (4,527) (8,302)
Net assets related to common stock (millions of yen) 765,544 1,022,417
Number of common stock used in the calculation of net assets per share (Thousands of share)
780,388 780,382
(Subsequent event)
Not Applicable

- 19 -
5. Non-consolidated Financial Statements
(1) Non-consolidated Balance Sheet
(Unit: Millions of Yen)
FY2014 (as of March 31, 2014)
FY2015 (as of March 31, 2015)
ASSETS Ⅰ Current assets Cash and deposits 206,892 76,241 Accounts receivable-trade 217,065 235,503 Short-term investment securities 169,987 344,982 Merchandise and finished goods 26,086 33,418 Work in process 46,903 47,428 Raw materials and supplies 21,813 19,845 Advance payments-trade 1,350 3,693 Prepaid expenses 1,621 1,851 Deferred tax assets 23,099 22,098 Short-term loans receivable to subsidiaries and affiliates 87,768 99,164 Current portion of long-term loans receivable from subsidiaries and affiliates 16,200 6,700
Deposits paid 18,697 23,740 Accounts receivable-other 27,599 36,547 Other 10,372 27,034 Allowance for doubtful accounts (4,193) (565) Total current assets 871,259 977,679 Ⅱ Noncurrent assets 1. Property, plant and equipment Buildings, net 47,632 48,329 Structures, net 4,949 5,222 Machinery and equipment, net 81,853 90,645 Vehicles, net 1,285 1,462 Tools, furniture and fixtures, net 5,996 6,812 Land 80,374 80,235 Construction in progress 9,192 6,255 Other 717 990 Total property, plant and equipment 231,998 239,950 2. Intangible assets Software 8,345 9,871 Other 1,591 2,023 Total intangible assets 9,936 11,894
- 20 -
(Unit: Millions of Yen)
FY2014 (as of March 31, 2014)
FY2015 (as of March 31, 2015)
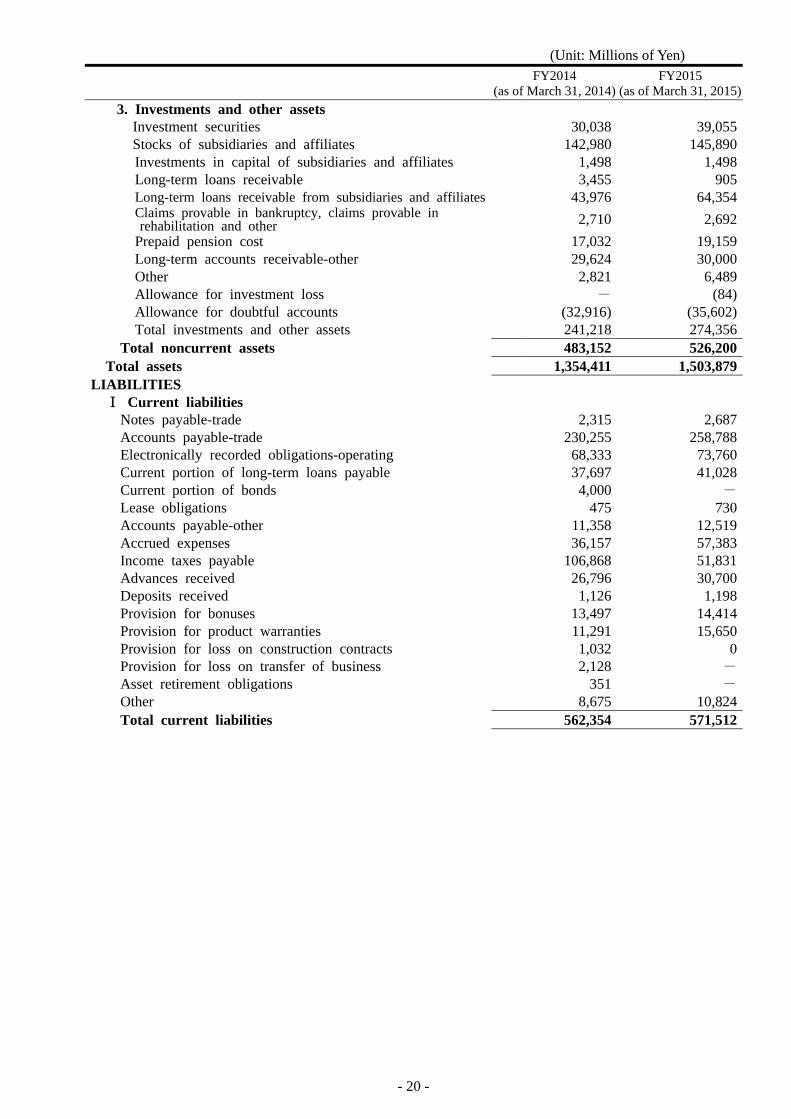
3. Investments and other assets Investment securities 30,038 39,055Stocks of subsidiaries and affiliates 142,980 145,890
Investments in capital of subsidiaries and affiliates 1,498 1,498 Long-term loans receivable 3,455 905 Long-term loans receivable from subsidiaries and affiliates 43,976 64,354 Claims provable in bankruptcy, claims provable in rehabilitation and other 2,710 2,692
Prepaid pension cost 17,032 19,159 Long-term accounts receivable-other 29,624 30,000 Other 2,821 6,489 Allowance for investment loss - (84) Allowance for doubtful accounts (32,916) (35,602) Total investments and other assets 241,218 274,356 Total noncurrent assets 483,152 526,200 Total assets 1,354,411 1,503,879LIABILITIES Ⅰ Current liabilities Notes payable-trade 2,315 2,687 Accounts payable-trade 230,255 258,788 Electronically recorded obligations-operating 68,333 73,760 Current portion of long-term loans payable 37,697 41,028 Current portion of bonds 4,000 - Lease obligations 475 730 Accounts payable-other 11,358 12,519 Accrued expenses 36,157 57,383 Income taxes payable 106,868 51,831 Advances received 26,796 30,700 Deposits received 1,126 1,198 Provision for bonuses 13,497 14,414 Provision for product warranties 11,291 15,650 Provision for loss on construction contracts 1,032 0 Provision for loss on transfer of business 2,128 - Asset retirement obligations 351 - Other 8,675 10,824 Total current liabilities 562,354 571,512
- 21 -
(Unit: Millions of Yen)
FY2014 (as of March 31, 2014)
FY2015 (as of March 31, 2015)
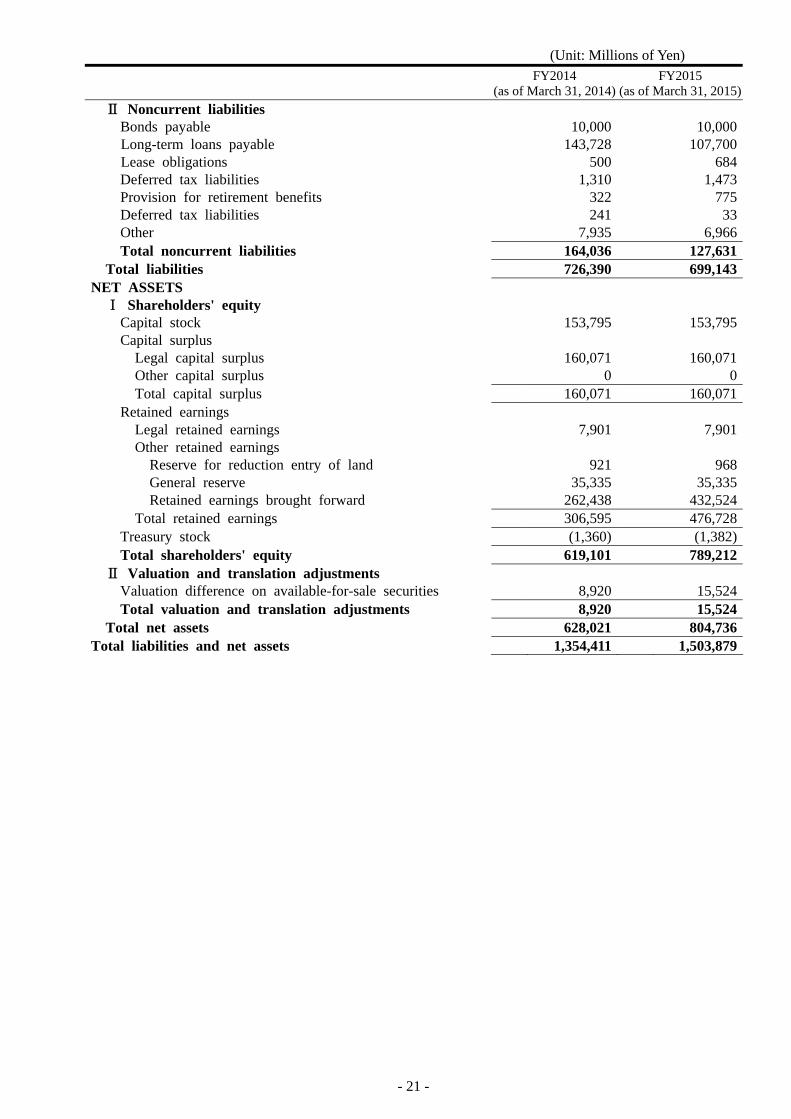
Ⅱ Noncurrent liabilities Bonds payable 10,000 10,000
Long-term loans payable 143,728 107,700Lease obligations 500 684
Deferred tax liabilities 1,310 1,473 Provision for retirement benefits 322 775 Deferred tax liabilities 241 33 Other 7,935 6,966 Total noncurrent liabilities 164,036 127,631 Total liabilities 726,390 699,143NET ASSETS Ⅰ Shareholders' equity Capital stock 153,795 153,795 Capital surplus Legal capital surplus 160,071 160,071 Other capital surplus 0 0 Total capital surplus 160,071 160,071 Retained earnings Legal retained earnings 7,901 7,901 Other retained earnings Reserve for reduction entry of land 921 968 General reserve 35,335 35,335 Retained earnings brought forward 262,438 432,524 Total retained earnings 306,595 476,728 Treasury stock (1,360) (1,382) Total shareholders' equity 619,101 789,212 Ⅱ Valuation and translation adjustments Valuation difference on available-for-sale securities 8,920 15,524 Total valuation and translation adjustments 8,920 15,524 Total net assets 628,021 804,736Total liabilities and net assets 1,354,411 1,503,879

- 22 -
(2) Non-consolidated Statements of Income (for twelve-month period)
(Unit: Millions of Yen)
FY2014
(April 1, 2013 to March 31, 2014)
FY2015 (April 1, 2014 to March 31, 2015)
Ⅰ Net sales 1,689,639 1,910,677Ⅱ Cost of sales 1,285,344 1,405,108Gross profit 404,295 505,570Ⅲ Selling, general and administrative expenses 155,867 187,180Operating income 248,428 318,390Ⅳ Non-operating income Interest income 736 810 Interest on securities 227 338 Dividends income 9,238 11,262 Real estate rent 3,037 2,968 Gain on valuation of derivatives 7,414 - Other 2,046 1,993 Total non-operating income 22,698 17,371Ⅴ Non-operating expenses Interest expenses 1,940 1,428 Depreciation 976 938 Foreign exchange losses 11,513 10,306 Loss on valuation of derivatives - 2,003 Other 4,374 6,267 Total non-operating expenses 18,803 20,942Ordinary income 252,323 314,819Ⅵ Extraordinary income Gain on sales of noncurrent assets 648 282 Gain on sales of investment securities 47,118 22 Reversal of allowance for doubtful accounts 4,655 770 Other 869 833 Total extraordinary income 53,290 1,907Ⅶ Extraordinary loss Loss on sales and retirement of noncurrent assets 2,632 1,844 Provision of allowance for doubtful accounts 29,659 171 Other 1,506 931 Total extraordinary losses 33,797 2,946Income before income taxes 271,816 313,780Income taxes-current 100,687 95,538Income taxes-deferred (1,982) (1,443)Total income taxes 98,705 94,095Net income 173,111 219,684

- 23 -
(3) Non-consolidated Statements of Changes in Net Assets
FY 2014 (April 1, 2013 to March 31, 2014) (Unit: Millions of Yen)
Shareholders' equity
Capital surplus Retained earnings
Other retained earnings Capital stock Capital
reserve
Othercapital surplus
Total capital surplus
Legal retained earnings
Reserve for reduction
entry of land
General reserve
Retained earnings brought forward
Balance at the beginning of current period
153,795 160,071 - 160,071 7,901 813 35,335 112,859
Cumulative effects of changes in accounting policies
- - - - - - - -
Restated balance 153,795 160,071 - 160,071 7,901 813 35,335 112,859
Changes of items during the period
Provision of reserve for reduction entry of land
- - - - - 108 - (108)
Dividends from surplus - - - - - - - (23,424)
Net income - - - - - - - 173,111
Purchase of treasury stock - - - - - - - -
Disposal of treasury stock - - 0 0 - - - -
Net changes of items other than shareholders' equity - - - - - - - -
Total changes of items during the period
- - 0 0 - 108 - 149,579
Balance at the end of current period
153,795 160,071 0 160,071 7,901 921 35,335 262,438
Shareholders' equity Valuation and translation adjustments
Retained earnings
Total retained earnings
Treasury stock
Total shareholders'
equity
Valuation difference on
available-for-sale securities
Total valuation and translation
adjustments
Total net assets
Balance at the beginning of current period
156,908 (1,257) 469,517 26,773 26,773 496,290
Cumulative effects of changes in accounting policies
- - - - - -
Restated balance 156,908 (1,257) 469,517 26,773 26,773 496,290
Changes of items during the period
Provision of reserve for reduction entry of land
- - - - - -
Dividends from surplus (23,424) - (23,424) - - (23,424)
Net income 173,111 - 173,111 - - 173,111
Purchase of treasury stock - (103) (103) - - (103)
Disposal of treasury stock - 0 0 - - 0
Net changes of items other than shareholders' equity - - - (17,853) (17,853) (17,853)
Total changes of items during the period
149,687 (103) 149,584 (17,853) (17,853) 131,731
Balance at the end of current period
306,595 (1,360) 619,101 8,920 8,920 628,021
FY 2015 (April 1, 2014 to March 31, 2015)

- 24 -
(Unit: Millions of Yen)
Shareholders' equity
Capital surplus Retained earnings
Other retained earnings Capital stock Capital
reserve
Other capital surplus
Total capital surplus
Legal retained earnings
Reserve for reduction
entry of land
General reserve
Retained earnings brought forward
Balance at the beginning of current period
153,795 160,071 0 160,071 7,901 921 35,335 262,438
Cumulative effects of changes in accounting policies
- - - - - - - 372
Restated balance 153,795 160,071 0 160,071 7,901 921 35,335 262,810
Changes of items during the period
Provision of reserve for reduction entry of land
- - - - - 47 - -
Dividends from surplus - - - - - - - (49,970)
Net income - - - - - - - 219,684
Purchase of treasury stock - - - - - - - -
Disposal of treasury stock - - - - - - - -
Net changes of items other than shareholders' equity - - - - - - - -
Total changes of items during the period
- - - - - 47 - 169,714
Balance at the end of current period
153,795 160,071 0 160,071 7,901 968 35,335 432,524
Shareholders' equity Valuation and translation adjustments
Retained earnings
Total retained earnings
Treasury stock
Total shareholders'
equity
Valuation difference on
available-for-sale securities
Total valuation and translation
adjustments
Total net assets
Balance at the beginning of current period
306,595 (1,360) 619,101 8,920 8,920 628,021
Cumulative effects of changes in accounting policies
372 - 372 - - 372
Restated balance 306,967 (1,360) 619,473 8,920 8,920 628,393
Changes of items during the period
Provision of reserve for reduction entry of land
47 - 47 - - 47
Dividends from surplus (49,970) - (49,970) - - (49,970)
Net income 219,684 - 219,684 - - 219,684
Purchase of treasury stock - (22) (22) - - (22)
Disposal of treasury stock - - - - - -
Net changes of items other than shareholders' equity - - - 6,604 6,604 6,604
Total changes of items during the period
169,761 (22) 169,739 6,604 6,604 176,343
Balance at the end of current period
476,728 (1,382) 789,212 15,524 15,524 804,736

May 8, 2015Fuji Heavy Industries Ltd.
(Yen in 100 Millions, Units in Thousands)
RESULTS
FYE20142013.4 - 2014.3
Change % Change %
24,081 28,779 4,698 19.5 30,300 1,521 5.3
Japan 6,721 6,529 (192) (2.9) 5,655 (874) (13.4)
Overseas 17,361 22,250 4,890 28.2 24,645 2,395 10.8
3,265 4,230 966 29.6 5,030 800 18.9
13.6 14.7 16.6
3,144 3,936 792 25.2 4,950 1,014 25.7
13.1 13.7 16.3
2,066 2,619 553 26.7 3,370 751 28.7
8.6 9.1 11.1
1,037 827
703 306
124 133
(666) (331)
(232) (135)
Exchange rates JPY/US$ 100/US$ 108/US$ 118/US$
JPY/EUR 133/EUR 140/EUR 125/EUR
Capital expenditures 685 1,107 1,300
Depreciation and amortization 549 648 670
R&D expenses 601 835 970
Interest bearing debts 2,697 2,112 1,800
182 163 (19) (10.4) 144 (19) (11.4)
Passenger Cars 126 128 2 1.4 107 (21) (16.6)
Minicars 55 35 (21) (37.1) 38 3 7.8
643 748 104 16.2 784 36 4.8
North America 478 570 92 19.3 600 30 5.3
Europe 47 47 0 0.5 50 3 6.8
China 45 54 9 20.1 50 (4) (7.7)
Other 74 77 3 4.0 84 7 9.0
825 911 86 10.4 928 18 1.9
813 914 101 12.4 935 21 2.2
Japan 650 708 58 8.9 705 (2) (0.3)
U.S. 164 207 43 26.4 230 23 11.1
Automobile 22,466 26,990 4,524 20.1
Aerospace 1,244 1,428 184 14.8
Industrial Products 298 290 (7) (2.5)
Other 73 71 (2) (2.5)
Automobile 3,090 4,009 919 29.7
Aerospace 141 189 48 33.7
Industrial Products 6 8 1 23.3
Other 21 19 (2) (10.2)Elimination &
Corporate6 6 (0) (6.4)
* Net Income in FYE2016 forecasts is Net Income Attributable to Owners of Parent.* Exchange Rates are the rates used for FHI's non-consolidated sales recording.
* Production in Japan includes production of the 86/FR-S models for Toyota.
Increase in R&D exp
Increase in SG&A exp,etc
Gain on currencyexchangeImprovements on modelmix, etc
Change Factorsin Operating income
Cost reduction effort, etc
Improvements on modelmix, etc
Profit margin (%)
Cost reduction effort, etc
Net sales
Operating income
Ordinary income
Net income
Profit margin (%)
Profit margin (%)
< Reference for FYE2015 Consolidated Financial Results >
FYE20152014.4.1 - 2015.3.31
FYE20162015.4.1 - 2016.3.31
RESULTS FORECASTS
Consolidated unit sales (Japan)
* Consolidated Unit Sales include retail sales of Japanese consolidated dealers, wholesale sales of overseas consolidated distributors, and deliveries from FHI to non-consolidated distributors/dealers.
< Forward-looking statements in this document are based on the information available at the time of the announcement and are subject to various risks anduncertainties that could cause actual results to vary materially. >
Production units total
Consolidated unit sales (Overseas)
Consolidated unit sales total
Net sales bybusiness segment
Operating income bybusiness segment
Increase in SG&A exp,etc
Performance description
Increase in R&D exp
Gain on currencyexchange
- 3rd consecutive year of increases in netsales and all profits.
- 4th consecutive year of increases in net salesand all profits.
- Fiscal year records for consolidated unitsales, net sales and all profits.
- Fiscal year records for consolidated unitsales, net sales and all profits.

FHI Announces Consolidated Financial Results for FYE2015
Tokyo, May 8, 2015 - Fuji Heavy Industries Ltd. (FHI), the manufacturer of Subaru automobiles, today announced its consolidated
financial results for the fiscal year ended March 31, 2015.
< FYE2015 Results: Consolidated Net Sales > Subaru’s consolidated global unit sales rose 10.4% to 911,000 units. While passenger car sales posted an increase led by launches
of new models such as the Levorg wagon and the new generation WRX, unit sales in Japan fell 10.4% to 163,000 units due to a
decrease in mini vehicle sales. Overseas unit sales grew 16.2% to 748,000 units, driven by continued high demand for the Forester
as well as strong sales of new generation models including the Legacy, Outback and WRX.
FHI’s consolidated net sales rose 19.5% to 2,877.9 billion yen due to unit sales growth, foreign exchange gains and other factors.
< FYE2015 Results: Consolidated Profit and Loss > As increases in SG&A and R&D expenses were offset by unit sales growth, exchange rate gains, cost reduction progress and other
factors, operating income rose 29.6% to 423.0 billion yen. Ordinary income grew 25.2% to 393.6 billion yen and net income
increased 26.7% to 261.9 billion yen.
Consolidated unit sales in North America reached a record high*1 for the sixth consecutive year. Consolidated global unit sales,
consolidated overseas unit sales, net sales and all profit figures posted all-time records*1 for the third consecutive year.
Based on the full-year business results, FHI will raise the year-end dividend from the previous projection by 6 yen to 37 yen per share.
Combined with the interim dividend of 31 yen per share, the annual dividend for FYE2015 will be 68 yen per share, an increase of 15
yen from 53 yen of the previous year.
< FYE2016 Forecasts > In light of further growth in North America and other regions, Subaru's consolidated global unit sales are projected to rise 1.9% to
928,000 units. As unit sales growth, currency exchange gains and cost reduction progress are expected to offset increases in SG&A
and R&D expenses, FHI forecasts net sales of 3,030 billion yen (up 5.3%), operating income of 503 billion yen (up 18.9%), ordinary
income of 495 billion yen (up 25.7%) and net income*2 of 337 billion yen (up 28.7%).
Consolidated unit sales in North America are projected to reach a record high*1 for the seventh consecutive year.
Consolidated global unit sales, consolidated overseas unit sales, net sales and all profit figures are projected to post all-time records*1
for the fourth consecutive year.
Currency rate assumptions: 118 yen/US$, 125 yen/euro
*1: Since fiscal year ended March 1986 - the year FHI started full-year consolidated financial reporting.
*2: Net Income in FYE2016 forecasts is “Net Income Attributable to Owners of Parent”.
Forward-looking statements in this document including financial and other forecasts are based on the information available at the time of the announcement and are subject to various risks and uncertainties that could cause actual results to vary materially.
###


![FY2015 Full-Year Consolidated Financial Results [Japan GAAP] (April 1, 2015 through March 31, 2016) · FY2015 Full-Year Consolidated Financial Results [Japan GAAP] (April 1, 2015](https://img.dokumen.tips/doc/110x75/5fcc42730482603d5603dd4a/fy2015-full-year-consolidated-financial-results-japan-gaap-april-1-2015-through.jpg)