Embed Size (px)
Citation preview

1
Makoto Kubo Representative Executive Officer and
Corporate Senior Executive Vice President
January 30, 2014
FY2013 First Nine Months and Third Quarter
Consolidated Business Results (April-December)
Copyright © 2014 Toshiba Corporation. All rights reserved. FY2013 First Nine Months and the Third Quarter www.toshiba.co.jp/about/ir/index.htm Consolidated Business Results
2
Forward-looking Statements This presentation contains forward-looking statements concerning Toshiba Group’s future plans,
strategies and performance.
These forward-looking statements are not historical facts, rather they represent assumptions and beliefs based on economic, financial and competitive data currently available.
As a global entity, operating a wide range of businesses in countries and regions with widely different market environments, Toshiba wishes to caution that actual results may differ materially from our expectations due to risks and uncertainties that, without limitation, relate to economic conditions, worldwide mega-competition in the electronics business, customer demand, foreign currency exchange rates, tax rules, regulations and other factors.
Toshiba’s fiscal year runs from April 1 to March 31.
All figures are consolidated totals for the first nine months of fiscal year 2013, unless otherwise indicated.
Prior-period performance on consolidated segment information has been reclassified to conform with the current classification, as of January 30, 2014.
Toshiba TEC acquired IBM’s Retail Store Solutions business in July 2012 and completed allocation of the acquisition cost to assets and liabilities in the current fiscal year. Fiscal year 2012 results have been revised to reflect this change.
Copyright © 2014 Toshiba Corporation. All rights reserved. FY2013 First Nine Months and the Third Quarter www.toshiba.co.jp/about/ir/index.htm Consolidated Business Results

3
Key Points of First 9 Months of FY2013
Net Sales: 4,588.8 billion yen (YoY: +545.8 billion yen)
Overall operating income increased by 55.0 billion yen YoY, the highest ever increase for the first nine months of a fiscal year.
Electronic Devices & Components recorded its highest ever operating income in this nine-month period,
and in the 3Q recorded an even higher level of profit margin than in the first half. Community Solutions and Healthcare Systems & Services also reported higher operating income.
Energy & Infrastructure saw lower operating income than in the same period a year earlier, due to stabilization of the demand for thermal power equipment that increased sharply after the 2011 earthquake in Japan, and a deterioration in the overseas nuclear power system sector.
Lifestyle Products & Services saw much higher 3Q operating income against the 2Q. The LCD TV and Home Appliances businesses moved into positive operating imcome in the 3Q. The PC business disposed of inventory as part of its structural reforms.
Net income decreased due to increases in income taxes, but surpassed the initial forecast. Copyright © 2014 Toshiba Corporation. All rights reserved. FY2013 First Nine Months and the Third Quarter www.toshiba.co.jp/about/ir/index.htm Consolidated Business Results
All five main segments saw higher net sales than in the year-earlier period.
Electronic Devices & Components recorded considerably higher sales on continuing higher sales of
memories. Energy & Infrastructure sales increased on a healthy performance by Social Systems, including
Photovoltaic Power Systems. Community Solutions also saw sales increase on good performances by the Elevator business and Toshiba TEC. Healthcare Systems & Services and Lifestyle Products & Services also saw higher sales.
Operating Income: 153.3 billion yen (YoY: +55.0 billion yen) Income before income taxes and noncontrolling interest: 91.0 billion yen (YoY: ±0 billion yen) Net income: 38.7 billion yen (YoY: -15.8billion yen)

4
FY2013 First 9 Months Overall, Year-on-Year
Copyright © 2014 Toshiba Corporation. All rights reserved. FY2013 First Nine Months and the Third Quarter www.toshiba.co.jp/about/ir/index.htm Consolidated Business Results
* “Net income (loss)” refers to Net income (loss) attributable to shareholders of the Company hereinafter. ** “the Company” refers to Toshiba Corporation hereinafter.
(Yen in billions, except earnings (losses) per share)
FY13 FY12 Variance1-3Q 1-3Q vs FY12/1-3Q
Net Sales 4,588.8 4,043.0 545.8
Operating Income (loss) 153.3 98.3 55.0% 3.3% 2.4% 0.9%
Income (loss) beforeincome taxes andnoncontrolling interests
91.0 91.0 0.0
% 2.0% 2.3% -0.3%
Net Income (loss) 38.7 54.5 -15.8% 0.8% 1.3% -0.5%
Earnings (losses) per shareattributable to shareholdersof the Company
¥9.13 ¥12.87 ¥-3.74

5
FY2013 First 9 Months by Segment, Year-on-Year (Yen in billions)
Copyright © 2014 Toshiba Corporation. All rights reserved. FY2013 First Nine Months and the Third Quarter www.toshiba.co.jp/about/ir/index.htm Consolidated Business Results
Variancevs FY12/1-3Q
Energy & Infrastructure 1,178.6 1,100.7 77.9Community Solutions 915.8 783.6 132.2Healthcare Systems & Services 268.9 255.0 13.9Electronic Devices & Components 1,313.5 962.2 351.3Lifestyle Products & Services 968.2 954.2 14.0Others 347.7 350.9 -3.2Total 4,588.8 4,043.0 545.8
Variancevs FY12/1-3Q
Energy & Infrastructure 4.3 54.2 -49.9% 0.4% 4.9% -4.5%
Community Solutions 16.2 14.0 2.2% 1.8% 1.8% 0.0%
Healthcare Systems & Services 14.4 13.1 1.3% 5.4% 5.1% 0.3%
Electronic Devices & Components 168.6 55.3 113.3% 12.8% 5.7% 7.1%
Lifestyle Products & Services -41.4 -28.9 -12.5% -4.3% -3.0% -1.3%
Others -8.9 -8.4 -0.5% -2.6% -2.3% -0.3%
Total 153.3 98.3 55.0% 3.3% 2.4% 0.9%
Net SalesFY131-3Q
Operating Income (loss)FY131-3Q
FY121-3Q
FY121-3Q

6
Overview, FY2013 First 9 Months Results
(+14% )
(+55.0)
(- 15.8 )
Net sales 11 12 13
Higher Sales Higher sales in all five main
segments, most notably Electronic Devices & Components.
Higher Operating Income Higher operating income as a result of a significant increase in Electronic Devices & Components.
Lower Net Income lower net income due to higher income taxes.
Operating Income (loss) 11 12 13
Net Income (loss) 11 12 13
(Yen in billions) [ ] = Year-on-year comparison
Copyright © 2014 Toshiba Corporation. All rights reserved. FY2013 First Nine Months and the Third Quarter www.toshiba.co.jp/about/ir/index.htm Consolidated Business Results
4,353.9 4,043.0 4,588.8
87.6 98.3
153.3
8.8
54.5 38.7

7
Operating Income (Loss) Analysis, FY2013 First 9 Months
0
+
-
(Yen in billions)
Copyright © 2014 Toshiba Corporation. All rights reserved. FY2013 First Nine Months and the Third Quarter www.toshiba.co.jp/about/ir/index.htm Consolidated Business Results
FY12/1-3Q Operating Income
98.3
Currency Exchange +53.5
VA CD
+321.1
153.3 [+ 55.0]
FY13/1-3Q Operating Income
VA: Value Analysis
CD: Cost Down
Price Reductions, Structural
Change
-382.3 Fixed Cost
-2.1
Volume, etc.
+64.8
8
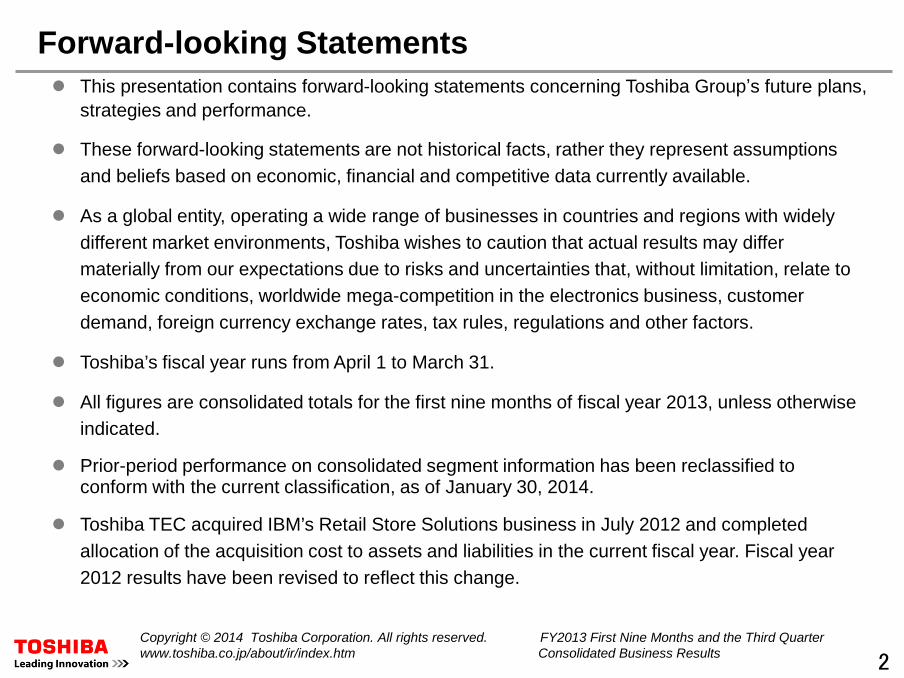
Energy & Infrastructure, FY2013 First 9 Months
(+7%) (-49.9 )
Operating income was lower on performance of the overseas Nuclear Power Systems business. Social Infrastructure Systems operating income continue to increase on good performances by Solar Photovoltaic Power Systems, Railroad Systems and other businesses. Thermal Power Systems saw lower operating income but secured high profitability.
Sales continued to rise, largely due to increased sales in the Renewable Energy business, including Solar Photovoltaic Power Systems and in the Social Infrastructure Systems business, including Railroad Systems, Automotive Systems and Industrial Equipment. The segment as a whole saw higher sales, despite reduced sales in Nuclear Power Systems, etc., in Japan.
(Yen in billions) [ ] = Year-on-year comparison
Net sales 11 12 13
Operating Income (loss) 11 12 13
Copyright © 2014 Toshiba Corporation. All rights reserved. FY2013 First Nine Months and the Third Quarter www.toshiba.co.jp/about/ir/index.htm Consolidated Business Results
1,007.1 1,100.7 1,178.6
32.5
54.2
4.3

9
Energy & Infrastructure: Main Projects Implemented in 3Q
Strategies Completed acquisition of T&D business from Vijai Electricals Ltd. Agreed to acquire a 60% holding in NuGeneration Limited, the UK-based nuclear company Poured first concrete for construction of nuclear power plants in the U.S. (Vogtle 4 and V.C. Summer 3) Entered solar photovoltaic power business in Germany Established a new geothermal power generation company in Okuhida hot spring village, Gifu
prefecture. Acquired low head hydro power business rights at Kami-oisawa grit chamber from Sendai
Waterworks Bureau.
Orders Received Smart meters for CPS Energy (U.S) Motor Inverters for the Ford Motor Company, U.S. Rail systems for major Bangkok Rail construction project, Thailand Electrical systems for locomotives in China Geothermal power generation system for Zorlu Enerji,Turkey Storage batteries for the West Sendai electric power substation operated by Tohoku Electric
Power Co., Inc. Storage batteries for Terna, Italy
Copyright © 2014 Toshiba Corporation. All rights reserved. FY2013 First Nine Months and the Third Quarter www.toshiba.co.jp/about/ir/index.htm Consolidated Business Results
10
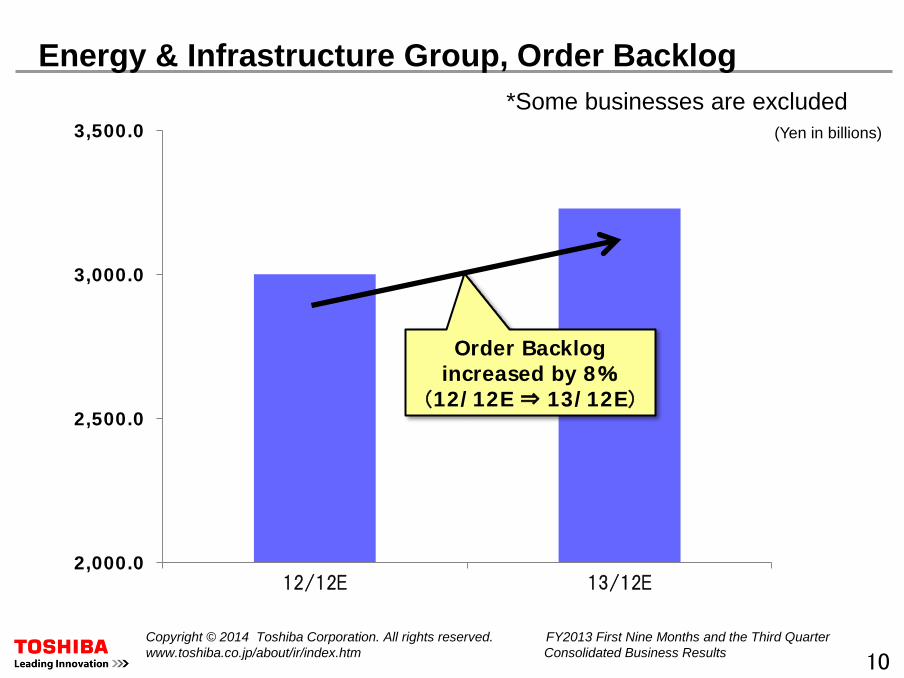
Energy & Infrastructure Group, Order Backlog *Some businesses are excluded
(Yen in billions)
Copyright © 2014 Toshiba Corporation. All rights reserved. FY2013 First Nine Months and the Third Quarter www.toshiba.co.jp/about/ir/index.htm Consolidated Business Results
2,000.0
2,500.0
3,000.0
3,500.0
12/12E 13/12E
Order Backlog increased by 8%
(12/12E ⇒ 13/12E)

11
Community Solutions, FY2013 First 9 Months
(+17% ) (+2.2 )
Operating income increased, mainly on Elevator business and Commercial Air-Conditioner business on business expansion of emerging markets along with increased operating income recorded by Toshiba TEC.
Segment sales increased. Disaster Prevention solutions, Elevator & Building Systems and industrial Air-Conditioners maintained solid growth. Toshiba TEC recorded higher sales, mainly in the POS business, due to the acquisition of IBM's retail store solutions business.
Net sales 11 12 13
Operating Income (loss) 11 12 13
POS: Point of Sales
(Yen in billions) [ ] = Year-on-year comparison
Copyright © 2014 Toshiba Corporation. All rights reserved. FY2013 First Nine Months and the Third Quarter www.toshiba.co.jp/about/ir/index.htm Consolidated Business Results
725.9 783.6
915.8
2.4
14.0 16.2
12
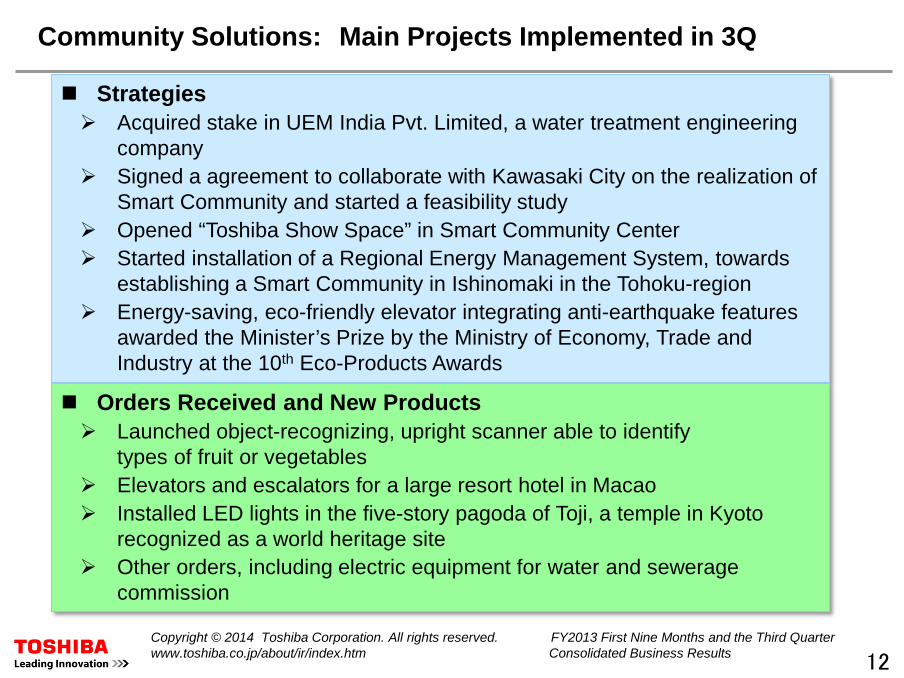
Community Solutions: Main Projects Implemented in 3Q
Strategies Acquired stake in UEM India Pvt. Limited, a water treatment engineering
company Signed a agreement to collaborate with Kawasaki City on the realization of
Smart Community and started a feasibility study Opened “Toshiba Show Space” in Smart Community Center Started installation of a Regional Energy Management System, towards
establishing a Smart Community in Ishinomaki in the Tohoku-region Energy-saving, eco-friendly elevator integrating anti-earthquake features
awarded the Minister’s Prize by the Ministry of Economy, Trade and Industry at the 10th Eco-Products Awards
Orders Received and New Products Launched object-recognizing, upright scanner able to identify
types of fruit or vegetables Elevators and escalators for a large resort hotel in Macao Installed LED lights in the five-story pagoda of Toji, a temple in Kyoto
recognized as a world heritage site Other orders, including electric equipment for water and sewerage
commission
Copyright © 2014 Toshiba Corporation. All rights reserved. FY2013 First Nine Months and the Third Quarter www.toshiba.co.jp/about/ir/index.htm Consolidated Business Results

13
Healthcare Systems & Services, FY2013 First 9 Months
(+5%) (+ 1.3 )
Higher operating income mainly came from the service sector and equipment sales in emerging markets. Yen depreciation also contributed to increased operating income from overseas operations.
Sales rose on increases of equipment sales, especially computerized tomography (CT) systems in emerging markets such as Turkey.
Higher sales were also the result of a solid performance in the service sector following an increase in unit installations, especially outside Japan.
237.2 255.0 268.9
9.5
13.1 14.4
(Yen in billions) [ ] = Year-on-year comparison
Net sales 11 12 13
Operating Income (loss) 11 12 13
Copyright © 2014 Toshiba Corporation. All rights reserved. FY2013 First Nine Months and the Third Quarter www.toshiba.co.jp/about/ir/index.htm Consolidated Business Results

14
Healthcare Systems & Services: Main Projects Implemented in 3Q
Strategies Established Healthcare Business Development Division to develop new
businesses and coordinate healthcare-related activities across Toshiba Group Started operation of Research Development Center in Dalian, China Started production of ultrasonic equipment in Brazil Started collaborative research into healthcare-related big data with Tohoku
University and others Started “Home Service for Seniors” business Established “3R Center” to build sales system for used equipment, focusing
on emerging countries Achieved cumulative production of 30,000 CT systems
New Products and New Orders Completed installation of 84 CT systems at Turkish Ministry of Public Health Released compact “Vantage Elan” 1.5T MRI system for the domestic market Released compact, high-end “Xario 100” Diagnostic Ultrasound Systems Accepted orders for Glassless 3D monitor Installed medical instruments at Manchester United’s training facility
Copyright © 2014 Toshiba Corporation. All rights reserved. FY2013 First Nine Months and the Third Quarter www.toshiba.co.jp/about/ir/index.htm Consolidated Business Results

15
Electronic Devices & Components, FY2013 First 9 Months
(+37% ) (+113.3 )
Sales increased as the Memory business continued to record solid sales and as the Storage Products business saw growth, mainly in 3.5-inch HDDs.
A significant increase in operating income, the highest ever for the April-December period. The Memory business continued to secure a high level of profit level, although the supply and demand balance eased in the 3Q.
Net sales 11 12 13
(Yen in billions) [ ] = Year-on-year comparison
Operating Income (loss) 11 12 13
Copyright © 2014 Toshiba Corporation. All rights reserved. FY2013 First Nine Months and the Third Quarter www.toshiba.co.jp/about/ir/index.htm Consolidated Business Results
1,069.8 962.2
1,313.5
43.3 55.3
168.6

16
Electronic Devices & Components: Main Projects Implemented in 3Q
Strategies Acquired OCZ Technology Group's SSD business assets
New products and New Orders Embedded NAND flash memory (e・MMCTM) with second-generation
19nm process New SDHC memory card with wireless LAN, "Flash Air“ SD memory card “EXCERIA PRO” series compliant with UHS-Ⅱ, the
world fastest specification 2.5-inch, 1TB HDD with 7mm height New products in “CANVIO” portable HDD series TransferJetTM Module compatible with USB and Micro USB,
the industry’s first Shipped samples of CMOS image sensor for car-mounted view camera Driver IC for small motors used in car system, such as door mirrors and
air-conditioners SSD with SATA interface for enterprise applications
Copyright © 2014 Toshiba Corporation. All rights reserved. FY2013 First Nine Months and the Third Quarter www.toshiba.co.jp/about/ir/index.htm Consolidated Business Results

17
Semiconductor & Storage Products Business Results Breakdown
Difference
vs. FY12/1-3Q
Discrete 114.3 111.9 2.4
System LSI 153.1 164.1 -11.0
Memories 628.1 356.0 272.1
Semiconductor Total 895.5 632.0 263.5
Storage Products 347.4 291.2 56.2
Difference
vs. FY12/1-3QSemiconductor & StorageProducts Total 161.4 58.8 102.6
Net Sales FY131-3Q
FY121-3Q
Operating Income(Loss)
FY131-3Q
FY121-3Q
(Yen in billions)
Copyright © 2014 Toshiba Corporation. All rights reserved. FY2013 First Nine Months and the Third Quarter www.toshiba.co.jp/about/ir/index.htm Consolidated Business Results

18
Semiconductor & Storage Products Business Quarterly Trend in Operating Income (Loss)
2.0
9.1
45.4
31.3
20.0
63.7
8.0
29.7
52.3
31.4 37.0
2011 2012 2013
1Q 2Q 3Q 4Q 1Q 2Q 3Q 4Q 1Q 2Q 3Q 4Q
(Yen in billions)
Copyright © 2014 Toshiba Corporation. All rights reserved. FY2013 First Nine Months and the Third Quarter www.toshiba.co.jp/about/ir/index.htm Consolidated Business Results

19
Lifestyle Products & Services, FY2013 First 9 Months
Difference
vs. FY12/1-3Q
TV 182.2 203.2 -21.0
PC 534.4 521.3 13.1
Home appliances 182.3 157.9 24.4
Difference
vs. FY12/1-3Q
Lifestyle Products & Services Total -41.4 -28.9 -12.5
1Q 2Q 3Q
-25.7 -11.0 -4.7
FY13 Quarterly Operating income (loss)
Net Sales FY131-3Q
FY121-3Q
Operating Income (Loss) FY131-3Q
FY121-3Q
(Yen in billions)
Copyright © 2014 Toshiba Corporation. All rights reserved. FY2013 First Nine Months and the Third Quarter www.toshiba.co.jp/about/ir/index.htm Consolidated Business Results
Lifestyle Products & Services halved its deficit in the 3Q against the 2Q and steadily improved its performance in each quarter.
Visual Solutions Group and Toshiba Home Appliances moved into profit in the 3Q. PC allocated the cost of inventory disposal to its structural reforms.

20
Non-Operating Income (Loss) and Expenses
Differencevs. FY12/1-3Q
Net financial loss -16.3 -16.5 0.2 Foreign exchange income (loss) 17.1 5.1 12.0 Income (loss) on sales of fixed assets -3.5 6.2 -9.7 Equity in earning of affiliates 8.9 12.9 -4.0
Structural reform costs -15.5 -22.9 7.4
Others -53.0 7.9 -60.9
Total -62.3 -7.3 -55.0
FY131-3Q
FY121-3Q
(Yen in billions)
Copyright © 2014 Toshiba Corporation. All rights reserved. FY2013 First Nine Months and the Third Quarter www.toshiba.co.jp/about/ir/index.htm Consolidated Business Results
21
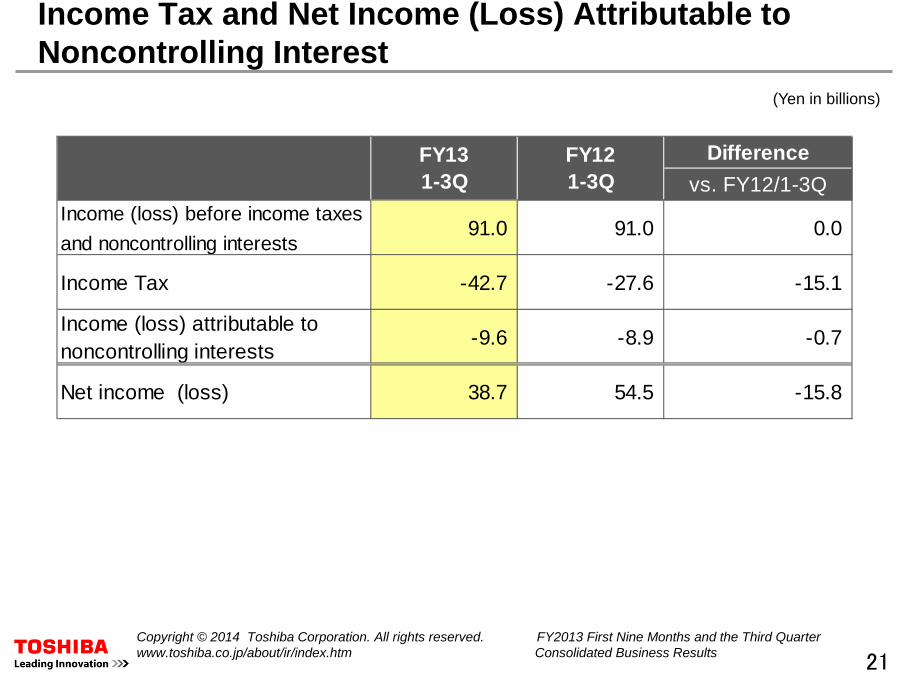
Income Tax and Net Income (Loss) Attributable to Noncontrolling Interest
Differencevs. FY12/1-3Q
Income (loss) before income taxesand noncontrolling interests
91.0 91.0 0.0
Income Tax -42.7 -27.6 -15.1
Income (loss) attributable tononcontrolling interests
-9.6 -8.9 -0.7
Net income (loss) 38.7 54.5 -15.8
FY131-3Q
FY121-3Q
(Yen in billions)
Copyright © 2014 Toshiba Corporation. All rights reserved. FY2013 First Nine Months and the Third Quarter www.toshiba.co.jp/about/ir/index.htm Consolidated Business Results

22
Cash Flows, FY2013 First 9 Months
17.9
-107.3
70.6
-296.1
-151.6
-191.9
-278.2 -258.9
-121.3
11/1-3Q 12/1-3Q 13/1-3Q
Cash flow fromoperating activitiesCash flow frominvesting activitiesFree cash flow
FCF: +25.4 in 3Q
Copyright © 2014 Toshiba Corporation. All rights reserved. FY2013 First Nine Months and the Third Quarter www.toshiba.co.jp/about/ir/index.htm Consolidated Business Results
(Yen in billions)

23
Consolidated Balance Sheets
Liabilities and Equity Assets
3,305.8 3,474.8 3,792.2
997.7 1,134.5
1,146.7 1,021.1
1,187.2 1,339.4 233.4
217.9 196.4
5,558.0 6,014.4
6,474.7
11/12E 12/12E 13/12E
Cash Equivalents
Accounts Receivable
Inventories
Others
1,385.3 1,539.2 1,563.4
1,130.3 1,383.9 1,640.7
3,042.4 3,091.3
3,270.6
5,558.0 6,014.4
6,474.7
11/12E 12/12E 13/12E
Others
Total Equity
Interest Bearing Debt
Copyright © 2014 Toshiba Corporation. All rights reserved. FY2013 First Nine Months and the Third Quarter www.toshiba.co.jp/about/ir/index.htm Consolidated Business Results
(Yen in billions)

24
Total Equity
Copyright © 2014 Toshiba Corporation. All rights reserved. FY2013 First Nine Months and the Third Quarter www.toshiba.co.jp/about/ir/index.htm Consolidated Business Results
(Yen in billions)
vs.13/3E vs.12/12ECommon Stock 439.9 439.9 439.9 0.0 0.0
Additional paid-in capital 404.6 404.4 399.1 0.2 5.5
Retained earnings 640.2 635.4 612.6 4.8 27.6Accumulated othercomprehensive loss
-261.7 -443.9 -510.9 182.2 249.2
Treasury stock -1.7 -1.5 -1.5 -0.2 -0.2Equity attributable to shareholders
of the company1,221.3 1,034.3 939.2 187.0 282.1
Equity attributable tononcontrolling interests
419.4 381.8 444.7 37.6 -25.3
Total equity 1,640.7 1,416.1 1,383.9 224.6 256.8
Equity attributable to shareholdersof the Company / Total assets 18.9% 17.0% 15.6% 1.9% 3.3%
13/12E 12/12E13/3EDifference

25
DE Ratio
Copyright © 2014 Toshiba Corporation. All rights reserved. FY2013 First Nine Months and the Third Quarter www.toshiba.co.jp/about/ir/index.htm Consolidated Business Results
(Yen in billions)
1,385.3 1,539.2 1,563.4
784.0 939.2
1,221.3
177% 164%
128%
11/12E 12/12E 13/12E
Interest-bearing Debt
Equity attributable toShareholders of the CompanyD/E ratio

26
FY2013 3Q Overall, Year-On-Year
Differencevs. FY12/3Q
Net Sales 1,549.6 1,357.1 192.5
Operating Income (loss) 47.7 29.6 18.1% 3.1% 2.2% 0.9%
Income (loss) before incometaxes and noncontrolling interests 39.1 48.3 -9.2
% 2.5% 3.6% -1.1%
Net Income (loss) 17.2 29.4 -12.2% 1.1% 2.2% -1.1%
FY13/3Q FY12/3Q
Copyright © 2014 Toshiba Corporation. All rights reserved. FY2013 First Nine Months and the Third Quarter www.toshiba.co.jp/about/ir/index.htm Consolidated Business Results
(Yen in billions)

27
FY2013 3Q Overall by Segment, Year-On-Year Difference
vs. FY12/3QEnergy & Infrastructure 395.5 352.4 43.1Community Solutions 316.0 271.3 44.7Healthcare Systems & Services 83.1 77.5 5.6Electronic Devices & Components 422.4 333.1 89.3Lifestyle Products & Services 356.8 328.4 28.4Others 110.7 110.0 0.7Total 1,549.6 1,357.1 192.5
Difference
vs. FY12/3QEnergy & Infrastructure -9.0 13.3 -22.3
% -2.3% 3.8% -6.1%Community Solutions 7.7 6.4 1.3
% 2.4% 2.4% 0.0%Healthcare Systems & Services 4.4 3.5 0.9
% 5.4% 4.5% 0.9%Electronic Devices & Components 54.8 28.0 26.8
% 13.0% 8.4% 4.6%Lifestyle Products & Services -4.7 -17.0 12.3
% -1.3% -5.2% 3.9%Others -5.5 -4.2 -1.3
% -5.0% -3.8% -1.2%Total 47.7 29.6 18.1
% 3.1% 2.0% 0.9%
Net SalesFY133Q
Operating Income (loss)FY133Q
FY123Q
FY123Q
Copyright © 2014 Toshiba Corporation. All rights reserved. FY2013 First Nine Months and the Third Quarter www.toshiba.co.jp/about/ir/index.htm Consolidated Business Results
(Yen in billions)

28
• Toshiba TEC acquired IBM’s Retail Store Solutions business in July 2012 and completed allocation of the acquisition cost to assets and liabilities in the current fiscal year. Fiscal year 2012 results have been revised to reflect this change.
FY2013 Forecast,Overall
Copyright © 2014 Toshiba Corporation. All rights reserved. FY2013 First Nine Months and the Third Quarter www.toshiba.co.jp/about/ir/index.htm Consolidated Business Results
(Yen in billions, except earnings (losses) per share)
Variance
vs FY12
Net Sales 6,300.0 5,800.3 499.7
Operating Income (loss) 290.0 193.4 96.6% 4.6% 3.3% 1.3%
Income (loss) before incometaxes and noncontrolling 200.0 154.6 45.4
% 3.2% 2.7% 0.5%
Net Income (loss) 100.0 77.4 22.6% 1.6% 1.3% 0.3%
Earnings (losses) per shareattributable to shareholders ofthe Company
¥23.61 ¥18.27 ¥5.34
Forecast(as of Oct 30)
FY12Actual
No change from the forecast announced on October 30, 2013
29
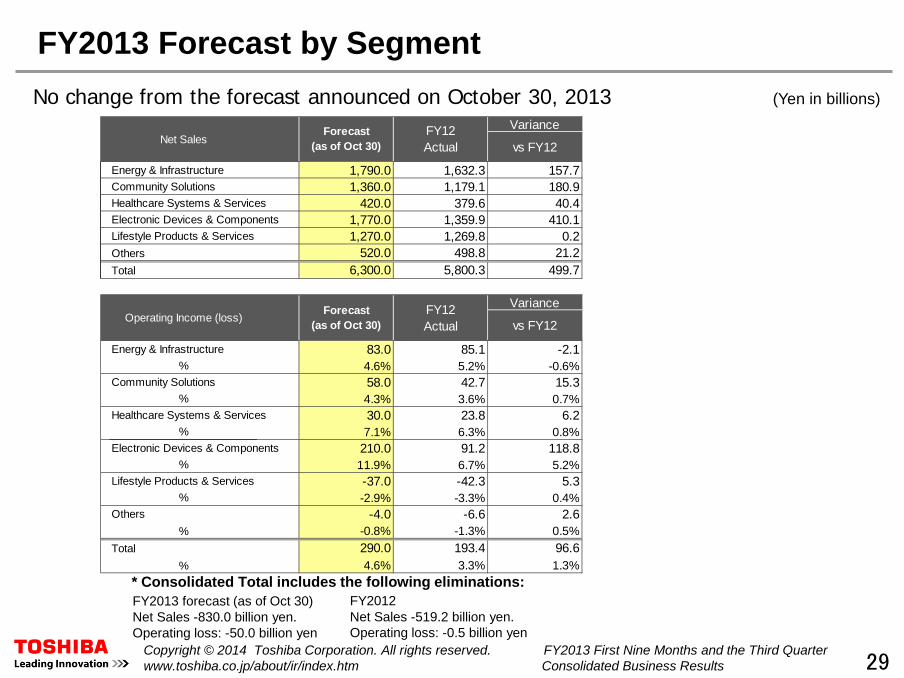
FY2013 Forecast by Segment
* Consolidated Total includes the following eliminations: FY2012 Net Sales -519.2 billion yen. Operating loss: -0.5 billion yen
Copyright © 2014 Toshiba Corporation. All rights reserved. FY2013 First Nine Months and the Third Quarter www.toshiba.co.jp/about/ir/index.htm Consolidated Business Results
FY2013 forecast (as of Oct 30) Net Sales -830.0 billion yen. Operating loss: -50.0 billion yen
(Yen in billions) Variance
vs FY12
Energy & Infrastructure 1,790.0 1,632.3 157.7Community Solutions 1,360.0 1,179.1 180.9Healthcare Systems & Services 420.0 379.6 40.4Electronic Devices & Components 1,770.0 1,359.9 410.1Lifestyle Products & Services 1,270.0 1,269.8 0.2Others 520.0 498.8 21.2Total 6,300.0 5,800.3 499.7
Variance
vs FY12
Energy & Infrastructure 83.0 85.1 -2.1% 4.6% 5.2% -0.6%
Community Solutions 58.0 42.7 15.3% 4.3% 3.6% 0.7%
Healthcare Systems & Services 30.0 23.8 6.2% 7.1% 6.3% 0.8%
Electronic Devices & Components 210.0 91.2 118.8% 11.9% 6.7% 5.2%
Lifestyle Products & Services -37.0 -42.3 5.3% -2.9% -3.3% 0.4%
Others -4.0 -6.6 2.6% -0.8% -1.3% 0.5%
Total 290.0 193.4 96.6% 4.6% 3.3% 1.3%
Net SalesForecast
(as of Oct 30)
Operating Income (loss)Forecast
(as of Oct 30)
FY12Actual
FY12Actual
No change from the forecast announced on October 30, 2013

30 Copyright © 2014 Toshiba Corporation. All rights reserved. FY2013 First Nine Months and the Third Quarter www.toshiba.co.jp/about/ir/index.htm Consolidated Business Results


![Recent Transfer Pricing ruling - wirc-icai.org · PDF fileHyderabad ITAT – Vijai Electricals Ltd. [TS-142-ITAT-2013(HYD)-TP] 20. Facts . Investment at . Rs. 21 Crores . Vijai Electricals](https://img.dokumen.tips/doc/110x75/5aa8a47b7f8b9a72188bd744/recent-transfer-pricing-ruling-wirc-icaiorg-itat-vijai-electricals-ltd-ts-142-itat-2013hyd-tp.jpg)
![34-41] Lead Story - SPML Infra · PDF fileMadhya Pradesh. Apart from this, BHEL also supplied other key equipment like 1,200kV insulators. Vijai Electricals Ltd:This Hyderabad-based](https://img.dokumen.tips/doc/110x75/5aa8a47b7f8b9a72188bd73d/34-41-lead-story-spml-infra-pradesh-apart-from-this-bhel-also-supplied-other.jpg)